Parasitoid wasp diversity in apple orchards along a pest management gradient
by
Stacy G. Mates
A thesis submitted in partial fulfillment of the requirements
for the degree of Master of Science
( Natural Resources and Environment) in the University of Michigan
December 2010
Thesis Committee: Professor Ivette Perfecto, Chair Assistant Professor Catherine Badgley Professor Mark Hunter


ii
ABSTRACT
Various studies have found higher biodiversity, particularly of arthropod natural enemies,
on organic than on conventional farms. However, using broad management categories to
compare farm diversity is complicated by farms using intermediate practices such as Integrated
Pest Management (IPM). We used a pest-management toxicity index to compare Hymenopteran
parasitoid species richness, abundance, and community composition in six apple orchards in
southeastern Michigan, USA, along a gradient of management practices: organic, varying levels
of IPM, and conventional.
We conducted monthly vacuum-sampling of wasps in each orchard during 2009, and
quantified pest-management practices based on pesticide application records. We then assigned a
toxicity score to each orchard using a modified pesticide toxicity index and arranged the orchards
along a toxicity gradient.
One conventional orchard had a lower toxicity score than two orchards using IPM.
Additionally, toxicity scores varied from month to month within each orchard. We found higher
total wasp species richness in the organic orchard; however, richness varied by month and in
August a conventional orchard had the highest species richness. Total wasp abundance was
highest in orchards at opposite ends of the toxicity gradient, but patterns of wasp abundance also
varied by month and the conventional orchard had the highest mean abundance in August.
Monthly toxicity scores did not correlate with wasp species richness, but did with wasp
abundance.
Broad pest management categories were not consistent predictors of monthly variation in
parasitoid wasp diversity. In contrast, monthly toxicity scores helped explain patterns of wasp
abundance, though not species richness. With further refinement, a pest-management index could
improve our understanding of monthly variation in orchard natural enemy biodiversity, and serve
as a tool for farmers looking to increase biological control of orchard pests by parasitoid wasps.

iii
ACKNOWLEDGEMENTS
Thanks to my co-advisors, Ivette Perfecto and Catherine Badgley for their support
throughout the thesis process, and to committee member Mark Hunter for his helpful comments
on this manuscript. I’m grateful to Kathy Welch at the Center for Statistical Consultation and
Research (CSCAR) for invaluable statistical advice, Mark O’Brien, Dennis Haines, Michael
Sharkey and Richard Vernier for help with wasp identification, John Wise for advice on wasp
sampling methods, and David Epstein and Jeanette Yanklin for recommending apple growers
with whom to work. Thanks also to Katie Julian, a fantastic field assistant – I truly could have
not have completed my field work without her strong arms, great ideas, and ongoing enthusiasm.
Finally, a huge thank you to the apple growers who invited me into their orchards and took the
time to introduce me to the complex and fascinating world of orchard management: Bill Erwin,
Damon and Owen Glei, Jim Koan, Janis and Howard Miller, Scott Robertello, and Bruce
Upston.
Funding for this research was provided by the Margaret Dow Towsley Scholarship, the
Matthaei Botanical Gardens and Nichols Arboretum Research Endowment Fund, the University
of Michigan Rackham Graduate Student Research Grant, and the University of Michigan School
of Natural Resources and Environment Thesis Grant.

iv
TABLE OF CONTENTS
Abstract ii
Acknowledgements iii
Table of contents iv
Introduction 1
Methods 5
Results 11
Discussion 15
Tables Table 1: Participating orchards 23 Table 2: Pesticide use 24 Table 3: Toxicity and species richness analysis 25 Table 4: Toxicity and abundance analysis 26
Figures Figure 1: IOBC toxicity scores and gradient 27 Figure 2: Total and monthly wasp species richness 28 Figure 3: Total and monthly wasp abundance 29 Figure 4: IOBC toxicity scores vs. species richness 30 Figure 5: IOBC toxicity scores vs. abundance 31 Figure 6: Wasp morphospecies composition 32 Figure 7: Bray-Curtis cluster analysis 33 Figure 8: Wasp family composition 34
Literature cited 35
Appendix Table A1: Wasp morphospecies collected 41 Table A2: Abundance analysis, pairwise comparisons 46 Figure A1: Map of participating orchards 50

1
INTRODUCTION
A number of studies have determined that organic farms support higher biodiversity than
conventional ones, whether diversity is expressed as abundance and species richness (Hole et al.
2005, Koss et al. 2005, Bengtsson et al. 2007, Letourneau and Bothwell 2008), as food-web
network structure (Macfadyen et al. 2009), or as species evenness (Crowder et al. 2010).
Arthropod natural enemies in particular appear to respond favorably to organic agroecosystems.
In recent studies, predatory insects were on average 49% more abundant and had 84% higher
species richness (Bengtsson et al. 2007), and parasitoid wasps were 87% more abundant
(Letourneau and Bothwell 2008) and had significantly higher species richness (Macfadyen et al.
2009) on organic than on conventional farms.
When comparing farms, researchers face an interesting challenge: how should they
decide which farms are categorized as organic or conventional? Although defined regulatory
standards for organic certification exist in many countries (for an example, see the USDA
National Organic Program website: http://www.ams.usda.gov/AMSv1.0/nop), studies
acknowledge that “organic” and “conventional” are not simple dichotomous categories (Hole et
al. 2005, Bengtsson et al. 2007, Letourneau and Bothwell 2008). For instance, practices typical
of organic farms – such as avoiding synthetic pesticides and preserving mixed farming systems –
are also used on some conventional farms (Hole et al. 2005). Similarly, farmers interested in
ecologically-friendly practices may support higher farm biodiversity regardless of how their
farms are categorized (Hole et al. 2005).
Categorizing farms based on pest-management strategies is further complicated by farmer
adoption of Integrated Pest Management (IPM), a set of practices that aim to maintain pest
damage below economically damaging thresholds while minimizing environmental and health

2
impacts from pesticides (Prokopy 1994). Comparison studies have explicitly lumped farms using
IPM with conventional growers (Hole et al. 2005), eliminated them from the comparison
(Bengtsson et al. 2007, Crowder et al. 2010), or not specified how these farms were categorized
(Letourneau and Bothwell 2008, Macfadyen et al. 2009). Other studies treat IPM as its own
management category. Koss et al. (2005) compared predator densities among three categories of
potato farms: “Hard” or conventional farms with season-long use of broad-spectrum
organophosphate and carbamate insecticides, “Soft” or IPM farms using mostly selective
insecticides, and certified organic farms. However, pest management still varied within each of
these categories: some IPM farms applied broad-spectrum pesticides at planting time, and some
organic farms used pyrethrum, a broad-spectrum botanical insecticide highly toxic to beneficial
arthropods (Franz et al. 1980, Koss et al. 2005).
An alternative to classifying pest-management practices into broad categories is to
quantify and compare specific management practices. The International Organization for
Biological Control of Noxious Animals and Plants– Pesticides and Beneficial Organisms
Working Group (IOBC), a global organization that promotes environmentally safe pest control,
has developed a set of standardized laboratory and semi-field tests to quantify acute pesticide
toxicity to beneficial organisms (Hassan et al. 1983, 1987, 1988, 1994, Sterk et al. 1999, public
communication: IOBC pesticide toxicity database accessed July 20, 2010 from http://www.iobc-
wprs.org/ip_ipm/03022_IOBC_ PesticideDatabase_2005.pdf). Using IOBC data, Thomson and
Hoffman (2006) created a toxicity metric for vineyards based on the IOBC toxicity class
assigned to each pesticide and the total number of times a particular product was applied in each
vineyard. Using this metric, they compared beneficial arthropod biodiversity among vineyards in
the context of the cumulative effect of pesticides applied over the growing season (Thomson and

3
Hoffman 2006, 2007).
Apple orchards provide a useful study system in which to compare the effects of pest-
management strategies on beneficial arthropod diversity. Due to intensive production methods
and minimal market tolerance for damaged fruit, conventional apple growers have relied on
frequent applications of broad spectrum pesticides, especially organophosphates, to control
arthropod pests (Perry et al. 1996, Lacey and Unruh 2005, Jones et al. 2009). In 1996, Michigan
apple growers applied up to eight different fungicides and 10 different insecticides at weekly
intervals, resulting in up to 15 pesticide applications during the growing season (Perry et al.
1996). Motivated by government regulations restricting organophosphate use, the development
of pest resistance to common orchard pesticides, increasing pesticide costs, and public concern
over pesticide exposure, apple growers and agricultural agencies are increasingly interested in
adopting IPM practices to reduce pesticide use and increase biological control of major orchard
pests (Prokopy et al. 1996, Gut and Brunner 1998, Suckling et al. 1999, Jones et al. 2009). IPM
programs are also popular due to their demonstrated success at controlling spider mites (Acari:
Tetranychidae), prominent apple foliage pests, via conservation biological control (Agnello et al.
2002, Jones et al. 2009). Biodiversity studies in apple orchards have generally included IPM
orchards in their comparisons, with a range of conclusions as to where IPM practices fit within
the organic versus conventional dichotomy (Suckling et al. 1999, Simon et al. 2007, Markó et al.
2009).
Parasitic Hymenoptera are common orchard natural enemies that parasitize key apple
pests including codling moth, Cydia pomonella (MacPhee and Sanford 1954, Lacey and Unruh
2005), various species of leafroller and leafminer moths (Biddinger et al. 1994, Hull et al. 1997,
Cross et al. 1999, Wilkinson et al. 2004), oriental fruit moth, Grapholita molesta (Atanassov et

4
al. 2003) and rosy apple aphid, Dysaphis plantaginea (Cross et al. 1999, Brown and Matthews
2007). In addition to being a potential source of biological control of these orchard pests (Van
Driesche and Taub 1983, Hull et al. 1997, Jones et al. 2009), parasitoid wasps are also highly
sensitive to pesticides, including fungicides (Hassan et al. 1987, 1988, 1994, Thomson and
Hoffman 2006) and many insecticides less harmful to other beneficial arthropods (Suckling et al.
1996, Sarvary et al. 2006, Thomson and Hoffman 2006). Therefore, parasitoid wasp diversity
could serve as an indicator of both overall orchard toxicity and the potential for increased
biological control upon reducing pesticide use.
We examined parasitoid wasp species richness, abundance, and community composition
from May through August 2009 in six apple orchards in southeastern Michigan, USA, utilizing a
range of pest-management strategies: organic, conventional, and varying levels of IPM. We
determined a toxicity gradient for the six orchards using a modified version of the IOBC toxicity
metric developed by Thomson and Hoffman (2006), and then compared wasp biodiversity along
that gradient. Our investigation centered on two main questions. First, how would monthly
patterns of parasitoid wasp species richness and abundance along a pesticide toxicity gradient
compare to an overall seasonal “snapshot”? Second, where would IPM practices fit within
biodiversity comparisons based on pest management – as a subset of conventional practices, or
as their own, intermediate category?

5
METHODS
Orchard study sites
Sampling took place at six apple orchards in southeastern Michigan, located between
43.02° to 41.77° north to south and 083.62° to 084.60° east to west (Appendix Fig. A1). The
orchards represent a range of sizes, tree ages and pest management practices as summarized by
the growers (Table 1). Org is a certified organic orchard using USDA National Organic
Standards-approved pesticides and non-pesticidal practices, including pheromone mating
disruption. ABO uses advanced IPM practices that the owner considers “all but organic,”
including pheromone mating disruption and a focus on building predator populations. IPM-d is
an IPM orchard with diverse plantings of tree and soft fruits and vegetables, whose owner takes a
“wait and see” attitude to pest control. IPM-i is a large, intensively managed orchard that uses
IPM practices to control spider mites. Conv-d is an older, conventional orchard with diverse
plantings of tree and small fruits. Finally, Conv is a conventional orchard that follows a set spray
schedule.
Some orchards have multiple planting locations and intersperse blocks of apple trees with
other crops; therefore, rather than record overall orchard size, we calculated orchard block size
based on the number of hectares occupied continuously by apple trees and bordered by
hedgerows, other crops, or significant roads. Orchard block sizes varied from 1.6 to 22.3 hectares
(Table 1). We established a study plot within each orchard at least 17.7 m from any block edge,
consisting of 10 Red Delicious apple trees divided into two adjacent rows of five trees each. The
exception was Conv, which had only one row of Red Delicious containing all 10 sample trees.
Groundcover in all orchards consisted mostly of grass mixed with small amounts of Trifolium
spp., Taraxacum officinale, Daucus carota, Plantago spp. and other common weedy species;

6
mowing practices varied by orchard.
Orchard pesticide use and IOBC toxicity index
We collected 2009 pesticide application records from each orchard, and conducted a one-
hour interview with each grower to clarify spray records and assess cultural pest control
practices, pest-management philosophy, and attitudes toward orchard natural enemies (Table 2).
Because of difficulty interpreting some spray records, we assumed that all pesticides were
applied at the industry-recommended spray rate unless specifically noted by the grower and
clarified in Table 2.
To determine an IOBC toxicity class for each pesticide, we used the on-line database of
pesticide toxicity to beneficial arthropods maintained by the IOBC (public communication:
IOBC pesticide toxicity database accessed July 20, 2010 from http://www.iobc-
wprs.org/ip_ipm/03022_IOBC_ PesticideDatabase_2005.pdf). This database divides toxicity
into three classes: harmless/slightly harmful (0-30% mortality in lab tests), moderately harmful
(31-79% mortality), and harmful (>80% mortality). IOBC wasp mortality data were based on
Trichogramma cacoeciae, which the IOBC used as an indicator species, except for the
insecticide thiacloprid, for which the IOBC only evaluated effects on Aphidius rhopalosiphi.
Using a modified version of the method developed by Thomson and Hoffman (2006), which
based the index on a four-class system, we assigned a toxicity class to each pesticide on a scale
of 0-2 from the lowest to the highest mortality class. By assigning a zero value to pesticides
causing less than 30% mortality, we effectively eliminated these pesticides from each orchard’s
toxicity calculation (Thomson and Hoffman 2006). For pesticides not included in the IOBC
database, we found studies that evaluated toxicity to parasitoid wasps, giving preference to
studies that followed IOBC testing procedures (Table 2). We calculated total IOBC toxicity

7
scores for each orchard by multiplying each pesticide’s IOBC toxicity class by the number of
times that pesticide was applied from the start of the season through our August sample date, and
then summing pesticide toxicity scores. We also calculated monthly IOBC toxicity scores, using
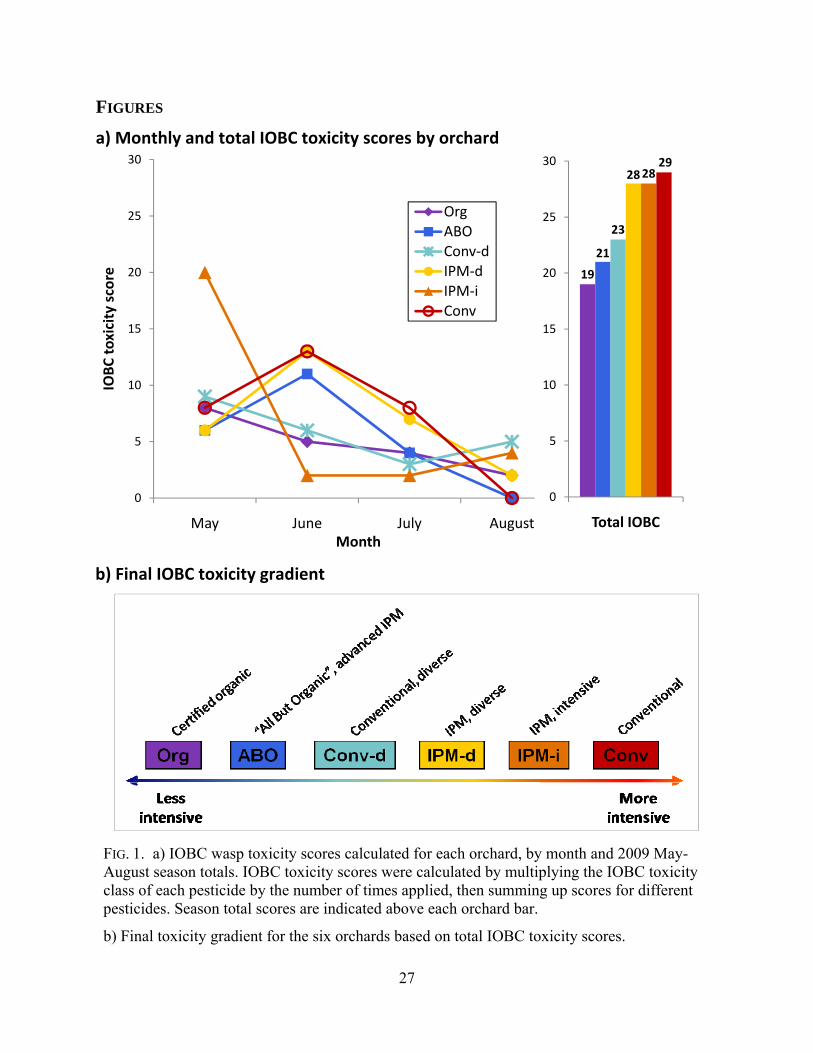
the time between sample dates to represent each month (Fig. 1a).
The orchards also utilized cultural or physical pest-management practices which were not
included in their spray records (Table 2). Org used pheromone mating disruption to control
codling moth (C. pomonella), while ABO used mating disruption to control both codling moth
and oriental fruit moth (G. molesta). IPM-i delayed spring mowing of the orchard floor to allow
predatory mites to migrate from overwintering sites up into the apple trees, and Org limited
mowing to preserve weeds that could serve as alternative pollen and nectar sources for predatory
arthropods. Finally, all six orchards utilized some form of scouting and trapping in 2009 to
monitor pest populations. Org and ABO routinely contract with a professional orchard scout who
visited each orchard weekly, IPM-i employs a scout as part of regular orchard staff, and IPM-d,
Conv-d, and Conv all utilized a scout in 2009 provided gratis by a local pesticide company,
Wilbur-Ellis.
Parasitoid sampling and identification
Sampling took place once per month at each orchard from May through August 2009:
May 14-21, June 17-26, July 21-30, and August 16-21. We used a modified leaf blower/vacuum
with fine (≤ 30 μm) mesh bags fitted into the tube to vacuum-sample arthropods for one minute
from the mid and lower canopy of each of the 10 apple trees. Vacuum-sampling allows for a
more complete sample of flying arthropods than the traditional collection method of branch
beating (Harper and Guynn 1998, J. Wise, personal communication). We placed the mesh
sampling bags into sealable plastic bags with a cotton pad soaked in 99.5% ethyl acetate, and

8
stored the bags in a chilled cooler in the field. In the lab, we separated parasitic Hymenoptera
from other arthropods and debris, then stored the wasps in the freezer and other specimens in
70% ethyl alcohol. Once identified, wasps were stored in 95% ethyl alcohol.
We identified Hymenoptera collected from June through August to family (Borror and
White 1970, Borror et al. 1989, Grissell and Schauff 1990) and morphospecies, following family
and subfamily taxonomy of the Hymenoptera Online Database maintained by Norman et al.
(public communication: accessed January 11, 2010 from http://hol.osu.edu/). Voucher
specimens were stored in the laboratory of I. Perfecto at the University of Michigan. Wasps from
May samples were difficult to identify to morphospecies due to immediate storage in alcohol;
therefore, May wasps were counted for abundance comparisons only.
Data Analysis
We used Estimate S software (Colwell 2006) to calculate parasitoid wasp smooth species
accumulation curves and compare total and monthly species richness among orchards. We then
examined the relationship between monthly IOBC scores and monthly species richness counts
for each orchard, using a generalized linear mixed model (GLMM) to account for multiple
measurements over time for each orchard (Molenberghs and Verbeke 2005). Species richness
was treated as the total count of species collected across all trees within a given orchard and
month, and thus analyzed at the orchard level. Since species richness was count data which did
not meet the assumptions necessary for a Poisson distribution (mean equal to variance), we
specified a negative binomial distribution. To account for between-orchard variability, we
included random coefficients for the intercept and slope of IOBC toxicity scores within each
orchard.
We also used the model above to examine the relationship between species richness and
9
two potential confounding factors: orchard block size, which could affect species richness by
altering immigration and recolonization potential, and tree age, since older trees have been
shown to support greater arthropod diversity (Brown and Schmitt 2001). Additionally, because
pest-management practices and wasp and prey/host life-cycles varied across months, we also
examined the relationship between IOBC toxicity scores and species richness within each month
using a negative binomial regression (generalized linear model). As we had only one aggregated
species count per orchard within each month, we did not include a random effect in the analysis
for individual months. Generalized linear models for the entire season were analyzed using SAS
Release 9.2 (SAS Institute, Cary, North Carolina, USA), while relationships within individual
months were analyzed using SPSS Versions 17.0 and 18.0 (IPM Software, Chicago, Illinois,
USA).
To evaluate the effects of individual orchard practices on monthly parasitoid wasp
abundance, we used repeated-measures ANOVA with orchard, month, and the interaction of
orchard by month as fixed effects. Since the subject of our model was the individual tree
measured over time in each orchard, we used a compound-symmetric covariance structure to
account for repeated measurements and thus non-independent residuals for the same tree over
time. The interaction of orchard by month was significant, indicating that orchard to orchard
differences varied by month; therefore, we performed post-hoc tests to compare mean wasp
abundance across orchards within each month. A Bonferroni correction for multiple comparisons
was used for the post-hoc tests within each month. Abundance data was natural log transformed
for all abundance analyses to obtain more normally distributed residuals.
We then analyzed the relationship between monthly IOBC toxicity scores and wasp
abundance using a linear mixed model (LMM) (Molenberghs and Verbeke 2000). As our subject

10
was the individual tree measured repeatedly over time, we used a compound-symmetric
covariance structure to account for correlations within each tree. We allowed orchard to be a
random effect because we focused this analysis on IOBC toxicity rather than individual orchard
practices. Abundance was natural log transformed to improve normality. Using the same linear
mixed model, we examined orchard block size and tree age as potential confounding factors for
abundance. Linear mixed models were calculated using SPSS Versions 17.0 and 18.0 (IPM
Software, Chicago, Illinois, USA).
Since orchard owners set their spray schedules independently of our study, we
acknowledged that the last pesticide application before each sample date could confound the
relationship between overall monthly IOBC scores and wasp diversity. Therefore, we calculated
a “last spray” toxicity ratio for each month by dividing the IOBC toxicity rating of the most
recent pesticide application by number of days elapsed between application and our sample date,
assuming that the intensity of impact would decrease over time. If an orchard applied a mixture
of pesticides on the same date, we summed the IOBC toxicity class of each individual pesticide
for a total IOBC rating for the last spray. We then used the models discussed above to examine
the relationship between the last spray ratio and wasp species richness or abundance, including
total monthly IOBC toxicity scores as a covariate.
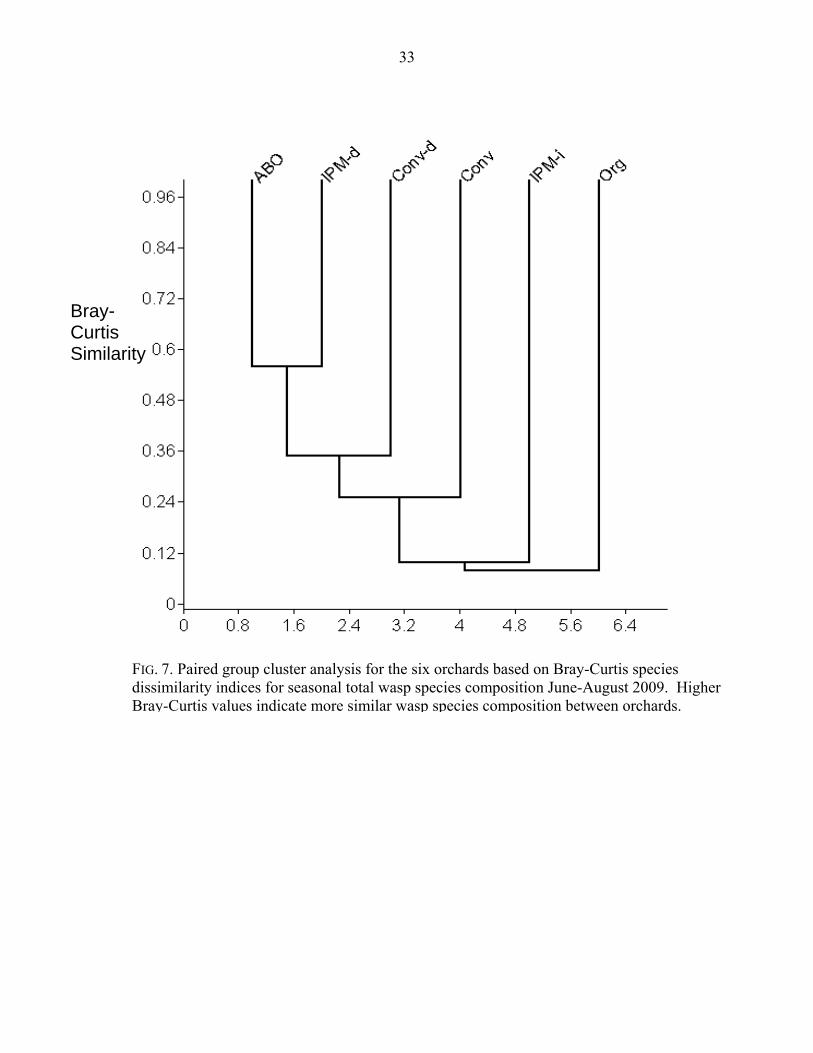
To compare wasp community composition among orchards, we tallied the number of
individuals per species and family collected at each orchard, then used a paired-group cluster
analysis in PAST Version 2.02 (Hammer et al. 2001) based on the Bray-Curtis dissimilarity
index (Bray and Curtis 1957) to group orchards based on similar morphospecies.

11
RESULTS
IOBC toxicity index for orchards
Based on grower reporting, we hypothesized that the orchards’ pest management
practices would rank as follows from least to most toxic to parasitoid wasps: Org, ABO, IPM-d,
IPM-i, Conv-d, and Conv. The total IOBC toxicity score for each orchard supported this gradient
with one exception: Conv-d had a lower IOBC toxicity score than either IPM-d or IPM-i. The
final gradient – Org, ABO, Conv-d, IPM-d = IPM-i, and Conv – reflected total IOBC toxicity
scores from 19 to 29 (Table 2, Fig. 1b).
IOBC toxicity scores also varied by month (Fig. 1a). Although we saw a general trend of
decreasing toxicity from May to August, toxicity scores at three orchards (ABO, IPM-d, and
Conv) actually peaked in June. IPM-i had a May IOBC toxicity score of 20, the highest score at
any orchard during any month, but had June and July scores which were the lowest for those
months. Finally, two orchards, ABO, and Conv, did not apply any pesticides between our July
and August sampling dates and thus had August IOBC toxicity scores of zero.
Wasp species richness and abundance
During May through August 2009 at the six orchards, we collected 892 parasitoid wasps,
811 of which we identified to 169 morphospecies in 16 families (Appendix Table A1). The
dominant families were Aphelinidae, with six species and 280 individuals, and Eulophidae, with
35 species and 262 individuals. A few abundant morphospecies within these two families
accounted for the overall family dominance: morphospecies Aphel_04 was represented by 260
individuals, and Eulop_08, Eulop_09, and Eulop_19 were represented by 93, 55, and 24
individuals, respectively. We also collected 96 morphospecies in various families that were
represented by a single individual (singletons).

12
Species accumulation curves for June-August 2009 totals indicated significantly higher
total wasp species richness at Org than at the other five orchards (Fig. 2a). However, patterns of
species richness varied from month to month (Fig. 2b) and only the species accumulation pattern
for July matched that of total species richness. Most notably, wasp species richness at Conv was
zero in June, but rose to the highest richness of the six orchards in August with 30 species. Org
had the highest species richness in June and July, but dropped in August to second highest after
Conv.
Patterns of wasp abundance also varied from month to month. May-August totals showed
similar mean wasp abundance per tree at Org, ABO and Conv (Fig. 3a). However, when we
examined monthly variation in mean wasp abundance, we found different orchard to orchard
differences depending on the month (Table A2) and distinct patterns at individual orchards over
the season (Table 4, Fig. 3b). Abundance at Conv followed a pattern similar to species richness:
we collected few to no wasps from May through July, but saw a dramatic spike in August to 18
wasps per tree, the highest mean wasp abundance found at any orchard during the 2009 season.
Abundance at Org also followed the same pattern as species richness; Org had the highest
abundance from May through July, but then dropped in August. At ABO, abundance increased
steadily over the season, while at IPM-d, abundance peaked in July and then dropped in August.
Finally, abundance at Conv-d and IPM-i remained low throughout the season.
Relationship between IOBC toxicity scores and wasp diversity
Wasp species richness from June-August was unaffected by orchards’ monthly IOBC
toxicity scores (Table 3, Fig. 4, p = 0.525). When we examined the relationship between species
richness and monthly IOBC toxicity scores at individual orchards, we did not find any significant
relationships (Table 3). There was a negative trend in the relationship between species richness

13
and monthly IOBC scores at Conv, but flat relationships at ABO, IPM-d, and IPM-i, and positive
relationships at Org and Conv-d, albeit over a narrow three-point range of IOBC scores (Fig. 4).
Examining the relationship between toxicity scores and species richness within specific months,
we found negative but non-significant relationships between each month’s IOBC toxicity scores
and species richness (Table 3; June p = 0.565, July p = 0.714, August p =0.720). Likewise,
neither orchard block size (p = 0.598) nor tree age (p = 0.254) had a significant impact on
species richness (Table 3).
In contrast, wasp abundance from May-August showed a significant negative relationship
with monthly IOBC toxicity scores in a mixed linear model (Table 4, Fig. 5, p = 0.014). While
wasp abundance was variable at lower IOBC toxicity scores, few to no wasps were found at
monthly IOBC toxicity scores of 13 or greater. Neither orchard block size (p = 0.525) nor tree
age (p = 0.932) had a significant effect on abundance when we controlled for IOBC toxicity
scores, nor influenced the significant relationship between IOBC and abundance (Table 4).
The last spray toxicity ratio (the most recent spray’s cumulative IOBC class divided by
the number of days between application and sample date) had a significant negative relationship
with abundance (Table 4, p = 0.031), but that relationship disappeared if we controlled for
monthly IOBC toxicity scores (Table 4, p = 0.350). Species richness was unaffected by the last
spray ratio (Table 3, p = 0.128).
Community composition
We compared morphospecies composition at the six orchards in terms of total number of
individuals per species from June through August (Fig. 6). Singletons were common at all
orchards, ranging from 14% of the total individuals at ABO and Conv to 81% at IPM-i.
Additionally, at every orchard except IPM-i, we collected a dominant species accounting for

14
27% (Org) to 65% (IPM-d) of total individuals. The aphelinid Aphel_04 was found at all
orchards except Org, and was the dominant species at ABO (61%), Conv-d (29%), and IPM-d
(65%). In contrast, the dominant species at Org and Conv were both eulophids: Eulop_09 at Org
(27%) and Eulop_08 at Conv (47%). Cluster analysis based on Bray-Curtis dissimilarity indices
(Fig. 7) showed that ABO and IPM-d had the most similar species composition (Bray-Curtis =
0.559), based in large part on Aphel_04’s dominance at both orchards. Org was the least similar
to any other orchard, with a maximum Bray-Curtis value of 0.108 with Conv.
Family composition varied among orchards in parallel with species composition, with
Aphelinidae well represented at all orchards except Org and IPM-i, and Eulophidae the dominant
family at Org and Conv (Fig. 8). The number of families ranged from nine at Conv to 13 at
ABO, and even orchards with low abundance showed moderate family diversity, with 10
families at IPM-i and 11 at Conv-d.

15
DISCUSSION
In this study, we compared parasitoid wasp diversity in six apple orchards along a
gradient of pest-management intensity. We found that broad pest-management categories -
organic, IPM, and conventional - were inconsistent predictors of parasitoid wasp diversity,
especially when we took into account monthly variation in species richness and abundance.
However, using monthly and seasonal IOBC toxicity scores as an index of pest-management
intensity (Thomson and Hoffman 2006) allowed us to better understand how orchard pest
management can affect biodiversity.
Diversity and IOBC toxicity scores
Although other biodiversity comparison studies (Hole et al. 2005, Koss et al. 2005,
Bengtsson et al. 2007, Letourneau and Bothwell 2008, Macfadyen et al. 2009, Crowder et al.
2010) reported seasonal or yearly totals of diversity, our results indicated that examining
monthly changes in species richness and abundance can give a more informative picture of how
diversity varies with pest-management practices over the season. In terms of species richness,
our season totals supported the results of previous studies (Hole et al. 2005, Bengtsson et al.
2007, Letourneau and Bothwell 2008) by finding significantly higher diversity in the organic
orchard than in all other orchards, and suggested that IPM and conventional practices support
similar numbers of species and could thus be pooled together (Fig. 2a). However, upon
examining patterns in individual months, only the July pattern matched that of season totals (Fig.
2b). In June, species richness followed a gradual gradient which aligned with the overall IOBC
toxicity gradient (Org – ABO – Conv-d – IPM-d – IPM-i – Conv), suggesting instead that
intermediate pesticide intensity permitted intermediate species richness as found by Suckling et
al. (1999). August also followed a gradual gradient, but this time with the highest species

16
richness in the most “conventional” orchard, Conv, in direct contrast to the conclusions of most
previous studies (Hole et al. 2005, Koss et al. 2005, Bengtsson et al. 2007, Letourneau and
Bothwell 2008; for an exception see Simon et al. 2007).
Season totals for abundance also appeared to contradict the results of previous
biodiversity comparisons, since we found the highest mean wasp abundance in the organic (Org),
“all but organic” (ABO) and conventional (Conv) orchards, even though these orchards fell at
opposite ends of the IOBC toxicity gradient (Fig. 3a). Monthly wasp abundance showed a more
complex picture, with individual patterns of change in abundance at each orchard (Fig. 3b). Most
notably, 86% of the wasps found at Conv were collected in August, with no wasps at all in June
and fewer than two wasps per tree in May and July.
Monthly IOBC toxicity scores help explain some of this variation in diversity from
month to month. First, pesticide toxicity levels appeared to create an upper bound on wasp
abundance, with variation at lower IOBC toxicity scores but few to no wasps at the highest
toxicity scores (Fig. 5). This relationship is also reflected by examining seasonal trends in IOBC
toxicity scores (Fig. 1a) and abundance (Fig. 3b): as toxicity scores generally decreased over the
season, the upper limit of abundance increased. The last pesticide application before each sample
date, expressed as a last spray ratio, did have a significant effect on abundance, but that effect
disappeared once we considered the month’s overall IOBC toxicity score (Table 4).
The relationship between monthly IOBC toxicity scores and species richness was less
clear cut. A general trend of decreasing IOBC toxicity scores over the season (Fig. 1a) coincided
with an increase in the minimum number of species found at any orchard (Fig. 2b), suggesting
that toxicity could set the bottom range of species richness; however, this relationship was not
significant when analyzed at either the seasonal or monthly level (Table 3, Fig. 4). These results

17
suggest that while pesticide toxicity set an upper limit on how many wasps could survive in each
orchard, the species richness of these wasps was likely shaped by other factors, such as host
presence and life cycles (Brown 1993, Holzschuh et al. 2010) or diversity of alternative hosts
and adult food sources within and surrounding the orchard (Lacey and Unruh 2005, Bianchi et al.
2006, Brown and Matthews 2007). The last pesticide application before spray date did not have a
significant effect on species richness (Table 3).
Hymenopteran community structure can be shaped in part by pest management, since
pesticides have varying effects on different species and families (Simon et al. 2007). Org
appeared to have a distinctly different wasp community that did the other orchards, according to
Bray-Curtis dissimilarity indices (Fig. 7) and the lack of Aphel_04, which was present at the
other five orchards and the dominant species at three of the five. Also notable was the high
percentage of singletons found at all orchards, regardless of pest-management strategy. Rarity
may be typical of parasitic Hymenoptera, which have been found to serve in natural systems in
low numbers but high species richness and can perform important regulatory functions despite
small population size (LaSalle 1993).
Diversity patterns in specific orchards
A few individual orchards went through notable changes in species richness or abundance
over the season. First, the dramatic August increase in wasp abundance and species richness at
Conv can be partly explained by monthly IOBC toxicity scores, since Conv had an August
toxicity score of zero. Since Conv is a relatively small orchard close to a small creek surrounded
by brushy habitat, wasps were likely able to immigrate into the study area from extra-orchard
areas once spraying ceased (Brown 1993, Miliczky and Horton 2005, Markó et al. 2009). ABO
also had an August toxicity score of zero and a corresponding increase in wasp abundance from

18
July to August. The increase at ABO may have been less dramatic than at Conv because of the
greater distance to extra-orchard habitat (Miliczky and Horton 2005), or because the higher
baseline wasp population at ABO already represented a greater proportion of regional wasp
diversity (Hooper et al. 2005).
Org also stood out due to higher wasp diversity during June and July than might be
predicted based on its monthly toxicity scores. One possible reason that Org was a positive
outlier was that IOBC toxicity scores overestimated the actual toxicity of the pesticides used. For
example, while the IOBC classed sulfur as “highly toxic” based on mortality of its indicator
species Trichogramma cacoeciae, even high concentrations of sulfur caused only moderate
mortality of Aphidius rhopalosiphi (public communication: IOBC pesticide toxicity database
accessed July 20, 2010 from http://www.iobc-wprs.org/ip_ipm/03022_IOBC_
PesticideDatabase_2005.pdf). Therefore, if sulfur were less toxic to the wasp species present at
Org than to T. cacoeciae, then Org’s June IOBC toxicity score might have been exaggerated.
Alternately, other practices at Org might have helped increase diversity regardless of pesticide
application, such as grower tolerance of foliage pests which could serve as alternative hosts, or
reduced mowing to preserve weeds acting as pollen and nectar sources for adult wasps (J. Koan,
personal communication).
We were also intrigued by the combination of low wasp abundance with relatively high
species richness found at IPM-i and Conv-d, where singletons accounted for 81% and 36% of the
number of wasps, respectively. This pattern may have been a reflection of parasitic wasps’
characteristic rarity (LaSalle 1993), but at IPM-i could also reflect a combination of orchard size
and high pesticide use. IPM-i was the largest orchard in our study, with no obvious potential
refugia within sight of the study block, and had a May IOBC toxicity score that was the highest

19
score at any orchard during any month. We only collected one wasp in May, indicating a low
baseline resident population. Therefore, even though IPM-i had low toxicity scores over the rest
of the season, if wasps were unable to migrate easily into the orchard because of greater distance
to extra-orchard habitat (Miliczky and Horton 2005, Bianchi et al. 2006), the few wasps found
were likely “foragers” passing through but not yet established or actively parasitizing (Brown
and Schmitt 2001). In contrast, Conv-d had the third lowest IOBC toxicity index of the six
orchards, and is a small orchard with blocks of apples interplanted with diverse crops including
peaches, which could serve as attractive alternative nectar sources for parasitoid wasps (Brown
and Schmitt 2001). Therefore, the low wasp abundance at Conv-d was not well explained by our
study, and may be due to historical pesticide use or other practices not captured in 2009 records.
Orchard size and diversity
Although orchard block size did not show a significant relationship with abundance or
species richness in our statistical analyses (Table 3, Table 4), distance to extra-orchard habitat
has been shown to influence parasitoid diversity and activity (Altieri and Schmidt 1986,
Miliczky and Horton 2005, Bianchi et al. 2006) and helps explain some of the monthly variation
in diversity, especially at Conv and IPM-i. It is likely that our small sample size and the
confounding effects of toxicity levels and orchard block size limited the effectiveness of the
statistical test for block size; we only examined one orchard with a very large block size (IPM-i)
and the two orchards of intermediate block size coincidentally had the lowest IOBC toxicity
scores (Org and ABO). For future studies, rather than use orchard block size as a surrogate for
distance to extra-orchard habitat, it would be useful to measure specific distances from study
sites to potential areas likely to support parasitoids.
Limitations of IOBC toxicity index

20
Although using cumulative IOBC toxicity scores as a pest management index allowed for
a more complete explanation of parasitic Hymenoptera diversity differences among the six
orchards than using broad management categories, the index did not adequately explain species
richness or patterns at orchards like Conv-d. Many factors in addition to pest management can
influence natural enemy diversity, including plant and prey/host diversity within the orchard
(Brown 1993, Brown and Schmitt 2001, Holzschuh et al. 2010), prey/host population cycles
(Brown 1993, Thomson and Hoffman 2007), availability of alternative prey/hosts and food
sources (Landis et al. 2000, Lacey and Unruh 2005, Bianchi et al. 2006), potential for predator
recolonization after disturbance (Miliczky and Horton 2005, Markó et al. 2009) and regional
landscape complexity (Bianchi et al. 2006, Tscharntke et al. 2008). These factors may also
interact; for instance, Holzschuh et al. (2010) pointed out that while bee diversity generally
decreased with reduced landscape complexity around agricultural fields, this effect did not occur
on organic farms.
Additionally, the IOBC toxicity index is based on a set of assumptions that may not
adequately account for the complex ways pesticides could impact parasitoid wasps. First, by
summing the cumulative scores for each pesticide used at an orchard, we treated the effects of
different pesticides as additive. If instead some pesticides interact synergistically, then the IOBC
toxicity index could underestimate the actual cumulative impact on wasps (Thomson and
Hoffman 2007). Second, IOBC toxicity classes for individual pesticides are based on acute
toxicity; however, since pesticides have varying persistence, two pesticides with comparable
acute toxicity could have different impacts over time (Williams et al. 2003). Third, by focusing
only on direct mortality, IOBC toxicity classes do not account for sublethal effects of pesticides
that could also affect parasitoid abundance and species richness, but are more difficult to
21
quantify (Thomson and Hoffman 2007, Jones et al. 2009). Fourth, IOBC toxicity classes are
based on indicator species, which facilitates consistent pesticide comparisons, but may not
account for the actual impact on local species, especially in field settings (Thomson and
Hoffman 2007). Finally, timing of application could affect impact, since immature life stages of
the parasitoid are enclosed in their hosts and therefore may be partially protected from pesticides
(Longley 1999, Bastos et al. 2006).
Based on these limitations, Thomson and Hoffman (2007) proposed a refined pesticide
impact metric based on three variables: the relative reduction of the predator population via
either lethal or sublethal effects; the persistence time of each pesticide; and the potential for the
predator to re-populate the agroecosystem from surrounding areas. Although these variables
could be challenging to calculate based on available pesticide data, they could also help create a
pest-management index that allows for more meaningful comparisons of different systems.
Additionally, it would be ideal to carry out multi-year diversity comparisons between different
farms to tease out longer term patterns of variation in abundance and species richness.
Conclusions and management implications
Our study points to some possible implications for apple growers and researchers
interested in further reducing pesticide use in order to encourage natural enemy diversity. While
parasitoid wasps have been shown to provide only partial biological control of apple foliar and
fruit pests (Van Driesche and Taub 1983, Hull et al. 1997, Jones et al. 2009), they could serve as
an important tool in combination with non-pesticidal management strategies such as pheromone
mating disruption for C. pomonella. Therefore, parasitoid wasps represent a relatively untapped
area of focus for orchard IPM extension.
Our first major finding was that parasitoid wasp abundance and species richness in an

22
orchard can vary, sometimes dramatically, from month to month. As the large August increase in
wasp abundance and species richness at Conv demonstrated, wasps could recolonize even a
heavily sprayed orchard after pesticide application ceased if the orchard is sufficiently close to a
wasp refuge or source population. Therefore, growers could increase the potential for
supplemental biological control of various pests by creating or preserving habitat favorable to
wasps within or near orchards (Lacey and Unruh 2005), and by timing sprays to reduce
parasitoid exposure during more vulnerable life stages (Longley 1999, Bastos et al. 2006).
Additionally, further research could examine when during the season wasps make the greatest
contribution toward biological control of pests, so that growers could aim to preserve wasp
diversity during the time of maximum impact. For example, Cook et al. (2007) report that
parasitoids can effectively control aphids only if the parasitoids enter fields before exponential
aphid population growth begins.
We also found that while the IOBC toxicity index had its limits, especially in explaining
variation in wasp species richness, it served as a better predictor of wasp abundance than broad
orchard management categories like organic, IPM, and conventional. Apple growers and
extension educators could utilize such an index to increase wasp and other natural enemy
populations and thus biological control of orchard pests. For instance, current apple IPM
programs to preserve beneficial arthropods do not generally focus on fungicides, yet fungicides
made up 58-71% of the total pesticide applications at each of the six orchards and can be as toxic
to parasitoid wasps as many insecticides are (Table 2). By using a standardized toxicity index to
help growers select both insecticides and fungicides that are minimally toxic to parasitoid wasps,
growers could build the populations of these currently underutilized natural enemies and
complement their efforts to control apple pests with fewer and less toxic pesticides.

23
TABLES
TABLE 1. Participating orchards’ pest management category, block size, tree age, strain of Red Delicious apples planted, and notes on pest management practices.
Orchard Pest management
category
Orchard block size
(ha) a
Tree age
(yrs)
Tree spacing
(m) b
Red Delicious
strain Pest management notesOrg Certified organic 7.3 15 4.4 x 5.5 Red Chief Holistic approach, high
tolerance of leaf damageABO IPM, advanced 8.1 15 2.6 x 5.4 Cambell Owner calls practices “all
but organic” IPM-d IPM, mid-level,
diverse 3.3 25 3.6 x 5.6 Red Chief Diverse plantings of tree
and small fruits, vegetables; “wait and see” approach to pest control
IPM-i IPM, intensive 22.3 8 2.1 x 4.7 IT Delicious Intensive production, IPM for mite control
Conv-d Conventional, diverse
1.6 40 5.1 x 7.0 Unknown Diverse plantings of tree and small fruits
Conv Conventional 4.9 9 6.2 x 6.2 Adams Follows strict spray schedule
Notes. a Orchard block size based on the number of hectares occupied by apple trees and bordered by hedgerows, other crops, or significant roads. b Tree spacing = distance between trees within row x distance between rows. Exception is Conv-d, where table reports average distance between trees because tree spacing varied from 4.1 to 8.9 m.

24
TABLE 2. Pesticide applications with IOBC toxicity classes, total orchard IOBC toxicity scores, and other pest management practices used in study orchards, January through August 2009.
Adjusted IOBC class
Applications per orchardPesticide Org ABO Conv-d IPM-d IPM-i ConvFungicides / bactericides Streptomycin sulfate 0a 0 0 0 1 1 2Captan 1 0 1 6 3 6 4Copper hydroxide 0b 14 0 1 1 1 1Dithiocarbamate/Ziram 0c 0 2 2 2 1 0Fenarimol 1 0 0 2 3 0 0Kresoxim-methyl 0 0 0 0 1 0 1Lime-sulfur 2 1 0 0 0 0 0Mancozeb 1d 0 10 3 4 3 4Myclobutanil 0e 0 2 0 2 2 4Pyrimethanil 2 0 0 1 0 0 1Thiophanate-Methyl 0 0 0 0 0 0 1Trifloxystrobin 0f 0 0 0 1 1 1Sulfur 2 4 0 0 0 0 0
Insecticides / miticides Acetamiprid 2g 0 0 1 2 0 1Azinphos-methyl 2 0 0 0 0 3 3Carbaryl h 2 0 1 1 1 2 2Chlorpyrifos 2 0 0 0 0 1 0C. pomonella granulosis virus 0 1 0 0 0 0 0Imidacloprid 2 0 0 0 1 1 0Imidacloprid + Cyfluthrin 2f 0 0 0 0 0 1Indoxacarb 1 0 0 1 0 0 0Novaluron 1i 0 1 1 0 0 0Petroleum Oil 1j 8 1 1 0 1 1Phosmet 2 0 1 1 4 0 2Pyrethrin (organic certified) 1k 1 0 0 0 0 0Rynaxypyr/Chlorantraniliprole 0l 0 0 2 0 0 0Spinetoram 1 0 0 1 0 0 0Spinosad (GF 120) 1 2 0 0 0 0 0Thiacloprid 2 0 2 0 1 1 0Spirodiclofen 0 0 0 1 1 0 0
Total pesticide applications 31 21 25 28 24 29Total pesticides used 7 9 15 15 13 152009 IOBC toxicity score 19 21 23 28 28 29Other pest control practices Pheromone mating disruption 1 1 0 0 0 0Delayed mowing m 1 0 0 0 1 0Orchard scout / traps n 1 1 1 1 1 1
Notes: a U.S. EPA assessment. bThomson and Hoffman 2006. c Mani and Krishnamoorthy 1997. d Class 1 assigned due to spray concentration. e Manzoni et al. 2006. f Carmo et al. 2010. g Estay et al. 2005. h Used as apple thinning agent. iBastos et al. 2006. j Suma et al. 2009. k IOBC class reduced to 1 because only applied to block perimeter, not sample trees. l Preetha et al. 2009. m Spring mowing delayed to allow predatory mites to migrate up into trees from overwintering sites. n Org and ABO contract with professional scout; IPM-i has a scout on staff; Conv-d, IPM-d and Conv utilized a scout in 2009 provided gratis by a local pesticide company, Wilbur-Ellis.

25
TABLE 3. Relationship between IOBC pesticide toxicity scores and counts of total parasitoid wasp species richness per orchard. Statistically significant results (p < 0.05) are indicated by an asterisk.
Predictor Numerator df Denominator df F p Monthly IOBC toxicity scores a 1 5 0.47 0.525Orchard block size a, b 1 6 0.31 0.598Tree age a, b 1 5 1.59 0.254Last spray ratio a, b 1 5 3.32 0.128
Predictor Wald Chi-Square df p Total IOBC toxicity scores c, d 0.346 1 0.556Monthly IOBC toxicity scores – by month: c
June 0.331 1 0.565July 0.134 1 0.714August 0.129 1 0.720
Monthly IOBC toxicity scores – by orchard: c Org 0.080 1 0.777ABO 0.003 1 0.953Conv-d 0.088 1 0.767IPM-d 0.000 1 0.997IPM-i 0.001 1 0.973Conv 3.264 1 0.071
a Statistical model: generalized linear mixed model (GLMM) with random coefficients for the intercept and slope of IOBC scores for each orchard. We specified a negative binomial distribution of species richness counts.
b Monthly IOBC toxicity scores included as covariate. c Statistical model: negative binomial regression. We specified a negative binomial distribution
of species richness counts. d Uses count of total species richness for the season (June-August 2009). All other analyses in
this table used monthly species richness counts.

26
TABLE 4. Relationship between parasitoid wasp abundance and individual orchard practices, and between abundance and IOBC toxicity scores. Statistically significant results (p < 0.05) are indicated by an asterisk.
Predictor Numerator df Denominator df F pMonthly abundance comparisons: a
Month 3 162 59.483 <0.001*Orchard 5 54 26.579 <0.001*Orchard by month b 15 162 10.712 <0.001*
Monthly IOBC toxicity scores c 1 6 12.442 0.014*Orchard block size c, d 1 3 0.498 0.525Tree age c, d 1 4 0.008 0.932Last spray ratio c 1 6 8.187 0.031*Last spray ratio with monthly IOBC
toxicity scores as covariate c, d 1 4 1.145 0.350
Predictor Wald Chi-Square df p Total IOBC toxicity scores e 0.205 1 0.605
a Statistical model: repeated measures ANOVA with orchard, month, and orchard by month interaction included as fixed effects. Abundance data were natural log transformed to obtain more normally distributed residuals. b Due to the significance of this interaction, we performed post-hoc tests to compare mean abundance across orchards within each month. Results of paired comparison post-hoc tests are summarized in Appendix Table A2. c Statistical model: linear mixed model (LMM) with orchard included as random effect and individual trees considered as subject effect. d Monthly IOBC toxicity scores included as covariate. e Statistical model: negative binomial regression. We specified a negative binomial distribution
of total abundance counts per orchard.
27
0
5
10
15
20
25
30
May June July August
IOBC
toxicity score
Month
OrgABOConv‐dIPM‐dIPM‐iConv
19
21
23
282829
0
5
10
15
20
25
30
Total IOBC
FIGURES
a) Monthly and total IOBC toxicity scores by orchard
FIG. 1. IOBC wasp toxicity scores calculated for each orchard, by month and 2009 May-August season totals, and final toxicity gradient for the six orchards. Season total scores are indicated above each orchard bar and were used to establish the toxicity gradient for the six orchards: Org, ABO, Conv-d, IPM-d, IPM-i, and Conv. IOBC toxicity scores were calculated by multiplying the IOBC toxicity class of each pesticide by the number of times applied,
FIG. 1. a) IOBC wasp toxicity scores calculated for each orchard, by month and 2009 May-August season totals. IOBC toxicity scores were calculated by multiplying the IOBC toxicity class of each pesticide by the number of times applied, then summing up scores for different pesticides. Season total scores are indicated above each orchard bar.
b) Final toxicity gradient for the six orchards based on total IOBC toxicity scores.
b) Final IOBC toxicity gradient

28
FIG. 2. a) Total parasitoid species richness from June through August 2009 at six apple orchards. Dotted lines represent 95% confidence intervals and indicate significantly higher species richness at Org than at the other five orchards.
b) Monthly variation in wasp species richness at the six orchards, using maximums from species accumulation curves for each month. Bars represent 95% confidence intervals. Orchards within the same month indicated by the same letter do not differ significantly from each other.
0
10
20
30
40
50
60
70
80
90
1 2 3 4 5 6 7 8 9 10
Num
ber of wasp species
Number of trees sampled
a) Total species richness Jun‐Aug 2009
OrgABOConv‐dIPM‐dIPM‐iConv95% CI
0
5
10
15
20
25
30
35
40
45
June July August
Num
ber of wasp species
Month 2009
b) Variation in wasp species richness by month, 2009
Org
ABO
Conv‐d
IPM‐d
IPM‐i
Conv
a
ab
bc
bc
c
d
a
b
bb
bb
a
ababab
b b

29
0.0
2.0
4.0
6.0
8.0
10.0
12.0
14.0
16.0
18.0
May June July August
Mean wasp ab
unda
nce pe
r tree
Month 2009
b) Monthly variation in mean wasp abundance per tree, 2009
Org
ABO
Conv‐d
IPM‐d
IPM‐i
Conv
FIG. 3. a) Total mean wasp abundance per tree from May through August 2009 at six apple orchards. Bars represent standard errors.
b) Monthly variation in mean wasp abundance per tree at the six orchards. Bars represent standard errors. Orchards within the same month indicated by the same letter do not differ significantly from each other. Appendix Table A2 summarizes results from post-hoc pairwise comparisons of mean abundances across orchards within each month.
0.0
1.0
2.0
3.0
4.0
5.0
6.0
7.0
Org ABO Conv‐d IPM‐d IPM‐i Conv
Mean nu
mbe
r of wasps per tree
Orchard
a) Mean wasp abundance per tree ‐ 2009 totals
a
a
a
a
a
b
b b
ababc
bccc
ab
cdebcdecdede
ab
abc
e
bcdcd
bcd

30
0
5
10
15
20
25
30
35
40
0 2 4 6 8 10 12 14
Total w
asp species richne
ss per m
onth
Monthly IOBC toxicity scores
OrgABOConv‐dIPM‐dIPM‐iConv
FIG. 4. Relationship between monthly IOBC toxicity scores and monthly counts of total parasitoid wasp species richness at six orchards from June through August 2009. A generalized linear mixed model did not find a significant relationship between monthly IOBC scores and species richness (p = 0.525, Table 3). Dotted lines indicate trendlines for individual orchards.

31
FIG. 5. Relationship between monthly IOBC pesticide toxicity scores and mean wasp abundance per tree at six orchards sampled from May through August 2009. A linear mixed model found a significant negative relationship between monthly IOBC toxicity scores and natural log transformed abundance (p = 0.014, Table 4). Mean abundance per tree is presented in this figure for clarity.
0
2
4
6
8
10
12
14
16
18
0 5 10 15 20
Mean wasp ab
unda
nce pe
r tree
Monthly IOBC toxicity score
Org
ABO
Conv‐d
IPM‐d
IPM‐i
Conv

32
Org: 202 individuals ABO: 198 individuals
Conv: 187 individualsIPM‐d: 118 individuals
Conv‐d: 69 individuals
IPM‐i: 37 individuals
FIG. 6. Wasp morphospecies composition in six orchards. Total number of wasp individuals per orchard is indicated above each pie chart. The dominant species per orchard is marked with number of wasps and percentage of total wasps in that orchard; other species that represent 10% or more of total individuals are indicated by name and number of wasps. Singletons are grouped as one category per orchard. Unlabeled colored segments indicate shared species with >1 individuals per orchard; white segments indicate species that either occurred in only one orchard or only occurred as singletons in other orchards. Aphel_04 was collected from all orchards except Org.
Singletons, 47 Eulop_09,
55, 27%
Aphel_04, 121, 61%
Singletons,28
Singletons,26
Aphel_04,40
Eulop_08,88, 47% Eulop_19,
19Aphel_04,77, 65%
Singletons, 29
Aphel_04,20, 29% Singletons,
25
Aphel_04
Brac_05,3, 8%
Singletons,30
33
Bray-Curtis Similarity
FIG. 7. Paired group cluster analysis for the six orchards based on Bray-Curtis species dissimilarity indices for seasonal total wasp species composition June-August 2009. Higher Bray-Curtis values indicate more similar wasp species composition between orchards.

34
0
50
100
150
200
Org ABO Conv‐d IPM‐i IPM‐d Conv
Total num
ber of individu
als pe
r family
Orchard
Minor families*
Encyrtidae
Ceraphronidae
Figitidae
Mymaridae
Ichneumonidae
Braconidae
Pteromalidae
Platygastridae
Eulophidae
Aphelinidae
FIG. 8. Wasp family composition in the six orchards. Total number of families per orchard is indicated above each bar. *Minor families (Diapriidae, Eurytomidae, Megaspilidae, Eucharitidae, Sierolomorphidae and Torymidae) are represented by ≤ 3 individuals per orchard.
11 13
11
10
12
9
35
LITERATURE CITED
Agnello, A. M., W. H. Reissig, J. Kovach, and J. P. Nyrop. 2003. Integrated apple pest
management in New York State using predatory mites and selective pesticides.
Agriculture, Ecosystems and Environment 94:183-195.
Altieri, M. A., and L. L. Schmidt. 1986. The dynamics of colonizing arthropod communities at
the interface of abandoned, organic and commercial apple orchards and adjacent
woodland habitats. Agriculture, Ecosystems and Environment 16:29-43.
Atanassov, A., P. W. Shearer, and G. C. Hamilton. 2003. Peach pest management programs
impact beneficial fauna abundance and Grapholita molesta (Lepidoptera: Tortricidae)
egg parasitism and predation. Environmental Entomology 32:780-788.
Bastos, C. S., R. P. de Almeida, and F. Suinaga. 2006. Selectivity of pesticides used on cotton
(Gossypium hirsutum) to Trichogramma pretiosum reared on two laboratory-reared hosts.
Pest Management Science 62:91-98.
Bengtsson, J., J. Ahnström, and A. Weibull. 2005. The effects of organic agriculture on
biodiversity and abundance: a meta-analysis. Journal of Applied Ecology 42:261-269.
Bianchi, F. J. J. A., C. J. H. Booij, and T. Tscharntke. 2006. Sustainable pest regulation in
agricultural landscapes: a review on landscape composition, biodiversity and natural pest
control. Proceedings of the Royal Society of Biological Sciences 273:1715-1727.
Biddinger, D. J., C. M. Felland, and L. A. Hull. 1994. Parasitism of tufted apple bud moth
(Lepidoptera: Tortricidae) in conventional insecticide and pheromone-treated
Pennsylvania apple orchards. Environmental Entomology 23:1568-1579.
Borror, D. J., C. A. Triplehorn, and N. F. Johnson. 1989. An introduction to the study of insects.
Sixth edition. Thomson Learning, USA.
Borror, D. J., and R. E. White. 1970. A field guide to the insects America north of Mexico.
Houghton Mifflin, New York, Ney York, USA.
Bray, J. R., and J. T. Curtis. 1957. An ordination of the upland forest communities of southern
Wisconsin. Ecological Monographs 4:326-349.
Brown, M. W. 1993. Resilience of the natural arthropod community on apple to external
disturbance. Ecological Entomology 18:169-183.
Brown, M. W., and C. R. Matthews. 2007. Conservation biological control of rosy apple aphid,
Dysaphis plantaginea (Passerini) in eastern North America. Environmental Entomology

36
36:1131-1139.
Brown, M. W., and J. J. Schmitt. 2001. Seasonal and diurnal dynamics of beneficial insect
populations in apple orchards under different management intensity. Environmental
Entomology 30:415-424.
Carmo, E. L., A. F. Bueno, and R. C. O. F. Bueno. 2010. Pesticide selectivity for the insect egg
parasitoid Telenomus remus. BioControl 55:455-464.
Colwell, R. K. 2006. EstimateS: Statistical estimation of species richness and shared species
from samples. Version 8. Persistent URL <purl.oclc.org/estimates>.
Cook, S. M., Z. R. Khan, and J. A. Pickett. 2007. The use of push-pull strategies in integrated
pest management. Annual Review of Entomology 52:375-400.
Cross, J. V., M. G. Solomon, D. Babandreier, L. Blommers, M. A. Easterbrook, C. N. Jay, G.
Jenser, R. L. Jolly, U. Kuhlmann, R. Lilley, E. Olivella, S. Toepfer, and S. Vidal. 1999.
Biocontrol of pests of apples and pears in northern and central Europe: 2. Parasitoids.
Biocontrol Science and Technology 9:277-314.
Crowder, D. W., T. D. Northfield, M. R. Strand, and W. E. Snyder. 2010. Organic agriculture
promotes evenness and natural pest control. Nature 466:109-113.
Estay, P., J. E. Araya, and M. H. Araya. 2005. Toxicidad en laboratorio de imidacloprid,
acetamiprid y abamectina sobre adultos de Encarsia formosa (Gahan) (Hymenoptera,
Aphelinidae). Boletín Sociedad Entomológica Aragonesa 37:369-371.
Franz, J. M., H. Bogenschütz, S. A. Hassan, P. Huang, E. Naton, H. Suter, and G. Viggiani.
1980. Results of a joint pesticide test programme by the Working Group: Pesticides and
Beneficial Arthropods. Entomophaga 25:231-236.
Grissell, E. E., and M. E. Schauff. 1990. A handbook of the families of Nearctic Chalcidoidea
(Hymenoptera). The Entomological Society of Washington, Washington, D. C., USA.
Gut, L. J., and J. F. Brunner. 1998. Pheromone-based management of codling moth
(Lepidoptera: Tortricidae) in Washington apple orchards. Journal of Agricultural
Entomology 15:387-405.
Hammer, O., D. A. T. Harper, and P. D. Ryan. 2001. PAST: paleontological statistics software
package for education and data analysis. Palaeontologia Electronica 4:9pp.
Harper, C. A., and D. C. Guynn, Jr. 1998. A terrestrial vacuum sampler for macroinvertebrates.
Wildlife Society Bulletin 26:302-306.

37
Hassan, S. A., F. Bigler, H. Bogenschütz, J. U. Brown, S. I. Firth, P. Huang, M. S. Ledieu, E.
Naton, P. A. Oomen, W. P. J. Overmeer, W. Rieckmann, L. Samsøe-Petersen, G.
Viggiani, and A. Q. van Zon. 1983. Results of the second joint pesticide testing
programme by the IOBC/WPRS-Working Group “Pesticides and Beneficial Arthropods.”
Zeitschrift fur Angewandte Entomologie 95:151-158.
Hassan, S. A., R. Albert, F. Bigler, P. Blaisinger, H. Bogenschütz, E. Boller, J. Brun, P.
Chiverton, P. Edwards, W. D. Englert, P. Huang, C. Inglesfield, E. Naton, P. A. Oomen,
W. P. J. Overmeer, W. Rieckmann, L. Samsøe-Petersen, J. J. Tuset, G. Viggiani, and G.
Vanwetswinkel. 1987. Results of the third joint pesticide testing programme by the
IOBC/WPRS-Working Group “Pesticides and Beneficial Arthropods.” Journal of
Applied Entomology 103:92-107.
Hassan, S. A., F. Bigler, H. Bogenschütz, E. Boller, J. Brun, P. Chiverton, P. Edwards, F.
Mansour, E. Naton, P. A. Oomen, W. P. J. Overmeer, L. Polgar, W. Rieckmann, L.
Samsøe-Petersen, A. Stäubli, G. Sterk, K. Tavares, J. J. Tuset, G. Viggiani, and A. G.
Vivas. 1988. Results of the 4th joint pesticide testing programme carried out by the
IOBC/WPRS-Working Group “Pesticides and Beneficial Organisms.” Journal of Applied
Entomology 105:321-329.
Hassan, S. A., F. Bigler, H. Bogenschütz, E. Boller, J. Brun, J. N. M. Calis, J. Coremans-
Pelseneer, C. Duso, A. Grove, U. Heimbachi, N Helver, H. Hokkanen, G. B. Lewis, F.
Mansour, L. Moreth, L. Polgar, L. Samsøe-Petersen, B. Sauphanor, A. Stäubli, G. Sterk,
A. Vainio, M. van de Veire, G. Viggiani, and H. Vogt. 1994. Results of the sixth joint
pesticide testing programme of the IOBC/WPRS-Working Group “Pesticides and
Beneficial Organisms.” Entomophaga 39:107-119.
Hole, D. G., A. J. Perkins, J. D. Wilson, I. H. Alexander, P. V. Grice, and A. D. Evans. 2005.
Does organic farming benefit biodiversity? Biological Conservation 122:113-130.
Holzschuh, A., I. Steffan-Dwenter, and T. Tscharntke. 2010. How do landscape composition and
configuration, organic farming and fallow strips affect the diversity of bees, wasps and
their parasitoids? Journal of Animal Ecology 79:491-500.
Hooper, D. U., F. S. Chapin, III, J. J. Ewel, A. Hector, P. Inchausti, S. Lavorel, J. H. Lawton, D.
M. Lodge, M. Loreau, S. Naeem, B. Schmid, H. Setälä, A. J. Symstad, J. Vandermeer,
and D. A. Wardle. 2005. Effects of biodiversity on ecosystem functioning: a consensus of

38
current knowledge. Ecological Monographs 75:3-35.
Hull, L. A., B. A. McPheron, and A. M. Lake. 1997. Insecticide resistance management and
integrated mite management in orchards: can they coexist? Pesticide Science 51:359-366.
Jones, V. P., T. R. Unruh, D. R. Horton, N. J. Mills, J. F. Brunner, E. H. Beers, and P. W.
Shearer. 2009. Tree fruit IPM programs in the western United States: the challenges of
enhancing biological control through intensive management. Pest Management Science
65:1263-1377.
Koss, A. M., A. S. Jensen, A. Schreiber, K. S. Pike, and W. E. Snyder. 2005. Comparison of
predator and pest communities in Washington potato fields treated with broad-spectrum,
selective, or organic insecticides. Environmental Entomology 34:87-95.
Lacey, L. A., and T. R. Unruh. 2005. Biological control of codling moth (Cydia pomonella,
Lepidoptera: Tortricidae) and its role in integrated pest management, with emphasis on
entomopathogens. Vedalia 12:33-60.
Landis, D. A., S. D. Wratten, and G. M. Gurr. 2000. Habitat management to conserve natural
enemies of arthropod pests in agriculture. Annual Review of Entomology 45:175-201.
LaSalle, J. 1993. Parasitic Hymenoptera, biological control and biodiversity. In LaSalle, J., and I.
D. Gauld. 1993. Hymenoptera and biodiversity. CAB International, Wallingford,
England.
Letourneau, D. K., and S. G. Bothwell. 2008. Comparison of organic and conventional farms:
challenging ecologists to make biodiversity functional. Frontiers in Ecology and the
Environment 6:430-438.
Longley, M. 1999. A review of pesticide effects upon immature aphid parasitoids within
mummified hosts. International Journal of Pest Management 45:139-145.
Macfadyen, S., R. Gibson, A. Polaszek, R. J. Morris, P. G. Craze, R. Planqué, W. O. C.
Symondson, and J. Memmott. 2009. Do differences in food web structure between
organic and conventional farms affect the ecosystem service of pest control? Ecology
Letters 12:229-238.
MacPhee, A. W., and K. H. Sanford. 1954. The influence of spray programs on the fauna of
apple orchards in Nova Scotia. VII. Effects on some beneficial arthropods. The Canadian
Entomologist 86:128-135.
Mani, M., and A. Krishnamoorthy. 1997. Effects of different pesticides upon the wax scale

39
parasitoid, Anicetus ceylonensis How. (Hym.: Encyrtidae). International Journal of Pest
Management 43:123-126.
Manzoni, C. G., A. D. Grützmacher, F. P. Giolo, W. da Roza Härter, and C. Müller. 2006.
Selectividade de agrotóxicos usados na produção integrada de maçã para adultos de
Trichogramma pretiosum. Pesquisa Agropecuária Brasileira 41:1461-1467.
Markó, V., B. Keresztes, M. T. Fountain, and J. V. Cross. 2009. Prey availability, pesticides and
the abundance of orchard spider communities. Biological Control 48:115-124.
Miliczky, E. R., and D. R. Horton. 2005. Densities of beneficial arthropods within pear and apple
orchards affected by distance from adjacent native habitat and association of natural
enemies with extra-orchard host plants. Biological Control 33:249-259.
Molenberghs, G., and G. Verbeke. 2000. Linear mixed models for longitudinal data. Springer,
New York, NY, USA.
Molenberghs, G., and G. Verbeke. 2005. Models for discrete longitudinal data. Springer, New
York, NY, USA.
Perry, R., J. Flore, M. Whalon, J. Johnson, A. Jones, G. Van Ee, and C. Edson. 1996. The
development of integrated fruit management programs in Michigan, USA. Acta
Horticulturae 422:85-89.
Preetha, G., J. Stanley, S. Suresh, S. Kuttalam, and R. Samiyappan. 2009. Toxicity of selected
insecticides to Trichogramma chilonis: assessing their safety in the rice ecosystem.
Phytoparasitica 37:209-215.
Prokopy, R. J. 1994. Integration in orchard pest and habitat management: a review. Agriculture,
Ecosystems and Environment 50:1-10.
Prokopy, R. J., J. L. Mason, M. Christie, and S. E. Wright. 1996. Arthropod pest and natural
enemy abundance under second-level versus first-level integrated pest management
practices in apple orchards: a 4-year study. Agriculture, Ecosystems and Environment
57:35-47.
Sarvary, M. A., J. Nyrop, H. Reissig, and K. M. Gifford. 2007. Potential for conservation
biological control of the obliquebanded leafroller (OBLR) Choristoneura rosaceana
(Harris) in orchard systems managed with reduced-risk insecticides. Biological Control
40:37-47.
Simon, S., H. Defrance, and B. Sauphanor. 2007. Effect of codling moth management on orchard

40
arthropods. Agriculture, Ecosystems and Environment 122:340-348.
Sterk, G., S. A. Hassan, M. Baillod, F. Bakker, F. Bigler, S. Blümel, H. Bogenschütz, E. Boller,
B. Bromand, J. Brun, J. N. M. Calis, J. Coremans-Pelseneer, C. Duso, A. Garrido, A.
Grove, U. Heimbach, H. Hokkanen, J. Jacas, G. Lewis, L. Moreth, L. Polgar, L. Roversti,
L. Samsoe-Petersen, B. Sauphanor, L. Schaub, A. Stäubli, J. J. Tuset, A. Vainio, M. Van
de Veire, G. Viggiani, E. Viñuela, and H. Vogt. 1999. Results of the seventh joint
pesticide testing programme carried out by the IOBC/WPRS-Working Group ‘Pesticides
and Beneficial Organisms.’ BioControl 44:99-117.
Suckling, D. M., J. T. S. Walker, and C. H. Wearing. 1999. Ecological impact of three pest
management systems in New Zealand apple orchards. Agriculture, Ecosystems and
Environment 73:129-140.
Suma, P., L. Zappalà, G. Mazzeo, and G. Siscaro. 2009. Lethal and sub-lethal effects of
insecticides on natural enemies of citrus scale pests. BioControl 54:651-661.
Thomson, L. J., and A. A. Hoffman. 2006. Field validation of laboratory-derived IOBC toxicity
ratings for natural enemies in commercial vineyards. Biological Control 39:507-515.
Thomson, L. J., and A. A. Hoffman. 2007. Ecologically sustainable chemical recommendations
for agricultural pest control? Journal of Economic Entomology 100:1741-1750.
Tscharntke, T., R. Bommarco, Y. Clough, T. O. Crist, D. Kleijn, T. A. Rand, J. M. Tylianakis, S.
van Nouhuys, and S. Vidal. 2008. Reprint of “Conservation biological control and enemy
diversity on a landscape scale” [Biol. Control 43 (2007) 294-309]. Biological Control
45:238-253.
VanDriesche, R. G., and G. Taub. 1983. Impact of parasitoids on Phyllonorycter leafminers
infesting apple in Massachusettes, U.S.A. Protection Ecology 5:303-317.
Wilkinson, T. K., D. A. Landis, and L. J. Gut. 2004. Parasitism of obliquebanded leafroller
(Lepidoptera: Tortricidae) in commercially managed Michigan apple orchards. Journal of
Economic Entomology 97:1524-1530.
Williams III, L., L. D. Price, and V. Manrique. 2003. Toxicity of field-weathered insecticide
residues to Anaphes iole (Hymenoptera: Mymaridae), and egg parasitoid of Lygus
lineolaris (Heteroptera: Miridae), and implications for inundative biological control in
cotton. Biological Control 26:217-223

Appendix – Table A1
41
TABLE A1. Parasitic Hymenoptera morphospecies and families identified from vacuum-sampling of apple tree canopies at six orchards in southeastern Michigan, USA, May-August 2009.
Number of wasps per orchard Family, morphospecies Org ABO Conv-d IPM-d IPM-i Conv TotalAphelinidae
Aphel_01 1 0 0 1 0 0 2Aphel_02 0 0 0 0 1 0 1Aphel_04 0 121 20 77 2 40 260Aphel_05 4 1 1 3 0 0 9Aphel_06 1 4 1 1 0 0 7Aphel_07 0 0 0 0 1 0 1
Braconidae Brac_01 1 0 0 0 0 1 2Brac_02 0 0 1 0 0 0 1Brac_03 0 0 0 3 0 0 3Brac_04 1 0 0 0 0 0 1Brac_05 0 0 0 0 3 0 3Brac_06 0 0 0 0 1 0 1Brac_07 0 2 0 0 0 0 2Brac_08 0 2 0 0 0 0 2Brac_09 0 1 0 0 0 0 1Brac_10 0 1 0 0 0 0 1Brac_11 0 1 0 0 0 1 2Brac_12 0 1 0 0 0 0 1Brac_13 0 1 0 0 0 0 1Brac_14 0 2 0 0 0 3 5Brac_15 0 0 0 1 0 0 1Brac_16 0 1 0 0 0 0 1Brac_17 0 0 0 0 1 0 1Brac_18 3 0 0 0 0 0 3Brac_19 1 0 0 0 0 0 1Brac_20 1 0 0 0 0 0 1Brac_21 0 0 0 0 1 0 1Brac_22 0 0 0 1 0 0 1Brac_23 0 0 0 0 1 0 1Brac_24 0 0 1 0 0 0 1Brac_25 0 0 1 0 0 0 1Brac_26 0 0 0 0 0 1 1Brac_27 0 0 0 0 0 1 1Brac_28 0 0 0 0 0 1 1Brac_29 0 0 1 0 0 0 1

Appendix – Table A1
42
Family, morphospecies Org ABO Conv-d IPM-d IPM-i Conv TotalBrac_30 5 0 0 0 0 0 5Brac_31 1 0 0 0 0 0 1
Ceraphronidae Cera_01 0 1 0 0 1 0 2Cera_02 0 0 0 0 1 1 2Cera_03 1 0 0 0 0 0 1Cera_04 1 2 1 1 0 1 6Cera_05 0 0 0 0 0 1 1
Chalcidoidea, unknown family ChalX_07 0 2 1 1 1 0 5ChalX_08 0 1 0 0 0 0 1
Diapriidae Dia_01 0 2 0 0 0 0 2Dia_02 0 0 0 0 1 0 1Dia_03 0 0 0 0 1 0 1Dia_04 0 0 0 0 1 0 1
Encyrtidae Encyr_01 0 0 0 1 0 0 1Encyr_02 0 1 0 0 1 0 2Encyr_03 0 0 0 1 0 0 1Encyr_04 1 0 1 1 1 0 4Encyr_05 0 0 1 0 0 0 1Encyr_06 0 0 0 0 1 0 1Encyr_07 0 0 0 0 1 0 1Encyr_08 1 0 0 0 0 0 1
Eucharitidae Euch_01 0 0 0 1 0 0 1
Eulophidae Eulop_01 1 4 0 0 0 0 5Eulop_02 2 0 0 1 0 1 4Eulop_04 2 0 0 0 0 0 2Eulop_05 13 0 0 0 0 0 13Eulop_06 3 0 0 0 0 0 3Eulop_07 3 0 0 1 1 0 5Eulop_08 5 0 0 0 0 88 93Eulop_09 55 0 0 0 0 0 55Eulop_10 6 0 2 0 0 0 8Eulop_11 1 0 0 0 0 0 1Eulop_12 0 0 0 0 2 0 2Eulop_13 15 0 0 0 0 0 15

Appendix – Table A1
43
Family, morphospecies Org ABO Conv-d IPM-d IPM-i Conv TotalEulop_16 0 1 1 0 0 0 2Eulop_17 0 1 3 0 1 0 5Eulop_18 0 0 0 0 0 1 1Eulop_19 5 0 0 0 0 19 24Eulop_20 1 0 0 0 0 0 1Eulop_21 1 0 0 0 0 1 2Eulop_22 2 0 0 0 1 0 3Eulop_23 1 0 0 0 0 0 1Eulop_24 1 0 0 0 0 0 1Eulop_25 1 0 0 0 0 0 1Eulop_26 1 0 0 0 0 0 1Eulop_27 0 0 0 1 0 0 1Eulop_28 0 0 0 1 1 0 2Eulop_29 0 0 0 0 0 1 1Eulop_30 0 0 0 0 0 1 1Eulop_31 0 0 0 0 0 1 1Eulop_32 0 0 1 0 0 0 1Eulop_33 0 0 1 0 0 0 1Eulop_34 0 1 0 0 0 0 1Eulop_35 0 2 0 0 0 0 2Eulop_36 1 0 0 0 0 0 1Eulop_37 1 0 0 0 0 0 1Eulop_38 1 0 0 0 0 0 1
Eurytomidae Eury_01 0 0 1 0 0 0 1Eury_02 0 0 2 0 0 0 2
Figitidae Fig_01 0 1 1 1 0 0 3Fig_02 1 0 1 1 1 0 4Fig_03 2 2 0 1 0 2 7Fig_04 0 1 0 0 0 0 1
Ichneumonidae Ich_01 0 0 0 0 1 0 1Ich_02 1 1 0 0 0 3 5Ich_03 0 0 0 1 0 0 1Ich_04 1 0 0 0 1 1 3Ich_05 1 0 0 0 0 0 1Ich_06 0 0 0 0 1 0 1Ich_07 0 0 0 0 1 0 1Ich_08 0 0 0 0 1 1 2Ich_09 0 1 0 0 0 0 1

Appendix – Table A1
44
Family, morphospecies Org ABO Conv-d IPM-d IPM-i Conv TotalIch_10 0 1 0 0 0 0 1Ich_11 1 0 0 0 0 0 1
Megaspilidae Meg_01 0 0 0 1 0 0 1Meg_02 0 2 0 0 0 0 2
Mymaridae Mym_01 0 1 1 0 0 0 2Mym_02 0 1 0 0 0 0 1Mym_03 0 0 2 0 0 0 2Mym_04 3 0 0 1 0 0 4Mym_05 1 0 0 0 0 0 1Mym_06 1 0 0 0 0 0 1Mym_07 1 0 0 0 0 0 1Mym_08 0 0 0 0 0 1 1Mym_09 0 0 0 0 0 1 1Mym_10 0 0 0 0 0 1 1Mym_11 0 0 1 0 0 0 1Mym_12 0 1 0 0 0 0 1
Platygastridae Plat_01 1 1 2 1 0 0 5Plat_02 1 5 6 3 1 0 16Plat_03 0 2 1 1 0 0 4Plat_05 0 0 0 1 0 1 2Plat_06 2 0 0 0 0 0 2Plat_07 0 1 0 0 0 0 1Plat_09 0 4 2 0 0 2 8Plat_10 0 1 1 0 0 0 2Plat_11 0 1 3 1 0 0 5Plat_12 1 1 2 0 0 1 5Plat_13 0 0 1 1 0 2 4Plat_14 1 0 0 3 0 0 4Plat_15 1 0 0 0 0 0 1Plat_16 1 0 0 0 0 0 1Plat_17 1 0 0 0 0 0 1Plat_18 0 0 0 0 1 1 2Plat_19 0 0 1 1 0 0 2Plat_20 0 0 0 1 0 0 1Plat_21 0 0 0 0 1 0 1Plat_22 0 0 0 0 0 1 1Plat_23 0 0 0 0 0 1 1Plat_24 0 1 0 0 0 0 1

Appendix – Table A1
45
Family, morphospecies Org ABO Conv-d IPM-d IPM-i Conv TotalPlat_25 1 0 0 0 0 0 1
Pteromalidae Ptero_01 0 2 0 0 0 0 2Ptero_02 0 0 1 1 1 0 3Ptero_03 1 0 0 0 0 0 1Ptero_04 3 0 0 0 0 0 3Ptero_05 1 0 1 1 0 0 3Ptero_06 10 0 0 0 0 0 10Ptero_07 4 0 0 0 0 0 4Ptero_08 1 0 0 0 0 0 1Ptero_10 1 0 0 0 0 0 1Ptero_11 2 0 0 0 0 2 4Ptero_12 1 0 0 0 0 0 1Ptero_14 0 10 0 0 0 0 10Ptero_16 0 1 0 0 0 0 1Ptero_17 2 0 0 0 0 0 2Ptero_18 1 0 0 0 0 0 1Ptero_19 1 0 0 0 0 0 1Ptero_20 2 0 0 0 0 0 2Ptero_21 0 0 0 0 0 1 1Ptero_22 0 0 0 0 0 1 1Ptero_23 2 0 0 0 0 0 2Ptero_24 1 0 0 0 0 0 1
Sierolomorphidae Sierolomorpha canadensis
1 0 0 0 0 0 1
Torymidae Tory_01 0 0 1 0 0 0 1
Individuals, identified 202 198 69 118 37 187 811
Unidentifiable (used for abundance only) May samples 28 3 7 19 1 16 74ChalX (Jun-Aug) 0 1 2 2 0 2 7
Total individuals 230 202 78 139 38 205 892Total species 71 45 35 34 33 35 169Total families 11 13 11 12 10 8 16

Appendix – Table A2
46
TABLE A2. Post-hoc pairwise comparisons from repeated measures ANOVA comparing mean wasp abundance across orchards within each month (month x orchard). Abundance was natural log transformed. A Bonferroni correction for multiple comparisons was used within each month. Significant differences are indicated by an asterisk.
Month (I)
Orchard (J)
Orchard
Mean Difference
(I-J)Std.
Error df p
95% Confidence Interval for Difference
Lower Bound Upper BoundMay Org ABO .979* .237 216 .001* .276 1.683 IPM-d .183 .237 216 1.000 -.521 .886 IPM-i 1.089* .237 216 >.001* .386 1.793 Conv-d .760* .237 216 .023* .056 1.463 Conv .413 .237 216 1.000 -.291 1.117 ABO Org -.979* .237 216 .001* -1.683 -.276 IPM-d -.797* .237 216 .014* -1.500 -.093 IPM-i .110 .237 216 1.000 -.594 .814 Conv-d -.220 .237 216 1.000 -.923 .484 Conv -.566 .237 216 .266 -1.270 .137 IPM-d Org -.183 .237 216 1.000 -.886 .521 ABO .797* .237 216 .014* .093 1.500 IPM-i .906* .237 216 .003* .203 1.610 Conv-d .577 .237 216 .237 -.127 1.280 Conv .230 .237 216 1.000 -.473 .934 IPM-i Org -1.089* .237 216 >.001* -1.793 -.386 ABO -.110 .237 216 1.000 -.814 .594 IPM-d -.906* .237 216 .003* -1.610 -.203 Conv-d -.330 .237 216 1.000 -1.033 .374 Conv -.676 .237 216 .071 -1.380 .027 Conv-d Org -.760* .237 216 .023* -1.463 -.056 ABO .220 .237 216 1.000 -.484 .923 IPM-d -.577 .237 216 .237 -1.280 .127 IPM-i .330 .237 216 1.000 -.374 1.033 Conv -.347 .237 216 1.000 -1.050 .357 Conv Org -.413 .237 216 1.000 -1.117 .291 ABO .566 .237 216 .266 -.137 1.270 IPM-d -.230 .237 216 1.000 -.934 .473 IPM-i .676 .237 216 .071 -.027 1.380 Conv-d .347 .237 216 1.000 -.357 1.050June Org ABO .639 .237 216 .114 -.065 1.342

Appendix – Table A2
47
Month (I)
Orchard (J)
Orchard
Mean Difference
(I-J)Std.
Error df p
95% Confidence Interval for Difference
Lower Bound Upper Bound June Org IPM-d 1.091* .237 216 >.001* .387 1.795
IPM-i 1.531* .237 216 >.001* .827 2.234 Conv-d 1.388* .237 216 >.001* .684 2.091 Conv 1.958* .237 216 >.001* 1.255 2.662 ABO Org -.639 .237 216 .114 -1.342 .065 IPM-d .452 .237 216 .865 -.251 1.156 IPM-i .892* .237 216 .003* .188 1.595 Conv-d .749* .237 216 .027* .045 1.453 Conv 1.319* .237 216 >.001* .616 2.023 IPM-d Org -1.091* .237 216 >.001* -1.795 -.387 ABO -.452 .237 216 .865 -1.156 .251 IPM-i .439 .237 216 .977 -.264 1.143 Conv-d .297 .237 216 1.000 -.407 1.000 Conv .867* .237 216 .005* .163 1.571 IPM-i Org -1.531* .237 216 >.001* -2.234 -.827 ABO -.892* .237 216 .003* -1.595 -.188 IPM-d -.439 .237 216 .977 -1.143 .264 Conv-d -.143 .237 216 1.000 -.846 .561 Conv .428 .237 216 1.000 -.276 1.131 Conv-d Org -1.388* .237 216 >.001* -2.091 -.684 ABO -.749* .237 216 .027* -1.453 -.045 IPM-d -.297 .237 216 1.000 -1.000 .407 IPM-i .143 .237 216 1.000 -.561 .846 Conv .570 .237 216 .255 -.133 1.274 Conv Org -1.958* .237 216 >.001* -2.662 -1.255 ABO -1.319* .237 216 >.001* -2.023 -.616 IPM-d -.867* .237 216 .005* -1.571 -.163 IPM-i -.428 .237 216 1.000 -1.131 .276 Conv-d -.570 .237 216 .255 -1.274 .133July Org ABO .423 .237 216 1.000 -.281 1.127 IPM-d .474 .237 216 .700 -.229 1.178 IPM-i 1.457* .237 216 >.001* .753 2.160 Conv-d 1.544* .237 216 >.001* .841 2.248 Conv 1.526* .237 216 >.001* .822 2.230 ABO Org -.423 .237 216 1.000 -1.127 .281 IPM-d .051 .237 216 1.000 -.652 .755

Appendix – Table A2
48
Month (I)
Orchard (J)
Orchard
Mean Difference
(I-J)Std.
Error df p
95% Confidence Interval for Difference
Lower Bound Upper BoundJuly ABO IPM-i 1.034* .237 216 >.001* .330 1.737
Conv-d 1.121* .237 216 >.001* .418 1.825 Conv 1.103* .237 216 >.001* .399 1.807
IPM-d Org -.474 .237 216 .700 -1.178 .229 ABO -.051 .237 216 1.000 -.755 .652 IPM-i .982* .237 216 .001* .279 1.686 Conv-d 1.070* .237 216 >.001* .366 1.774 Conv 1.052* .237 216 >.001* .348 1.755 IPM-i Org -1.457* .237 216 >.001* -2.160 -.753 ABO -1.034* .237 216 >.001* -1.737 -.330 IPM-d -.982* .237 216 .001* -1.686 -.279 Conv-d .088 .237 216 1.000 -.616 .791 Conv .069 .237 216 1.000 -.634 .773 Conv-d Org -1.544* .237 216 >.001* -2.248 -.841 ABO -1.121* .237 216 >.001* -1.825 -.418 IPM-d -1.070* .237 216 >.001* -1.774 -.366 IPM-i -.088 .237 216 1.000 -.791 .616 Conv -.018 .237 216 1.000 -.722 .685 Conv Org -1.526* .237 216 >.001* -2.230 -.822 ABO -1.103* .237 216 >.001* -1.807 -.399 IPM-d -1.052* .237 216 >.001* -1.755 -.348 IPM-i -.069 .237 216 1.000 -.773 .634 Conv-d .018 .237 216 1.000 -.685 .722Aug Org ABO -.704* .237 216 .050 -1.408 -.001 IPM-d -.024 .237 216 1.000 -.727 .680 IPM-i .878* .237 216 .004* .174 1.581 Conv-d .113 .237 216 1.000 -.591 .817 Conv -1.240* .237 216 >.001* -1.944 -.536 ABO Org .704* .237 216 .050 .001 1.408 IPM-d .681 .237 216 .068 -.023 1.384 IPM-i 1.582* .237 216 >.001* .878 2.286 Conv-d .817* .237 216 .010* .114 1.521 Conv -.536 .237 216 .372 -1.240 .168 IPM-d Org .024 .237 216 1.000 -.680 .727 ABO -.681 .237 216 .068 -1.384 .023

Appendix – Table A2
49
Month (I)
Orchard (J)
Orchard
Mean Difference
(I-J)Std.
Error df p
95% Confidence Interval for Difference
Lower Bound Upper Bound Aug IPM-d IPM-i .901* .237 216 .003* .198 1.605
Conv-d .137 .237 216 1.000 -.567 .840 Conv -1.216* .237 216 >.001* -1.920 -.513 IPM-i Org -.878* .237 216 .004* -1.581 -.174 ABO -1.582* .237 216 >.001* -2.286 -.878 IPM-d -.901* .237 216 .003* -1.605 -.198 Conv-d -.765* .237 216 .022 -1.468 -.061 Conv -2.118* .237 216 .000 -2.821 -1.414 Conv-d Org -.113 .237 216 1.000 -.817 .591 ABO -.817* .237 216 .010 -1.521 -.114 IPM-d -.137 .237 216 1.000 -.840 .567 IPM-i .765* .237 216 .022 .061 1.468 Conv -1.353* .237 216 .000 -2.057 -.650 Conv Org 1.240* .237 216 .000 .536 1.944 ABO .536 .237 216 .372 -.168 1.240 IPM-d 1.216* .237 216 .000 .513 1.920 IPM-i 2.118* .237 216 .000 1.414 2.821 Conv-d 1.353* .237 216 .000 .650 2.057

Appendix – Fig. A1
50
http://www.touristguide.com/maps/michigan-map.jpg
Org
ABO
Conv‐d
Conv
IPM‐dIPM‐i
http://maps.google.com/maps/ms?ie=UTF8&hl=en&msa=0&msid=100031109582419974394.000467ca70d73ad592777&z=9
FIG. A1. Map of six study orchards in southeastern Michigan, USA.