Doc
tora
l the
sis
ISBN 978-82-326-1516-2 (printed ver.)ISBN 978-82-326-1517-9 (electronic ver.)
ISSN 1503-8181
Doctoral theses at NTNU, 2016:89
Øystein Døhl
User need and resource allocation in public long-term care. The use of disability and impairment instruments
Application on a large Norwegian municipality
NTNU
N
orw
egia
n U
nive
rsity
of
Scie
nce
and
Tech
nolo
gyTh
esis
for
the
degr
ee o
f P
hilo
soph
iae
Doc
tor
Facu
lty
of M
edic
ine
Dep
artm
ent o
f Pub
lic H
ealt
h an
d G
ener
al P
ract
ice
Øystein D
øhlD
octoral theses at NTN
U, 2016:89

User need and resource allocation in public long-term care. The use of disability and impairment instruments
Application on a large Norwegian municipality
Thesis for the degree of Philosophiae Doctor
Trondheim, April 2016
Norwegian University of Science and TechnologyFaculty of MedicineDepartment of Public Health and General Practice
Øystein Døhl

NTNUNorwegian University of Science and Technology
Thesis for the degree of Philosophiae Doctor
Faculty of Medicine
Department of Public Health and General Practice
© Øystein Døhl
ISBN 978-82-326-1516-2 (printed ver.)ISBN 978-82-326-1517-9 (electronic ver.)ISSN 1503-8181
Doctoral theses at NTNU, 2016:89
Printed by NTNU Grafisk senter

1
Table of content
Oppsummering (Norwegian summary) .................................................... 3
Summary ...................................................................................................... 5
Acknowledgements ...................................................................................... 7
List of papers ............................................................................................... 8
Abbreviations ............................................................................................... 9
1 Background ...................................................................................... 11
2 The need for long-term care ........................................................... 12
2.1 Disability and impairment ......................................................................... 12
2.2 A framework for assessing need ............................................................... 13
2.3 The use of disability and impairment instruments .................................... 14
2.3.1 Choosing variables to assess need............................................................. 14
2.3.2 Scoring...................................................................................................... 16
2.3.3 Dimensionality.......................................................................................... 17
3 Explanatory factors for the use of long-term care ....................... 18
3.1 Care for elderly .......................................................................................... 18
3.1.1 Use of home care....................................................................................... 19
3.1.2 Use of nursing homes................................................................................ 20
3.2 Care for intellectually disabled individuals ............................................... 21
3.3 Supply of long-term care ........................................................................... 21
4 Aims of the study ............................................................................. 22
5 Study setting .................................................................................... 23
5.1 Long-term care in Norway ........................................................................ 23
5.2 The municipality of Trondheim ................................................................ 24
6 Materials and Methods ................................................................... 25
6.1 Disability instruments ............................................................................... 25
6.1.1 IPLOS compared with other commonly used instruments....................... 26
6.1.2 Validity and reliability tests of IPLOS..................................................... 28
6.2 Other variables .......................................................................................... 30
6.3 Statistical methods ..................................................................................... 31
6.3.1 Factor analysis.......................................................................................... 31
6.3.2 Multilevel analysis.................................................................................... 33

2
6.3.3 Multivariate regression analysis............................................................... 33
6.3.4 Item Response Theory – IRT.................................................................... 34
6.4 Ethical considerations ............................................................................... 34
7 Summary and results ...................................................................... 35
7.1 Paper 1: ...................................................................................................... 35
7.2 Paper 2: ...................................................................................................... 35
7.3 Paper 3: ...................................................................................................... 36
8 Discussion ......................................................................................... 36
8.1 Description and measures of need of long-term care among the elderly .. 36
8.1.1 How to describe need at the individual and group levels.......................... 36
8.1.2 The relationship between need and amount of care.................................. 38
8.2 Description and measures of need of long-term care among intellectually disabled persons .................................................................................................. 43
9 Implications and further research ................................................. 44
9.1 Implications for the score system .............................................................. 44
9.1.1 New variables related to “information gap”.............................................. 45
9.2 Implications for planning .......................................................................... 45
9.2.1 Practical use in the planning and financing of long-term care.................. 45
9.3 Further research ......................................................................................... 47
10 References ........................................................................................ 48
Appendix - Variable list ............................................................................ 58
PAPERS I-III ............................................................................................. 60

3
Oppsummering (Norwegian summary)
Europeiske land står overfor store demografiske endringer. Antall eldre over 80 år vil
dobles i løpet av de neste 25 årene og sterkest vil veksten bli etter 2020. Samfunnets
ressursinnsats til eldre med hjelpebehov kommer til å øke kraftig. Vi vet videre at
funksjonsnivå er den viktigste predikatoren for eldre sitt hjelpebehov. Hovedmålet med
denne studien var å undersøke sammenhengen mellom individuelle variasjoner i
funksjonsnivå og offentlig ressursinnsats. Både for de som mottar heldøgns tjenester
som for eksempel sykehjemstjenester, og hjemmeboende som mottar punkthjelp.
I 2006 ble det innført et nasjonalt system i Norge (IPLOS) som innehar en
funksjonsevaluering. Instrumentet brukes i alle norske kommuner og for alle personer
som mottar offentlige pleie og omsorgstjenester. I denne studien har vi brukt de
funksjonsvariablene som brukes i IPLOS. Studien har sett på mottakere av tjenester i
Trondheim kommune.
Funnene fra studie 3 viser at det norske instrumentet har problemer med å predikere
forskjeller i hjelpebehov hos de friskeste eldre. Det må hele tiden gjøres avveininger
mellom ideell utforming og administrativ ressursbruk. Og de fleste instrumenter har
problemer med å predikere hjelpebehov langs deler av kontinuumet fra helt frisk til fult
hjelpebehov. Likevel er vurderingen at det norske systemet burde hatt flere variabler
som kunne bidratt til en bedre predikering av hjelpebehov hos de friskeste eldre.
I studie 1 fant vi at forskjeller i mengde hjelp den enkelte pasient mottar på sykehjem
kan forklares både ut fra individuelle forskjeller i funksjonsnivå og forskjeller mellom
sykehjem. Totalt kan ¼ av individuelle forskjeller forklares med ulik praksis mellom
sykehjemmene. Videre fant vi at i en situasjon hvor alle pasienter budsjetteres med
samme beløp så vil hjelpen den enkelte pasient mottar ikke bare avhenge av den enkelte
pasients funksjonsnivå, men også funksjonsnivå til alle andre pasienter på samme
sykehjem. Det vil si; bor du sammen med friskere pasienter så mottar du mer hjelp enn
dersom du bor sammen med sykere pasienter, gitt at du har samme funksjonsnivå i
begge tilfeller.

4
I studie 2 fant vi at offentlig ressursbruk til hjemmeboende eldre i stor grad kan
forklares med funksjonsnivå. Her ser IPLOS ut til å kunne forklare ressursbruk på lik
linje med andre brukte instrumenter. Videre fant vi at de med mer komplekse
sykdomsbilder (målt med comorbiditet) mottar 21 prosent mer offentlig hjelp enn andre.
Aleneboende eldre mottar mer offentlig hjelp enn de som bor sammen med noen.
Kvinner med samboere mottar omtrent 30 prosent mindre hjelp enn aleneboende, mens
menn med samboere mottar omtrent 50 prosent mindre hjelp enn aleneboende. Videre
fant vi at for personer med psykisk utviklingshemming er adferd den viktigste
predikatoren for offentlig ressursbruk, men hjelp til dagligdagse aktiviteter er også
viktig for denne gruppen. Hjelp fra pårørende eller andre bistandspersoner kommer i
tillegg til og ikke som erstatning for offentlig hjelp. Pårørende sin innsats slår dermed
ulikt ut i offentlig ressursbruk for eldre hjemmeboende enn for psykisk
utviklingshemmede.
Resultatene fra denne studien kan brukes i planlegging av tjenester til eldre og psykisk
utviklingshemmede personer. Trondheim kommune har etter denne studien endret sine
budsjetteringssystemer på sykehjem og for hjemmeboende eldre, og er i gang med å
endre sine budsjetteringssystemer for psykisk utviklingshemmede.

5
Summary
In the coming decades, the European countries will witness great demographic changes.
Within the next 25 years, the number of people aged 80 years or older will double. The
elderly’s overall use of resources will increase considerably. Disability is the most
important cause of the amount of care needed. The overall aim of this thesis is to assess
the relationship between factors describing disability and impairment and the use of
long-term care services both in a nursing home setting and at home.
Since 2006, all Norwegian municipalities have been required to assess user needs using
a standardised national registration system (IPLOS) that contains variables describing
physical disability and cognitive impairment. This is the only instrument used across all
Norwegian municipalities. Here, we utilised the same variables as those used in the
national registration system and combined them with detailed time studies with
recipients in the municipality of Trondheim.
Our findings from study 3 show that the Norwegian instrument had difficulties in
differentiating the need of the least disabled elderly individuals. However, this is a well-
known problem of disability instruments due to the trade-off between administrative
burden and an “ideal” instrument. Introducing new variables to close these gaps should
be considered.
In study 1, we found that the amount of individual care received depends on both
individual disability and differences between nursing homes. Approximately ¼ of
individual differences could be explained by differences between nursing homes.
Furthermore, we found that within a financial reimbursement model with no adjustment
for case-mix, the amount of care that patients receive depends not only on the patients’
own needs but also on the needs of all the other residents. Thus, if one lives with less
disabled patients, one receives more care than an individual who lives with more
heavily disabled patients.

6
In study 2, we found that home-dwelling elderly’s public use of care could largely be
explained by disability and cognitive impairment. IPLOS seems to explain use of public
care to the same extent as other indices. Those with comorbidity received 21 percent
more public care than others. Those living alone received more public care than those
living with others. Cohabiting women received approximately 30 percent less care than
those living alone, while cohabiting men received approximately 50 percent less care.
Furthermore, we found that behaviour is the most important predictor of the amount of
public care for intellectually disabled persons but that help in performing everyday
activities is also important for these persons, as it is for elderly individuals. Care from
relatives or other private care is complementary and does not affect the amount of
public care. Thus care from relatives or others act as a substitute for public care for
home-dwelling elderly while it is complementary to public care for intellectually
disabled persons.
The results from this study could be used in overall administrative planning of public
long-term care. The municipality of Trondheim has changed its reimbursement model
for nursing homes and home-dwelling elderly since these results were found.
Furthermore, the municipality is now changing its reimbursement system for
intellectually disabled persons according to the results of this study.
7
Acknowledgements
The project was conducted with grants from The Norwegian Association of Local and
Regional Authorities (KS), County Governor of Sør-Trøndelag and the municipality of
Trondheim. I am grateful for the support from my three supervisors and co-authors. Jon
Magnussen was the principle supervisor, and he introduced me to the field of academic
evaluation. Thank you for given me optimal scientific support from the start and until
the very end of this thesis, and for telling me that there is a light at the end of the tunnel.
Without your guidance throughout the project, this thesis would not have been
completed. Thank to Helge Garåsen chief executive officer in the municipality of
Trondheim and supervisor for this thesis, for giving me generous opportunities to do
research within the care services in the municipalities of Trondheim. It has been a
pleasure working with you for all these years. Thank to Jorid Kalseth my third
supervisor for this thesis. Your scientific support has been a major importance for me
and my thesis. I would also like to thank Tor Åm and Snorre Glørstad, former chief
executive officer and chief municipal executive in the municipality of Trondheim.
Without your initial support there would not have been any thesis at all. I owe a great
thank to the municipality of Trondheim and all my colleagues. I am proud and grateful
to work within an organization where knowledge has such appreciation. I would
especially like to thank Karin Storholt, Liv Terese Nilssen, Kari Borten Moe, Karl
Sigmund Hagen, Linda Blekkan and Trine Hansen for practically support during these
years. I would also thank Marit Ringseth Berg for interesting and personal valuable
discussions during all our common projects over these years.
Finally I would like to thank my family and friends who have supported me. Especially
my loving wife Anita and my wonderful children Jenny, Ida and Hanne for having such
patience with me through all these years. More than anyone else my wife Anita has
contributed to this thesis by cheering me forward.
In the loving memory of my father.
Melhus, December 2015, Øystein Døhl

8
List of papers
This thesis is based on the following three publications:
I: Døhl Ø, Garåsen H, Kalseth J, Magnussen J: Variations in levels of care between
nursing home patients in a public health care system. BMC Health Services Research
(2014), 14(1):108.
II: Døhl Ø, Garåsen H, Kalseth J, Magnussen J: Factors associated with the amount of
public home care received by elderly and intellectually disabled individuals in a large
Norwegian municipality. Health & Social Care in the Community (2015).
doi/10.1111/hsc.12209
III: Døhl Ø, Garåsen H, Kalseth J, Magnussen J: Physical disability and cognitive
impairment among recipients of long-term care. A cross-sectional study in a large
Norwegian municipality. Journal of Nursing Education and Practice (2016), 6(7).

9
Abbreviations
ADL Activities of Daily Living
AM-PAC Activity Measure for Post Acute Care
CFA Confirmatory factor analysis
EFA Exploratory Factor Analysis
FIM Functional Independence Measure
GDP Gross Domestic Product
IADL Instrumental Activities of Daily Living
ICC Intraclass Correlation Coefficient
ICC Item Characteristic Curve
ICF International classification of functioning, disability and health
ICPC International Classification of Primary Care
IRA Inter-rater agreement
IRR Inter-rater reliability
LTC Long Term Care
LTCE Long Term Care Expenditure
MDS Minimum Data Set
OECD Organization for Economic Co-operation and Development
OLS Ordinary Least Square
PAF Principal Axis Factoring
PCA Principal Component Analysis
RAI Resident Assessment Instrument
RUG Resource Utilization Groups

10
SEM Structural Equation Modelling
SMAF Système de Mesure de l’Autonomie Fonctionnelle (French). The
functional autonomy measurement system.
WHO World Health Organization

11
1 Background
Across OECD countries, public long-term care expenditure (LTCE) varies between 0.1
and 3.7 percent of GDP and, on average, constitutes approximately 1.6 percent. In
Norway, LTCE in 2011 was 2.4 percent of GDP, with only the Netherlands and Sweden
spending a higher proportion of GDP on long-term care (LTC) [1]. Approximately 50
percent of long-term care recipients are 80 years or older [2]. Across the European
countries, the number of people aged 80 years or older is expected to double within the
next 25 years [3, 4]; thus, it is expected that the costs of health and long-term care will
increase sharply within the OECD countries [5].
Table 1 Long-term care expenditure as share of GDP
Source: OECD Health at a Glance 2013 [1]
In Norway, nearly 3.9 percent of the population receive long-term care; the average rate
within the OECD is 2.3 percent [2]. The majority of the elderly want to live at home as
long as possible and, when needed, receive long-term care in their homes [6]. Home
care is generally considered as less expensive than nursing home care [7]; thus, the use
of home care is viewed as important for reducing the total LTCE. In the past decade, the
proportion of recipients receiving long-term care at home has increased; in 2011, within
12
the OECD, nearly 64 percent of all long-term care recipients received their care at home
[1]. In Japan and Norway, more than 75 percent of those in need of long-term care
receive it at home [1, 8]. Although the majority of recipients receive long-term care in
their homes, LTCEs for institutions are higher than those for home care in most OECD
countries [2].
Although the elderly is the largest group of LTC recipients, in the Scandinavian
countries, those below 65 years of age constitute approximately 21-32 percent of the
long-term care recipients [2]. During the past two decades, in Norway, the number of
recipients below 67 years old has increased at a higher rate than those above 67 years
[9]. Recipients below 67 years old account for approximately 40 percent of the LTCE,
and persons with intellectual disabilities constitute nearly 50 percent of LTCE for those
below 67 years [9, 10].
2 The need for long-term care
One of the main drivers of population ageing is lower mortality rates. In Norway, the
life expectancy is anticipated to increase by three to four years by 2040 [11]. There is no
controversy that an ageing population implies increased use of long-term care.
However, the cost of the ageing population is not necessarily due to age; rather, it
concerns the need for care following the ageing process. It has been argued that time to
death, not age, is the driver of long-term care use [12]. More recent studies have shown
that time to death is a substitute for underlying causes such as disability [12-14].
2.1 Disability and impairment Two terms commonly used to describe individuals in need of long-term care are
“impairment” and “disability”. Impairment can be defined as loss in physiological or
psychological structure or function at the organ level resulting from a disease [15].
Disability is defined as “any restriction or lack of ability to perform an activity in the

13
manner or within the range considered normal for a human being” [15, 16]. Disability
is, therefore, related to the ability to perform an activity, while impairment can be
viewed as the cause of disability. Impairment does not necessarily imply disability, but
disability results from impairment. Disability is often considered in relation to physical
factors, i.e., limited physical ability to perform tasks, and is often used to describe
decrepitude. Intellectual disability, by contrast, is related to reduced cognitive ability to
understand new or complex situations and reduced ability to learn and apply new skills
[17]. Hereafter, I will use the term disability instead of physical disability for limitations
due to physical factors.
2.2 A framework for assessing need The consequences that disability has on the need for services depend on both the
individual’s degree of disability and the social environment. Thus, there are several
social and economic modifiers that should be taken into account when assessing an
individual’s need for care.
There are a number of conceptual models used to describe need for care. Three
commonly used models are described here. Two models focusing on the social
implications of disability are Nagi’s disablement model [18] and the International
Classification of Functioning, Disability and Health ICF [19]. Both models describe
functioning at three levels: separate parts of the body, the whole person and the person
within a specific community setting [20]. A central issue for both Nagi’s and the ICF
model is that disability is largely dependent on the social and/or the environmental
context. Another largely used conceptual model is the Andersen behavioural model [21,
22]. The explanatory factors for care utilisation are decomposed into Predisposing
factors, i.e., age, gender, marital status, education etc.; Enabling factors, i.e., financial
and organisational factors such as price and access; and Need factors, i.e., disability,
diagnosis etc. The papers in this thesis are based on the framework of Andersen &
Newman [21], also commonly referred to as the Andersen-Newman model. This

14
framework is well suited to discuss individual determinants and determinants at a more
aggregated level.
2.3 The use of disability and impairment instruments One of the most frequently used methods of assessing disability is through variables
describing the ability to perform activities of daily living (ADL) and instrumental
activities of daily living (IADL). ADLs characterise basic everyday tasks, while IADLs
characterise basic abilities for independent living.
2.3.1 Choosing variables to assess need
The idea that diagnosis does not sufficiently describe the needs of the elderly and
chronically ill emerged in the 1950s [23]. Thus, more detailed information was needed,
and Katz’s [24] and Barthel’s [25] instruments described functional dependences and
need for help using everyday activities such as bathing, dressing, going to the toilet,
transferring, continence and feeding [24, 25]. These two instruments are still commonly
used in the characterisation of the elderly’s basic needs. In a clinical setting, Katz’s
instrument has been criticised for assessing too few activities and Barthel’s has been
criticised for having an overly narrow rating, as it only contains two scores (help/no
help) [26]. There is no agreement on how many variables are needed to give a
sufficiently detailed description of needs. Roherig [27] found that four out of ten
variables in the Barthel instrument identified 95.3 percent of patients with limitations in
ADL variables. Katz argued that in addition to the variables in the original ADL
instrument, mobility should also be viewed as a basic requirement for self-maintenance
[28, 29]. In Barthel’s instrument, mobility is explicitly included as separate variables
[25].
An ADL instrument includes the most fundamental activities, but it is still not sufficient
for assessing the possibility of independent living. Lawton [30] introduced a broader
description of disability by using IADL variables. The variables in the IADL instrument
15
describe one’s capability for independent living and includes variables such as
shopping, using the telephone, cooking, housekeeping, laundry, transportation,
responsibility for own medications and ability to handle money [30]. Today, there exist
many different disability instruments, and most of them are adjustments of the basic
ideas of Katz, Barthel and/or Lawton [31, 32].
The Katz, Barthel and Lawton instruments do not include variables describing cognitive
impairment. There are several instruments for measuring cognitive impairment in use,
i.e., the Mini-Mental State Examination (MMSE) [33, 34] and the Cognitive
Performance Scale (CPS) [35]. The MMSE is frequently used to evaluate how cognitive
impairment impacts the use of resources [36-38]. It has been shown to perform well in
classifying cognitive impairment compared to more detailed cognitive surveys [39]. The
CPS is based on the Minimum Data Set (MDS) used in the US and is a shorter
evaluation of cognitive impairment than the MMSE [35, 40]. The CPS was designed to
assess cognitive impairment among long-term care recipients. The CPS has been shown
to reveal cognitive impairment equally well as the MMSE [35]. It has been used both in
home care and nursing home settings [41, 42].
Some instruments combine disability and cognitive impairment, such as the Resident
Assessment Instrument (RAI), the Functional Independence Measure (FIM) and the
Activity Measure for Post Acute Care (AM-PAC). The RAI is based on the MDS, and
there is a version for long-term care both in nursing homes and at home [40, 42-44].
The RAI is also a basis for the reimbursement system RUG [45-49]. The FIM could be
considered an expanded Barthel instrument with the addition of five variables that
measure cognitive impairment. As is the case for the Barthel instrument, the FIM lacks
IADL variables [50]. The FIM is widely used in rehabilitation settings and is considered
as more appropriate than the measurements of Katz and Barthel in terms of the
rehabilitation of elderly people [51]. The AM-PAC is based on the WHO’s ICF [19]; it
is mainly used in post-acute care settings [52]. The AM-PAC constitutes 41 variables
covering ADL, mobility and cognitive impairment but only two IADL variables. In this

16
measure, the IADL variable “using phone” is defined as a cognitive variable. The AM-
PAC has a short form with 30 variables. The variables in the two versions are not
exactly the same; the short form has several IADL variables [53].
There will always be a trade-off between the desired degree of detail and the practicality
of the use of an instrument to measure disability. Instruments that have fewer variables
should raise more concerned about potential gaps in the information provided by the
instrument. There could be aspects of disability that will not be detected. If one focuses
only on basic domains measured with ADL variables, one would not been able to detect
differences between the less disabled persons. However, if one focuses only on IADL
variables, one could experience difficulties in detecting differences between the most
disabled individuals. More generally, one should be aware of the information gaps of
instruments before using them [31].
2.3.2 Scoring
There are several ways to score the variables included in an instrument. All disability
instruments make some distinction between need for help (or receiving help) and no
need for help. The least detailed classification is the dichotomous need/no need for help,
which is used in the Barthel instrument for all variables except one [25]. Katz’s measure
uses a three-point scale [24], Lawton’s instrument uses either a three- or five-point scale
[30], and the FIM has one of the most detailed scores, using a seven-point scale. An
instrument’s potential to describe need also depends on how well the variables cover the
full spectrum of needs [31].
Capability to perform or actual performance of a task
When describing disability, a distinction should be made between an individual’s
capability to perform tasks and whether she/he is actually performing the tasks. Some
instruments describe what the individual actually does [24], while others describe the
17
individual´s ability to manage the tasks [30, 54]. The first approach could produce a
higher disability score than the latter approach. This problem is more relevant for IADL
variables than ADL variables [55]. This is due to the fact that some individuals do not
perform IADL activities regularly even though they are able to do so.
Another distinction is between whether the instrument is based on observed functioning
or self-evaluated functioning. Observed functioning is typically done by professional
care personnel. Using observed or self-evaluated ability could affect the score, and the
resulting scores may not be comparable. Findings indicate that an observed score could
imply higher measured disability than a self-evaluated score [56, 57].
2.3.3 Dimensionality
A detailed description of disability is useful for assessment and planning at an
individual level. For planning and analyses on an aggregated level, however, a more
aggregated description of user needs will often be more helpful. There are basically two
methods of aggregation in use. One method is summing all scores on all variables,
which in regression analysis, is equal to an average score [25, 58, 59]. Another method
is summing the scores on the variables for which persons require need help [24, 30, 60,
61]. The aggregation of variables into one or more indices could ease the interpretation
of complex relationships. However, variables that measure different aspects could
mislead policy messages if they are poorly combined [62]. Both Katz and Lawton
noted that the variables in their ADL and IADL instruments had a hierarchic
classification, but they did not address the question of whether the variables represent
one unique dimension with increasing complexity or should be combined into different
dimensions of disability. ADL and IADL are often used separately, and it has been
argued that they represent two or even several unique dimensions [63]. Spector [64]
argued that ADL and IADL variables could be considered as one dimension due to the
high correlation between them. Others have noted that the number of dimensions could
be related to other factors such as gender [65], severity [66, 67] or different type of
diseases [68, 69]. Thomas [63] found that ADL/IADL variables constituted three

18
dimensions, one ADL and two IADL, and argued that one of the IADL dimensions
constituted variables with higher cognitive complexity. Then, the number of dimensions
in an instrument could rely on both the characteristics of the recipient being analysed
and the number of variables used.
3 Explanatory factors for the use of long-term care
Given the various aspects of disability, the next question is how these, in addition to
other aspects described in the Andersen-Newman framework, are related to the
utilisation of long-term care. There are broadly two types of studies: Those that discuss
factors that can predict whether or not an individual uses long-term care either in their
own homes or in nursing homes and those that study factors that can predict the amount
or volume of long-term care. These studies capture different aspects of long-term care,
as individual determinants of whether one is given access to long-term care may differ
from the determinants of the amount of care received.
3.1 Care for elderly Home care is care provided in the recipient’s own home. Care may be provided by
health care personnel or by, e.g., family members. Home care ranges from help with
cleaning and preparing meals to around the clock care. Sheltered housing1 is a wide
range of self-owned or rented housing for disabled people. People living in sheltered
housing receive home care. In extra care sheltered housing2, residents live in facilities
defined as their own private homes (paying their own rent) and receive care according
to their assessed needs. The services could be similar to those delivered in nursing
homes. A nursing home provides 24-hour continual nursing care to people who are not
able to live at home.
1 In Norwegian: Omsorgsbolig 2 In Norwegian: Omsorgsboliger med heldøgns omsorg

19
3.1.1 Use of home care
Disability is consistently found to be strong a predictor of both the access to and the
amount of home care services [61, 70-74]. Disability, mobility and age seem to be more
important predictors of the probability of public home care use than variables describing
cognitive impairment [37, 74-77]. Additionally, those living alone have higher odds of
receiving formal help [37, 78]. The effect of cognitive impairment on the probability of
use is less clear [71, 79].
For recipients of home care disability, age and living alone seem to be the most
important predictors of the amount of care [38, 61, 70, 72]. The effect of cognitive
impairment on the amount of care received is less clear [72]; however, Meinow [61]
found that those with cognitive impairment received 25 percent more care than those
without any cognitive impairment.
Other health-related need variables mentioned in the literature include diagnosis;
comorbidity3; physical, psychological, and emotional well being; and self-rated health
status. The results related to these variables are mixed, and the effects are often
nonsignificant [71, 73, 80, 81]. A large survey of dependent elderly people living at
home indicates that individuals with poor self-rated health and chronic conditions are
more likely to use both formal and informal care [82]. Furthermore, people with
dementia are nearly five times more likely to use public home care than other older
people living alone [83]. Studies have also shown effects of depressive mood [79],
psychosocial well being [73], and emotional problems [77] on home care use. Disability
is also clearly related to well being [84] and depression [85]. The role of relatives
(cohabitant, spouse or children) is substantial throughout OECD countries. More than
10 percent of the population aged 50 or older receive help from an informal care giver,
and the amount of informal care is higher in countries with stronger family ties [86-88].
Dependent people who live alone typically have greater use of formal care than people
3 Comorbidity is defined as the presence of two or more medically diagnosed diseases [16]
20
who live with their spouses or children [37, 71, 73, 77]. Algera [80], however, reported
more mixed results for patients with long-term conditions. Informal care may serve as a
substitute and reduce the need for public care [37, 72, 74]. However, such care may
have a positive effect on formal care because informal care givers, such as children,
serve as advocates. Blomgren [37] reported that elderly who receive help from children
and elderly without children used more home care than elderly with children who do not
provide informal care. The literature is inconclusive with regard to the effect of socio-
economic status, as measured by education and income, on home care use [37, 61, 81].
3.1.2 Use of nursing homes
There is a large body of literature examining nursing home admissions (NHA),
including several meta-analyses [89-91]. There seems to be a consensus in the literature
that ADL, cognitive impairment and age are indisputable predictors of NHA. Somewhat
surprisingly, IADL variables are not consistently found to be predictors of NHA, but de
Meijer [74] found that IADL, age and ADL were significant predictors of NHA. Living
alone and prior nursing home stay increase the risk for NHA. The effect of living alone
has been found to be gender specific [91-94].
Relatively few studies have analysed the amount of resources at an individual level
within a nursing home setting. Most of these studies have been done within the RUG
system, which is a classification system of nursing home patients based on ADL score
and is used as a reimbursement system in the US [60]. Patients’ ADL score is a strong
explanatory factor of variation in individual care within nursing homes [95-97]. There is
also evidence of increased use of resources related to gender (female) and age (those
below 75 years) [95]. As noted above, the importance of cognitive impairment as a
predictor of NHA is indisputable; however, the effect of cognitive impairment on the
use of resources within a nursing home setting is less clear. Within the RUG system, the
effect of cognitive impairment is not found to be important in explaining use of care
resources [98]. Other studies have indicated that cognitive impairment affects resource
use indirectly through ADL [36, 41]. Nordberg [36] found that patients with dementia
21
received 30 percent more care than those without dementia; furthermore, worsened
ADL had a significant effect for the non-demented but not for the demented. The RUG
system has been criticised for only focusing on patient-level data and not taking into
account differences that arise at the nursing home level. Nearly 37 percent of the
variation between patients is observed at the nursing home level, and this could affect
the estimates [99].
3.2 Care for intellectually disabled individuals Elderly above 67 years old are the most frequent consumers of public long-term care.
Another large group of consumers is intellectually disabled persons. In most Western
countries, services provided for people with intellectual disabilities have been
deinstitutionalised over the past decades and replaced by community-based homes or
service flats. Instruments that are commonly used to assess intellectually disabled
persons such as, e.g., the Behaviour Problems Inventory (BPI) and the Inventory for
Client and Agency Planning (ICAP) focus primarily on behavioural problems; however,
some also include ADL and IADL variables, i.e., the Learning Disability Casemix Scale
(LDCS) [100-102]. Behavioural problems have been found to be the strongest
predictors of the amount of care among the intellectually disabled [103-105].
Behavioural problems are commonly captured by a set of variables covering, e.g., self-
abusive behaviours and both physically and verbally offensive behaviours towards
others. Although these individuals’ intellectual disability is the main reason they need
public services, disabilities could also restrict their participation in the community. Few
studies have isolated the effects of ADL or IADL as predictors of need for this group
[106]. Studies of those with mild or moderate intellectual disability have found that they
could have problems with activities of daily living [107] and that the use of ADL and
IADL is certainly appropriate for intellectually disabled individuals [108-110].
3.3 Supply of long-term care The financing of the home care sector in Europe is a complicated mosaic, with a wide
variety of funding and payment systems for providers [111]. Within the Nordic welfare

22
model, the financing of long-term care is a part of the public’s responsibility. The
supplier of long-term care is a mix of private and public providers. In Norway, the
dominant form of financing the suppliers is through global budgeting. A financial
reimbursement system based on Case-mix models has been used in nursing homes in
several countries [41, 45, 46, 112-116]. One of the most commonly used system is the
RUG system, which is based on the RAI/MDS [40, 43]. In RUG, the recipient is divided
into seven homogen groups and subgroups beneath each group, and the reimbursement
is based on the number of recipient in each group [46]. The RUG is primarily developed
for use in nursing homes. Several states in the US, as well as other countries, use RUG
as a reimbursement system through Medicare and Medicaid [46, 47]. There is also a
version for home care, RUGHC [42, 44, 48, 49].
4 Aims of the study
The aim of this study is to assess the relationship between factors describing individual
disability and impairment and the use of long-term care services both at home and in a
nursing home setting.
- The aim of paper 1 was to determine whether there were systematic
variations between nursing homes’ level of care given to patients and
whether such variations could be explained by nursing home characteristics
and/or individual need-related variables.
- The aim of paper 2 was to relate the amount of home care provided to elderly
individuals aged 67 years or older and intellectually disabled individuals
aged 18 years or older to disability and impairment characteristics.

23
- The aim of paper 3 was to examine how disability and impairment variables
could be grouped into common factors and whether the number of factors
(dimensions) differed between groups of elderly users in the Norwegian
health care system.
5 Study setting
5.1 Long-term care in Norway Long-term care is a part of the universal social and welfare system. It is an individual’s
right to services when the need arises. Responsibility for providing long-term care lies
with each of the 428 municipalities. Services may be provided by private firms, the
municipality or a combination of the two. The majority of services are provided at home
(home care) or in nursing homes; however, some services are also provided in sheltered
housing and extra care sheltered housing units. Sheltered housing consists of self-owned
or rented housing for elderly or disabled individuals and is often located adjacent to a
nursing home. Extra care sheltered housing units provide 24-hour care and are
considered as an alternative to nursing homes. For the intellectually disabled, extra care
sheltered housing is the typical living arrangement for independent living. In addition to
long-term care, the municipalities are responsible for rehabilitation, short-term stays at
nursing homes and post-acute care.
Specialised health care, including hospitals, is the responsibility of the central
government (state). General practitioners operate through a contract with the
municipalities, are responsible for primary health care and serve as gatekeepers who
make referrals to acute health care. However, they cannot refer patients to long-term
care.

24
The financial responsibility of long-term care lies with the municipalities. There is a co-
payment. The individual co-payments are means tested and differ between nursing
home and home care. In nursing homes, individual pay 75 percent of income below and
85 percent of income above NOK 90 068 (2015), with a deductible of NOK 7 500 [117,
118]. Home care is practically free of charge; payment is restricted to help with
practical tasks such as house cleaning. Those with an income below NOK 176 740 pay
a maximum amount per month of NOK 186 (2015) [117]. In sheltered housing, the
payment follows the same structure as that for home care; thus, the payment of services
is much lower in sheltered housing than in nursing homes. However, recipients pay no
additional rents in nursing homes, but they do in sheltered housing.
5.2 The municipality of Trondheim Trondheim has approximately 185 000 inhabitants and is Norway’s third-largest
municipality. The share of nursing home residents in the population above 80 is slightly
above the national average, while the share receiving home care is below the national
average [119]. Of those aged 67 years or older, approximately ¼ receive some type of
services from the municipality. These services range from having a safety alarm or
meals on wheels to living in a nursing home.
25
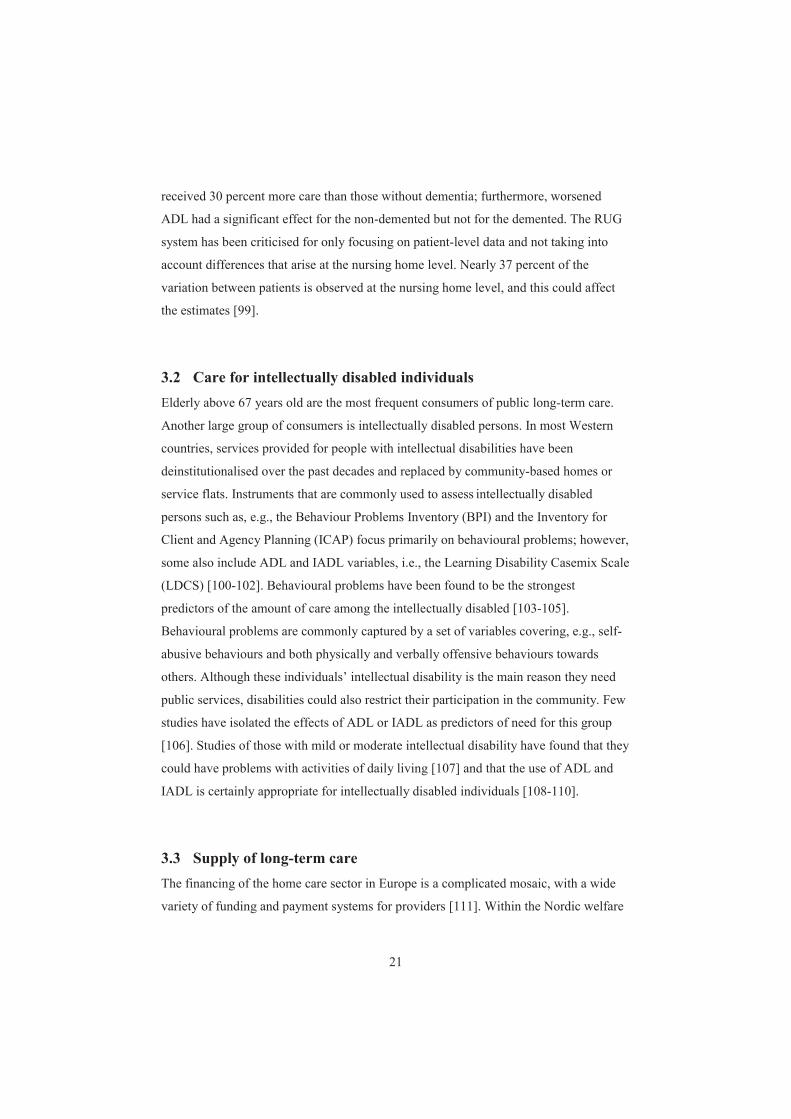
Table 1. Share of long-term care recipients in the municipality of Trondheim
The municipality of Trondheim has been using various instruments (Gerix and the
Hovedkort) to measure disabilities since the mid 1980s. Among Norwegian
municipalities, Trondheim has one of the longest experience in using such instruments
[120, 121]. In 2006, Trondheim, as all other Norwegian municipalities, started to use
IPLOS.
6 Materials and Methods
6.1 Disability instruments In 2006, a mandatory system for nursing and home care statistics (IPLOS) was
introduced in all Norwegian municipalities, covering all recipients of public care [122,
123]. The measures of disability and impairment used in this study are based on the
Individual Nursing and Care Statistics (IPLOS). IPLOS contains 15 variables describing
disability and cognitive impairment and two variables describing loss of hearing and
sight. Disability and impairment is assessed on a five-point scale, where a score of 1
26
indicates no loss of function, and a score of 2 indicates able to manage the task but with
reduced quality or speed. Scores of 3-5 indicate an increasing need of help. IPLOS uses
observed functioning, which is also used in this study. In this study, we have assessed
capability to perform tasks, and the average score was used.
In acute care, several tools are used to score disability [124-130], and all of these tools
are based on a diagnosis. As mentioned above, disability is caused by an impairment
due to a disease, e.g., stroke, dementia, and COPD. The care given by the municipality
is based on the need for care and not the initial medical explanation for the disability.
Therefore, this type of tools is less suitable in LTC. Thus, IPLOS is compared with
more general instruments that are not based on a specific diagnosis.
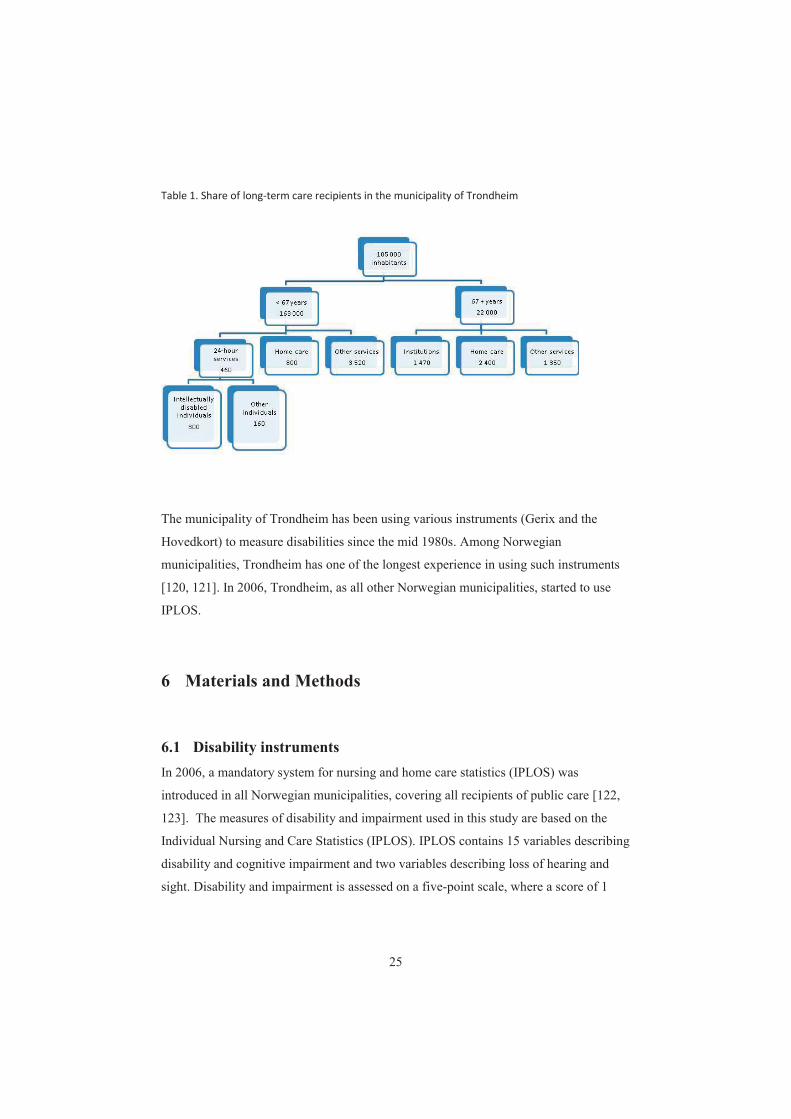
6.1.1 IPLOS compared with other commonly used instruments
IPLOS is based on the same types of variable as those found in other commonly used
instruments [131]. Table 2 compares IPLOS with the Katz, Barthel, Lawton and FIM
instruments.
Table 2 Variables used in some commonly used instruments compared with IPLOS
Variables Katz Barthel Lawton FIM IPLOS
ADL:
Eating X X X X X
Bathing X X X X (X)
Grooming/Personal hygiene X X X X
Dressing X X X X X
Transfer X X X X X
Using the toilet X X X X X
Continence X X X
Controlling bowel X X
Indoor mobility X (X) X (X)
Ascend and descend stairs X X (X)

27
Outdoor mobility (X) X
IADL:
Use of phone X
Shopping X X
Food preparation/cooking X X
Housekeeping X X
Laundry X (X)
Mode of transportation X
Handling finance X
Responsibility for own medication X (X)
Cognitive:
Communication1 X X
Social interaction X X
Daily decision taking/ Plan and -
manage daily routine X
Memory X X
Problem solving X
Behavioural control X 1Comprehension and expression
IPLOS compared with the Barthel and Katz ADL instruments:
The Barthel instrument has seven variables, and the Katz instrument has six. In addition
to ADL, the Barthel instrument has 3 variables measuring mobility. It makes a
distinction between Grooming/Personal toilet and Taking a bath. In IPLOS, Grooming,
Personal toilet and Taking a bath are measured within the same variable. IPLOS has the
same ADL variables as the Katz instrument except Bladder. While Katz’s and Barthel’s
instruments make a distinction between using the Toilet and Controlling bladder and
bowel, all this information is included in the variable Using toilet in IPLOS. The
Barthel instrument has one variable for Transfer between (wheel-) chair and bed and
one for Walk on a surface; IPLOS merges these into the same variable Indoor mobility.
Barthel’s instrument has a variable Ascend and descend stairs; in IPLOS, this is a part
of Outdoor mobility. The Katz instrument uses a 3-point scoring system, and the Barthel
instrument uses 2- or 3-point scores. IPLOS uses a 5-point score. Neither Barthel’s nor
Katz’s instrument has IADL or cognitive variables.

28
IPLOS compared with Lawton’s instrument:
Lawton’s instrument has eight IADL variables, while IPLOS has three. In addition,
IPLOS has a variable Maintaining own health, which has a much wider definition than
Lawton’s Responsibility for own medication. Housekeeping in IPLOS includes laundry,
while this variable is separated from Housekeeping in Lawton’s measure.
IPLOS compared with the FIM:
The FIM has the same ADL variables as those used in Katz’s and Barthel’s instruments.
The FIM does not have any IADL variables but does have five cognitive variables. The
FIM divides communication into Comprehension and Expression, while IPLOS merges
these two variables into one variable called Communication. The instruments’ variables
of Social interaction and Memory are quite the same, while the FIM includes a variable
labelled Problem solving, which is not included in IPLOS. IPLOS has a variable Daily
decision taking, which is close to Plan and manage daily routine. In the FIM, the
variable Social interaction is more related to adequate social behaviour, while in IPLOS,
it is more related to maintaining social relations. Adequate social behaviour in IPLOS is
measured in the variable Behavioural problems.
6.1.2 Validity and reliability tests of IPLOS
While IPLOS shares many similarities with other instruments, a possible objection is
that is has been tested for validity only to a limited degree. Selbæk [132] performed a
validity test of the variables in IPLOS among 652 home-dwelling elderly. ADL and
IADL variables in IPLOS were tested against similar variables in Lawton’s instrument,
and the validity of two the cognitive impairment variables (memory and
communication) in IPLOS was tested against the MMSE, the Clinical Dementia Rating
(CRD) [133] and the Neuropsychiatric Inventory (NPI) [134]. The correlation
(Spearman’s rho) between IPLOS ADLs and Lawton’s ADLs was 0.66 and between

29
IPLOS IADLs and Lawton’s IADLs was 0.53. There is no common agreement of what
is considered as strong or weak correlation; in most definitions, 0.66 is considered as a
strong correlation, while 0.53 is considered as a moderate to strong correlation. The
correlation between IPLOS cognitive impairment and CRD was 0.65 and between
MMSE and IPLOS was -0.53; the negative value is because lower values on the MMSE
imply worsened cognitive ability. The correlation with a behavioural rating, the NPI,
was weak to moderate. Thus, compared to the MMSE, CRD and NPI, IPLOS could
underestimate cognitive impairment. However, whether this is due to unclear definitions
of the variables in IPLOS or the training of the employees is unknown.
This thesis did not aim to perform a reliability or validity test of IPLOS. The IPLOS has
been used in Norway for nearly 10 years. Here, we were interested in whether routinely
collected data could be used for planning. Using data from the municipality a limited
inter-rater reliability test was conducted. Inter-rater reliability (IRR) and inter-rater
agreement (IRA) tests were performed [135, 136]. Intraclass correlation coefficient
(ICC) tests are often used to test the reliability of disability indices [43, 137-139]. Four
cases were used, 38 employees were tested in case 1, 44 in case 2, 63 in case 3 and 39 in
case 4, of these employees, respectively 38, 44, 47 and 23 had completed an earlier
training program [140].
The test was conducted according to Shout and Fleiss [141]. A high ICC indicates both
high reliability and agreement [142]. ICC values above 0.75 were interpreted as good
reliability, values between 0.4 and 0.75 as moderate to good reliability, and values
below 0.4 were considered as poor reliability [143].
For each single variable, an inter-rater agreement test was performed. This test
examined observed vs. expected variance [144-146]. In accordance with LeBreton
[135], we used rwg as measure between observed and expected variance. rwg values
above 0.91 were interpreted as very strong agreement, values between 0.71 and 0.90 as

30
strong agreement, values between 0.51 and 0.70 as moderate agreement, values between
0.31 and 0.50 as weak agreement, and values below 0.3 as no agreement [135].
The main finding of this limited reliability analysis was that those who had completed
an organised training program (authorised) had higher ICC and higher agreement than
those who did not (non-authorised). When the Minimum Data Set (MDS) was
implemented in the US in the early nineties, the importance of training and education
were noted [147]. All but three variables had strong to very strong agreement. Social
interaction had the lowest agreement for both authorised and non-authorised. In other
indices such as the FIM and the RAI, a similar variable is more limited to deviant
behaviour. For the non-authorised, Using toilet and Maintaining own health had
moderate agreement. This confirms results from other studies that report difficulties in
scoring variables such as Maintaining own health and Social interaction [148]. There
are several caveats to this approach. Because we needed to use those who participated in
the training program, there was no randomisation of the participants. The authorised
were more numerous than the non-authorised, and this could affect the estimates. The
number of cases was limited, and we could not properly determine whether all variables
had the same dispersion in difficulty. The study was conducted in one municipality,
making it less suited for generalisations.
6.2 Other variables
The outcome variable in this study was amount of long-term care provided, as measured
in hours per week. Time was registered by personnel using handheld computers and
registered after each visit. In nursing homes and sheltered housing for intellectually
disabled individuals, time was registered after each shift.
All variables, including diagnosis, gender, age group, living arrangement and other
enabling variables, were registered in the municipality’s electronic patient record
system.

31
6.3 Statistical methods In all three studies, a quantitative cross-sectional analysis was performed. In paper 1,
exploratory factor analysis and multilevel regression analysis with random intercepts
(sometimes referred to as mixed model) were used. In the second paper, exploratory
factor analysis and multivariate regression analysis were used. In the third paper,
exploratory factor analysis, confirmatory factor analysis and item response theory were
used. Analyses were performed with SPSS version 21. IBM Corp. Armonk, NY or Stata
13.1 StataCorp. College Station, TX.
6.3.1 Factor analysis
Factor analysis is a set of methods used to cluster variables that statistically depend on
each other. Variables with high correlation could be grouped together into a common
factor. There are two major types of factor analysis. In exploratory factor analysis
(EFA), one attempts to find the underlying structure based on the observed correlation
among the observed variables. No assumption is made about the underlying structure. In
confirmatory factor analysis (CFA), one seeks to test whether an assumable underlying
structure is true. Confirmatory factor analysis should be based on a theory of the
underlying structure [149].
In exploratory factor analysis, there are several decision points. The lack of clear
guidelines makes EFA a bit puzzling [150, 151]. In this study, ordinal variables were
used. Although polychoric correlations are considered to be the "gold standard" when
analysing dichotomous items, Pearson’s correlation is often used. Polychoric
correlations assume that the underlying latent variables are normally distributed [64]. If
the variables are non-normal distributed the use of polychoric correlation may lead to
biased estimates. Still, polychoric correlation is often preferred for ordinal data [152].
Pearson’s correlation could lead to underestimating the factor loadings and, thus,

32
retaining too many factors. With as many as 5 response categories, this may not
represent a serious problem [64, 153, 154].
Decision points in EFA:
1) Factor extraction method
2) Number of factors to retain
3) Rotation
1) The most frequently used extraction methods are principal component analysis
(PCA) and principal axis factoring analysis (PAF). In this study, we used PAF, which is
often recommended [150].
2) There are no clear commonly accepted statistical criteria for the number of factors to
retain, and the number of factors retained should be examined in light of existing
theory. Here, Kaiser criterion, scree plot and parallel analysis were used. Parallel
analysis is not a part of the standard version of SPSS; thus, a script by Hayton [155] was
used.
3) Rotation does not influence the number of factors to retain; it is done only to
maximise the high correlations and to minimise the low correlations. There are two
main categories of rotation, orthogonal and oblique rotation. In orthogonal rotation, the
factors are assumed to not be correlated, while in oblique rotation, the factors are
allowed to correlate. In social science, correlations between factors are nearly always
the case; thus, oblique rotation is considered as best practice [150].
The frequently recommended minimum sample size for EFA is at least ten times the
number of variables. There is no clear consensus in the literature concerning whether
this is a reasonable minimum, but a minimum ratio of 20:1 seems to be more justifiable
[151].

33
In CFA, one estimates variables that minimise the difference in correlation matrix from
the constraint model and the correlation matrix from the observed variables and tests
whether the estimated correlation matrix has consistent fit with the observed correlation
matrix [156].
Because there are no clear guidelines regarding how to arrange the variables, we used
both an exploratory and a confirmatory factor analysis in the studies [157].
6.3.2 Multilevel analysis
Multilevel analysis allows for the differentiation between variations at different levels.
In article 1, we were interested in determining whether a large part of the difference in
individual care was caused by differences between nursing homes compared to
differences between individuals [158, 159]. Furthermore, multilevel regression analysis
could be an appropriate way to adjust for heterogeneity. A common practise in standard
regression analysis is to add dummy variables to adjust for heterogeneity. An obstacle
with the use of dummies is that it could reduce the degrees of freedom, which could be
a problem if the number of observations is low. This problem could be reduced by using
random coefficient analysis in a multilevel analysis. In this article, the estimation
procedure was done by maximum likelihood methods, assuming an unstructured
covariance matrix.
6.3.3 Multivariate regression analysis
Multivariate regression analysis was used in article 2. Heteroscedasticity was tested by
using Cook-Weisberg and White’s heteroscedasticity-consistent estimators [160].
Multicollinearity was tested by using variance inflation factor. Because of the skewed
distribution of the error term, a natural logarithm was used to normalise the distribution.

34
For categorical dummy variables and discrete variables, Kennedy’s approximation was
used to adjust the data for bias [161, 162].
In article 2, potential heterogeneity was adjusted by fixed coefficients. Although
random coefficients increase the degree of freedom, they do not necessarily improve the
model compared to fixed heterogeneity coefficients [163].
6.3.4 Item Response Theory - IRT
In article 3, item response theory (IRT) was used. IRT is considered as a proper
technique to determine the hierarchical order of the variables and potential information
gaps between variables. Both one-parameter logistic (1PL) and two-parameter logistic
(2PL) IRT models were used. The variable (or item) difficulty parameter is measured, in
standard deviations, as the distance from the overall mean score (standardised) on the
latent variable when the probabilities of scoring “need for help” or “no need for help”
are equal (i.e., 50 percent) [164, 165]. Thus, higher parameter values are associated with
more difficult tasks (variables) or the increased ability to possibly manage an item
increase. There are no clear guidelines for the recommended size of the gaps between
variables, although some reports have suggested values between 0.15 and 0.30 [166-
168].
6.4 Ethical considerations The study was approved by the Regional Committee for Medical and Health Research
Ethics (REK) and the Ombudsman for Research at the Norwegian Social Science Data
Services (NSD). The data from the municipality was de-identified.

35
7 Summary and results
7.1 Paper 1: Within the setting of a public health service, we analysed the distribution of resources
between nursing homes funded by global budgets. Three questions were pursued. First,
are there systematic variations between nursing homes in terms of the level of care
given to patients? Second, can such variations be explained by nursing home
characteristics? Third, how are individual need-related variables associated with
differences in the level of care given? As much as 24 percent of the variation in
individual care between patients could be explained by variation in nursing homes.
Adjusting for structural nursing home characteristics did not substantially reduce the
variation in nursing homes. For the average user, one point increase in individual ADL
increases the use of resources by 27 percent. A negative association was found between
individual care and mean ADL at the nursing homes. In other words, at the nursing
home level, a more resource-demanding case-mix is compensated by lowering the
average amount of care. In a financial reimbursement model for nursing homes with no
adjustment for case-mix, the amount of care patients receive depends not only on the
patients’ own needs but also on the needs of all the other residents.
7.2 Paper 2: This study reports an analysis of factors associated with home care use in a setting in
which long-term care services are provided within a publicly financed welfare system.
Both disability and cognitive impairment were strong predictors of the amount of care
received for both elderly and intellectually disabled individuals. For elderly individuals,
we also found significant positive associations between weekly hours of home care and
having comorbidity and living alone. The reduction in the amount of care for elderly
individuals living with a cohabitant was substantially greater for males than for females.
For intellectually disabled individuals, receiving services involuntarily due to severe
behavioural problems was a strong predictor of the amount of care received. Our
analysis showed that routinely collected data capture important predictors of home care

36
use and, thus, facilitate both short-term budgeting and long-term planning of home care
services.
7.3 Paper 3:
The aim of this study was to utilise a national information system that comprises 15
variables characterising disability and cognitive impairment to analyse the number of
factors (dimensions) necessary to determine whether long-term care is needed as well as
the hierarchical order of the variables within each factor. Specifically, we examined
whether the number of factors and their structures differed across elderly in the
Norwegian health care system. Two factors were sufficient to characterise need for all
groups of recipients. For the elderly, disability and cognitive impairment appeared to
represent different dimensions of need. The IRT analysis suggested a nearly identical
hierarchical ordering for elderly persons receiving care at home and those living in
nursing homes. Grouping variables that describe disability and cognitive impairment are
most suitable for broad factors that could be used in explaining the elderly’s needs. IRT
analysis revealed large information gaps between different variables in the system used
in Norway today; thus, there is a need to (re-)consider the design of the standardised
national registration system (IPLOS).
8 Discussion
8.1 Description and measures of need of long-term care among the
elderly
8.1.1 How to describe need at the individual and group levels
Today, IPLOS is the only need-based evaluation of elderly and intellectually disabled
individuals with the potential to be used throughout the Norwegian long-term health
care system. This makes it a potential tool for both cross-sectional and longitudinal

37
comparison between and within municipalities. Although the use of IPLOS variables is
central in this thesis, the intention has not been to evaluate IPLOS as a system per se.
However, results based on IPLOS data are of interest because IPLOS is a mandatory
system for all Norwegian municipalities and all recipients of public long-term care and
has remain nearly unchanged since 2006.
When moving from the individual level to comparisons at the group level, there is a
need to aggregate the variables for two reasons. The first reason is that the comparison
of all variables would be overly complex. An aggregation, thus, eases the interpretation
of the results. Second, the underlying causes of disability affect the variables to a more
or less degree, implying that the variables are correlated. The estimation of correlated
variables could give biased results. How to group the ADL, mobility and IADL
variables into factors has been extensively analysed. The literature, however, is largely
inconclusive, suggesting that ADL, mobility and IADL variables may be placed in
groups that include one to three unique factors [63, 64, 169]. In article 3, we found that
need could be described by two factors: one containing variables related to disability
and another containing variables related to cognitive impairment. Our results support
studies that found that ADL and mobility variables constitute a common dimension in
describing the service needs of the home-dwelling elderly and nursing home residents
and that the IADL variables could be both physical and cognitive [66, 67, 69]. Thus,
the distinction between physical and cognitive variables may be more relevant than that
between ADL, IADL and cognitive variables. Furthermore, the factorisation seems to be
independent of whether care is provided at home or in nursing homes. In addition, the
distinction between the “younger elderly” (67-80) and the “older elderly” (80+) and
gender do not seem to be important when choosing the number of factors or the
variables contained in each factor.
The exploratory factor analysis produced three dimensions for nursing homes in article
1 and two dimensions in article 3. In article 1, Pearson’s correlation was used, and in
article 3, polychoric correlation was used. This is an example of Pearson’s correlation

38
retaining too many factors. The data used in article 1 were from 2004 and those used in
article 3 from 2012. The use of polychoric correlation also led to two factors in the 2004
data used in article 1. The estimated results and the conclusions from article 1 remain
the same when a physical disability index was used instead of a combination of ADL
and IADL.
We also analysed how the variables measure disability along a continuum. Our results
suggest that the hierarchical ranking of variables is quite similar for elderly living at
home and those living in nursing homes as well as across age and gender. These
findings are in accordance with Finlayson [170]. Second, we found large information
gaps between the variables that represent the simplest tasks, more precisely, between the
variables Eating and Indoor mobility, both for patients in nursing homes and home-
dwelling elderly. A possible solution to reduce this gap could be to split the variable
Indoor mobility into more detailed variables. In Garcia [65], indoor mobility is split into
three separate variables, and this split seems to reduce the gap. McHorney [32]
performed an IRT analysis on 166 ADL/IADL variables with much more detailed
information than IPLOS. This detailed analysis gives an overview of potential variables
that could cover gaps along the continuum. In practical use, there will always be a trade-
off between an instrument that includes multiple variables and covers a wide spectrum
of need and a more parsimonious instrument that reduces the administrative burden
[31]. A possible solution to increase the ability to detect differences and, at the same
time, keep the administrative burden to a minimum is to replace some of the variables.
However, we did not find any gaps small enough to justify rejecting variables without
an important loss of information. Accurately accounting for differences in need among
the less disabled is a limitation in most indices based only on traditional ADL/IADL
variables [168], and our analysis suggests that the best solution is to trade administrative
ease in favour of a more detailed instrument.
8.1.2 The relationship between need and amount of care

39
8.1.2.1 Home Care
In home care, cognitive impairment together with disability, age and living alone seem
to be the most important predictors of the amount of care provided [38, 61]. We found
that worsened disability increased the use of public home care more than did worsened
cognitive and behavioural impairment. At the mean value of cognitive impairment
score, the marginal effect of a one-point increase in disability was an increase of 120
percent in the amount of care provided. At the mean value of disability, the marginal
effect of a one-point increase in cognitive impairment was an increase of 66 percent in
care. This establishes a strong relationship between both disability and
cognitive/behavioural impairment on the amount of public home care received by the
elderly. The importance of disability as a predictor of the amount of care received has
been stated in other studies, while the effect of cognitive impairment has been more
unclear [61, 70, 72]. We found that the model explained 45 percent of the variation in
individual care. This is in the same range as that in other studies, which have explained
37-49 percent [48, 49, 61].
In our study, we did not find any age effect. This result is contrary to Meinow [61] and
Lindholm [38], but as Meinow stated: “… older age had a significant positive effect on
the amount of home help allocated. Although this could be a result of privilege solely by
age, it is likely that the age variable covered some kind of frailty related to the amount
of home help received, and not included by the IADLs and ADLs measures”.
The role of informal care (cohabitant, spouse or children) is substantial throughout
OECD countries. More than 10 percent of the population aged 50 or above receive help
from an informal care giver [37, 72, 86, 87]. Our results support the hypotheses that
cohabitants serve as substitutes for public care and that their effect on the amount of
care given can be quite substantial. However, we found a strong gender effect for home-
dwelling elderly, which is contrary to other studies [72]. Men living with cohabitants
received substantially less care than females. The lack of an association between gender
and help received among those who lived alone may be due to the cohabitant. This

40
implies that female cohabitants serve as a substitute for public care to a larger degree
than male cohabitants. Cohabiting women receive approximately 30 percent less care
than those living alone, while cohabiting men receive approximately 50 percent less
care than those living alone. Comorbidity among the elderly is associated with
worsened disability and increased hospitalisation [171]. To our knowledge, no previous
study has conducted an analysis of the association between comorbidity and the amount
of public home care provided. The presence of comorbidity increased the amount of
home care by approximately 20 percent. We did not find a direct effect of any of the
most frequently used diagnoses, i.e., dementia, stroke or diabetes; thus, diagnoses may
be too crude a measure to describe need. Diagnosis is measured as yes/no, while the
degree of disability resulting from a diagnosis could vary substantially. Dementia is
considered as one of the most important diseases that impact the future use of public
health care. We do not have precise information about the prevalence of dementia in the
Norwegian population [172]. In Europe and Northern America, estimates of the
prevalence of dementia are approximately 12 percent for those 80 to 85 years old and
25-30 percent for those above 85 years old [173]. Dementia is an important cause of
increased disability. However, in this study, the diagnosis of dementia itself was not a
significant predictor of the amount of public home care beyond what was captured by
cognitive impairment.
8.1.2.2 Nursing home
It has been established that ADL are an important predictor of time the staff allocates to
recipients of long-term care in nursing homes [36, 60, 95, 98, 99]. Although the
importance of cognitive impairment as a predictor of admissions to nursing homes is
indisputable, the effect of cognitive impairment on the use of resources within a nursing
home setting is less clear. Arling [41], however, found that increased cognitive
impairment led to worsened ADL, which in turn led to increased staff time. Fries [98]
found that cognitive impairment led to (slightly) increased staff time for those with less
ADL disability. In addition, we found that disability, measured with ADL, was the
strongest predictor of increased staff time use. For the average user, a one-point increase

41
in ADL-disability increases the use of resources by 27 percent. We also found a
significant effect of increased cognitive impairment. For the average patient, the
marginal effect of a one-point increase in cognitive impairment was 1.1 percent. When
disabilities were held constant, worsened cognitive impairment led to increased staff
time, but as in Fries [98], we also found that increased cognitive impairment led to a
greater increase in staff time for those with less disability. For those with the most
severe disability, a one-point increase in cognitive impairment actually led to decrease
in staff time.
Heterogeneity between nursing homes could account for as much as 29-37 percent of
the variation between patients direct care [99]. In our study, we found that variation
between nursing homes accounted for approximately 25 percent of the variation in total
individual care. However, the variation between nursing homes was smaller (14
percent) for personal care. In other words, variation between nursing homes differs a
great deal according to what type of staff time was analysed. However, not taking the
heterogeneity into account could lead to less efficient estimated parameters.
When we compare studies 1 and 2, we see that worsened cognitive impairment has a
stronger effect, as measured in percent, on the staff time in home care than in a nursing
home setting. Those with cognitive impairment need some type of supervision, which is
a natural part of a nursing home setting with staff available 24 hours per day. This
supervision is not necessarily captured in direct care time in a nursing home setting. In a
home care setting, increased need for supervision led to more frequently visits. The
results from study 1 and study 2 are not directly comparable according to the role of
informal care. However, in study 1, we found that those who received a substantial
amount of informal care (more than 3 hours per week) also received more formal care.
However, there were no differences in formal care between those who received no
informal care and those who received up to three hours of informal care per week. For
those who received home care (study 2), the amount of informal care received had no
significant effect on the amount of public care received. It is noteworthy that the effect

42
of cohabitating in home care and receiving substantial informal care in nursing homes
had opposite effects on the amount of formal care. Unfortunately, the data did not
provide information that would allow us to look further into this question. One possible
explanation for this finding could be that in the nursing home setting, we observed
people at the end of life and that this influences time used both by staff and relatives.
Relatives and the staff could also have different definitions of “desirable level of care”.
Another possible explanation is that relatives that spend a substantial amount of time
with the patients serve as strong advocates.
Unfortunately, enabling variables such as income and education were not available for
this study. Most studies have not found any significant effect of education on the
amount of care, but to some degree, it seems to affect the probability of having care
[71]. In a Norwegian health care setting, those with high education were more likely to
receive more frequent care than others [81]. Within the Nordic welfare model, this is
contrary to a Finnish study that did not find any education effect [37]. Some of the
same pattern seems to occur related to income. It is most common to not find any effect
of income on the amount of care, while the effect of income on the probability of care is
more unclear [71]. Researchers who found that those with higher income use more care
services are mainly from a US health care setting. A study by Blomgren [37], which
was conducted within a Nordic welfare system, did not find any income effect on the
probability of home care use. More detailed information about informal care would be
of interest. We know that the presence of children could affect the probability of having
home care, but the effect on the amount of care is unknown [37].
It seems to be indisputable that cognitive impairment seems impacts the amount of
home care and NHA; however, whether it is a good predictor of amount of care in the
nursing home sector is more debatable. In our study, we found cognitive impairment to
be a solid factor in predicting the amount of care both in home care and nursing home
settings. It has been noted that IPLOS may underestimate cognitive impairment [132]. If

43
this is truly the case, we may have underestimated the effect of cognitive impairment
rather than overestimating the effect by using IPLOS.
8.2 Description and measures of need of long-term care among
intellectually disabled persons
There are some distinct differences between elderly and intellectually disabled
individuals according to the disability instrument. According to the findings from study
2, the same variables could be used for both groups, but the interpretation of the
variables differs. For the elderly, the variables could be divided into disability and
cognitive impairment. For intellectually disabled individuals, the factor analysis
identified behavioural impairment as a separate factor, whereas all the other variables
were grouped into one common composite index, which constitutes both disability and
cognitive impairment.
Behavioural impairment and coercive measures were the most important predictors of
care provided to intellectually disabled care recipients. A one-point change in
behavioural impairment increased the amount of public care provided by 50 percent.
Furthermore, individuals who were subjected to coercive measures received 56 percent
more care per week than individuals who were not subjected to such measures. Our
findings support the notion that behavioural problems are among the strongest
predictors of the use of public care among intellectually disabled individuals [103, 105].
Furthermore, our findings support the notion that, in addition to behavioural measures,
disability and cognitive impairment are important explanatory factors of the variation in
long-term care provided to intellectually disabled service recipients. For the average
care recipient, the marginal effect of a one-point increase in the composite index was an
increase of 77 percent in weekly care hours.

44
For intellectually disabled individuals, behavioural impairment is certainly important
when describing the need for care. However, IPLOS has only one variable describing
behavioural impairment, and this variable may not describe the full range of behavioural
impairment. Other instruments, for instance the Learning Disability Casemix Scale
(LDCS) [101, 105], the Behaviour Problems Inventory (BPI) [102] or Inventory for
Client and Agency Planning (ICAP) [100], have at least seven variables to describe
behavioural impairment. IPLOS’s limitation in describing challenging behaviour could
be a reason why the model only explained 29percent of the individual variation. Other
models has an explanatory power of explaining differences in nearly 40 percent [103],
on the other hand some models has an explanatory power of 33 percent [105].
Challenging behaviour is common among the elderly with dementia; most of the elderly
with dementia experience (short) periods with behavioural disturbance [174]. In article
3, we found that after Eating, Behavioural control was the variable for which the elderly
had the lowest score both in nursing homes and in home care. We also observed large
gaps between Behavioural control, Communication and the other cognitive variables.
Although those with severe challenging behaviour seem to be a small group of the
elderly, they are viewed as a challenge for and threat to both the staff and other
residents, and they create a substantial amount of stress [175, 176].
9 Implications and further research
9.1 Implications for the score system IPLOS is a mandatory system, and in national statistics, it is used in the same manner
for all recipients. Based on the results from this study, there are some suggestions for
improvement.

45
9.1.1 New variables related to “information gap”
For elderly, there were information gaps at both ends of the scale. To improve the
scale’s ability to detect differences in disability, one should attempt to find variables
between “housekeeping” and “shopping” at the most difficult end and between “eating”
and “indoor mobility” at the easiest end. This is similar for both home-dwelling elderly
and those living in nursing homes. For cognitive variables, one should find variable(s)
covering the gap between “maintaining own health” and the other cognitive variables.
The system would benefit from closing gaps. This study has not tested potential
variables to fill the gaps, but there are several suggestions listed in other studies [32].
As a consequence of IPLOS’s limitation of having only one variable that describes
behavioural impairment, in 2015, the municipality of Trondheim incorporated three
variables to cover a wider spectrum of challenging behaviour. It would be of interest for
further research to investigate whether more detailed scoring of challenge behaviour
combined with staff time could give more accurate information concerning both
intellectually disabled individuals and the elderly with behavioural disturbance.
9.2 Implications for planning
9.2.1 Practical use in the planning and financing of long-term care
One of the main findings from study 1 was that a reimbursement system with no
adjustment for case-mix could lead to a situation in which the amount of care received
depended not only on the patient disability and impairment but also on the case-mix of
the entire nursing home. At the time of the study, nursing homes in the municipality of
Trondheim received the same amount of budget regardless of the acuity of the residents.
The consequence of this was that for elderly living at nursing homes, the amount of care
received depended on the ADL level of all the other residents. This has implications for
the planning of the services as well as implication for the patients. The municipality of

46
Trondheim changed its reimbursement system after this time study was conducted. The
most common way to finance nursing homes in Norway is through global budgeting.
An interesting task for further research would be to investigate whether budget
allocation based on case-mix will eliminate differences in individual care depending on
the overall case-mix in the institution. The nursing homes in the study certainly had
different ways of allocating their care time to recipients. Some prioritised individual
care time, while others used more of their resources in group time. Unfortunately, we
did not have any indicators of the quality of the care provided. It would be of interest
for further research to investigate whether differences in quality between nursing homes
could be related to different methods of providing care.
RUG is used as a reimbursement system for nursing homes [45, 46, 60]. A system for
home care, RUG HC, has also been developed [48]. The White Paper 50 1997 [177]
concluded that RUG would not be introduced in Norway at the moment but that it
should be considered later. When IPLOS was prepared, the goal was for it to be a part
of a potential introduction of RAI [131]. Thus, municipalities that choose to use the
more comprehensive RAI should not have to use two parallel systems. That was not the
final solution. The results from our studies show models that explain the individual
differences in care as well as RUG measured with adjusted r square. Thus, IPLOS is a
potential tool for reimbursement purposes.
The decision to admit an intellectually disabled person into a community home is based
on the municipality´s assessment of the person’s needs. In Trondheim, the assessment is
performed by an independent office. The financial system for the intellectually disabled
is partly based on dialogue between this office and those who deliver the services and
partly constrained by global budgeting. A system based on case-mix for intellectual
disabled individuals is under development in the municipality.

47
9.3 Further research This study was only conducted in one municipality. This reduces potential noise in the
data resulting from differences between municipalities. To determine whether the
generality of the results hold, the datasets should be expanded to include several
municipalities. First, more validity and reliability tests should be conducted across
municipalities.
It would be of interest to see if there is larger heterogeneity between nursing homes
within the same municipality than those in different municipalities. It would also be
interesting to include several specialised units with more extensive care, e.g.,
rehabilitation, behaviour problems such as out acting or special treatments [99].
Although the explained variance in this study corresponds with that in other studies, a
large part of the variation in individuals’ care remains unexplained. This should be
addressed in future research.
In study 1, there seem to be economies of scale. For nursing homes, there could be
economies of scale at least up to 75-95 beds [178]. For intellectually disabled persons,
the economies of scale are unclear. It has been found that few residents leads to higher
costs [103]. These findings are disputable; some scholars argue that differences are
relatively small and that results could be related to the fact that a small community
setting could serve as a proxy for other non-/ or poorly measured variables such as
behaviour [179]. It would have been interesting to incorporate facility size in the
analysis. Cost differences related to diagnosis have also been found [179]. Our data did
not include information on diagnosis for intellectually disabled individuals; this would
have strengthened the analysis.

48
10 References
1. OECD, Health at a Glance 2013. OECD Indicators. 2013: OECD Publishing. 2. Colombo, F., et al., Help Wanted? Providing and Paying for Long-Term Care. OECD
Health Policy Studies. 2011, Paris: OECD Publishing. 3. Giannakouris, K., Ageing characterises the demographic perspectives of the European
societies. Eurostat, 2008. 72. 4. Statistics Norway. Norwegian population projections. 2015; Available from:
https://www.ssb.no/statistikkbanken/selectvarval/define.asp?SubjectCode=01&ProductId=01&MainTable=FolkFramT2&contents=Personer&PLanguage=1&Qid=0&nvl=True&mt=1&pm=&SessID=5482477&FokusertBoks=1&gruppe1=Hele&gruppe2=Hele&gruppe3=Funksjonell5&gruppe4=Hele&aggreg3=YES&VS1=Landet&VS2=Kjonn&VS3=AlleAldre00B&VS4=&CMSSubjectArea=befolkning&KortNavnWeb=folkfram&StatVariant=&Tabstrip=SELECT&aggresetnr=1&checked=true.
5. OECD, Projecting OECD Health and Long-Term Care Expenditures: What are the main drivers? OECD Economics Department Working Papers. Vol. 477. 2006, Paris: OECD Publishing.
6. TNS Opinion & Social, Health and long-term care in the European Union, in Special Eurobarometer 283/Wave 67.3. 2007, European Commission: Brussels.
7. Tarricone, R. and A.D. Tsouros, Home care in Europe: The solid facts. 2008, Copenhagen: WHO Regional Office for Europe.
8. OECD, Health at a Glance 2011. OECD Indicators. 2011: OECD Publishing. 9. Gautun, H., A.S. Grødem, and Å. Hermansen, Hvordan fordele omsorg? (In Norwegian),
in Fafo-rapport. 2012, Fafo. 10. Brevik, I., De nye hjemmetjenestene langt mer enn bare eldreomsorg (In Norwegian), in
NIBR-rapport. 2010. 11. Statistics Norway. Life expectancy at birth. Statbank 2014; Available from:
https://www.ssb.no/en/befolkning/statistikker/folkfram/aar/2014-06-17. 12. Payne, G., et al., Counting Backward to Health Care's Future: Using Time to Death
Modeling to Identify Changes in End of Life Morbidity and the Impact of Aging on Health Care Expenditures. Milbank Quarterly, 2007. 85(2): p. 213-257.
13. de Meijer, C., et al., Determinants of long-term care spending: Age, time to death or disability? Journal of Health Economics, 2011. 30(2): p. 425-438.
14. de Meijer, C., Studies of Health and Long-Term Care Expenditure Growth in Aging Populations, in Institute of Health Policy & Management. 2012, Erasmus University Rotterdam.
15. WHO, International classifïcation of impairments, disabilities and handicaps: A manual of classification retating to the consequences af clisease. 1980, Geneva: World Health Organization.
16. Fried, L.P., et al., Untangling the concepts of disability, frailty, and comorbidity: implications for improved targeting and care. The Journal of Gerontology: Medical Sciences, 2004. 59(3): p. 255-63.
17. WHO. Definition: intellectual disability. 2015; Available from: http://www.euro.who.int/en/health-topics/noncommunicable-diseases/mental-health/news/news/2010/15/childrens-right-to-family-life/definition-intellectual-disability.

49
18. Nagi, S.Z., Some conceptual issues in disability and rehabilitation, in Sociology and rehabilitation, M.B. Sussman, Editor. 1966, American Sociological Association: Washington DC. p. 100-113.
19. WHO, ICF: International classification of functioning, disability, and health, ed. World Health Organization. 2001, Geneva, Switzerland.
20. Jette, A.M., Toward a common language of disablement. The Journals of Gerontology Series A: Biological Sciences and Medical Sciences, 2009. 64(11): p. 1165-1168.
21. Andersen, R. and J.F. Newman, Societal and individual determinants of medical care utilization in the United States. Milbank Quarterly, 2005. 83(4): p. 1-28.
22. Babitsch, B., D. Gohl, and T. von Lengerke, Re-revisiting Andersen’s Behavioral Model of Health Services Use: a systematic review of studies from 1998–2011. GMS Psycho-Social-Medicine, 2012. 9.
23. Moskowitz, E., M. Vernon, and C.B. McCann, Classification of disability in the chronically ill and aging. Journal of Chronic Diseases, 1957. 5(3): p. 342-346.
24. Katz, S., et al., Studies of illness in the aged. The index of ADL: A standardized measure of biological and psychosocial function. JAMA, 1963. 185: p. 914-9.
25. Mahoney, F.I. and D.W. Barthel, Functional Evaluation: The Barthel Index. Maryland State Medical Journal, 1965. 14: p. 61-5.
26. Applegate, W.B., J.P. Blass, and T.F. Williams, Instruments for the Functional Assessment of Older Patients. New England Journal of Medicine, 1990. 322(17): p. 1207-1214.
27. Roehrig, B., et al., How many and which items of activities of daily living (ADL) and instrumental activities of daily living (IADL) are necessary for screening. Critical Reviews in Oncology/Hematology, 2007. 62(2): p. 164-71.
28. Katz, S., Assessing self-maintenance: activities of daily living, mobility, and instrumental activities of daily living. Journal of the American Geriatrics Society, 1983. 31(12): p. 721-7.
29. Katz, S., The science of quality of life. Journal of Chronic Diseases, 1987. 40(6): p. 459-63.
30. Lawton, M.P. and E.M. Brody, Assessment of older people: self-maintaining and instrumental activities of daily living. The Gerontologist, 1969. 9(3): p. 179-86.
31. Lindeboom, R., et al., Activities of daily living instruments Optimizing scales for neurologic assessments. Neurology, 2003. 60(5): p. 738-742.
32. McHorney, C.A. and A.S. Cohen, Equating Health Status Measures with Item Response Theory: Illustrations with Functional Status Items. Medical Care, 2000. 38(9): p. II43-II59.
33. Folstein, M.F., S.E. Folstein, and P.R. McHugh, "Mini-mental state". A practical method for grading the cognitive state of patients for the clinician. Journal of Psychiatric Research, 1975. 12(3): p. 189-98.
34. Strobel, C. and K. Engedal, MMSE-NR Norsk revidert Mini Mental Status Evaluering (In Norwegian). 2008.
35. Morris, J.N., et al., MDS Cognitive Performance Scale. Journal of Gerontology, 1994. 49(4): p. M174-82.
36. Nordberg, G., et al., Time use and costs of institutionalised elderly persons with or without dementia: results from the Nordanstig cohort in the Kungsholmen Project--a population based study in Sweden. International Journal of Geriatric Psychiatry, 2007. 22(7): p. 639-48.

50
37. Blomgren, J., et al., Determinants of home-based formal help in community-dwelling older people in Finland. European Journal of Ageing, 2008. 5(4): p. 335-347.
38. Lindholm, C., et al., Costs explained by function rather than diagnosis—results from the SNAC Nordanstig elderly cohort in Sweden. International Journal of Geriatric Psychiatry, 2012. 28(5): p. 454-462.
39. Tombaugh, T.N. and N.J. McIntyre, The mini-mental state examination: a comprehensive review. J Am Geriatr Soc, 1992. 40(9): p. 922-35.
40. CMS. MDS 3.0 Training Materials. (25.01.2012); Available from: https://www.cms.gov/NursingHomeQualityInits/45_NHQIMDS30TrainingMaterials.asp#TopOfPage.
41. Arling, G. and A.R. Williams, Cognitive impairment and resource use of nursing home residents: a structural equation model. Medical Care, 2003. 41(7): p. 802-12.
42. Landi, F., et al., Minimum data set for home care: a valid instrument to assess frail older people living in the community. Medical Care, 2000. 38(12): p. 1184-90.
43. Morris, J.N., et al., Designing the national resident assessment instrument for nursing homes. The Gerontologist, 1990. 30(3): p. 293-307.
44. Morris, J.N., et al., Outcome Measures for use with home care clients. Canadian Journal on Aging, 2000. 19: p. 87-105.
45. Fries, B.E., Comparing case-mix systems for nursing home payment. Health Care Financing Review, 1990. 11(4): p. 103-19.
46. Björkgren, M., RUG-III-baserade ersättningssystem för äldrevården (In Swedish), in Rapporter och artiklar. 2004, Chydenius institutet - Karleby universitetscenter: Karleby.
47. Medicare&Medicaid. Available from: http://www.cms.gov/. 48. Bjorkgren, M.A., B.E. Fries, and L.R. Shugarman, A RUG-III Case-Mix System for Home
Care. Canadian journal on aging, 2000. 19: p. 106-125. 49. Poss, J.W., et al., Validation of Resource Utilization Groups version III for Home Care
(RUG-III/HC): evidence from a Canadian home care jurisdiction. Medical Care, 2008. 46(4): p. 380-7.
50. Granger, C.V., et al., Advances in functional assessment for medical rehabilitation. Topics in Geriatric Rehabilitation, 1986. 1(3): p. 59-74.
51. Cohen, M.E. and R.J. Marino, The tools of disability outcomes research functional status measures. Arch Phys Med Rehabil, 2000. 81(12 Suppl 2): p. S21-9.
52. Haley, S.M., et al., Activity Outcome Measurement for Postacute Care. Medical Care, 2004. 42(1): p. I-49.
53. Haley, S.M., et al., Short-form activity measure for post-acute care. Arch Phys Med Rehabil, 2004. 85(4): p. 649-60.
54. Collin, C., et al., The Barthel ADL Index: a reliability study. International Disability Studies, 1988. 10(2): p. 61-3.
55. Der Wiel, A.B.-v., et al., Disability in the Oldest Old: “Can Do” or “Do Do”? Journal of the American Geriatrics Society, 2001. 49(7): p. 909-914.
56. Reuben, D.B., et al., Measuring physical function in community-dwelling older persons: a comparison of self-administered, interviewer-administered, and performance-based measures. Journal of the American Geriatrics Society, 1995. 43(1): p. 17-23.
57. Wijlhuizen, G.J., Measuring disability, the agreement between self evaluation and observation of performance. Disability and Rehabilitation, 1999. 21(2): p. 61-67.
58. Fillenbaum, G.G., Screening the elderly. A brief instrumental activities of daily living measure. Journal of the American Geriatrics Society, 1985. 33(10): p. 698-706.
51
59. Hebert, R., R. Carrier, and A. Bilodeau, The Functional Autonomy Measurement System (SMAF): description and validation of an instrument for the measurement of handicaps. Age and Ageing, 1988. 17(5): p. 293-302.
60. Fries, B.E., et al., Refining a case-mix measure for nursing homes: Resource Utilization Groups (RUG-III). Medical Care, 1994. 32(7): p. 668-85.
61. Meinow, B., I. Kåreholt, and M. Lagergren, According to need? Predicting the amount of municipal home help allocated to elderly recipients in an urban area of Sweden. Health and Social Care in the Community, 2005. 13(4): p. 366-377.
62. OECD, Handbook on Constructing Composite Indicators. Methodology and user guide. 2008, OECD.
63. Thomas, V.S., K. Rockwood, and I. McDowell, Multidimensionality in Instrumental and Basic Activities of Daily Living. Journal of Clinical Epidemiology, 1998. 51(4): p. 315-321.
64. Spector, W.D. and J.A. Fleishman, Combining activities of daily living with instrumental activities of daily living to measure functional disability. J Gerontol B Psychol Sci Soc Sci, 1998. 53(1): p. S46-57.
65. Cabrero-Garcia, J. and J.A. Lopez-Pina, Aggregated measures of functional disability in a nationally representative sample of disabled people: analysis of dimensionality according to gender and severity of disability. Quality of Life Research, 2008. 17(3): p. 425-36.
66. Ng, T.-P., et al., Physical and Cognitive Domains of the Instrumental Activities of Daily Living: Validation in a Multiethnic Population of Asian Older Adults. The Journals of Gerontology Series A: Biological Sciences and Medical Sciences, 2006. 61(7): p. 726-735.
67. Leung, D.Y.P., A.Y.M. Leung, and I. Chi, An Evaluation of the Factor Structure of the Instrumental Activities of Daily Living Involvement and Capacity Scales of the Minimum Data Set for Home Care for Elderly Chinese Community Dwellers in Hong Kong. Home Health Care Services Quarterly, 2011. 30(3): p. 147-159.
68. Linacre, J.M., et al., The structure and stability of the Functional Independence Measure. Arch Phys Med Rehabil, 1994. 75(2): p. 127-32.
69. Stineman, M.G., et al., Impairment-specific dimensions within the Functional Independence Measure. Arch Phys Med Rehabil, 1997. 78(6): p. 636-43.
70. Boaz, R.F. and J. Hu, Determining the amount of help used by disabled elderly persons at home: The role of coping resources. The Journal of Gerontology: Social Sciences, 1997. 52(6): p. S317-S324.
71. Kadushin, G., Home health care utilization: a review of the research for social work. Health & social work, 2004. 29(3): p. 219-244.
72. Hayward, L.M., et al., Publicly funded and family-friend care in the case of long-term illness: The role of the Spouse. Canadian journal on aging, 2004. 23(5): p. S39-S48.
73. Hammar, T., P. Rissanen, and M.-L. Perälä, Home-care clients’ need for help, and use and costs of services. European Journal of Ageing, 2008. 5(2): p. 147-160.
74. de Meijer, C.A., et al., The role of disability in explaining long-term care utilization. Medical Care, 2009. 47(11): p. 1156-63.
75. Larsson, K., M. Thorslund, and I. Kåreholt, Are public care and services for older people targeted according to need? Applying the Behavioural Model on longitudinal data of a Swedish urban older population. European Journal of Ageing, 2006. 3(1): p. 22-33.
76. Sigurdardottir, S.H., et al., Needs and care of older people living at home in Iceland. Scandinavian Journal of Public Health, 2012. 40(1): p. 1-9.

52
77. Stoddart, H., et al., What determines the use of home care services by elderly people? Health and Social Care in the Community, 2002. 10(5): p. 348-360.
78. Larsson, K. and M. Thorslund, Does gender matter? Differences in patterns of informal support and formal services in a Swedish urban elderly population. Research on Aging, 2002. 24(3): p. 308-336.
79. Roelands, M., et al., Are cognitive impairment and depressive mood associated with increased service utilisation in community-dwelling elderly people? Health and Social Care in the Community, 2003. 11(1): p. 1-9.
80. Algera, M., et al., Home care needs of patients with long term conditions: literature review. Journal of Advanced Nursing, 2004. 46(4): p. 417-429.
81. Sævareid, H.I., et al., Association between self reported care needs and the allocation of care in Norwegian home nursing care recipients. International Journal of Older People Nursing, 2012. 7(1): p. 20-28.
82. Rodríguez, M., Use of informal and formal care among community dwelling dependent elderly in Spain. European Journal of Public Health, 2013. 24(4): p. 668-73.
83. Larsson, K. and M. Silverstein, The effects of marital and parental status on informal support and service utilization: A study of older Swedes living alone. Journal of Aging Studies, 2004. 18(2): p. 231-244.
84. Garatachea, N., et al., Feelings of well being in elderly people: Relationship to physical activity and physical function. Archives of Gerontology and Geriatrics, 2009. 48(3): p. 306-312.
85. Yang, Y. and L.K. George, Functional disability, disability transitions, and depressive symptoms in late life. J Aging Health, 2005. 17(3): p. 263-92.
86. OECD, Long-term care expenditure, in Health at a Glance 2011: OECD Indicators. 2011, OECD Publishing. p. 161-177.
87. Viitanen, T.K., Informal and formal care in Europe. 2007, IZA Discussion Papers No. 2648.
88. Bolin, K., B. Lindgren, and P. Lundborg, Informal and formal care among single-living elderly in Europe. Health Economics, 2008. 17(3): p. 393-409.
89. Gaugler, J.E., et al., Predicting nursing home admission in the U.S: a meta-analysis. BMC Geriatr, 2007. 7: p. 13.
90. Luppa, M., et al., Prediction of institutionalisation in dementia. A systematic review. Dement Geriatr Cogn Disord, 2008. 26(1): p. 65-78.
91. Luppa, M., et al., Prediction of institutionalization in the elderly. A systematic review. Age and Ageing, 2010. 39(1): p. 31-8.
92. Bravell, M.E., et al., Sooner or later? A study of institutionalization in late life. Aging Clin Exp Res, 2009. 21(4-5): p. 329-37.
93. Coughlin, T.A., T.D. McBride, and K. Liu, Determinants of transitory and permanent nursing home admissions. Medical Care, 1990. 28(7): p. 616-31.
94. Luppa, M., et al., Gender differences in predictors of nursing home placement in the elderly: a systematic review. International Psychogeriatrics, 2009. 21(6): p. 1015-25.
95. Bjorkgren, M.A., et al., Validity and reliability of Resource Utilization Groups (RUG-III) in Finnish long-term care facilities. Scandinavian Journal of Public Health, 1999. 27(3): p. 228-34.
96. Brizioli, E., et al., Nursing home case-mix instruments: validation of the RUG-III system in Italy. Aging Clinical and Experimental Research, 2003. 15(3): p. 243-53.
97. Carpenter, I., et al., Identification of registered nursing care of residents in English nursing homes using the Minimum Data Set Resident Assessment Instrument

53
(MDS/RAI) and Resource Utilisation Groups version III (RUG-III). Age and Ageing, 2003. 32(3): p. 279-85.
98. Fries, B.E., et al., Mental dysfunction and resource use in nursing homes. Medical Care, 1993. 31(10): p. 898-920.
99. Arling, G., et al., Explaining direct care resource use of nursing home residents: findings from time studies in four states. Health Services Research, 2007. 42(2): p. 827-46.
100. Bruininks, R.H., et al., Examiner's manual. ICAP: Inventory for Client and Agency Planning. DLM Teaching Resources. 1986, Allen, TX.
101. Comas Herrera, A., et al., Benefit groups and resource groups for adults with intellectual disabilities in residential accommodation. Journal of Applied Research in Intellectual Disabilities, 2001. 14(2): p. 120-140.
102. Rojahn, J., et al., The Behavior Problems Inventory: An instrument for the assessment of self-injury, stereotyped behavior, and aggression/destruction in individuals with developmental disabilities. Journal of Autism and Developmental Disorders, 2001. 31(6): p. 577-588.
103. Hallam, A., et al., Costs of village community, residential campus and dispersed housing provision for people with intellectual disability. Journal of Intellectual Disability Research, 2002. 46(Pt 5): p. 394-404.
104. Campbell, E.M., et al., Predictors of expenditures in western states, in Costs and outcomes of community services for people with intellectual disabilities, R.J. Stancliffe and K.C. Lakin, Editors. 2004, Brookes: Baltimore, Md. p. 175-201.
105. Knapp, M., et al., Intellectual disability, challenging behaviour and cost in care accommodation: what are the links? Health and Social Care in the Community, 2005. 13(4): p. 297-306.
106. Rhoades, J.A. and B.M. Altman, Personal Characteristics and Contextual Factors Associated With Residential Expenditures for Individuals With Mental Retardation. Mental Retardation, 2001. 39(2): p. 114-129.
107. Kottorp, A., B. Bernspång, and A.G. Fisher, Activities of daily living in persons with intellectual disability: Strengths and limitations in specific motor and process skills. Australian Occupational Therapy Journal, 2003. 50(4): p. 195-204.
108. Hällgren, M. and A. Kottorp, Effects of occupational therapy intervention on activities of daily living and awareness of disability in persons with intellectual disabilities. Australian Occupational Therapy Journal, 2005. 52(4): p. 350-359.
109. Thomson, S.T., Predicting support needs for people with psychiatric and intellectual disabilities. 2008.
110. Maenner, M.J., et al., Evaluation of an activities of daily living scale for adolescents and adults with developmental disabilities. Disability and Health Journal, 2012.
111. Genet, N., et al., Home care in Europe: a systematic literature review. BMC Health Services Research, 2011. 11: p. 207.
112. Williams, B.C., et al., Activities of daily living and costs in nursing homes. Health Care Financing Review, 1994. 15(4): p. 117-35.
113. Cuellar, A.E. and J.M. Wiener, Can social insurance for long-term care work? The experience of Germany. Health Affairs, 2000. 19(3): p. 8-25.
114. Tsutsui, T. and N. Muramatsu, Care-needs certification in the long-term care insurance system of Japan. Journal of the American Geriatrics Society, 2005. 53(3): p. 522-7.
115. Mitchell, O.S., J. Piggott, and S. Shimizutani, Aged-care support in Japan: perspectives and challenges. Benefits Quarterly, 2006. 22(1): p. 7-18.

54
116. Gustavsson, A., et al., Differences in resource use and costs of dementia care between European countries: baseline data from the ICTUS study. J Nutr Health Aging, 2010. 14(8): p. 648-54.
117. Ministry of Health and Care Services, Forskrift om egenandel for kommunale helse- og omsorgstjenester (In Norwegian). 2012.
118. Norwegian tax administration, National Insurance scheme basic amount. 2014. 119. Statistics Norway. StatBank Kostra. 2014; Available from:
https://www.ssb.no/statistikkbanken/selecttable/hovedtabellHjem.asp?KortNavnWeb=pleie&CMSSubjectArea=helse&PLanguage=1&checked=true.
120. Lines, K., Management information systems in health care: politics and the dynamics of legitimacy. Vol. nr 37. 2007, Steinkjer: Høgskolen i Nord-Trøndelag. XII, 271 s.
121. Hofstad, T., Som å ta øynene fra oss. 2009, Cobenhagen business school. 122. Norwegian Directorate of health and social affairs, Felles forståelse-individuell
registrering; Veileder (in Norwegian). 2003. 123. Norwegian Directorate of Health, IPLOS - Veileder for helsepersonell i kommunale
helse- og sosialtjenester (in Norwegian), ed. Helsedirektoratet. 2009, Oslo: Norwegian Directorate of Health,.
124. Rankin, J., Cerebral vascular accidents in patients over the age of 60. II. Prognosis. Scottish Medical Journal, 1957. 2(5): p. 200-15.
125. van Swieten, J.C., et al., Interobserver agreement for the assessment of handicap in stroke patients. Stroke, 1988. 19(5): p. 604-7.
126. Doherty, D.E., et al., Chronic Obstructive Pulmonary Disease. Journal of Family Practice, 2006. 55(11): p. S1-S8.
127. Lai, S.M., et al., Physical and social functioning after stroke: comparison of the Stroke Impact Scale and Short Form-36. Stroke, 2003. 34(2): p. 488-93.
128. Meguro, M., et al., Development and Validation of an Improved, COPD-Specific Version of the St. George Respiratory Questionnaire. Chest, 2007. 132(2): p. 456-63.
129. Maes, S., et al., Is the MacNew quality of life questionnaire a useful diagnostic and evaluation instrument for cardiac rehabilitation? Eur J Cardiovasc Prev Rehabil, 2008. 15(5): p. 516-20.
130. Remme, W.J. and K. Swedberg, Guidelines for the diagnosis and treatment of chronic heart failure. European Heart Journal, 2001. 22(17): p. 1527-60.
131. Norwegian Directorate of Health, Individbasert pleie- og omsorgsstatistikk (IPLOS) i kostra - Forslag til informasjonssystem for pleie- og omsorgstjenesten (in Norwegian). 2000, Helsedirektoratet.
132. Selbæk, G. and L.D. Høgset, IPLOS og kartlegging av tjenestebehov hos hjemmeboende med kognitiv svikt (in Norwegian). 2010, Alderspsykiatrisk senter Sykehuset Innlandet HF
133. Hughes, C.P., et al., A new clinical scale for the staging of dementia. Br J Psychiatry, 1982. 140: p. 566-72.
134. Cummings, J.L., et al., The Neuropsychiatric Inventory: comprehensive assessment of psychopathology in dementia. Neurology, 1994. 44(12): p. 2308-14.
135. LeBreton, J.M. and J.L. Senter, Answers to 20 Questions About Interrater Reliability and Interrater Agreement. organizational research methods, 2008. 11(4): p. 815-852.
136. Kottner, J., et al., Guidelines for Reporting Reliability and Agreement Studies (GRRAS) were proposed. International Journal of Nursing Studies, 2011.

55
137. Hawes, C., et al., Reliability estimates for the Minimum Data Set for nursing home resident assessment and care screening (MDS). The Gerontologist, 1995. 35(2): p. 172-8.
138. Fricke, J. and C.A. Unsworth, Inter-rater reliability of the original and modified Barthel Index, and a comparison with the Functional Independence Measure. Australian Occupational Therapy Journal, 1997. 44(1): p. 22-29.
139. Tong, A.Y.C. and D.W.K. Man, The validation of the Hong Kong Chinese version of the Lawton Instrumental activities of daily living scale for institutionalized elderly persons. OTJR, 2002. 22(4): p. 132-132.
140. Trondheim Kommune, Rutiner ved registrering av ADL ferdigheter (unpublished) (In Norwegian). 2008.
141. Shrout, P.E. and J.L. Fleiss, Intraclass correlations: uses in assessing rater reliability. Psychological Bulletin, 1979. 86(2): p. 420-8.
142. LeBreton, J.M., et al., The restriction of variance hypothesis and interrater reliability and agreement: Are ratings from multiple sources really dissimilar? Organizational research methods, 2003. 6(1): p. 80-12.
143. Fleiss, J.L., The design and analysis of clinical experiments. 1986, New York: Wiley. xiv, 432 s.
144. Finn, R.H., A note on estimating the reliability of categorical data. Educational and psychological measurement, 1970. 30(1): p. 71-76.
145. James, L.R., R.G. Demaree, and G. Wolf, Estimating within-group interrater reliability with and without response bias. Journal of Applied Psychology, 1984. 69(1): p. 85-98.
146. Lindell, M.K., C.J. Brandt, and D.J. Whitney, A revised index of interrater agreement for multi-item ratings of a single target. Applied Psychological Measurement, 1999. 23(2): p. 127-135.
147. Hawes, C., et al., MDS data should be used for research. The Gerontologist, 1992. 32(4): p. 563-564.
148. Hallem, U.L., J. Bjerkan, and H.V. Brataas, IPLOS som sykepleiefaglig vurderingsverktøy: behov for og nytte av kompetansehevende utviklingsarbeid (In Norwegian), in Rapport nr. 80. 2012: The Nord-Trøndelag University College.
149. Tabachnick, B.G. and L.S. Fidell, Using multivariate statistics. 2013, Boston: Pearson. XXXI, 983 s. : ill.
150. Osborne, J.W., A.B. Costello, and T.J. Kellow, Best practices in exploratory factor analysis, in Best practices in quantitative methods, J.W. Osborne, Editor. 2008, SAGE Publications: Thousand Oaks, Calif.
151. Kline, R., Exploratory and Confirmatory Factor Analysis, in Applied Quantitative Analysis in the Social Sciences, Y. Petscher, C. Schatschneider, and D.L. Compton, Editors. 2013, Taylor and Francis: Hoboken. p. 171.
152. Coenders, G. and W.E. Saris, Categorization and measurement quality. The choice between Pearson and Polychoric correlations, in The multitrait-multimethod approach to evaluate measurement instruments, W.E. Saris and A. Münich, Editors. 1995: Budapest, Eötvös University Press. p. 125-144.
153. Dolan, C.V., Factor analysis of variables with 2, 3, 5 and 7 response categories: A comparison of categorical variable estimators using simulated data. British Journal of Mathematical and Statistical Psychology, 1994. 47(2): p. 309-326.
154. Holgado–Tello, F.P., et al., Polychoric versus Pearson correlations in exploratory and confirmatory factor analysis of ordinal variables. Quality & Quantity, 2010. 44(1): p. 153-166.

56
155. Hayton, J.C., D.G. Allen, and V. Scarpello, Factor retention decisions in exploratory factor analysis: A tutorial on parallel analysis. Organizational Research Methods, 2004. 7(2): p. 191-205.
156. Mulaik, S.A., Foundations of factor analysis. 2009, Boca Raton, FL: Chapman & Hall/CRC. XXIII, 524 s. : ill.
157. Hurley, A.E., et al., Exploratory and confirmatory factor analysis: Guidelines, issues, and alternatives. Journal of organizational behavior, 1997. 18(6): p. 667-683.
158. Twisk, J.W.R., Applied longitudinal data analysis for epidemiology: a practical guide. 2003, Cambridge, UK: Cambridge University Press. xvi, 301 s. : ill.
159. Twisk, J.W.R., Applied Multilevel Analysis. 2006: Cambridge University Press. 160. White, H., A heteroskedasticity-consistent covariance matrix estimator and a direct test
for heteroskedasticity. Econometrica: Journal of the Econometric Society, 1980: p. 817-838.
161. Kennedy, P.E., Estimation with Correctly Interpreted Dummy Variables in Semilogarithmic Equations. The American Economic Review, 1981. 71(4): p. 801.
162. Jan van Garderen, K. and C. Shah, Exact interpretation of dummy variables in semilogarithmic equations. The Econometrics Journal, 2002. 5(1): p. 149-159.
163. Døhl, Ø. and J. Larsson, Faste versus stokastiske heterogenitetskoeffisienter i ubalansert datasett ved analyse av teknologiforskjeller mellom bedrifter, in Reports. 2001, Statistics Norway: Oslo.
164. DeMars, C., Item Response Theory. 2010, Oxford: Oxford University Press, USA. 1 online resource (138 s.).
165. Bond, T.G. and C.M. Fox, Applying the Rasch model: fundamental measurement in the human sciences. 2012, New York: Routledge. xvi, 340 s. : ill.
166. Wolfe, F. and S.X. Kong, Rasch analysis of the Western Ontario MacMaster questionnaire (WOMAC) in 2205 patients with osteoarthritis, rheumatoid arthritis, and fibromyalgia. Annals of the rheumatic diseases, 1999. 58(9): p. 563-568.
167. Jackson, T.R., et al., Validation of authentic performance assessment: a process suited for Rasch modeling. American Journal of Pharmaceutical Education, 2002. 66(3): p. 233-242.
168. Fieo, R.A., et al., Calibrating ADL-IADL scales to improve measurement accuracy and to extend the disability construct into the preclinical range: a systematic review. BMC Geriatr, 2011. 11: p. 42.
169. Norstrom, T. and M. Thorslund, The structure of IADL and ADL measures: some findings from a Swedish study. Age and Ageing, 1991. 20(1): p. 23-8.
170. Finlayson, M., T. Mallinson, and V.M. Barbosa, Activities of daily living (ADL) and instrumental activities of daily living (IADL) items were stable over time in a longitudinal study on aging. J Clin Epidemiol, 2005. 58(4): p. 338-49.
171. Marengoni, A., et al., Aging with multimorbidity: A systematic review of the literature. Ageing Research Reviews, 2011. 10(4): p. 430-439.
172. Strand, B.H., et al., Hvor mange har demens i Norge? Tidsskr Nor Laegeforen, 2014. 134(3): p. 276-7.
173. Ferri, C.P., et al., Global prevalence of dementia: a Delphi consensus study. Lancet, 2005. 366(9503): p. 2112-2117.
174. Krishnamoorthy, A. and D. Anderson, Managing challenging behaviour in older adults with dementia. Progress in Neurology and Psychiatry, 2011. 15(3): p. 20-26.
175. NRK, Pleiere frykter voldelige demente, in NRK. 2009.

57
176. Pulsford, D. and J. Duxbury, Aggressive behaviour by people with dementia in residential care settings: a review. Journal of psychiatric and mental health nursing, 2006. 13(5): p. 611-618.
177. Ministry of Health and Care Services, St. meld. nr. 50 Handlingsplan for eldreomsorgen (1996-97) (In Norwegian). 1997: Oslo.
178. Farsi, M., M. Filippini, and D. Lunati, Economies of scale and efficiency measurement in Switzerland's Nursing homes. Schweizerische Zeitschrift für Volkswirtschaft und Statistik, 2008. 144(3): p. 359.
179. Stancliffe, R.J. and K.C. Lakin, Costs and outcomes of community services for people with intellectual disabilities. 2004, Baltimore, Md.: Brookes. XXX, 346 s. : ill.

58
Appendix - Variable list Variabel Norwegian Variable English
1. Spise Har behov for bistand/assistanse til å innta servert mat og å drikke. Eating Needs assistance to eat served food
and drinks
2. På og avkledning
Har behov for bistand/assistanse til å ta og av seg klær og fottøy finne fram og velge i overensstemmelse med årstid, vær og temperatur.
Dressing/undressing
Needs assistance to dress/undress clothes and shoes, and to choose appropriate clothing etc. according to season, weather and temperature.
3. Personlig hygiene
Har behov for bistand/assistanse til å vaske og stelle hele kroppen inkl. pusse tenner/munnhygiene.
Personal hygiene
Needs assistance to clean the whole body, including brushing the teeth.
4. Toalett Har behov for bistand/assistanse til å utføre toalettbesøk/-funksjoner.
Using the toilet Needs assistance with toileting
5. Bevege seg innendørs
Har behov for bistand/assistanse til å gå, bevege eller forflytte seg på ett plan innendørs; på flatt gulv, over terskler, ut og inn av seng, opp og ned av stol. Trapper innendørs er ikke med.
Indoor mobility
Needs assistance to move around on one floor (internal stairs not included). Crossing doorsteps, getting, inn and out of bed / chair.
6. Bevege seg utendørs
Har behov for bistand/assistanse til å gå, bevege eller forflytte seg utenfor egen bolig, opp og ned
trapper, fortauskanter, på ujevne underlag mv. Med utenfor egen bolig menes her alt utenfor egen inngangsdør. Trappeoppganger og trapper ute er utendørs.
Outdoor mobility
Needs assistance to move around outside own residence. Getting up and down stairs, curb stones, uneven surfaces etc. This includes everything outside ones own front door.
7. Lage mat
Har behov for bistand/assistanse til å planlegge, organisere og tilberede enkel og sammensatte
måltider, skjære opp maten, smøre brødskiver og tilberede annen tørrmat, varme opp mat og lage kaffe og te.
Cooking Needs assistance to plan, prepare and cook cold and hot meals and drinks.
8. Alminnelig husarbeid
Har behov for bistand/assistanse til å utføre vanlig husarbeid som å gjøre rent, vaske klær, bruke husholdningsapparater, lagre matvarer og kaste avfall.
House keeping
Needs assistance to perform ordinary housework like cleaning, the use of home appliances, store groceries and get rid of rubbish.
9. Skaffe seg varer og tjenester
Har behov for bistand/assistanse til å skaffe seg varer som mat/drikke, klær/sko, husholdningsartikler, tekniske tjenester og husholdningstjenester, som er nødvendige og relevante i dagliglivet. (Enten via internett / telefon eller direkte i butikk.)
Shopping
Needs assistance with shopping for example food/drink, clothes/shoes, household goods, services etc. necessary to live independently (Either bought in a shop, by phone or on the internet)
10. Ivareta egen helse Har behov for bistand/assistanse til å
håndtere egen sykdom, skade eller
Maintaining own health
Needs assistance to deal with own sickness, disease, injury or disability, to contact a doctor or other relevant

59
funksjonsnedsettelse,
til å ta kontakt med behandlingsapparatet når symptomer eller skade oppstår, følge behandlings- opplegg og håndtere egne medisiner.
health personnel. Needs assistance to take responsibility for following recommended treatment regimes and to manage ones own medication.
11. Kommunikasjon
Har behov for bistand/assistanse til å kommunisere med andre personer. Med kommunikasjon menes å forstå og uttrykke seg verbalt/nonverbalt, evt. ved bruk av kommunikasjonsutstyr, tolk og teknikker.
Communication
Needs assistance to communicate with other people. By communication means ability to comprehend and express one selves, both verbal and nonverbal. If needed be by the use of technical equipment.
12. Sosial deltakelse
Har behov for bistand/assistanse til å styrke og opprettholde et sosialt nettverk, ha/ta kontakt med familie, venner, kolleger og personer i nærmiljøet.
Social interaction
Needs assistance to maintain a social life, to maintain contact with family, friends, colleagues and other relevant persons.
13. Beslutninger i dagliglivet
Har behov for bistand/assistanse til å ta avgjørelser og organisere daglige gjøremål, gjøre valg mellom alternativer, disponere tiden gjøremålene tar og integrere uforutsette hendelser.
Daily decision taking
Needs assistance to make everyday decisions and to organise their lives, make choices and administrate their own time.
14. Hukommelse
Har behov for bistand/assistanse til å huske nylig inntrufne hendelser, finne fram i kjente omgivelser, være orientert for tid og sted, gjenkjenne kjente personer, huske avtaler og viktige hendelser den siste uken.
Memory
Needs assistance to memorise recent events, recognize well-known places, to be orientated for time and space, recall appointments and important episodes during the preceding week.
15. Styre adferd
Har behov for bistand/assistanse til å styre egen atferd. Med dette menes å ha kontroll over impulser, verbal og fysisk aggresjon over for seg selv og andre.
Behavioural control
Needs assistance to maintain own behavioural manners. Having control with verbal and physical impulses and aggression towards ones self and towards others.


Paper I - III


Paper I

RESEARCH ARTICLE Open Access
Variations in levels of care between nursinghome patients in a public health care systemØystein Døhl1,2*, Helge Garåsen1,2, Jorid Kalseth1,3 and Jon Magnussen1
Abstract
Background: Within the setting of a public health service we analyse the distribution of resources betweenindividuals in nursing homes funded by global budgets. Three questions are pursued. Firstly, whether there aresystematic variations between nursing homes in the level of care given to patients. Secondly, whether suchvariations can be explained by nursing home characteristics. And thirdly, how individual need-related variablesare associated with differences in the level of care given.
Methods: The study included 1204 residents in 35 nursing homes and extra care sheltered housing facilities.Direct time spent with patients was recorded. In average each patient received 14.8 hours direct care each week.Multilevel regression analysis is used to analyse the relationship between individual characteristics, nursing homecharacteristics and time spent with patients in nursing homes. The study setting is the city of Trondheim, with apopulation of approximately 180 000.
Results: There are large variations between nursing homes in the total amount of individual care given to patients.As much as 24 percent of the variation of individual care between patients could be explained by variationbetween nursing homes. Adjusting for structural nursing home characteristics did not substantially reduce thevariation between nursing homes. As expected a negative association was found between individual care andcase-mix, implying that at nursing home level a more resource demanding case-mix is compensated by lowering theaverage amount of care. At individual level ADL-disability is the strongest predictor for use of resources in nursinghomes. For the average user one point increase in ADL-disability increases the use of resources with 27 percent.
Conclusion: In a financial reimbursement model for nursing homes with no adjustment for case-mix, the amount of carepatients receive does not solely depend on the patients’ own needs, but also on the needs of all the other residents.
Keywords: Nursing home, Care level, ADL, IADL, Cognitive impairment, Multi level analysis
BackgroundWithin the OECD area long term care (LTC) costs haverisen steadily in the past 10–15 years. This growth is ex-pected to continue and, on average, public spending onLTC could almost double across OECD countries by 2050[1]. LTC is provided in nursing homes or as home care,but in most OECD countries nursing home is the domin-ant form of provision [2]. Cognitive impairment and phys-ical disabilities as well as prior nursing home use arestrong predictors of nursing home admission [3].
Several instruments are available to assess level of disabil-ity and by extension the level of care need in individualLTC patients [4-7]. Based on these assessment instruments,case mix systems for nursing homes have been developed[8]. They are used as a base for provider payment, mainlyin the US, but also in some countries in Europe [9]. How-ever, the dominant form of provider payment in Europe is amixture of global budgets, patient co-payment and perdiem financing without any specific case-mix adjust-ment [2]. To what extent this leads to a situationwhereby individuals with the same level of need receivedifferent care has, to our knowledge, not been analysedin a public health care setting.In this paper we utilise a data set of individually received
direct care in nursing homes, combined with a national
* Correspondence: [email protected] of Public Health and General Practice, Norwegian University ofScience and Technology, P.O. Box 8905 MTFS, N-7491 Trondheim, Norway2Department of Health and Welfare Services, City of Trondheim, Trondheim,NorwayFull list of author information is available at the end of the article
© 2014 Døhl et al.; licensee BioMed Central Ltd. This is an Open Access article distributed under the terms of the CreativeCommons Attribution License (http://creativecommons.org/licenses/by/2.0), which permits unrestricted use, distribution, andreproduction in any medium, provided the original work is properly credited. The Creative Commons Public DomainDedication waiver (http://creativecommons.org/publicdomain/zero/1.0/) applies to the data made available in this article,unless otherwise stated.
Døhl et al. BMC Health Services Research 2014, 14:108http://www.biomedcentral.com/1472-6963/14/108

instrument that describes physical disability and cognitiveimpairments of patients. We use these to pursue threequestions: Firstly; to what extent are there systematic vari-ations between nursing homes as to the level of care givento individuals with presumably similar needs. Secondly,can nursing-home level variations be explained by struc-tural nursing home characteristics? And thirdly, how areneed-related variables at individual level related to differ-ences in the level of care given?
Institutional setting and study areaIn Norway LTC is an integral part of the welfare system,and is provided in a predominantly public and tax basedhealth care system. Approximately 14 percent of thepopulation 80 years or older live in nursing homes [10].In the Nordic tradition responsibility for long-term-careis devolved to multi-purpose local authorities. These willboth finance and operate LTC services, with some finan-cial contribution from service recipients. There are nonational standards (norms) for long term care, and grossper capita expenditure varies substantially between mu-nicipalities [10]. While this in part will reflect differencesin demographical composition, variations are also likelyto be the result of differences in both municipal incomeand local political prioritizing. Differences in expend-iture (costs per capita) will be due to differences in ac-cess (recipients per capita) or the amount of care given(costs per case). To avoid confusing different levels ofcare with different prioritization between local author-ities we have limited our analyses to nursing homes inone municipality; the city of Trondheim with 180.000inhabitants. At the time of the study the municipalityhad 197 beds per 1000 person 80+, which was slightlyabove the national average at 193 [10].Long term care may be provided at home or in an in-
stitution. The decision to admit an individual to a nurs-ing home will be based on the municipality’s assessmentof their needs. In Trondheim the assessment is done byan independent office and patients are allocated to eachnursing home based on the availability of beds. Thus anursing home can not select its own case-mix. Individ-ual patient-level data used in this analysis are from 2004;at that time all nursing homes in Trondheim were fi-nanced by global budgets based on the number of pa-tients and wards, with no adjustment for case-mix. Thusa nursing home would receive a budget that would cover3.9 full time equivalents (FTE) per ward and 0.5 FTE perresident. The cost of a FTE included the average cost ofa man year plus substitutes at holidays and sick leaves.In addition costs of night-watch and administration wereincluded in the budget. Other operating expenses werebased on a rate per resident. Financial contributionsfrom the nursing home residents were collected by themunicipality and are not part of nursing home incomes.
However, the financial contributions do partly financethe overall municipal budget for nursing home care.This model is still the most common model used for fi-nancing nursing homes in Norway. Notably Trondheimchanged its financial model after the time study; nearly45 percent of labour related costs are now distributeddepending on differences in individual ADL and IADLdisability and cognitive impairment.
MethodsNursing home characteristicsThe study includes 35 residential facilities. There aretwo types of residential facilities, “traditional” nursinghomes and extra care sheltered housing. In extra caresheltered housing, residents live in facilities defined astheir own private homes (paying their own rent) and re-ceive care according to their assessed needs. Nursingand care services in both types of facilities are financedby global budgets, using the model described above. Thelevel of care and nursing are considered as being equalin both facilities. There are some minor financial differ-ences related to other operational expenses like energy,medicine and medical equipment. For the purpose ofthis analysis these are however not of any consequence.Ten of the residential facilities in the study were extracare sheltered housing. The average size of the shelteredhousing was 16 residents (ranging from 6 to 29) com-pared to 41(ranging from 9 to 129) for nursing homes.In the reminder of the paper we use the term nursinghome for both types of residential facilities, if not statedotherwise. Rehabilitation and post-acute facilities werenot included in this study (Table 1).Although long term care is a public responsibility,
delivery may be by private non-profit organizations. Inour material five of the 35 nursing homes are private,non-profit making organizations. These private nurs-ing homes have contracts with the local authority andare obliged to deliver services at the same level of careand quality as in public nursing homes.Several studies have investigated the significance of
nursing home size on costs. Some findings indicate thatthere exists economics of scale, particularly for the smallestnursing homes [11]. Others have identified economic ofscale up to 75–95 beds [12]. In this study size was mea-sured as the inverse number of beds, thus allowing forpossible non-linearity.Some studies suggest a positive association between
both staffing levels, numbers of licensed nurses and thequality of care in nursing homes [13]. In this analysis weinclude skill mix as a possible explanatory factor. Whilethe total available amount of FTEs depends on the budget,the skill mix is under the discretion of each nursing home.Staff skill mix is characterized by two variables; the pro-portion of employees with health related college/university
Døhl et al. BMC Health Services Research 2014, 14:108 Page 2 of 10http://www.biomedcentral.com/1472-6963/14/108

degree and the proportion of employees with a healthrelated upper secondary education. A third group, em-ployees with no health related education serves as areference category.Case-mix was measured as average ADL-disability
score (see definition below) for all patients in eachnursing home.
Patient level dataWe utilised a standardised national registration system(IPLOS) [14] that describes patient needs, and com-bined this with a detailed time study of 1204 residentsin the 35 nursing homes and extra care sheltered hous-ing facilities.
The time studyThe time study was performed by employees in themunicipality of Trondheim in 2004. Nursing home staff
were asked to register only direct face to face time spentwith patients according to 16 different categories. Toensure reliability all of the personnel who were to regis-ter data were trained by a team from the municipalityprior to the registration. The training had both a theor-etical and a practical part. The training team was avail-able for questions during the registration period. Theregistration was done by personnel responsible for thepatients’ daily care. Direct care time for the all the staffwas registered. Two members of staff on each wardwere responsible for the registration, and did this to-gether with the personnel responsible for the patient.Time spent by the attending doctor is not included, onaverage this constituted about 0.2 hours per patient perweek included time to administration (personal com-munication with the chief doctor). For the purpose ofthis analysis we have grouped the 16 registration cat-egories into five separate main categories; personal care,
Table 1 Characteristics of study sample, nursing homes (N = 35) and residents (N = 1204)
Share% or average (sd)
Nursing home level data: Median Minimum Maximum Quartile 25 -75
Extra care sheltered housing 29%
Private ownership 14%
Nursing home size; beds 34.4 (30.7) 25.0 6 129 17 – 36
Staff skill mix - average proportion;
College/university degree 25% (10) 24% 8% 48% 16% - 31%
Upper secondary education 62% (13) 62% 27% 92% 51% - 70%
None health related education 14% (10) 12% 0% 56% 8% - 18%
Average case-mix; ADL - mobility 3.28 (0.43) 3.38 2.16 4.20 3.04 - 3.54
Residents level data:
Age:
<80 24%
80-89 49%
90+ 27%
Private care
None 66%
<3 hours 32%
3 < hours 3%
Disability score: Score 1–1.9 Score 2–2.9 Score 3–3.9 Score 4-5
ADL 3.35 (1.12) 13.0% 24.1% 26.1% 36.8%
IADL 4.51 (0.70) 0.7% 2.7% 11.6% 85.1%
Cognitive impairment 3.43 (0.95) 7.0% 23.3% 34.4% 35.3%
Vision & hearing 1.82 (0.79) 52.5% 33.7% 11.5% 2.2%
Diagnose:
Dementia/Alzheimer 42%
Stroke 17%
Diabetes 8%
Standard deviation-sd.
Døhl et al. BMC Health Services Research 2014, 14:108 Page 3 of 10http://www.biomedcentral.com/1472-6963/14/108

assistance with meals, communication, medical care andother care (Table 2). While our main focus is on varia-tions in and determinants of total individual care, allanalyses have also been done separately on personalcare and assistance with meals, which were the two lar-gest categories. The average amount of individual carewas 14.8 hours per week, with a standard deviation of6.9. In nursing homes the average amount of individualcare was 14.5 hours per week, with a standard deviationof 6.4. In sheltered housing the average amount of in-dividual care was 17.6 hours per week, with a standarddeviation of 9.8.
Disability dataIPLOS has several similarities with the Canadian SMAF[15]. IPLOS characterizes patient dependencies using 17variables. We have grouped these 17 variables into fourgroups based on a factor analysis (see Additional file 1).Activities of Daily Living - ADL (including mobility)comprise personal hygiene, dressing, eating, ease of usingthe toilet, indoor and outdoor mobility. InstrumentalActivities of Daily Living - IADL contains shopping,house-keeping and cooking. Cognitive impairment(including behavioural impairment) contains memory,communication, social interaction, daily decision taking,maintaining ones’ own health and behavioural control.The final group contains sight and hearing. In IPLOSpatients are described on a scale from one to five. Scoreone indicates no disability. Score two indicates somedifficulties performing the task or performing it withreduced quality, but without need for assistance. Scorethree or higher indicates an increased need for care. In
nursing home settings patients do not perform all taskseven if they are capable of doing so. This especially con-cern IADL tasks. All patients were scored according totheir potential capacity to perform the tasks.We also included additional individual characteristics.
Three age groups were used; below 80 years, between 80to 89 years and 90 years or older. Diagnosis was regis-tered for each patient according to ICPC code. The mostfrequently occurring diagnoses were Dementia/Alzheimer,Stroke and Diabetes. We also included the amount of in-formal care a patient received. The data from the mu-nicipality enabled us to separate between patients withno informal care, less than 3 hours per week and morethan 3 hours per week. All data was provided by themunicipality (Table 2).
Analytical methodsThe 17 variables were sorted into four groups based ona factor analysis. Principal axis factoring (PAF) was usedas the extraction method [16]. Kaizers normalization withcut-off at eigenvalues equal 1 was used together with ascree plot and parallel analysis to decide the number offactors to retain. Oblique rotation was used as rotationmethod (direct oblim with δ = 0). The results are shownin the Additional file 1. In the regression analysis a multi-level approach with random intercept was used. This al-lows us to determine to what extent variation in individualcare is due to nursing home factors and to what extent itis due to individual characteristics. We do not use randomslopes, thus the marginal effect of individual level variablesis assumed to be equal across nursing homes, althoughthe level of care may differ. Because of skewed distribution
Table 2 Distribution of individual care, hours per week, standard deviation (sd)
Activity Share Grouped activity (share) Average hours per week (sd)
Get out of bed - morning 16.4% Personal care (48%) 7.1 (4.2)
Go to bed - evening 10.9%
Resting – (in/out of bed. etc.) 5.7%
Shower. bath 3.8%
Toilet 10.9%
Eat breakfast 6.9% Assistance with meals (27%) 4.0 (2.9)
Eat dinner 7.6%
Have a cup of coffee or tea 5.6%
Eat supper 6.7%
Conversation with residents 10.6% Communication (12%) 1.8 (1.9)
Dialogue with relatives 1.6%
Administrating Medication 5.7% Medical care (8%) 1.2 (0.9)
Prepare pill dispenser/medication 2.2%
Cooperation with doctor 0.4%
Extra attention at night. dentist. hairdresser. pedicure etc. 4.9% Other care (5%) 0.7 (1.4)
Sum 100% Individual care (100%) 14.8 (6.9)
Døhl et al. BMC Health Services Research 2014, 14:108 Page 4 of 10http://www.biomedcentral.com/1472-6963/14/108

a natural logarithm was used to achieve an approximatelynormal distribution. We did separate analyses for the totalindividual care, personal care and assistance during meals.Three models were estimated. Model (1) is an emptymodel without any explanatory variables included.
In yij ¼ γ þ uj þ rij ð1Þ
Where:In yij – Individual care for a person i at nursing home
j, measured as logarithm number of hours per week.γ – The grand mean of In yijuj – A nursing home specific effect, treated as a random
effect assumed to be normally distributed with constantvariance τ0rij – Individual error term assumed to be normally
distributed with constant variance σ2
The share of variation in care at nursing home level,as measured by the Intraclass correlation coefficient (ICC),shows the amount of variation between nursing homes as aproportion of the total variation.
ICC ¼ τ0σ2 þ τ0ð Þ ð2Þ
In model 2 explanatory factors at the nursing homelevel where added.
In yij ¼ γ þXH
h¼1δhxhj þ u0jþ rij ð3Þ
xhj – A set of H nursing home variables, this is fixedeffects.In model 3 individual variables were added.
In yij ¼ γ þXH
h¼1δhxhj þXM
m¼1θmxmji
þXM
m¼1XM
r¼1θmmxmjixrji þXL
l¼1βlxlji þ u0j
ð4Þxm and xr – A set of M individual disability variables.
We use a specification that allows interaction betweenindividual variables.xl – A set of L other individual variables.
For a continuous variable the estimated value θ^m has an
interpretation as percentage increase in y with one unitincrease in xm. For categorical dummy variables wehave used Kennedy’s approximation to adjust for bias
[17]; β0� �^ ¼ e
β^−1
2V β^ð Þ−1
� �, where V β
� �, is the variance
to the estimated β . It is simple and has shown to be veryclose to exact unbiased estimates [18]. The interpretationof the Kennedy’s approximation is percentage increasein y for a change in the categorical variable. For the dis-ability variables note that the marginal effects include
interaction effects and hence depends on the level (score)of the variables.The model was estimated using the restricted maximum
likelihood method, assuming an unstructured covariancematrix, using Stata version 12.1.The study was approved by the Regional Committee
for Medical and Health Research Ethics (REK) and theOmbudsman for Research at the Norwegian Social ScienceData Services (NSD).
ResultsTotal individual care constituted about 60 percent of theavailable staff hours in our study and the average patientreceived 14.8 hours individual care per week. The resultsfrom estimation of Equation 1, 2, 3, 4) are shown in Table 3.We see from Figure 1 that there is a substantial variation
in individual care both between and within nursing homes.The Intraclass correlation coefficient shows that variationsbetween nursing homes account for 24 percent of the totalvariation between individuals (Table 3). However, when weanalyse the different categories of care time separately, wesee that only 13.7 percent of the variation in “personal care”can be attributed to differences at nursing home level. Forassistance during meals the variation was 25.5 percent.When nursing home characteristics were included,
the variation at nursing home level was only marginallyreduced, with the ICC for individual care now at 22.1percent.
Nursing home variablesNearly one fourth (24%) of total variation can be attributedto the nursing home level. Of the structural nursing homevariables size, ownership and average case mix are signifi-cantly associated with total amount of care given. The asso-ciation between size and care is negative, implying thatpatients, other things equal, receive less care in larger facil-ities. The relationship is, however, non-linear and strongestfor the smallest nursing homes. The size-effect was particu-larly evident for assistance with meals.The effect of ownership is positive, with patients in
private, non-profit institutions receiving 30 percent moreindividual care than those in public nursing homes.There is a positive association between average case-mix
in a nursing home and the amount of care provided. Atenth of a unit increase in the average case-mix decreasesthe average amount of direct individual care for patientswith about three percent. On average this constitutes about25 min per week per patient. The 25th and 75th percentilecase mix was at 3.04 and 3.54. Staff skill mix was not asso-ciated with amount of care given.
Individual level variablesThere is an association between all of the four groupeddisability/impairment variables and the total amount of
Døhl et al. BMC Health Services Research 2014, 14:108 Page 5 of 10http://www.biomedcentral.com/1472-6963/14/108

individual care given. There was a significant direct mar-ginal effect of ADL-disability, IADL-disability and cognitiveimpairment. (For simplicity we use “ADL” and “IADL” forADL-/IADL-disability for the remainder of the discussion.)Due to interaction effects among the disability/impairment
variables, marginal effects will vary depending on the scoresfor the different variables. The calculated marginal effectswill be most accurate around average scores and for themost frequent combination of scores. The relevant rangesin our material are quite narrow for IADL (high values) and
Table 3 Results of multilevel regression analysis of individual care time in nursing homes
(Total) individual care Personal care Assistance with meals
Model 1:
Variance-nursing home level τ 0 0.064 (0.037-0.110) 0.075 (0.042-0.137) 0.142 (0.082-0.246)
Variance-individual level σ2
0.204 (0.188-0.221) 0.475 (0.438-0.516) 0.414 (0.382-0.450)
ICC 24.0% 13.7% 25.5%
Model 2:
Variance-nursing home level τ0
0.058 (0.032-0.106) 0.061 (0.031-0.122) 0.113 (0.060-0.215)
Variance-individual level σ2
0.204 (0.188-0.221) 0.476 (0.438-0.516) 0.414 (0.382-0.450)
ICC 22.1% 11.4% 21.4%
Model 3:
Intercept γ 0.31 (−0.70-1.33) −3.39*** (−4.60- -2.18) 0.71 (−0.80-2.23)
Nursing home characteristics:
Extra care sheltered housing δ1(δ1) 0.02 (0.02) (−0.14-0.18) 0.10 (0.10) (−0.10-0.31) 0.13 (0.13) (−0.12-0.38)
Private ownership δ2(δ02
) 0.27** (0.30) (0.03-0.52) 0.21 (0.23) (−0.05-0.47) 0.04 (0.03) (−0.31-0.39)
Nursing home size δ3
2.73** (0.04-5.42) 1.13 (−1.92-4.18) 6.09** (2.14-10.03)
College/university degree δ4(δ04
) 0.65 (0.66) (−0.41-1.71) 0.72 (0.74) (−0.41-1.85) −0.23 (−0.41) (−1.74-1.29)
Upper secondary education δ5(δ05
) 0.24 (0.16) (−0.60-1.08) 0.45 (0.41) (−0.44-1.33) −0.51 (−0.50) (−1.69-0.68)
Case mix δ6
−0.29** (−0.49- -0.09) −0.16 (−0.38-0.06) −0.25* (−0.54-0.05)
Individual characteristics:
ADL-disability θ1
0.73*** (0.56-0.90) 1.95*** (1.69-2.21) −0.23 (−0.52-0.06)
IADL-disability θ2
0.31*** (0.18-0.44) 0.64*** (0.44-0.85) 0.15 (−0.08-0.39)
Cognitive impairment θ3
0.47*** (0.31-0.64) 0.21* (−0.04-0.47) 0.46** (0.17-0.74)
Vision and hearing V&H θ4
−0.28** (−0.45- -0.10) −0.41** (−0.67- -0.15) −0.20 (−0.50-0.10)
ADL -IADL θ12
−0.08*** (−0.12- -0.04) −0.26*** (−0.32- -0.21) 0.01 (−0.05-0.08)
ADL - Cognitive θ13
−0.04*** (−0.07- -0.02) −0.07*** (−0.11- -0.04) 0.06** (0.01-0.10)
ADL -V&H θ14
0.02 (−0.01-0.05) −0.03 (−0.07-0.01) 0.10*** (0.06-0.15)
IADL-Cognitive θ23
−0.06** (−0.09- -0.02) 0.00 (−0.06-0.05) −0.06* (−0.12-0.01)
IADL-V&H θ24
0.07** (0.02-0.12) 0.10** (0.03-0.18) 0.06 (−0.02-0.15)
Cognitive-V&H θ34
−0.03 (−0.06-0.01) 0.01 (−0.04-0.06) −0.13*** (−0.18- -0.07)
Dementia/Alzheimer β31(β031
) 0.03 (0.03) (−0.02-0.07) 0.06** (0.07) (0.00-0.13) −0.02 (−0.02) (−0.09-0.05)
Stroke β32(β032
) 0.01 (0.01) (−0.04-0.06) 0.09** (0.09) (0.01-0.16) −0.10** (−0.10) (−0.18- -0.02)
Diabetes β33(β033
) 0.05 (0.05) (−0.01-0.12) 0.01 (0.01) (−0.08-0.11) 0.00 (0.00) (−0.11-0.10)
Private care <3 hours β21
0.02 (0.02) (−0.03-0.07) 0.01 (0.01) (−0.06-0.08) −0.09** (−0.09) (−0.18- -0.01)
Private care 3 < hours β22(β022
) 0.17** (0.18) (0.05-0.28) 0.01 (0.00) (−0.16-0.18) 0.22** (0.24) (0.02-0.41)
age 80–89 β11(β011
) −0.04 (−0.04) (−0.08-0.01) −0.01 (−0.01) (−0.08-0.05) 0.02 (0.02) (−0.05-0.10)
age above 90 β12(β
012
) −0.04 (−0.04) (−0.10-0.01) 0.02 (0.02) (−0.06-0.09) 0.00 (0.00) (−0.08-0.09)
Model fit Statistics:
Restricted log. Likelihood Model 3 −339.8 −750.8 −900.4
Estimated values are expressed with ^.***p ≤ 0.001 **p ≤ 0.05 *p ≤ 0.1 (95% Confidence Interval).
Døhl et al. BMC Health Services Research 2014, 14:108 Page 6 of 10http://www.biomedcentral.com/1472-6963/14/108

sight and hearing (low values) (see Table 1). In evaluatingmarginal effects of the ADL, IADL and cognitive variables,the average score for sight and hearing is used.There were negative interaction effects among ADL,
IADL and cognitive impairment on the amount of indi-vidual care given.For the average patient the marginal effect of one point
increase in ADL was 27 percent [i.e.: 0.73 – (0.08 × 4.51) –(0.04 × 3.43) + (0.02 × 1.82)]. For the majority of patientcases the marginal effect of ADL lies between 17–35percent.For the average patient the marginal effect of one
point increase in IADL was minus 4 percent. The mar-ginal effect of one point increase in IADL is positive forvalues of ADL and cognitive impairment below theaverage, and negative for ADL and cognitive impair-ment values at the average or higher. For the majority ofpatient cases the marginal effect of IADL lies between16 and minus 26 percent.For the average patient the marginal effect of one
point increase in cognitive impairment was 1.1 percent.The marginal effect point increase in cognitive impair-ment is positive in the majority of patient cases, but forthe most severe it is negative. For the relevant ranges,the marginal effect of cognitive impairment lies between15 and minus 8 percent.In the relevant ranges of scores, the marginal effect of
sight and hearing is close to zero or negative.The results for personal care resemble the result for
total individual care. However, the marginal effect of ADLis almost twice the size evaluated at average disabilityscores. Furthermore, the interaction effect between ADLand IADL is much stronger whilst there is no interactioneffect between IADL and cognitive impairment.
The results for assistance with meals show positivemarginal effects for ADL, IADL and cognitive impairmentfor most relevant ranges of disability scores, in the rangeof about 10–20 percent for average scores. The marginaleffect of IADL is smallest, and close to zero for high valuesfor cognitive impairment due to a negative interactioneffect. The estimated effect of sight and hearing is closeto zero for average disability scores. However, there arequite strong interaction effects with ADL (positive) andcognitive impairment (negative).None of the diagnostic variables influenced the total
individual care patients received, when disability levelswere adjusted for. A positive association was found betweenDementia/Alzheimer and stroke diagnoses and the amountof personal care given. Those with dementia/Alzheimerand stroke got respectively 7 and 9 percent more per-sonal care. Those with stroke got 10 percent less assistancewith meals.Informal care was only significant for those receiving
more than three hours informal care. Those who receivedmore than three hours informal care also received morecare from the nursing home staff. For assistance withmeals, those who received less than three hours informalcare received 9 percent less help from the nursing homestaff, while those who received more than three hours in-formal care received 24 percent more help.When all other factors are kept unchanged age did not
influence the amount of individual care.
DiscussionAs much as 24 percent of the variation in individual carewas found to be at nursing home level. We are not awareof similar studies in public settings, but one US study foundthat variation between nursing homes accounted for 29–37
510
1520
2530
35
Hou
rs p
er w
eek
0 5 10 15 20 25 30 35Nursing Homes
CI-L / CI-H Mean
Figure 1 Variation in individual care. Mean and 95% confidence interval for each nursing home, Total average = 14.8
Døhl et al. BMC Health Services Research 2014, 14:108 Page 7 of 10http://www.biomedcentral.com/1472-6963/14/108

percent of the total variation between patients [19]. The im-plication of this finding is that the amount of care patientsreceive will critically depend on the nursing home they areadmitted to. Remembering that these are nursing homes,within one municipality, in a public health care systemwhere equity is a central goal, this result is surprising. Fur-thermore, only a small amount of nursing home variationwas explained by our structural variables. The time registra-tions only covered face-to-face care given and not timespent in group activities. Some of the nursing homes mayprioritize group activities and this could explain some ofthe variation. A second explanation could be differences inefficiency. Such differences could be related to differencesin management style, management capacity or culture, butalso due to physical limitations due to building structuresand patient logistics. Neither of these variables are, unfortu-nately, observed (or observable) in this study.The core of nursing home production is compensation
for disability or poor health. Our results show that theamount of care given to a patient, other things equal,will depend on the case mix of the nursing home; inother words on the level of disability of all other patients atthe same nursing home. We interpret this as a consequenceof a financial model where there is no compensation forcase-mix and differences in the need for care. As averagecase-mix increase nursing homes respond by lowering thelevel of care for all users. Thus a financial model that doesnot take variation in needs for individual assistance into ac-count could lead to a situation whereby patients with thesame needs, receive different levels of care. It should alsobe noted that the municipality of Trondheim changed theirreimbursement model based of the findings of the timestudy. What we found correlates to some extent with otherfindings from Canada. By using SMAF in nursing homes itwas found that nursing home funding based on the numberof beds has some major obstacles. Firstly, the increasedlevel of disability among the patients in nursing homes overtime was not taken into account in the budgets. Secondly,there were large differences between nursing homes in ac-tual budgets compared to the needs of the patients [20].We did find some variation between nursing homes
related to structural factors. Nursing home size wasnegatively associated with the amount of individual caregiven, especially related to assistance with meals. This couldalso be related to constructional factors. Larger nursinghomes do often have larger dining rooms, which couldbe more effective for the employees. A higher individualpersonal care level was also found for patients at privateowned nursing homes. The time registrations only cov-ered direct face-to-face care performance and not timespent in group activities. Some of the nursing homesmay prioritize group activities, and this could explainsome of the variation. Another explanation could bedifferences in efficiency. A study from Switzerland found
that non-profit owned nursing home could be more costeffective than public owned nursing homes [21]. Datafrom our study gave no opportunity to compare differencesin efficiency.The patients ADL score is a strong explanatory factors
for variations in individual care within nursing homes[22-24]. Our study also shows that the patients ADL-disability was the strongest predictor for use of resources.Other studies have indicated that cognitive impairmentaffects resource use indirectly through ADL [25,26], butin our study cognitive impairment had a separate directeffect on the amount of care. We also found that both IADLand sight and hearing had a significant association with pro-vided care. IADL measures activities that are considered tobe important for living independently in the community [5].Therefore measurement of IADL is often left out in nursinghome settings. Our results would indicate that IADL mea-sures provide valuable information also in nursing homes.This is in line with other studies where activities related toIADL accounted for about 16% of the total time in nursinghomes [27]. Thus our results suggest that excluding IADLmay result in a loss of information regarding variation incare provided to nursing home patients. There seems to besubstantial interaction effects between the different disabil-ity variables. It was only for ADL that the marginal effectwas positive for all ranges of disability scores.The marginal effect of cognitive impairment was positive
for low values of ADL or IADL and negative for highvalues. The development of dementia is often connectedwith challenging behaviour. Challenging behaviour ismore demanding when patients have a high physicalability. Also loss of cognitive functioning probably meansthat the patient becomes less able to perform ADL activ-ities. Whether the negative marginal effect for patients withmost severe physical disability is related to unmet needse.g. due to problems with expressing their needs andwishes, or a natural reduction in need for care time isuncertain. We do not find such a negative interactioneffect for assistance with meals.The marginal effect of IADL was positive for low values
of ADL and cognitive impairment, and was negative forhigh values of ADL and cognitive impairment. One possibleinterpretation is that worsening IADL implies that it takesmore time to assist patients to perform activities when theyare relatively well functioning. When disabilities are severethe patient is less capable of participating in performingactivities and it is less time consuming for care personnelto perform the activity without the participation of the se-vere disabled elderly. Another explanation for the inverserelationship between care and some levels of disability maybe differential levels of movement restriction includingdiffering levels of medication.The complex relationships between disability dimensions
and direct care time is illustrated both by the significant
Døhl et al. BMC Health Services Research 2014, 14:108 Page 8 of 10http://www.biomedcentral.com/1472-6963/14/108

interaction effects among disability variables and by the dif-ferences in results for different types of care.We found no evidence that patient diagnoses affected
the total amount of care given. Thus disability seems tobe a better predictor of care received than diagnoses.This could imply that diagnoses are too crude a measureto capture need. Diagnosis is measured as yes/no, whilethe degree of disability resulting from a diagnosis couldvary substantially. It is often the degree of disability thatis compensated for by nursing home care.In an analysis excluding disability measurements
(not shown, available on request) both Dementia/Alzheimerand Stroke became significant explanatory factors forindividual care. This is not a new finding. Earlier studiesof nursing home admissions have found that the effectof diagnosis weakens or becomes insignificant when disabil-ity is introduces as a factor [28]. Even if disabilities were abetter predictor for the amount of care given, ignoring diag-nosis could lead to overlooking some important explana-tory factors. When we analysed personal care separately wefound that both Dementia/Alzheimer and Stroke add someexplanatory effect which was not captured in the disabilitymeasure. We found that patients with stroke got more as-sistance with personal care and less assistance during mealsthan patients with other diagnoses. Stroke patients oftenhave a one-side paralysis. This could imply that stroke pa-tients are often capable of eating by themselves, but needhelp with personal care, such as help to get dressed.Studies on LTC focusing on home care recipients have
found that informal care may be a substitute for publiccare [29]. We find that patients who received more thanthree hours informal care also received more nursinghome care, thus informal care seems to be complementaryrather than substitute to public care. One possible explan-ation is that nursing homes are not able to provide the de-sirable level of care for all patients, and thus must dependon additional informal care. Another possible explanationis that relatives that spend a lot of time with the patientsact as strong advocates.A study from Finland found that patients over 75 years
got about 40 minutes less direct care per week [22]. Ourresults show no strong systematic relationship betweenage and care levels.There are caveats in this approach. The analysis was
limited to variations in individual direct care. On averagethe share of time used for direct care was 60 percent. Thisleaves about 40 percent of the total labour costs out of thestudy. Dealing with non-individual time is a common obs-tacle in most time study in nursing home. This obstacleis often overcome by dividing the non-individual timeequally between all of the patients [23]. Increasing theamount of hours each patient receives will not alter theresults for individual need variables. Using data fromonly one municipality reduces the generality of the results.
Expanding the data set would enable us to see whether thelarge share of nursing home variation is coincidental, or acommon feature across municipalities. It would also enableus to test the robustness of the associations within a morediversified institutional setting. This should be a questionfor further research.
ConclusionAs much as 24% of the variation of individual care betweenpatients could be explained by variation between nursinghomes. Structural nursing home characteristics, however,only reduced the unexplained variation between nursinghome minimally.Our findings show that in a financial reimbursement
model with no adjustment for case-mix, the amount ofcare patients receive does not solely depend on the pa-tients own disability, but also on the disability level ofall the other patients.ADL disability was the strongest explanatory factors
for use of resources in nursing homes. But also IADLand cognitive disability are important explanatory fac-tors. Analysing different care components separatelyadds valuable information on the relationship betweenindividual characteristics and the type of care providedto nursing home patients.
Additional file
Additional file 1: Results from the factor analysis: Eigenvalues fromthe initial solution with its explained variance. Eigenvalues from aparallel analysis. Factor loadings from the rotated pattern matrix andcorrelation between factors.
AbbreviationsADL: Activities of daily living; IADL: Instrumental activities of daily living;IPLOS: Individuell Pleie og OmsorgsStatistikk (Norwegian). Individual nurseand care statistics.; Sd: standard deviation; SMAF: Système de Mesure del’Autonomie Fonctionnelle (French). The functional autonomy measurementsystem.
Competing interestsThe authors have no competing interests.
Authors’ contributionsØD carried out the statistical analysis. ØD, HG, JK, and JM prepared themanuscript. All authors read and approved the final manuscript.
AcknowledgementThe study was conducted with grants from The Norwegian Association ofLocal and Regional Authorities (KS) and County Governor of Sør-Trøndelag.Thanks to the city of Trondheim for access to the time study.
Author details1Department of Public Health and General Practice, Norwegian University ofScience and Technology, P.O. Box 8905 MTFS, N-7491 Trondheim, Norway.2Department of Health and Welfare Services, City of Trondheim, Trondheim,Norway. 3SINTEF Health research, SINTEF Technology and Society,Trondheim, Norway.
Received: 27 September 2013 Accepted: 21 February 2014Published: 5 March 2014
Døhl et al. BMC Health Services Research 2014, 14:108 Page 9 of 10http://www.biomedcentral.com/1472-6963/14/108

References1. OECD: Projecting OECD Health and Long-Term Care Expenditures: What are
the main drivers? Volume 477. Paris: OECD Publishing; 2006.2. Colombo F, Llena-Nozal A, Mercier J, Tjadens F: Help Wanted? Providing and
Paying for Long-Term Care. Paris: OECD Publishing; 2011.3. Gaugler JE, Duval S, Anderson KA, Kane RL: Predicting nursing home
admission in the U.S: a meta-analysis. BMC Geriatr 2007, 7:13.4. Katz S, Ford AB, Moskowitz RW, Jackson BA, Jaffe MW: Studies of illness in
the aged. The index of ADL: A standardized measure of biological andpsychosocial function. JAMA 1963, 185:914–919.
5. Fillenbaum GG: Screening the elderly. A brief instrumental activities ofdaily living measure. J Am Geriatr Soc 1985, 33(10):698–706.
6. Mahoney FI, Barthel DW: Functional Evaluation: The Barthel Index.Md State Med J 1965, 14:61–65.
7. Folstein MF, Folstein SE, McHugh PR: Mini-mental state. A practicalmethod for grading the cognitive state of patients for the clinician.J Psychiatr Res 1975, 12(3):189–198.
8. Fries BE, Schneider DP, Foley WJ, Gavazzi M, Burke R, Cornelius E: Refining acase-mix measure for nursing homes: Resource Utilization Groups(RUG-III). Med Care 1994, 32(7):668–685.
9. Björkgren M: RUG-III-baserade ersättningssystem för äldrevården.In Rapporter och artiklar, Volume 45. Karleby: Chydenius institutet - Karlebyuniversitetscenter; 2004.
10. StatBank Kostra. https://www.ssb.no/statistikkbanken/selecttable/hovedtabellHjem.asp?KortNavnWeb=pleie&CMSSubjectArea=helse&PLanguage=1&checked=true.
11. Christensen EW: Scale and scope economies in nursing homes: Aquantile regression approach. Health Econ 2004, 13(4):363–377.
12. Farsi M, Filippini M, Lunati D: Economies of scale and efficiency measurementin Switzerland’s Nursing homes. Schweiz Z Volkswirtsch Stat 2008, 144(3):359.
13. Bostick JE, Rantz MJ, Flesner MK, Riggs CJ: Systematic review of studiesof staffing and quality in nursing homes. J Am Med Dir Assoc 2006,7(6):366–376.
14. Norwegian Directorate of health and social affairs: Felles forståelse-individuellregistrering; Veileder. In, Volume 1.0. 2003.
15. Hebert R, Carrier R, Bilodeau A: The Functional Autonomy MeasurementSystem (SMAF): description and validation of an instrument for themeasurement of handicaps. Age Ageing 1988, 17(5):293–302.
16. Osborne JW, Costello AB, Kellow TJ: Best practices in exploratory factoranalysis. In Best practices in quantitative methods. Edited by Osborne JW.Thousand Oaks, Calif: SAGE Publications; 2008.
17. Kennedy PE: Estimation with Correctly Interpreted Dummy Variables inSemilogarithmic Equations. Am Econ Rev 1981, 71(4):801.
18. Jan van Garderen K, Shah C: Exact interpretation of dummy variables insemilogarithmic equations. Econ J 2002, 5(1):149–159.
19. Arling G, Kane RL, Mueller C, Lewis T: Explaining direct care resource useof nursing home residents: findings from time studies in four states.Health Serv Res 2007, 42(2):827–846.
20. Tousignant M, Hebert R, Dubuc N, Simoneau F, Dieleman L: Application ofa case-mix classification based on the functional autonomy of theresidents for funding long-term care facilities. Age Ageing 2003,32(1):60–66.
21. Farsi M, Filippini M: An Empirical Analysis of Cost Efficiency in Non-profitand Public Nursing Homes. Ann Pub Cooperative Econ 2004, 75(3):339–365.
22. Bjorkgren MA, Hakkinen U, Finne-Soveri UH, Fries BE: Validity and reliabilityof Resource Utilization Groups (RUG-III) in Finnish long-term carefacilities. Scand J Pub Health 1999, 27(3):228–234.
23. Brizioli E, Bernabei R, Grechi F, Masera F, Landi F, Bandinelli S, Cavazzini C,Gangemi S, Ferrucci L: Nursing home case-mix instruments: validation ofthe RUG-III system in Italy. Aging Clin Exp Res 2003, 15(3):243–253.
24. Carpenter I, Perry M, Challis D, Hope K: Identification of registered nursingcare of residents in English nursing homes using the Minimum Data SetResident Assessment Instrument (MDS/RAI) and Resource UtilisationGroups version III (RUG-III). Age Ageing 2003, 32(3):279–285.
25. Nordberg G, Wimo A, Jonsson L, Kareholt I, Sjolund BM, Lagergren M, vonStrauss E: Time use and costs of institutionalised elderly persons with orwithout dementia: results from the Nordanstig cohort in theKungsholmen Project–a population based study in Sweden. Int J GeriatrPsychiatry 2007, 22(7):639–648.
26. Arling G, Williams AR: Cognitive impairment and resource use of nursinghome residents: a structural equation model. Med Care 2003, 41(7):802–812.
27. Luttenberger K, Graessel E: Recording care time in nursing homes:development and validation of the “RUD-FOCA”(Resource Utilization inDementia–Formal Care). Int Psychogeriatr 2010, 22(8):1291.
28. Banaszak-Holl J, Fendrick AM, Foster NL, Herzog AR, Kabeto MU, Kent DM,Straus WL, Langa KM: Predicting nursing home admission: estimates froma 7-year follow-up of a nationally representative sample of olderAmericans. Alzheimer Dis Assoc Disord 2004, 18(2):83–89.
29. Kalseth J: Politics and resource use in local government service production.Trondheim: Norwegian University of Science and Technology; 2003.
doi:10.1186/1472-6963-14-108Cite this article as: Døhl et al.: Variations in levels of care betweennursing home patients in a public health care system. BMC HealthServices Research 2014 14:108.
Submit your next manuscript to BioMed Centraland take full advantage of:
• Convenient online submission
• Thorough peer review
• No space constraints or color figure charges
• Immediate publication on acceptance
• Inclusion in PubMed, CAS, Scopus and Google Scholar
• Research which is freely available for redistribution
Submit your manuscript at www.biomedcentral.com/submit
Døhl et al. BMC Health Services Research 2014, 14:108 Page 10 of 10http://www.biomedcentral.com/1472-6963/14/108

Paper II

Is not included due to copyright


Paper III

http://jnep.sciedupress.com Journal of Nursing Education and Practice 2016, Vol. 6, No. 7
ORIGINAL RESEARCH
Physical disability and cognitive impairment amongrecipients of long-term care
Øystein Døhl ∗1,2, Helge Garåsen1,2, Jorid Kalseth3, Jon Magnussen1
1Department of Public Health and General Practice, Faculty of Medicine, Norwegian University of Science and Technology,Trondheim, Norway2Department of Health and Welfare Services, City of Trondheim, Norway3Department of Health Research, SINTEF Technology and Society, Trondheim, Norway
Received: November 23, 2015 Accepted: January 19, 2016 Online Published: February 1, 2016
DOI: 10.5430/jnep.v6n7p1 URL: http://dx.doi.org/10.5430/jnep.v6n7p1
ABSTRACT
Background and objective: For practical policy purposes variables describing disability and impairment should be aggregated
into broader factors. By using data from a Norwegian mandatory system the objective of this study was to analyse whether the
number of factors describing the need for long-term care differs between recipients of home care and nursing home residents
and according to the age or gender of long-term care recipients. The hierarchical order of the variables within each factor is
determined to assess whether there are important informational gaps in the description of recipients.
Methods: Data are from a mandatory system characterizing all recipients of public long term care in Norway. Two groups of
public care recipients were included: elderly (67 years and older) individuals receiving home care services (N = 2,493) and
patients in nursing homes (N = 1,218). Exploratory factor analysis (EFA), Confirmatory factor analysis (CFA) and item response
analysis (IRT) were used to determine the number of factors and the hierarchical structures of the variables.
Results: Two factors were sufficient to characterise need for both nursing home residents and home dwelling elderly. This
result is not sensitive to stratification by age and gender. IRT analysis revealed large informational gaps suggesting that the used
instrument fails to sufficiently capture important aspects of user needs.
Conclusions: Factorization suggests that all elderly long term care users can be adequately described along two dimensions;
on reflecting physical disability and one reflecting cognitive impairment. However, both the number of factors and the variable
contained in each factor are likely to depend on the instrument used to characterise LTC users. Large informational gaps suggest
a need to supplement the national information system used in Norway.
Key Words: Elder care, Nursing home care, Disability, Long term care
1. INTRODUCTIONUsing data from a mandatory system used to characterize
individual users of long term care in Norway (the IPLOS-
system), the objective of this article is to analyse whether
the number of factors describing the need for long-term care
differs between recipients of home care and nursing home
residents. Furthermore whether there are differences between
those aged 67-79 and those aged 80+, and also whether there
are differences between men and women. Through this anal-
ysis we assess how variables describing physical disability
and cognitive impairment can be grouped in broader factors
for the purpose of financing and planning of long term care
∗Correspondence: Øystein Døhl; Email: [email protected]; Address: Department of Public Health and General Practice, Faculty of Medicine,
Norwegian University of Science and Technology, Trondheim, Norway.
Published by Sciedu Press 1

http://jnep.sciedupress.com Journal of Nursing Education and Practice 2016, Vol. 6, No. 7
services. Finally we discuss the IPLOS system in terms of
how well it describes the full spectrum of the variables that
are important in the assessment of user needs.
Both disability and cognitive impairment have consistently
been found to be strong predictors of the use of long-term
care services.[1–5] Although the scores on a variety of sep-
arate variables are important for individual assessment and
follow-up, some form of aggregation/grouping of variables
is convenient if this information is to be used for planning
purposes, financing or population-based resource allocation.
This raises the question of how disability and impairment
variables can be grouped together and also how many sep-
arate factors that are needed to sufficiently capture needs.
What is also important, from a policy perspective, is whether
the grouping of variables and the number of factors differ
between different types of users.
Disability is commonly evaluated according to a range of
functional capabilities, e.g., activities of daily living (ADL),
mobility and instrumental activities of daily living (IADL).
Indeed, many of the available instruments use ADL/IADL
variables to describe disability, most built on the works of
Katz, Lawton and Barthel.[6–8] Cognitive impairment can be
evaluated according to, e.g., the Mini Mental State Exami-
nation (MME), the Cognitive Performance Scale (CPS) and
diagnoses.[9, 10] Some instruments also include variables that
capture both disability and cognitive impairment, e.g., The
Functional Independence Measure (FIM), The Functional
Autonomy Measurement System (SMAF) and The Activity
Measure for Post-Acute Care (AM-PAC).[11–14]
There is a large literature that analyses how ADL, mobil-
ity and IADL variables can be aggregated into broader fac-
tors. The literature, however, is largely inconclusive, sug-
gesting they may be grouped in from one to three unique
factors.[15–17] One explanation for the conflicting results may
be differences in the underlying set of variables that describe
disability or cognitive impairment. Whereas ADL variables
describe basic self-care activities and mobility, the IADL
variable sub-domains are often less precisely defined.[18, 19]
Moreover, some instruments include variables that describe
social factors and/or cognitive impairment under the IADL
heading, and thus, the reason for not combining ADL and
IADL into one common factor could be because the latter
can include social[20, 21] or cognitive variables.[14, 17, 22–25]
The number of factors needed to describe needs may also
vary between different types of users, depending on setting
(home care vs. nursing home), age or gender. Again, the lit-
erature provides conflicting results on this topic.[13, 15, 21, 26, 27]
In practical use, there will be a trade-off between an in-
strument that includes multiple variables and covers a wide
spectrum of needs and a more parsimonious instrument that
reduces the administrative burden.[19] Measures of ADL, mo-
bility, IADL and cognitive impairment have been shown to
vary in their ability to detect disability.[13, 16, 28–30] Thus, im-
portant variables may be missing in the instruments that are
used (“gaps”), and the aggregated factors may consequently
be less precise.
In Norway, the provision of public long-term care is decen-
tralised to 428 municipalities. Since 2006 municipalities
have been required to assess user needs using a standard-
ised national registration system (IPLOS) that contains 15
variables describing physical disability and cognitive impair-
ment.[31] While the primary purpose with IPLOS was to
provide local and central authorities with information about
long term care use and long term care users, the potential for
using the system for financial purposes was also considered.
Intentionally the idea was to link IPLOS to the Resident
Assessment Instrument (RAI) and the Resource Utilization
Groups system (RUG).[32–34] In the final version, however,
the selected ADL variables had clear similarities with those
used by Katz, Lawton and Barthel.[6–8] Characterisation of
disability in IPLOS is based on the principles described by
the World Health Organization’s (WHO) classification of
disabilities.[35] The IPLOS system is unique for Norway,
the most similar system is the Canadian SMAF.[12] While
IPLOS is now an established tool in the assessment of indi-
vidual user need,[36] it is still rarely used by municipalities in
aggregate planning, monitoring or financing of services.
2. METHODSThe data obtained covered all recipients of long term care
aged 67 years or older in the municipality of Trondheim.
The first group comprised 2,493 persons who received pub-
lic home care (home-dwelling elderly). The second group
consisted of 1,218 elderly who received long-term care in
nursing homes (1,152 persons) or sheltered housing units
(64 persons). Together, these two groups constitute approxi-
mately 18% of the elderly aged 67 years or older who lived
in Trondheim at the time of the study. A quantitative cross-
sectional design was used.
Data were collected during a four-week period in October
2012. Data are routinely registered for all individuals who
receive public nursing home or home care services. We
utilised the 15 variables (see Table 1) that described dis-
abilities related to ADL (variables 1-4), mobility (variables
5-6), IADL (variables 7-9), and cognitive and behavioural
impairment (variables 11-15). Variable 10, “maintaining
one’s own health”, is similar to Lawton and Brody’s origi-
nal IADL variable “responsibility for own medications”,[7]
2 ISSN 1925-4040 E-ISSN 1925-4059

http://jnep.sciedupress.com Journal of Nursing Education and Practice 2016, Vol. 6, No. 7
but it has a broader definition. It is not clear whether this
expanded variable should be interpreted as an IADL or a
cognitive variable. The 15 variables were scored using a
five-point scale. Higher scores imply lower capability and
scores of three or higher indicate the need for assistance. A
score of one indicates no need for help, and a score of two
indicates that the person is capable of performing the task but
with difficulties. Scores are updated whenever the recipient’s
condition changes. The data contained no missing values.
All personnel who registered the data had been licensed and
trained by the municipality’s authorisation program.[37] All
recipients were scored according to their potential capacity
to perform the tasks described in each variable.
Data analysesData were analysed using the following procedure. The
datasets were randomly divided into two halves. First, the
number of factors was established using exploratory factor
analysis (EFA) on one half of the datasets.[38] Because data
were ordinal, polychoric rather than Pearson correlation was
used.[39] The number of factors to retain was determined
based on combining the Kaizer criteria, a parallel analysis
and a scree plot.[40] The parallel analyses were conducted
with 50 randomisations. Variables were grouped into one
factor if their factor loading was higher than 0.40.[40] Inter-
nal consistency was tested with Cronbach’s alpha and was
computed for each factor, based on the factors for which
the variables showed the highest loading. Cronbach’s alpha
values above 0.70 were interpreted as good, and values above
0.90 were considered very good.[41]
Secondly the factorisations from the step 1 were tested by
use of confirmatory factor analysis (CFA) on the other half of
the sample. We used a Root Mean Square Error of Approxi-
mation (RMSEA) to test the covariance of the model against
the covariance of the sample. As a measure of the residual
correlation we used Standardized Root Mean Square Resid-
ual (SRMR). Chi squared tests which is often used could
be inflated by high sample size, and a Comparative fit index
(CFI) is considered as more prober for large samples.[40, 42]
CFI was used to compare the model with a more restrictive
model assuming no covariance among the variables.[40, 43, 44]
RMSEA should be as low as possible preferable below 0.06
and the upper 90% confidence interval should be 0.10 or
below. SRMR should be as low as possible preferable 0.10
or below and the CFI should be close to 0.90 or higher.[16, 40]
We used both a maximum likelihood and quasi-maximum
likelihood with robust standard errors procedure to correct
for the effect of nonlinearity of the standard errors. The two
methods produced nearly the same values. The results from
the maximum likelihood are presented.
To determine the hierarchical order of the variables, we
used item response theory (IRT). IRT analysis requires a
dichotomy in the responses; thus, all recipients of care were
categorised as either disabled (score 3 to 5) or non-disabled
(score 1 or 2) for each variable. Both one-parameter logistic
(1PL) and two-parameter logistic (2PL) IRT models were es-
timated. Our main interest was the parameter that describes
variable (or item) difficulty, β (see Tables 2 and 3). This pa-
rameter measures, in standard deviations, the distance from
the overall mean score (standardised) on the latent variable
θ (disability/impairment) when the probabilities of scoring
“need for help” (score 3-5) or “no need for help” (score 1-2)
are equal (i.e., 50%).[45, 46] Thus, higher β values are associ-
ated with more difficult tasks (variables). There are no clear
guidelines for the recommended size of the gaps between
items, although some reports have suggested values between
0.15 and 0.30.[30, 47, 48]
The analyses were performed with SPSS version 21. IBM
Corp. Armonk, NY. and Stata 13.1 StataCorp. College Sta-
tion, TX.
The study was approved by the Regional Committee for Med-
ical and Health Research Ethics (REK) and the Ombudsman
for Research at the Norwegian Social Science Data Services
(NSD).
3. RESULTS3.1 Descriptive statisticsAbout 2/3 of elderly receiving home care and nearly 3/4 of
elderly in nursing home were female (see Table 4). The av-
erage score of all 15 variables were 2.1 for home dwelling
elderly and 3.5 for those living in nursing home.
The average score for each of the 15 disability/impairment
variables was generally higher (indicating greater needs) for
the elderly in nursing homes than for the home-dwelling
elderly.
3.2 DimensionalityTable 1 shows that the data were non-normal; thus, the use
of polychoric correlation based on maximum likelihood may
lead to biased estimates. Still, polychoric correlation is often
preferred for ordinal data.[49] Because of the correlations
between the factors, an oblique rotation was used in the EFA
(direct oblim with δ = 0).[50, 51] Estimated factor loadings are
shown in Tables 5-7.
The EFA indicated that the 15 variables could be grouped
into two factors for both the home-dwelling elderly and the
elderly who lived in nursing homes. For both groups, the
eigenvalue for a third factor was below Kaizer’s eigenvalue
criteria, at 0.34 and 0.67, respectively. A two-factor model
Published by Sciedu Press 3

http://jnep.sciedupress.com Journal of Nursing Education and Practice 2016, Vol. 6, No. 7
was supported by both the parallel analysis and the scree
plots (not presented here). For both groups, the first factor
consisted of disability variables (ADL, mobility and IADL)
and the second of cognitive and behavioural variables. For
the elderly individuals who lived at home, the variable “shop-
ping” demonstrated loadings above the threshold of 0.40 on
both factors, it also had high loadings on both factors for
those who lived in nursing homes. The results from the EFA
analysis for home dwelling elderly and nursing home resi-
dents related to age and gender is in Tables 6 and 7. Due to
small sample sizes it was not possible to do an age-group or
gender-specific CFA on the nursing home residents. However
for the home dwelling elderly results were nearly identical
for the two age groups as well as for men and women. These
results are shown in Table 3.
Table 1. Characteristics of the study sample, share of recipient who score 1 and 2 and share of recipient who score 3, 4 and
5,with the average score and 95% confidence interval (C.I.). Home care (N = 2,493) and nursing home residents (N = 1,218)
Home-dwelling elderly Nursing home residents Score 1-2 Score 3-5 Mean score (C.I.) Score 1-2 Score 3-5 Mean score (C.I.)
1 Eating 96% 4% 1.16 (1.14-1.18) 62% 38% 2.12 (2.05-2.19) 2 Dressing 61% 39% 2.01 (1.96-2.05) 11% 89% 3.72 (3.66-3.78) 3 Personal hygiene 40% 60% 2.44 (2.40-2.48) 2% 98% 4.00 (3.95-4.05) 4 Using the toilet 81% 19% 1.61 (1.57-1.65) 25% 75% 3.36 (3.29-3.44) 5 Indoor mobility 83% 17% 1.87 (1.83-1.90) 37% 63% 3.07 (2.99-3.15) 6 Outdoor mobility 51% 49% 2.55 (2.51-2.60) 10% 90% 4.03 (3.97-4.09) 7 Cooking 51% 49% 2.33 (2.28-2.38) 1% 99% 4.50 (4.46-4.55) 8 Shopping 29% 71% 2.82 (2.78-2.87) 1% 99% 4.53 (4.49-4.57) 9 House keeping 11% 89% 3.40 (3.37-3.44) 0% 100% 4.72 (4.68-4.75) 10 Maintaining own health 15% 85% 2.93 (2.90-2.96) 1% 99% 4.24 (4.20-4.28) 11 Communication 94% 6% 1.23 (1.20-1.25) 54% 46% 2.41 (2.34-2.47) 12 Social interaction 67% 33% 1.84 (1.81-1.88) 19% 81% 3.13 (3.08-3.19) 13 Daily decision making 74% 26% 1.76 (1.72-1.80) 9% 91% 3.77 (3.72-3.83) 14 Memory 77% 23% 1.74 (1.70-1.77) 17% 83% 3.43 (3.37-3.49) 15 Behavioural control 96% 4% 1.14 (1.13-1.16) 58% 42% 2.20 (2.13-2.27)
Table 2. Confirmatory factor analysis on one half of the
sample of home dwelling elderly and nursing home residents
Home dwelling elderly
Nursing homes patients
Fit statistics RMSEA 0.09 (0.08-0.09)* 0.14 (0.13-0.15)* CFI 0.83 0.81 SRMR 0.06 0.10 Covariance 1 2 1 2
1 1 12 0.56 1 0.59 1
*90% confidence interval
Cronbach’s alpha values were between 0.79 and 0.94, thus
all but one was well above the recommended level of 0.70.
The results from the CFA analysis partly confirmed the re-
sults from the EFA analysis. For the home dwelling elderly
both the RMSEA and SRMR results supported the two factor
model. For the nursing-home residents the CFA results did
not clearly support the two factor model from the EFA analy-
ses. However, the covariance between the two factors was
0.59, and a CFA testing whether a composite (one-factor)
model gave an even poorer fit (results not shown).
3.3 Hierarchical ordering of the variables and gaps
IRT analysis was conducted separately for each of the factors.
Because the differences between the 1PL and 2PL models
were negligible, only the 1PL results are presented (see Table
8).
For both groups of elderly, “housekeeping” was found to
be the most difficult disability task, whereas “eating” was
the least difficult. For the cognitive variables, “maintaining
own health” was the most difficult, whereas “behavioural
control” was the least difficult task. Generally, all variables
were relatively more difficult for those who lived in nursing
homes than for the home-dwelling elderly.
4 ISSN 1925-4040 E-ISSN 1925-4059

http://jnep.sciedupress.com Journal of Nursing Education and Practice 2016, Vol. 6, No. 7
Table 3. Confirmatory factor analysis of home dwelling elderly, according to gender and age
Female Male 67-79 80+RMSEA 0.10 (0.09-0.10)* 0.12 (0.11-0.12)* 0.12 (0.11-0.12)* 0.09 (0.09-0.10)* CFI 0.88 0.86 0.86 0.89 SRMR 0.07 0.07 0.07 0.06 Covariance 1 2 1 2 1 2 1 2 1 1 1 1 1 2 0.58 1 0.66 1 0.61 1 0.58 1
*90% confidence interval
Table 4. Descriptive statistics of recipients
Home dwelling (N = 2,493)
Nursing homes (N = 1,218)
Percentage Men 34% 27% Percentage age 67-79 28% 22%* Average score 15 items 2.1 3.5 Men 2.1 3.5 Women 2.0 3.6 67-79 2.1 3.6 80+ 2.0 3.5 *Some recipients in nursing homes might be below 67 years old
Large differences between the item difficulty parameters (β)
identified areas in which the IPLOS instrument could be said
to lack precision. For the home-dwelling elderly, there were
larger gaps than recommended at both ends of the disability
scale. For patients in nursing homes, there were smaller gaps
between the most difficult variables but larger gaps between
the moderately difficult variables.
4. DISCUSSIONGrouping users of long-term care according to their needs is
useful for policy makers for planning, financing and moni-
toring purposes. With a variety of available instruments that
describe disability and cognitive impairments the literature is
inconclusive as for how such a grouping should be done. Our
analyses are based on the Norwegian IPLOS system, but the
challenges in long term care facing policy makers are similar
in other countries, thus we believe that our comparison of
recipients of home care and nursing home provide insight
beyond a specific Norwegian setting.
Table 5. EFA results-Eigenvalues, factor loadingsa from the pattern matrix and Cronbach’s alpha values from
home-dwelling elderly and nursing home residents
Factors Home-dwelling elderly Nursing home residents 1 2 1 2
Eigenvalues 8.08 1.70 8.06 1.91 Eigenvalues from parallel analysis 1.13 1.10 1.19 1.15 1 Eating 0.48 0.32 0.54 0.33 2 Dressing 0.82 0.09 0.86 0.11 3 Personal hygiene 0.76 0.18 0.70 0.32 4 Using the toilet 0.81 0.06 0.83 0.10 5 Indoor mobility 0.96 -0.24 0.95 -0.24 6 Outdoor mobility 0.90 -0.11 0.91 -0.14 7 Cooking 0.64 0.34 0.60 0.34 8 Housekeeping 0.72 0.17 0.71 0.17 9 Shopping 0.56 0.42 0.37 0.54 10 Maintaining own health 0.18 0.67 0.19 0.72 11 Communication 0.18 0.59 0.15 0.65 12 Social interaction 0.20 0.60 0.19 0.61 13 Daily decision taking -0.01 0.91 0.02 0.88 14 Memory -0.12 0.86 -0.16 0.86 15 Behavioural control 0.05 0.63 -0.11 0.66 Cronbach’s alpha† 0.91 0.79 0.90 0.85 * Loadings > 0.40 are marked with boldface; † The Cronbach’s alpha was computed within each factor based on the boldface variables.
Published by Sciedu Press 5

http://jnep.sciedupress.com Journal of Nursing Education and Practice 2016, Vol. 6, No. 7
Table 6. EFA results-Eigenvalues, factor loadingsa from the pattern matrix values from home-dwelling elderly, above and
below 80 years old, female and male
Factors 67-79 80+ Female Male 1 2 1 2 1 2 1 2
Eigenvalues 8.58 1.86 7.86 1.64 7.86 1.75 8.55 1.70 1 Eating 0.49 0.34 0.47 0.29 0.44 0.34 0.55 0.30 2 Dressing 0.83 0.13 0.82 0.06 0.84 0.03 0.79 0.17 3 Personal hygiene 0.77 0.22 0.76 0.15 0.77 0.14 0.74 0.24 4 Using the toilet 0.86 0.04 0.79 0.05 0.83 0.02 0.79 0.09 5 Indoor mobility 1.00 -0.21 0.93 -0.25 0.94 -0.23 1.00 -0.24 6 Outdoor mobility 0.96 -0.16 0.87 -0.08 0.87 -0.07 0.95 -0.14 7 Cooking 0.66 0.35 0.64 0.32 0.67 0.31 0.61 0.37 8 Housekeeping 0.74 0.18 0.72 0.15 0.75 0.12 0.69 0.22 9 Shopping 0.57 0.42 0.56 0.42 0.54 0.42 0.57 0.44 10 Maintaining own health 0.12 0.71 0.23 0.64 0.18 0.67 0.20 0.66 11 Communication 0.22 0.60 0.17 0.58 0.15 0.61 0.24 0.54 12 Social interaction 0.19 0.65 0.21 0.57 0.22 0.55 0.16 0.70 13 Daily decision taking -0.03 0.95 0.02 0.89 -0.02 0.92 0.02 0.90 14 Memory -0.11 0.83 -0.13 0.90 -0.11 0.87 -0.13 0.84 15 Behavioural control 0.02 0.68 0.07 0.60 0.09 0.58 -0.02 0.71 * Loadings > 0.40 are marked with boldface
Table 7. EFA results-Eigenvalues, factor loadingsa from the pattern matrix values from nursing home residents, above and
below 80 years old, female and male
Factors 67-79 80+ Female Male 1 2 1 2 1 2 1 2
Eigenvalues 8.31 2.17 10.42 1.25 7.99 1.94 8.12 1.86 1 Eating 0.61 0.32 0.39 0.50 0.55 0.35 0.52 0.28 2 Dressing 0.84 0.15 0.22 0.77 0.87 0.09 0.82 0.17 3 Personal hygiene 0.73 0.34 0.40 0.61 0.72 0.29 0.63 0.42 4 Using the toilet 0.86 0.09 0.22 0.76 0.83 0.10 0.82 0.12 5 Indoor mobility 1.03 -0.30 -0.21 1.00 0.94 -0.23 0.97 -0.26 6 Outdoor mobility 0.93 -0.11 -0.01 0.89 0.91 -0.16 0.90 -0.08 7 Cooking 0.66 0.35 0.54 0.47 0.63 0.31 0.54 0.43 8 Housekeeping 0.77 0.13 0.44 0.54 0.74 0.14 0.59 0.28 9 Shopping 0.48 0.51 0.71 0.28 0.38 0.51 0.38 0.57 10 Maintaining own health 0.28 0.67 0.80 0.13 0.22 0.69 0.11 0.80 11 Communication 0.10 0.72 0.69 0.17 0.18 0.65 0.10 0.68 12 Social interaction 0.08 0.71 0.64 0.20 0.19 0.62 0.16 0.60 13 Daily decision taking 0.09 0.83 0.98 -0.03 0.03 0.88 0.00 0.88 14 Memory -0.19 0.85 0.97 -0.13 -0.16 0.83 -0.15 0.91 15 Behavioural control -0.15 0.57 0.83 -0.09 -0.14 0.68 -0.04 0.64 * Loadings > 0.40 are marked with boldface
The existing literature is inconclusive as to whether disability,
as expressed through ADL and IADL variables, represents
one, two or even more dimensions in describing needs for
the home-dwelling elderly.[15–17] Our findings show firstly,
the need for both home health and institutional care for the
elderly can be described by using two factors; one containing
6 ISSN 1925-4040 E-ISSN 1925-4059

http://jnep.sciedupress.com Journal of Nursing Education and Practice 2016, Vol. 6, No. 7
variables related to physical disability, and one containing
variables related to cognitive impairment. Thus factorization
seems to be independent of whether care is provided at home
or in nursing homes. Secondly, the distinction between the
“younger elderly” (67-80), and the “older elderly” (80+) does
not seem to be important when choosing neither the number
of factors nor the variables contained in each factors. Thirdly,
we find no systematic differences between men and women
in the characterization of user needs. Thus both the number
of factors and the variables contained in each factor seems to
be the same for men and women. Others has found that more
factors are needed to describe needs for females than males
related to household activities.[21] This difference could be
related to different social structures between countries.
Table 8. Item parameter estimates of β (standard error) from the 1PL model for home-dwelling elderly individuals and
nursing home residents
Home-dwelling elderly Nursing home residents ADL/IADL/mobility Item difficulty ( ) ADL/IADL/mobility Item difficulty ( ) Housekeeping 3.78 (0.11) Housekeeping 8.13 (0.49) Shopping 1.68 (0.08) Cooking 6.92 (0.33) Personal hygiene 0.78 (0.08) Personal hygiene 6.23 (0.28) Outdoor mobility -0.04 (0.08) Outdoor mobility 3.97 (0.17) Cooking -0.07 (0.08) Dressing 3.69 (0.16) Dressing -0.84 (0.08) Toilet 2.09 (0.13) Toilet -2.76 (0.09) Indoor mobility 1.02 (0.11) Indoor mobility -3.00 (0.10) Eating -0.97 (0.11) Eating -5.52 (0.15) Cognitive CognitiveMaintain own health 2.80 (0.09) Maintain own health 6.95 (0.42) Social interaction -1.19 (0.07) Shopping 5.96 (0.29) Daily decisions making -1.74 (0.08) Daily decision making 3.49 (0.15) Memory -2.07 (0.08) Memory 2.46 (0.12) Communication -4.36 (0.13) Social interaction 2.34 (0.12) Behavioural control -4.94 (0.15) Communication -0.28 (0.09)
Behavioural control -0.52 (0.09)
-2*log likelihood ADL/IADL 1PL 18,451.2 -2*log likelihood ADL/IADL 1PL
5,558.0
-2*log likelihood Cognitive 1PL
11,140.4 -2*log likelihood Cognitive 1PL
5,879.3
Our analysis supports previous studies that found that ADL
and mobility variables constitute a common dimension in
describing the service needs for the home-dwelling elderly
and for nursing home residents, whereas the IADL variables
could both be physical and cognitive depending on the recip-
ients being analysed.[23–25] Furthermore, our results indicate
that behavioural problems can be grouped with other cogni-
tive variables for elderly users. This finding is in contrast
to others, who has found that aggressive behaviour could
be treated as a separate dimension for nursing home resi-
dents.[52] This further underscores the point that some IADL
variables have a strong cognitive element. Thus, the distinc-
tion between physical and cognitive variables may be more
relevant than that between ADL, IADL and cognitive vari-
ables. This could explain why some variable as for instance
shopping is a physical disability for some recipients while it
appears as a cognitive dimension for others.
The IPLOS system contains 15 variables describing disability
and cognitive impairment. Although other instruments will
contain different variables, we still believe that our analyses
suggest that a common factorization is applicable for the
population 67+. For policy makers this means that a com-
mon “case-mix system” based on this factorization can be
developed for planning, financing and monitoring the use of
long-term care services for this group.
We found that the hierarchical ranking of variables to be
quite similar between home dwelling elderly and those living
Published by Sciedu Press 7

http://jnep.sciedupress.com Journal of Nursing Education and Practice 2016, Vol. 6, No. 7
at nursing homes. There was one exception namely cooking
which was considered as medium difficult for home dwelling
elderly, while it emerged as the second most difficult task for
those living in nursing homes. This is in contrast to others
who found that cooking, unlike other tasks, was considered
as less difficult in a nursing home setting than among home
dwelling elderly.[53] However, the level of difficulty for per-
forming different tasks was generally higher for the elderly
living in nursing homes. This result suggests that the tran-
sition from home care to nursing home care is attributable
to a general worsening of disability more than to a sudden
change in the capacity to perform specific tasks, and thus
that setting (home vs institutional care) in our case is a proxy
for severity. These findings are in accordance with others.[53]
Among home dwelling elderly there were small differences
in gaps and no differences in hierarchical ranking stratified
by gender or age (results not shown), which is in accordance
with others.[26]
Large differences between the difficulty parameters of the
variables studied highlight areas where the IPLOS system
could have a low level of precision. When instruments show
gaps between the least difficult variables, it becomes more
difficult to separate between the least disabled individuals;
conversely, gaps between the most difficult variables make
it more difficult to distinguish between the most disabled
persons.[14, 30, 54] This scenario may be related to both the
number and the types of variables included.[14] For both
groups of elderly, we found relatively large gaps at both ends
of the physical disability measures. For the home-dwelling
elderly, the difference between eating and indoor mobility
was large, although we consider this to represent a minor
problem. As shown in Table 1, approximately 96% of home-
dwelling elderly were capable of eating alone, and most
of those living in nursing homes were also able to eat by
themselves. For the home-dwelling elderly, the gap between
housekeeping and shopping was more striking, as approxi-
mately 70%-90% of home-dwelling recipients required help
with housekeeping or shopping. This large gap could make
it more difficult to differentiate among the least disabled.
Large gaps for the least and most disabled home-dwelling
elderly persons have also been detected in studies using other
instruments, suggesting that this problem is not specific to
the IPLOS system.[29, 55] For patients in nursing homes, the
gaps were large between the most difficult variables. The
large gap between the most difficult variables–housekeeping,
cooking, personal hygiene and outdoor mobility–could be
related to the fact that the two first are IADL variables and
that very few individuals actually need to perform these tasks
in a nursing home setting. We found, in Table 1, that nearly
100% of those living in nursing homes required help with
these tasks.
We also observed that there were relatively large gaps be-
tween the cognitive variables for the two groups of elderly
individuals. Thus, the IPLOS system does not appear to
be well suited for detecting differences between users with
severe cognitive impairment. One possible solution, when
there are gaps, could be to split the variable in question into
multiple “sub”-variables, e.g., a possibility is to split indoor
mobility into three separate variables.[21] In a more general
analysis 166 ADL/IADL variables were analysed and iden-
tified potential variables that could be included in disability
instruments to reduce information gaps.[28] After a variable
is split, the system may be more capable of identifying dif-
ferences between both the most and least severely disabled
recipients.
In Norway today, a composite score of all 15 IPLOS variables
is used to describe “severity”.[56] However, our results show
that this may lead to an inaccurate picture of both severity
and the resulting need.
A strength of this study is that analysis are based on everyday
use of a system that is mandatory. Thus, we also believe
that results should be applicable in Norwegian long term
care. There are, however, also some caveats in our approach.
Firstly, the IPLOS system contains fewer variables than other
frequently used instruments; in particular, it contains fewer
IADL variables. Thus, frequently used IADL variables such
as “handling money” and “using phone/internet” can be indi-
rectly included in “shopping”, and the variable “maintaining
own health” has a broader definition than the frequently used
IADL variable “responsibility for own medications”. These
variables have been reported in some studies to be included in
a separate “cognitive” IADL dimension in addition to other
“physical” IADL variables. In contrast, IPLOS includes vari-
ables related to cognitive and behavioural functioning, which
enables us to test IADL variables against cognitive impair-
ment. Further the IPLOS system does not have information
of other potential determinants of need as e.g., medication
and education. Secondly, the data analysed in this study were
a specific Norwegian setting; therefore, we cannot confirm
their representativeness for other settings. Thirdly, Although
IPLOS, as other instruments, have gaps along the continuum,
comparison with other instruments was not possible with
the available data. Further research should compare IPLOS
against other reliable instruments.
5. CONCLUSION
Factorization suggests that all elderly (67 years and older)
long term care users can be adequately described along two
dimensions; one reflecting physical disability and one re-
8 ISSN 1925-4040 E-ISSN 1925-4059

http://jnep.sciedupress.com Journal of Nursing Education and Practice 2016, Vol. 6, No. 7
flecting cognitive impairment. However both the number of
factors and the variable contained in each factor is likely to
depend on the instrument used to characterise LTC users.
The IRT analysis showed minor differences in the hierarchi-
cally structure between home dwelling elderly and nursing
home residents. On the other hand IRT analysis revealed
large information gaps between the different variables in the
system currently used in Norway. Especially it seems less
suited to discover differences in need among the less disabled
home dwelling elderly. Thus, there is a need to supplement
the design of the IPLOS system preferably with variables
from other reliable instruments.
ACKNOWLEDGEMENTSThe study was conducted with grants from The Norwegian
Association of Local and Regional Authorities (KS) and
County Governor of Sør-Trøndelag.
CONFLICTS OF INTEREST DISCLOSUREThe authors declare that there is no conflict of interest.
REFERENCES[1] Kadushin G. Home health care utilization: a review of the re-
search for social work. Health & social work. 2004; 29(3): 219-244.
http://dx.doi.org/10.1093/hsw/29.3.219[2] Meinow B, Kåreholt I, Lagergren M. According to need? Pre-
dicting the amount of municipal home help allocated to elderly
recipients in an urban area of Sweden. Health and Social Care
in the Community. 2005; 13(4): 366-377. PMid:15969708 http://dx.doi.org/10.1111/j.1365-2524.2005.00570.x
[3] Karlsson S, et al. Functional ability and health complaints among
older people with a combination of public and informal care vs. pub-
lic care only. Scandinavian Journal of Caring Sciences. 2008; 22(1):
136-148. PMid:18269433 http://dx.doi.org/10.1111/j.1471-6712.2007.00549.x
[4] Luppa M, et al. Prediction of institutionalization in the elderly. A sys-
tematic review. Age and Ageing. 2010; 39(1): 31-8. PMid:19934075
http://dx.doi.org/10.1093/ageing/afp202[5] Døhl Ø, et al. Variations in levels of care between nursing home pa-
tients in a public health care system. BMC Health Services Research.
2014; 14(1): 108. PMid:24597468 http://dx.doi.org/10.1186/1472-6963-14-108
[6] Katz S, et al. Studies of illness in the aged. The index of ADL: A
standardized measure of biological and psychosocial function. JAMA.
1963; 185: 914-9. PMid:14044222 http://dx.doi.org/10.1001/jama.1963.03060120024016
[7] Lawton MP, Brody EM. Assessment of older people: self-maintaining
and instrumental activities of daily living. The Gerontologist. 1969;
9(3): 179-86. PMid:5349366 http://dx.doi.org/10.1093/geront/9.3_Part_1.179
[8] Mahoney FI, Barthel DW. Functional Evaluation: The Barthel Index.
Maryland State Medical Journal. 1965; 14: 61-5. PMid:14258950
[9] Folstein MF, Folstein SE, McHugh PR. “Mini-mental state”–A prac-
tical method for grading the cognitive state of patients for the
clinician. Journal of Psychiatric Research. 1975; 12(3): 189-98.
http://dx.doi.org/10.1016/0022-3956(75)90026-6[10] Morris JN, et al. MDS Cognitive Performance Scale. Journal of
Gerontology. 1994; 49(4): M174-82. PMid:8014392 http://dx.doi.org/10.1093/geronj/49.4.M174
[11] Granger CV, et al. Advances in functional assessment for medical
rehabilitation. Topics in Geriatric Rehabilitation. 1986; 1(3): 59-74.
http://dx.doi.org/10.1097/00013614-198604000-00007[12] Hebert R, Carrier R, Bilodeau A. The Functional Autonomy Measure-
ment System (SMAF): description and validation of an instrument
for the measurement of handicaps. Age and Ageing. 1988; 17(5):
293-302. http://dx.doi.org/10.1093/ageing/17.5.293[13] Haley SM, et al. Activity Outcome Measurement for Postacute Care.
Medical Care. 2004; 42(1): I-49. http://dx.doi.org/10.1097/01.mlr.0000103520.43902.6c
[14] Haley SM, et al. Short-form activity measure for post-acute care.
Arch Phys Med Rehabil. 2004; 85(4): 649-60. http://dx.doi.org/10.1016/j.apmr.2003.08.098
[15] Norstrom T, Thorslund M. The structure of IADL and ADL measures:
some findings from a Swedish study. Age and Ageing. 1991; 20(1):
23-8. PMid:2028846 http://dx.doi.org/10.1093/ageing/20.1.23
[16] Spector WD, Fleishman JA. Combining activities of daily living
with instrumental activities of daily living to measure functional
disability. J Gerontol B Psychol Sci Soc Sci. 1998; 53(1): S46-
57. PMid:9469179 http://dx.doi.org/10.1093/geronb/53B.1.S46
[17] Thomas VS, Rockwood K, McDowell I. Multidimensionality in In-
strumental and Basic Activities of Daily Living. Journal of Clinical
Epidemiology. 1998; 51(4): 315-321. http://dx.doi.org/10.1016/S0895-4356(97)00292-8
[18] Chong DKH. Measurement of instrumental activities of daily living
in stroke. Stroke. 1995; 26(6): 1119-1122. http://dx.doi.org/10.1161/01.STR.26.6.1119
[19] Lindeboom R, et al. Activities of daily living instruments Optimizing
scales for neurologic assessments. Neurology. 2003; 60(5): 738-
742. http://dx.doi.org/10.1212/01.WNL.0000044402.16315.FC
[20] Avlund K. Methodological challenges in measurements of functional
ability in gerontological research. A review. Aging Clinical and Ex-
perimental Research. 1997; 9(3): 164-174. http://dx.doi.org/10.1007/BF03340145
[21] Cabrero-Garcia J, Lopez-Pina JA. Aggregated measures of functional
disability in a nationally representative sample of disabled people:
analysis of dimensionality according to gender and severity of disabil-
ity. Quality of Life Research. 2008; 17(3): 425-36. PMid:18264797
http://dx.doi.org/10.1007/s11136-008-9313-x[22] Linacre JM, et al. The structure and stability of the Functional Inde-
pendence Measure. Arch Phys Med Rehabil. 1994; 75(2): 127-32.
PMid:8311667
[23] Stineman MG, et al. Impairment-specific dimensions within the
Functional Independence Measure. Arch Phys Med Rehabil. 1997;
78(6): 636-43. http://dx.doi.org/10.1016/S0003-9993(97)90430-5
Published by Sciedu Press 9

http://jnep.sciedupress.com Journal of Nursing Education and Practice 2016, Vol. 6, No. 7
[24] Ng TP, et al. Physical and Cognitive Domains of the Instrumen-
tal Activities of Daily Living: Validation in a Multiethnic Popula-
tion of Asian Older Adults. The Journals of Gerontology Series A:
Biological Sciences and Medical Sciences. 2006; 61(7): 726-735.
http://dx.doi.org/10.1093/gerona/61.7.726[25] Leung DYP, Leung AYM, Chi I. An Evaluation of the Factor Struc-
ture of the Instrumental Activities of Daily Living Involvement and
Capacity Scales of the Minimum Data Set for Home Care for El-
derly Chinese Community Dwellers in Hong Kong. Home Health
Care Services Quarterly. 2011; 30(3): 147-159. PMid:21846228
http://dx.doi.org/10.1080/01621424.2011.592421[26] Coster WJ, et al. Refining the conceptual basis for rehabilitation out-
come measurement: personal care and instrumental activities domain.
Medical Care. 2004; 42(1 Suppl): I62-72. http://dx.doi.org/10.1097/01.mlr.0000103521.84103.21
[27] Stephan A, et al. Validity, reliability, and feasibility of the German
version of the Caregiver Reaction Assessment scale (G-CRA): a
validation study. International Psychogeriatrics. 2013; 25(10): 1621-
1628. PMid:23886344 http://dx.doi.org/10.1017/S1041610213001178
[28] McHorney CA, Cohen AS. Equating Health Status Measures with
Item Response Theory: Illustrations with Functional Status Items.
Medical Care. 2000; 38(9): II43-II59. http://dx.doi.org/10.1097/00005650-200009002-00008
[29] Fortinsky RH, et al. Measuring disability in Medicare home care pa-
tients: application of Rasch modeling to the outcome and assessment
information set. Medical Care. 2003. 601-615 p.
[30] Fieo RA, et al. Calibrating ADL-IADL scales to improve mea-
surement accuracy and to extend the disability construct into
the preclinical range: a systematic review. BMC Geriatr. 2011;
11: 42. PMid:21846335 http://dx.doi.org/10.1186/1471-2318-11-42
[31] Norwegian Directorate of Health, IPLOS veileder for personell i kom-
munale helse- og omsorgstjenester (In Norwegian). Oslo: Norwegian
Directorate of Health. 2014.
[32] Ministry of Health and Care Services, St. meld. nr. 50 Handlingsplan
for eldreomsorgen (1996-97) (In Norwegian). Oslo. 1997.
[33] Norwegian Directorate of Health, Individbasert pleie- og om-
sorgsstatistikk (IPLOS) i kostra - Forslag til informasjonssystem
for pleie- og omsorgstjenesten (in Norwegian). Helsedirektoratet.
2000.
[34] Fries BE, et al. Refining a case-mix measure for nursing homes: Re-
source Utilization Groups (RUG-III). Medical Care. 1994; 32(7): 668-
85. http://dx.doi.org/10.1097/00005650-199407000-00002
[35] WHO. International classifïcation of impairments, disabilities and
handicaps: A manual of classification retating to the consequences
of clisease. Geneva: World Health Organization. 1980.
[36] Herbern SM, Grimeland MO. Hvordan benytter kommunene seg
av og vedlikeholder IPLOS-dataene?–En undersøkelse til norske
kommuner (In Norwegian), ed. N.D.o. health. Oslo: Norwegian
Directorate of Health. 2014.
[37] Trondheim Kommune, Rutiner ved registrering av ADL ferdigheter
(unpublished) (In Norwegian). 2008.
[38] Watson R, Thompson DR. Use of factor analysis in Journal of Ad-
vanced Nursing: literature review. Journal of Advanced Nursing.
2006; 55(3): 330-341. PMid:16866827 http://dx.doi.org/10.1111/j.1365-2648.2006.03915.x
[39] Holgado-Tello FP, et al. Polychoric versus Pearson correlations in
exploratory and confirmatory factor analysis of ordinal variables.
Quality & Quantity. 2010; 44(1): 153-166. http://dx.doi.org/10.1007/s11135-008-9190-y
[40] Kline R. Exploratory and Confirmatory Factor Analysis, in Ap-
plied Quantitative Analysis in the Social Sciences, Y. Petscher, C.
Schatschneider, and D.L. Compton, Editors. Taylor and Francis:
Hoboken. 2013.
[41] Gliem JA, Gliem RR. Calculating, interpreting, and reporting Cron-
bach’s alpha reliability coefficient for Likert-type scales. Midwest
Research-to-Practice Conference in Adult, Continuing, and Commu-
nity Education. 2003. PMid:12684791
[42] Mulaik SA. Foundations of factor analysis. Boca Raton, FL: Chap-
man & Hall/CRC. XXIII. 2009.
[43] Thompson B. Exploratory and confirmatory factor analysis: under-
standing concepts and applications. Washington, DC: American Psy-
chological Association. 2004. http://dx.doi.org/10.1037/10694-000
[44] Brown TA. Confirmatory factor analysis for applied research. New
York: Guilford Press. XVIII. 2006.
[45] DeMars C. Item Response Theory. Oxford: Oxford University
Press; 2010. http://dx.doi.org/10.1093/acprof:oso/9780195377033.001.0001
[46] Bond TG, Fox CM. Applying the Rasch model: fundamental mea-
surement in the human sciences. New York: Routledge. 2012.
[47] Wolfe F, Kong SX. Rasch analysis of the Western Ontario MacMas-
ter questionnaire (WOMAC) in 2205 patients with osteoarthritis,
rheumatoid arthritis, and fibromyalgia. Annals of the rheumatic dis-
eases. 1999; 58(9): 563-568. PMid:10460190 http://dx.doi.org/10.1136/ard.58.9.563
[48] Jackson TR, et al. Validation of authentic performance assessment: a
process suited for Rasch modeling. American Journal of Pharmaceu-
tical Education. 2002; 66(3): 233-242.
[49] Coenders G, Saris WE. Categorization and measurement quality.
The choice between Pearson and Polychoric correlations, in The
multitrait-multimethod approach to evaluate measurement instru-
ments, W.E. Saris and A. Münich, Editors. Budapest, Eötvös Univer-
sity Press; 1995. 125-144 p.
[50] Tabachnick BG, Fidell LS. Using multivariate statistics. Boston,
Mass.: Allyn and Bacon. 2001. PMid:16705786
[51] Osborne JW, Costello AB, Kellow TJ. Best practices in exploratory
factor analysis, in Best practices in quantitative methods, J.W. Os-
borne, Editor. Thousand Oaks, Calif: SAGE Publications; 2008.
[52] Sommer OH, et al. Factor analysis of the brief agitation rating scale
in a large sample of Norwegian nursing home patients. Dementia and
Geriatric Cognitive disorders. 2010; 29(1): 55-60. PMid:20110701
http://dx.doi.org/10.1159/000265542[53] Finlayson M, Mallinson T, Barbosa VM. Activities of daily living
(ADL) and instrumental activities of daily living (IADL) items were
stable over time in a longitudinal study on aging. J Clin Epidemiol.
2005; 58(4): 338-49. PMid:15862719 http://dx.doi.org/10.1016/j.jclinepi.2004.10.008
[54] Lai SM, et al. Physical and social functioning after stroke: compar-
ison of the Stroke Impact Scale and Short Form-36. Stroke. 2003;
34(2): 488-93. http://dx.doi.org/10.1161/01.STR.0000054162.94998.C0
[55] Sheehan TJ, et al. Measuring disability: application of the Rasch
model to activities of daily living (ADL/IADL). J Outcome Meas.
2001; 5(1): 839-63.
[56] Norwegian Directorate of Health, Anbefaling fra arbeidsgruppe re-
videring av IPLOS samlemål-Rapport fra arbeidsgruppe nedsatt av
Helsedirektoratet. Oslo (in Norwegian): Helsedirektoratet. 2010.
10 ISSN 1925-4040 E-ISSN 1925-4059