Overview of Excel Object Model
ISYS 562

Excel’s Database Tools
• Lookup and Database functions:– VLookUp, D functions
• Data– Sort– Filter– Subtotals– Pivot table/Pivot chart
• OLAP: On Line Analytical Process• DrillDown, RollUp
– Import external data• Import data• New web query• New database query
• ADO

Data/Import External Data
• New Database Query
• Select <New Data Source> and click OK.

OLAP Cube• Data/Import External Data/New database query:
– Define query– In the last step, choose Create OLAP Cube

OLAP Wizard
• Source of data to be summarized
• Analysis dimensions

Web Query
• Data/Import External Data/New web query• Click table on the web page • Use the Save Query button to save web query• Web query can be refreshed. Copy/Paste can
not.

Import Data
• Data/Import External Data/Import Data

Excel Object Model

• Excel Application– Workbooks/Workbook
• Worksheets– Worksheet
» Range» Cells
– Shapes» Drawing objects
• Charts» Chart
• User form

Workbooks Object
• Properties:– Count– Item
• Methods:– Add: Create a new, empty workbook – Open: This method opens an Excel file and creates a
new workbook for the opened file. • Workbooks.Open "c:\f.xls"
– OpenDataBase: This method creates a new workbook and opens the database for import.
• Workbooks.OpenDatabase "C:\salesDB.mdb"

Workbook Object
• Properties:– ActiveChart, ActiveSheet– Charts, Sheets– ReadOnly, Password
• Methods:– Activate– RefreshAll– Save, SaveAs– Close

Worksheets Object
• Properties:– Count– Item
• Methods:– Add: – Delete: Worksheets("Sheet3").Delete – Copy– Move: Worksheets("Sheet1").Move after:=Worksheets("Sheet3")
– Select

Worksheet Object
• Properties:– Cells– Columns: Worksheets("Sheet1").Columns(1).Font.Bold = True
– ListObjects– Range
– Rows: Worksheets("Sheet1").Rows(3).Delete – Shapes

Cells
• Cells(Index): – Index is cell’s sequence number.
• A1 – cells(1), B1 - Cells(2), C1 – cells(3).
• Cells(RowIndex, ColIndex)• A1 – Cells(1 ,1), B3 – Cells(3, 2)
• Cells with no index:– All cells in a worksheet.

Cells Examples
This example sets the font size for cell C5 on Sheet1 to 14 points:
Worksheets("Sheet1").Cells(5, 3).Font.Size = 14
This example clears the formula in cell one on Sheet1:Worksheets("Sheet1").Cells(1).ClearContents
Worksheets(1).Cells(1, 1).Value = 24
This example sets the font and font size for every cell on Sheet1 to 8-point Arial:
With Worksheets("Sheet1").Cells.Font .Name = "Arial" .Size = 8
End With The following example sets the formula for cell A2.
ActiveSheet.Cells(2, 1).Formula = "=Sum(B1:B5)"

Cells with Loop
This example loops through cells A1:J4 on Sheet1. If a cell contains a value less than 0.001, the example replaces that value with 0 (zero).
For rwIndex = 1 to 4 For colIndex = 1 to 10
With Worksheets("Sheet1").Cells(rwIndex, colIndex) If .Value < .001 Then .Value = 0
End With Next colIndex
Next rwIndex

Use ADO to Import A TablePrivate Sub CommandButton1_Click()Dim cn As ADODB.ConnectionSet cn = New ADODB.Connectioncn.Open ("provider=microsoft.jet.oledb.4.0;data source=c:\salesDB.mdb;")Dim rs As ADODB.RecordsetSet rs = New ADODB.Recordsetrs.Open "select * from customer", cn, adOpenKeysetDim i, j As IntegerFor i = 1 To rs.Fields.Count Sheet1.Cells(i) = rs.Fields(i - 1).NameNext ii = 2Do While Not rs.EOFFor j = 1 To rs.Fields.Count Sheet1.Cells(i, j) = rs.Fields(j - 1)Next ji = i + 1rs.MoveNextLoopEnd Sub

Range Object
• Represents a cell, a row, a column, a selection of cells containing one or more contiguous blocks of cells, or a 3-D range.

Range Object Properties and Methods
• Properties:– CurrentRegion: The current region is a range
bounded by any combination of blank rows and blank columns.
– Formula– Value
• Methods:– Activate– AutoFormat– Clear– Delete– Select

Referring to a Range • Use Range(arg), where arg names the range, to return a
Range object that represents a single cell or a range of cells. The following example places the value of cell A1 in cell A5.
– Worksheets("Sheet1").Range("A5").Value = 10– Worksheets(“sheet1”).Range(“myRange”)=10– Worksheets(“sheet1”).Range(“myRange”).Select
• The following example fills the range A1:H8 with random numbers by setting the formula for each cell in the range. When it’s used without an object qualifier (an object to the left of the period), the Range property returns a range on the active sheet. Use the Activate method to activate a worksheet before you use the Range property without an explicit object qualifier.
– Worksheets("Sheet1").Activate – Range("A1:H8").Formula = "=Rand()"

• Referring to a range as a collection of cells:– Cells.select, Cells(1).select– ActiveSheet.Cells(2, 1).Formula = "=Sum(B1:B5)"
• Referring to a range as collection of rows or columns:– Rows(2).select, Rows(“3:10”).select– Columns(3).select, Columns(“A:C”).select
• Referring to a range as current selection:– ActiveCell.CurrentRegion– Selection

Range Example
Worksheets("faculty").Range("a1").SelectActiveCell.CurrentRegion.AutoFormat Format:=xlRangeAutoFormatClassic1
ActiveCell.CurrentRegion.SelectMsgBox (Selection.Count)

Selection PropertyReturns the selected object in the active window, for an Application object, and a specified window, for a Windows object.
The returned object type depends on the current selection (for example, if a cell is selected, this property returns a Range object). The Selection property returns Nothing if nothing is selected.Using this property with no object qualifier is equivalent to using Application.Selection.
ExampleThis example clears the selection on Sheet1 (assuming that the selection is a range of cells).
Worksheets("Sheet1").ActivateSelection.Clear
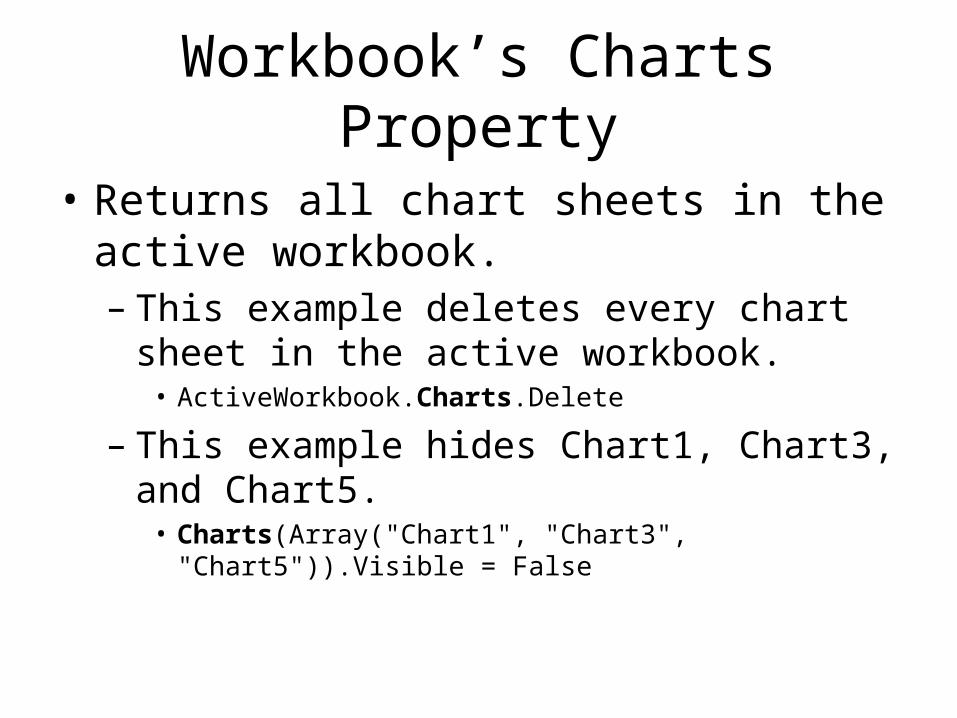
Workbook’s Charts Property
• Returns all chart sheets in the active workbook.– This example deletes every chart sheet in the
active workbook.• ActiveWorkbook.Charts.Delete
– This example hides Chart1, Chart3, and Chart5.
• Charts(Array("Chart1", "Chart3", "Chart5")).Visible = False

Macro that Creates a Chart
Sub CreateChart() Charts.Add ActiveChart.ChartType = xlColumnClustered ActiveChart.SetSourceData Source:=Sheets("faculty").Range("B1:C4"), PlotBy _ :=xlColumns ActiveChart.Location Where:=xlLocationAsNewSheet With ActiveChart .HasTitle = True .ChartTitle.Characters.Text = "Students" .Axes(xlCategory, xlPrimary).HasTitle = True .Axes(xlCategory, xlPrimary).AxisTitle.Characters.Text = "Faculty" .Axes(xlValue, xlPrimary).HasTitle = True .Axes(xlValue, xlPrimary).AxisTitle.Characters.Text = "Number of Students" End WithEnd Sub

VBA Procedure that Creates a Chart
Dim newChart As ChartSet newChart = Charts.AddWith newChart .ChartType = xl3DColumn .SetSourceData Source:=Sheets("faculty").Range("B1:C4"), PlotBy _ :=xlColumns .Location Where:=xlLocationAsNewSheet .HasTitle = True .ChartTitle.Characters.Text = "Students" .Axes(xlCategory, xlPrimary).HasTitle = True .Axes(xlCategory, xlPrimary).AxisTitle.Characters.Text = "Faculty" .Axes(xlValue, xlPrimary).HasTitle = TrueEnd With

User Form
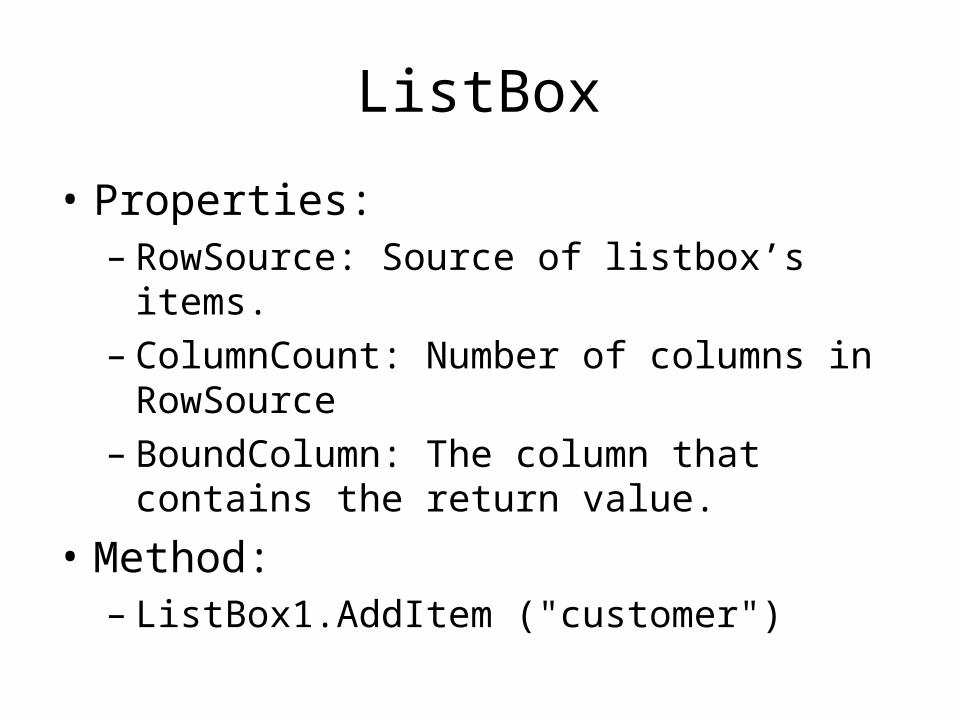
ListBox
• Properties:– RowSource: Source of listbox’s items.– ColumnCount: Number of columns in
RowSource– BoundColumn: The column that contains the
return value.
• Method:– ListBox1.AddItem ("customer")

SpinButton
• Max: Maximum value
• Min: Minimum value
• SmallChange: – Increment or decrement when click.

Pairing a Spinbutton with a Textbox
• Private Sub SpinButton1_Change()
• TextBox1.Text = SpinButton1.Value
• End Sub

OptionButton
• If OptionButton2 Then
• ListBox1.BoundColumn = 3
• Else
• ListBox1.BoundColumn = 2
• End If

ListBox RowSource
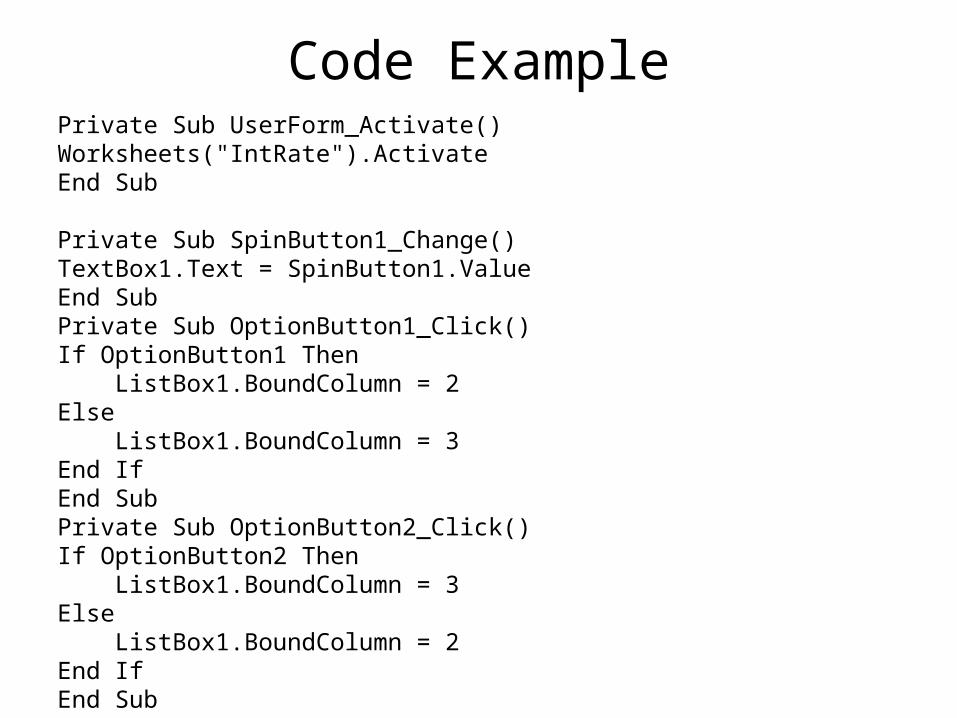
Code ExamplePrivate Sub UserForm_Activate()Worksheets("IntRate").ActivateEnd Sub
Private Sub SpinButton1_Change()TextBox1.Text = SpinButton1.ValueEnd SubPrivate Sub OptionButton1_Click()If OptionButton1 Then ListBox1.BoundColumn = 2Else ListBox1.BoundColumn = 3End IfEnd SubPrivate Sub OptionButton2_Click()If OptionButton2 Then ListBox1.BoundColumn = 3Else ListBox1.BoundColumn = 2End IfEnd Sub

Private Sub ListBox1_Click()TextBox4.Text = ListBox1.ValueEnd SubPrivate Sub SpinButton1_Change()TextBox1.Text = SpinButton1.ValueEnd Sub
Private Sub CommandButton1_Click()Dim Term As IntegerIf OptionButton1 Then Term = 15Else Term = 30End IfMsgBox (-Pmt(TextBox4.Value / 12, Term * 12, TextBox1.Value))End Sub

MultiPage Control
• Properties:– Caption
• To add a new page:– Point to a page’s caption and right click,
choose the New Page fom the context menu.

Events
• Workbook– VBE explorer: ThisWorkBook
• Open event– Private Sub Workbook_Open()
• UserForm1.Show– End Sub
• Worksheet– Activate event
• Private Sub Worksheet_Activate()• UserForm1.Show• End Sub