OPTIMAL PROCESS DESIGN FOR RECYCLED PET BLENDS
IN INJECTION MOLDING
by
PERRY H. JOHNSON
A Senior Project submitted
In partial fulfillment
of the requirements for the degree of
Bachelor of Science in Manufacturing Engineering
California Polytechnic State University
San Luis Obispo
Graded by:_________________ Date of Submission:_______________
Checked by:________________ Approved by:_____________________
Table of Contents ABSTRACT .................................................................................................................................... 1
INTRODUCTION .......................................................................................................................... 2
BACKGROUND ............................................................................................................................ 5
PET Plastics ................................................................................................................................ 5
Injection Molding........................................................................................................................ 6
Design of Experiments ................................................................................................................ 7
Economic Justification ................................................................................................................ 8
DESIGN ........................................................................................................................................ 10
DOE Basis ................................................................................................................................. 10
Creating a Mathematical Model................................................................................................ 12
Predictive Model ....................................................................................................................... 13
Injection Molding Parameters ................................................................................................... 15
Cylinder temperature settings ............................................................................................... 15
Injection rate ......................................................................................................................... 15
Holding pressure and time .................................................................................................... 16
Plasticizing screw speed and back pressure .......................................................................... 16
Mold geometry ...................................................................................................................... 16
METHODOLOGY ....................................................................................................................... 17
Material Adequacy .................................................................................................................... 17
Virgin PET ............................................................................................................................ 17
Recycled PET........................................................................................................................ 17
Experimental Runs .................................................................................................................... 18
Gathering of Data ...................................................................................................................... 19
Tensile testing ....................................................................................................................... 19
RESULTS ...................................................................................................................................... 24
ANOVA ..................................................................................................................................... 25
Response 1 (Yield Stress) ..................................................................................................... 25
Response 2 (Young‘s Modulus) ............................................................................................ 27
Solution To Predictive Model ................................................................................................... 29
Response Surface Graphs ......................................................................................................... 29
Response 1 (Yield Stress) ..................................................................................................... 29
Response 2 (Young‘s Modulus) ............................................................................................ 30
Optimization ............................................................................................................................. 30
CONCLUSION ............................................................................................................................. 31

THANKS ...................................................................................................................................... 32
RESOURCES ............................................................................................................................... 33
APPENDIX ................................................................................................................................... 35
PET Properties .......................................................................................................................... 35
Tensile Testing .......................................................................................................................... 36
1
ABSTRACT
This case study on optimization of blends with process variables shows how application
of advanced tools of Design of Experiments can simultaneously optimize a mixture formulation
and processing conditions, taking advantage of complex interactions in the system. The effect of
recycled PET and virgin PET on tensile strength and stiffness was studied. The optimal amount
of mixture components to produce maximum recycled-content products is determined. As the
results of doing systematic experimentation, using mixture experiments, the quality of recycled
plastic products can be improved and becomes more robust to variations at the optimal thermal
operating settings. This is done through numerical optimization approaches that are available,
using a mixture-process-variable simplex experimental setup to generate a predictive model of
mechanical response. Then manipulating the predictive models is completed to find the ―sweet
spot‖ for both mixture and process variables.
2
INTRODUCTION
The last few decades has witnessed significant increase in world population. This has
caused considerable increase in the demand for low cost living conditions, which in part leads to
dramatic increase in the consumption of plastics. Past statistics show that worldwide annual
production of plastics is over 100 million tons per year [1]. There is approximately 3 million tons
of plastic waste produced from that, of which environmental agencies report around 80%
reaching landfill sites [2]. The practical solution is to recycle or reuse the plastic that has already
been produced. In fact, recycling plastic has many advantages:
Using a resource that would otherwise be wasted
Reducing or preventing the amount of waste going to landfill
Reducing the costs involved in the disposal of waste, which ultimately leads to savings
for the community
Providing employment
Protecting natural resources
Reducing pollution
Over the last many years, the focus of plastic recycling has changed. Earlier, the focus
was on educating and encouraging the public and industry to recycle. As the necessity and
incentives to reduce the volume of waste materials entering our landfills sunk into the populace‘s
minds, market forces became such that millions of pounds of plastic waste heading for the
landfill now had some value. The question then turned to one of how to collect this material and
convert it into a marketable raw material. The economies dictate that recycled materials are the
more expensive engineering resins, such as polycarbonate, nylon, and PET [3]. In some cases,
the cost of recyclable materials also exceeds the cost of raw materials due to processing and
transportation costs. In the United States, the recovery of postconsumer plastics for 2009 was
approximately 7% (U.S. EPA 2011) [4]. So it is desirable to find uses for recycled plastic
material that can be justified by having a similar cost to a virgin material‘s alternative solution.
Plastics that can be recycled are called thermoplastic polymers. Some typical examples of
thermoplastic polymers are polyethylene terephthalate (PET), polypropylene, polyethylene,
polycarbonate, etc. Plastic material selection for many materials (plastics, metals, etc.) can be a
highly complex process if not properly approached particularly when using recycled plastics. Its
methodology ranges from a high degree of subjective intuition in some areas to a high degree of
sophistication in others. When selecting an additive for a mixture, it is important to take into
account also the potential side-effects it may have on other properties. In some cases, the cost of
the system will be reduced, but at a penalty in other directions such as mechanical properties that
can influence performance of the fabricated product [5]. Any attempt to compare mixed plastic
with other conventional materials (metal, wood, glass, etc.) on a straight property-for-property or
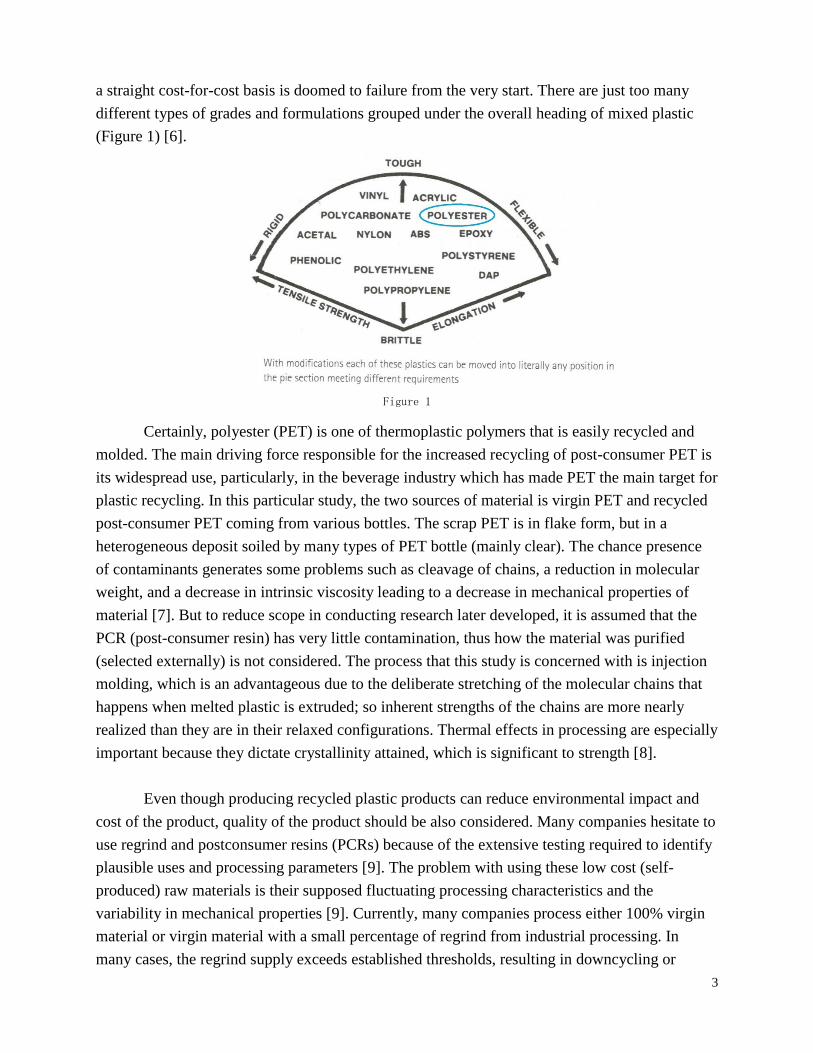
3
a straight cost-for-cost basis is doomed to failure from the very start. There are just too many
different types of grades and formulations grouped under the overall heading of mixed plastic
(Figure 1) [6].
Figure 1
Certainly, polyester (PET) is one of thermoplastic polymers that is easily recycled and
molded. The main driving force responsible for the increased recycling of post-consumer PET is
its widespread use, particularly, in the beverage industry which has made PET the main target for
plastic recycling. In this particular study, the two sources of material is virgin PET and recycled
post-consumer PET coming from various bottles. The scrap PET is in flake form, but in a
heterogeneous deposit soiled by many types of PET bottle (mainly clear). The chance presence
of contaminants generates some problems such as cleavage of chains, a reduction in molecular
weight, and a decrease in intrinsic viscosity leading to a decrease in mechanical properties of
material [7]. But to reduce scope in conducting research later developed, it is assumed that the
PCR (post-consumer resin) has very little contamination, thus how the material was purified
(selected externally) is not considered. The process that this study is concerned with is injection
molding, which is an advantageous due to the deliberate stretching of the molecular chains that
happens when melted plastic is extruded; so inherent strengths of the chains are more nearly
realized than they are in their relaxed configurations. Thermal effects in processing are especially
important because they dictate crystallinity attained, which is significant to strength [8].
Even though producing recycled plastic products can reduce environmental impact and
cost of the product, quality of the product should be also considered. Many companies hesitate to
use regrind and postconsumer resins (PCRs) because of the extensive testing required to identify
plausible uses and processing parameters [9]. The problem with using these low cost (self-
produced) raw materials is their supposed fluctuating processing characteristics and the
variability in mechanical properties [9]. Currently, many companies process either 100% virgin
material or virgin material with a small percentage of regrind from industrial processing. In
many cases, the regrind supply exceeds established thresholds, resulting in downcycling or
4
landfilling of significant quantities of regrind [9]. As discussed earlier, thermal processing
conditions as well as mixture conditions affect quality characteristics, so a method that
characterizes recycled plastic by both processing parameters and mixture state could
dramatically increase the supply of acceptable recycled plastic over the generic threshold
approach. This project aims to demonstrate the economic and technical feasibility of using a
optimal ratio of recovered recycled PET plastic (RPET) to virgin PET pellets in a specific
injection molding process. This is done in part by providing polynomial equations that can
predict the mechanical response based on machine settings and blend state, conceived through a
designed experiment.
Designed experiments are a very powerful tool to quantify the effect of the factors on the
response in production processes, or, ultimately, to determine which factor level combinations
provide optimal output quality. A key feature of designed experiments is that the researcher
varies the factor levels systematically, according to a certain experimental plan, which is
developed in the Design section. Thus, the Yield Stress and Young‘s Modulus are the two
selected quality objectives. Thus this paper works to analyze Yield Stress and Young‘s Modulus
results based only on three thermal processing parameters of a binary mixture design of
PET/RPET in Injection Molding.
Powerful desktop computer tools now make it easy to optimize paint formulations. Aided
by the computer, statistically based Design of Experiments (DOE) — a proven method for
making breakthrough improvements in cost and performance — can be applied. The latest
versions of dedicated DOE software exhibit more versatility than ever to create optimal designs
that handle any combination of mixture components and processing factors (Design Expert by
Stat-Ease is used). These computer programs easily manipulate almost any number of responses
in powerful optimization routines that reveal ―sweet spots‖ — the operating windows that meet
all specifications at minimal cost.
5
BACKGROUND
PET Plastics
In order to more fully understand internal problems that may arise in processing, more
specific knowledge of PET is required. Thermoplastic material is composed of carbon and
hydrogen atoms joined together forming long-chain high-molecular-weight products. These
features determine the mechanical properties such as density, stiffness, tensile strength,
flexibility, hardness, brittleness, elongation and creep characteristics [10]. The molecular
arrangements largely depend on the process characteristics used for manufacturing of PET
products. In PET longer the main chain, the greater the number of atoms, and consequently, the
greater the molecular weight.
The crystalline term is used to describe a thermoplastic (TP) of a highly ordered structure
with sharp melt points. They do not therefore soften gradually as the temperature increases but
tend to remain hard until a given quantity of heat has been absorbed, at which point they rapidly
change to a low viscosity melt. The mechanical properties are greatly influenced by this melt
flow action. They are anisotropic in flow, shrinking less in the direction of flow than transverse
to it [11]. Crystalline behavior identifies its morphology; that is the study of the physical form or
structure of a material. They are usually translucent (glassy) or opaque, which the PET is, and
generally have higher softening points than amorphous plastics. Since commercially perfect
crystalline polymers are not produced, they are identified technically as semi-crystalline TP‘s.
The crystalline TP‘s normally have up to 80% crystalline structure and the rest is amorphous,
with recycled content being more amorphous.
As the consequence – the crystallinity of injection molded parts can be influenced by
processing conditions like mold temperature or melt temperature. When the mold temperature is
higher, the crystallinity degree of molded parts is also higher. This feature of injection molded
parts directly influences their mechanical properties – parts of higher crystallinity degree have
higher values of hardness, tensile strength, wear resistance and better dimensional stability.
A wide range of applications is possible because of the excellent balance of properties
PET possesses and because the degree of crystallinity and the level of orientation in the finished
product can be controlled. Polyethylene Terephthalate does not reach its optimum properties
until the level of crystallinity is raised by special processing and/or the molecules are oriented
[12]. For packaging applications PET is used because it combines optimal processing,
mechanical, and barrier properties. Very few other materials offer such a range of processing and
property variables. In general, Polyesters (PET) are easy to process. Nevertheless, specific
6
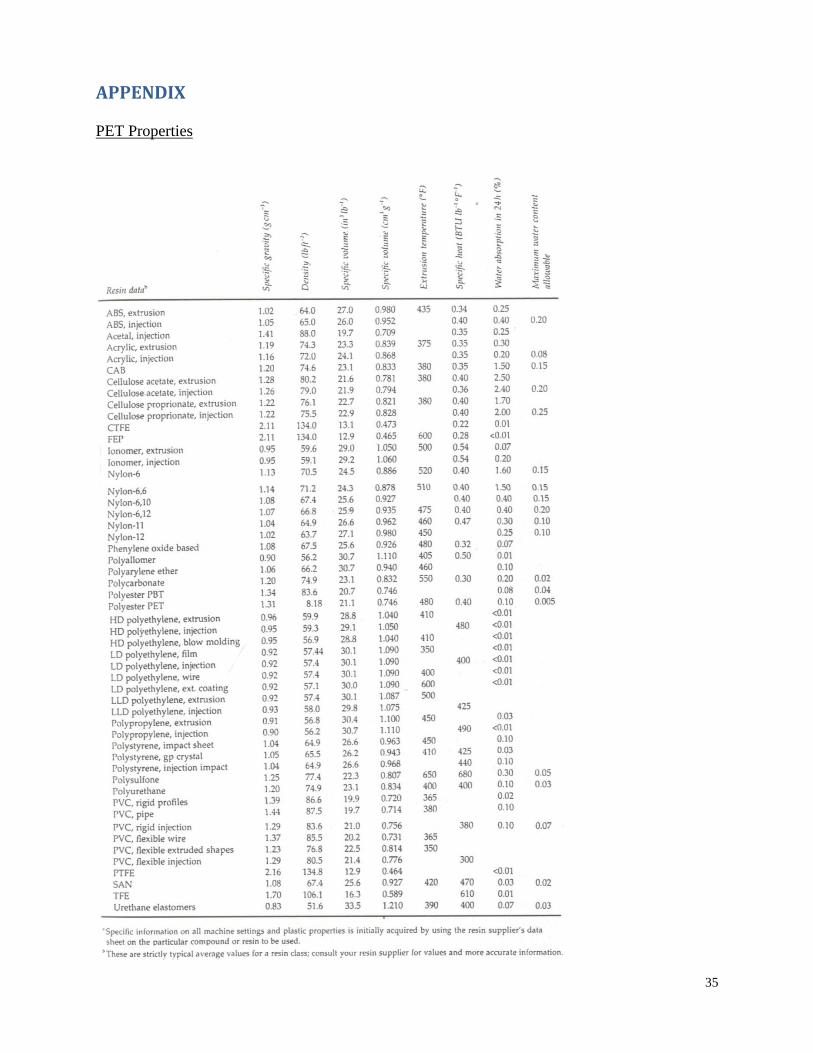
properties should be noted such as an extrusion temperature of 480°F [13] can be the basis for
early process design (more property information is provided in Appendix).
If small amounts of moisture are present, PET resins are inherently sensitive to
degradation in the melt. This degradation process, which results in a lowering of the molecular
weight (breakdown of the polymer chain), is known as hydrolysis. To prevent this effect, the
moisture content of the granules should be maintained at a low level if at all possible. In general,
to obtain good parts of constant quality during production, PET grades should be dried to a level
below 50ppm (parts per million). Reaching the desired moisture level typically requires drying at
212-248°F during 4-6 hours. Higher temperature settings should be avoided to prevent material
discoloration. If there are no heating hook-ups for the mold, running several shots until it has
heated up sufficiently is an alternative.
Injection Molding
The term Injection Molding is an oversimplified description of a quite complicated
process that is controllable within specified limits. Melted or plasticized plastic material is
injected by force into a mold cavity. The process is one of the most economical methods for
mass production of simple to complex products. Three basic operations exist. They are the only
operations in which the mechanical and thermal inputs of the injection equipment must be
coordinated with the fundamental behavior properties of the plastic being processed. They are
heating of the plastic to molding temperature, inject it, and then cooling (or solidify) the product
in the mold [14]. The programming of different injection speeds and pressures during the
forward travel of the screw or plunger greatly aids in filling cavities properly. The clamp tonnage
of a machine must have sufficient locking force not to cause the parting of the hold halves; it
resists the force of melted plastic moving at high pressures into the mold halves. If the mating
surfaces of the mold are forced apart, even a few thousands of an inch (depending on type of
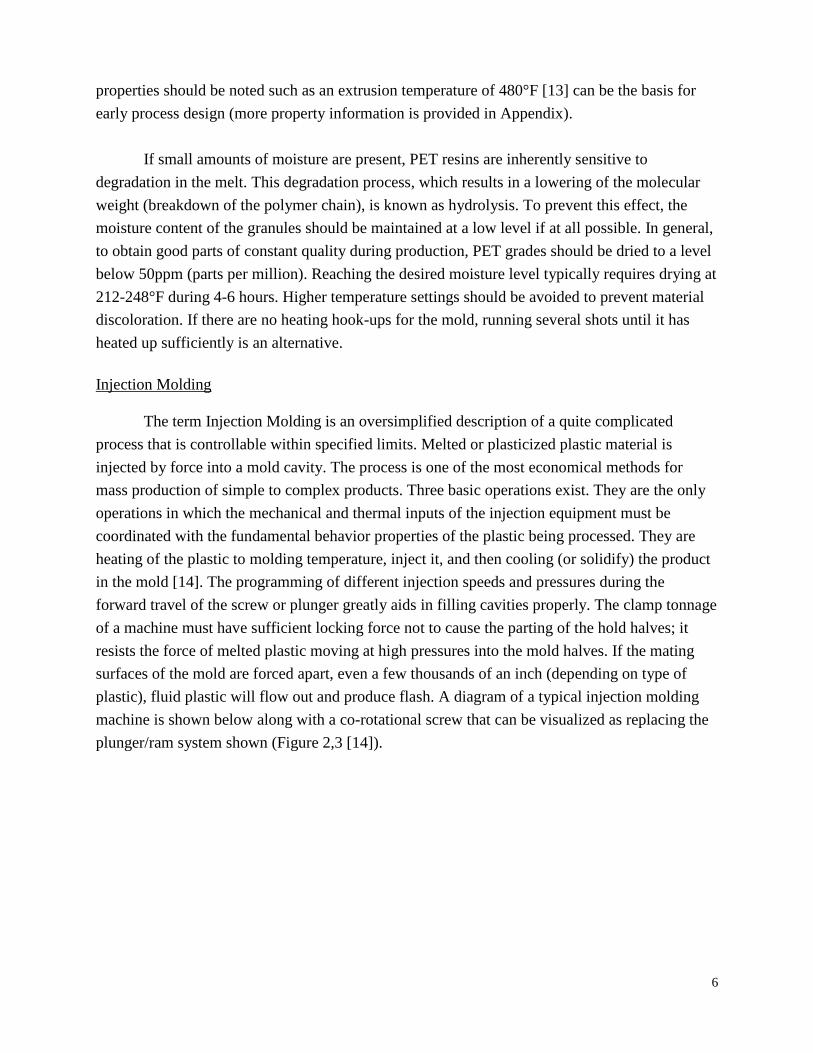
plastic), fluid plastic will flow out and produce flash. A diagram of a typical injection molding
machine is shown below along with a co-rotational screw that can be visualized as replacing the
plunger/ram system shown (Figure 2,3 [14]).
7
Figure 2
Figure 3
Design of Experiments
Traditional experimental design is focused on several factors that are varied in the form
of treatments, but in this study there is special consideration to be given for blend states. Having
a blend means that the components cannot be varied independently because they, in combination,
make up the whole mixture. On the other hand, process variables can and will be changed in
conjunction with blend states. This is something that needed looking into as past classroom
experience was not sufficient. So, to make this project more approachable, a previous statistically
significant design of this type of experiment was researched. It was carried out by an investigator
who looked into mixture design with the inclusion of process variables. John Cornell had
developed an adequate mathematical transformation of the variables leading to polynomial
models that describe the influence of the composition on the material flow properties using an
optimum experimental set [15]. The aim of these polynomial models is not to study in depth the
physical phenomena, but to apply them as practical models for the optimization of blend
composition. Details of how the experimental analysis will be produced in further sections, but it
can be noted that the thermal processing variables are nozzle, front barrel, and rear barrel
temperatures.
Design of Experiments analysis provides a solid estimate of the value of independent
variables in every possible combination by varying the values of all the factors in parallel. This
approach determines not just the main effects of each factor, but also the interactions between the
factors. But the statistical knowledge required to perform DOE and generate polynomials from
scratch can be an obstacle to its use. Design-Expert is easy to use program from Stat-Ease that
will be used to complete DOE analysis.
8
Economic Justification
Setting aside environmental concerns, the economic success or failure of plastics
recycling relies on two variables: the cost of the raw materials used to make virgin plastic,
petroleum and natural gas, and the cost of recycling versus the cost of disposal, which fluctuates
based on a city‘s proximity to recycling centers and the price to dump in local landfills.
Nonetheless, the cost of recycling a bottle versus making a new one simply varies, depending
where the bottle is and what the unpredictable price of oil happens to be.
It is found that a manufacturer of injection molded parts that used their own blend of
recycled resin was actually incredibly successful, using methodology somewhat similar to this
study. AGS Technology from Schaumburg, Illinois lowers the cost of the plastic-injection
molded parts it manufacturers by using recycled plastic as its raw material [16]. They are an
ISO/TS 16949-certified injection molder that uses its proprietary recycled plastics to produce
high-quality molded components, primarily for the automotive and durable goods industries
(Ford, Chrysler, and Chevrolet). Due to the recycled raw material cost being substantially less
than virgin materials, the company is able to pass on to its customers significant cost savings on
the resultant molded components.
AGS Technology formulates its own raw material, matching its properties to
corresponding virgin resins and to customer specifications. Traditional plastic compounders
convert recycled plastic into a raw material for injection molding applications by grinding the
recycled plastic and then extruding it into pellets, which is how recycled content can sometimes
exceed the cost of virgin content. Conversely, AGS Technology molds its formulated plastic
regrind directly and bypasses the expensive extruding/pelletizing operation from an outside
source. Often, molders who might have saved 10 percent in raw material costs by using recycled
plastics see these cost savings evaporate because of the manufacturing problems they will
experience while processing them. When a molder runs parts with virgin material, the runs are
consistent. But with recycled material, there is more variability, so the scrap rate may go up.
These types of things would have incurred costs and eliminated any potential savings. So
therefore it is beneficial to optimize the recycled blends, reducing variability.
"Plastics News," a trade magazine, lists the recent price of PET virgin bottle resin pellets
between 103 and 105 (104 avg.) cents a pound, compared to only 66 to 74 (70 avg.) cents a
pound for PET recycled bottle flake [17]. For a brief example, we can say that about 250,000 lbs.
of material is used for a certain job per year, and it uses an arbitrary 50-50 blend. The cost
differential between the recycled material and the corresponding virgin resin is $0.34 per lb.
That‘s an annual savings of $42,500 for the customer ($260,000 for plain virgin PET, and
$217,500 for the 50-50 blend), without sacrificing any quality standards because the performance
9
characteristics have been optimized. What could be a better testimonial to the economic benefit
of using recycled plastics?
Christopher Racelis, AGS President, explains that their ―business model is that we‘re a
low-cost producer for ‗shoot-and-ship‘ parts, using recycled plastics as our raw material.‖ The
products that they manufacture are material-intensive, so the bulk of the cost—it could be 50, 60,
70 percent—is in the raw material. So ―the best way to remove cost from the part is to mold the
most cost-effective raw material. And that is recycled plastic,‖ Racelis mentions [16].
10
DESIGN
DOE Basis
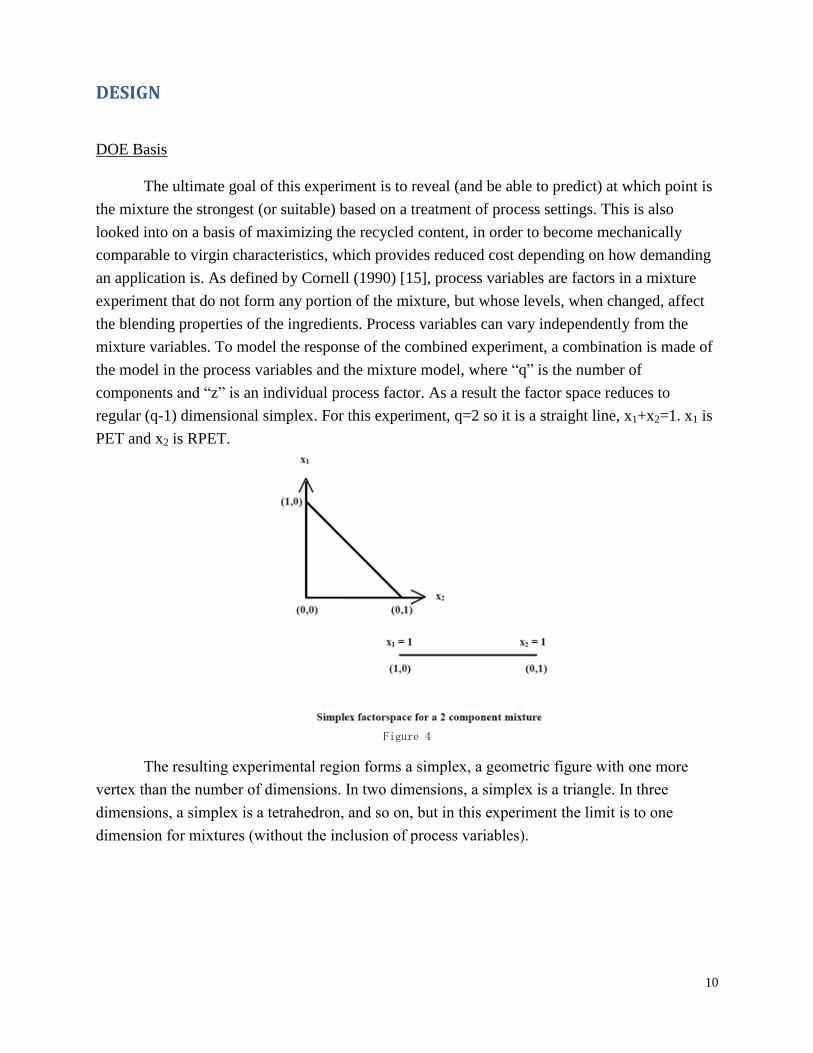
The ultimate goal of this experiment is to reveal (and be able to predict) at which point is
the mixture the strongest (or suitable) based on a treatment of process settings. This is also
looked into on a basis of maximizing the recycled content, in order to become mechanically
comparable to virgin characteristics, which provides reduced cost depending on how demanding
an application is. As defined by Cornell (1990) [15], process variables are factors in a mixture
experiment that do not form any portion of the mixture, but whose levels, when changed, affect
the blending properties of the ingredients. Process variables can vary independently from the
mixture variables. To model the response of the combined experiment, a combination is made of
the model in the process variables and the mixture model, where ―q‖ is the number of
components and ―z‖ is an individual process factor. As a result the factor space reduces to
regular (q-1) dimensional simplex. For this experiment, q=2 so it is a straight line, x1+x2=1. x1 is
PET and x2 is RPET.
Figure 4
The resulting experimental region forms a simplex, a geometric figure with one more
vertex than the number of dimensions. In two dimensions, a simplex is a triangle. In three
dimensions, a simplex is a tetrahedron, and so on, but in this experiment the limit is to one
dimension for mixtures (without the inclusion of process variables).
11
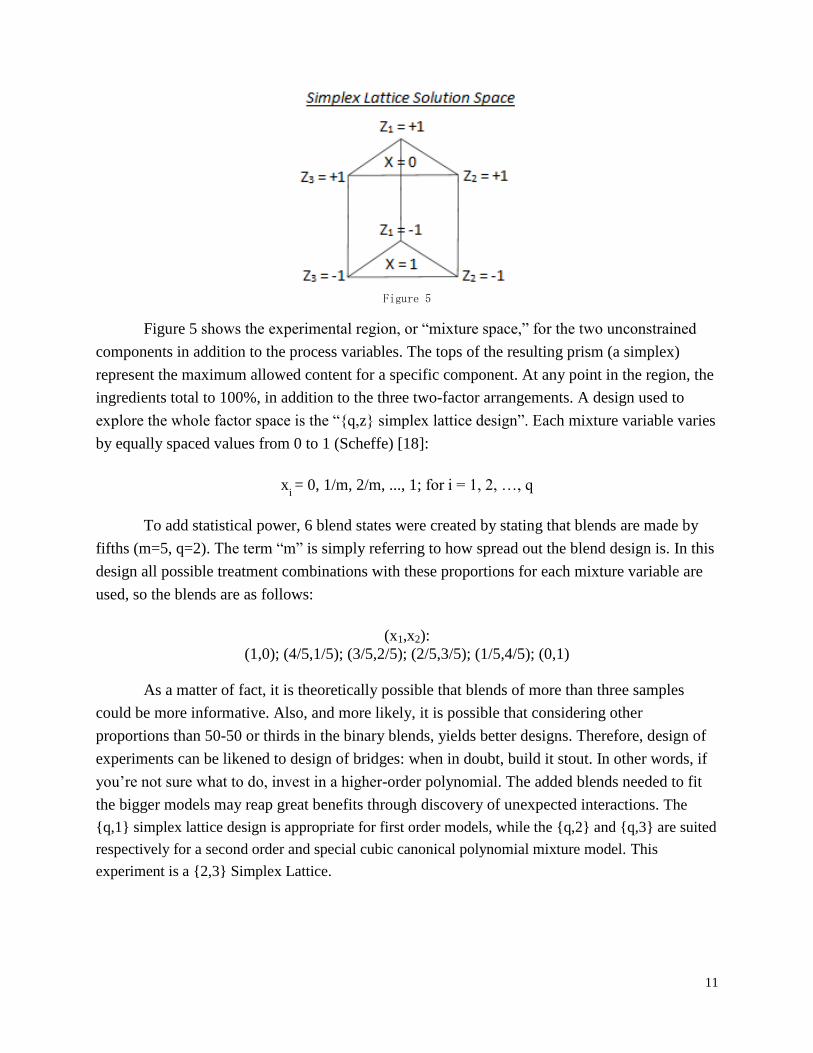
Figure 5
Figure 5 shows the experimental region, or ―mixture space,‖ for the two unconstrained
components in addition to the process variables. The tops of the resulting prism (a simplex)
represent the maximum allowed content for a specific component. At any point in the region, the
ingredients total to 100%, in addition to the three two-factor arrangements. A design used to
explore the whole factor space is the ―{q,z} simplex lattice design‖. Each mixture variable varies
by equally spaced values from 0 to 1 (Scheffe) [18]:
xi = 0, 1/m, 2/m, ..., 1; for i = 1, 2, …, q
To add statistical power, 6 blend states were created by stating that blends are made by
fifths (m=5, q=2). The term ―m‖ is simply referring to how spread out the blend design is. In this
design all possible treatment combinations with these proportions for each mixture variable are
used, so the blends are as follows:
(x1,x2):
(1,0); (4/5,1/5); (3/5,2/5); (2/5,3/5); (1/5,4/5); (0,1)
As a matter of fact, it is theoretically possible that blends of more than three samples
could be more informative. Also, and more likely, it is possible that considering other
proportions than 50-50 or thirds in the binary blends, yields better designs. Therefore, design of
experiments can be likened to design of bridges: when in doubt, build it stout. In other words, if
you‘re not sure what to do, invest in a higher-order polynomial. The added blends needed to fit
the bigger models may reap great benefits through discovery of unexpected interactions. The
{q,1} simplex lattice design is appropriate for first order models, while the {q,2} and {q,3} are suited
respectively for a second order and special cubic canonical polynomial mixture model. This
experiment is a {2,3} Simplex Lattice.
12
Creating a Mathematical Model
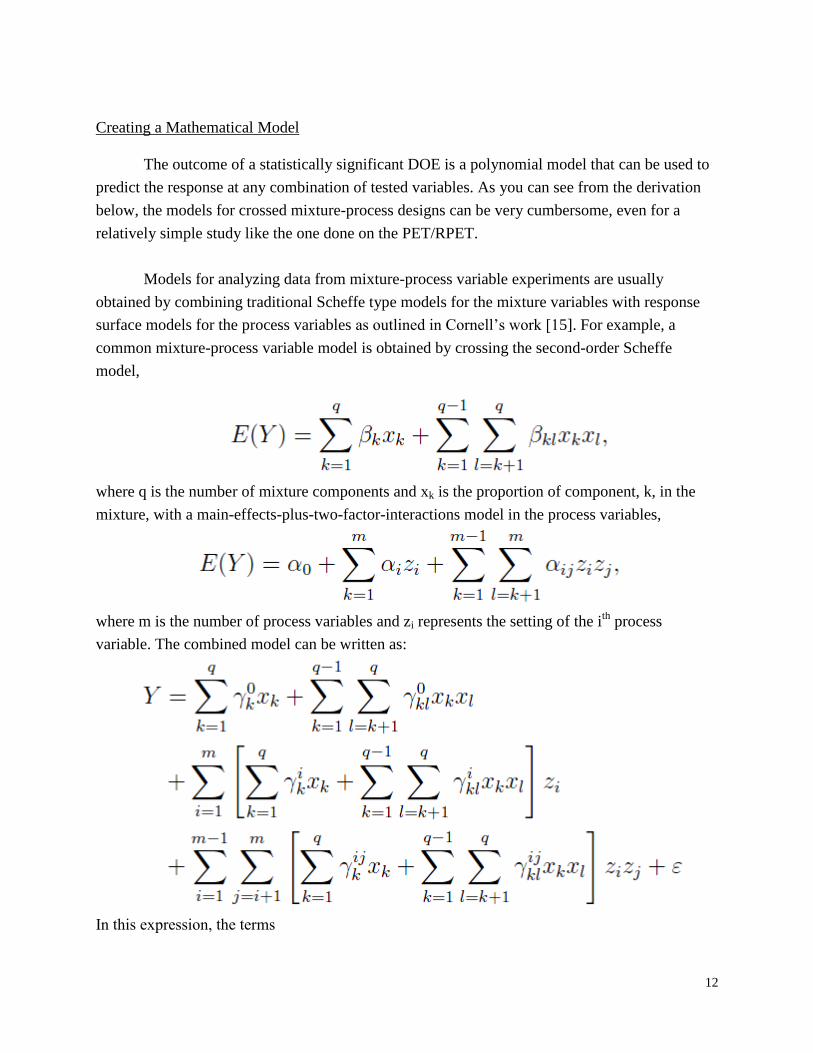
The outcome of a statistically significant DOE is a polynomial model that can be used to
predict the response at any combination of tested variables. As you can see from the derivation
below, the models for crossed mixture-process designs can be very cumbersome, even for a
relatively simple study like the one done on the PET/RPET.
Models for analyzing data from mixture-process variable experiments are usually
obtained by combining traditional Scheffe type models for the mixture variables with response
surface models for the process variables as outlined in Cornell‘s work [15]. For example, a
common mixture-process variable model is obtained by crossing the second-order Scheffe
model,
where q is the number of mixture components and xk is the proportion of component, k, in the
mixture, with a main-effects-plus-two-factor-interactions model in the process variables,
where m is the number of process variables and zi represents the setting of the i
th process
variable. The combined model can be written as:
In this expression, the terms
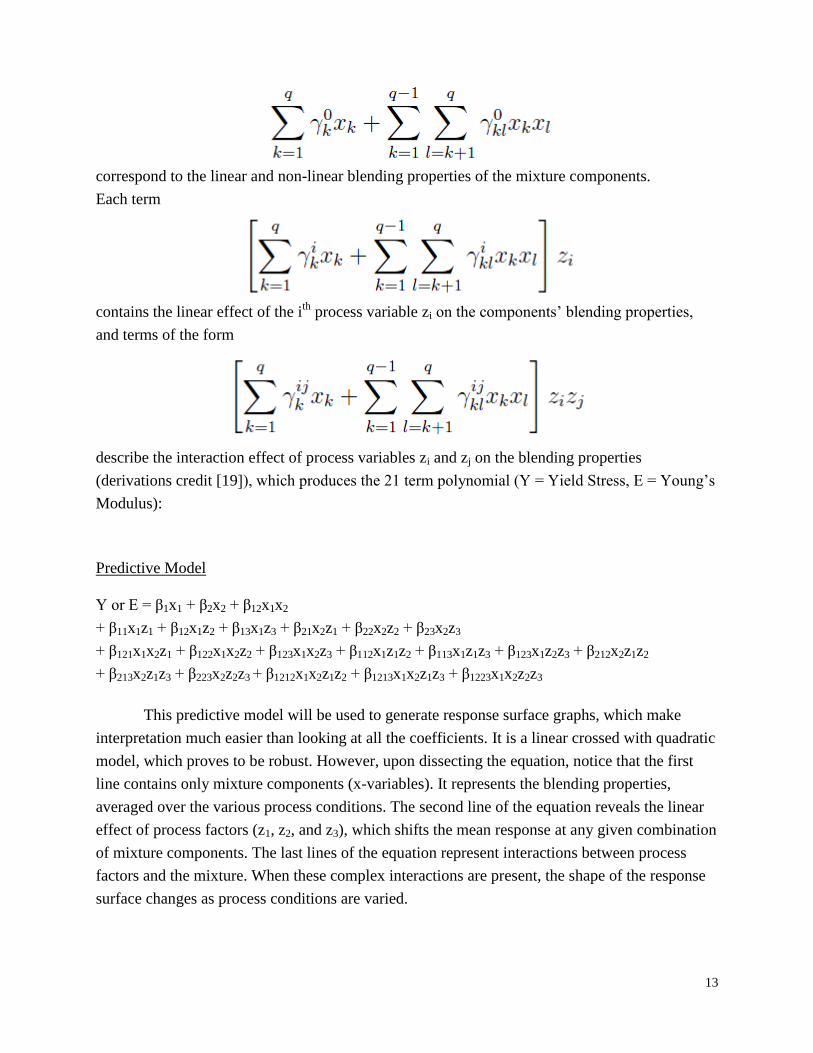
13
correspond to the linear and non-linear blending properties of the mixture components.
Each term
contains the linear effect of the i
th process variable zi on the components‘ blending properties,
and terms of the form
describe the interaction effect of process variables zi and zj on the blending properties
(derivations credit [19]), which produces the 21 term polynomial (Y = Yield Stress, E = Young‘s
Modulus):
Predictive Model
Y or E = β1x1 + β2x2 + β12x1x2
+ β11x1z1 + β12x1z2 + β13x1z3 + β21x2z1 + β22x2z2 + β23x2z3
+ β121x1x2z1 + β122x1x2z2 + β123x1x2z3 + β112x1z1z2 + β113x1z1z3 + β123x1z2z3 + β212x2z1z2
+ β213x2z1z3 + β223x2z2z3 + β1212x1x2z1z2 + β1213x1x2z1z3 + β1223x1x2z2z3
This predictive model will be used to generate response surface graphs, which make
interpretation much easier than looking at all the coefficients. It is a linear crossed with quadratic
model, which proves to be robust. However, upon dissecting the equation, notice that the first
line contains only mixture components (x-variables). It represents the blending properties,
averaged over the various process conditions. The second line of the equation reveals the linear
effect of process factors (z1, z2, and z3), which shifts the mean response at any given combination
of mixture components. The last lines of the equation represent interactions between process
factors and the mixture. When these complex interactions are present, the shape of the response
surface changes as process conditions are varied.
14
Since blend states are hard to change factors during experimentation (injection molding
works with one compound at a time), Block Designs for mixture experiments are employed.
Groups of mixture blends are assumed to differ from other groups or blocks by an additive
constant (―fifths‖). A design is said to block orthogonally with respect to the blending properties
of the components if the estimates of the blending properties in the fitted model are uncorrelated
with and are unaffected by the effects of the blocks. The order in which experiments are should
be randomized though to avoid influence by uncontrolled variables such as tool wear, and
ambient temperature. These changes, which often are time-related, can significantly influence the
response. If the run order is not randomized, the DOE may indicate factor effects that are really
due to an uncontrolled variable that just happened to change at the same time.
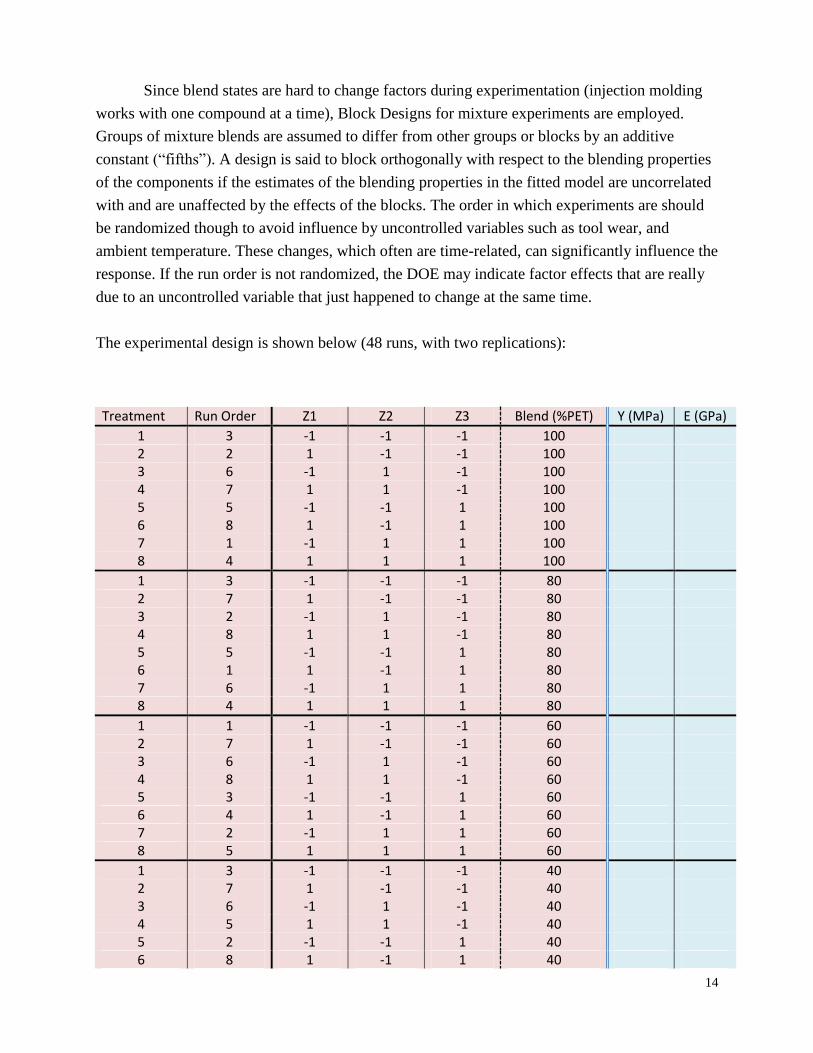
The experimental design is shown below (48 runs, with two replications):
Treatment Run Order Z1 Z2 Z3 Blend (%PET) Y (MPa) E (GPa)
1 3 -1 -1 -1 100 2 2 1 -1 -1 100 3 6 -1 1 -1 100 4 7 1 1 -1 100 5 5 -1 -1 1 100 6 8 1 -1 1 100 7 1 -1 1 1 100 8 4 1 1 1 100
1 3 -1 -1 -1 80 2 7 1 -1 -1 80 3 2 -1 1 -1 80 4 8 1 1 -1 80 5 5 -1 -1 1 80 6 1 1 -1 1 80 7 6 -1 1 1 80 8 4 1 1 1 80
1 1 -1 -1 -1 60 2 7 1 -1 -1 60 3 6 -1 1 -1 60 4 8 1 1 -1 60 5 3 -1 -1 1 60 6 4 1 -1 1 60 7 2 -1 1 1 60 8 5 1 1 1 60
1 3 -1 -1 -1 40 2 7 1 -1 -1 40 3 6 -1 1 -1 40 4 5 1 1 -1 40 5 2 -1 -1 1 40 6 8 1 -1 1 40
15
7 1 -1 1 1 40 8 4 1 1 1 40
1 6 -1 -1 -1 20 2 2 1 -1 -1 20 3 5 -1 1 -1 20 4 1 1 1 -1 20 5 7 -1 -1 1 20 6 8 1 -1 1 20 7 3 -1 1 1 20 8 4 1 1 1 20
1 8 -1 -1 -1 0 2 4 1 -1 -1 0 3 3 -1 1 -1 0 4 1 1 1 -1 0 5 2 -1 -1 1 0 6 6 1 -1 1 0 7 5 -1 1 1 0 8 7 1 1 1 0
Injection Molding Parameters
All parameters other than blend state and temperature (nozzle, front/rear barrel) that are
used run the injection molding process will be held constant for as long as possible, and are
determined on site due to variances in machine design.
Cylinder temperature settings As a standard, a flat or slightly increasing temperature profile should be applied from the
feeding section to the nozzle of the cylinder. These are general indications that may require
specific adaptation, but the actual parameters will be set as follows according to initial PET
research:
z1 (nozzle temperature) = 500°F (low, -1), 520°F (high, +1)
z2 (barrel temperature, front) = 470°F (low, -1), 490°F (high, +1)
z3 (barrel temperature, rear) = 475°F (low, -1), 495°F (high, +1)
These temperatures are necessary to produce well crystallized PET parts.
Injection rate The preferred injection rate should be high to fill the mold quickly so as to obtain best
surface quality and maximum chain orientation. A high injection rate is also favorable to avoid
poor parting line quality and premature freezing of the gate during filling. In the case of visible
defects in products, the injection rate will be reduced, provided that the defects are not caused by
insufficient venting.
16
Holding pressure and time Holding pressure is preferably 40-60% lower than injection pressure. This compensates
for volumetric shrinkage for solidifying and crystallizing melt. The holding pressure must be
sufficiently high to prevent sinks in the thickest section of the product, but on the other hand, it
should not be set so high that the product starts to flash or residual stresses are built-in. Holding
time should be prolonged proportionally as wall thickness and gate sizes increase. The faster the
rate of cooling, the more retention there is of the frozen orientation.
Plasticizing screw speed and back pressure Depending on the screw diameter, speed should be set in 50 to 100 rpm range, whilst
maintaining a 250-300psi backpressure. Plasticizing times should fall well within limit set by the
actual cooling time.
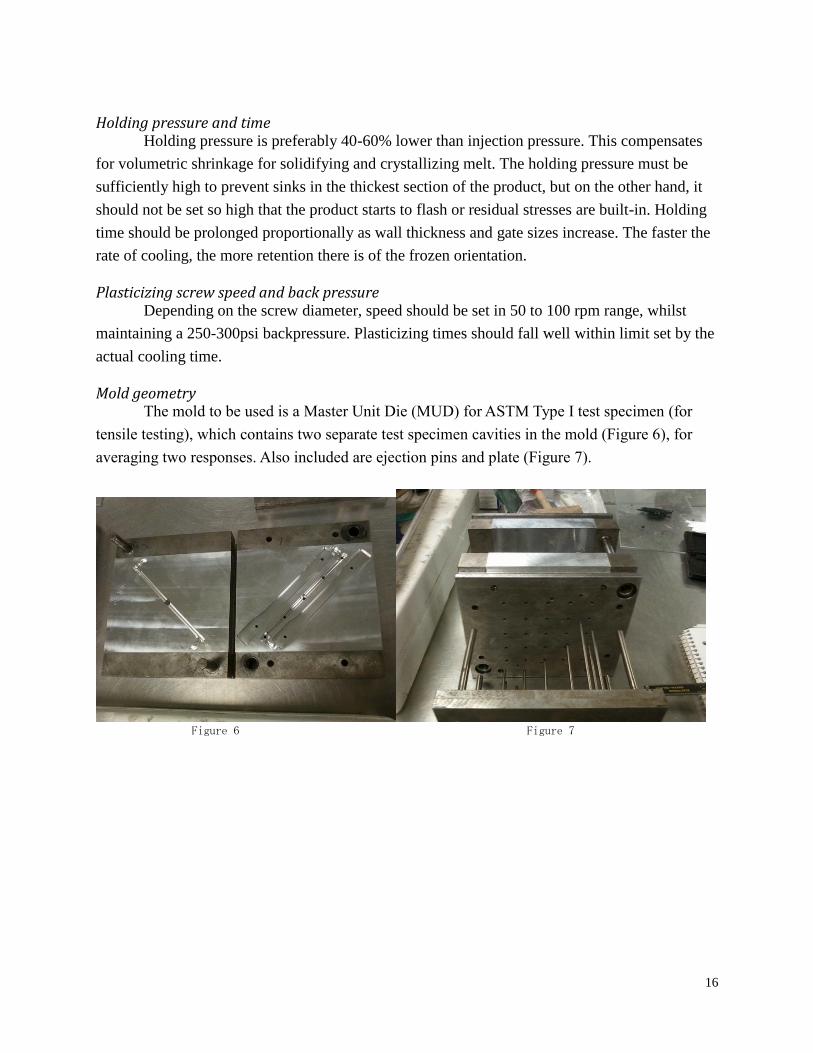
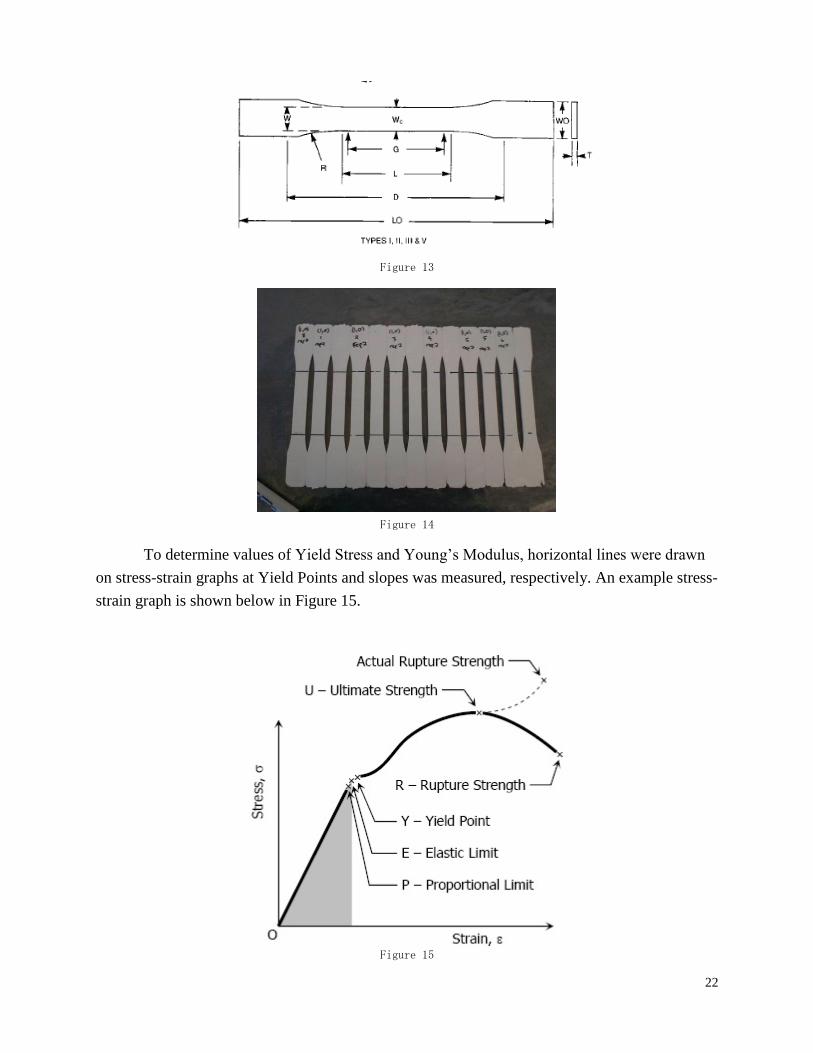
Mold geometry The mold to be used is a Master Unit Die (MUD) for ASTM Type I test specimen (for
tensile testing), which contains two separate test specimen cavities in the mold (Figure 6), for
averaging two responses. Also included are ejection pins and plate (Figure 7).
Figure 6 Figure 7
17
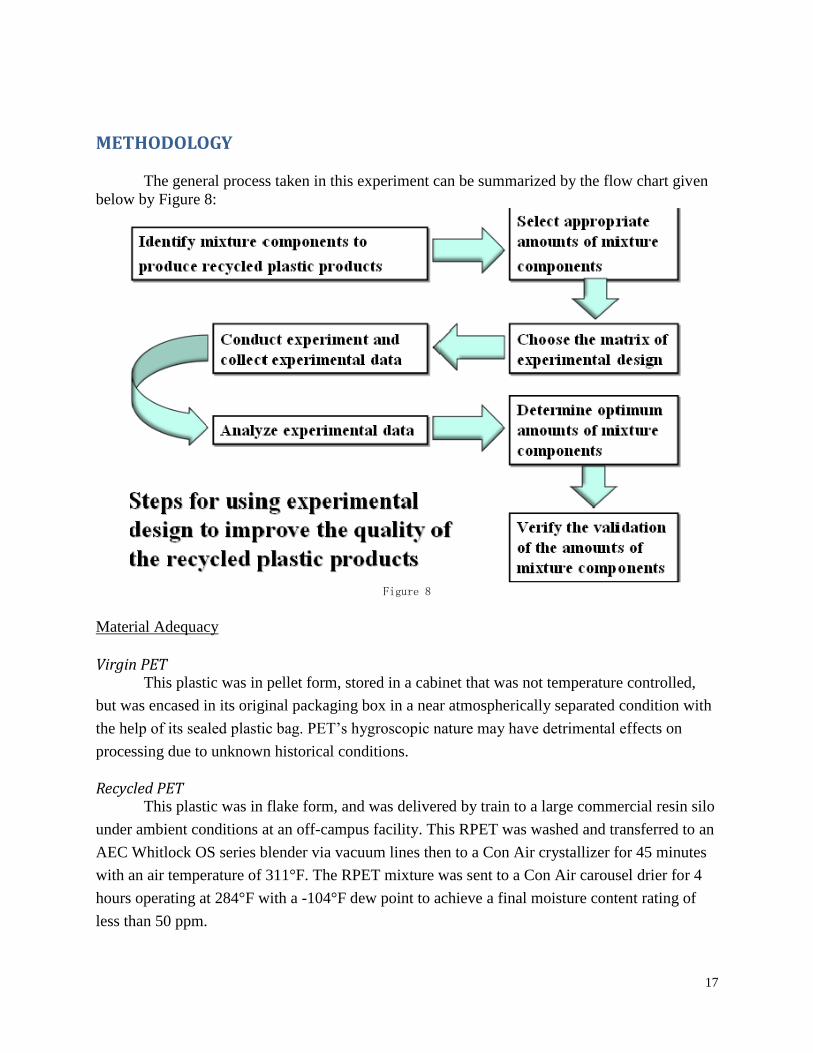
METHODOLOGY
The general process taken in this experiment can be summarized by the flow chart given
below by Figure 8:
Figure 8
Material Adequacy
Virgin PET This plastic was in pellet form, stored in a cabinet that was not temperature controlled,
but was encased in its original packaging box in a near atmospherically separated condition with
the help of its sealed plastic bag. PET‘s hygroscopic nature may have detrimental effects on
processing due to unknown historical conditions.
Recycled PET This plastic was in flake form, and was delivered by train to a large commercial resin silo
under ambient conditions at an off-campus facility. This RPET was washed and transferred to an
AEC Whitlock OS series blender via vacuum lines then to a Con Air crystallizer for 45 minutes
with an air temperature of 311°F. The RPET mixture was sent to a Con Air carousel drier for 4
hours operating at 284°F with a -104°F dew point to achieve a final moisture content rating of
less than 50 ppm.
18
Experimental Runs
Before performing the full experiment, thermal process settings were checked out and
concluded as indeed correct on the Morgan Press, a vertical injection molding machine located at
the Manufacturing Engineering Department labs at Cal Poly. Testing of a few blends under
varied injection pressures and heating temperatures proved that both resin stocks were
compatible.
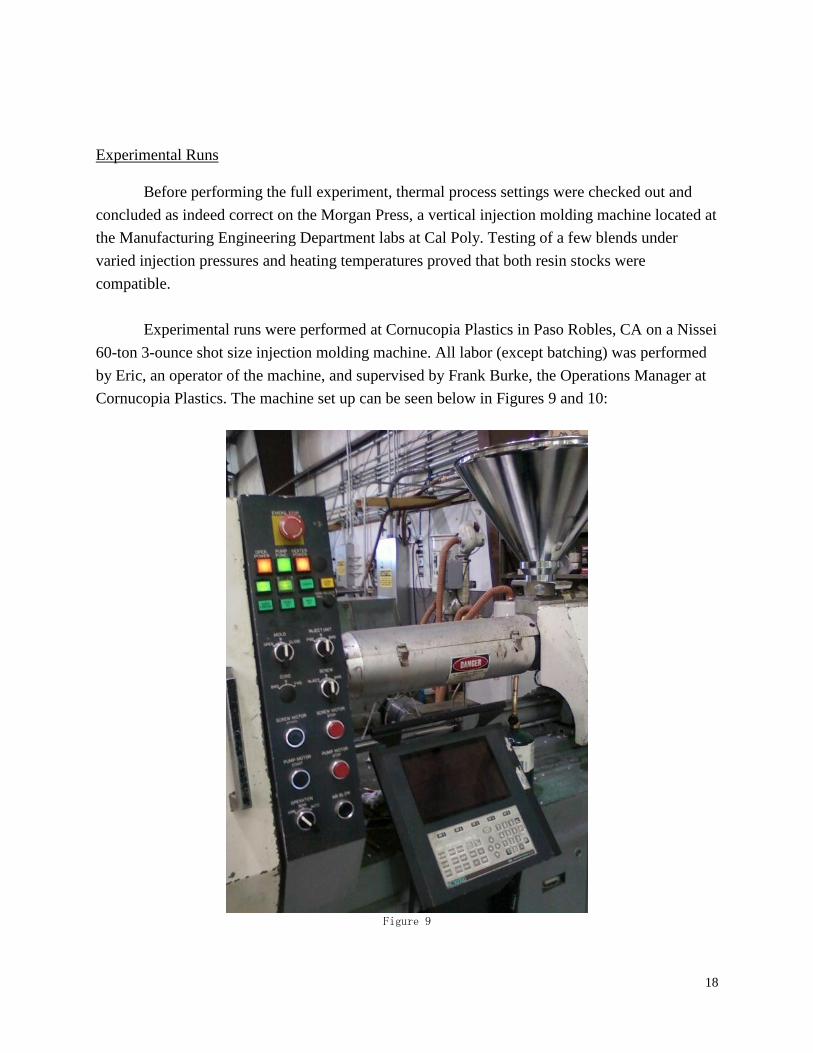
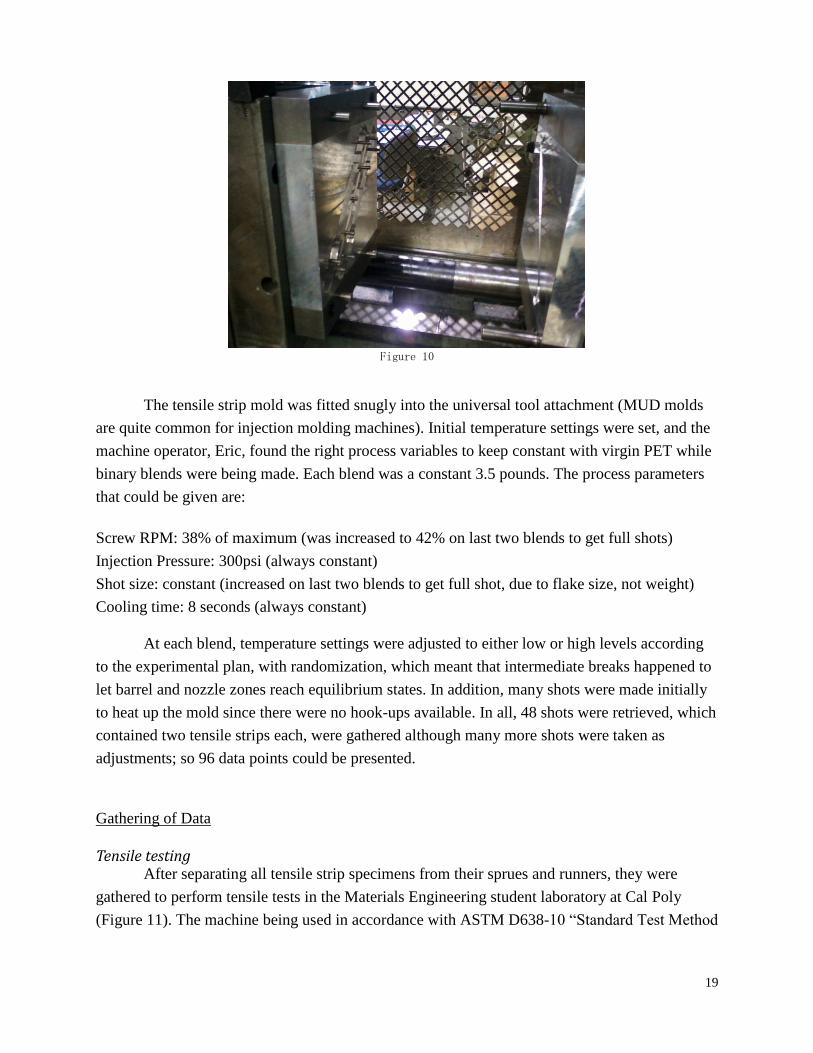
Experimental runs were performed at Cornucopia Plastics in Paso Robles, CA on a Nissei
60-ton 3-ounce shot size injection molding machine. All labor (except batching) was performed
by Eric, an operator of the machine, and supervised by Frank Burke, the Operations Manager at
Cornucopia Plastics. The machine set up can be seen below in Figures 9 and 10:
Figure 9
19
Figure 10
The tensile strip mold was fitted snugly into the universal tool attachment (MUD molds
are quite common for injection molding machines). Initial temperature settings were set, and the
machine operator, Eric, found the right process variables to keep constant with virgin PET while
binary blends were being made. Each blend was a constant 3.5 pounds. The process parameters
that could be given are:
Screw RPM: 38% of maximum (was increased to 42% on last two blends to get full shots)
Injection Pressure: 300psi (always constant)
Shot size: constant (increased on last two blends to get full shot, due to flake size, not weight)
Cooling time: 8 seconds (always constant)
At each blend, temperature settings were adjusted to either low or high levels according
to the experimental plan, with randomization, which meant that intermediate breaks happened to
let barrel and nozzle zones reach equilibrium states. In addition, many shots were made initially
to heat up the mold since there were no hook-ups available. In all, 48 shots were retrieved, which
contained two tensile strips each, were gathered although many more shots were taken as
adjustments; so 96 data points could be presented.
Gathering of Data
Tensile testing After separating all tensile strip specimens from their sprues and runners, they were
gathered to perform tensile tests in the Materials Engineering student laboratory at Cal Poly
(Figure 11). The machine being used in accordance with ASTM D638-10 ―Standard Test Method
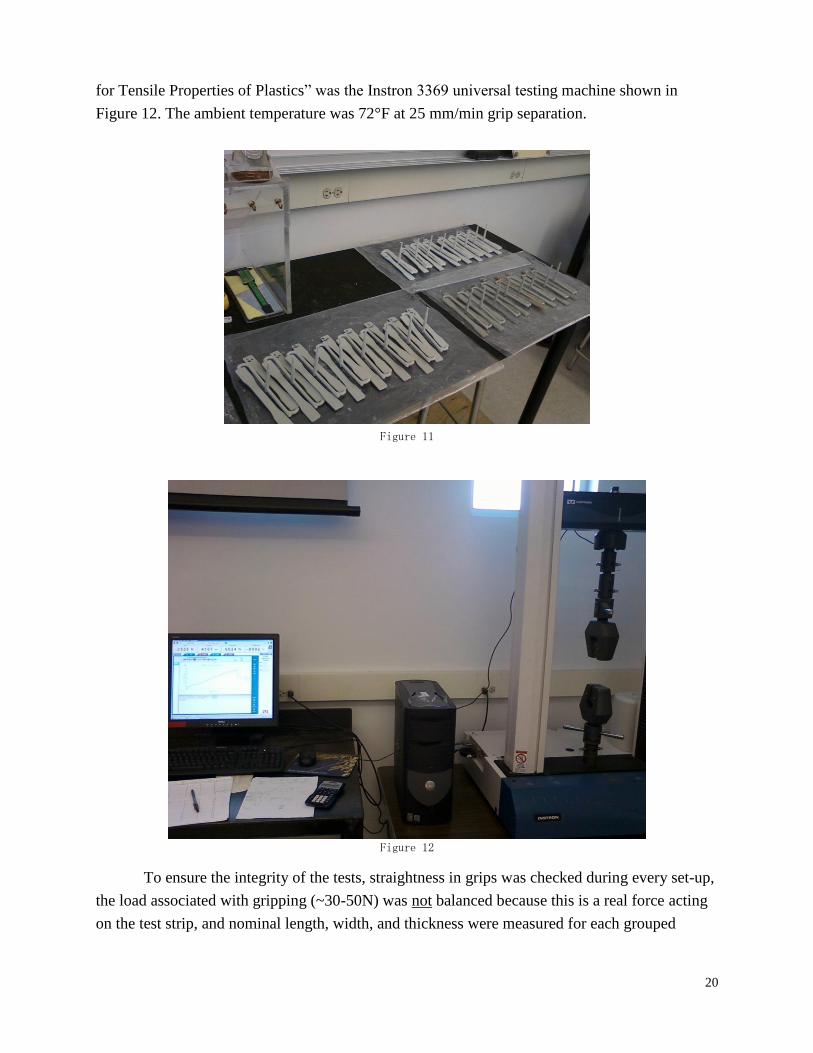
20
for Tensile Properties of Plastics‖ was the Instron 3369 universal testing machine shown in
Figure 12. The ambient temperature was 72°F at 25 mm/min grip separation.
Figure 11
Figure 12
To ensure the integrity of the tests, straightness in grips was checked during every set-up,
the load associated with gripping (~30-50N) was not balanced because this is a real force acting
on the test strip, and nominal length, width, and thickness were measured for each grouped

21
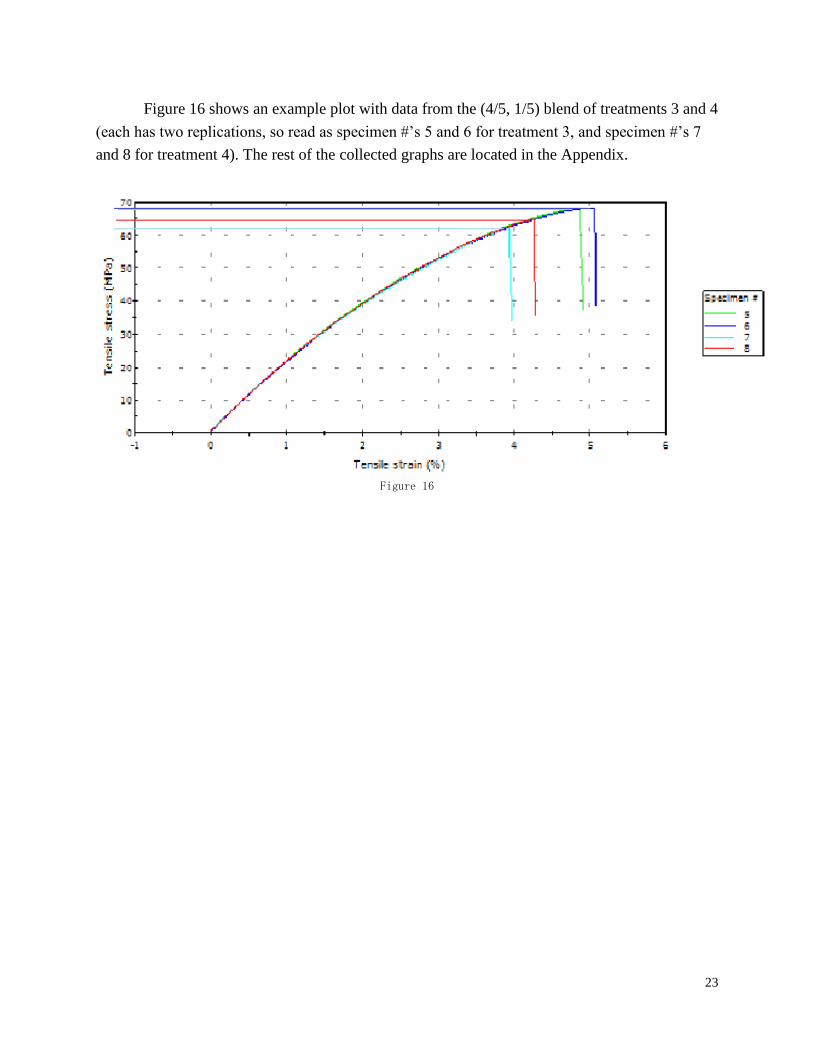
mixture (not assuming same dimensionality) and tested with those appropriate values (see Figure
13 and Figure 14).
Specimen Lengths:
(1,0) = 62.0 mm
(4/5,1/5) = 62.6 mm
(3/5,2/5) = 62.6 mm
(2/5,3/5) = 62.6 mm
(1/5,4/5) = 62.6 mm
(0,1) = 62.6 mm
Specimen Widths:
(1,0) = 12.64 mm
(4/5,1/5) = 12.80 mm
(3/5,2/5) = 12.70 mm
(2/5,3/5) = 12.80 mm
(1/5,4/5) = 12.75 mm
(0,1) = 12.85 mm
Specimen Thicknesses:
(1,0) = 3.19 mm
(4/5,1/5) = 3.21 mm
(3/5,2/5) = 3.19 mm
(2/5,3/5) = 3.20 mm
(1/5,4/5) = 3.19 mm
(0,1) = 3.21 mm
22
Figure 13
Figure 14
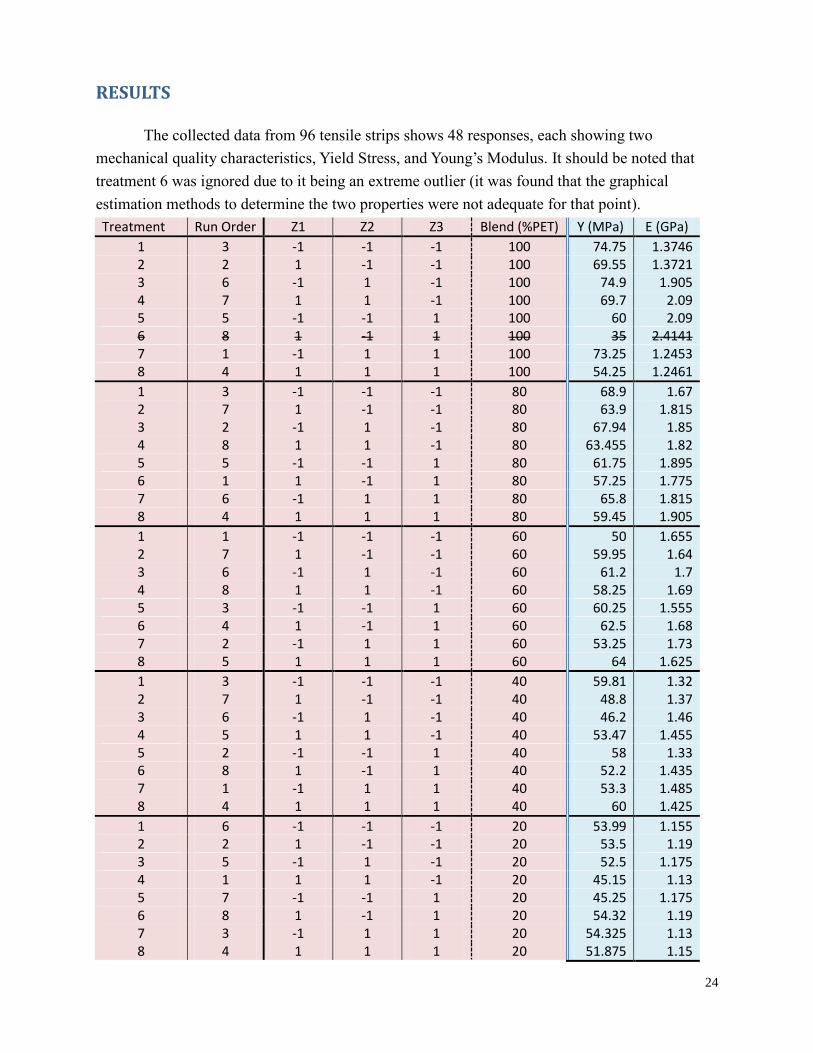
To determine values of Yield Stress and Young‘s Modulus, horizontal lines were drawn
on stress-strain graphs at Yield Points and slopes was measured, respectively. An example stress-
strain graph is shown below in Figure 15.
Figure 15
23
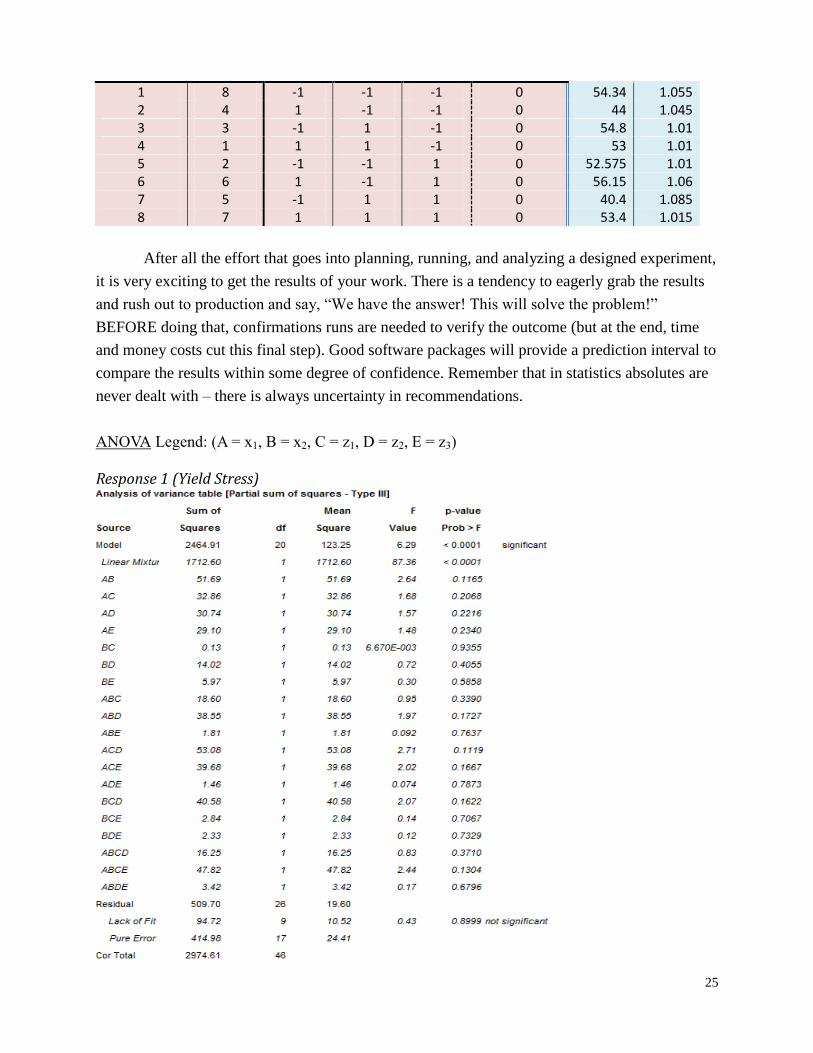
Figure 16 shows an example plot with data from the (4/5, 1/5) blend of treatments 3 and 4
(each has two replications, so read as specimen #‘s 5 and 6 for treatment 3, and specimen #‘s 7
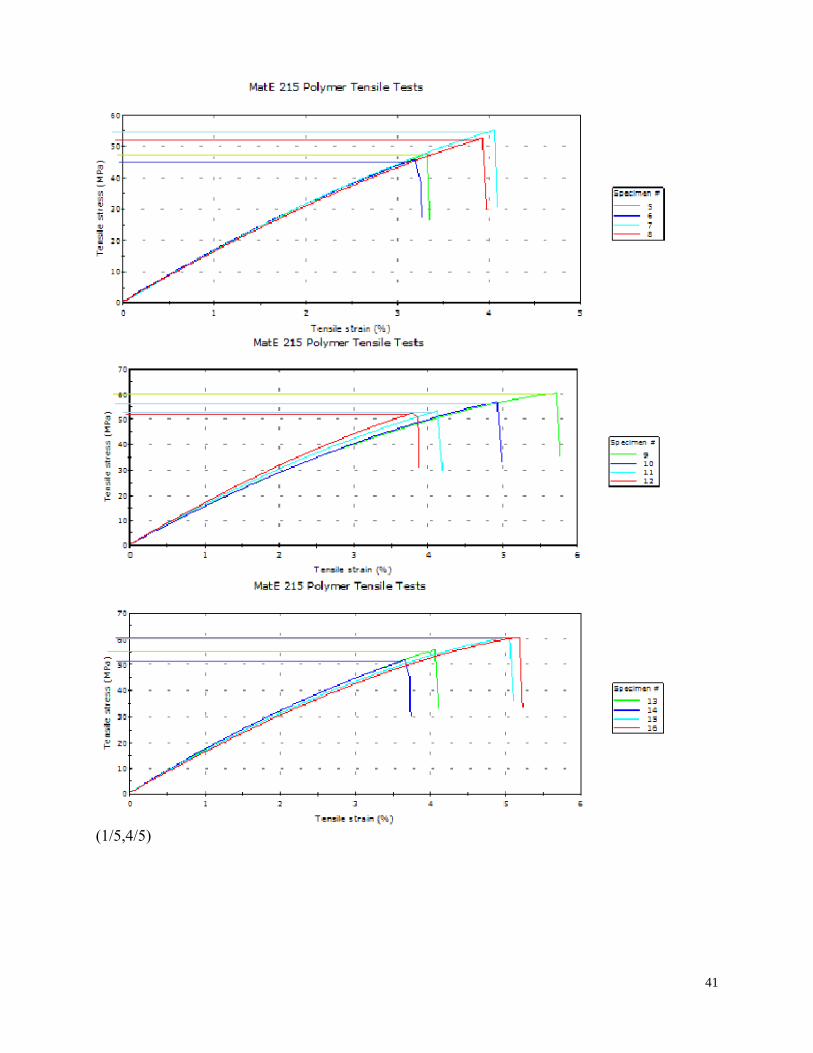
and 8 for treatment 4). The rest of the collected graphs are located in the Appendix.
Figure 16
24
RESULTS
The collected data from 96 tensile strips shows 48 responses, each showing two
mechanical quality characteristics, Yield Stress, and Young‘s Modulus. It should be noted that
treatment 6 was ignored due to it being an extreme outlier (it was found that the graphical
estimation methods to determine the two properties were not adequate for that point).
Treatment Run Order Z1 Z2 Z3 Blend (%PET) Y (MPa) E (GPa)
1 3 -1 -1 -1 100 74.75 1.3746 2 2 1 -1 -1 100 69.55 1.3721 3 6 -1 1 -1 100 74.9 1.905 4 7 1 1 -1 100 69.7 2.09 5 5 -1 -1 1 100 60 2.09 6 8 1 -1 1 100 35 2.4141 7 1 -1 1 1 100 73.25 1.2453 8 4 1 1 1 100 54.25 1.2461
1 3 -1 -1 -1 80 68.9 1.67 2 7 1 -1 -1 80 63.9 1.815 3 2 -1 1 -1 80 67.94 1.85 4 8 1 1 -1 80 63.455 1.82 5 5 -1 -1 1 80 61.75 1.895 6 1 1 -1 1 80 57.25 1.775 7 6 -1 1 1 80 65.8 1.815 8 4 1 1 1 80 59.45 1.905
1 1 -1 -1 -1 60 50 1.655 2 7 1 -1 -1 60 59.95 1.64 3 6 -1 1 -1 60 61.2 1.7 4 8 1 1 -1 60 58.25 1.69 5 3 -1 -1 1 60 60.25 1.555 6 4 1 -1 1 60 62.5 1.68 7 2 -1 1 1 60 53.25 1.73 8 5 1 1 1 60 64 1.625
1 3 -1 -1 -1 40 59.81 1.32 2 7 1 -1 -1 40 48.8 1.37 3 6 -1 1 -1 40 46.2 1.46 4 5 1 1 -1 40 53.47 1.455 5 2 -1 -1 1 40 58 1.33 6 8 1 -1 1 40 52.2 1.435 7 1 -1 1 1 40 53.3 1.485 8 4 1 1 1 40 60 1.425
1 6 -1 -1 -1 20 53.99 1.155 2 2 1 -1 -1 20 53.5 1.19 3 5 -1 1 -1 20 52.5 1.175 4 1 1 1 -1 20 45.15 1.13 5 7 -1 -1 1 20 45.25 1.175 6 8 1 -1 1 20 54.32 1.19 7 3 -1 1 1 20 54.325 1.13 8 4 1 1 1 20 51.875 1.15
25
1 8 -1 -1 -1 0 54.34 1.055 2 4 1 -1 -1 0 44 1.045 3 3 -1 1 -1 0 54.8 1.01 4 1 1 1 -1 0 53 1.01 5 2 -1 -1 1 0 52.575 1.01 6 6 1 -1 1 0 56.15 1.06 7 5 -1 1 1 0 40.4 1.085 8 7 1 1 1 0 53.4 1.015
After all the effort that goes into planning, running, and analyzing a designed experiment,
it is very exciting to get the results of your work. There is a tendency to eagerly grab the results
and rush out to production and say, ―We have the answer! This will solve the problem!‖
BEFORE doing that, confirmations runs are needed to verify the outcome (but at the end, time
and money costs cut this final step). Good software packages will provide a prediction interval to
compare the results within some degree of confidence. Remember that in statistics absolutes are
never dealt with – there is always uncertainty in recommendations.
ANOVA Legend: (A = x1, B = x2, C = z1, D = z2, E = z3)
Response 1 (Yield Stress)
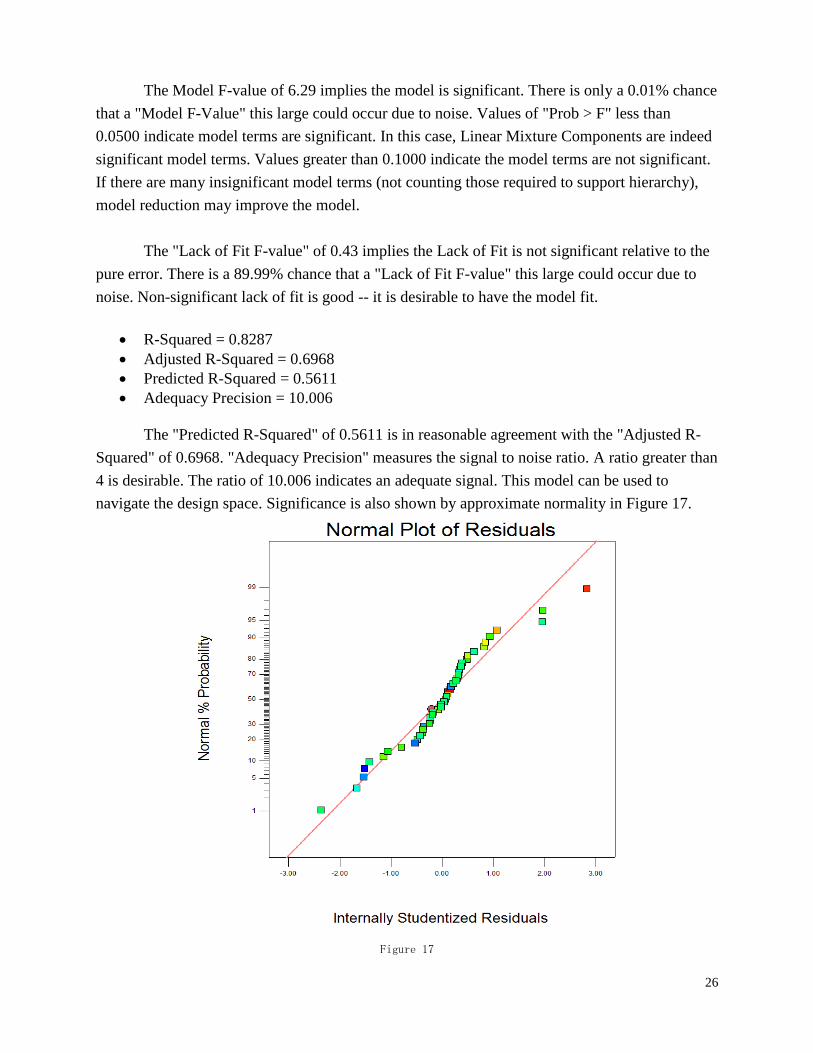
26
The Model F-value of 6.29 implies the model is significant. There is only a 0.01% chance
that a "Model F-Value" this large could occur due to noise. Values of "Prob > F" less than
0.0500 indicate model terms are significant. In this case, Linear Mixture Components are indeed
significant model terms. Values greater than 0.1000 indicate the model terms are not significant.
If there are many insignificant model terms (not counting those required to support hierarchy),
model reduction may improve the model.
The "Lack of Fit F-value" of 0.43 implies the Lack of Fit is not significant relative to the
pure error. There is a 89.99% chance that a "Lack of Fit F-value" this large could occur due to
noise. Non-significant lack of fit is good -- it is desirable to have the model fit.
R-Squared = 0.8287
Adjusted R-Squared = 0.6968
Predicted R-Squared = 0.5611
Adequacy Precision = 10.006
The "Predicted R-Squared" of 0.5611 is in reasonable agreement with the "Adjusted R-
Squared" of 0.6968. "Adequacy Precision" measures the signal to noise ratio. A ratio greater than
4 is desirable. The ratio of 10.006 indicates an adequate signal. This model can be used to
navigate the design space. Significance is also shown by approximate normality in Figure 17.
Figure 17
27
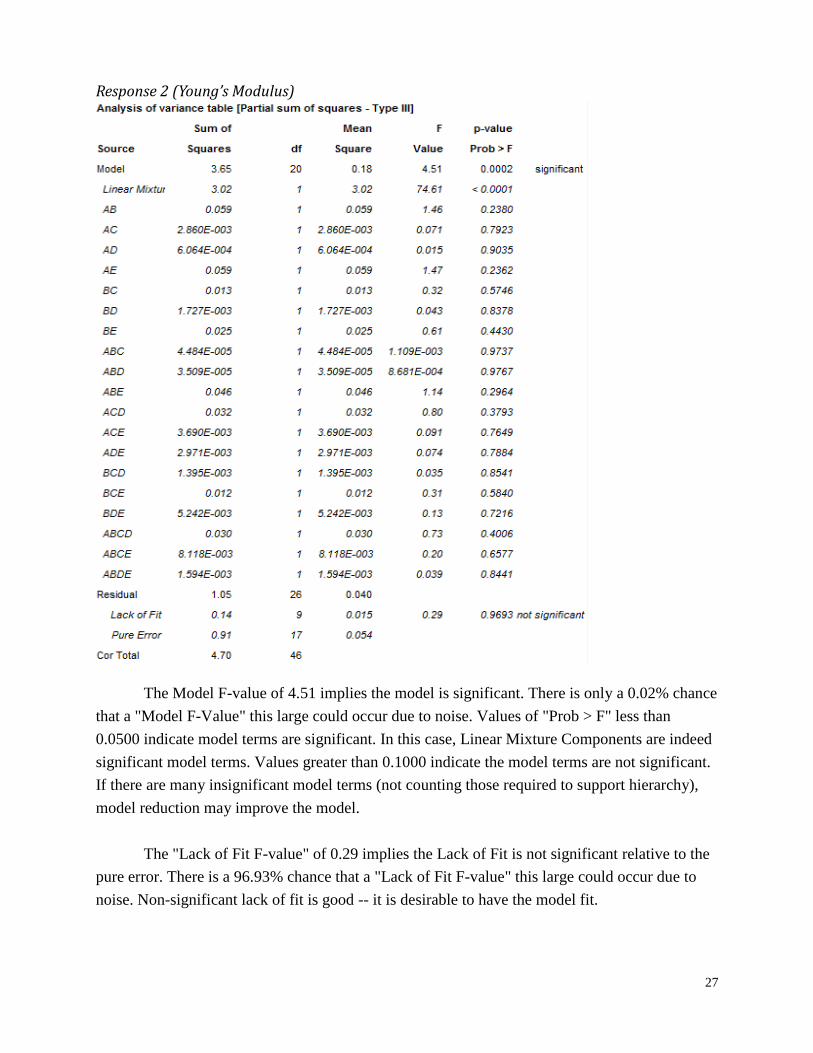
Response 2 (Young’s Modulus)
The Model F-value of 4.51 implies the model is significant. There is only a 0.02% chance
that a "Model F-Value" this large could occur due to noise. Values of "Prob > F" less than
0.0500 indicate model terms are significant. In this case, Linear Mixture Components are indeed
significant model terms. Values greater than 0.1000 indicate the model terms are not significant.
If there are many insignificant model terms (not counting those required to support hierarchy),
model reduction may improve the model.
The "Lack of Fit F-value" of 0.29 implies the Lack of Fit is not significant relative to the
pure error. There is a 96.93% chance that a "Lack of Fit F-value" this large could occur due to
noise. Non-significant lack of fit is good -- it is desirable to have the model fit.
28
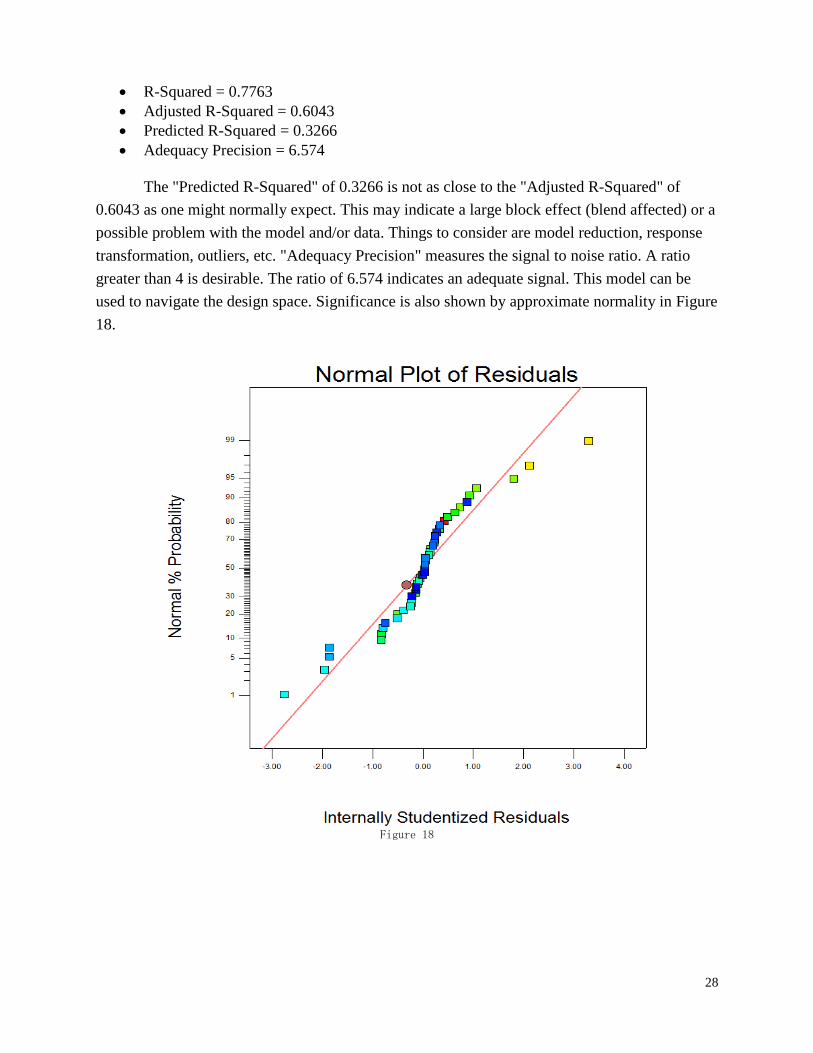
R-Squared = 0.7763
Adjusted R-Squared = 0.6043
Predicted R-Squared = 0.3266
Adequacy Precision = 6.574
The "Predicted R-Squared" of 0.3266 is not as close to the "Adjusted R-Squared" of
0.6043 as one might normally expect. This may indicate a large block effect (blend affected) or a
possible problem with the model and/or data. Things to consider are model reduction, response
transformation, outliers, etc. "Adequacy Precision" measures the signal to noise ratio. A ratio
greater than 4 is desirable. The ratio of 6.574 indicates an adequate signal. This model can be
used to navigate the design space. Significance is also shown by approximate normality in Figure
18.
Figure 18

29
Solution To Predictive Model
Y = 71.43x1 + 51.16x2 – 17.45x1x2
– 4.21x1z1 + 4.35x1z2 – 2.68x1z3 – 0.20x2z1 + 2.07x2z2 + 1.18x2z3
+ 12.03x1x2z1 – 18.27x1x2z2 + 2.87x1x2z3 – 5.46x1z1z2 + 5.01x1z1z3 + 0.88x1z2z3 + 2.41x2z1z2
– 0.93x2z1z3 + 0.83x2z2z3 + 9.70x1x2z1z2 – 20.71x1x2z1z3 – 5.16x1x2z2z3
E = 1.86x1 + 0.94x2 + 0.59x1x2
– 0.039x1z1 + 0.019x1z2 + 0.12x1z3 + 0.062x2z1 + 0.023x2z2 + 0.075x2z3
+ 0.019x1x2z1 – 0.017x1x2z2 – 0.46x1x2z3 – 0.13x1z1z2 – 0.048x1z1z3 + 0.040x1z2z3 – 0.014x2z1z2
– 0.062x2z1z3 – 0.0391x2z2z3 + 0.41x1x2z1z2 + 0.27x1x2z1z3 – 0.11x1x2z2z3
In this model, the blends are percentages and process variables are coded as high or low
values. Using this method, adequate predictions (within tested range of temperatures) can be
made due to significance of the model shown in the previous section.
Response Surface Graphs
Response 1 (Yield Stress)
Figure 19
30
Based on the largest interaction in the prediction polynomial that involves process
variables, –18.27x1x2z2 (ABD), the interaction with blend state can be seen graphically in Figure
19. With a lower front barrel temperature (z2, D), Yield Stress acts linearly relative to PET/RPET
content, and with a higher front barrel temperature, Yield Stress acts exponentially relative to
PET/RPET content.
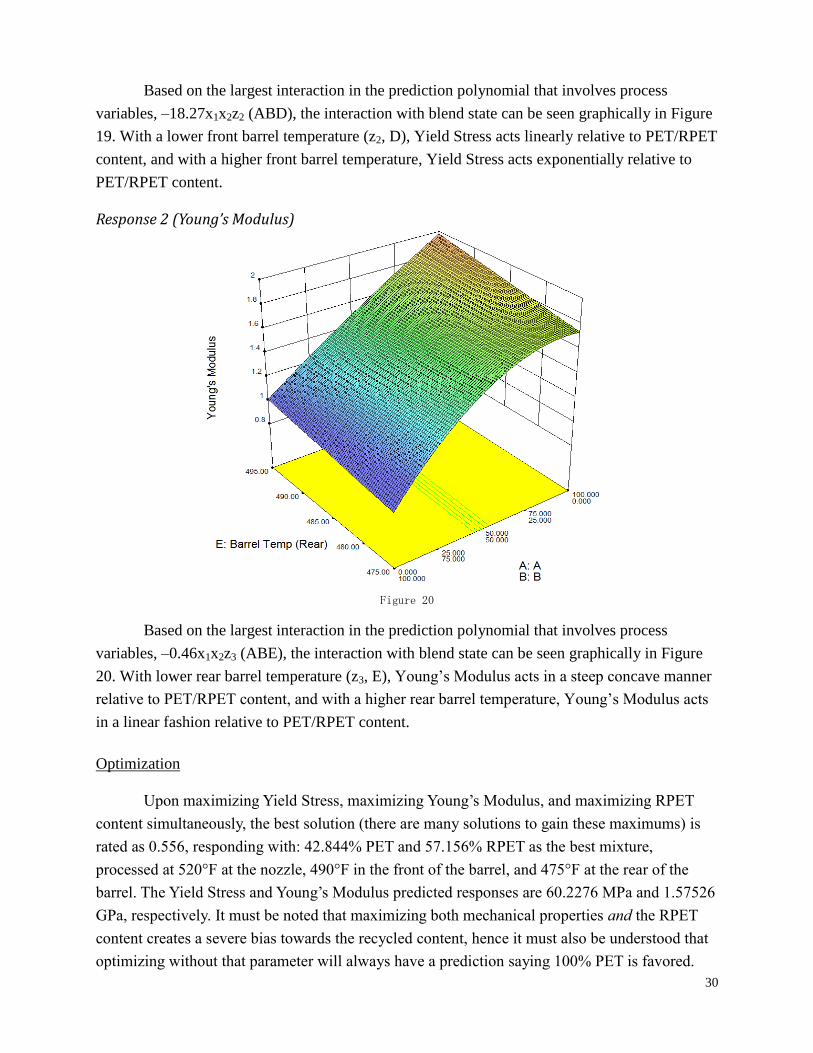
Response 2 (Young’s Modulus)
Figure 20
Based on the largest interaction in the prediction polynomial that involves process
variables, –0.46x1x2z3 (ABE), the interaction with blend state can be seen graphically in Figure
20. With lower rear barrel temperature (z3, E), Young‘s Modulus acts in a steep concave manner
relative to PET/RPET content, and with a higher rear barrel temperature, Young‘s Modulus acts
in a linear fashion relative to PET/RPET content.
Optimization
Upon maximizing Yield Stress, maximizing Young‘s Modulus, and maximizing RPET
content simultaneously, the best solution (there are many solutions to gain these maximums) is
rated as 0.556, responding with: 42.844% PET and 57.156% RPET as the best mixture,
processed at 520°F at the nozzle, 490°F in the front of the barrel, and 475°F at the rear of the
barrel. The Yield Stress and Young‘s Modulus predicted responses are 60.2276 MPa and 1.57526
GPa, respectively. It must be noted that maximizing both mechanical properties and the RPET
content creates a severe bias towards the recycled content, hence it must also be understood that
optimizing without that parameter will always have a prediction saying 100% PET is favored.
31
CONCLUSION
Recycling plastic can reduce consumption of energy, non-renewable fossil fuels use, as
well as global emissions of carbon dioxide. The effect of recycled PET and virgin PET on tensile
strength and stiffness was studied. The optimal amounts of mixture components to produce
recycled plastic products are determined. As the results of doing systematic experimentation,
using mixture experiments, the quality of recycled plastic products can be improved and
becomes more robust to variations at the optimal operating settings. The results have proven that
the manufacturer can use these settings of recycled PET and virgin PET to produce quality
products with low cost (quality depends on source as some recycled content qualities can be very
high) and environmental impact reduction.
This case study on optimization of blends with process variables shows how application
of advanced tools of DoE can simultaneously optimize a mixture formulation and processing
conditions, taking advantage of complex interactions in the system. Response surface graphics,
which can be produced in association with prediction formulas, make it easy to find the peak
performance. If it is necessary to juggle many responses to keep products in specification,
numerical optimization approaches are available to manipulate the predictive models and find the
―sweet spot‖ for both mixture and process variables. DOE helps our customers set their
processing conditions to achieve the required levels of strength with our materials. Careful
analysis shows them which process conditions they need to focus on holding precisely and which
ones they don‘t need to worry about. DOE also provides significant statistical information that
helps demonstrate its validity.
The ultimate benefit comes from discovery of operating windows that satisfy all customer
specifications most economically. The economic justification is spearheaded by a designer who
wishes to optimize their material with reduced environmental impact; this study shows that there
can be uses of recycled resin outside of its initial purpose, gaining a second life as a new
mechanically strong material. If this is accomplished, you and your company will gain a
competitive advantage and generate big profits.
32
THANKS
The author would like to thank the Faculty of Engineering at California Polytechnic State
University for supporting the research connected with this paper, specifically Dan Waldorf, the
Technical Advisor for this Manufacturing Engineer‘s senior project. In addition, the author
would like to thank Frank Burke of Cornucopia Plastics for donating time, labor, and machinery
to complete this work. An Industrial Technology Professor, Keith Vorst, needs to be thanked as
well due to his donation of the tensile strip MUD mold.
33
RESOURCES
1. Hannequart, JP. Good Practice Guide on Waste Plastics Recycling: A guide by and for
logal regional authorities. Association of cities and regions for recycling (ACRR),
Belgium: 2004.
2. B. L. Fletcher and M. E. Mackay, ―A model of plastics recycling: does recycling reduce
the amount of waste‖, Resources, Conservation and Recycling, col. 17, pp. 141-151,
1996.
3. Staniulis, A. Method for lowering component costs by direct injection molding of recycle
plastics. Annual Recycling Conference, 255-257, 260. 1998.
4. Environmental Protection Agency, U.S. (2011, January 25). Common Wastes &
Materials - Plastics. Retrieved from
http://www.epa.gov/osw/conserve/materials/plastics.htm
5. Rosato, D. V., & Rosato, D. V. Selecting Plastic and Process. Reinforced Plastics
Handbook (3 ed., pp. 831-835). Oxford: Elsevier. 2004
6. Rosato, D. V., & Rosato, D. V. Selecting Plastic and Process. Reinforced plastics
handbook (3 ed., pp. 826-827). Oxford: Elsevier. 2004.
7. Torres, N., Robin, J., & Boutevin, B. Study of thermal and mechanical properties of
virgin and recycled Polyethylene terephthalate before and after injection molding.
European Polymer Journal, 36(10), 2075-2080. 2000.
8. F. A. Mantia. Handbook of Plastics Recycling, Shrewsbury, UK: Rapra Technology,
2002.
9. Kuswanti, C., Xu, G., Koelling, K., Stuart, J., Qiao, J., et al. An engineering approach to
plastic recycling based on rheological characterization. Journal of Industrial Ecology,
6(3-4), 125-135. 2003.
10. Khan, Z. , Kamaruddin, S. , & Siddiquee, A. Feasibility study of use of recycled high
density polyethylene and multi response optimization of injection moulding parameters
using combined grey relational and principal component analyses. Materials & Design,
31(6), 2925. 2010.
11. Rosato, D. V., & Rosato, D. V. Plastics. Reinforced plastics handbook (3 ed., pp. 109).
Oxford: Elsevier. 2004.
12. Rosato, D. V., Rosato, D. V., & Rosato, M. V. Plastic Property, polyester. Plastic
product material and process selection handbook (pp. 40-80). Kidlington, Oxford, UK:
Elsevier. 2004.
13. Rosato, D. V., Rosato, D. V., & Rosato, M. V. Injection Molding. Plastic Product
Material and Process Selection Handbook (pp. 192-220). Kidlington, Oxford, UK:
Elsevier. 2004.
14. Rosato, D. V., Rosato, D. V., & Rosato, M. V. Plastic Process, polyester. Plastic product
material and process selection handbook (pp. 85-86). Kidlington, Oxford, UK: Elsevier.
2004.
15. Cornell, J. A. Experiments with mixtures: designs, models, and the analysis of mixture
data (2nd ed.). New York: Wiley. 1990.
16. Bachman, K. (2010, May 15). Injection molder slashes part costs using recycled plastics.
Retrieved from http://beta.machinedesign.com/article/ags-technology-slashes-injection-
molded-part-costs-by-making-its-own-raw-material-from-recyc.
17. PlasticsNews. Resin pricing. (2011, June 2). Retrieved from
http://www.plasticsnews.com/resin-pricing/all-resins.html

34
18. Scheffé, H. Simplex-centroid designs for experiments with Mixtures, Journal of Royal
Statistical Society. Series B, 25, 235-263. 1963.
19. De Ketelaere B. & Goos P. & Brijs K. "Prespecified Factor-Level Combinations in the
Optimal Design of Mixture-Process Variable Experiments Abstract: Designed
experiments allow researchers to explore and understand the relation between set,"
Working Papers 2011001, University of Antwerp, Faculty of Applied Economics. 2010.
35
APPENDIX
PET Properties
36
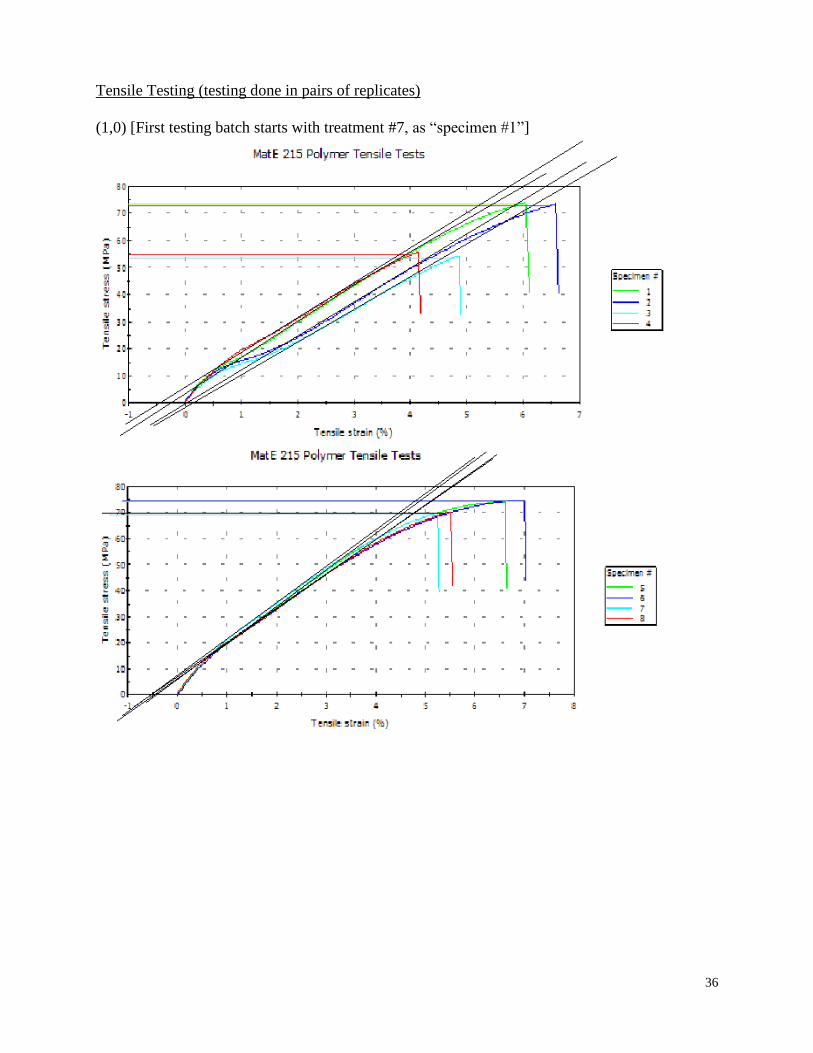
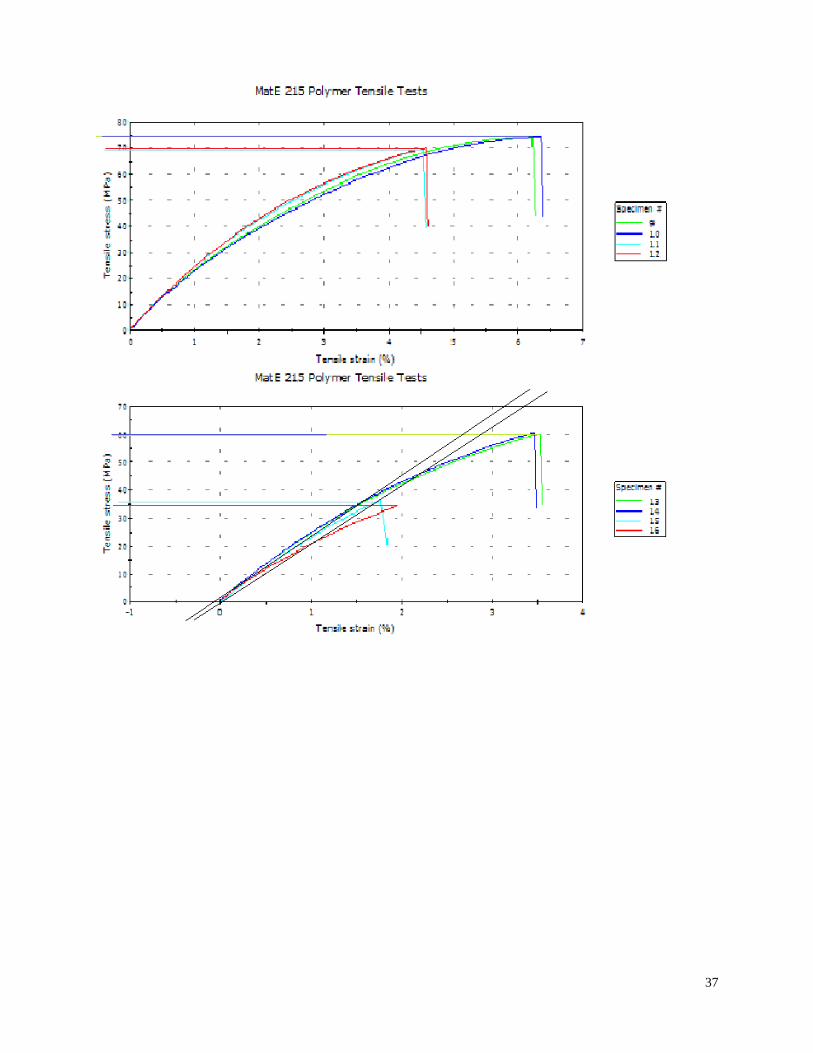
Tensile Testing (testing done in pairs of replicates)
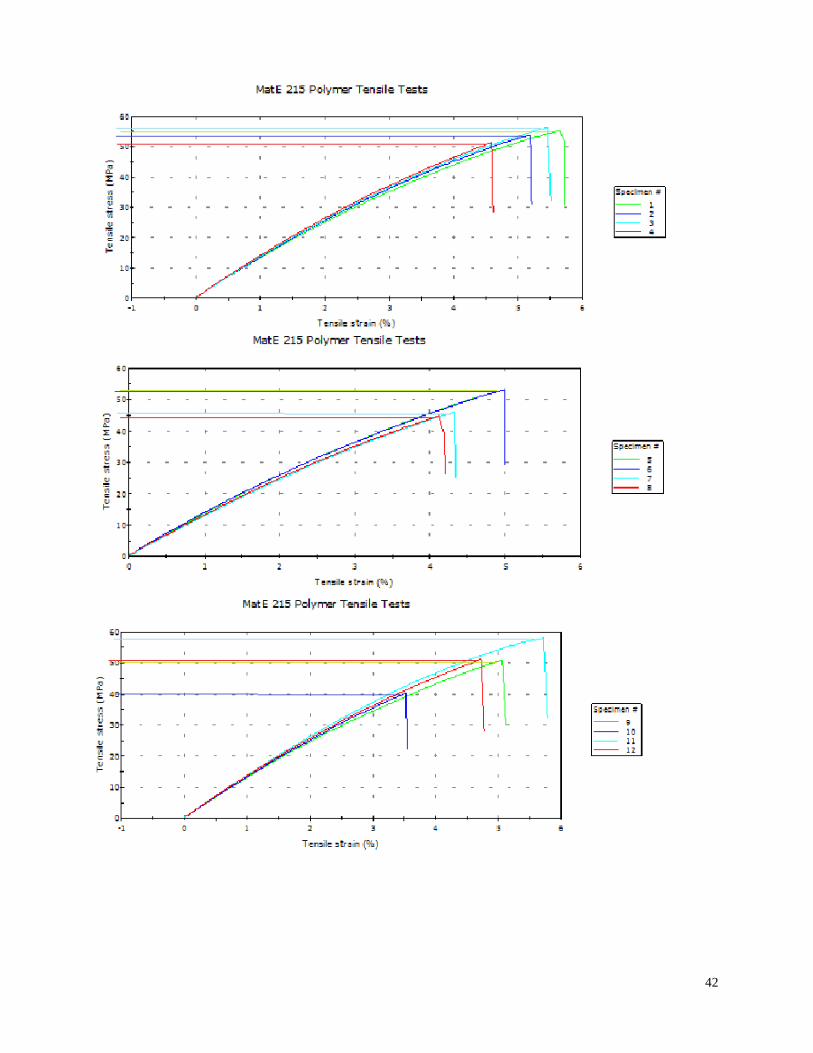
(1,0) [First testing batch starts with treatment #7, as ―specimen #1‖]
37
38
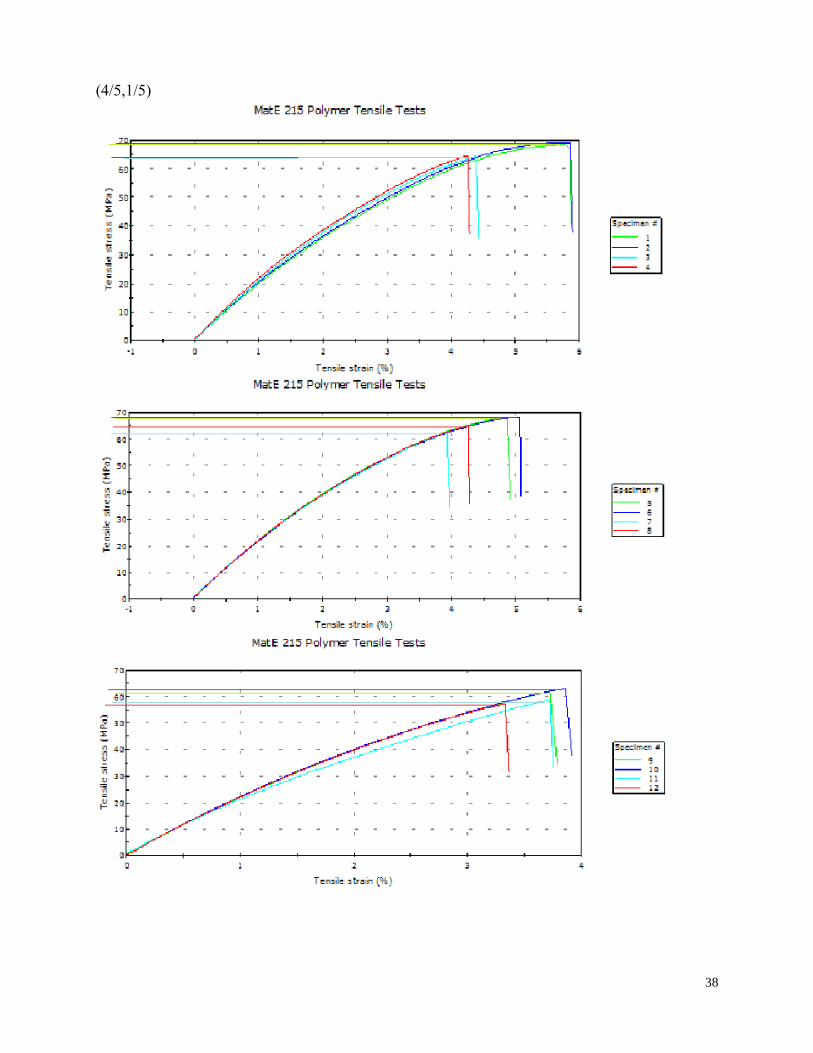
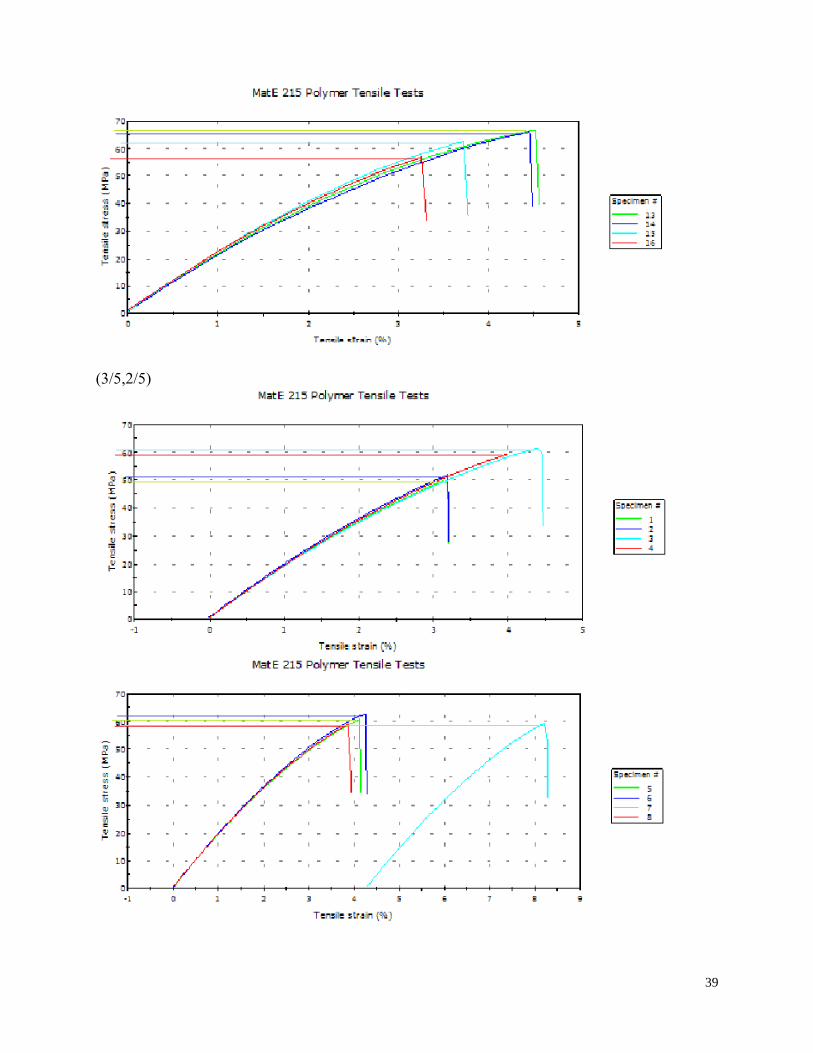
(4/5,1/5)
39
(3/5,2/5)
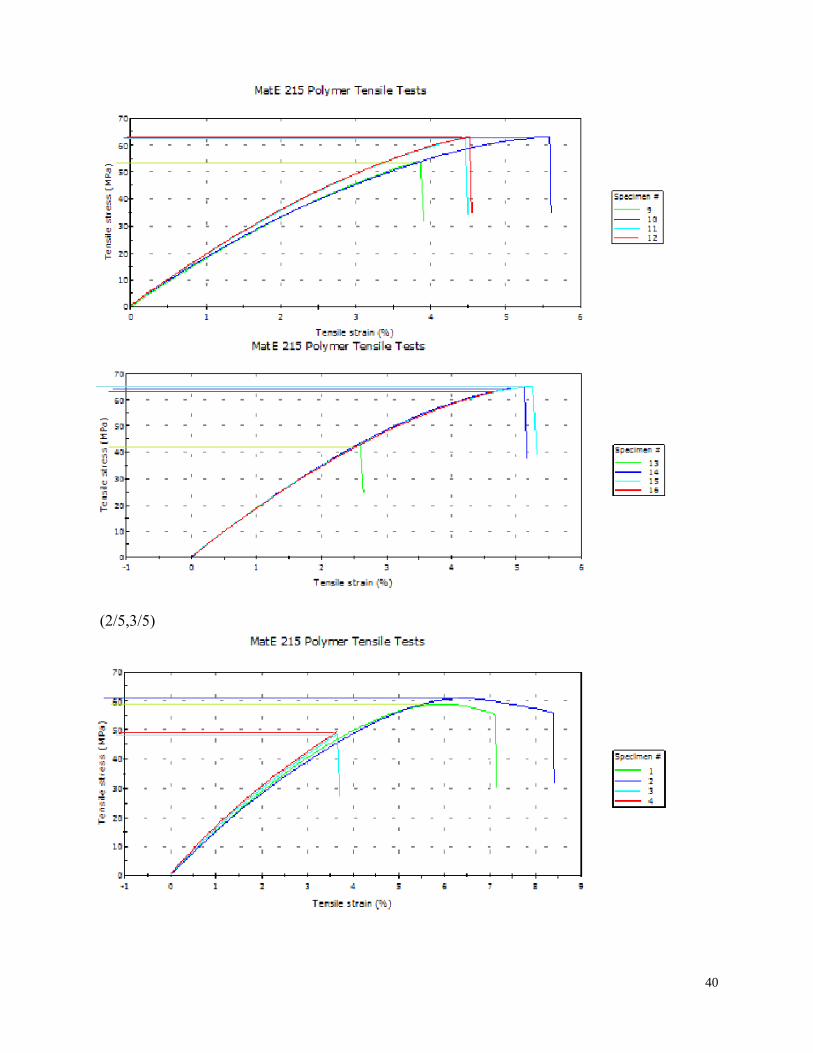
40
(2/5,3/5)
41
(1/5,4/5)
42
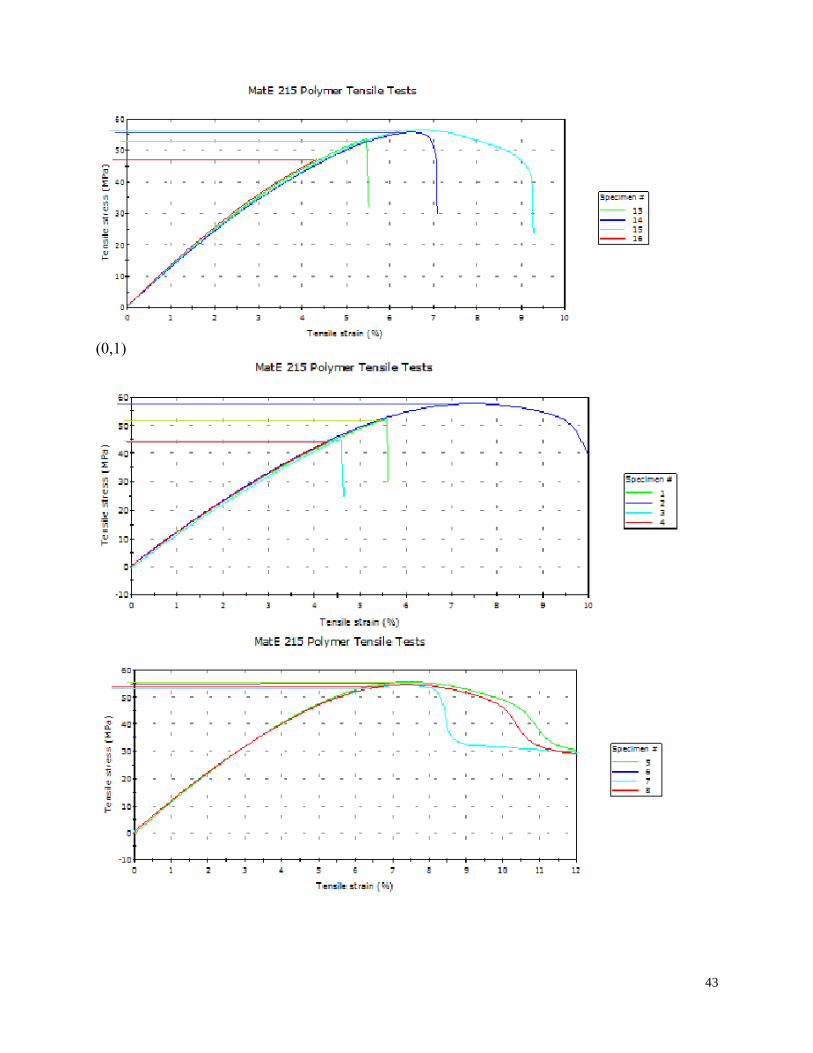
43
(0,1)
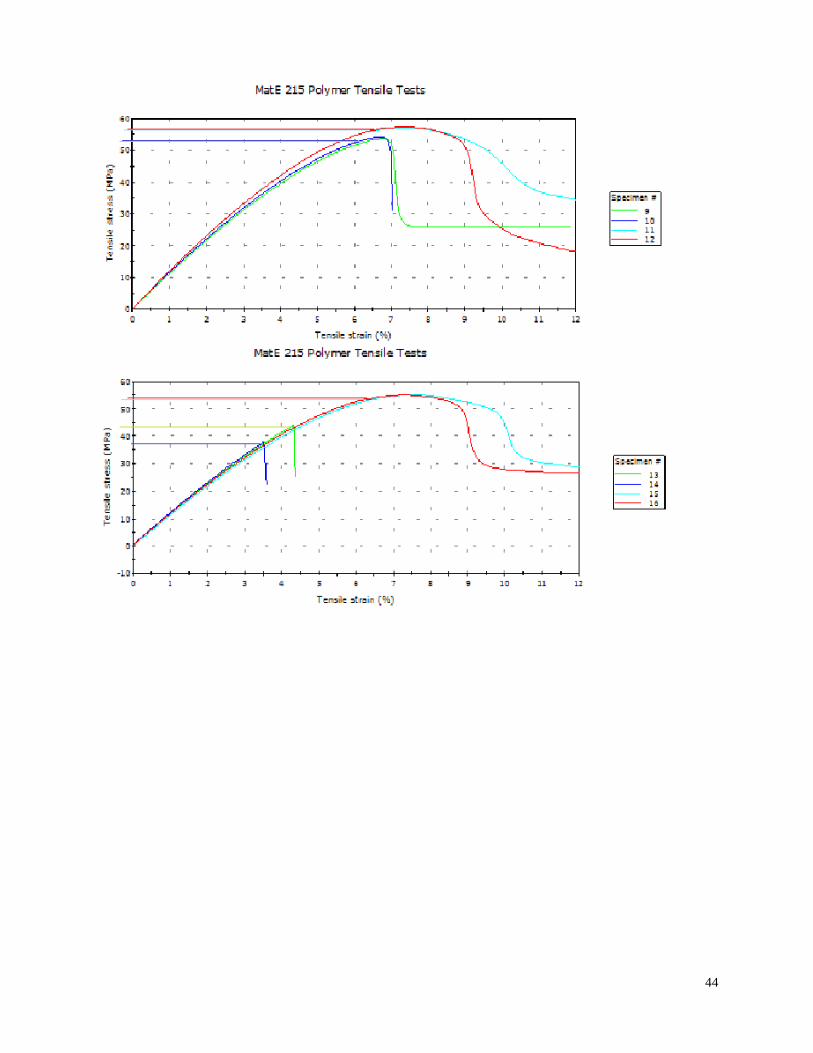
44


![Bending Behaviour of Recycled PET Fiber Reinforced Cement ...ijetch.org/vol7/805-CE045.pdf · industry [2]- [11]. The ... Bending Behaviour of Recycled PET Fiber Reinforced Cement-Based](https://static.cupdf.com/doc/110x72/5b0bf1f47f8b9a952f8b4652/bending-behaviour-of-recycled-pet-fiber-reinforced-cement-2-11-the-.jpg)