OKLAHOMA CITY AREA
INDIAN HEALTH SERVICE
AREA PROFILE 2009 November 2009

ACKNOWLEDGEMENTS
i
Data compiled by: Oklahoma City Area Indian Health Service Planning and Partnership Development: Marjorie Rogers, Area Planning Officer & Area GPRA Coordinator Tina Isham-Amos, Area Statistical Officer Julie Erb-Alvarez, Area Epidemiologist Diabetes Program: Joyce Mauldin, Statistician Southern Plains Inter-Tribal Epidemiology Center: Courtney Carrier, Epidemiologist Indian Health Service National CHR Program CDR Dione Harjo, Assistant Director
Special thanks to the staff of the Oklahoma City Area Indian Health Service who contribute each and every day to improving the health status of the American Indian and Alaska Na-tive people. Without your efforts, this report would not be possible.
Any questions or request for copies should be directed to: Tina Isham-Amos, Area Statistical Officer [email protected] (405) 961-3962

TABLE OF CONTENTS
ii
Chapter 1. Glossary of Terms, Abbreviations and Acronyms .......................................... 1
Chapter 2. Introduction ..................................................................................................... 3
Chapter 3. Demographics.................................................................................................. 5
Chapter 4. Maternal & Child Health ............................................................................... 13
Chapter 5. Mortality ......................................................................................................... 25
Chapter 6. Cancer Incidence ........................................................................................... 41
Chapter 7. GPRA .............................................................................................................. 55
Chapter 8. Diabetes Audit ............................................................................................... 81
Chapter 9. I/T/U Health Systems Data........................................................................... 89
Chapter 10. Substance Abuse ........................................................................................ 95
Chapter 11. Community Health Representative ........................................................... 99
Chapter 12. Tuberculosis ............................................................................................ 103
Chapter 1. Glossary of Terms, Abbreviations and Acronyms
1
Age-Adjustment: Age adjustment is used to compare risks of two or more populations at one point in time or one population at two or more points in time. Age-adjusted rates are computed by the direct method by applying age-specific rates in a population of interest to a standardized age distri-bution, in order to eliminate differences in observed rates that result from age differences in popu-lation composition.
Average Daily Patient Load: The average number of patients occupying beds in a hospital on a daily basis. It is calculated by dividing total inpatient days for the year by 365.
Cause of Death: For the purpose of national mortality statistics, every death is attributed to one un-derlying condition, based on information reported on the death certificate and using the interna-tional rules for selecting the underlying cause of death from the conditions stated on the death cer-tificate. The underlying cause is defined by the World Health Organization (WHO) as the disease or injury that initiated the train of events leading directly to death, or the circumstances of the acci-dent or violence, which produced the fatal injury.
Incidence: A measure of the risk of developing some new condition within a specified period of time. The number of new cases of a disease.
Infant Mortality: Death of live-born children who have not reached their first birthday expressed as a rate (i.e., the number of infant deaths during a year per 1,000 live births reported in the year).
Life Expectancy: The average number of years remaining to a person at a particular age based on a given set of age-specific death rates, generally the mortality conditions existing in the period men-tioned.
Low Birth Weight: Birth weight of less than 5 pounds, 8 ounces or 2,500 grams.
Maternal Death: The death of a woman while pregnant or within 42 days of termination of preg-nancy, irrespective of the duration and the site of the pregnancy, from any cause related to or ag-gravated by the pregnancy or its management but not from accidental or incidental causes.
Mortality: A fatal outcome; death.
Morbidity: Illness or disease.
Neonatal Mortality Rate: The number of deaths under 28 days of age per 1,000 live births.
Occurrence: Place where the event occurred.
Post-neonatal Mortality Rate: The number of deaths that occur from 28 days to 365 days after birth per 1,000 live births.
Years of Potential Life Lost (YPLL): A mortality indicator that measures the burden of premature deaths. It is calculated by subtracting the age at death from age 65 and summing the result over all deaths.

2
Abbreviations and Acronyms AAIR Age Adjusted Incidence Rate
AAMR Age Adjusted Mortality Rate
AI/AN American Indian/Alaska Native
BMI Body Mass Index
Census United States Census Bureau
CDC Centers for Disease Control and Prevention
CHAMPVA Civilian Health and Medical Program of the Department of Veterans Affairs
CHR Community Health Representative
CHS Contract Health Services
CRS Clinical Reporting System
Deliv. Delivered
DMII Diabetes Mellitus Type II
FAS Fetal Alcohol Syndrome
FY Fiscal Year
GPRA Government Performance Results Act
HIV Human Immunodeficiency Virus
HTN Hypertension
IHS Indian Health Service
I/T/U Indian Health Service (federal)/Tribal/Urban facilities
Lac. Laceration
NDW National Data Warehouse
NEC Not Elsewhere Classified (medical term)
NOS Not Otherwise Specified (medical term)
NPIRS IHS National Patient Information Reporting System
OCAO IHS Oklahoma City Area Office
ODMHSAS Oklahoma Department of Mental Health and Substance Abuse Services
OSDH Oklahoma State Department of Health
PCPV Primary Care Provider Visits
PCP Primary Care Provider
POV Purpose of Visit
RPMS Resource Patient Management System
SCHIP State Children’s Health Insurance Program
SU Service Unit
VA US Department of Veterans Affairs
Chapter 1. Glossary of Terms, Abbreviations and Acronyms

Chapter 2. Introduction
3
The Indian Health Service Oklahoma City Area serves the states of Oklahoma, Kansas, portions of Texas and Richardson County, Nebraska. In the Oklahoma City Area, there are 38 Tribes in Oklahoma, 4 Tribes in Kansas and 1 Tribe in Texas. The Area consists of 12 Service Units.
The Oklahoma City Area has the largest user population in all of Indian Health Service; the second largest is the Navajo Area. There are a mixture of Indian Health, Tribal and Urban (I/T/U) facilities located throughout the area. The large number of Tribal Health Care Facili-ties and Programs is a reflection of the partnerships and cooperation within our Area to ful-fill the health care needs of our community.
As of October 1, 2008, there are six hospitals, four of which are hospital tribally operated. The hospitals also provide ambulatory patient care services in addition to inpatient care. There are 54 outpatient ambulatory care centers in the area, which include four clinics lo-cated in urban areas
• Dallas, Texas
• Oklahoma City, Oklahoma
• Tulsa, Oklahoma
• Wichita, Kansas
Service Units in the Oklahoma City Area
Ada Claremore Clinton
Eagle Pass Holton Haskell
Lawton Pawnee Shawnee
Tahlequah Talihina Wewoka

4
OKLAHOMA CITY AREA—SERVICE UNITS

Chapter 3. Demographics
5
Population Demographics & Socio-Economic Status Demographics are the description of the population and can be illustrated through various data elements. The most common are population total by race, age and sex. Other data elements show the lifestyle of the population through education and socio-economic data; such as median household income, and poverty status.
In this chapter the data focuses on the states of Kansas, Texas and Oklahoma, which make up the Oklahoma City Area. The data source is from the US Census Bureau data sets of the Census 2000 data tables, and the 2006-2008 American Community Survey. The data shown represents American Indian/Alaska Native alone or single race; if AI/AN specific data was not available, the data for all races was used. Data for All races and US AI/AN Alone were also used when available for comparison.
53,064
420,866
262,758
0
50,000
100,000
150,000
200,000
250,000
300,000
350,000
400,000
450,000
Population Total of AI/AN Alone or AI/AN in Combination with one or more races
American Community Survey, US Census Bureau 2006‐2008
Kansas Oklahoma Texas
Total UnitedStates AI/AN Population
4,560,735
Chapter 3. Demographics
6
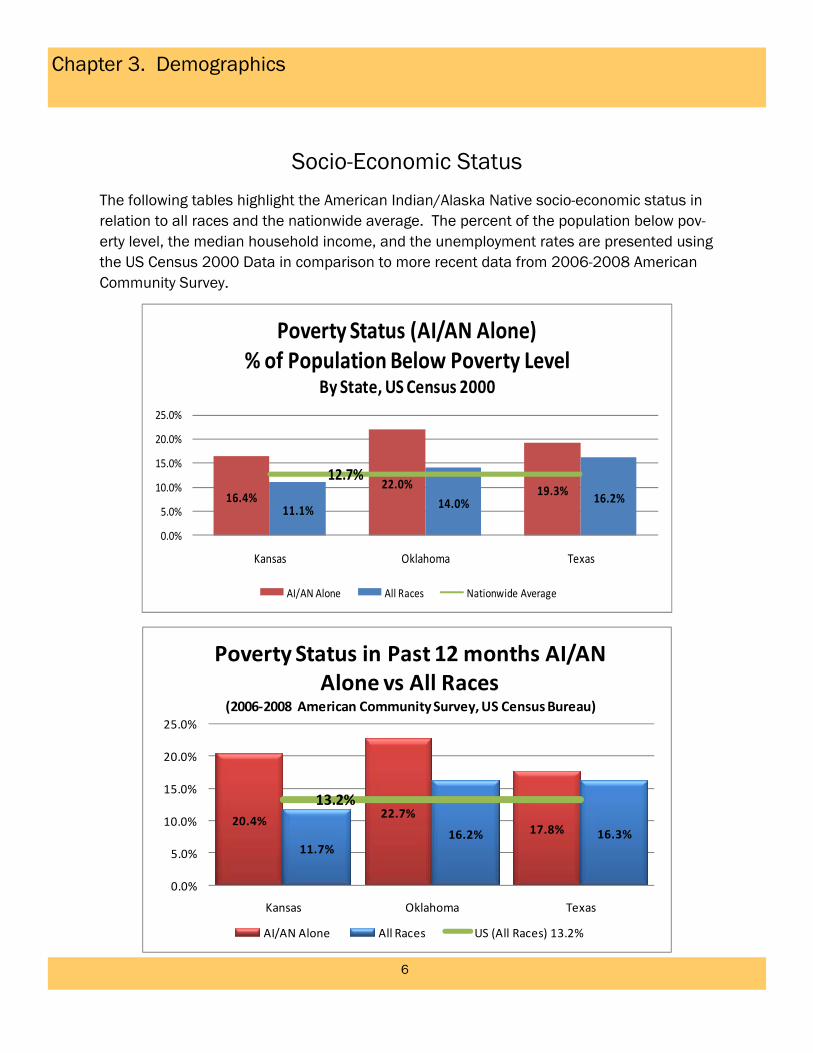
Socio-Economic Status
The following tables highlight the American Indian/Alaska Native socio-economic status in relation to all races and the nationwide average. The percent of the population below pov-erty level, the median household income, and the unemployment rates are presented using the US Census 2000 Data in comparison to more recent data from 2006-2008 American Community Survey.
16.4%22.0% 19.3%
11.1% 14.0% 16.2%
12.7%
0.0%
5.0%
10.0%
15.0%
20.0%
25.0%
Kansas Oklahoma Texas
Poverty Status (AI/AN Alone)% of Population Below Poverty Level
By State, US Census 2000
AI/AN Alone All Races Nationwide Average
20.4%22.7%
17.8%
11.7%16.2% 16.3%
13.2%
0.0%
5.0%
10.0%
15.0%
20.0%
25.0%
Kansas Oklahoma Texas
Poverty Status in Past 12 months AI/AN Alone vs All Races
(2006‐2008 American Community Survey, US Census Bureau)
AI/AN Alone All Races US (All Races) 13.2%

Chapter 3. Demographics
7
Socio-Economic Status

Chapter 3. Demographics
8
Education Status of Population The charts for education status are from the most recent Regional Differences in Indian Health, published in 2008 by the Indian Health Service, Division of Program Statistics.
13.312.3
11.310.2
9.59.4
8.48.48.2
7.565.7
0 4 8 12 16 20 24
OklahomaPortlandNashvilleBillings
CaliforniaTucsonBemidji
AberdeenAlbuquerque
PhoenixAlaskaNavajo
Percent
Percent Bachelor's Degree or HigherAge 25 and Older, 2000 Census American Indian/Alaska
Native (Alone)IHS Total=9.6
US All Races= 24.4
77.276.675.875.7
71.871.6
6968.868.167.3
6459.5
0 20 40 60 80
PortlandOklahoma
BemidjiBillingsAlaska
AberdeenCaliforniaNashvilleTucson
AlbuquerquePhoenixNavajo
Percent
Area
Percent High School Graduate or HigherAge 25 and Older, 2000 Census American Indian/Alaska Native (Alone)
IHS Total= 70.9
US All Races 80.4
Source: Regional Differences in Indian Health: 2002-2003 Edition, Chart 2.5
Source: Regional Differences in Indian Health: 2002-2003 Edition, Chart 2.6

Chapter 3. Demographics
9
Population Without Health Insurance
Source: Urban Institute and Kaiser Commission on Medicaid and the Uninsured estimates based on the Census Bureau's March 2008 and 2009 Current Population Survey (CPS: Annual Social and Eco-nomic Supplements). Health Insurance Coverage of the Total Population, states (2007-2008), U.S. (2008)
The Census Bureau broadly classifies health insurance coverage as either Private (non-government) coverage or Government-sponsored coverage (such as Medicare, Medicaid, SCHIP, Military Healthcare-Tricare, VA, CHAMPVA or state-specific plan). Since 1997 the US Census does not consider access to Indian Health Service as a form of insurance coverage. The uninsured percentages shown are for statewide all races, as there is not sufficient data for American Indian/Alaska Native specifically to measure health insurance coverage. The all races national average for CY 2008 was 15.4%.
12.5%
16.0%
25.2%
15.4%
0.0%
5.0%
10.0%
15.0%
20.0%
25.0%
30.0%
Kansas Oklahoma Texas National
Percent of Population Uninsured By StateAll Races, 2008

Chapter 3. Demographics
10
IHS User Population
Source: IHS National Data Warehouse User Population Reports and NPIRS (legacy) User Population Reports for the Oklahoma City Area.
The Indian Health Service User Population is an unduplicated count of AI/AN regis-trants who have had a direct or contract (inpatient, ambulatory, or dental) encounter with the health system during the last three years October 1, 2006 through Septem-ber 30, 2008. The chart below is the Oklahoma City Area user population trended over the past nine years. The I/T/U facilities export patient registration data to the National Data Warehouse each fiscal year in order to facilitate the area-wide process of un-duplication. The patient registrants are counted in the Service Unit and County where they reside regardless of which I/T/U facility they receive their care.
NOTE: FY 2008 is the latest official user population available, FY 2009 was not available at the time of this publication update.

Chapter 3. Demographics
11
Population Pyramid, OCA User Population 2008 This population pyramid shows the gender and age makeup of the Oklahoma City Area Users as of October 2008.
Age Group Female Male TOTAL
0 1,806 1,867 3,673
1-4 10,818 11,456 22,274
5-14 28,397 29,125 57,522
15-19 15,277 14,763 30,040
20-24 16,550 13,929 30479
25-34 27,512 23,290 50,802
35-44 21,682 18,415 40,097
45-64 35,528 28,936 64,464
65+ 15,297 11,578 26,875
Total 172,867 153,359 326,226
FY 2008 OCA IHS User by Age & Gender

12
This page is intentionally left blank

Chapter 4. Maternal and Child Health
13
BIRTH RATES
In Oklahoma, from calendar years 1992 through 2007, American Indians have consistently shown higher birth rates in comparison to whites and people of all races combined. An in-crease can be seen for American Indians from 2004 through 2007.
Source: OK2SHARE, Oklahoma State Department of Health. Vital Statistics, Birth Data. 2009.
0
5
10
15
20
25
Live
Births Pe
r 1,000
Pop
ulation
Oklahoma Birth RatesCalendar Years 1992‐2007
Oklahoma American Indian Oklahoma White Oklahoma All Races

Maternal and Child Health
14
BIRTH RATES FOR ADOLESCENT MOTHERS
Although there appears to be an overall downward trend for the general population, Okla-homa American Indian adolescents have shown markedly higher birth rates in comparison to the adolescents in the Oklahoma white population and of all races combined. In addition, a clear upward trend can be seen from 2003 through 2007 in the American Indian popula-tion.
Source: OK2SHARE, Oklahoma State Department of Health. Vital Statistics, Birth Data. 2009.
Chapter 4. Maternal and Child Health
0
2
4
6
8
10
12
Live
Births Pe
r 1,000
Pop
ulation
Oklahoma Birth Rates For Adolescents 10‐17 Years of AgeCalendar Years 1992‐2007
Oklahoma American Indian Oklahoma White Oklahoma All Races

Maternal and Child Health
15
LOW BIRTH WEIGHT
The proportion of low birth weight American Indian, white and all races babies have been steadily increasing over the time period from 1992 through 2007. Although the proportion of low birth weight babies has remained slightly lower than the white and all races popula-tion during this time, percent of low birth weight babies rose and was nearly equivalent for American Indians compared to the white population in 2007.
Source: OK2SHARE, Oklahoma State Department of Health. Vital Statistics, Birth Data. 2009.
Chapter 4. Maternal and Child Health
0.0%1.0%2.0%3.0%4.0%5.0%6.0%7.0%8.0%9.0%
Percentage of Low Birth Weight * Babies Born in OklahomaCalendar Years 1992‐2007
Oklahoma American Indian Oklahoma White Oklahoma All Races
* Low Birth Weight = 5.5 lbs or lessNationally, for 1996‐1998, 6.3% of AI/AN births in the IHSservice area were considered low birthweight.

Maternal and Child Health
16
HIGH BIRTH WEIGHT
Percentages of high birth weights (8.8 lbs or greater) have been steadily decreasing during the time period from 1992 through 2007. Even so, the proportion of high birth weight American Indian babies continues to be higher than that of the white and all races popula-tions.
Source: OK2SHARE, Oklahoma State Department of Health. Vital Statistics, Birth Data. 2009.
Chapter 4. Maternal and Child Health
0.00%
2.00%
4.00%
6.00%
8.00%
10.00%
12.00%
14.00%
16.00%
Percentage of High Birth Weight * Babies Born in OklahomaCalendar Years 1992‐2007
Oklahoma American Indian Oklahoma White Oklahoma All Races
* High Birth Weight = 8.8 lbs or greater

Maternal and Child Health
17
PRENATAL CARE
The yearly proportion of Oklahoma American Indian women receiving no prenatal care has remained slightly higher than the white and all races populations for the 16 year time period from 1992 through 2007. It appears that the yearly proportions for white and all races women have been increasing since 1999 and that all populations are increasing in propor-tion of pregnant women receiving no prenatal care.
Source: OK2SHARE, Oklahoma State Department of Health. Vital Statistics, Birth Data. 2009.
Chapter 4. Maternal and Child Health

Maternal and Child Health
18
ALCOHOL USE DURING PREGNANCY
The proportion of women reporting alcohol use during pregnancy has noticeably decreased since 1992. Although the proportion of American Indian women who reported drinking dur-ing their pregnancy was higher than that of the white and all races populations in the early 1990's, the proportions for each race have dropped and are now all equal at approximately one half of a percent, showing virtually no disparity in 2006. The newest data, from 2007, does reflect a slight increase for American Indians and a slight decrease for whites, but this is not a significant change from the previous year.
Source: OK2SHARE, Oklahoma State Department of Health. Vital Statistics, Birth Data. 2009.
Chapter 4. Maternal and Child Health
0.00%
0.50%
1.00%
1.50%
2.00%
2.50%
3.00%
Percentage of Oklahoma Mothers Who Drank Alcohol During PregnancyCalendar Years 1992‐2007
Oklahoma American Indian Oklahoma White Oklahoma All Races
Maternal and Child Health
19
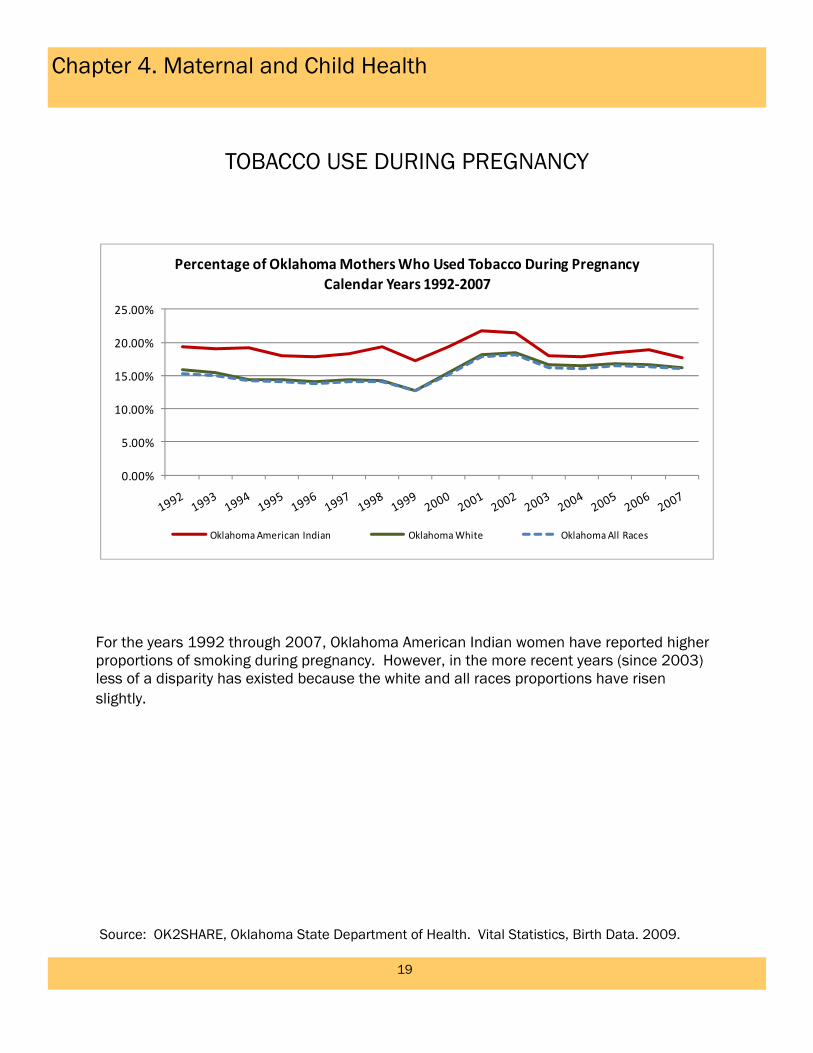
TOBACCO USE DURING PREGNANCY
For the years 1992 through 2007, Oklahoma American Indian women have reported higher proportions of smoking during pregnancy. However, in the more recent years (since 2003) less of a disparity has existed because the white and all races proportions have risen slightly.
Source: OK2SHARE, Oklahoma State Department of Health. Vital Statistics, Birth Data. 2009.
Chapter 4. Maternal and Child Health
0.00%
5.00%
10.00%
15.00%
20.00%
25.00%
Percentage of Oklahoma Mothers Who Used Tobacco During PregnancyCalendar Years 1992‐2007
Oklahoma American Indian Oklahoma White Oklahoma All Races
Maternal and Child Health
20
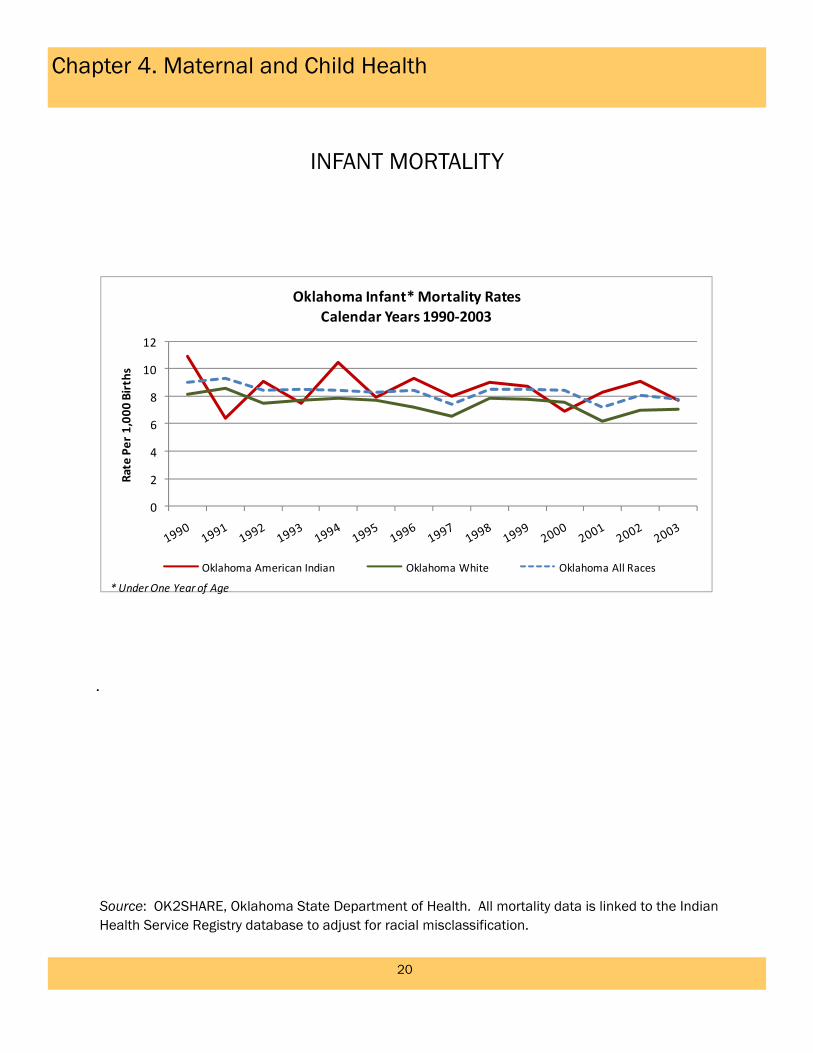
INFANT MORTALITY
.
0
2
4
6
8
10
12
Rate Per 1,000
Births
Oklahoma Infant* Mortality RatesCalendar Years 1990‐2003
Oklahoma American Indian Oklahoma White Oklahoma All Races
* Under One Year of Age
Source: OK2SHARE, Oklahoma State Department of Health. All mortality data is linked to the Indian Health Service Registry database to adjust for racial misclassification.
Chapter 4. Maternal and Child Health

Maternal and Child Health
21
NEONATAL MORTALITY
.
0
1
2
3
4
5
6
7
Rate Per 1,000
Births
Oklahoma Neonatal* Mortality RatesCalendar Years 1990‐2003
Oklahoma American Indian Oklahoma White Oklahoma All Races
* Thirty Days of Age or Less
Source: OK2SHARE, Oklahoma State Department of Health. All mortality data is linked to the Indian Health Service Registry database to adjust for racial misclassification.
Chapter 4. Maternal and Child Health

Maternal and Child Health
22
POST-NEONATAL MORTALITY
.
Source: OK2SHARE, Oklahoma State Department of Health. All mortality data is linked to the Indian Health Service Registry database to adjust for racial misclassification.
Chapter 4. Maternal and Child Health
0123456789
Rate Per 1,000
Births
Oklahoma Post Neonatal* Mortality RatesCalendar Years 1990‐2003
Oklahoma American Indian Oklahoma White Oklahoma All Races
* One Month to One Year of Age

Maternal and Child Health
23
CAUSES OF INFANT MORTALITY
.
Source: OK2SHARE, Oklahoma State Department of Health. All mortality data is linked to the In-dian Health Service Registry database to adjust for racial misclassification.
Chapter 4. Maternal and Child Health

Maternal and Child Health
24
.
This page is intentionally left blank
Chapter 5. Mortality
25
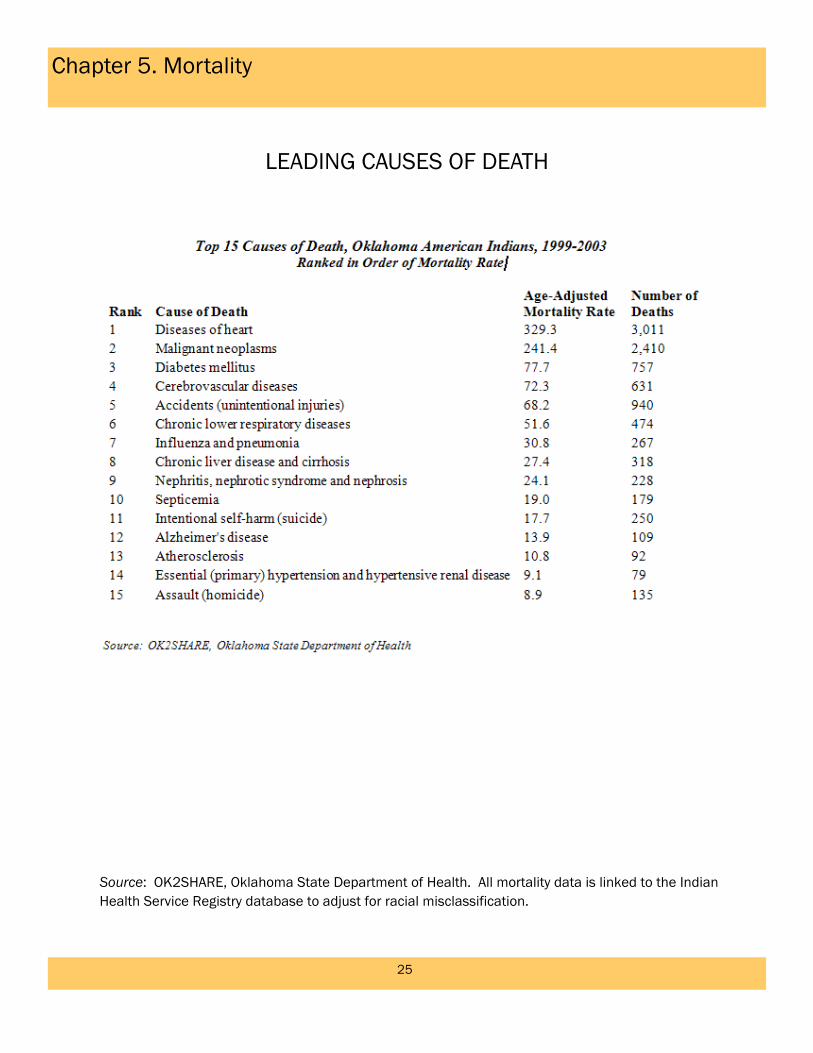
LEADING CAUSES OF DEATH
Source: OK2SHARE, Oklahoma State Department of Health. All mortality data is linked to the Indian Health Service Registry database to adjust for racial misclassification.
Mortality
26
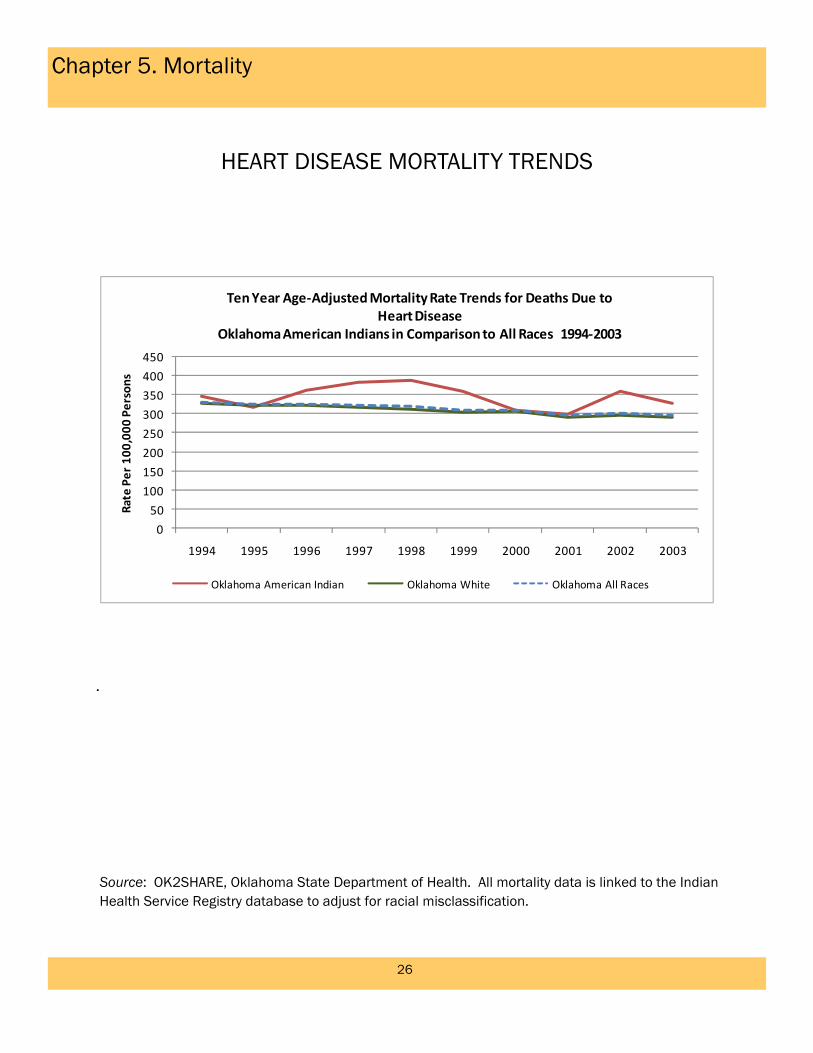
HEART DISEASE MORTALITY TRENDS
0
50
100
150
200
250
300
350
400
450
1994 1995 1996 1997 1998 1999 2000 2001 2002 2003
Rate Per 100
,000
Persons
Ten Year Age‐Adjusted Mortality Rate Trends for Deaths Due to Heart Disease
Oklahoma American Indians in Comparison to All Races 1994‐2003
Oklahoma American Indian Oklahoma White Oklahoma All Races
.
Source: OK2SHARE, Oklahoma State Department of Health. All mortality data is linked to the Indian Health Service Registry database to adjust for racial misclassification.
Chapter 5. Mortality

Mortality
27
CANCER MORTALITY TRENDS
.
0
50
100
150
200
250
300
1994 1995 1996 1997 1998 1999 2000 2001 2002 2003
Rate Per 100
,000
Persons
Ten Year Age‐Adjusted Mortality Rate Trends for Deaths Due to Malignant Neoplams
Oklahoma American Indians in Comparison to All Races, 1994‐2003
Oklahoma American Indian Oklahoma White Oklahoma All Races
Source: OK2SHARE, Oklahoma State Department of Health. All mortality data is linked to the Indian Health Service Registry database to adjust for racial misclassification.
Chapter 5. Mortality

Mortality
28
DIABETES MELLITUS MORTALITY TRENDS
.
0
20
40
60
80
100
1994 1995 1996 1997 1998 1999 2000 2001 2002 2003
Rate Per 100
,000
Persons
Ten Year Age‐Adjusted Mortality Rate Trends for Deaths Due to Diabetes Mellitus
Oklahoma American Indians in Comparison to All Races, 1994‐2003
Oklahoma American Indian Oklahoma White Oklahoma All Races
Source: OK2SHARE, Oklahoma State Department of Health. All mortality data is linked to the Indian Health Service Registry database to adjust for racial misclassification.
Chapter 5. Mortality

Mortality
29
CEREBROVASCULAR DISEASE (STROKE) MORTALITY TRENDS
.
0102030405060708090
1994 1995 1996 1997 1998 1999 2000 2001 2002 2003
Rate Per 100
,000
Persons
Ten Year Age‐Adjusted Mortality Rate Trends for Deaths Due to Cerebrovascular Disease (Stroke)
Oklahoma American Indians in Comparison to All Races, 1994‐2003
Oklahoma American Indian Oklahoma White Oklahoma All Races
Source: OK2SHARE, Oklahoma State Department of Health. All mortality data is linked to the Indian Health Service Registry database to adjust for racial misclassification.
Chapter 5. Mortality

Mortality
30
UNINTENTIONAL INJURY MORTALITY TRENDS
.
0
10
20
30
40
50
60
70
80
1994 1995 1996 1997 1998 1999 2000 2001 2002 2003
Rate Per 100
,000
Persons
Ten Year Age‐Adjusted Mortality Rate Trends for Deaths Due to Unintentional Injuries
Oklahoma American Indians in Comparison to All Races, 1994‐2003
Oklahoma American Indian Oklahoma White Oklahoma All Races
Source: OK2SHARE, Oklahoma State Department of Health. All mortality data is linked to the Indian Health Service Registry database to adjust for racial misclassification.
Chapter 5. Mortality

Mortality
31
CHRONIC LOWER RESPIRATORY DISEASE
MORTALITY TRENDS
.
0
10
20
30
40
50
60
70
1994 1995 1996 1997 1998 1999 2000 2001 2002 2003
Rate Per 100
,000
Persons
Ten Year Age‐Adjusted Mortality Rate Trends for Deaths Due to Chronic Lower Respiratory Diseases
Oklahoma American Indians in Comparison to All Races, 1994‐2003
Oklahoma American Indian Oklahoma White Oklahoma All Races
Source: OK2SHARE, Oklahoma State Department of Health. All mortality data is linked to the Indian Health Service Registry database to adjust for racial misclassification.
Chapter 5. Mortality

Mortality
32
INFLUENZA AND PNEUMONIA MORTALITY TRENDS
.
0
10
20
30
40
50
1994 1995 1996 1997 1998 1999 2000 2001 2002 2003
Rate Per 100
,000
0 Pe
rson
s
Ten Year Age‐Adjusted Mortality Rate Trends for Deaths Due to Influenza and Pnuemonia
Oklahoma American Indians in Comparison to All Races, 1994‐2003
Oklahoma American Indian Oklahoma White Oklahoma All Races
Source: OK2SHARE, Oklahoma State Department of Health. All mortality data is linked to the Indian Health Service Registry database to adjust for racial misclassification.
Chapter 5. Mortality
Mortality
33
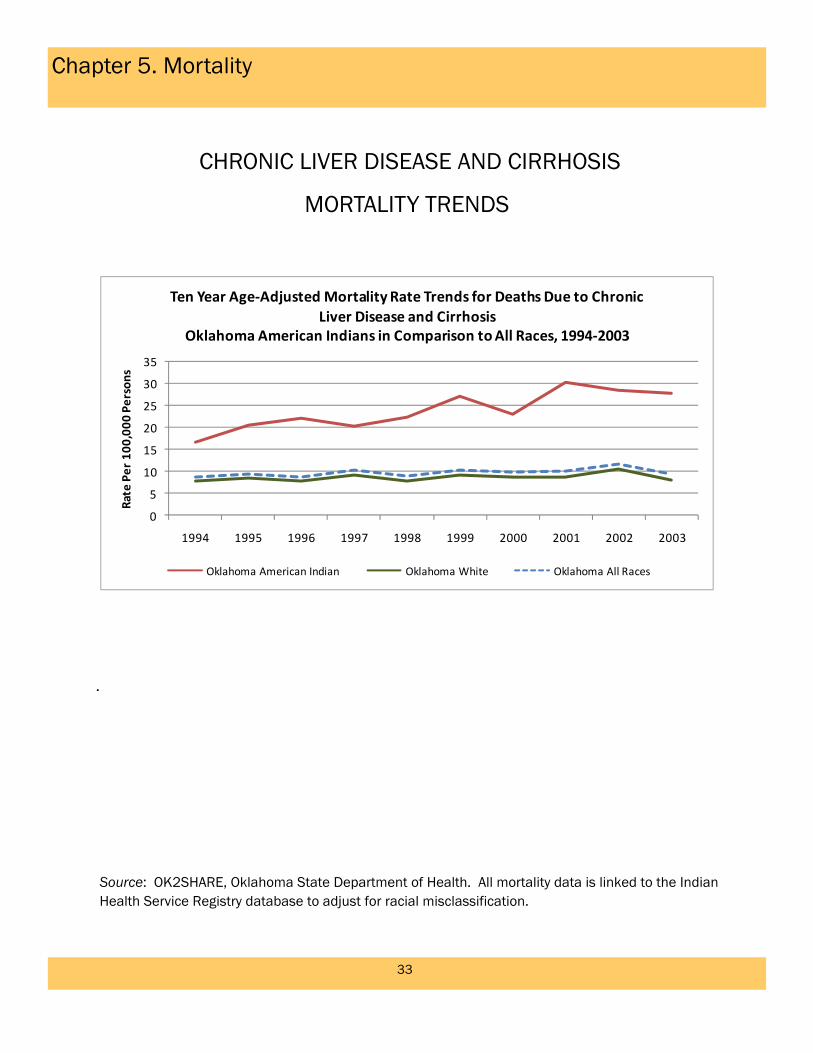
CHRONIC LIVER DISEASE AND CIRRHOSIS
MORTALITY TRENDS
.
0
5
10
15
20
25
30
35
1994 1995 1996 1997 1998 1999 2000 2001 2002 2003
Rate Per 100
,000
Persons
Ten Year Age‐Adjusted Mortality Rate Trends for Deaths Due to Chronic Liver Disease and Cirrhosis
Oklahoma American Indians in Comparison to All Races, 1994‐2003
Oklahoma American Indian Oklahoma White Oklahoma All Races
Source: OK2SHARE, Oklahoma State Department of Health. All mortality data is linked to the Indian Health Service Registry database to adjust for racial misclassification.
Chapter 5. Mortality
Mortality
34
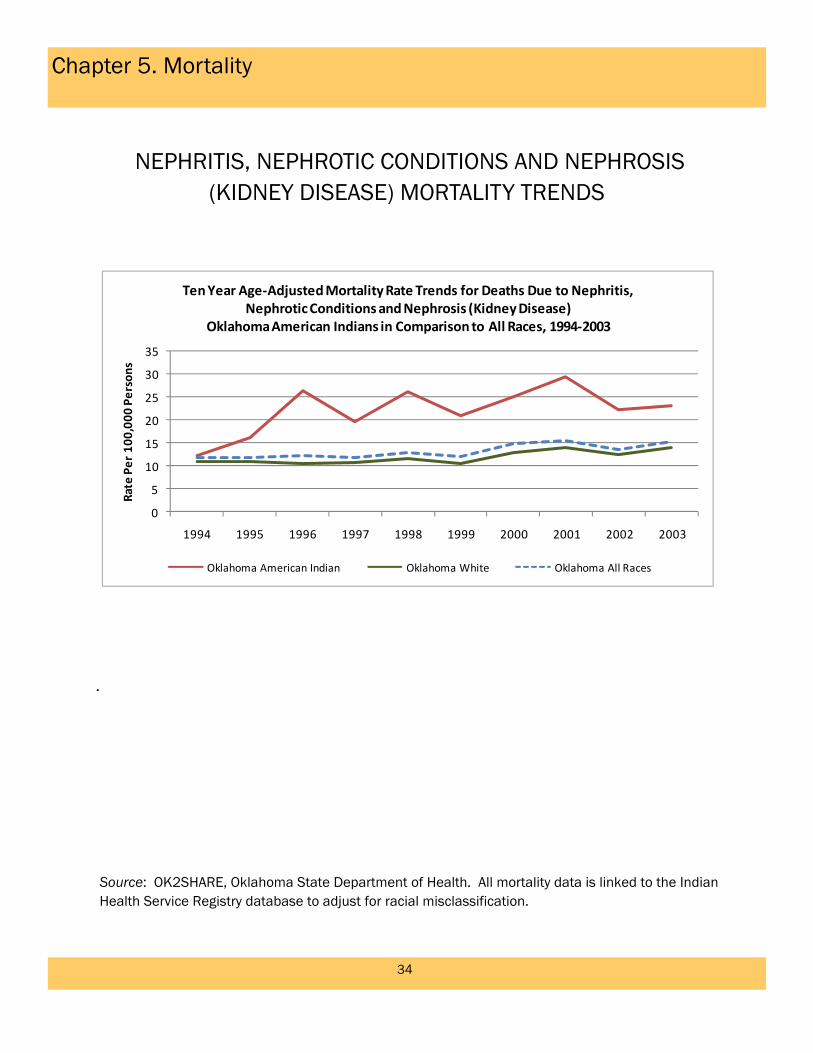
NEPHRITIS, NEPHROTIC CONDITIONS AND NEPHROSIS (KIDNEY DISEASE) MORTALITY TRENDS
.
0
5
10
15
20
25
30
35
1994 1995 1996 1997 1998 1999 2000 2001 2002 2003
Rate Per 100
,000
Persons
Ten Year Age‐Adjusted Mortality Rate Trends for Deaths Due to Nephritis, Nephrotic Conditions and Nephrosis (Kidney Disease)
Oklahoma American Indians in Comparison to All Races, 1994‐2003
Oklahoma American Indian Oklahoma White Oklahoma All Races
Source: OK2SHARE, Oklahoma State Department of Health. All mortality data is linked to the Indian Health Service Registry database to adjust for racial misclassification.
Chapter 5. Mortality

Mortality
35
SEPTICEMIA MORTALITY TRENDS
.
0
5
10
15
20
25
1994 1995 1996 1997 1998 1999 2000 2001 2002 2003
Rate Per 100
,000
Persons
Ten Year Age‐Adjusted Mortality Rate Trends for Deaths Due to Septicemia
Oklahoma American Indians in Comparison to All Races, 1994‐2003
Oklahoma American Indian Oklahoma White Oklahoma All Races
Source: OK2SHARE, Oklahoma State Department of Health. All mortality data is linked to the Indian Health Service Registry database to adjust for racial misclassification.
Chapter 5. Mortality

Mortality
36
SUICIDE MORTALITY TRENDS
.
0
5
10
15
20
25
1994 1995 1996 1997 1998 1999 2000 2001 2002 2003
Rate Per 100
,000
Persons
Ten Year Age‐Adjusted Mortality Rate Trends for Deaths Due to SuicideOklahoma American Indians in Comparison to All Races, 1994‐2003
Oklahoma American Indian Oklahoma White Oklahoma All Races
Source: OK2SHARE, Oklahoma State Department of Health. All mortality data is linked to the Indian Health Service Registry database to adjust for racial misclassification.
Chapter 5. Mortality

Mortality
37
ALZHEIMER’S DISEASE MORTALITY TRENDS
.
0
5
10
15
20
25
1994 1995 1996 1997 1998 1999 2000 2001 2002 2003
Rate Per 100
,000
Persons
Ten Year Age‐Adjusted Mortality Rate Trends for Deaths Due to Alzheimer's Disease
Oklahoma American Indians in Comparison to All Races, 1994‐2003
Oklahoma American Indian Oklahoma White Oklahoma All Races
Source: OK2SHARE, Oklahoma State Department of Health. All mortality data is linked to the Indian Health Service Registry database to adjust for racial misclassification.
Chapter 5. Mortality

Mortality
38
ATHEROSCLEROSIS MORTALITY TRENDS
.
0
5
10
15
20
25
1994 1995 1996 1997 1998 1999 2000 2001 2002 2003
Rate Per 100
,000
Persons
Ten Year Age‐Adjusted Mortality Rate Trends for Deaths Due to Atherosclerosis
Oklahoma American Indians in Comparison to All Races, 1994‐2003
Oklahoma American Indian Oklahoma White Oklahoma All Races
Source: OK2SHARE, Oklahoma State Department of Health. All mortality data is linked to the Indian Health Service Registry database to adjust for racial misclassification.
Chapter 5. Mortality
Mortality
39
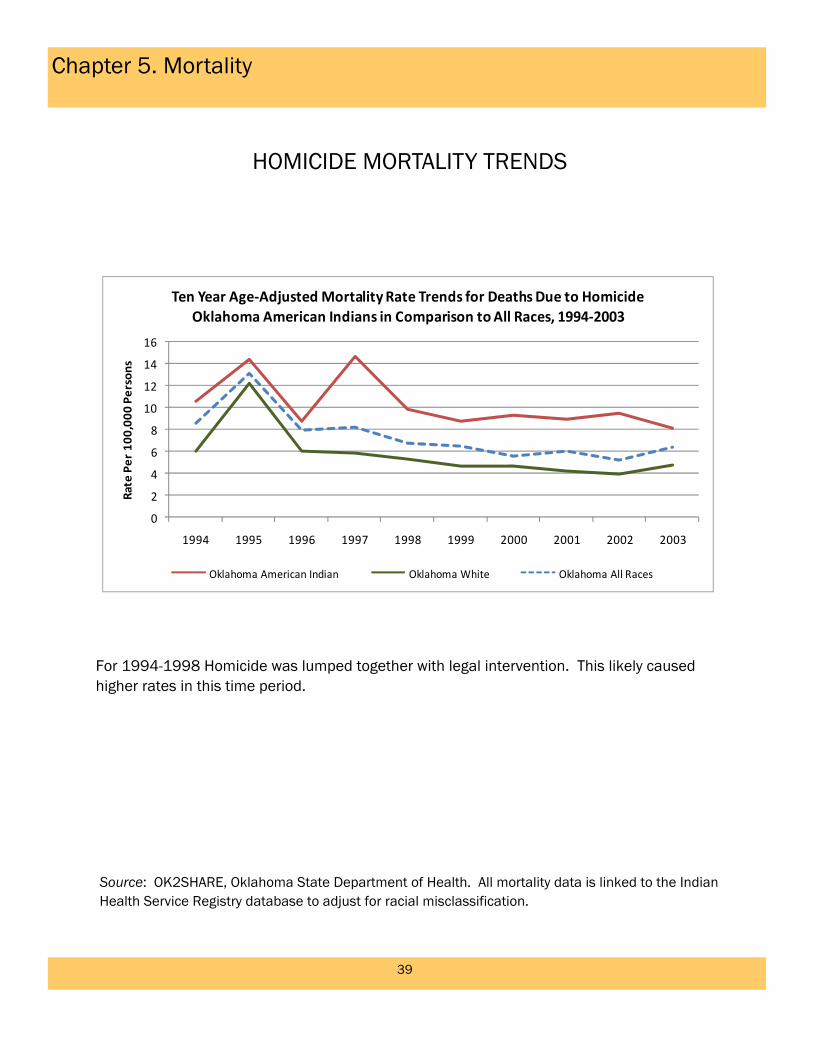
HOMICIDE MORTALITY TRENDS
For 1994-1998 Homicide was lumped together with legal intervention. This likely caused higher rates in this time period.
0
2
4
6
8
10
12
14
16
1994 1995 1996 1997 1998 1999 2000 2001 2002 2003
Rate Per 100
,000
Persons
Ten Year Age‐Adjusted Mortality Rate Trends for Deaths Due to HomicideOklahoma American Indians in Comparison to All Races, 1994‐2003
Oklahoma American Indian Oklahoma White Oklahoma All Races
Source: OK2SHARE, Oklahoma State Department of Health. All mortality data is linked to the Indian Health Service Registry database to adjust for racial misclassification.
Chapter 5. Mortality

Mortality
40
This page is intentionally left blank

Chapter 6. Cancer Incidence
41
MOST COMMONLY DIAGNOSED CANCERS IN OKLAHOMA AMERICAN INDIANS
Source: OK2SHARE, Oklahoma State Department of Health, Oklahoma Cancer Registry. All cancer registry data is linked to the Indian Health Service registry database to adjust for racial misclassification.
Rank Primary Cancer Site Age-Adjusted Incidence Rate
Number of Cancers
Diagnosed
1 Lung and bronchus 94.8 2,189
2 Breast (Excluding In Situ) 71.0 1,777
3 Prostate 64.5 1,458
4 Colon excluding rectum 47.5 1,070
5 Kidney and renal pelvis 23.7 587
6 Non-Hodgkin Lymphoma 21.7 511
7 Rectum and rectosigmoid 19.5 471
8 Bladder 15.2 342
9 Corpus uteri (uterine) 13.9 350
10 Pancreas 11.6 266
Top 10 Most Commonly Diagnosed Cancer Sites, Oklahoma American Indians, 1997-2007 Ranked by Incidence Rate

Cancer Incidence
42
CANCER INCIDENCE—ALL SITES (TYPES)
Source: OK2SHARE, Oklahoma State Department of Health, Oklahoma Cancer Registry. All cancer registry data is linked to the Indian Health Service registry database to adjust for racial misclassification.
Chapter 6. Cancer Incidence
The graphs below and on the following twelve pages outline, by cancer type 1) the yearly Age-Adjusted Inci-dence Rates (AAIR) for cancers trended out over the years 1997 through 2007 in comparison to the white and all races populations, 2) the cancer AAIRs for this combined period, and 3) the percentage of cancer cases, by race, that were diagnosed at an advanced (distant) stage during this same time period. For all types of cancer combined, the rates (shown below) have been higher for American Indians over the period from 1997-2007 in comparison to the white and all races populations. The percent of cases diag-nosed at a distant stage was slightly higher for American Indians compared to the white population.
Cancer Incidence
43
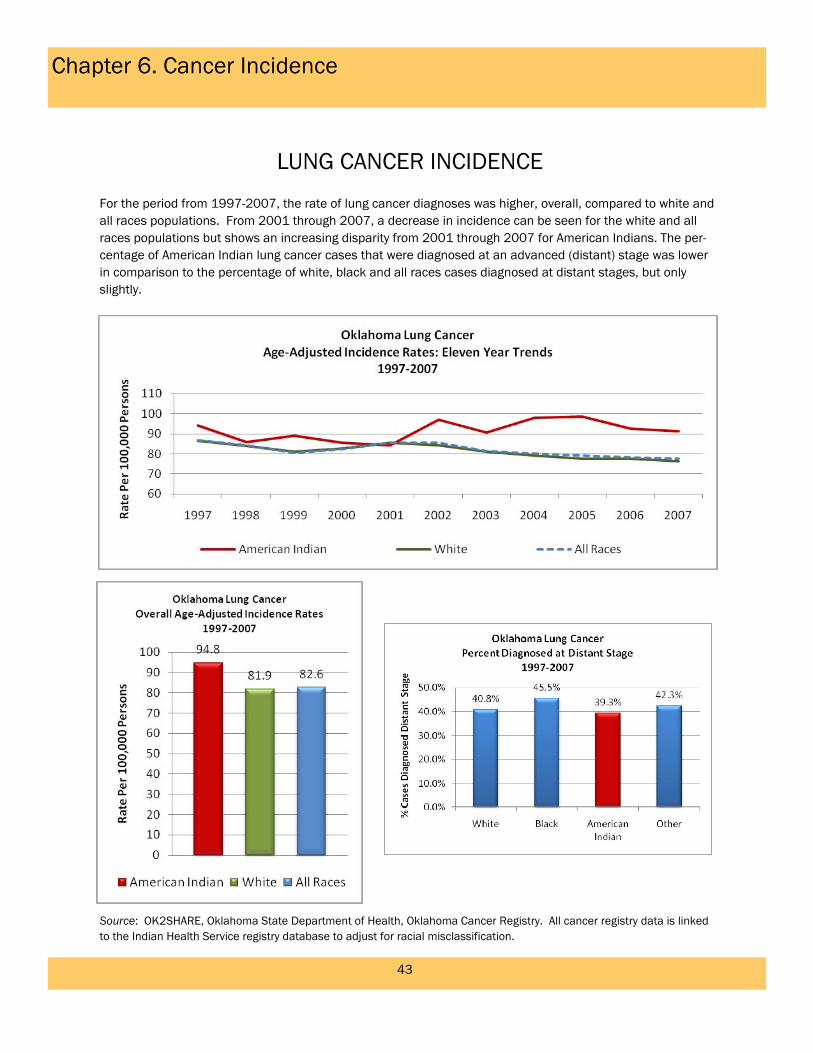
LUNG CANCER INCIDENCE
Source: OK2SHARE, Oklahoma State Department of Health, Oklahoma Cancer Registry. All cancer registry data is linked to the Indian Health Service registry database to adjust for racial misclassification.
Chapter 6. Cancer Incidence
For the period from 1997-2007, the rate of lung cancer diagnoses was higher, overall, compared to white and all races populations. From 2001 through 2007, a decrease in incidence can be seen for the white and all races populations but shows an increasing disparity from 2001 through 2007 for American Indians. The per-centage of American Indian lung cancer cases that were diagnosed at an advanced (distant) stage was lower in comparison to the percentage of white, black and all races cases diagnosed at distant stages, but only slightly.

Cancer Incidence
44
FEMALE BREAST CANCER INCIDENCE
Source: OK2SHARE, Oklahoma State Department of Health, Oklahoma Cancer Registry. All cancer registry data is linked to the Indian Health Service registry database to adjust for racial misclassification.
Chapter 6. Cancer Incidence
For the period from 1997-2007, the rate of breast cancer in females was about equivalent for American Indi-ans compared to the white and all races populations. The percentage of American Indian female breast can-cer cases that were diagnosed at an advanced (distant) stage was about equal to the percentage of white and all races populations, but much lower than the black population.
Cancer Incidence
45
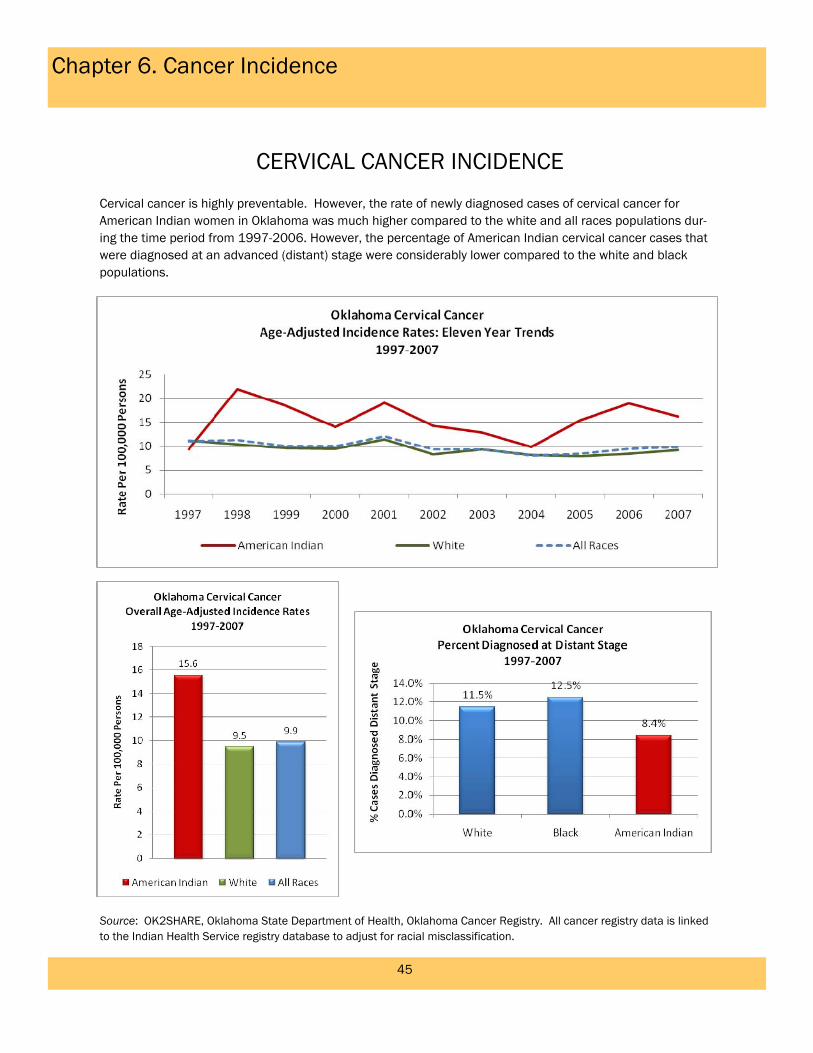
CERVICAL CANCER INCIDENCE
Source: OK2SHARE, Oklahoma State Department of Health, Oklahoma Cancer Registry. All cancer registry data is linked to the Indian Health Service registry database to adjust for racial misclassification.
Chapter 6. Cancer Incidence
Cervical cancer is highly preventable. However, the rate of newly diagnosed cases of cervical cancer for American Indian women in Oklahoma was much higher compared to the white and all races populations dur-ing the time period from 1997-2006. However, the percentage of American Indian cervical cancer cases that were diagnosed at an advanced (distant) stage were considerably lower compared to the white and black populations.
Cancer Incidence
46
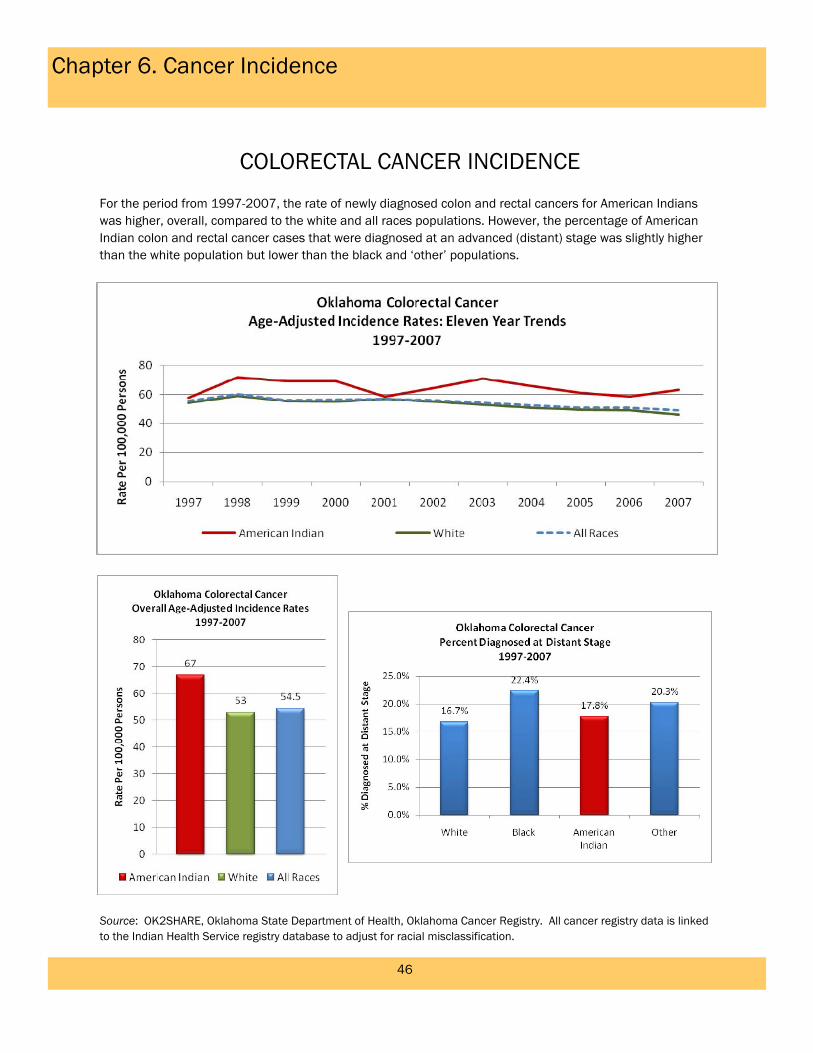
COLORECTAL CANCER INCIDENCE
Source: OK2SHARE, Oklahoma State Department of Health, Oklahoma Cancer Registry. All cancer registry data is linked to the Indian Health Service registry database to adjust for racial misclassification.
Chapter 6. Cancer Incidence
For the period from 1997-2007, the rate of newly diagnosed colon and rectal cancers for American Indians was higher, overall, compared to the white and all races populations. However, the percentage of American Indian colon and rectal cancer cases that were diagnosed at an advanced (distant) stage was slightly higher than the white population but lower than the black and ‘other’ populations.

Cancer Incidence
47
PROSTATE CANCER INCIDENCE
Source: OK2SHARE, Oklahoma State Department of Health, Oklahoma Cancer Registry. All cancer registry data is linked to the Indian Health Service registry database to adjust for racial misclassification.
Chapter 6. Cancer Incidence
For the period from 1997-2007, the incidence rate of prostate cancer was only slightly higher overall for American Indians compared to the white and all races populations, and showed a dip below those popula-tions in 2006-2007. The percentage of American Indian prostate cancer cases that were diagnosed at an advanced (distant) stage was slightly higher compared to the white population but lower than the black popu-lation.

Cancer Incidence
48
NON-HODGKIN’S LYMPHOMA INCIDENCE
Source: OK2SHARE, Oklahoma State Department of Health, Oklahoma Cancer Registry. All cancer registry data is linked to the Indian Health Service registry database to adjust for racial misclassification.
Chapter 6. Cancer Incidence
For the period from 1997-2007, the rate of Non-Hodgkin's Lymphoma was slightly higher overall for American Indians compared to the white and all races populations. The percentage of American Indian Non-Hodgkin's Lymphoma cases that were diagnosed at an advanced (distant) stage was slightly higher compared to the white population but lower than the black population.

Cancer Incidence
49
KIDNEY AND RENAL PELVIS CANCER INCIDENCE
Source: OK2SHARE, Oklahoma State Department of Health, Oklahoma Cancer Registry. All cancer registry data is linked to the Indian Health Service registry database to adjust for racial misclassification.
Chapter 6. Cancer Incidence
The overall rate of kidney and renal pelvis cancer for American Indians was much higher than the white and all races populations for the time period from 1997-2007. The percentage of kidney and renal pelvis cancers that were diagnosed at an advanced (distant) stage was also higher compared to the white and black popula-tions.

Cancer Incidence
50
BLADDER CANCER INCIDENCE
Source: OK2SHARE, Oklahoma State Department of Health, Oklahoma Cancer Registry. All cancer registry data is linked to the Indian Health Service registry database to adjust for racial misclassification.
Chapter 6. Cancer Incidence
The overall rate of bladder cancer for American Indians was lower than the white and all races populations for the time period from 1997-2007. The percentage of bladder cancers that were diagnosed at an advanced (distant) stage was slightly higher compared to the white population but distinctly lower than the black popu-lation.

Cancer Incidence
51
CORPUS UTERI (UTERINE) CANCER INCIDENCE
Source: OK2SHARE, Oklahoma State Department of Health, Oklahoma Cancer Registry. All cancer registry data is linked to the Indian Health Service registry database to adjust for racial misclassification.
Chapter 6. Cancer Incidence
The overall rate of uterine cancer for American Indians was higher than the white and all races populations for the time period from 1997-2007. The percentage of uterine cancers that were diagnosed at an advanced (distant) stage were several percentage points higher than the white population but distinctly lower than the black population.

Cancer Incidence
52
SKIN CANCER (MELANOMA) INCIDENCE
Source: OK2SHARE, Oklahoma State Department of Health, Oklahoma Cancer Registry. All cancer registry data is linked to the Indian Health Service registry database to adjust for racial misclassification.
Chapter 6. Cancer Incidence
For the period from 1997 through 2007, the rate of skin cancer has remained consistently lower for Ameri-can Indians, although it does show a slight increase overall since 1997. The percentage of skin cancers that were diagnosed at an advanced (distant) stage were slightly higher than the white and all races populations.
*Excluding Basal and Squamous Cell Carcinomas

Cancer Incidence
53
STOMACH CANCER INCIDENCE
Source: OK2SHARE, Oklahoma State Department of Health, Oklahoma Cancer Registry. All cancer registry data is linked to the Indian Health Service registry database to adjust for racial misclassification.
The rate of stomach cancer has remained consistently higher for American Indians during most of the time period from 1997-2007. The percentage that were diagnosed at an advanced (distant) stage were higher for American Indians in comparison to the white and black populations, but lower than those classified as ‘other’ population.
Chapter 6. Cancer Incidence

Cancer Incidence
54
LIVER AND BILE DUCT CANCER INCIDENCE
Source: OK2SHARE, Oklahoma State Department of Health, Oklahoma Cancer Registry. All cancer registry data is linked to the Indian Health Service registry database to adjust for racial misclassification.
The rates of liver and bile duct cancer for American Indians for each year from 1997 through 2007 was con-sistently higher than the white and all races populations, and took a sharp turn upward in 2007. Although these rates were consistently higher, the percentage of American Indian cases that were diagnosed at an advanced (distant) stage were slightly lower than the all races and white populations.
Chapter 6. Cancer Incidence
Chapter 7. Government Performance and Results Act (GPRA)
55
What is GPRA?
• Acronym for the “Government Performance and Results Act of 1993”.
• It is a federal law.
• Shows Congress how the Indian Health Service is performing based on a set of specific performance measures.
• Information that is reported to Congress must be backed up by a data supported audit trail that can be verified and validated.
• The “Clinical Reporting System” is the RPMS application the IHS Di-rector has chosen to help obtain clinical data for GPRA.
• GPRA data is incorporated in the annual budget request for IHS.

GPRA USER POPULATION: Any AI/AN patient who is alive on the last day of the report period and residing in the defined community with at least one visit to any clinic in the three years prior to the end of the report period. *NOTE: This defini-tion is not comparable to the Official User Population definition that was developed by IHS to define its core population for statistical reporting to Congress.
ACTIVE CLINICAL POPULATION: Patient must be American Indian/Alaska Native (Beneficiary Classification: 01), must reside in a community included in the site’s “official” GPRA community taxonomy, must be alive on the last day of the report period, and must have two visits to medical clinics in the past three years.
Chapter 7. Government Performance and Results Act (GPRA)
56
Numerator: The numerator is the number of patients who meet the logic criteria for a performance measure.
Denominator: The denominator for a performance measure is the total patient population being reviewed. Each meas-ure may have a different denominator.

Chapter 7. Government Performance and Results Act (GPRA) Diabetes Prevalence
57
Measure: (Non-GPRA measure) Proportion of patients with diagnosed diabetes prior to the end of the report period.
Denominator
User Population patients
Numerator
Anyone diagnosed with diabetes (POV 250.00-250.93) ever.
Chapter 7. Government Performance and Results Act (GPRA) Diabetes: Documented Hemoglobin A1c
58
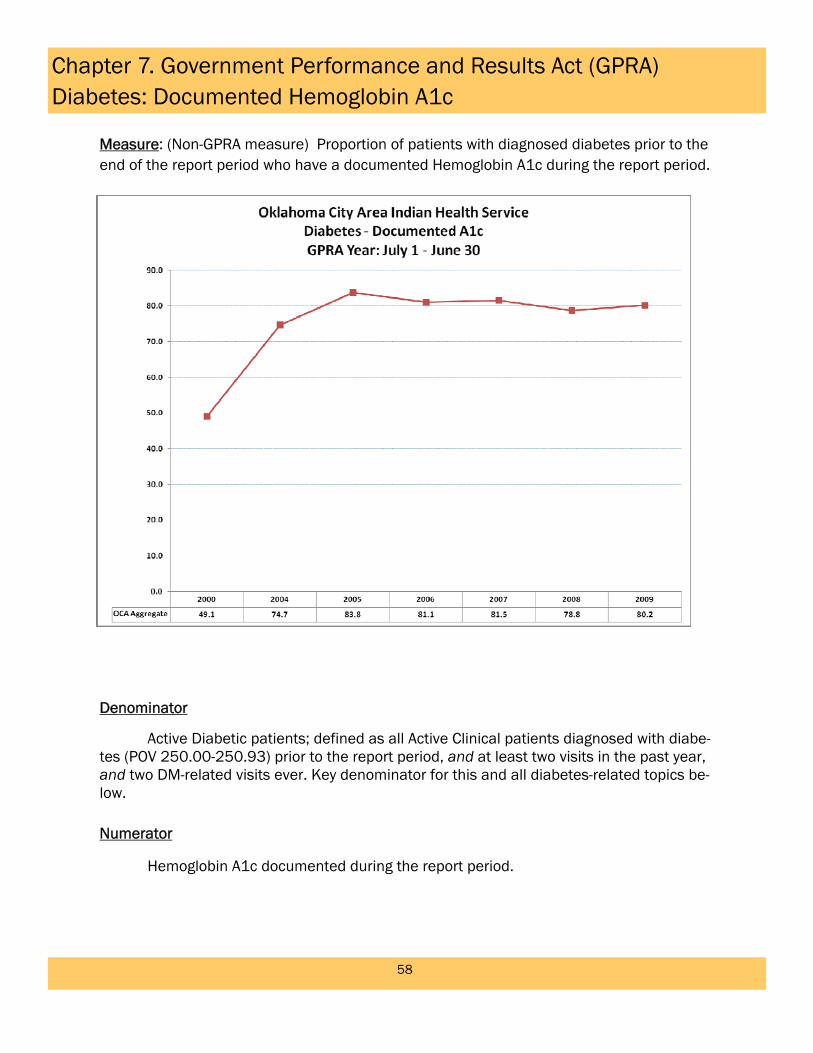
Measure: (Non-GPRA measure) Proportion of patients with diagnosed diabetes prior to the end of the report period who have a documented Hemoglobin A1c during the report period.
Denominator
Active Diabetic patients; defined as all Active Clinical patients diagnosed with diabe-tes (POV 250.00-250.93) prior to the report period, and at least two visits in the past year, and two DM-related visits ever. Key denominator for this and all diabetes-related topics be-low. Numerator
Hemoglobin A1c documented during the report period.
Chapter 7. Government Performance and Results Act (GPRA) Diabetes: Poor Glycemic Control
59
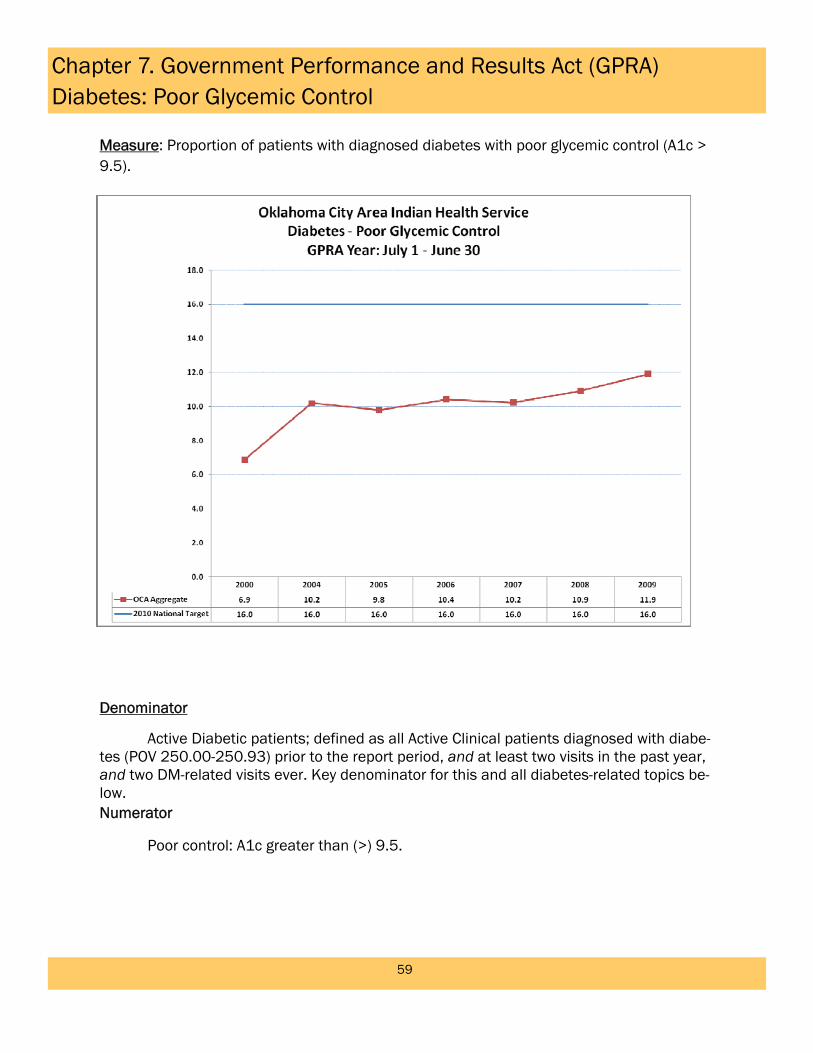
Measure: Proportion of patients with diagnosed diabetes with poor glycemic control (A1c > 9.5).
Denominator
Active Diabetic patients; defined as all Active Clinical patients diagnosed with diabe-tes (POV 250.00-250.93) prior to the report period, and at least two visits in the past year, and two DM-related visits ever. Key denominator for this and all diabetes-related topics be-low. Numerator
Poor control: A1c greater than (>) 9.5.

Chapter 7. Government Performance and Results Act (GPRA) Diabetes: Ideal Glycemic Control
60
Measure: Proportion of patients with diagnosed diabetes with ideal glycemic control (A1c < 7.0).
Denominator
Active Diabetic patients; defined as all Active Clinical patients diagnosed with diabe-tes (POV 250.00-250.93) prior to the report period, and at least two visits in the past year, and two DM-related visits ever. Key denominator for this and all diabetes-related topics be-low. Numerator
Ideal control: A1c less than (<) 7.

Chapter 7. Government Performance and Results Act (GPRA) Diabetes: Blood Pressure Control
61
Measure: Proportion of patients with diagnosed diabetes that have achieved blood pres-sure control (<130/80).
Denominator
Active Diabetic patients; defined as all Active Clinical patients diagnosed with diabe-tes (POV 250.00-250.93) prior to the Report Period, and at least two visits in the past year, and two DM-related visits ever. Key denominator for this and all diabetes-related topics be-low. Key denominator for this and all diabetes-related topics below.
Numerator
Controlled BP, < 130/80.

Chapter 7. Government Performance and Results Act (GPRA) Diabetes: Dyslipidemia Assessment
62
Measure: Proportion of patients with diagnosed diabetes assessed for dyslipidemia (LDL cholesterol).
Denominator
Active Diabetic patients; defined as all Active Clinical patients diagnosed with diabe-tes (POV 250.00-250.93) prior to the Report Period, and at least two visits in the past year, and two DM-related visits ever. Key denominator for this and all diabetes-related topics be-low. Key denominator for this and all diabetes-related topics below.
Numerator
Patients with LDL completed during the report period, regardless of result.

Chapter 7. Government Performance and Results Act (GPRA) Diabetes: Nephropathy Assessment
63
Measure: Proportion of patients with diagnosed diabetes assessed for nephropathy.
Denominator
Active Diabetic patients; defined as all Active Clinical patients diagnosed with diabe-tes (POV 250.00-250.93) prior to the report period, and at least two visits in the past year, and two DM-related visits ever. Key denominator for this and all diabetes-related topics be-low. Key denominator for this and all diabetes-related topics below.
Numerator
Patients with nephropathy assessment, defined as an estimated GFR and a quanti-tative urinary protein assessment during the report period or with evidence of diagnosis and/or treatment of ESRD at any time before the end of the report period.
Chapter 7. Government Performance and Results Act (GPRA) Diabetic Retinopathy
64
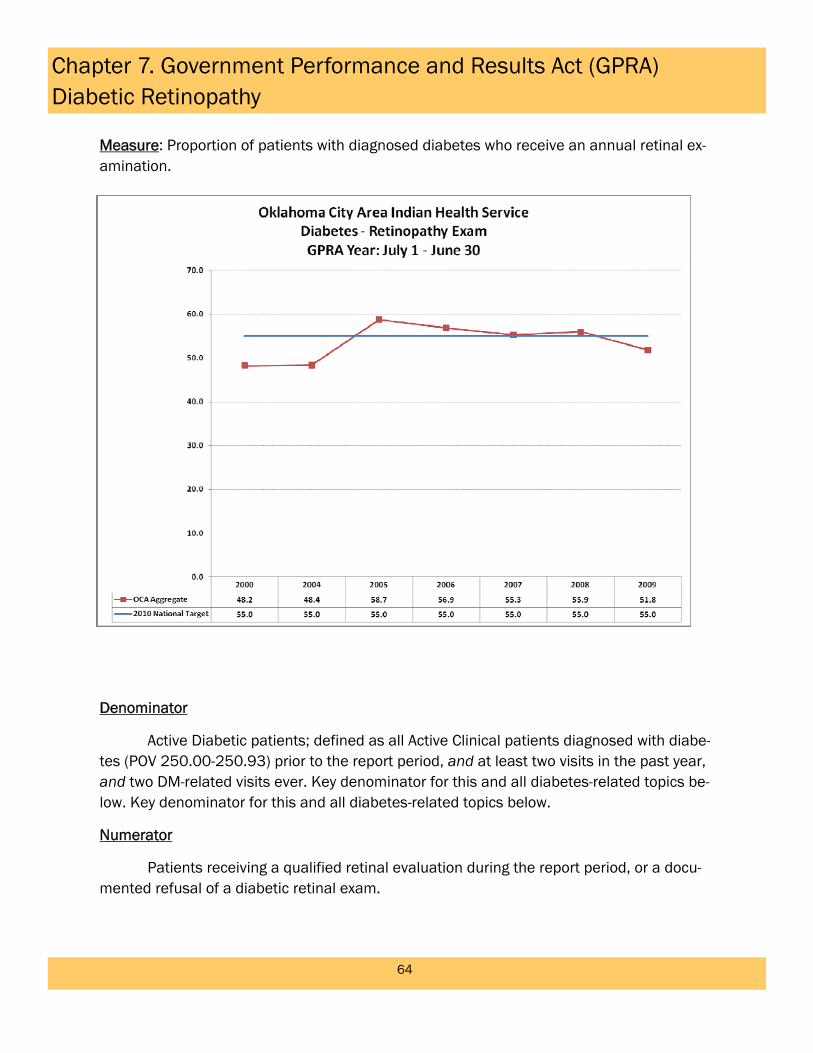
Measure: Proportion of patients with diagnosed diabetes who receive an annual retinal ex-amination.
Denominator
Active Diabetic patients; defined as all Active Clinical patients diagnosed with diabe-tes (POV 250.00-250.93) prior to the report period, and at least two visits in the past year, and two DM-related visits ever. Key denominator for this and all diabetes-related topics be-low. Key denominator for this and all diabetes-related topics below.
Numerator
Patients receiving a qualified retinal evaluation during the report period, or a docu-mented refusal of a diabetic retinal exam.

Chapter 7. Government Performance and Results Act (GPRA) Dental Access
65
Measure: Percent of patients who receive dental services.
Denominator
User Population patients, broken down by age groups: 0–5, 6–11, 12–19, 20–34, 35–44, 45–54, 55–74, 75 and older.
Numerator
Patients with a documented dental visit during the report period, including refusals.
Chapter 7. Government Performance and Results Act (GPRA) Dental Sealants
66
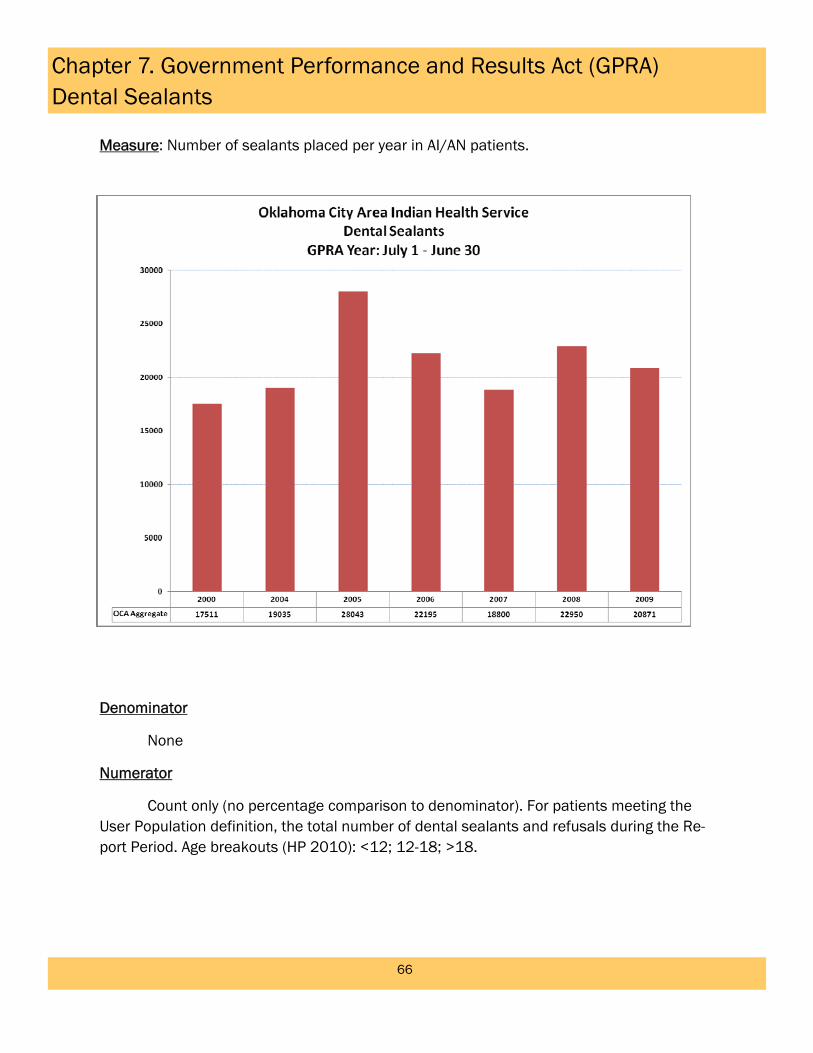
Measure: Number of sealants placed per year in AI/AN patients.
Denominator
None
Numerator
Count only (no percentage comparison to denominator). For patients meeting the User Population definition, the total number of dental sealants and refusals during the Re-port Period. Age breakouts (HP 2010): <12; 12-18; >18.
Chapter 7. Government Performance and Results Act (GPRA) Dental: Topical Fluorides
67
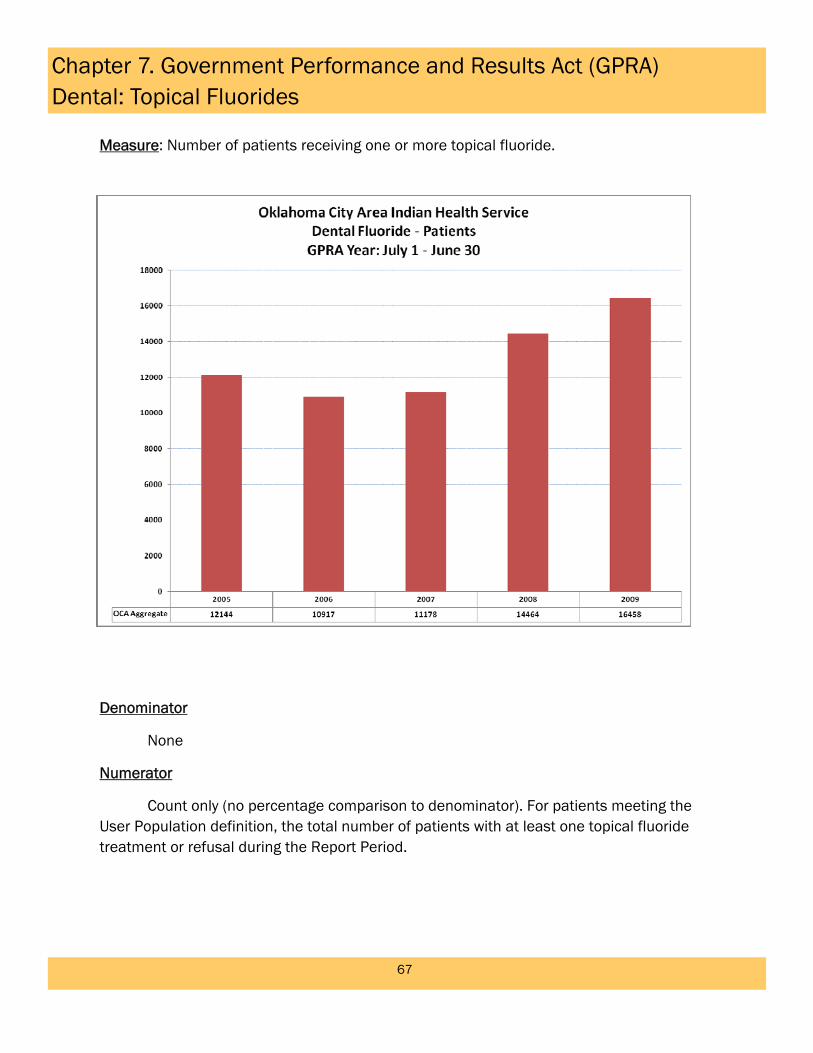
Measure: Number of patients receiving one or more topical fluoride.
Denominator
None
Numerator
Count only (no percentage comparison to denominator). For patients meeting the User Population definition, the total number of patients with at least one topical fluoride treatment or refusal during the Report Period.

Chapter 7. Government Performance and Results Act (GPRA) Adult Immunization: Influenza
68
Measure: Influenza vaccination rates among adult patients age 65 years and older.
Denominator
Ages 65 and older.
Numerator
Patients with influenza vaccine or refusal documented during the report period or with a contraindication documented at any time before the end of the report period.

Chapter 7. Government Performance and Results Act (GPRA) Adult Immunization: Pneumovax
69
Measure: Pneumococcal vaccination rates among adult patients age 65 years and older.
Denominator
Active Clinical patients ages 65 or older.
Numerator
Patients with Pneumococcal vaccine or contraindication documented at any time before the end of the Report Period or with a refusal in the past year.

Chapter 7. Government Performance and Results Act (GPRA) Childhood Immunizations
70
Measure: Combined (4:3:1:3:3) immunization rates for AI/AN patients ages 19-35 months.
Denominator
User Population patients active in the Immunization Package who are 19–35 months at end of report period.
Numerator
Patients who have received the 4:3:1:3:3 combination (i.e., 4 DTaP, 3 Polio, 1 MMR, 3 HiB, 3 Hepatitis B), including refusals, contraindications, and evidence of disease.

Chapter 7. Government Performance and Results Act (GPRA) Cancer Screening: Pap Smear Rates
71
Measure: Proportion of eligible women who have had a Pap screen within the previous three years.
Denominator
Female Active Clinical patients ages 21 through 64 without a documented history of hysterectomy. Patients must be at least 21 years of age at the beginning of the report pe-riod and less than 65 years of age as of the end of the report period.
Numerator
Patients with documented Pap smear in past three years or refusal in past year.

Chapter 7. Government Performance and Results Act (GPRA) Cancer Screening: Mammogram Rates
72
Measure: Proportion of eligible women who have had mammography screening within the previous two years.
Denominator
Female Active Clinical patients ages 52 through 64, without a documented bilateral mastectomy or two separate unilateral mastectomies.
Numerator
Patients with documented mammogram in past two years or refusal in past year.

Chapter 7. Government Performance and Results Act (GPRA) Cancer Screening: Colorectal Rates
73
Measure: Proportion of eligible patients who have had appropriate colorectal cancer screening.
Denominator
Active Clinical patients ages 51-80 without a documented history of colorectal can-cer or total colectomy, broken out by gender.
Numerator
Patients who have had ANY CRC colorectal screening, defined as any of the follow-ing: Fecal Occult Blood Test (FOBT) or Fecal Immunochemical Test (FIT) during the Report Period; flexible sigmoidoscopy or double contrast barium enema in the past five years; colonoscopy in the past 10 years, or a documented refusal in the past year.

Chapter 7. Government Performance and Results Act (GPRA) Tobacco Cessation Intervention
74
Measure: Proportion of tobacco-using patients that receive tobacco cessation intervention.
Denominator
Active Clinical patients identified as current tobacco users prior to the report period, broken down by gender and age groups: <12, 12-17, 18 and older.
Numerator
Patients who have received or refused tobacco cessation counseling or received a prescription for a smoking cessation aid during the report period.
Chapter 7. Government Performance and Results Act (GPRA) Alcohol Screening (FAS Prevention)
75
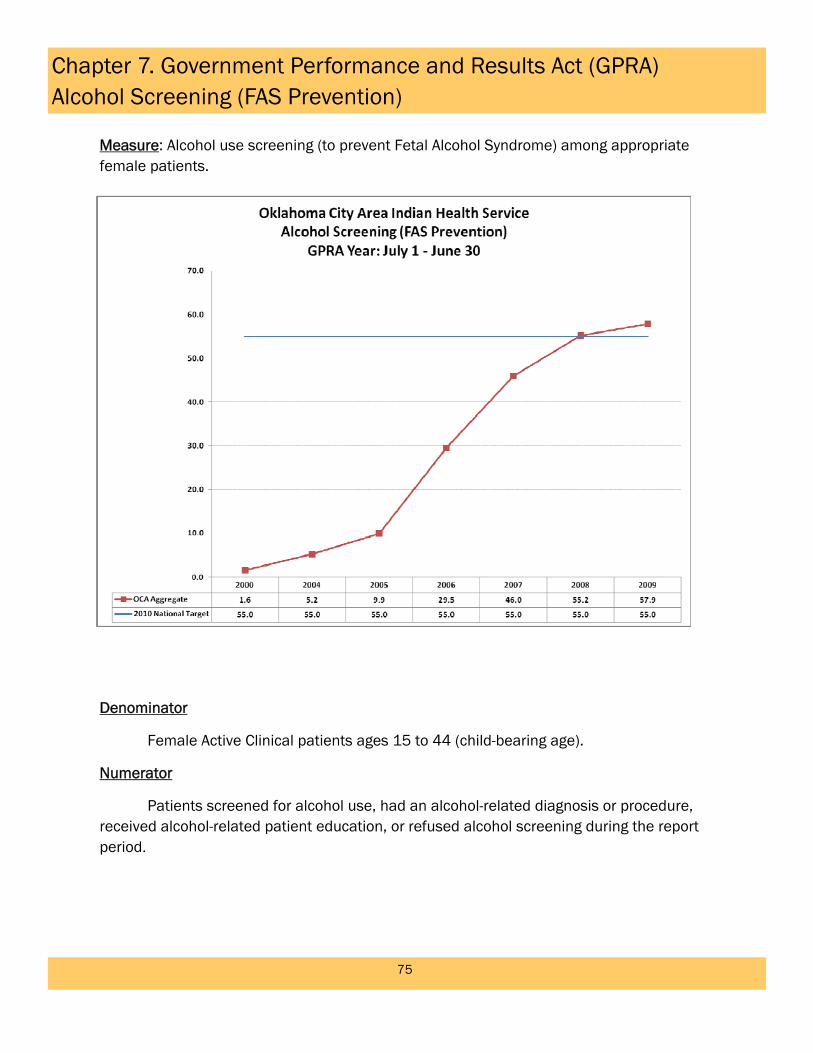
Measure: Alcohol use screening (to prevent Fetal Alcohol Syndrome) among appropriate female patients.
Denominator
Female Active Clinical patients ages 15 to 44 (child-bearing age).
Numerator
Patients screened for alcohol use, had an alcohol-related diagnosis or procedure, received alcohol-related patient education, or refused alcohol screening during the report period.
Chapter 7. Government Performance and Results Act (GPRA) Domestic (Intimate Partner) Violence Screening
76
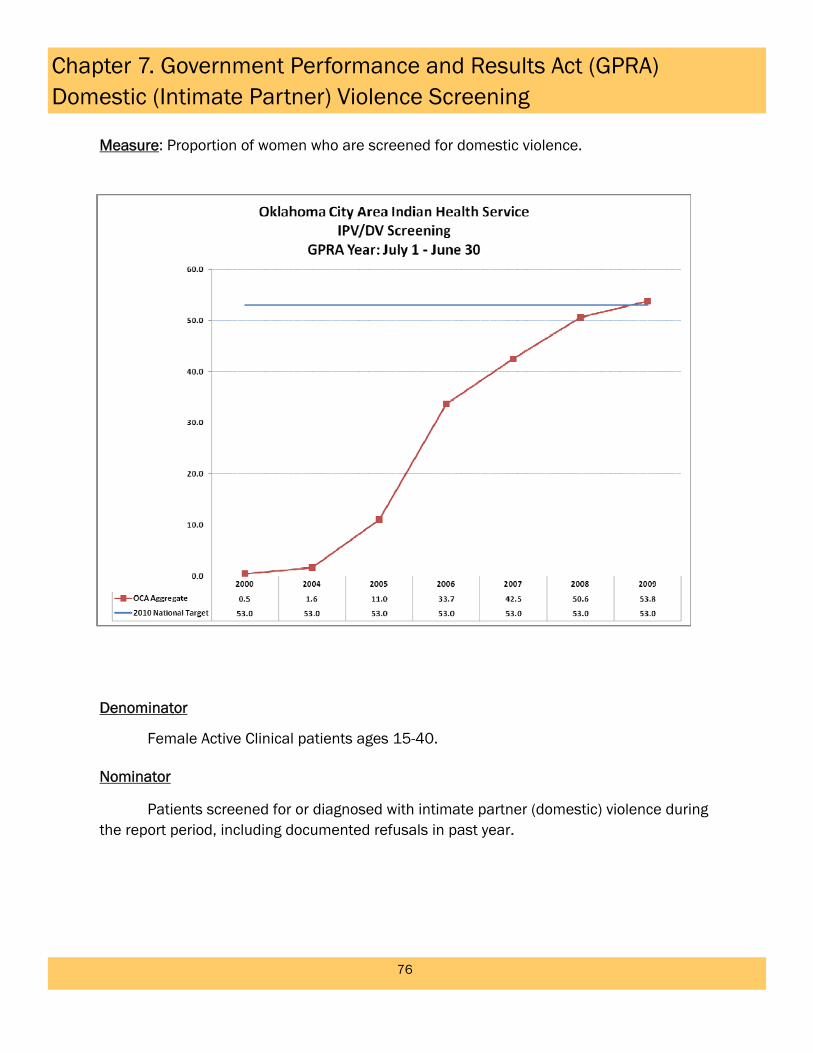
Measure: Proportion of women who are screened for domestic violence.
Denominator
Female Active Clinical patients ages 15-40. Nominator
Patients screened for or diagnosed with intimate partner (domestic) violence during the report period, including documented refusals in past year.
Chapter 7. Government Performance and Results Act (GPRA) Depression Screening
77
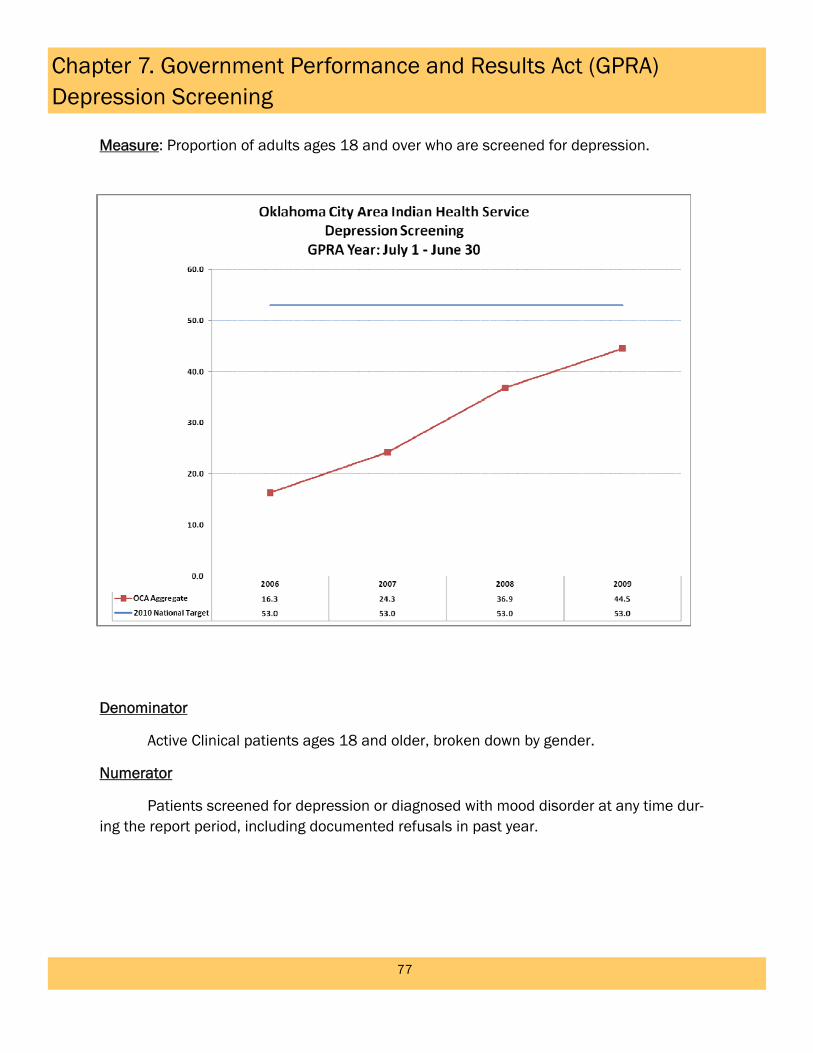
Measure: Proportion of adults ages 18 and over who are screened for depression.
Denominator
Active Clinical patients ages 18 and older, broken down by gender.
Numerator
Patients screened for depression or diagnosed with mood disorder at any time dur-ing the report period, including documented refusals in past year.
Chapter 7. Government Performance and Results Act (GPRA) Comprehensive CVD Assessment
78
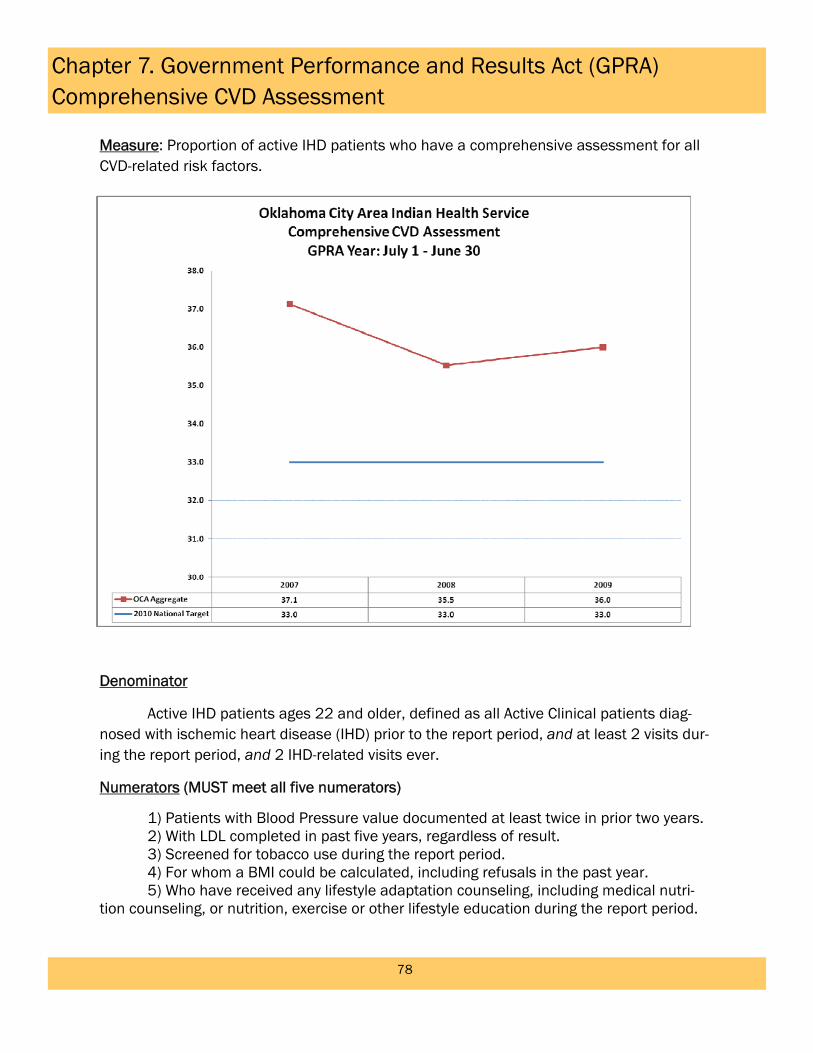
Measure: Proportion of active IHD patients who have a comprehensive assessment for all CVD-related risk factors.
Denominator
Active IHD patients ages 22 and older, defined as all Active Clinical patients diag-nosed with ischemic heart disease (IHD) prior to the report period, and at least 2 visits dur-ing the report period, and 2 IHD-related visits ever.
Numerators (MUST meet all five numerators)
1) Patients with Blood Pressure value documented at least twice in prior two years. 2) With LDL completed in past five years, regardless of result. 3) Screened for tobacco use during the report period. 4) For whom a BMI could be calculated, including refusals in the past year. 5) Who have received any lifestyle adaptation counseling, including medical nutri-tion counseling, or nutrition, exercise or other lifestyle education during the report period.

Chapter 7. Government Performance and Results Act (GPRA) HIV Screening
79
Measure: Proportion of pregnant women screened for HIV.
Denominator
All pregnant Active Clinical patients with no documented miscarriage or abortion during the past 20 months and no recorded HIV diagnosis ever.
Numerator
Patients who were screened for or refused an HIV test during the past 20 months.

80
This page is intentionally left blank

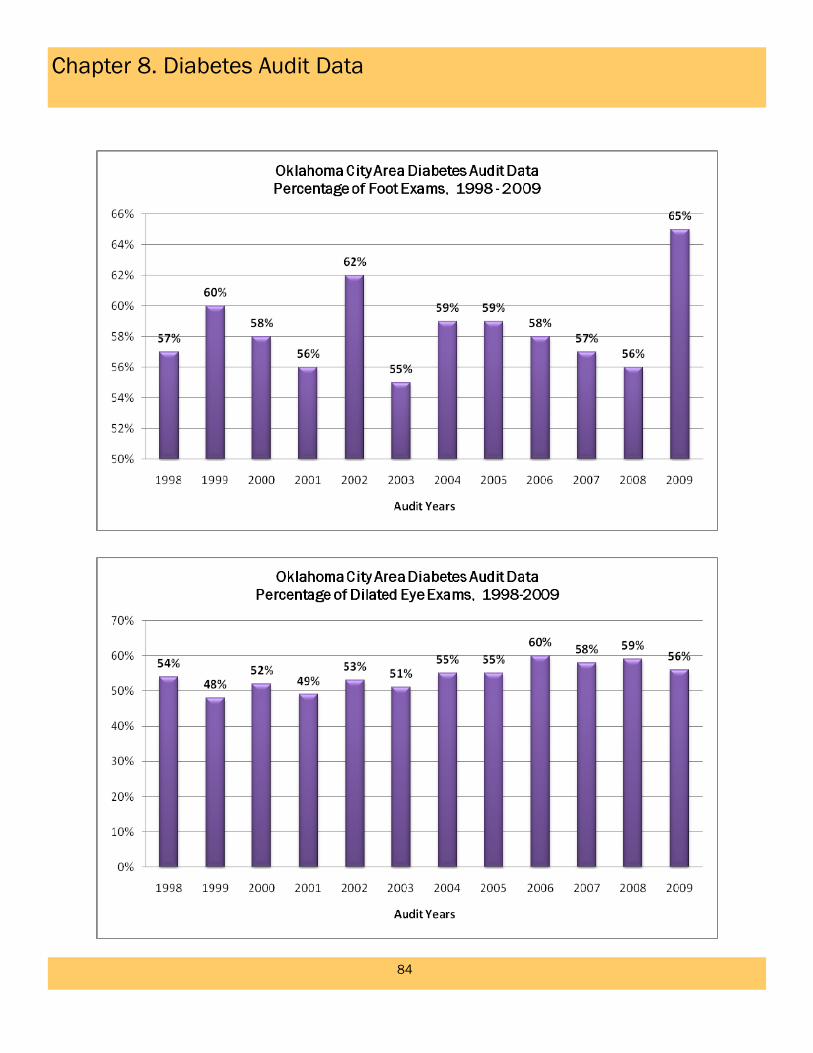
Chapter 8. Diabetes Audit Data
81
Data Table for Above Chart
Audit Years # in registry Sample Size
1998 11,685 1,343 1999 15,820 2,027 2000 18,016 2,429 2001 22,085 4,332 2002 26,996 4,178 2003 27,645 6,941 2004 31,526 7,343 2005 31,123 8,987 2006 33,406 12,471 2007 33,389 13,314 2008 36,749 17,776 2009 36,742 17,817

Diabetes Audit Data
82
Chapter 8. Diabetes Audit Data

Diabetes Audit Data
83
Chapter 8. Diabetes Audit Data
Diabetes Audit Data
84
Chapter 8. Diabetes Audit Data

Diabetes Audit Data
85
Chapter 8. Diabetes Audit Data

Diabetes Audit Data
86
Chapter 8. Diabetes Audit Data
Diabetes Audit Data
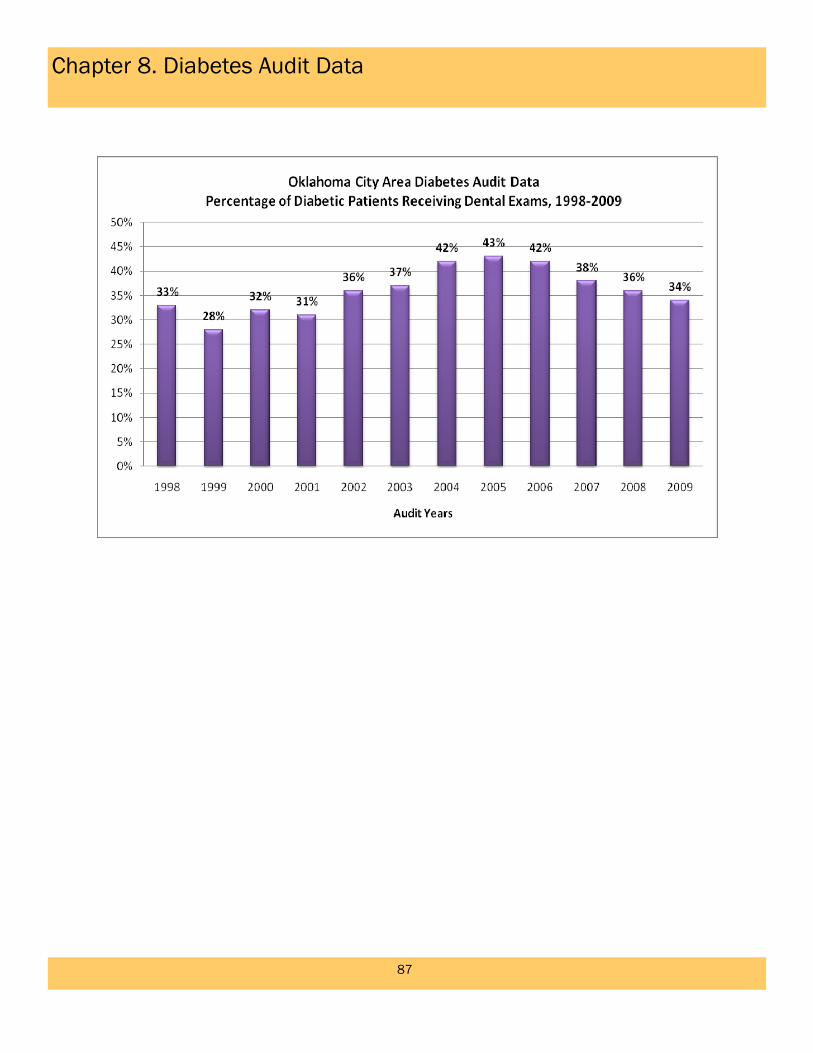
87
Chapter 8. Diabetes Audit Data

88
This page is intentionally left blank

Chapter 9. I/T/U Health Systems Data (National Data Warehouse)
89
The current I/T/U health systems data is a brief summary of aggregate data for the Oklahoma City Area. All I/T/U facilities export encounter and patient registration data to the IHS National Data Warehouse (NDW). The NDW generates the following reports for the Area: Ambulatory Patient Care Workload Report 1A, Inpatient Discharges, Visits by ICD9 Disease Classification for Outpatient visits and Inpatient admissions. The reports include data through FY 2009. You will find summary tables of the Top 10 Diagnoses for Outpatient Visits and Inpatient Visits (Discharge Diagnoses). For the top three disease classes, the top five diagnosis codes for each are broken out and listed for your information.
Top 10 Outpatient Visit Diagnoses By Disease Classification
Disease Classification: For Outpatient Visits between (10/1/2008-9/30/09) Number of 1 ENDOCRINE, NUTRITIONAL, METABOLIC AND IMMUNITY DISORDERS 251,977 1. 250.00 Diabetes Uncomplicated Type II/NIDDM 114,985 2. 250.02Diabetes Uncontrolled, Type II 45,369 3. 272.4 Hyperlipidemia NEC/NOS 22,549 4. 244.9 Hypothyroidism NOS 17,041 5. 278.00 Obesity, Unspecified 3,720 2 DISEASES OF THE CIRCULATORY SYSTEM 209,233 1. 401.9 Hypertension NOS 128,152 2. 401.1 Benign Hypertension 41,620 3. 414.00 Coronary atherosclerosis of unspec. type of vessel native/graft 6,574 4. 427.31 Atrial Fibrillation 6,135 5. 428.0 Congestive Heart Failure 2,714 3 DISEASES OF THE RESPIRATORY SYSTEM 165,976 1. 465.9 Acute Upper Respiratory Infection NOS 26,629 2. 493.90 Asthma Unspecified 23,983 3. 477.9 Allergic Rhinitis 19,596 4. 462.0 Acute Pharyngitis 15,559 5. 461.9 Acute Sinusitis NOS 11,245 4 DISEASES OF THE NERVOUS SYSTEM AND SENSE ORGANS 127,412 5 DISEASES OF MUSCULOSKELETAL SYSTEM & CONNECTIVE TISSUE 126,203 6 MENTAL DISORDERS 125,517 7 DISEASES OF THE DIGESTIVE SYSTEM 64,195 8 INJURY AND POISONING 59,547 9 DISEASES OF THE GENITOURINARY SYSTEM 57,313 10 DISEASES OF THE SKIN AND SUBCUTANEOUS TISSUE 54,843

Chapter 9. I/T/U Health Systems Data (National Data Warehouse)
90
Top 10 Inpatient Discharge Diagnoses By Disease Classification
Top 10 Inpatient Discharge Diagnoses By Disease Classification Disease Class: FY 2008 (10/1/2008-9/30/09) # Discharges
1. DISEASES OF THE DIGESTIVE SYSTEM 1,185 1. 577.0 Acute pancreatitis 157 2. 540.9 Acute appendicitis NOS 118 3. 558.9 Noninfectious gastroenteritis and colitis 75 4. 574.10 Cholelith with cholecystitis NEC 70 5. 574.00 Cholelith with acute cholecystitis 50
2. COMPLICATIONS OF PREGNANCY, CHILDBIRTH, AND PUERPERIUM 1,032 1. 654.21 Previous cesarean section delivery NOS 367 __ 2. 664.01 During delivery;1st-degree perineal lac; delivered, w/or w/o ante cond. 286 3. 650 Normal delivery 166 4. 664.11 During delivery;2nd-degree perineal lac; delivered, w/or w/o ante cond. 151 5. 645.11 Post Term Preg Deliv w/ or w/out antep cond 125
3. DISEASES OF THE RESPIRATORY SYSTEM 940 1. 486 Pneumonia, organism NOS 386 2. 491.21 Obstructive chronic bronchitis with (acute) exacerbation 136 3. 493.02,493.20,493.22,493.90-92 Asthma and asthma related diagnoses 50 4. 466.11,466.19 Acute bronchiolitis due to RSV or other infectious organism 77 5. 518.81 Acute respiratory failure 21
4. DISEASES OF THE GENITOURINARY SYSTEM 641 5. DISEASES OF THE CIRCULATORY SYSTEM 552 6. ENDOCRINE,NUTRITIONAL, METABOLIC AND IMMUNITY DISORDERS 460 7. INJURY AND POISONING 341 8. DISEASES OF THE SKIN AND SUBCUTANEOUS TISSUE 320 9. NEOPLASMS 258
10. DISEASES OF THE BLOOD AND BLOOD-FORMING ORGANS 198
I/T/U Health Systems Data (National Data Warehouse)
91
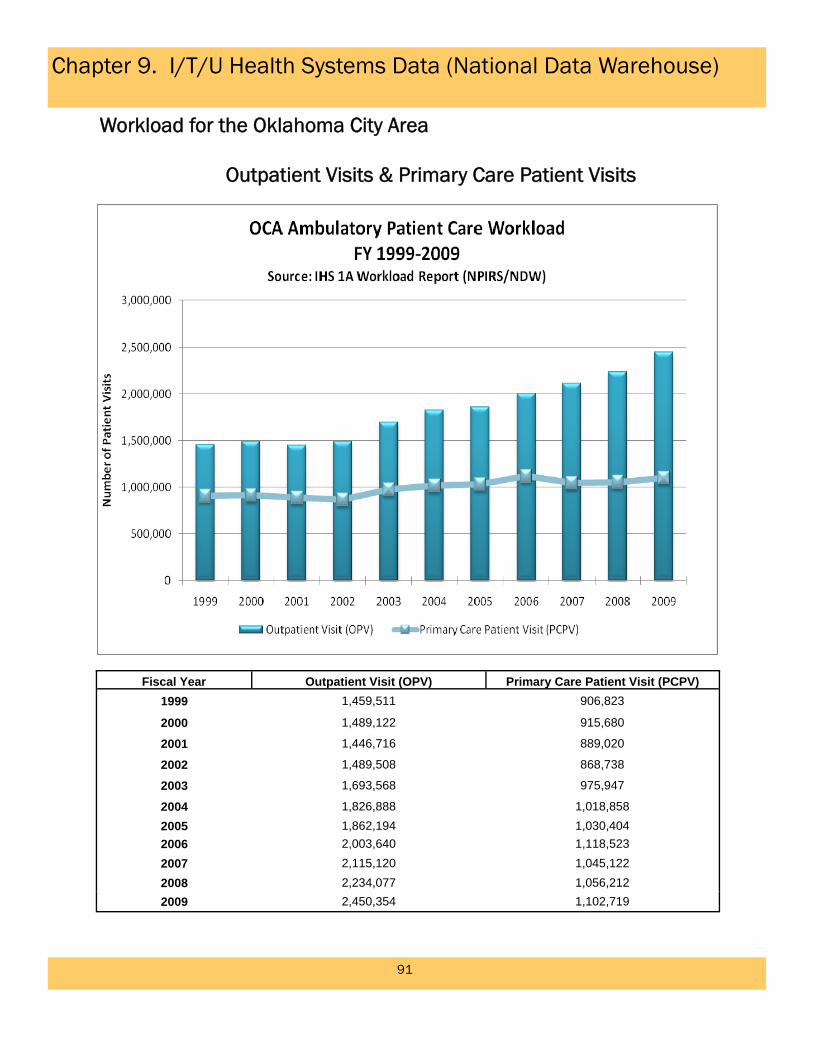
Workload for the Oklahoma City Area
Outpatient Visits & Primary Care Patient Visits
Fiscal Year Outpatient Visit (OPV) Primary Care Patient Visit (PCPV) 1999 1,459,511 906,823
2000 1,489,122 915,680
2001 1,446,716 889,020
2002 1,489,508 868,738
2003 1,693,568 975,947
2004 1,826,888 1,018,858
2005 1,862,194 1,030,404
2006 2,003,640 1,118,523
2007 2,115,120 1,045,122
2008 2,234,077 1,056,212
2009 2,450,354 1,102,719
Chapter 9. I/T/U Health Systems Data (National Data Warehouse)

I/T/U Health Systems Data (National Data Warehouse)
92
Workload for the Oklahoma City Area
OCA Total Dental Visits FY 2006-FY 2009
Chapter 9. I/T/U Health Systems Data (National Data Warehouse)
Source: IHS NDW Dental Workload Report with 38 I/T/U Facilities Reporting Dental Data
I/T/U Health Systems Data (National Data Warehouse)
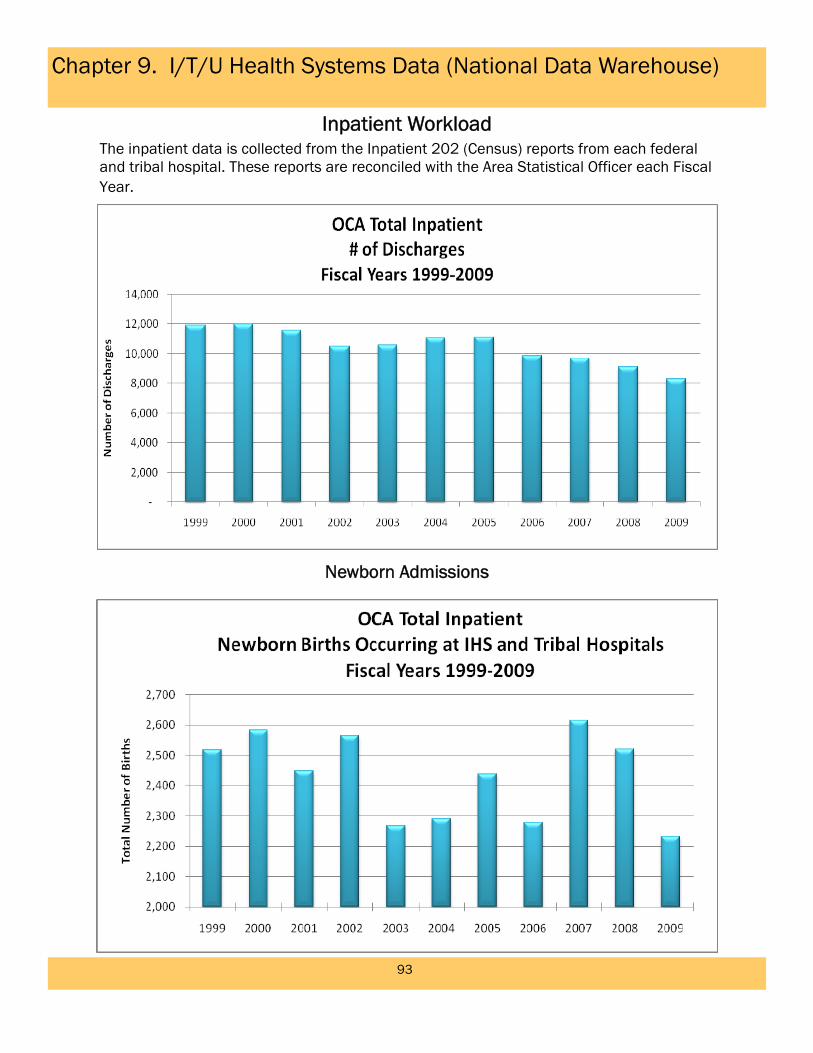
93
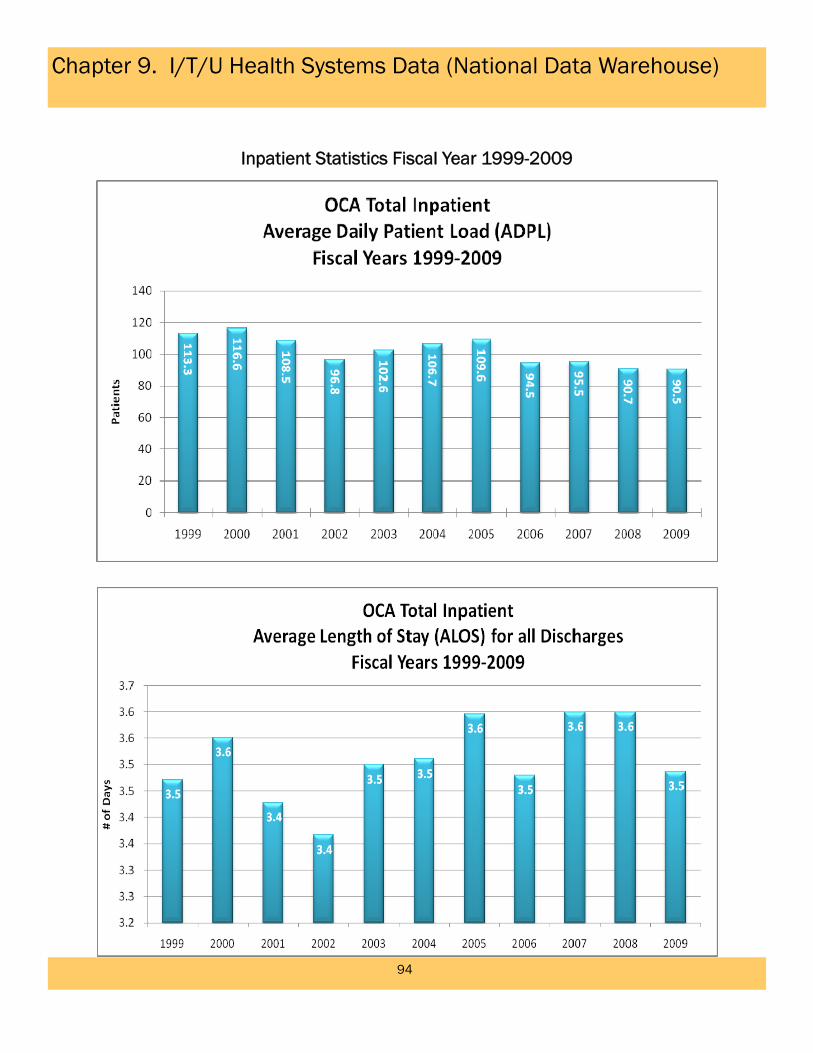
Inpatient Workload The inpatient data is collected from the Inpatient 202 (Census) reports from each federal and tribal hospital. These reports are reconciled with the Area Statistical Officer each Fiscal Year.
Newborn Admissions
Chapter 9. I/T/U Health Systems Data (National Data Warehouse)
I/T/U Health Systems Data (National Data Warehouse)
94
Inpatient Statistics Fiscal Year 1999-2009
Chapter 9. I/T/U Health Systems Data (National Data Warehouse)

Chapter 10. Substance Abuse
95
Total Substance Abuse Treatment Admissions to Oklahoma Department of Mental Health and
Substance Abuse Services (ODMHSAS) Facilities*
In Oklahoma, from Oklahoma State fiscal year (beginning July 1) 2001 through 2008, American Indians have consistently shown higher admission rates in comparison to the white population that of all races combined. Blacks have the highest total admission rates for the ODMHSAS-funded facilities. An increase can be seen for American Indians from 2004 through 2008. A slight upward trend for all races separate and combined is visible between 2005 and 2008.
*The number of persons receiving treatment is a duplicated count. That is, if a person goes into treatment more than
Source: ODMHSAS, Oklahoma Department of Mental Health and Substance Abuse Services. All admissions are from the ODMHSAS funded facilities and do not reflect all treatment facilities. All rates were calculated using 2000 census data.
0
200
400
600
800
1000
1200
1400
2001 2002 2003 2004 2005 2006 2007 2008
Rate of Total Admissions into Oklahoma Department of Mental Health and Substance Abuse Services Facilities, by Race
2001‐2008
All races AI/AN White Black
Rate per 100
,000
pop
ulation

Chapter 10. Substance Abuse
96
Methamphetamine Treatment Admissions to Oklahoma Department of Mental Health and
Substance Abuse Services (ODMHSAS) Facilities*
In Oklahoma, from Oklahoma State fiscal year (beginning July 1) 2001 through 2008, American Indians have consistently shown higher admission rates for methamphetamine treatment in comparison to other populations and that of all races combined. Blacks have the lowest methamphetamine treatment admission rates for the ODMHSAS-funded facili-ties. A decrease can be seen from 2006 through 2008 for American Indians, whites and all races. The black rates appear to level off during these years. A marked upward trend for all races separate and combined is visible between 2001 through 2004.
*The number of persons receiving treatment is a duplicated count. That is, if a person goes into treatment more than once during the year, they would be counted more than once in the numerator.
Source: ODMHSAS, Oklahoma Department of Mental Health and Substance Abuse Services. All admissions are from the ODMHSAS funded facilities and do not reflect all treatment facilities. All rates were calculated using 2000 census data.
0
20
40
60
80
100
120
140
160
180
200
2001 2002 2003 2004 2005 2006 2007 2008
Rate per 100
,000
pop
ulation
Rate of Admissions for Methamphetamine Treatment into Oklahoma Department of Mental Health and Substance Abuse Services Facilities
by Race, 2001‐2008
All Races AIAN White Black
Chapter 10. Substance Abuse
97
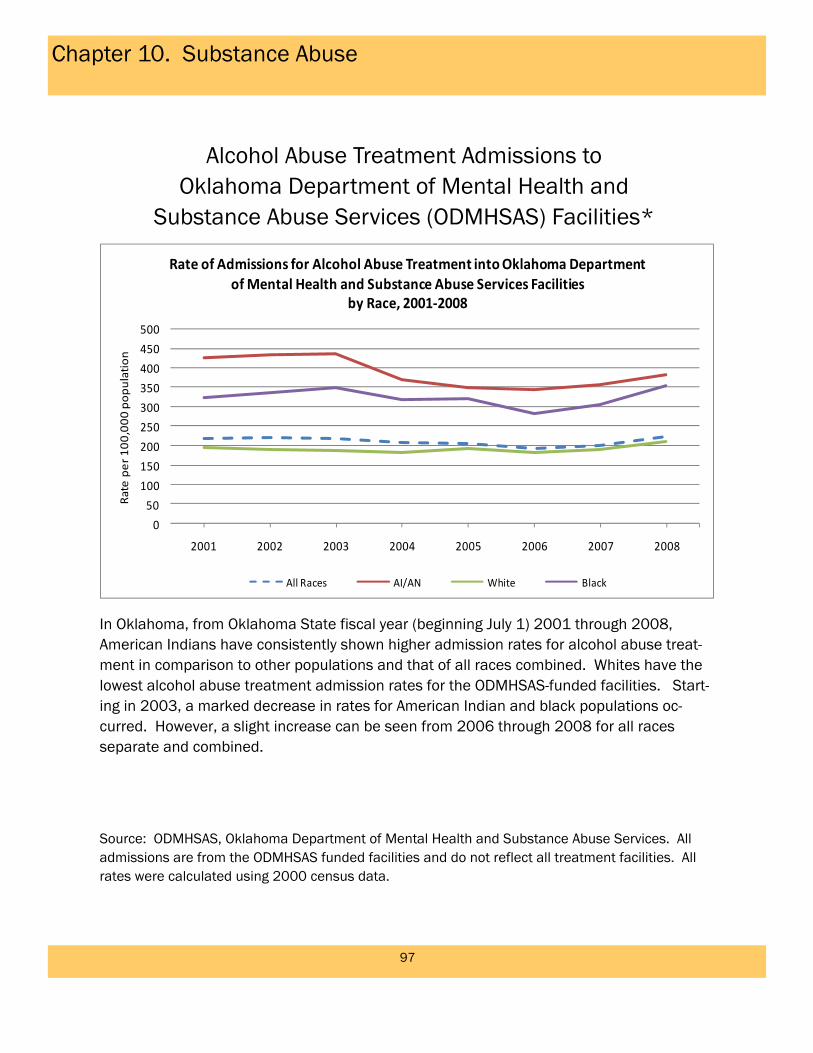
Alcohol Abuse Treatment Admissions to Oklahoma Department of Mental Health and
Substance Abuse Services (ODMHSAS) Facilities*
In Oklahoma, from Oklahoma State fiscal year (beginning July 1) 2001 through 2008, American Indians have consistently shown higher admission rates for alcohol abuse treat-ment in comparison to other populations and that of all races combined. Whites have the lowest alcohol abuse treatment admission rates for the ODMHSAS-funded facilities. Start-ing in 2003, a marked decrease in rates for American Indian and black populations oc-curred. However, a slight increase can be seen from 2006 through 2008 for all races separate and combined.
Source: ODMHSAS, Oklahoma Department of Mental Health and Substance Abuse Services. All admissions are from the ODMHSAS funded facilities and do not reflect all treatment facilities. All rates were calculated using 2000 census data.
0
50
100
150
200
250
300
350
400
450
500
2001 2002 2003 2004 2005 2006 2007 2008
Rate per 10
0,000 population
Rate of Admissions for Alcohol Abuse Treatment into Oklahoma Department of Mental Health and Substance Abuse Services Facilities
by Race, 2001‐2008
All Races AI/AN White Black

Chapter 10. Substance Abuse
98
Marijuana Treatment Admissions to Oklahoma Department of Mental Health and Substance
Abuse Services (ODMHSAS) Facilities*
In Oklahoma, from Oklahoma State fiscal year (beginning July 1) 2001 through 2008, the black population has consistently shown higher admission rates for marijuana treatment in comparison to other populations and that of all races combined. Whites have the lowest marijuana treatment admission rates for the ODMHSAS-funded facilities. A slight upward trend (but marked for the black population) can be seen beginning in 2006.
*The number of persons receiving treatment is a duplicated count. That is, if a person goes into treatment more than once during the year they would be counted more than once in the numerator.
Source: ODMHSAS, Oklahoma Department of Mental Health and Substance Abuse Services. All admissions are from the ODMHSAS funded facilities and do not reflect all treatment facilities. All rates were calculated using 2000 census data.
0
50
100
150
200
250
300
350
400
450
2001 2002 2003 2004 2005 2006 2007 2008
Rate of Admissions for Marijuana Use Treatment into Oklahoma Department of Mental Health and Substance Abuse Services Facilities,
by Race, 2001‐2008
All Races AI/AN White Black
Rate per 100
,000
pop
ulation

Chapter 11. Community Health Representatives (CHR)
99
Overview of CHR History and background
In 1968, the Community Health Representative (CHR) Program was the first tribally contracted program. The CHR Mission is to provide the highest level of preventive health care through advocacy and education by addressing the physical, mental, social and spiri-tual health. CHRs are trained paraprofessionals who partner with other members of the pa-tient’s health care team to assure that comprehensive, culturally acceptable personal and public health services are available and accessible to AI/AN people. Oklahoma Area cur-rently has 37 Tribally Operated Programs (1 Urban CHR ) with approximately 195 CHRs.
The CHR Patient Care Component (PCC) is available to all tribal CHR programs. CHR PCC allows Tribal programs to track program and staff performance and progress. In addi-tion, CHR PCC is the only means Headquarters CHR Program staff has to document CHR program worth on a national level. The CHR PCC data is also utilized for congressional in-quiries and budget justifications and requests for the program. Out of the 37 Tribally Oper-ated programs there were 11 programs entering data in 2008 and 8 programs in 2009.
Only 1/3 of the OCA’s Tribal CHR programs are reporting data.
Source: IHS National Data Warehouse, IHPES Portal
Fiscal Year 2009 CHR Program Records by Area

Chapter 11. Community Health Representatives (CHR)
100
Services Provided
CHRs are literally the eyes and ears for clinical staff in the patient’s homes. CHRs can provide valuable insight to medical staff on patient compliance issues and observa-tions on hazardous living environments through CHR PCC documentation. Not only does CHR PCC provide the clinical staff with supplementary patient insight, but it provides pa-tient care values and data to help manage the patient’s wellness. CHR PCC Coding, Data Entry and Reports Trainings are provided in Oklahoma on an annual basis at minimum.
For more information about CHR PCC please contact CDR Dione Harjo at (405) 951-3847 or (405) 990-8439 or by email at [email protected].
Source: IHS National Data Warehouse, IHPES Portal

Chapter 11. Community Health Representatives (CHR)
101
CHR Reporting
Top 10 Health Problem Codes
Source: IHS National Data Warehouse, IHPES Portal

Chapter 11. Community Health Representatives (CHR)
102
CHR Reporting
Location of Encounters
Source: IHS National Data Warehouse, IHPES Portal

Chapter 12. Tuberculosis
103
Incidence of Tuberculosis in Oklahoma by Race
In Oklahoma, for the combined period of 2003 through 2007, the incidence rate for Ameri-can Indians diagnosed with Tuberculosis was 11.3 per 100,000 persons. This rate is 2.5 times—or 60% higher – than the all races rate (4.5 per 100,000) and 3.6 times—or 73%-higher than the white rate (3.1 per 100,000). The American Indian rate is 1.2 times higher—or 17% - higher than the black rate (9.4 per 100,000). These rates are not age-adjusted and could be biased due to the age differences that may be present in each popu-lation.
Source: OSDH Tuberculosis Division, rates calculated by IHS-OCAO. All rates were calculated using 2000 census data, single race only. Because this data is not linked to the IHS patient registration database, it is possible that racial misclassification of American Indian cases has occurred and that the American Indian rates may be higher than reported here.
11.3
4.5
3.1
9.4
0.0
2.0
4.0
6.0
8.0
10.0
12.0
American Indian All Races White Black
Rate per 100
,000
pop
ulation
Oklahoma Tuberculosis Incidence Rates By Race, 2003‐2007

Chapter 12. Tuberculosis
104
Mortality Rates for Tuberculosis in Oklahoma by Race
In Oklahoma, for 1999 through 2003, the age-adjusted mortality rate for American Indians diagnosed with Tuberculosis was 1.6 per 100,000 persons. This rate is 4 times—or 75% higher– than the all races rate (0.4 per 100,000) and over 5 times—or 81%-higher than the white rate (0.3 per 100,000). The American Indian rate is 2.6 times—or 63%- higher than the black rate (0.6 per 100,000).
1.6
0.40.3
0.6
0
0.2
0.4
0.6
0.8
1
1.2
1.4
1.6
1.8
American Indian All Races White Black
Rate per 100
,000
pop
ulation
Age‐Adjusted Mortality Rates for Tuberculosis in Oklahomaby Race, 1999‐2003
Source: OK2SHARE, Oklahoma State Department of Health. All mortality data is linked to the Indian Health Service Registry database to adjust for racial misclassification.