OECD Regional Outlook 2021ADDRESSING COVID‑19 AND MOVING TO NET ZERO GREENHOUSE GAS EMISSIONS
OE
CD
Reg
ion
al Ou
tloo
k 2021 AD
DR
ES
SIN
G C
OV
ID‑19 A
ND
MO
VIN
G T
O N
ET
ZE
RO
GR
EE
NH
OU
SE
GA
S E
MIS
SIO
NS

OECD Regional Outlook2021
ADDRESSING COVID‑19 AND MOVING TO NET ZERO GREENHOUSE GAS EMISSIONS

This document, as well as any data and map included herein, are without prejudice to the status of or sovereignty overany territory, to the delimitation of international frontiers and boundaries and to the name of any territory, city or area.
The statistical data for Israel are supplied by and under the responsibility of the relevant Israeli authorities. The use ofsuch data by the OECD is without prejudice to the status of the Golan Heights, East Jerusalem and Israeli settlements inthe West Bank under the terms of international law.
Note by TurkeyThe information in this document with reference to “Cyprus” relates to the southern part of the Island. There is no singleauthority representing both Turkish and Greek Cypriot people on the Island. Turkey recognises the Turkish Republic ofNorthern Cyprus (TRNC). Until a lasting and equitable solution is found within the context of the United Nations, Turkeyshall preserve its position concerning the “Cyprus issue”.
Note by all the European Union Member States of the OECD and the European UnionThe Republic of Cyprus is recognised by all members of the United Nations with the exception of Turkey. Theinformation in this document relates to the area under the effective control of the Government of the Republic of Cyprus.
Please cite this publication as:OECD (2021), OECD Regional Outlook 2021: Addressing COVID-19 and Moving to Net Zero Greenhouse Gas Emissions, OECD Publishing, Paris, https://doi.org/10.1787/17017efe-en.
ISBN 978-92-64-81956-6 (print)ISBN 978-92-64-98835-4 (pdf)
Photo credits: Cover Illustration © Jeffrey Fisher.
Corrigenda to publications may be found on line at: www.oecd.org/about/publishing/corrigenda.htm.
© OECD 2021
The use of this work, whether digital or print, is governed by the Terms and Conditions to be found at http://www.oecd.org/termsandconditions.

3
OECD REGIONAL OUTLOOK 2021 © OECD 2021
Foreword
The fifth edition of the OECD Regional Outlook: Addressing COVID-19 and moving to net zero greenhouse
gas emissions comes at a critical juncture. The COVID 19 crisis has laid bare a number of weaknesses in
our economic and social systems and, in doing so, starkly revealed the interconnectivity between the
environment, economies and people. Many of these weaknesses were apparent before COVID-19 but less
so the costs of inaction to address them and, in turn, their unprecedented consequences.
We have learnt how quickly a crisis in one domain can spread to another: what started as and remains a
health crisis very quickly became an unmatched economic crisis. We have learnt of the paramount
importance of early, decisive action to tackle risks and build resilience. We have learnt that environmental
degradation is an important enabler of zoonotic risks and, as such, a threat to resilience. We have a much
better understanding, today, of the importance of resilience in efforts to build back better and, as this edition
of the OECD Regional Outlook shows, of how important it is to take into account the spatial dimension in
the recovery process.
The health and economic crisis triggered by COVID-19 stands out not only as the most significant in a
century but for the territorial diversity of its impacts and responses. The climate challenge is just as global
and territorially diverse. Greenhouse gas emissions and their sources vary enormously across regions and
the impacts of tackling climate change will also be vastly different across territories. Specific place-based
policies will be vital in mitigating the effects of those impacts on the most vulnerable regions.
However, while most OECD countries have set net-zero greenhouse gas emission targets for 2050, the
regional dimension is too often ignored. As this edition of the OECD Regional Outlook shows, this is a
mistake. Recognising the place-based dimension from the outset of the design and implementation of
mitigation policies will allow those targets to be reached more effectively. Indeed, well-chosen policies to
adapt to inevitable climate change can have important well-being benefits, which are often local. Integrating
subnational and regional government action into a multilevel governance framework is therefore a key part
of building back better.
Since its creation in 1999, the OECD Regional Development Policy Committee has consistently argued for
place-based policies, which can effectively address the diversity of economic, social, demographic,
institutional and geographic conditions across regions. They also ensure that a wide range of sectoral
policies, from transport and education to innovation and health, are co-ordinated with each other. This
OECD Regional Outlook aims to serve as a guide to help policymakers at all levels of government build
back better.
4
OECD REGIONAL OUTLOOK 2021 © OECD 2021
Acknowledgements
This publication was produced in the OECD Centre for Entrepreneurship, SMEs, Regions and Cities (CFE),
led by Lamia Kamal-Chaoui, Director, as part of the programme of work of the Regional Development
Policy Committee (RDPC). The report was co-ordinated and co-authored by Andrés Fuentes Hutfilter
under the supervision of Rüdiger Ahrend, Head of the Economic Analysis, Statistics and Data Division of
CFE with contributions from: Jolien Noels and Alison Weingarden (Chapter 1); Antoine Kornprobst and
Jolien Noels (Chapter 2); Monica Crippa (Joint Research Centre of the European Commission), Diego
Guizzardi (Joint Research Centre of the European Commission), Sandra Hannig, Jolien Noels,
Matteo Schleicher and Dorji Yangka (Chapter 3); Kate Brooks, Jonathan Crook, Ander Eizaguirre,
Sandra Hannig, Oscar Huerta Melchor, Soo-Jin Kim, Lukas Kleine-Rueschkamp, Lucas Leblanc,
Tadashi Matsumoto, Jolien Noels, Atsuhito Oshima, Louise Phong, Lisanne Raderschall, Oriana Romano,
Sena Segbedzi and Dorji Yangka (Chapter 4). Éric Gonnard, Claire Hoffmann and Marcos Díaz Ramirez
provided essential statistical inputs for the report. Aziza Akhmouch, Dorothee Allain-Dupré, Jonathan Barr,
Isabelle Chatry and Varinia Michalun supervised contributing staff. Alexander Lembcke and Paolo Veneri
provided resources and advice. The report was copy-edited by Eleonore Morena and prepared for
publication by Pilar Philip. Nikolina Jonsson and Jeanette Duboys provided invaluable technical and editing
support. The country profiles that are published as an online appendix to this report were drafted by Jolien
Noels under the supervision of Andrés Fuentes Hutfilter.
The OECD Secretariat thanks the delegates to the RDPC and its Working Parties on Rural Policy, Urban
Policy and Territorial Indicators for comments on earlier versions of this report. The report was approved
by the RDPC through written procedure on 22 April 2021 (CFE/RDPC(2021)1).
5
OECD REGIONAL OUTLOOK 2021 © OECD 2021
Table of contents
Foreword 3
Acknowledgements 4
Executive summary 10
Part I The resilience of rural and urban regions in the COVID-19 crisis 13
1 The COVID-19 crisis in urban and rural areas 14
COVID-19 has hit regions across the world but timing and impacts have differed 15
The economic crisis is profound and geographically diverse 22
Employment at risk varies strongly with the sectoral specialisation of regions 25
Recovery may be marked by structural change and increased poverty risk 31
References 34
2 Policy responses to the COVID-19 crisis 37
Policy responses need to include cities and rural regions 38
Managing the crisis across levels of government 41
Lessons learned from the COVID crisis for regional, urban and rural policies 59
References 61
Notes 63
Part II The resilience of rural and urban regions in the transition to net-zero greenhouse gas emissions 65
3 Reaching net-zero greenhouse gas emissions: The role for regions and cities 66
The case for regional action 67
Where do regions stand: Indicators of progress, well-being impacts and vulnerabilities 82
Summing up: Policy conclusions from Chapter 3 125
Annex 3.A. Annex charts 127
References 130
Notes 139
4 Selected policy avenues 141
Integrating subnational governments in climate policy governance and financing 142
Urban policies are central to climate change mitigation and regional development 159
Improving the resilience of rural regions in the net-zero-emission transition 177
Leaving no region behind 196

6
OECD REGIONAL OUTLOOK 2021 © OECD 2021
Summing up: Policy conclusions from Chapter 4 204
References 206
Notes 221
FIGURES
Figure 1.1. Within-country differences in COVID-19 mortality 16 Figure 1.2. COVID-19 mortality per 100 000 inhabitants, daily average 18 Figure 1.3. New York City COVID-19 cases by zip code 19 Figure 1.4. United Kingdom COVID-19 cases by lower-tier local authority area 20 Figure 1.5. Direct contribution of tourism in OECD economies 24 Figure 1.6. Share of jobs potentially at risk from COVID-19 containment measures 26 Figure 1.7. Regions with the highest share of jobs at risk by country, TL2 regions 26 Figure 1.8. Employment changes relative to January 2020 27 Figure 1.9. Temporary employment patterns are not uniform within countries 28 Figure 1.10. Business income has remained low in New York and fell more recently in North Dakota 29 Figure 1.11. The possibility to work remotely differs among and within countries 31 Figure 2.1. European countries increased testing in the course of the crisis 42 Figure 2.2. Policy tools at the core of a successful exit strategy 44 Figure 2.3. Co-ordination mechanisms effectiveness during the first phase of the crisis 45 Figure 2.4. Impact of the COVID-19 crisis on subnational finances in the European Union 46 Figure 2.5. Subnational governments’ budget and investment, 2007-19 47 Figure 2.6. Breakdown of subnational government expenditure by function (COFOG), 2017 47 Figure 2.7. COVID-19 pressure on subnational expenditures, by service area 48 Figure 2.8. Sources of subnational government revenues vary across countries 50 Figure 2.9. Impact on subnational revenue, by revenue source 51 Figure 2.10. New borrowing to cope with the COVID-19 crisis 52 Figure 2.11. Emergency fiscal measures to support subnational governments 53 Figure 2.12. Transit mobility decreases more with COVID-19 containment measures where citizen trust is high 58 Figure 3.1. Climate change is a threat to the foundations of human well-being 68 Figure 3.2. World CO2 emissions have decoupled from GDP only in relative terms, and not from energy
consumption 71 Figure 3.3. OECD CO2 emissions may have decoupled from GDP and energy consumption in absolute terms 71 Figure 3.4. Energy investment with current or stated policies differs sharply from investment needed to meet
the Paris Climate Agreement 75 Figure 3.5. Hazards and their impacts from 1980 to 2016 77 Figure 3.6. The three integrated infrastructures of climate change adaptation (CCA) 79 Figure 3.7. Metropolitan regions emit the most greenhouse gas emissions 83 Figure 3.8. Greenhouse gas emissions per capita are highest in remote regions 83 Figure 3.9. In most countries, rural regions have the highest emissions per capita 86 Figure 3.10. Within-country variation is larger than between countries 86 Figure 3.11. Agricultural emissions per capita are particularly high in New Zealand 87 Figure 3.12. Industrial emissions per capita are high in Australia, Norway and North America 87 Figure 3.13. Energy emissions per capita are high in some Dutch, Finnish, Greek and US regions 88 Figure 3.14. In most of the highest-emitting regions, energy supply, transport and industry-related emissions
dominate 88 Figure 3.15. Some OECD regions emit little CO2, mostly in middle-income regions of South America 89 Figure 3.16. Rural regions are less carbon-intensive in electricity production 90 Figure 3.17. Regional disparities in CO2 emissions of electricity generation can be large 90 Figure 3.18. To be aligned with the goals of the Paris Agreement, coal-fired electricity should be largely
eliminated by 2030 91 Figure 3.19. Most OECD countries still have at least one region with over 50% coal-fired electricity 92 Figure 3.20. Coal usage for electricity generation tends to be regionally concentrated 93 Figure 3.21. The 10 largest regional users of coal for electricity generation, generate over a fourth of coal-fired
electricity in OECD countries 94 Figure 3.22. GDP per capita is much lower than the national average in some regions with intensive coal use 95 Figure 3.23. Fewer OECD regions are adding new coal-fired electricity capacity 96
7
OECD REGIONAL OUTLOOK 2021 © OECD 2021
Figure 3.24. Most OECD regions, especially in the Americas, are no longer adding new coal-fired electricity
capacity 97 Figure 3.25. Share of solar in the energy mix, according to the Sustainable Development Scenario 98 Figure 3.26. Share of wind in the energy mix, according to the Sustainable Development Scenario 99 Figure 3.27. Remote regions, relative to their population, are larger producers of electricity 100 Figure 3.28. Rural regions contribute more to wind-powered electricity than large metro regions 100 Figure 3.29. Norway’s capital region is miles ahead of any other OECD region 102 Figure 3.30. Most population in OECD and BRIICS countries is exposed to air pollution above the WHO-
recommended threshold 105 Figure 3.31. In most OECD countries, all large regions have at least 25% of the population exposed to
pollution above the WHO-recommended threshold 105 Figure 3.32. Few countries have regions with over 5% of employment in sectors at risk of employment losses
due to the net-zero carbon transition 109 Figure 3.33. Life satisfaction of regions with the highest share of employment in sectors at risk is not
necessarily lower than the national average 110 Figure 3.34. Employment in coal, oil and gas extraction and refining sectors is at most about 1% of national
employment 112 Figure 3.35. Regional coal mining employment exceeds 1% only in Northwest Czech Republic, Silesia, South-
West Oltenia, West Virginia and Wyoming 112 Figure 3.36. Countries with more coal mining employment have no or later coal phase-out dates in electricity
generation 113 Figure 3.37. Regions with the highest shares of the population employed in coal mining tend to have a lower
per capita GDP compared to the national average 113 Figure 3.38. Some regions with over 2% employment in agriculture have lower GDP per capita than the
national average 114 Figure 3.39. Poverty is often higher in regions with over 2% of employment in agriculture in Australia and
Finland but not in Greece 114 Figure 3.40. In New Zealand in particular, regions with higher agricultural emissions per capita do tend to be
poorer regions 115 Figure 3.41. Rural regions are more car-dependent 116 Figure 3.42. Where within-country comparison is possible, regional differences in public transport performance
are clearly large 117 Figure 3.43. Cities with a lower GDP per capita tend to have worse public transport performance 118 Figure 3.44. Public transport performs poorly compared to cars 119 Figure 3.45. Spanish regions have the highest tonnage of road freight loading 120 Figure 3.46. Most road freight goods are loaded in intermediate to urban areas 120 Figure 3.47. Cost of multi-hazard damages across Europe to 2080 assuming no further climate change
mitigation action 121 Figure 3.48. Heatwaves across Australia relative to recent past 122 Figure 3.49. Projected mix of adaptation approaches under sea level rise in Pinellas County, Florida, US 123 Figure 3.50. Climate-change-induced road maintenance costs vary strongly across Mexican regions 124 Figure 4.1. Reductions in greenhouse gas emissions in selected major economies 145 Figure 4.2. The 12 Principles on Effective Public Investment Across Levels of Government 146 Figure 4.3. Metropolitan regions contribute the most to greenhouse gas emissions in North America and
OECD Asia 160 Figure 4.4. Per capita emissions in metropolitan regions are particularly large in Australia, North America and
OECD Asia 160 Figure 4.5. Key objectives identified by national governments to mainstream climate action in their NUPs 164 Figure 4.6. Simulated public transport network length in 37 metropolitan areas, 2015 168 Figure 4.7. Fair street space allocation provides more space for biking, walking and public transport while
significantly reducing the space for parking 171 Figure 4.8. Drivers of the circular economy in surveyed cities and regions 172 Figure 4.9. Agricultural emissions per capita for each TL2 region, sorted by national average, 2016 181 Figure 4.10. Sources of electricity production, 2017 188 Figure 4.11. Average number of private vehicles per 1 000 inhabitants, by type of region 193 Figure 4.12. Average number of private vehicles per 1 000 inhabitants, by type of region in each country 194 Figure 4.13. Difference between future and current life satisfaction 197
Annex Figure 3.A.1. Regional emissions per capita and GDP per capita are positively correlated 127
8
OECD REGIONAL OUTLOOK 2021 © OECD 2021
Annex Figure 3.A.2. In some top-emitting regions, GDP per capita is very high with little difference in life
satisfaction 128 Annex Figure 3.A.3. Difference between regional life satisfaction and national average for regions with largest
coal-fired electricity production 129 Annex Figure 3.A.4. Difference between regional GDP per capita and the national average for TL2 regions
with highest shares of employment in sectors with employment at risks 129
TABLES
Table 3.1. Employment changes from worldwide emission reductions consistent with the Paris Agreement, by
sector 107 Table 4.1. Electric vehicle goals announced by selected major cities 171 Table 4.2. Policy instruments to address climate change and ecosystem degradation in the agriculture and
forestry sectors and considerations for rural development 180
BOXES
Box 1.1. Estimates of economic impacts in cities 22 Box 1.2. Economic impacts in rural regions 23 Box 1.3. Cultural and creative sectors risk long-lasting decline, impacting creativity and well-being 30 Box 2.1. Local action contributes to successful early testing and tracing strategies 42 Box 2.2. Examples of vertical and horizontal co-ordination for crisis management 43 Box 2.3. The impact on subnational finance is asymmetric 45 Box 2.4. Pressure on subnational government spending is strong, especially for social services 48 Box 2.5. Revenue impacts will vary with revenue structure 50 Box 2.6. Providing fiscal relief to subnational governments 54 Box 2.7. The European Union Recovery Plan 55 Box 3.1. Lessons from the COVID-19 crisis in a regional, urban and rural context 69 Box 3.2. The key competencies of subnational governments in climate policy 73 Box 3.3. Examples of quantified adaptation benefits 78 Box 3.4. Benefits of Green Infrastructure (GI) 78 Box 3.5. Knowledge infrastructure 80 Box 3.6. Examples of cascading events 81 Box 3.7. Regional greenhouse gas emission data 84 Box 3.8. Key local well-being benefits from a zero-emission transition 103 Box 3.9. The impact of the net-zero carbon transition on regional employment: Methodological approach 106 Box 3.10. Defining public transport performance 117 Box 4.1. Integration of scientific advisory bodies 144 Box 4.2. OECD Principles on Effective Public Investment Across Levels of Government 146 Box 4.3. Making the most of multi-level governance tools to reach net-zero emissions by 2050 147 Box 4.4. The Climate Lens in Canada 149 Box 4.5. How to best use conditionalities? 149 Box 4.6. Multilateral, European and national/state climate funds 150 Box 4.7. Regional and local climate funds targeted at firms and households 156 Box 4.8. Green public procurement in Cities 157 Box 4.9. Consumption-based greenhouse gas emissions in cities 161 Box 4.10. Governance lessons from several metropolitan areas across the OECD 162 Box 4.11. Regulating smart mobility and the role of data 169 Box 4.12. The key role of cities and regions in low-carbon transition in buildings 174 Box 4.13. Key recommendations on urban resilience and disaster risk management 177 Box 4.14. Ecosystem service payments to integrate GHG reduction in rural regional development 184 Box 4.15. Key factors for successfully linking renewable energy to rural development 188 Box 4.16. Economic opportunities tend to be weaker in rural regions 196 Box 4.17. Stakeholder engagement for smart specialisation in Pomorskie, Poland 199 Box 4.18. How higher education institutions play a role in industrial transition 200 Box 4.19. Industry and skills mapping by the Public Employment Service in Wallonia 201 Box 4.20. Employment services in Flanders, Belgium, gear programmes to green transitions 202

9
OECD REGIONAL OUTLOOK 2021 © OECD 2021
Look for the StatLinks2at the bottom of the tables or graphs in this book.To download the matching Excel® spreadsheet, just type the link into your Internetbrowser, starting with the https://doi.org prefix, or click on the link from the e-bookedition.
This book has...A service that delivers Excel® files fromthe printedpage!
Follow OECD Publications on:
http://twitter.com/OECD_Pubs
http://www.facebook.com/OECDPublications
http://www.linkedin.com/groups/OECD-Publications-4645871
http://www.youtube.com/oecdilibrary
http://www.oecd.org/oecddirect/Alerts
10
OECD REGIONAL OUTLOOK 2021 © OECD 2021
Executive summary
Place-based policies are essential to building an inclusive, resilient and
sustainable recovery from the COVID-19 crisis
The COVID-19 pandemic has had a profound impact on the health of our societies and economies. It has
highlighted that risks to human health can trigger a systemic crisis. Economic and social systems may only
be as resilient as their weakest link. The interdependencies between resilience and inclusiveness have
thus been laid bare. Anticipation has proven critical to mitigating systemic crises. However, while the crisis
is global, there are significant differences across countries and the impacts also differ strongly within
countries. Understanding the causes of these spatial differences and, in particular, dealing with their
outcomes, especially for the most vulnerable and worst-hit communities, is critical for improving resilience
and “building back better”. Resilience also requires that we address the global environmental challenges
– including climate change – that make pandemics more likely. All of this reinforces the importance of
multi-level governance and local actors in implementing and designing mitigation measures and in
supporting an inclusive and resilient recovery.
The COVID-19 crisis is unrivalled in scale and regional differences in a century
COVID-19 has reinforced existing territorial inequalities. Whilst density was initially expected to be an
important determinant in infection rates, containment strategies, including the ability to work from home,
have lessened its impact. People living in poorer areas, in crowded living conditions and working in jobs
less amenable to remote working, were harder hit than their more affluent neighbours. Rural areas were
generally exposed later. Their disproportionate shares of older and less healthy populations, more limited
health capacities and lower shares of jobs amenable to remote working were readily exploited by the virus.
Employment at risk from lockdowns varied from less than 15% to more than 35% across 314 regions in
2020, with those dependent on heavily affected sectors, such as tourism, particularly exposed. The
potential for remote working across regions is also uneven. Equally, differences exist in the relative
importance of non-standard employment, which includes undeclared, temporary or self-employed workers,
who often benefit less from social protection. These differences contribute to regional employment and
poverty impacts.
The substantial costs of the COVID-19 pandemic to human life and economies, with its territorially different
impacts, reinforce the importance of place-based, co-ordinated policy responses. While effective central
governments need to set the national strategy, these need to go hand in hand with bottom-up local
approaches.
11
OECD REGIONAL OUTLOOK 2021 © OECD 2021
Climate change is a global challenge requiring local, inclusive and early action
Climate challenge also threatens the foundations of well-being. It is also global and territorially different,
albeit on a larger scale and longer time horizon than the COVID-19 crisis. Responses also need to include
regional and local actors. Key risks from global warming above 2 degrees Celsius include worldwide food
shortages as well as high risks of water scarcity in dryland regions. To prevent these risks, most OECD
countries are aiming for net-zero domestic greenhouse gas (GHG) emissions by 2050. Costs vary and can
be modest in fossil fuel-importing high-income regions. Well-being benefits beyond the protection of the
climate, for example from lower air pollution, as well as growth in new green technologies, could more than
offset the costs in many places. However, in some places, the transition costs may be higher and policies
and support will be needed to address the needs of vulnerable communities in particular, to avoid new
geographies of discontent emerging.
Subnational governments have a strong stake in this transformation because:
Variation in emissions per capita is larger within than between countries.
Well-being benefits largely arise locally.
Regional governments are better placed to understand local vulnerabilities.
Subnational governments have key competencies in energy use, land use and urban policy.
Governments at all levels need to assess investment decisions against the net-zero-emission
target.
Delaying action raises costs substantially. It also raises risks of dangerous, irreversible climate “tipping
points”. Many regions are far off near-term benchmarks, for example in phasing out coal, expanding
renewables or refurbishing buildings. Similarly, regions are not preparing road-freight hubs for zero-
emission technologies and logistics. Many city dwellers are able to reach destinations more quickly in their
own car than in shared transport, especially in poorer cities. Marginalised poor people bear the highest
risks from climate change.
Multi-level governance and finance need to mainstream the climate challenge
Subnational governments are responsible for most public spending and investment with impacts on the
climate and environment.
Transfers between subnational governments need to be linked to climate policy goals so that
subnational governments have the incentives and resources to act consistently with net-zero
emissions.
Subnational revenue and spending should integrate green budgeting and public procurement while
eliminating environmentally harmful subsidies.
Borrowing frameworks should make room for investments that serve the net-zero-emission
transition.
Governance structures and policy evaluation that integrate the scientific community in collective
decisions help ensure early cost-saving actions.
Cities require major rapid transformations
Metropolitan regions contribute more than 60% of production-based GHG emissions. Moreover, in high-
income cities, emissions inherent in the consumption of goods and services, which are largely produced
elsewhere, are often much higher than production-based emissions.
12
OECD REGIONAL OUTLOOK 2021 © OECD 2021
National urban policies should co-ordinate sectoral policies, such as transport and housing, across
metropolitan areas and their hinterlands, to reach net-zero emissions.
Cities can adopt policies to reach net-zero emissions in conjunction with better urban living. For
example, digital-based, on-demand ride-sharing not only lowers emissions and energy
consumption but also reduces congestion and pollution while saving costs, boosting innovation
and freeing urban space, provided it replaces individual car use. Mobility in the Greater Dublin
Area, for example, could be delivered with only 2% of the current number of vehicles and 37% less
congestion while improving connectivity and equitable access to the population.
Cities hold large potential for modular technologies to integrate renewables, heat pumps and other
green infrastructure.
High-income cities can take the lead on circular economy initiatives to make consumption more
consistent with net-zero emissions, by eliminating food waste and encouraging sharing and reuse
of goods for example.
Rural regions are pivotal for their natural endowments
Ecosystem services and the potential from the use of renewables in rural regions are key to well-being and
reducing emissions. But ageing, lower education levels and less diversified economic activity put rural
regions with carbon-intensive industries at bigger risk and per capita emissions are often higher in rural
than metropolitan regions.
Rewarding ecosystem benefits boosts GHG emission reduction and rural development.
Participation in profit and decision-making makes renewables projects more attractive in rural
regions, where they are often needed the most.
Innovation in agriculture, urban-rural connections and renewable energies can help diversify
economic activity.
Low operating costs of electric vehicles carry significant potential for rural regions, where car use
is particularly intensive. Laying out charging infrastructure seamlessly requires particular attention
in thinly populated areas.
Smart specialisation and well-designed support help leave no region behind
On average across regions, only 2.3% of employment is in sectors broadly defined as being at potential
risk of some employment loss from climate policies consistent with the Paris Agreement. But in some large
subnational regions, this may exceed 6%, such as Gyeongnam Region in Korea and Silesia in Poland,
and some of these risks may even be concentrated within these regions. Some of them already have
higher poverty and long-term unemployment, reinforcing the importance of supporting the transition in
strongly affected places early on, whilst also helping to keep political support for the transition. In this
context, smart specialisation can connect new, net-zero-emission activities to established local
businesses, skills and assets, avoiding regional economic decline.
Building consensus around future specialisations among early local stakeholders from higher
education institutions, innovative businesses, regional and local governments, is key.
Skills mapping can identify future occupations and skill needs. Engaging local employers can help
align skills with needs for reaching net-zero emissions.
13
OECD REGIONAL OUTLOOK 2021 © OECD 2021
Part I The resilience of
rural and urban regions in
the COVID-19 crisis
14
OECD REGIONAL OUTLOOK 2021 © OECD 2021
The COVID-19 pandemic has brought much human suffering. It has
underlined that risks to the foundations of human well-being are real global
threats with multiple knock-on effects on economy and society. While the
crisis is global, the impacts are territorially different. Well-connected urban
areas were among the first exposed to the pandemic. In rural areas, older
and less healthy populations often faced limited healthcare capacity. In
urban and rural regions alike, poor areas with crowded living and working
conditions have suffered worse health outcomes.
The economic crisis COVID-19 has triggered exceeds the global financial
and economic crisis from 2008 in scale and regional differentiation.
Employment at risk varied from less than 15% to more than 35% across
314 regions in 2020, often reflecting sectoral specialisation, such as in
tourism. Potentials for remote working are also uneven. Differences in
non-standard employment contribute to regionally different employment and
poverty impacts across regions. This includes undeclared, temporary or
self-employed workers, who often benefit less from social protection.
1 The COVID-19 crisis in urban and
rural areas
15
OECD REGIONAL OUTLOOK 2021 © OECD 2021
COVID-19 has hit regions across the world but timing and impacts have differed
Since the World Health Organization (WHO) declared COVID-19 a “public health emergency of
international concern” on 30 January 2020, the pandemic has triggered a global crisis, characterised by
multiple knock-on effects on economies and societies, making this a systemic crisis. The impacts differ
strongly across territories, including within countries. This applies to the spread of the virus and its health
consequences as well as to the impacts of the ensuing economic crisis and its effects on employment and
poverty. The COVID-19 pandemic, therefore, offers lessons in preventing and coping with systemic crises
in the future.
COVID-19 has hit urban regions early
At the beginning of the pandemic, some of the largest global cities (e.g. London, Madrid, Milan, New York
City) had the highest incidence of COVID-19 cases per capita. Epidemiological models predicted that
without mitigation strategies, the disease would spread faster in urban metropolitan areas than rural areas
(Stier, Berman and Bettencourt, 2020[1]). However, many areas that were initially hard hit by COVID-19
enacted containment measures such as widespread closures of commerce and strict limits on travel.
These rules, combined with voluntary social distancing, led to large declines in mobility by foot, car and
public transit, particularly in the largest cities (Ramuni, 2020[2]).
Indeed, some of the densest cities in the world managed to bring initial outbreaks of COVID-19 under
control with a very low incidence of infections and deaths. For example, Australia, Japan and South Korea
brought prevalence down dramatically – including in cities like Seoul, Sydney and Tokyo – emphasising
anticipation, early preparation and a proactive approach when caseloads were still low and using mitigation
measures such as mask-wearing (Chapter 2).
Whilst density itself does not appear to be a determining factor, in part reflecting the strong policy
responses (Hamidi, Sabouri and Ewing, 2020[3]), many large cities such as Brussels, Mexico City, Paris,
Santiago de Chile and Stockholm have fared worse than other regions (Figure 1.1). Places marked with
inequalities and a high concentration of urban poor living in crowded housing do appear to be more
vulnerable than those that are better resourced, less crowded and more equal (Iacobucci, 2020[4]).
Most cities rely on public transit networks but these do not appear to have been a significant vector of
transmission (Florida, Rodriguez-Pose and Storper, 2020[5]). For instance, contract-tracing efforts in
France and Japan have not identified any coronavirus clusters from transit use. There are a number of
factors that may help to explain this. Coronavirus transmission may be lower in trains and subways
(especially given the fact that many had advanced ventilation systems before COVID-19) than other
enclosed spaces because commuters usually stay for brief periods of time and refrain from talking. In most
OECD cities, widespread avoidance of public transit has continued since the onset of COVID-19, resulting
in less crowded travel conditions coupled with mitigation measures such as mask-wearing rules to limit the
virus’ spread. Equally, it is possible that contact tracing has not identified significant numbers of virus
transmission on transit systems because of the dispersed nature of transit compared to other settings
(O’Sullivan, 2020[6]). Certainly, the high incidence rates among public transit drivers and operators
suggests some caution in interpretation, at least with respect to long travel times. Nevertheless, the
evidence points strongly to household contacts as being the main source of contagion, followed by
workplaces (Brandily et al., 2020[7]).
Large, global cities experienced earlier cases of COVID-19, due to their strong connectedness to other
places. For example, South German and Northern Italian regions and their cities may well have been hit
early within their countries because of their stronger connections to China via global value chains.
16
OECD REGIONAL OUTLOOK 2021 © OECD 2021
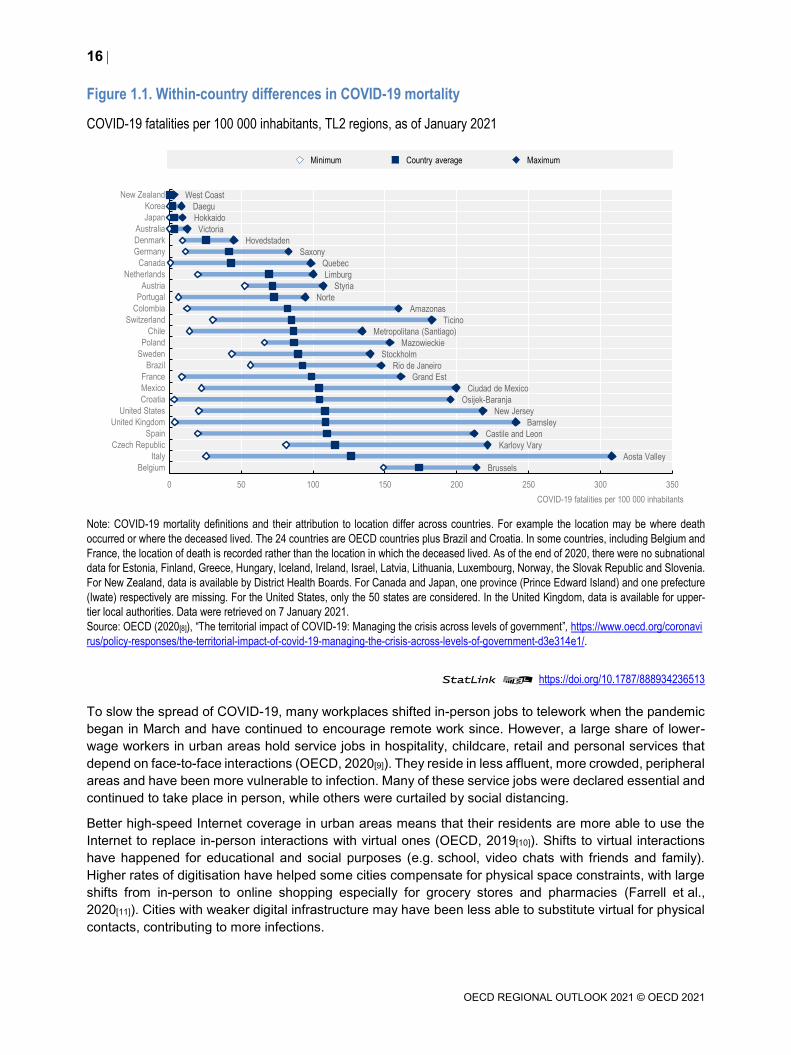
Figure 1.1. Within-country differences in COVID-19 mortality
COVID-19 fatalities per 100 000 inhabitants, TL2 regions, as of January 2021
Note: COVID-19 mortality definitions and their attribution to location differ across countries. For example the location may be where death
occurred or where the deceased lived. The 24 countries are OECD countries plus Brazil and Croatia. In some countries, including Belgium and
France, the location of death is recorded rather than the location in which the deceased lived. As of the end of 2020, there were no subnational
data for Estonia, Finland, Greece, Hungary, Iceland, Ireland, Israel, Latvia, Lithuania, Luxembourg, Norway, the Slovak Republic and Slovenia.
For New Zealand, data is available by District Health Boards. For Canada and Japan, one province (Prince Edward Island) and one prefecture
(Iwate) respectively are missing. For the United States, only the 50 states are considered. In the United Kingdom, data is available for upper-
tier local authorities. Data were retrieved on 7 January 2021.
Source: OECD (2020[8]), “The territorial impact of COVID-19: Managing the crisis across levels of government”, https://www.oecd.org/coronavi
rus/policy-responses/the-territorial-impact-of-covid-19-managing-the-crisis-across-levels-of-government-d3e314e1/.
StatLink 2 https://doi.org/10.1787/888934236513
To slow the spread of COVID-19, many workplaces shifted in-person jobs to telework when the pandemic
began in March and have continued to encourage remote work since. However, a large share of lower-
wage workers in urban areas hold service jobs in hospitality, childcare, retail and personal services that
depend on face-to-face interactions (OECD, 2020[9]). They reside in less affluent, more crowded, peripheral
areas and have been more vulnerable to infection. Many of these service jobs were declared essential and
continued to take place in person, while others were curtailed by social distancing.
Better high-speed Internet coverage in urban areas means that their residents are more able to use the
Internet to replace in-person interactions with virtual ones (OECD, 2019[10]). Shifts to virtual interactions
have happened for educational and social purposes (e.g. school, video chats with friends and family).
Higher rates of digitisation have helped some cities compensate for physical space constraints, with large
shifts from in-person to online shopping especially for grocery stores and pharmacies (Farrell et al.,
2020[11]). Cities with weaker digital infrastructure may have been less able to substitute virtual for physical
contacts, contributing to more infections.
Brussels
Aosta Valley
Karlovy Vary
Castile and Leon
Barnsley
New Jersey
Osijek-Baranja
Ciudad de Mexico
Grand Est
Rio de Janeiro
Stockholm
Mazowieckie
Metropolitana (Santiago)
Ticino
Amazonas
Norte
Styria
Limburg
Quebec
Saxony
Hovedstaden
Victoria
Hokkaido
Daegu
West Coast
Belgium
Italy
Czech Republic
Spain
United Kingdom
United States
Croatia
Mexico
France
Brazil
Sweden
Poland
Chile
Switzerland
Colombia
Portugal
Austria
Netherlands
Canada
Germany
Denmark
Australia
Japan
Korea
New Zealand
0 50 100 150 200 250 300 350
COVID-19 fatalities per 100 000 inhabitants
Minimum Country average Maximum
17
OECD REGIONAL OUTLOOK 2021 © OECD 2021
Whilst there remains considerable uncertainty about the longer-term economic and social consequences
of COVID-19, it is clear that the pandemic has, at least in the short term, dampened the vibrant activities
of cities. Many trends that started before the crisis, such as digitalisation – including greater potential for
remote working – have accelerated. The pandemic has also raised awareness among policy makers and
the public at large about the importance of protecting sustainable ecosystems. As a result, city planners
are already beginning to place higher emphasis on open spaces, mixed-use architecture and contactless
digital commerce.
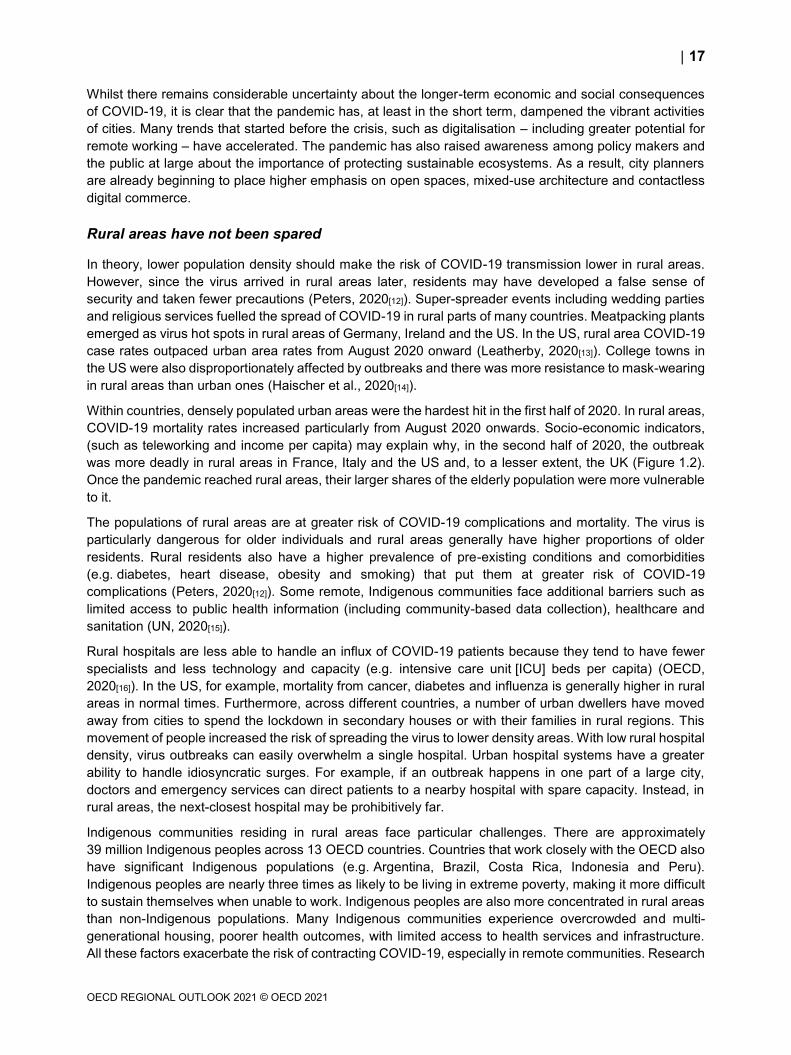
Rural areas have not been spared
In theory, lower population density should make the risk of COVID-19 transmission lower in rural areas.
However, since the virus arrived in rural areas later, residents may have developed a false sense of
security and taken fewer precautions (Peters, 2020[12]). Super-spreader events including wedding parties
and religious services fuelled the spread of COVID-19 in rural parts of many countries. Meatpacking plants
emerged as virus hot spots in rural areas of Germany, Ireland and the US. In the US, rural area COVID-19
case rates outpaced urban area rates from August 2020 onward (Leatherby, 2020[13]). College towns in
the US were also disproportionately affected by outbreaks and there was more resistance to mask-wearing
in rural areas than urban ones (Haischer et al., 2020[14]).
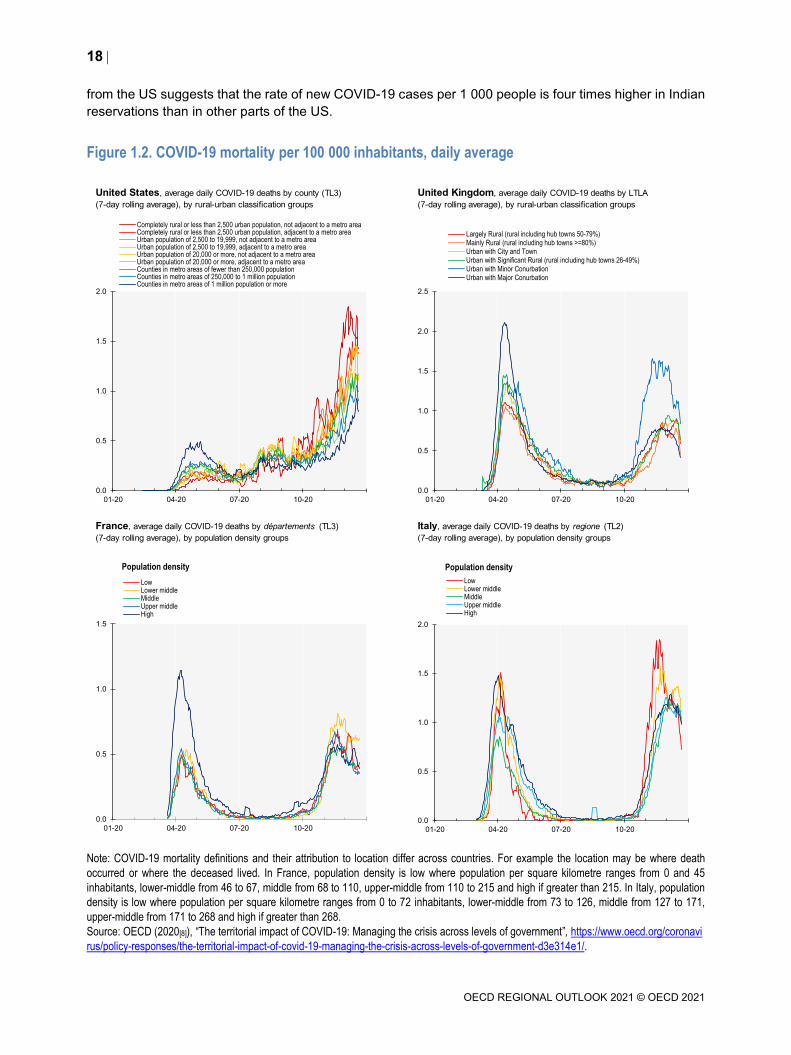
Within countries, densely populated urban areas were the hardest hit in the first half of 2020. In rural areas,
COVID-19 mortality rates increased particularly from August 2020 onwards. Socio-economic indicators,
(such as teleworking and income per capita) may explain why, in the second half of 2020, the outbreak
was more deadly in rural areas in France, Italy and the US and, to a lesser extent, the UK (Figure 1.2).
Once the pandemic reached rural areas, their larger shares of the elderly population were more vulnerable
to it.
The populations of rural areas are at greater risk of COVID-19 complications and mortality. The virus is
particularly dangerous for older individuals and rural areas generally have higher proportions of older
residents. Rural residents also have a higher prevalence of pre-existing conditions and comorbidities
(e.g. diabetes, heart disease, obesity and smoking) that put them at greater risk of COVID-19
complications (Peters, 2020[12]). Some remote, Indigenous communities face additional barriers such as
limited access to public health information (including community-based data collection), healthcare and
sanitation (UN, 2020[15]).
Rural hospitals are less able to handle an influx of COVID-19 patients because they tend to have fewer
specialists and less technology and capacity (e.g. intensive care unit [ICU] beds per capita) (OECD,
2020[16]). In the US, for example, mortality from cancer, diabetes and influenza is generally higher in rural
areas in normal times. Furthermore, across different countries, a number of urban dwellers have moved
away from cities to spend the lockdown in secondary houses or with their families in rural regions. This
movement of people increased the risk of spreading the virus to lower density areas. With low rural hospital
density, virus outbreaks can easily overwhelm a single hospital. Urban hospital systems have a greater
ability to handle idiosyncratic surges. For example, if an outbreak happens in one part of a large city,
doctors and emergency services can direct patients to a nearby hospital with spare capacity. Instead, in
rural areas, the next-closest hospital may be prohibitively far.
Indigenous communities residing in rural areas face particular challenges. There are approximately
39 million Indigenous peoples across 13 OECD countries. Countries that work closely with the OECD also
have significant Indigenous populations (e.g. Argentina, Brazil, Costa Rica, Indonesia and Peru).
Indigenous peoples are nearly three times as likely to be living in extreme poverty, making it more difficult
to sustain themselves when unable to work. Indigenous peoples are also more concentrated in rural areas
than non-Indigenous populations. Many Indigenous communities experience overcrowded and multi-
generational housing, poorer health outcomes, with limited access to health services and infrastructure.
All these factors exacerbate the risk of contracting COVID-19, especially in remote communities. Research
18
OECD REGIONAL OUTLOOK 2021 © OECD 2021
from the US suggests that the rate of new COVID-19 cases per 1 000 people is four times higher in Indian
reservations than in other parts of the US.
Figure 1.2. COVID-19 mortality per 100 000 inhabitants, daily average
Note: COVID-19 mortality definitions and their attribution to location differ across countries. For example the location may be where death
occurred or where the deceased lived. In France, population density is low where population per square kilometre ranges from 0 and 45
inhabitants, lower-middle from 46 to 67, middle from 68 to 110, upper-middle from 110 to 215 and high if greater than 215. In Italy, population
density is low where population per square kilometre ranges from 0 to 72 inhabitants, lower-middle from 73 to 126, middle from 127 to 171,
upper-middle from 171 to 268 and high if greater than 268.
Source: OECD (2020[8]), “The territorial impact of COVID-19: Managing the crisis across levels of government”, https://www.oecd.org/coronavi
rus/policy-responses/the-territorial-impact-of-covid-19-managing-the-crisis-across-levels-of-government-d3e314e1/.
United States, average daily COVID-19 deaths by county (TL3) United Kingdom, average daily COVID-19 deaths by LTLA
(7-day rolling average), by rural-urban classification groups (7-day rolling average), by rural-urban classification groups
France, average daily COVID-19 deaths by départements (TL3) Italy, average daily COVID-19 deaths by regione (TL2)
(7-day rolling average), by population density groups (7-day rolling average), by population density groups
0.0
0.5
1.0
1.5
2.0
01-20 04-20 07-20 10-20
Completely rural or less than 2,500 urban population, not adjacent to a metro areaCompletely rural or less than 2,500 urban population, adjacent to a metro areaUrban population of 2,500 to 19,999, not adjacent to a metro areaUrban population of 2,500 to 19,999, adjacent to a metro areaUrban population of 20,000 or more, not adjacent to a metro areaUrban population of 20,000 or more, adjacent to a metro areaCounties in metro areas of fewer than 250,000 populationCounties in metro areas of 250,000 to 1 million populationCounties in metro areas of 1 million population or more
0.0
0.5
1.0
1.5
2.0
01-20 04-20 07-20 10-20
LowLower middleMiddleUpper middleHigh
Population density
0.0
0.5
1.0
1.5
2.0
2.5
01-20 04-20 07-20 10-20
Largely Rural (rural including hub towns 50-79%)Mainly Rural (rural including hub towns >=80%)Urban with City and TownUrban with Significant Rural (rural including hub towns 26-49%)Urban with Minor ConurbationUrban with Major Conurbation
0.0
0.5
1.0
1.5
01-20 04-20 07-20 10-20
LowLower middleMiddleUpper middleHigh
Population density
19
OECD REGIONAL OUTLOOK 2021 © OECD 2021
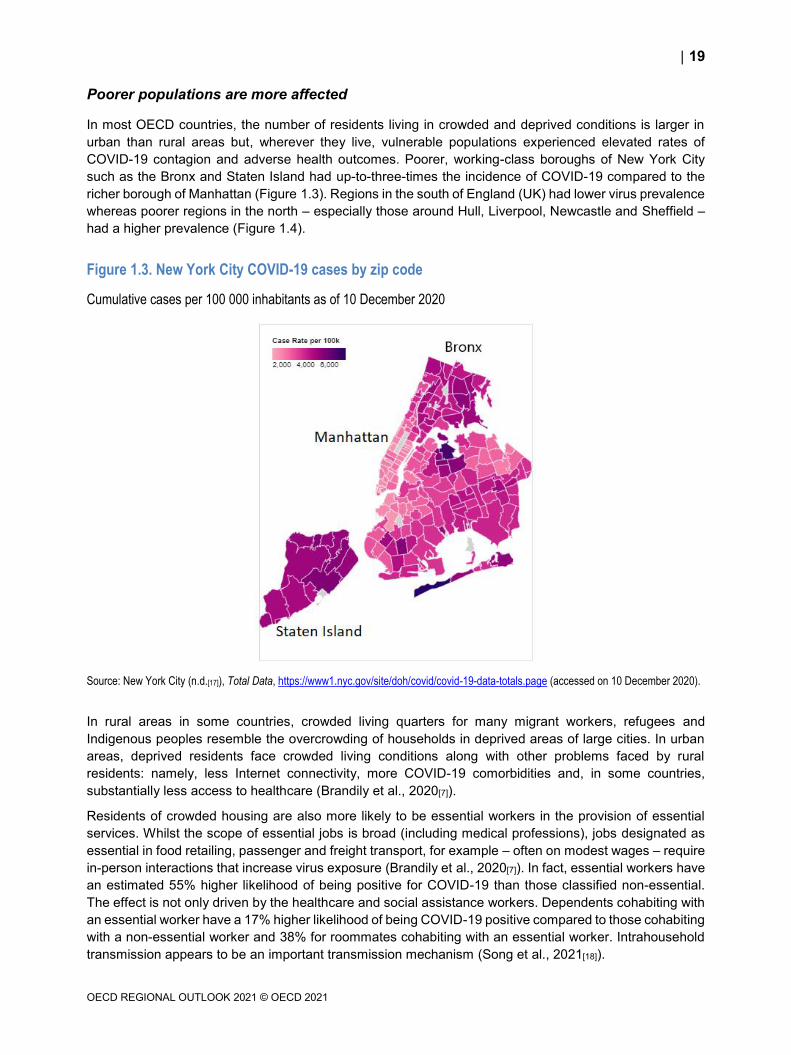
Poorer populations are more affected
In most OECD countries, the number of residents living in crowded and deprived conditions is larger in
urban than rural areas but, wherever they live, vulnerable populations experienced elevated rates of
COVID-19 contagion and adverse health outcomes. Poorer, working-class boroughs of New York City
such as the Bronx and Staten Island had up-to-three-times the incidence of COVID-19 compared to the
richer borough of Manhattan (Figure 1.3). Regions in the south of England (UK) had lower virus prevalence
whereas poorer regions in the north – especially those around Hull, Liverpool, Newcastle and Sheffield –
had a higher prevalence (Figure 1.4).
Figure 1.3. New York City COVID-19 cases by zip code
Cumulative cases per 100 000 inhabitants as of 10 December 2020
Source: New York City (n.d.[17]), Total Data, https://www1.nyc.gov/site/doh/covid/covid-19-data-totals.page (accessed on 10 December 2020).
In rural areas in some countries, crowded living quarters for many migrant workers, refugees and
Indigenous peoples resemble the overcrowding of households in deprived areas of large cities. In urban
areas, deprived residents face crowded living conditions along with other problems faced by rural
residents: namely, less Internet connectivity, more COVID-19 comorbidities and, in some countries,
substantially less access to healthcare (Brandily et al., 2020[7]).
Residents of crowded housing are also more likely to be essential workers in the provision of essential
services. Whilst the scope of essential jobs is broad (including medical professions), jobs designated as
essential in food retailing, passenger and freight transport, for example – often on modest wages – require
in-person interactions that increase virus exposure (Brandily et al., 2020[7]). In fact, essential workers have
an estimated 55% higher likelihood of being positive for COVID-19 than those classified non-essential.
The effect is not only driven by the healthcare and social assistance workers. Dependents cohabiting with
an essential worker have a 17% higher likelihood of being COVID-19 positive compared to those cohabiting
with a non-essential worker and 38% for roommates cohabiting with an essential worker. Intrahousehold
transmission appears to be an important transmission mechanism (Song et al., 2021[18]).

20
OECD REGIONAL OUTLOOK 2021 © OECD 2021
Workers in informal employment, of which there are 2 billion (sixty-one percent of the world’s employed
population), are particularly vulnerable. In addition to having higher exposure to health and safety risks,
informal workers are often obliged to work without appropriate physical protection such as masks or hand
disinfectants. Moreover, informal workers have limited (often negligible) social protection and less recourse
to benefit from health and safety standards, including hygiene and social distancing protocols introduced
by most governments around the world. Nor can they access paid sick leave, which, when sufficiently
generous, can reduce workplace transmission by convincing workers who might have contracted the virus
to stay home.
The impact of COVID has compounded existing socio-economic vulnerabilities and disproportionately
affected vulnerable populations and minorities, in terms of infection and health risks (OECD, 2020[19]). In
addition, while a disproportionate share of essential workers are low-paid workers, low-paid workers in
non-essential jobs have also been the most vulnerable to job and income loss in many regions, in part
reflecting the lower possibilities to telework.
Figure 1.4. United Kingdom COVID-19 cases by lower-tier local authority area
Cumulative cases per 100 000 inhabitants as of 4 June 2020
Source: Ythlev (2020[20]), COVID-19 Outbreak UK Per Capita Cases Map, https://commons.wikimedia.org/wiki/File:COVID-
19_outbreak_UK_per_capita_cases_map.svg.
21
OECD REGIONAL OUTLOOK 2021 © OECD 2021
Worldwide environmental challenges contribute to sparking and diffusing pandemics
Human interference with biodiversity helps create the conditions for pathogens to leap from animals to
humans, creating zoonotic diseases, such as COVID-19 (OECD, 2020[21]). According to the 2020
Intergovernmental Science-Policy Platform on Biodiversity and Ecosystem Services (IPBES) Workshop
Report on Biodiversity and Pandemics “the underlying causes of pandemics are the same global
environmental changes that drive biodiversity loss and climate change (IPBES, 2020[22]).” Land-use
change, in particular deforestation, degradation and fragmentation of animals’ habitat, agriculture
intensification, as well as wildlife trade and climate change have all played a role. Another important driver
of infectious diseases is agriculture expansion and intensification, and particularly mass animal farming
(Rohr et al., 2019[23]). High-density industrialised livestock operations are already more vulnerable to
losses of animals to diseases. Both increased host density and increased contact rates between people
and animals facilitate the transmission of diseases and can cause increases in infectious diseases. In
addition, increased poaching of wildlife and illegal resource extraction in some countries contributes to the
loss of rural livelihoods and reduced capacity for monitoring and enforcement (OECD, 2020[21]). It is
therefore paramount to understand and integrate into policymaking the connection between the
environmental and public health agendas (O’Callaghan-Gordo and Antó, 2020[24]). Along with COVID-19,
many deadly pathogens in recent memory – such as dengue and more recently HIV, Ebola, SARS – have
taken this interspecies leap: 70% of emerging diseases and almost all known pandemics are zoonotic.
Effective biodiversity conservation and sustainable land use, including halting deforestation, will limit the
risk of zoonotic transfer while also helping to maintain the existing ecosystem services (OECD, 2020[21]).
Land use change is a particularly large driver of pandemics, responsible for more than 30% of emerging
disease events (IPBES, 2020[22]). Regional governments can contribute towards more sustainable land
use governance and reduce the role of land use change in pandemic emergence since they are often in
charge of local spatial planning and land use policies. Biodiversity benefits, including lower risks to human
health from zoonotic diseases, should be assessed and incorporated in major developments and land use
projects. Additionally, policies targeting the reduced role of land use change to pandemics through
ecological restoration and biodiversity conservation have synergies with combating climate change and its
effects, and can promote jobs (OECD, 2020[25]). The conservation and restoration of ecosystems can
reduce the risk of zoonotic diseases. Limiting climate change will therefore also contribute to avoiding rising
zoonotic disease risk.
The pandemic also highlighted the link between air pollution and mortality from COVID-19. Indoor and
outdoor air pollution exacerbate the airborne transmission of SARS-CoV-2 as well as the health impacts
once infected (OECD, 2020[21]). A number of studies have demonstrated that a small increase in particulate
matter (PM2.5) is associated with an increase in the COVID-19 death rate of 8%-16%, depending on the
region. Socially disadvantaged groups are more exposed and vulnerable to air pollution, which makes
them potentially more vulnerable to adverse health impacts, including from COVID-19.
Policies to reach net-zero greenhouse gas (GHG) emissions as targeted by many OECD countries for
2050 and policies to adapt to now inevitable climate change offer important synergies with this agenda, as
argued in Part II of this Regional Outlook, although also a few trade-offs, which need to be minimised.
Better air quality, improved water quality, effective waste management and enhanced biodiversity
protection will go hand in hand with emission reduction if well-designed and reduce the vulnerability of
communities to pandemics. It will also improve overall societal well-being and resilience.
As argued in Part II, integrating environmental health in policies to improve resilience offers many benefits
beyond limiting risks related to pandemics. Good air quality generates wide benefits for public health and
well-being along with economic benefits as a result of fewer air pollution-related illnesses, positive impacts
on cognition and learning, and higher productivity. Similarly, improving access to safely managed drinking
water and sanitation will bring important benefits to the most disadvantaged in both OECD and non-OECD
countries. In OECD countries, improved access can significantly enhance inclusiveness for under-

22
OECD REGIONAL OUTLOOK 2021 © OECD 2021
privileged groups such as people with health conditions, groups in substandard housing, migrants and
homeless people. In many developing countries, women and girls, in particular, are often responsible for
collecting water and suffer most from inadequate access to sanitation. Biodiversity conservation and
sustainable use are also key as biodiversity and ecosystem services provide benefits of
USD 125-140 trillion per year (i.e. more than one and a half times the size of global gross domestic product
[GDP]).
The economic crisis is profound and geographically diverse
The economic crisis triggered by COVID-19 may be the most serious economic crisis in a century. The
social and economic impacts of the lockdowns and other restrictions to slow the pandemic are diverse and
more geographically differentiated than in the 2008 global financial crisis. Whilst a number of factors, as
shown above, help to explain differences in rates of infections or death across regions, differences in
economic impacts are largely driven by industrial structures, degree of integration into global value chains,
and, of course, the stringency and length of containment measures. Indeed, although most policy
responses were initially implemented at the national level, in many countries, as the crisis unfolded, these
became more localised. (OECD, 2020[8]).
Wholesale and retail trade, accommodation and food service sectors were heavily affected by closures,
physical distancing and travel disruption, hitting metropolitan regions and tourist regions first. Lower local
consumption reinforced the impact of lost tourism – affecting large retailers, general-purpose stores and
businesses in the hospitality industry. Box 1.1 shows impacts on a selection of cities. Manufacturing is also
a high-risk sector, as it is particularly affected by disruptions of value chains, especially by lockdowns and
mobility restrictions.
Box 1.1. Estimates of economic impacts in cities
Many cities across the OECD reported major impacts:
COVID-19 caused a marked contraction in the economy of Greater Montreal in the second
quarter of 2020. The social distancing required to avoid infection and reduce mortality slowed
economic activity in retail businesses, personal services and passenger transport (especially
air and public transport). Supply chain disruptions and recessions among major trading partners
weaken exports, investment and tourism in the medium term.
An impact study of confinement on the job market in Madrid, Spain, estimated that 2 months of
confinement would result in the loss of 60 500 jobs and even 108 000 if counting indirect
employment. This represents 5.4% of total employment. The breakdown by sector of the data
places hospitality as the most affected sector (31.8%, with 19 227 fewer jobs) followed by retail
trade (11.3%, with 6 850 fewer jobs), personal services (5.6%, which means 3 425 fewer jobs)
and culture (2.5%, with 1 497 fewer jobs).
After 2 months of confinement, Bogotá’s (Colombia) GDP was estimated to fall around 4% and
unemployment reached 18%. With 3 months of confinement, the drop would be -8%, never seen
in the history of the city.
Source: OECD (2020[19]), “Cities policy responses”, https://www.oecd.org/coronavirus/policy-responses/cities-policy-responses-fd1053ff/.

23
OECD REGIONAL OUTLOOK 2021 © OECD 2021
In the US, the initially hardest-hit counties and metropolitan areas constitute the core of its productive
capacity. The 50 hardest-hit US counties “support more than 60 million jobs and 36% of its GDP” (Muro,
Whiton and Maxim, 2020[42]). Economically vulnerable regions may often have been at bigger risk, for
example, because of less sectoral diversification and less digital infrastructure. Indeed, in the European
Union (EU), regions that received significant cohesion funds from the EU before the crisis have
experienced larger relative declines in GDP (European Committee of Regions, 2020[26]), suggesting the
crisis may widen geographic disparities in economic performance. Rural areas may have benefitted from
temporarily higher demand but their structural characteristics have also made them more vulnerable
(Box 1.2).
Box 1.2. Economic impacts in rural regions
The temporary relocation of urban dwellers to rural areas may have produced positive consumption effects
in some rural areas, despite the overall decline in demand with confinement. Researchers in the US
observed a temporary increase in consumption of primary consumption goods, though the demand for
luxury goods declined in urban and rural areas. Rural areas specialised in agriculture and food processing
may have been able to boost production and sales.
Nonetheless, rural regions have been particularly vulnerable because they have:
A much less diversified economy.
A large share of workers in essential jobs (agriculture, food processing, etc.), coupled with a limited
capability to undertake these jobs from home, and poorer high-speed Internet infrastructure. This
has made telework and social distancing much harder to implement.
Lower incomes and lower savings may have forced rural people to continue to work and/or not visit
the hospital when needed.
Shortages of seasonal and temporary workers have been a significant challenge, with some jurisdictions
at risk of losing a planting season as a result of border closures. Disruptions of perishable cargo trade that
affect food markets created an additional burden for rural food businesses.
Source: OECD (2020[16]), “Policy implications of coronavirus crisis for rural development”, https://read.oecd-ilibrary.org/view/?ref=134_134479-
8kq0i6epcq&title=Policy-Implications-of-Coronavirus-Crisis-for-Rural-Development.
The fall in travel hurts regions that depend heavily on tourism
The emergence of COVID-19 around the globe led to concerns over travellers contracting and transmitting
the virus. Before the pandemic, the tourism sector directly accounted for nearly 5% of GDP and 7% of
employment worldwide (Figure 1.5) but it collapsed as many countries instituted testing and quarantine
restrictions for international travellers and even outright bans. The OECD estimates that international
tourism fell by 80% in 2020.
Business travel was hard hit and many cultural activities, festivals, cruises and large events were cancelled
or rescheduled for post-COVID times (OECD, 2020[27]). Even after some bans were lifted, tourism –
especially involving international travel – remained very depressed. The fall in domestic tourism was
smaller but still enormous. For example, both Spain and the UK expect declines of around 50% in their
domestic tourism in 2020 (OECD, 2020[28]).
24
OECD REGIONAL OUTLOOK 2021 © OECD 2021
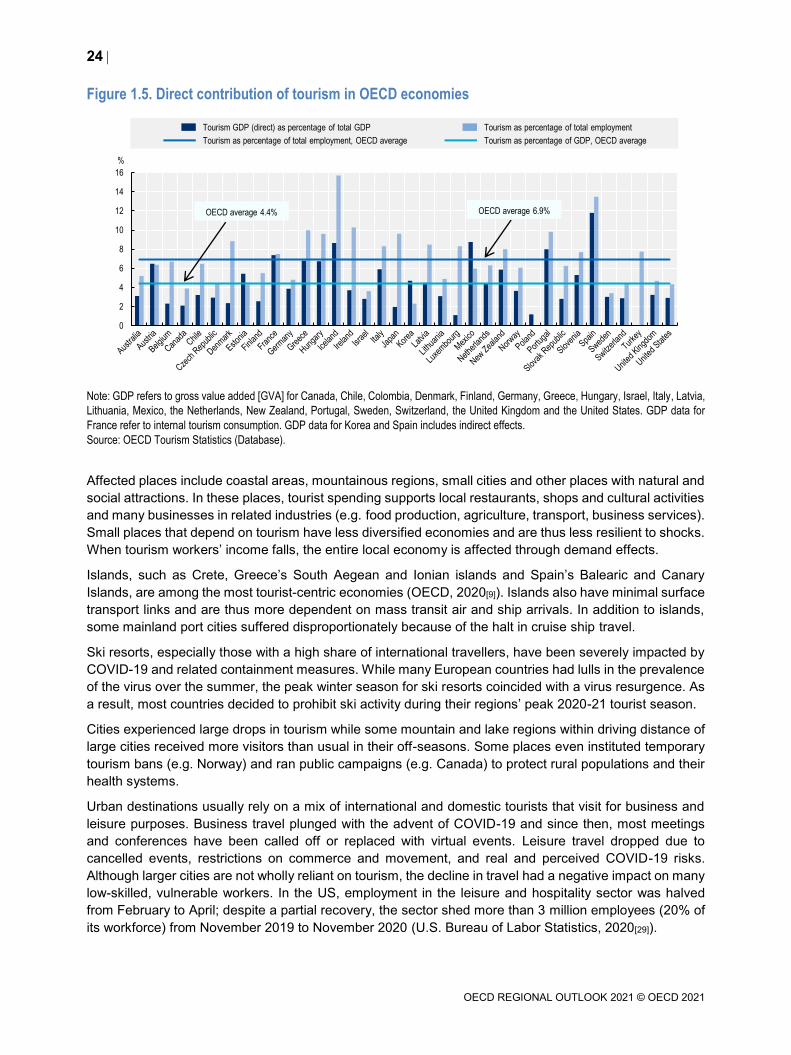
Figure 1.5. Direct contribution of tourism in OECD economies
Note: GDP refers to gross value added [GVA] for Canada, Chile, Colombia, Denmark, Finland, Germany, Greece, Hungary, Israel, Italy, Latvia,
Lithuania, Mexico, the Netherlands, New Zealand, Portugal, Sweden, Switzerland, the United Kingdom and the United States. GDP data for
France refer to internal tourism consumption. GDP data for Korea and Spain includes indirect effects.
Source: OECD Tourism Statistics (Database).
Affected places include coastal areas, mountainous regions, small cities and other places with natural and
social attractions. In these places, tourist spending supports local restaurants, shops and cultural activities
and many businesses in related industries (e.g. food production, agriculture, transport, business services).
Small places that depend on tourism have less diversified economies and are thus less resilient to shocks.
When tourism workers’ income falls, the entire local economy is affected through demand effects.
Islands, such as Crete, Greece’s South Aegean and Ionian islands and Spain’s Balearic and Canary
Islands, are among the most tourist-centric economies (OECD, 2020[9]). Islands also have minimal surface
transport links and are thus more dependent on mass transit air and ship arrivals. In addition to islands,
some mainland port cities suffered disproportionately because of the halt in cruise ship travel.
Ski resorts, especially those with a high share of international travellers, have been severely impacted by
COVID-19 and related containment measures. While many European countries had lulls in the prevalence
of the virus over the summer, the peak winter season for ski resorts coincided with a virus resurgence. As
a result, most countries decided to prohibit ski activity during their regions’ peak 2020-21 tourist season.
Cities experienced large drops in tourism while some mountain and lake regions within driving distance of
large cities received more visitors than usual in their off-seasons. Some places even instituted temporary
tourism bans (e.g. Norway) and ran public campaigns (e.g. Canada) to protect rural populations and their
health systems.
Urban destinations usually rely on a mix of international and domestic tourists that visit for business and
leisure purposes. Business travel plunged with the advent of COVID-19 and since then, most meetings
and conferences have been called off or replaced with virtual events. Leisure travel dropped due to
cancelled events, restrictions on commerce and movement, and real and perceived COVID-19 risks.
Although larger cities are not wholly reliant on tourism, the decline in travel had a negative impact on many
low-skilled, vulnerable workers. In the US, employment in the leisure and hospitality sector was halved
from February to April; despite a partial recovery, the sector shed more than 3 million employees (20% of
its workforce) from November 2019 to November 2020 (U.S. Bureau of Labor Statistics, 2020[29]).
0
2
4
6
8
10
12
14
16
%
OECD average 6.9%
Tourism GDP (direct) as percentage of total GDP Tourism as percentage of total employment
Tourism as percentage of total employment, OECD average Tourism as percentage of GDP, OECD average
OECD average 4.4%
25
OECD REGIONAL OUTLOOK 2021 © OECD 2021
The drop in economic activity resulted in significant but temporary environmental
improvements
CO2 emissions declined by 8% worldwide in 2020, to levels of 10 years ago (OECD, 2020[21]). However,
this temporary reduction is not expected to have any long-term impact. Moreover, unless energy use, land
use and urban policies are profoundly transformed, the annual flow of emissions will continue to rise. As
highlighted in Part II of this Regional Outlook report, it is the stock of cumulated CO2 emissions that counts
for the climate. Only moving to net-zero CO2 emissions can halt global warming.
Air pollution also declined temporarily as industrial activity, ground transport and air travel dropped for
several months. Reduced transport in particular has had a positive impact on air quality during confinement
in many cities (OECD, 2020[19]). In regions with lockdowns, there was a decrease of 50%-75% in road
transport and up to 95% in rush-hour traffic congestion in major cities. Compared with 2019, levels of
pollution in New York, US, have decreased by nearly 50%. Cities in China and India also recorded major
reductions in sulphur oxide concentrations as industrial activities were curtailed (OECD, 2020[19]) but
countries have since reported a rapid return to rising levels (OECD, 2020[21]).
The drop-in economic activity has also led to an improvement in water quality in waterways and coastal
zones. However, this will also be a temporary phenomenon as water pollution is expected to increase once
economic activity resumes. By contrast, waste management challenges have increased as governments
deal with major increases in protective equipment and demand for single-use plastics while recycling
diminished (OECD, 2020[21]). The impacts on the most vulnerable segments of society need to be taken
into account, especially from contaminated sites and in areas that lack access to adequate housing and
clean water.
The temporary nature of the environmental improvements illustrates how closely environmental impacts
still relate to economic activity. To address the risks to the foundations of human well-being from climate
change while improving inclusive economic prosperity, it is necessary to decouple economic activity from
GHG emissions not only in relative but in absolute terms, requiring broad and profound transformation of
regional economies, the theme of Part II of this Regional Outlook report.
Employment at risk varies strongly with the sectoral specialisation of regions
Evaluating regional employment at risk from a lockdown in a region can be estimated based on the specific
sectors of activity. On this basis, employment at risk may vary from less than 15% to more than 35% across
314 regions in 30 OECD and 4 non-OECD European countries in May 2020 (Figure 1.6). In 1 of 5 OECD/EU
regions, more than 30% of jobs are potentially at risk during a lockdown.
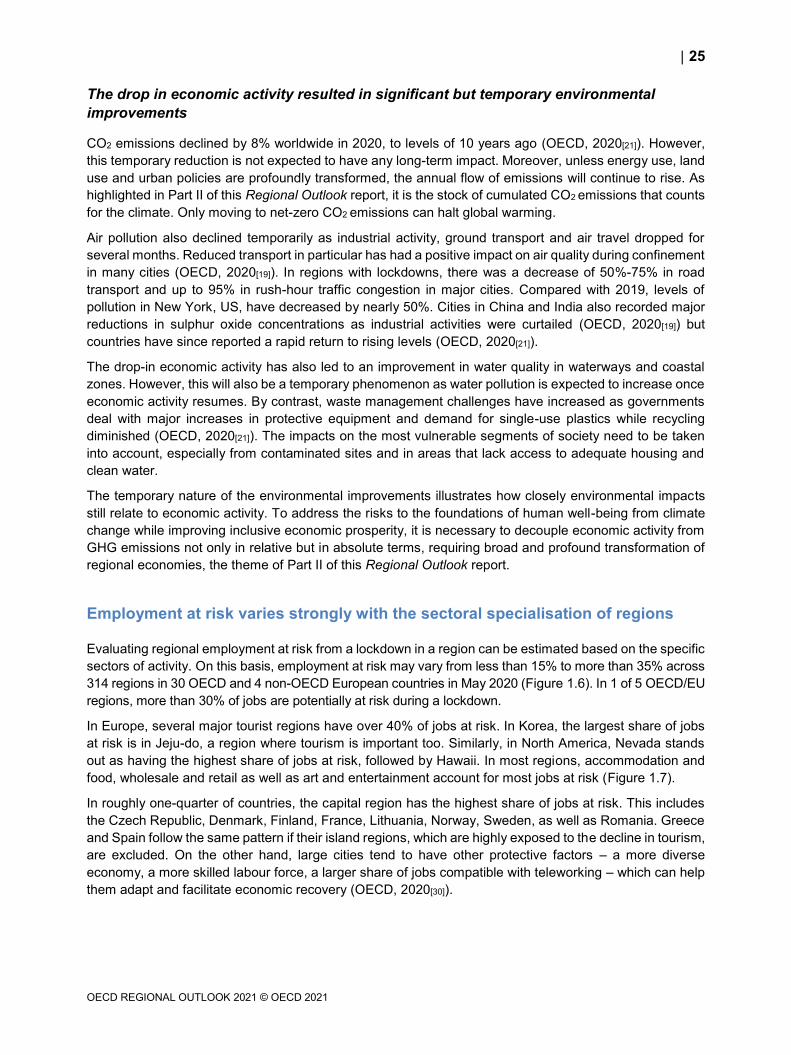
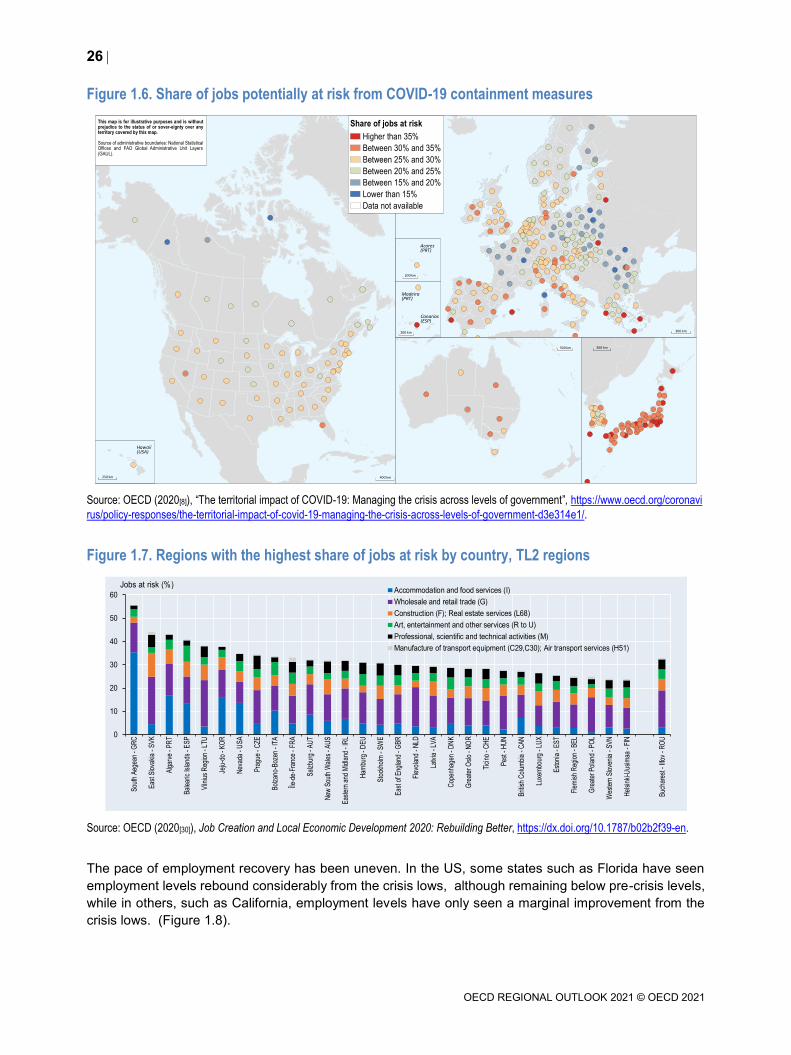
In Europe, several major tourist regions have over 40% of jobs at risk. In Korea, the largest share of jobs
at risk is in Jeju-do, a region where tourism is important too. Similarly, in North America, Nevada stands
out as having the highest share of jobs at risk, followed by Hawaii. In most regions, accommodation and
food, wholesale and retail as well as art and entertainment account for most jobs at risk (Figure 1.7).
In roughly one-quarter of countries, the capital region has the highest share of jobs at risk. This includes
the Czech Republic, Denmark, Finland, France, Lithuania, Norway, Sweden, as well as Romania. Greece
and Spain follow the same pattern if their island regions, which are highly exposed to the decline in tourism,
are excluded. On the other hand, large cities tend to have other protective factors – a more diverse
economy, a more skilled labour force, a larger share of jobs compatible with teleworking – which can help
them adapt and facilitate economic recovery (OECD, 2020[30]).
26
OECD REGIONAL OUTLOOK 2021 © OECD 2021
Figure 1.6. Share of jobs potentially at risk from COVID-19 containment measures
Source: OECD (2020[8]), “The territorial impact of COVID-19: Managing the crisis across levels of government”, https://www.oecd.org/coronavi
rus/policy-responses/the-territorial-impact-of-covid-19-managing-the-crisis-across-levels-of-government-d3e314e1/.
Figure 1.7. Regions with the highest share of jobs at risk by country, TL2 regions
Source: OECD (2020[30]), Job Creation and Local Economic Development 2020: Rebuilding Better, https://dx.doi.org/10.1787/b02b2f39-en.
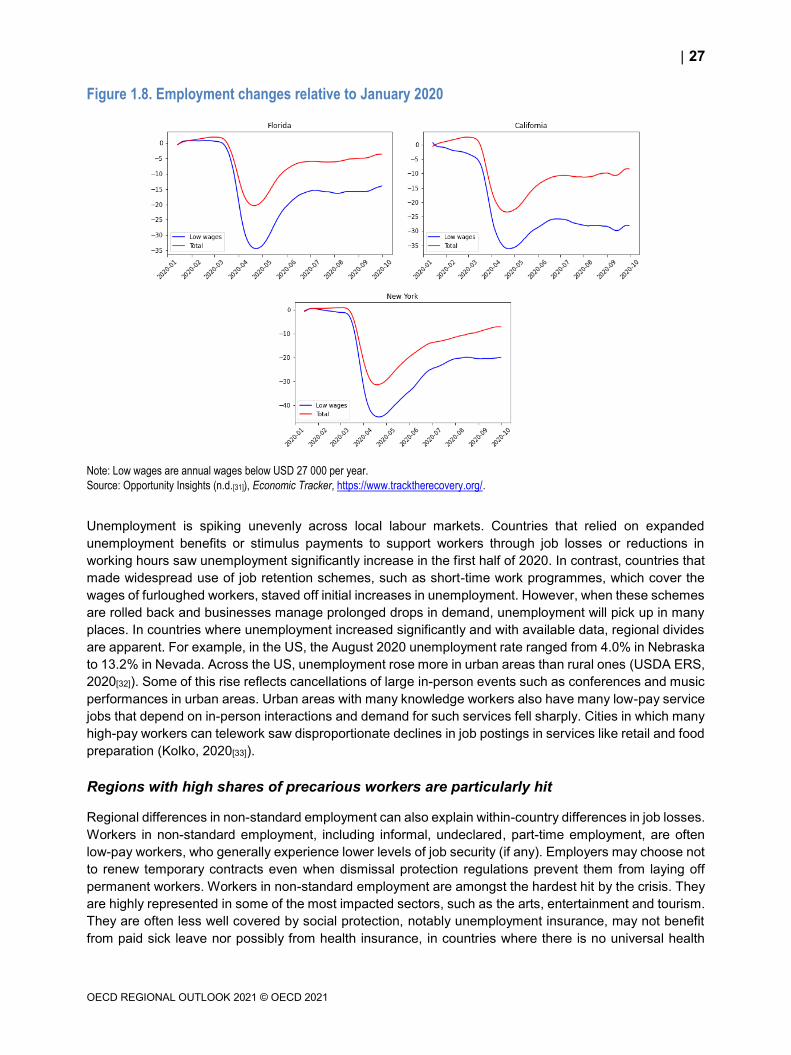
The pace of employment recovery has been uneven. In the US, some states such as Florida have seen
employment levels rebound considerably from the crisis lows, although remaining below pre-crisis levels,
while in others, such as California, employment levels have only seen a marginal improvement from the
crisis lows. (Figure 1.8).
Hawaii(USA)
250 km
This map is for illustrative purposes and is withoutprejudice to the status of or sover-eignty over anyterritory covered by this map.
Source of administrative boundaries: National StatisticalOffices and FAO Global Administrative Unit Layers(GAUL).
400 km
Canarias(ESP)
300 km
Share of jobs at risk
Higher than 35%
Between 30% and 35%
Between 25% and 30%
Between 20% and 25%
Between 15% and 20%
Lower than 15%
Data not available
300 km
Madeira(PRT)
500 km
Acores(PRT)
200 km
200 km
0
10
20
30
40
50
60
Sou
th A
egea
n - G
RC
Eas
t Slo
vaki
a - S
VK
Alg
arve
- P
RT
Bal
earic
Isla
nds
- ES
P
Viln
ius
Reg
ion
- LTU
Jeju
-do
- KO
R
Nev
ada
- US
A
Pra
gue
- CZE
Bol
zano
-Boz
en -
ITA
Île-d
e-Fr
ance
- FR
A
Sal
zbur
g - A
UT
New
Sou
th W
ales
- A
US
Eas
tern
and
Mid
land
- IR
L
Ham
burg
- D
EU
Sto
ckho
lm -
SW
E
Eas
t of E
ngla
nd -
GB
R
Flev
olan
d - N
LD
Latv
ia -
LVA
Cop
enha
gen
- DN
K
Gre
ater
Osl
o - N
OR
Tici
no -
CH
E
Pes
t - H
UN
Brit
ish
Col
umbi
a - C
AN
Luxe
mbo
urg
- LU
X
Est
onia
- E
ST
Flem
ish
Reg
ion
- BE
L
Gre
ater
Pol
and
- PO
L
Wes
tern
Slo
veni
a - S
VN
Hel
sink
i-Uus
imaa
- FI
N
Buc
hare
st -
Ilfov
- R
OU
Accommodation and food services (I)
Wholesale and retail trade (G)
Construction (F); Real estate services (L68)
Art, entertainment and other services (R to U)
Professional, scientific and technical activities (M)
Manufacture of transport equipment (C29,C30); Air transport services (H51)
Jobs at risk (%)
27
OECD REGIONAL OUTLOOK 2021 © OECD 2021
Figure 1.8. Employment changes relative to January 2020
Note: Low wages are annual wages below USD 27 000 per year.
Source: Opportunity Insights (n.d.[31]), Economic Tracker, https://www.tracktherecovery.org/.
Unemployment is spiking unevenly across local labour markets. Countries that relied on expanded
unemployment benefits or stimulus payments to support workers through job losses or reductions in
working hours saw unemployment significantly increase in the first half of 2020. In contrast, countries that
made widespread use of job retention schemes, such as short-time work programmes, which cover the
wages of furloughed workers, staved off initial increases in unemployment. However, when these schemes
are rolled back and businesses manage prolonged drops in demand, unemployment will pick up in many
places. In countries where unemployment increased significantly and with available data, regional divides
are apparent. For example, in the US, the August 2020 unemployment rate ranged from 4.0% in Nebraska
to 13.2% in Nevada. Across the US, unemployment rose more in urban areas than rural ones (USDA ERS,
2020[32]). Some of this rise reflects cancellations of large in-person events such as conferences and music
performances in urban areas. Urban areas with many knowledge workers also have many low-pay service
jobs that depend on in-person interactions and demand for such services fell sharply. Cities in which many
high-pay workers can telework saw disproportionate declines in job postings in services like retail and food
preparation (Kolko, 2020[33]).
Regions with high shares of precarious workers are particularly hit
Regional differences in non-standard employment can also explain within-country differences in job losses.
Workers in non-standard employment, including informal, undeclared, part-time employment, are often
low-pay workers, who generally experience lower levels of job security (if any). Employers may choose not
to renew temporary contracts even when dismissal protection regulations prevent them from laying off
permanent workers. Workers in non-standard employment are amongst the hardest hit by the crisis. They
are highly represented in some of the most impacted sectors, such as the arts, entertainment and tourism.
They are often less well covered by social protection, notably unemployment insurance, may not benefit
from paid sick leave nor possibly from health insurance, in countries where there is no universal health
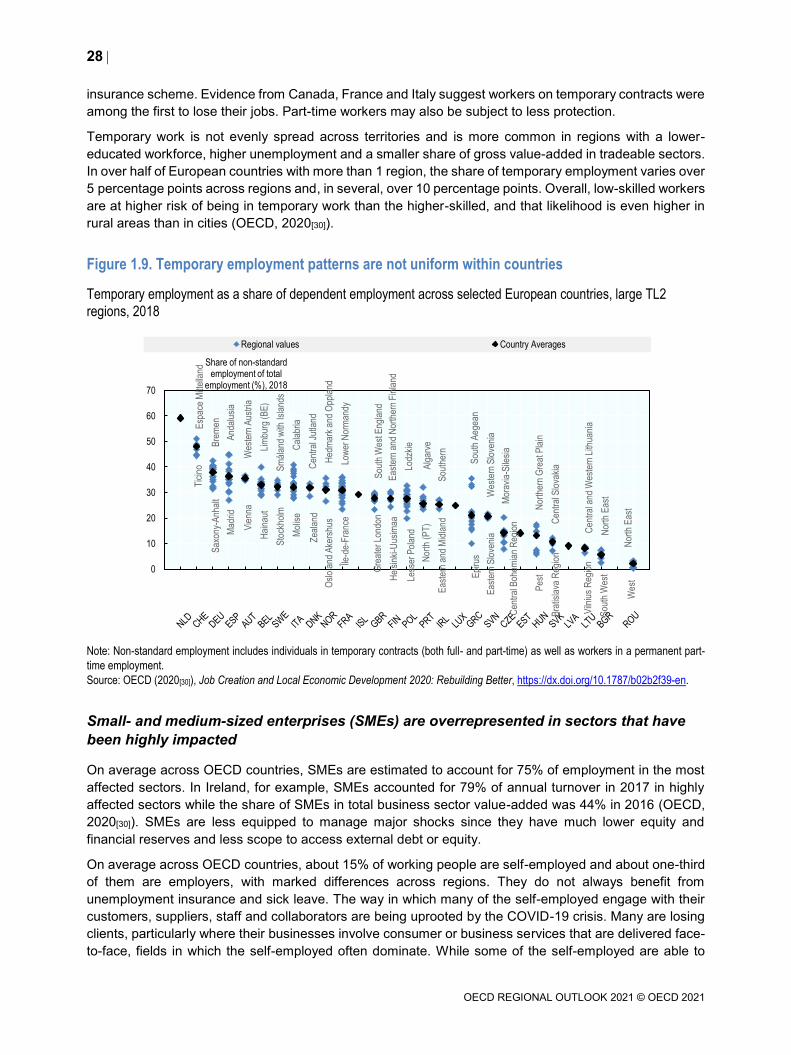
28
OECD REGIONAL OUTLOOK 2021 © OECD 2021
insurance scheme. Evidence from Canada, France and Italy suggest workers on temporary contracts were
among the first to lose their jobs. Part-time workers may also be subject to less protection.
Temporary work is not evenly spread across territories and is more common in regions with a lower-
educated workforce, higher unemployment and a smaller share of gross value-added in tradeable sectors.
In over half of European countries with more than 1 region, the share of temporary employment varies over
5 percentage points across regions and, in several, over 10 percentage points. Overall, low-skilled workers
are at higher risk of being in temporary work than the higher-skilled, and that likelihood is even higher in
rural areas than in cities (OECD, 2020[30]).
Figure 1.9. Temporary employment patterns are not uniform within countries
Temporary employment as a share of dependent employment across selected European countries, large TL2
regions, 2018
Note: Non-standard employment includes individuals in temporary contracts (both full- and part-time) as well as workers in a permanent part-
time employment.
Source: OECD (2020[30]), Job Creation and Local Economic Development 2020: Rebuilding Better, https://dx.doi.org/10.1787/b02b2f39-en.
Small- and medium-sized enterprises (SMEs) are overrepresented in sectors that have
been highly impacted
On average across OECD countries, SMEs are estimated to account for 75% of employment in the most
affected sectors. In Ireland, for example, SMEs accounted for 79% of annual turnover in 2017 in highly
affected sectors while the share of SMEs in total business sector value-added was 44% in 2016 (OECD,
2020[30]). SMEs are less equipped to manage major shocks since they have much lower equity and
financial reserves and less scope to access external debt or equity.
On average across OECD countries, about 15% of working people are self-employed and about one-third
of them are employers, with marked differences across regions. They do not always benefit from
unemployment insurance and sick leave. The way in which many of the self-employed engage with their
customers, suppliers, staff and collaborators are being uprooted by the COVID-19 crisis. Many are losing
clients, particularly where their businesses involve consumer or business services that are delivered face-
to-face, fields in which the self-employed often dominate. While some of the self-employed are able to
Esp
ace
Mitt
ella
nd
Bre
men
And
alus
ia
Wes
tern
Aus
tria
Lim
burg
(BE
)
Sm
ålan
d w
ith Is
land
s
Cal
abria
Cen
tral
Jut
land
Hed
mar
k an
d O
ppla
nd
Low
er N
orm
andy
Sou
th W
est E
ngla
nd
Eas
tern
and
Nor
ther
n F
inla
nd
Lodz
kie
Alg
arve
Sou
ther
n
Sou
th A
egea
n
Wes
tern
Slo
veni
a
Mor
avia
-Sile
sia
Nor
ther
n G
reat
Pla
in
Cen
tral
Slo
vaki
a
Cen
tral
and
Wes
tern
Lith
uani
a
Nor
th E
ast
Nor
th E
ast
Tic
ino
Sax
ony-
Anh
alt
Mad
rid
Vie
nna
Hai
naut
Sto
ckho
lm
Mol
ise
Zea
land
Osl
o an
d A
kers
hus
Île-d
e-F
ranc
e
Gre
ater
Lon
don
Hel
sink
i-Uus
imaa
Less
er P
olan
d
Nor
th (
PT
)
Eas
tern
and
Mid
land
Epi
rus
Eas
tern
Slo
veni
a
Cen
tral
Boh
emia
n R
egio
n
Pes
t
Bra
tisla
va R
egio
n
Viln
ius
Reg
ion
Sou
th W
est
Wes
t
0
10
20
30
40
50
60
70
Share of non-standard employment of total
employment (%), 2018
Regional values Country Averages

29
OECD REGIONAL OUTLOOK 2021 © OECD 2021
mitigate the adverse impacts by going online for customer and staff interactions, low digital capacities
often holds them back and there is a risk that this could lead to new digital gaps emerging with early
adopters. In addition, emergency support measures do not reach all SMEs (especially informal SMEs).
(OECD, 2021[34]).
SMEs and the self-employed are particularly dependent on their local economies for demand and access
to business support but local economies and communities also depend on healthy SMEs. Beyond the jobs
they provide, they are often active corporate citizens and are an important component of dynamic and vital
local communities. Thus, the impact of potential SME closures goes beyond just the economic activity and
jobs they are directly responsible for (OECD, 2020[30]).
The impact on small business may be long-lasting, as customers may be permanently lost to larger
(especially digital) competitors, consumer confidence in the ability of smaller firms to provide products
safely is dented, business networks are damaged, skilled employees that were furloughed find new jobs
elsewhere, and deferred investment decisions impact on output. In the United States, small businesses’
income remained around 40% below the pre-crisis level in the state of New York end-2020 (Figure 1.10)
with similar patterns in other north-eastern states, despite the reductions in COVID-19 case load and death
rates. More generally, sunk-cost characteristics of business investment may imply that a loss of capital
stock following a large shock is not recovered, especially if uncertainty remains large and even if demand
returns. This is likely to impact employment too. This may be especially true for small businesses, which
cannot borrow easily.
Figure 1.10. Business income has remained low in New York and fell more recently in North Dakota
Small business income relative to January 2020
Source: Opportunity Insights (n.d.[31]), Economic Tracker, https://www.tracktherecovery.org/.
Cultural activities and their locations have been badly hit
Social distancing brings ongoing challenges to venue-based cultural activities such as theatres and
museums (see Box 1.3). Cultural and creative activities account for about 1% to somewhat above 5% of
employment across OECD regions. The high share of self-employed, freelancers and SMEs in the cultural
sector creates unique challenges that general public support schemes are not always well-tailored to
address.
30
OECD REGIONAL OUTLOOK 2021 © OECD 2021
Box 1.3. Cultural and creative sectors risk long-lasting decline, impacting creativity and
well-being
Venue-based sectors (such as museums, the performing arts, live music, festivals, cinema, etc.) are
the hardest hit by social distancing measures. The abrupt drop in revenues puts their financial
sustainability at risk and has resulted in reduced earnings and layoffs. It also has repercussions
throughout their supplier networks, hitting suppliers in both creative and non-creative sectors. Some
cultural and creative sectors, such as online content platforms, have seen an increase in demand for
cultural content streaming during lockdowns but the benefits from this extra demand have largely
accrued to the largest firms in the industry.
The effects will be long lasting due to a combination of several factors. The impacts on distribution
channels and the drop in investment will affect the production of cultural goods and services and their
diversity in the months, if not years, to come. Over the medium term, the anticipated lower levels of
international and domestic tourism, drop in general demand and reductions of public and private funding
for arts and culture, especially at the local level, could amplify this negative trend even further.
In the absence of responsive public support and recovery strategies, the downsizing of cultural and
creative sectors will have a negative impact on cities and regions in terms of jobs and revenues,
creation, innovation, citizen well-being and overall vibrancy and diversity. Much of the broad support to
workers and firms rolled out in response to COVID-19 was not well suited to the peculiarities of the
sector. Cultural and creative sectors largely consist of micro firms, non-profit organisations and creative
professionals, often operating on the margins of financial sustainability. Large public and private cultural
institutions and businesses depend on this dynamic ecosystem for the provision of creative goods and
services. Employment and income support measures are not always accessible or adapted to the new
and non-standard forms of employment (freelance, intermittent, hybrid – e.g. combining salaried part-
time work with freelance work) that tend to be more precarious and are more common in this sector.
SME finance measures could also be better adapted to businesses with significant intangible assets.
Source: OECD (2020[30]), Job Creation and Local Economic Development 2020: Rebuilding Better, https://dx.doi.org/10.1787/b02b2f39-en.
Telework mitigates the impact of confinement on jobs in some regions
The extent to which occupations can be performed remotely is an important mitigating factor with respect
to the economic impact and cost of COVID-19 containment and contributes to territorial differences in
resilience. This strongly depends on the nature of the tasks. The OECD recently estimated the share of
occupations amenable to remote working in OECD regions based on the tasks performed by workers. The
potential for remote working is unevenly distributed within countries (Figure 1.11). Urban areas display a
9 percentage point higher share of occupations that can be performed remotely than rural areas.
In most countries, large cities and capital regions offer the largest potential for remote working. On average,
there is a 15-percentage point difference between the region with the highest and lowest potential for
remote working in a given country. These findings hold under the assumption that all workers – regardless
of location – have access to an efficient Internet connection and the necessary equipment. As a
consequence, differences arising from connectivity and available equipment might also determine the
potential for actual telework opportunities, most likely reinforcing urban-rural divides.
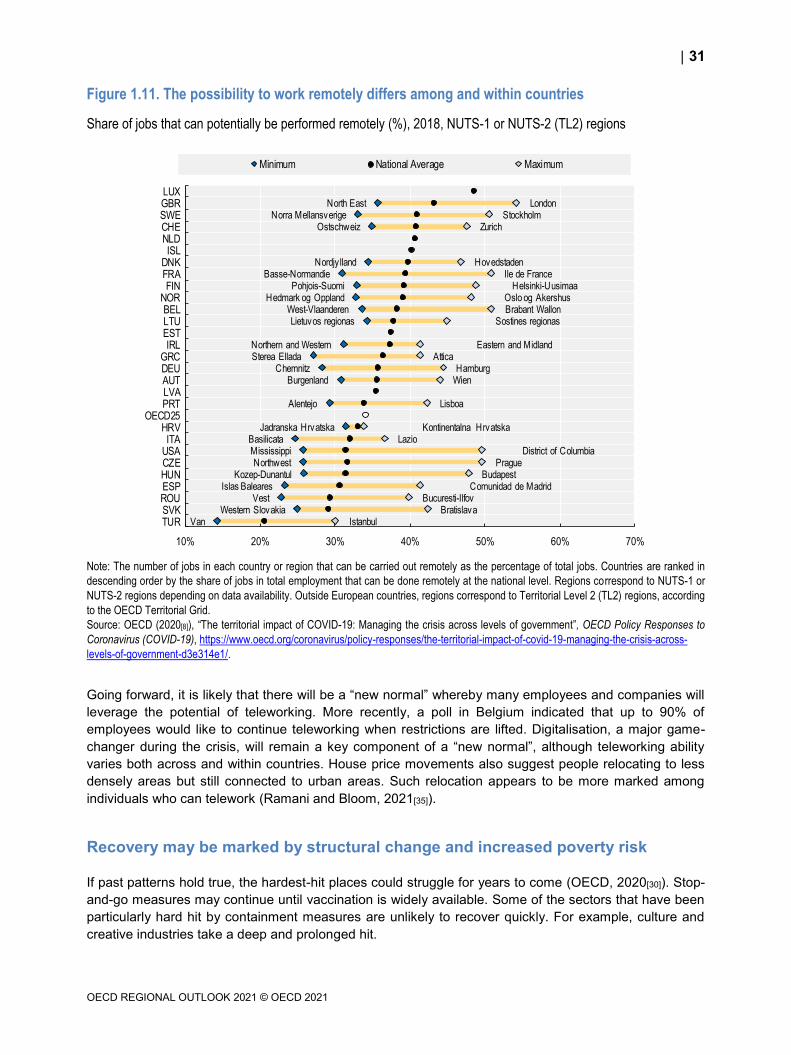
31
OECD REGIONAL OUTLOOK 2021 © OECD 2021
Figure 1.11. The possibility to work remotely differs among and within countries
Share of jobs that can potentially be performed remotely (%), 2018, NUTS-1 or NUTS-2 (TL2) regions
Note: The number of jobs in each country or region that can be carried out remotely as the percentage of total jobs. Countries are ranked in
descending order by the share of jobs in total employment that can be done remotely at the national level. Regions correspond to NUTS-1 or
NUTS-2 regions depending on data availability. Outside European countries, regions correspond to Territorial Level 2 (TL2) regions, according
to the OECD Territorial Grid.
Source: OECD (2020[8]), “The territorial impact of COVID-19: Managing the crisis across levels of government”, OECD Policy Responses to
Coronavirus (COVID-19), https://www.oecd.org/coronavirus/policy-responses/the-territorial-impact-of-covid-19-managing-the-crisis-across-
levels-of-government-d3e314e1/.
Going forward, it is likely that there will be a “new normal” whereby many employees and companies will
leverage the potential of teleworking. More recently, a poll in Belgium indicated that up to 90% of
employees would like to continue teleworking when restrictions are lifted. Digitalisation, a major game-
changer during the crisis, will remain a key component of a “new normal”, although teleworking ability
varies both across and within countries. House price movements also suggest people relocating to less
densely areas but still connected to urban areas. Such relocation appears to be more marked among
individuals who can telework (Ramani and Bloom, 2021[35]).
Recovery may be marked by structural change and increased poverty risk
If past patterns hold true, the hardest-hit places could struggle for years to come (OECD, 2020[30]). Stop-
and-go measures may continue until vaccination is widely available. Some of the sectors that have been
particularly hard hit by containment measures are unlikely to recover quickly. For example, culture and
creative industries take a deep and prolonged hit.
VanWestern Slovakia
VestIslas Baleares
Kozep-DunantulNorthwest
MississippiBasilicata
Jadranska Hrvatska
Alentejo
BurgenlandChemnitz
Sterea ElladaNorthern and Western
Lietuvos regionasWest-Vlaanderen
Hedmark og OpplandPohjois-Suomi
Basse-NormandieNordjy lland
OstschweizNorra Mellansverige
North East
IstanbulBratislava
Bucuresti-IlfovComunidad de Madrid
BudapestPrague
District of ColumbiaLazio
Kontinentalna Hrvatska
Lisboa
WienHamburg
AtticaEastern and Midland
Sostines regionasBrabant WallonOslo og Akershus
Helsinki-UusimaaIle de France
Hovedstaden
ZurichStockholm
London
10% 20% 30% 40% 50% 60% 70%
TURSVKROUESPHUNCZEUSAITA
HRVOECD25
PRTLVAAUTDEUGRC
IRLESTLTUBEL
NORFIN
FRADNK
ISLNLDCHESWEGBRLUX
Minimum National Average Maximum

32
OECD REGIONAL OUTLOOK 2021 © OECD 2021
Many job losses during recessions are not cyclical but rather reflect an acceleration of structural changes.
Accordingly, these jobs are unlikely to recover even when the economic situation improves. This can be
especially problematic for local economies where concentrated job losses in specific sectors can have
large negative spill-overs in the local economy more generally. Poor labour market outcomes, such as
unemployment and low wages, can be associated with a broader range of quality-of-life challenges at the
individual and community level, including poor mental and physicalhealth . Likewise, local downturns can
put significant pressure on local public budgets, impacting local quality of life and public services such as
education and infrastructure (OECD, 2020[30]).
Some labour market transitions initiated before the COVID-19 pandemic could gather momentum and
become abrupt changes. Technological change, globalisation, the green transition and demographic
change were already reshaping the geography of jobs and labour forces prior to the COVID-19 crisis.
These transitions will both create and destroy jobs, but not necessarily in the same places or requiring the
same skills. The green transition could also receive new momentum as part of stimulus packages (OECD,
2020[30]).
. The share of jobs at risk from automation ranges from around 4% to almost 40% across regions. While
places facing higher risks tend to have a lower-educated workforce and are less urbanised, the rapid
uptake of teleworking could expand job creation outside of traditional high-growth centres.
There is some discussion around whether increased possibilities for teleworking will lead many people to
leave cities and establish their residencies in remote areas, yet there are reasons that make this unlikely.
People are attracted to dense places for their employment opportunities but also for the access to services
and amenities they offer. At the same time, people could access these benefits and additional ones such
as lower housing prices and less congestion in intermediate cities and/or well-connected rural areas. The
long-term impact on the urban/rural spatial equilibrium may be difficult to predict, though telework at least
in a hybrid form is likely to remain a permanent feature of work to some degree (OECD, 2020[8]).
Tourism should rebound with a highly effective vaccine but risks remain
As a labour-intensive sector, the impacts on local employment in tourism destinations will be profound.
Even after COVID-19 risks fade, travel faces considerable headwinds to a full rebound. Some of the
telework that necessitated online meetings enabled technology and habits that may prove to be permanent,
leading to lower demand for in-person business meetings and conferences. Even with a highly effective
vaccine, some travellers – particularly older ones – may be reluctant to board cruise ships, travel in trains
and airplanes, and interact with groups in tours and hotels. Finally, the COVID-19-induced global economic
crisis will almost certainly dampen consumer confidence and spending. On the other hand, since domestic
and international travel has been risky and restricted for a year or more, there is pent-up demand for travel.
For example, some countries that eased their containment measures (e.g. Denmark, Iceland,
New Zealand) have already seen rebounds in domestic tourism (OECD, 2020[28]).
The supply-side of tourism may also be restricted in the future. The tourism sector is dominated by SMEs
such as hotels, restaurants and shops that are less resilient to downturns compared to larger businesses
(OECD, 2020[36]). Some of the hardest-hit small businesses have closed, especially in areas with
incomplete government aid. They may not reopen if their owners’ skills and business fixed assets can be
transferred to other uses. In Mexico, which relies heavily on tourism, more than 1 million SMEs have closed
permanently (Téllez, 2020[37]). Some large tourist-dependent businesses (e.g. hotels) also shut because
they could not withstand the loss in revenue from extended COVID-related closures. In addition to business
closures, staggering declines in cultural and recreational activities combined with an uncertain future could
imply less investment in such infrastructure (e.g. museums, theatres, ski lifts, casinos, amusement parks)
going forward. Some organisers and performers may have already changed their livelihoods to depend
less on in-person group events.
33
OECD REGIONAL OUTLOOK 2021 © OECD 2021
Poverty and adverse well-being impact on vulnerable groups is set to increase sharply
In large cities with often expensive housing in urban centres, polarised labour markets often mean strong
divides between high-skilled workers with relatively secure jobs and low-skilled workers in face-to-face
service and retail jobs at risk and subject to higher infection risk and higher risk of heavy symptoms (OECD,
2020[30]). For Manchester, UK, for example, socio-economic inequalities are considered the priority
emergency to recover from the crisis (OECD, 2020[19]). In Bristol, UK, findings from a survey showed that
black, Asian-origin workers and other ethnic minorities were overrepresented in sectors that have been hit
the hardest, including taxi drivers and low-income jobs among the self-employed. This was compounded
by unequal access in terms of health, housing and information and communication technology (ICT)
access (OECD, 2020[19]). Homeless people, estimated to be 1.9 million across OECD countries, have no
or limited means of isolating and protecting themselves from infection.
For the elderly, COVID-19 places a severe restriction on their autonomous daily life, in addition to the
higher risk of complication in case of infection. Many of whom live alone may not have a family member or
friend to rely on and those who live in care homes are most affected by physical distancing. Non-elderly
persons with a high risk of COVID-19 complications and their households are also more affected than the
rest of the population. Among the elderly, COVID-19-related lockdowns has generated particularly marked
loneliness and other psychological impacts. Low-income households may not have access to local
professional help, especially if local and regional governments lack resources to provide them where
demand may be particularly high (see below).
Women, who are overrepresented in service sectors that rely on contact with customers (e.g. tourism,
hotels, restaurants) are more likely to be negatively affected by the economic downturn from the COVID-19
pandemic and women face additional risks of infection (including for hospital and long-term care staff) and
domestic violence. In some countries, including Canada and Japan, additional childcare burdens at home
led to large declines in women’s labour force participation, which could have longer-run impacts on gender
employment gaps (Djankov and Zhang, 2020[38]).
School closures also risk exacerbating inequities in education outcomes as parents play a larger role in
their children’s learning when schools are closed or virtual. The pandemic and its economic crisis have
also brought a higher incidence of mental illnesses, notably depression, to which vulnerable groups
including youth are more sensitive. For example, in France, the incidence of depression among young
people has increased and this incidence is also likely to be geographically uneven. In terms of economic
impacts, many young entrants to the labour market are unable to find work yet are ineligible for furlough
and unemployment insurance schemes (Cajner et al., 2020[39]). Recent graduates may be
disproportionately disadvantaged in their later careers (Altonji, Kahn and Speer, 2016[40]) and the effects
may be stronger in countries with dual labour markets.
Workers in informal undeclared jobs are typically not covered by social safety nets, such as unemployment
or housing benefit. In the Global South, up to 80% of urban employment is in the informal sector. Some of
the biggest challenges from the crisis are likely to be a significant rise in income inequality and poverty.
Estimates suggest that up to 400 million people worldwide could be pushed into extreme poverty, adding
to the roughly 700 million in poverty prior to the pandemic. A large share of the new extremely poor is
projected to be in South and Southeast Asia and Sub-Saharan Africa. These are also countries where
large numbers of urban citizens live in precarious, densely packed and underserved slums, characterised
by high levels of informal employment and often an inability to adhere to social distancing measures, even
more so if its inhabitants want to avoid starvation (Gulati et al., 2020[41]). Young people entering the labour
market are at particularly stark risk of being durably affected in their earnings prospects. Labour market
entrants with relatively weak labour market prospects are particularly likely to suffer for many years from
the impact of a local recession on their career entry.
34
OECD REGIONAL OUTLOOK 2021 © OECD 2021
References
Almagro, M. and A. Orane-Hutchinson (2020), “The determinants of the differential exposure to
COVID-19 in New York City and their evolution over time”.
[42]
Altonji, J., L. Kahn and J. Speer (2016), “Cashier or consultant? Entry labor market conditions,
field of study, and career success”, Journal of Labor Economics, Vol. 34/S1, pp. S361-S401,
https://www.journals.uchicago.edu/doi/10.1086/682938.
[40]
Brandily, P. et al. (2020), “A poorly understood disease? The unequal distribution of excess
mortality due to COVID-19 across French municipalities”, Cold Spring Harbor Laboratory
Press, https://doi.org/10.1101/2020.07.09.20149955.
[7]
Cajner, T. et al. (2020), “Reconciling unemployment claims with job losses in the first months of
the COVID-19 crisis”, Finance and Economics Discussion Series, No. 2020-055, Board of
Governors of the Federal Reserve System, Washington,
https://doi.org/10.17016/FEDS.2020.055.
[39]
Djankov, S. and E. Zhang (2020), “COVID-19 widens gender gap in labor force participation in
some but not other advanced economies”, PIIE, https://www.piie.com/blogs/realtime-
economic-issues-watch/covid-19-widens-gender-gap-labor-force-participation-some-not.
[38]
European Committee of Regions (2020), Potential Impacts of COVID-19 on Regions and Cities
of the EU, http://dx.doi.org/10.2863/56992.
[26]
Farrell, D. et al. (2020), “The early impact of COVID-19 on local commerce”,
https://www.jpmorganchase.com/institute/research/cities-local-communities/early-impact-
covid-19-local-commerce.
[11]
Florida, R., A. Rodriguez-Pose and M. Storper (2020), “Cities in a post-COVID world”, Papers in
Evolutionary Economic Geography (PEEG), Utrecht University, Department of Human
Geography and Spatial Planning, Group Economic Geography,
https://ideas.repec.org/p/egu/wpaper/2041.html.
[5]
Gulati, M. et al. (2020), “The economic case for greening the global recovery through cities”. [41]
Hamidi, S., S. Sabouri and R. Ewing (2020), “Does density aggravate the COVID-19
pandemic?”, Journal of the American Planning Association, Vol. 86/4, pp. 495-509,
http://dx.doi.org/10.1080/01944363.2020.1777891.
[3]
Iacobucci, G. (2020), “Covid-19: Deprived areas have the highest death rates in England and
Wales”, https://www.bmj.com/content/bmj/369/bmj.m1810.full.pdf.
[4]
IPBES (2020), Workshop Report on Biodiversity and Pandemics, Intergovernmental Platform on
Biodiversity and Ecosystem Services, http://dx.doi.org/10.5281/ZENODO.4147.
[22]
Kolko, J. (2020), “Why job postings have fallen more in large, rich metros”,
https://www.hiringlab.org/2020/06/25/job-postings-large-rich-metros/.
[33]
Kotozaki, Y. (ed.) (2020), “Who is wearing a mask? Gender-, age-, and location-related
differences during the COVID-19 pandemic”, PLOS ONE, Vol. 15/10, p. e0240785,
https://dx.plos.org/10.1371/journal.pone.0240785.
[14]
35
OECD REGIONAL OUTLOOK 2021 © OECD 2021
Leatherby, L. (2020), “The worst virus outbreaks in the U.S. are now in rural areas”,
https://www.nytimes.com/interactive/2020/10/22/us/covid-rural-us.html.
[13]
New York City (n.d.), Total Data, https://www1.nyc.gov/site/doh/covid/covid-19-data-totals.page
(accessed on 10 December 2020).
[17]
O’Callaghan-Gordo, C. and J. Antó (2020), “COVID-19: The disease of the anthropocene”,
Environmental Research, Vol. 187, p. 109683,
http://dx.doi.org/10.1016/j.envres.2020.109683.
[24]
OECD (2021), The Digital Transformation of SMEs, OECD Studies on SMEs and
Entrepreneurship, OECD Publishing, Paris, https://dx.doi.org/10.1787/bdb9256a-en.
[34]
OECD (2020), “Biodiversity and the economic response to COVID-19: Ensuring a green and
resilient recovery”, OECD Policy Responses to Coronavirus (COVID-19), OECD, Paris.
[25]
OECD (2020), “Cities policy responses”, OECD Policy Responses to Coronavirus (COVID-19),
OECD, Paris, https://www.oecd.org/coronavirus/policy-responses/cities-policy-responses-
fd1053ff/.
[19]
OECD (2020), “Coronavirus (COVID-19): SME policy responses”, OECD Policy Responses to
Coronavirus (COVID-19), OECD, Paris, https://www.oecd.org/coronavirus/policy-
responses/coronavirus-covid-19-sme-policy-responses-04440101/.
[36]
OECD (2020), “From pandemic to recovery: Local employment and economic development”,
OECD Policy Responses to Coronavirus (COVID-19), OECD, Paris, https://read.oecd-
ilibrary.org/view/?ref=130_130810-m60ml0s4wf&title=From-pandemic-to-recovery-Local-
employment-and-economic-development.
[9]
OECD (2020), Job Creation and Local Economic Development 2020: Rebuilding Better, OECD
Publishing, Paris, https://dx.doi.org/10.1787/b02b2f39-en.
[30]
OECD (2020), “Making the Green Recovery work for jobs, income and growth”, Tackling
Coronavirus (COVID-19): Contributing to a Global Effort, OECD, Paris, https://read.oecd-
ilibrary.org/view/?ref=136_136201-ctwt8p7qs5&title=Making-the-Green-Recovery-Work-for-
Jobs-Income-and-Growth_.
[21]
OECD (2020), “Mitigating the impact of COVID-19 on tourism and supporting recovery”, OECD
Tourism Papers, No. 2020/03, OECD Publishing, Paris, https://dx.doi.org/10.1787/47045bae-
en.
[28]
OECD (2020), “Policy implications of coronavirus crisis for rural development”, Tackling
Coronavirus (COVID-19): Contributing to a Global Effort, OECD, Paris, https://read.oecd-
ilibrary.org/view/?ref=134_134479-8kq0i6epcq&title=Policy-Implications-of-Coronavirus-
Crisis-for-Rural-Development.
[16]
OECD (2020), “The territorial impact of COVID-19: Managing the crisis across levels of
government”, OECD Policy Responses to Coronavirus (COVID-19), OECD, Paris,
https://www.oecd.org/coronavirus/policy-responses/the-territorial-impact-of-covid-19-
managing-the-crisis-across-levels-of-government-d3e314e1/.
[8]
36
OECD REGIONAL OUTLOOK 2021 © OECD 2021
OECD (2020), “Tourism policy responses to the coronavirus (COVID-19)”, OECD Policy
Responses to Coronavirus (COVID-19), OECD, Paris,
https://www.oecd.org/coronavirus/policy-responses/tourism-policy-responses-to-the-
coronavirus-covid-19-6466aa20/.
[27]
OECD (2019), OECD Regional Outlook 2019: Leveraging Megatrends for Cities and Rural
Areas, OECD Publishing, Paris, https://doi.org/10.1787/9789264312838-en.
[10]
Opportunity Insights (n.d.), Economic Tracker, https://www.tracktherecovery.org/ (accessed
on January 2021).
[31]
O’Sullivan, F. (2020), “Japan and France find public transit seems safe”,
https://www.bloomberg.com/news/articles/2020-06-09/japan-and-france-find-public-transit-
seems-safe.
[6]
Peters, D. (2020), “Community susceptibility and resiliency to COVID‐19 across the rural‐urban
continuum in the United States”, Journal of Rural Health, Vol. 36/3, pp. 446-456,
https://doi.org/10.1111/jrh.12477.
[12]
Ramani, A. and N. Bloom (2021), “The doughnut effect of COVID-19 on cities”, Vox EU,
https://voxeu.org/article/doughnut-effect-covid-19-cities.
[35]
Ramuni, L. (2020), “How quickly did people respond to the coronavirus?”, Centre for Cities,
https://www.centreforcities.org/blog/how-quickly-did-people-respond-to-the-coronavirus/.
[2]
Rohr, J. et al. (2019), “Emerging human infectious diseases and the links to global food
production”, Nature Sustainability, Vol. 2/6, pp. 445-456, https://doi.org/10.1038/s41893-019-
0293-3.
[23]
Song, H. et al. (2021), “The impact of the non-essential business closure policy on Covid-19
infection rates”, NBER Working Paper, No. 28374, http://dx.doi.org/10.3386/W28374.
[18]
Stier, A., M. Berman and L. Bettencourt (2020), “COVID-19 attack rate increases with city size”,
http://arxiv.org/abs/2003.10376.
[1]
Téllez, C. (2020), “Coronavirus has shuttered 1 million small businesses”,
https://mexiconewsdaily.com/news/coronavirus-has-shuttered-1-million-small-businesses/.
[37]
U.S. Bureau of Labor Statistics (2020), All Employees, Leisure and Hospitality (USLAH),
https://fred.stlouisfed.org/series/USLAH#0.
[29]
UN (2020), “The impact of COVID-19 on Indigenous peoples”, UN/DESA Policy Brief, No. 70,
United Nations, https://www.un.org/development/desa/dpad/publication/un-desa-policy-brief-
70-the-impact-of-covid-19-on-indigenous-peoples/.
[15]
USDA ERS (2020), The COVID-19 Pandemic and Rural America, United States Department of
Agriculture Economic Research Service, https://www.ers.usda.gov/covid-19/rural-america/
(accessed on 15 December 2020).
[32]
Ythlev (2020), COVID-19 Outbreak UK Per Capita Cases Map,
https://commons.wikimedia.org/wiki/File:COVID-
19_outbreak_UK_per_capita_cases_map.svg.
[20]
37
OECD REGIONAL OUTLOOK 2021 © OECD 2021
Governments at all levels have taken unprecedented actions to contain the
spread of COVID-19 and mitigate the large economic impacts. Local and
regional actors play an increasingly important role. The substantial costs of
the COVID-19 pandemic to human life and economies and their territorially
different impacts highlight that a place-based, co-ordinated policy response
is central. While central governments need to set the strategy, bottom-up
approaches produce inclusive, local responses. Preventive, anticipative
action minimises major adverse impacts on health, well-being and the
economy.
In view of the bigger health and economic impacts on vulnerable groups,
efforts to halt the pandemic need to be combined with support to
disadvantaged areas. Hardest-hit regions and cities may face the biggest
loss in revenues and the biggest increase in spending. Without concerted
action, this could derail rebuilding efforts in the regions hit the most. Multi-
level public finance arrangements need to respond to asymmetric increases
in healthcare needs, unemployment and poverty.
Societies have shown they are willing to act to overcome the crisis. This
can inspire lasting transformations, notably to address the climate
challenge. National, regional and local governments need to deploy
economic stimulus in a way that is consistent with these transformations.
2 Policy responses to the COVID-19
crisis

38
OECD REGIONAL OUTLOOK 2021 © OECD 2021
Policy responses need to include cities and rural regions
Governments at all levels have taken unprecedented actions to contain the spread of COVID-19 and
mitigate the large economic impacts on people and firms described in Chapter 1. Local and regional actors
play an increasingly important role. They often implement emergency support policies on behalf of national
governments, complement them with local actions to fill gaps for specific sectors or populations and help
local workers and firms navigate the sometimes-complex patchwork of schemes (OECD, 2020[1]).
As shown in Chapter 1, the economic, fiscal and social impact of the COVID-19 crisis on territories is
differentiated, and its diverse risks vary greatly depending on the location (OECD, 2020[2]). This regionally
differentiated impact calls for a territorial approach to policy responses on the health, economic, social and
fiscal fronts and strong inter-governmental co-ordination. Recovery strategies also need to have an explicit
territorial dimension and therefore need to involve subnational governments at all levels in their
implementation.
Cities are on the frontline of responses to the COVID-19 crisis
Often hit first by the initial waves of the pandemic, cities play a key role to implement measures to contain
infections and cope with economic impacts but also provide laboratories for bottom-up and innovative
recovery strategies. COVID-19 has accelerated transformations towards inclusive, green and smart cities,
although these continue to fall short of what is needed to reach net-zero greenhouse gas (GHG) emissions
in 2050, a target set by most OECD countries to align with the Paris Climate Agreement (Part II of this
Regional Outlook report).
Cities crisis management responses have first related to social distancing, workplaces and commuting,
protection of vulnerable groups, ensuring local service delivery, support to businesses and citizen
engagement. Many cities are also planning for life beyond COVID-19 with a range of investments to pair
recovery with environmental sustainability including clean forms of urban mobility and energy efficiency.
The following are some steps taken by city governments (OECD, 2020[2]).
Prevention and effective early action
In some Asian countries, early action, particularly in early testing and extensive tracing of COVID-19 cases,
teleworking and lockdown orders, have succeeded in avoiding large outbreaks in several hyper-dense
cities such as Hong Kong (China), Seoul and Tokyo.
Several mayors and local administrations have developed innovative ways to inform, reassure and
communicate. They have developed a wide range of digital tools to cope with daily needs and health
issues, including public information programmes, websites, posters, advertisements and social media.
The crisis has prompted some cities to expand facilities and services to prevent and reduce health crisis
impacts. Seoul, Korea, has made a large investment in public healthcare, establishing a monitoring system
of the pandemic and new municipal facilities that include a public medical school and research centres on
infectious diseases. To help reduce virus transmission within households, especially mixed-generation
ones, governments in some countries (e.g. Finland, Italy, Lithuania) arranged special isolation
accommodation for people who contracted the virus (Haroon et al., 2020[3]). These may in particular serve
to alleviate low-income households who often live in crowded housing and who are more exposed to both
infections and socio-economic effects of the crisis, as argued above.
Supporting inclusiveness
Support measures to vulnerable groups are diverse and include food programmes for children and the
elderly, meal and pharmaceuticals delivery, special care for elderly and disabled people, emergency
39
OECD REGIONAL OUTLOOK 2021 © OECD 2021
shelter and housing, distribution of masks, vouchers for essential goods, installation of sanitary facilities,
exemptions or deferrals from rental payments for residents of social housing, mortgage payment
assistance, waiver or relief of utility payments and emergency phone lines. Some have engaged
unemployed people in paid work to improve public services needed in the crisisand provided more
subsidised social services (e.g. early childhood services for children).
Bristol in the United Kingdom (UK), for example, is supporting and taking into consideration studies and
recommendations by civil society organisations addressing social disparities. One example is the work
conducted by the Bristol-based Black South West Network (BSWN), which has provided support to Black,
Asian and Minority Ethnic businesses, communities and organisations, through advice and monitoring of
the impact of the crisis on these communities (OECD, 2020[4]).
The use of digital tools
Digitalisation has been a crucial lever in cities’ response to the pandemic, with tools monitoring contagion
risk and, in some cases, ensuring the respect of confinement and social distancing, while also enabling
the continuity of services and economic activity. These tools and the changes in habits they have entailed
will remain a permanent component of cities’ recovery phase and increased preparedness for potential
new waves. This prompted reflections on issues of privacy rights and the universality of Internet access.
In terms of contact tracing and ensuring social distancing in Daegu, Korea, the epidemiological
investigation during the outbreak was able to use the smart city data hub to trace patient routes. Seoul,
Korea, used geo-localisation data, bank card usage and video surveillance. Other cities opted for less
individualised monitoring options, such as using urban data to observe collective density and mobility
patterns. For instance, Mexico City, Mexico, used a partnership with Google Maps and Waze to monitor
mobility trends and Budapest, Hungary, is using smart city tools to identify high concentrations of people.
The digital divide is one of the many inequalities exposed by COVID-19. Cities initially provided rapid or
temporary measures to try to bridge that gap. Boston in the United States (US) is working to address the
digital divide by providing high school students with a free “cell phone hotspot”. Boston and New York
schools have also provided tablets to students, though meeting demand has been a challenge and there
might be students who cannot access the Internet. In Yokohama, Japan, some school lessons were made
available on a local TV station. Milan, Italy, has launched a call for donations of devices or Internet
connections to schools. The city of Toronto, Canada, has partnered with information and communication
technology (ICT) companies to provide free temporary Internet access for low-income neighbourhoods,
long-term care homes and shelters.
Urban mobility
Mobility has been strongly impacted by the COVID-19 pandemic and has provided cities with the
momentum to rethink urban space and propose alternatives. For example, cities have been promoting
cycling. Moving into more long-term and permanent strategies, cities are now investing in active mobility
infrastructure, improved public transport safety and accessibility, and zero-emission transport options, such
as electric vehicles and scooters. Part II of this Regional Outlook report shows how important it is to take
these measures on a large scale across all cities to reach net-zero GHG emissions but also avoid
unnecessary costs, strengthen well-being, move towards a fairer allocation of urban space and thereby
strengthen cities’ international attractiveness and competitiveness.
While the impact of COVID-19 on public transport has been significant in most OECD countries, transport
systems have shown a remarkable capacity to enforce hygiene measures during lockdowns, thus
contributing to avoiding transport-related clusters. Many urban public transport systems ensured a
minimum level of service to facilitate distancing. Urban transport around the world has also faced
unprecedented low levels of ridership and corresponding losses in fare revenue.

40
OECD REGIONAL OUTLOOK 2021 © OECD 2021
Going forward, and as described in Part II, a diversification of public transport offers, including digital-
platform-based ride-sharing can help avoid congested public transport while reducing individual car use
and make it more responsive to demand in real time.
Urban planning and design
Cities are adapting urban design, reclaiming public space for citizens and rethinking the location of
essential urban functions to ensure easier access to services and amenities while securing safety and
health. Concepts such as the “15-minute city” have gained traction as a means to increase the quality and
sustainability of life in cities, by ensuring access to 6 essential functions in a short perimeter: to live, work,
supply, care, lean and enjoy. This can be well aligned with net-zero-emission strategies and boost well-
being beyond the pandemic, as accessibility is improved with less energy use in transport. This would need
to be built into a comprehensive urban net-zero transport concept, including transport pricing (Part II of this
Regional Outlook).
Montreal, Canada, is one of the many cities enabling social distancing through the extension of terraces
on sidewalks and pedestrianisation of streets. This further confirms the benefits of Montreal’s “human
scale” as the city is already a juxtaposition of neighbourhoods, each with easily accessible public services
and amenities.
Rural regions face specific vulnerabilities. Short-term responses during the COVID-19 crisis have focused
on emergency measures to improve health and access to medical services and other basic services in
rural areas. Improving digital infrastructure was another focal point. These have shed light on the high
vulnerability of rural regions, calling for specific measures for them. Bottom-up initiatives involving civil
society and voluntary support groups have emerged to support rural communities.
Health responses and improving access to the medical and other basic services
Several countries have mobilised health workers in different ways to ensure services in remote territories.
Initiatives range from making health services more accessible and delivering medical equipment, to
information and self-assessment tools for citizens, or bringing rural citizens closer to health services.
The European Union (EU) developed a platform containing a growing list of open-source software and
hardware solutions to assist medical staff, public administrations, businesses and citizens in their daily
activities.
In Mexico, a platform of about 300 professionals from different fields joined efforts to create and donate
3D-printed medical devices to rural hospitals. The platform has facilitated the donation of medical
equipment, such as masks and respirators, as well as monetary donations to supply the needs of local
hospitals.
Korea has provided on-demand services in locations where physical facilities are unavailable, as well as
improved medical services to all people regardless of location. The Korean government plans to transform
medium-sized regional hospitals into first-class medical institutions that can treat all kinds of diseases.
In Spain, in the Basque Country region, a programme relying on volunteers and the network of pharmacies
provides a service to the elderly population with chronic diseases and living alone, ensuring they will not
have to go to the pharmacy and thus avoid coronavirus exposure.
Other measures have ranged from securing food availability in rural areas, for example with networks of
local citizens/producers to deliver food and other basic products, assisting the elderly and solidarity
initiatives, providing emergency aid and maintaining essential services.

41
OECD REGIONAL OUTLOOK 2021 © OECD 2021
Improving digital infrastructure and accessibility
While 85% of urban households had access to 30 Mbps of broadband before the crisis, only 56% of rural
households had access.
The US has provided funding to entities seeking to deploy broadband in rural areas. The CARES
Act also allocated USD 25 million to the United States Department of Agriculture’s Distance
Learning and Telemedicine programme, helping rural communities by funding connectivity to
combat the effects of remoteness and low population density.
Poland has introduced an investment plan of EUR 6.6 billion to reinforce public investment
expenditure including a specific fund for the deployment of broadband networks.
The government of Austria created Digital Team Austria, a group of companies that will offer
services including online meetings, digital collaboration, cyber security and/or Internet access free
of charge for at least three months.
Korea has allocated funds for wider 5G wireless network coverage, development of next-
generation smartphone models and easing regulations to speed up innovation to foster the
transition to new telecommunication systems. This programme is part of a package of measures
that will generate an economic stimulus in a post-COVID-19 phase by relying heavily on artificial
intelligence (AI) and wireless telecommunication technology.
Managing the crisis across levels of government
“Strong co-ordination between all actors in charge of the response at central and regional levels is the
basis of an effective response” (WHO, 2020[5]). It has increasingly emerged that this requires leadership
and co-ordination by the national government and effective co-ordination mechanisms among levels of
government. On the health front, many countries have increasingly adopted territorial approaches to
response measures. On the economic front, governments have provided massive fiscal support to protect
businesses, households and vulnerable populations. Since March 2020, they have pledged to spend more
than USD 12 trillion globally. More than two-thirds of OECD countries have introduced measures to support
subnational finance on the spending and revenue sides and have relaxed fiscal rules.
The territorial approach to the health crisis and the role of subnational governments
Many countries have adopted local lockdowns to limit the large costs of national confinements. Effective
co-ordination among subnational authorities, health agencies and the central government are essential to
managing local outbreaks. Effective testing strategies with the tracing of contacts, combined with social
distancing can limit containment measures and reduce their economic impacts. They are best put in place
when caseloads are low, as part of a preventive approach to avoid rising caseloads which may then require
lockdowns. They require accurate data and information about infections and contacts at the local level, to
quickly deploy test results and trace contacts, as in Korea (Box 2.1).
European countries increased their capacities and generalised testing for suspicious cases when
caseloads had already reached high levels between May and November 2020 (Figure 2.1). In the EU27,
more than 6 million reverse transcription polymerase chain reaction (RT-PCR) tests were taken every week
in October compared to 1.5 million in April (OECD, 2020[2]). Subnational governments play a leading role
in implementing the “track, isolate, test and treat” strategy. To reduce the risk of new waves of COVID-19
outbreaks, 70%-90% of all people who have been in contact with an infected person need to be traced,
tested and isolated if infected. This is most effective when caseloads are still small, so requires a
preventive, anticipatory approach (OECD, 2020[6]).
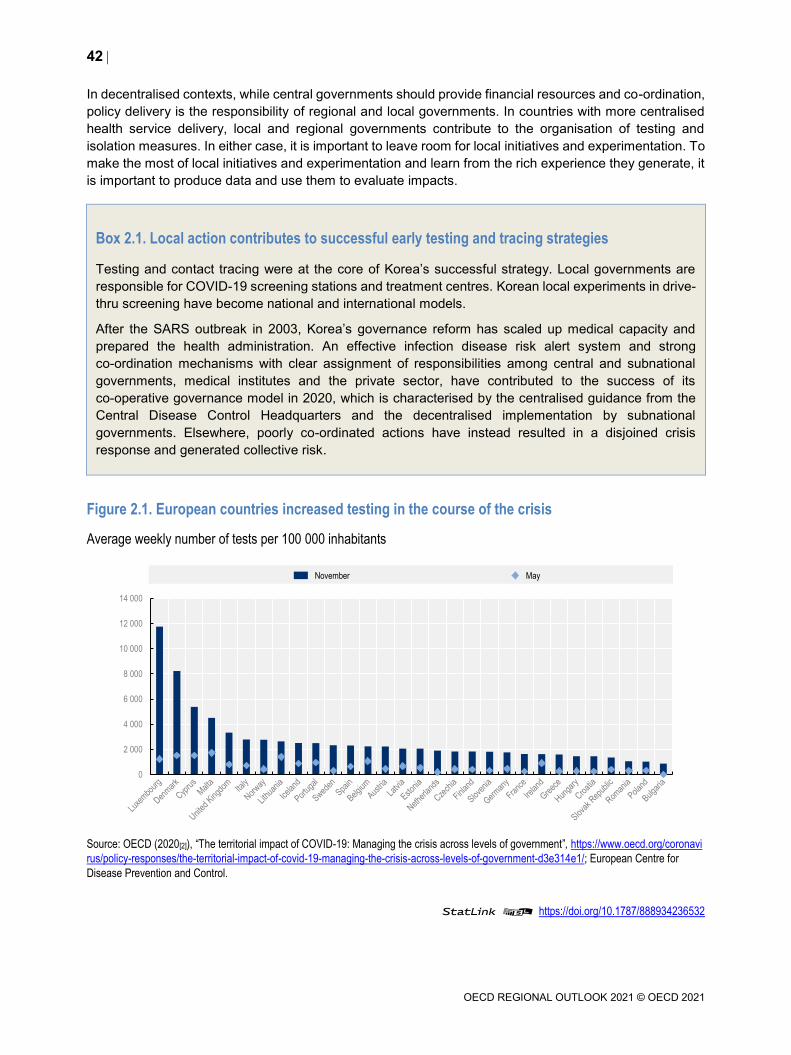
42
OECD REGIONAL OUTLOOK 2021 © OECD 2021
In decentralised contexts, while central governments should provide financial resources and co-ordination,
policy delivery is the responsibility of regional and local governments. In countries with more centralised
health service delivery, local and regional governments contribute to the organisation of testing and
isolation measures. In either case, it is important to leave room for local initiatives and experimentation. To
make the most of local initiatives and experimentation and learn from the rich experience they generate, it
is important to produce data and use them to evaluate impacts.
Box 2.1. Local action contributes to successful early testing and tracing strategies
Testing and contact tracing were at the core of Korea’s successful strategy. Local governments are
responsible for COVID-19 screening stations and treatment centres. Korean local experiments in drive-
thru screening have become national and international models.
After the SARS outbreak in 2003, Korea’s governance reform has scaled up medical capacity and
prepared the health administration. An effective infection disease risk alert system and strong
co-ordination mechanisms with clear assignment of responsibilities among central and subnational
governments, medical institutes and the private sector, have contributed to the success of its
co-operative governance model in 2020, which is characterised by the centralised guidance from the
Central Disease Control Headquarters and the decentralised implementation by subnational
governments. Elsewhere, poorly co-ordinated actions have instead resulted in a disjoined crisis
response and generated collective risk.
Figure 2.1. European countries increased testing in the course of the crisis
Average weekly number of tests per 100 000 inhabitants
Source: OECD (2020[2]), “The territorial impact of COVID-19: Managing the crisis across levels of government”, https://www.oecd.org/coronavi
rus/policy-responses/the-territorial-impact-of-covid-19-managing-the-crisis-across-levels-of-government-d3e314e1/; European Centre for
Disease Prevention and Control.
StatLink 2 https://doi.org/10.1787/888934236532
0
2 000
4 000
6 000
8 000
10 000
12 000
14 000
November May
43
OECD REGIONAL OUTLOOK 2021 © OECD 2021
Nearly all surveyed EU subnational governments consider co-ordination among all levels of government
in the design and implementation of measures very important for a successful crisis exit (Figure 2.2). Other
key factors they highlighted also relate to co-ordination, such as the possibility of adapting measures to
the local situation and the relationship between subnational governments, the private sector and the public.
Seventy-one percent of surveyed subnational governments highlighted that the lack of vertical and
horizontal co-ordination is among the biggest challenge in managing the health crisis (OECD-CoR, 2020[7]).
Vertical co-ordination among the national and subnational governments is the “first step of an effective
response”, as stated by the World Health Organization (WHO) at the pandemic’s outset. In places where
subnational governments operate with high degrees of autonomy, policy responses are more likely to be
fragmented (OECD, 2020[2]). There is a greater risk of operating with one-size-fits-all measures that may
not address local needs in more centralised countries. Crisis management tools in a broad range of policy
areas, including healthcare, social services, economic development and public investment, are shared
across levels of government and therefore require effective vertical co-ordination. Unilateral decisions
without prior consultation with all stakeholders spurred non-compliant behaviours and even large-scale
demonstrations in France, Italy, Spain, the UK and the US.
Horizontal co-ordination is as important as vertical co-ordination, particularly in decentralised and federal
countries where crisis responses are differentiated across territories (OECD, 2020[2]). Horizontal
co-ordination across jurisdictions allows addressing cross-jurisdictional issues and achieve economies of
scope. Some jurisdictions may face an immediate trade-off between adequately responding to the crisis
locally and supporting neighbouring jurisdictions with information (on infections and local measures) and
resources (equipment, personnel and funds). Going forward, cross-jurisdiction co-operation will be
essential to support the recovery process and avoid a fragmented approach to public investment.
New co-ordination platforms and associations of regional and local governments support
crisis management
Federal and unitary countries have introduced and mobilised vertical co-ordination mechanisms during the
pandemic. Newly created institutions have supported inter-governmental co-ordination in 8 out of
17 surveyed OECD countries (OECD, 2020[8]). The Risk Assessment Group and the Group of Experts in
charge of the Exit Strategy in Belgium and the New Emergency Management Office in Colombia for
example are providing such platforms. National associations of subnational governments are important to
foster vertical co-ordination efforts by disseminating information, identifying and sharing solutions and
supporting the implementation of emergency measures by their members (Box 2.2). The more
decentralised the country, the greater the need to mobilise co-ordination platforms to minimise the risk of
a fragmented policy response. Such platforms allow enhancing the evaluation of policy measures and
promoting feedback on what works and what issues emerge across different levels of government.
Box 2.2. Examples of vertical and horizontal co-ordination for crisis management
Associations of regional and local governments act as interlocutors between national and subnational
governments. They also co-ordinate efforts among their members, identify solutions and help
implement emergency measures. Regular dialogue between the national government and these
associations can be particularly valuable to address crisis-generated social and economic damage. In
Australia, the government introduced the National Cabinet to bring together the prime minister and first
ministers of Australian states and territories. In Chile, the Social Committee for COVID-19, formed by
representatives of municipal associations, government authorities, academics and professional from
the health sector, helped to strengthen the action plan. In Spain, the Conference of Presidents, a
multi-lateral co-operation body between the central government and the governments of the
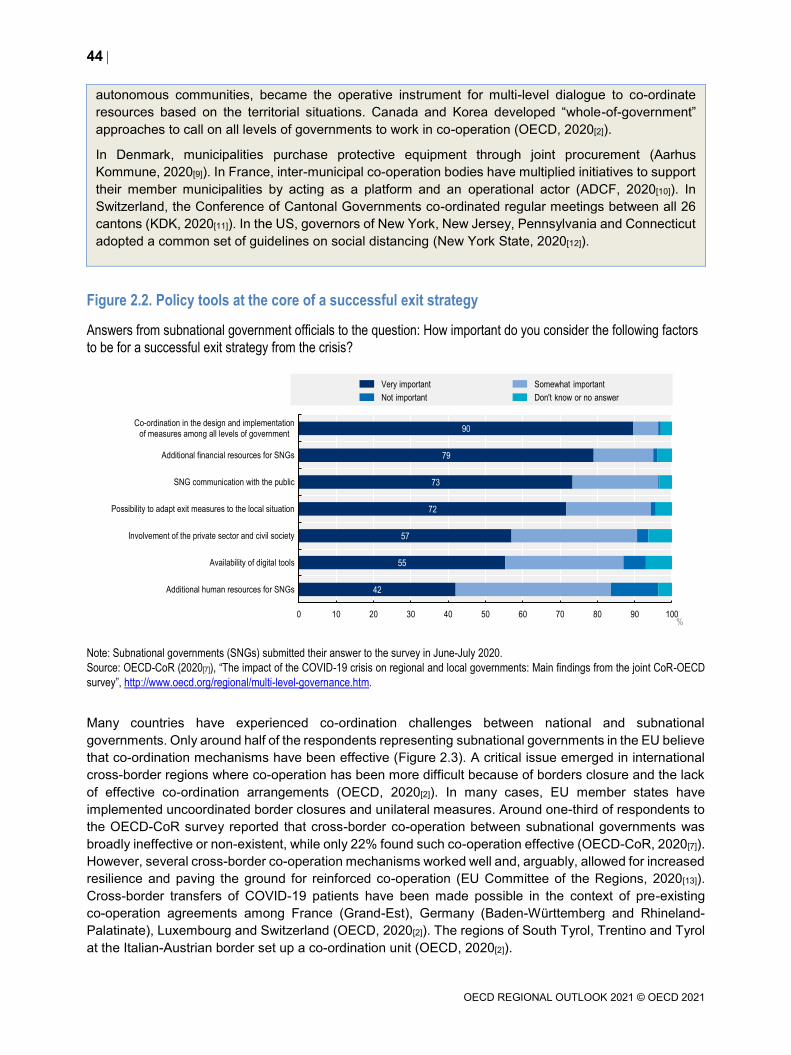
44
OECD REGIONAL OUTLOOK 2021 © OECD 2021
autonomous communities, became the operative instrument for multi-level dialogue to co-ordinate
resources based on the territorial situations. Canada and Korea developed “whole-of-government”
approaches to call on all levels of governments to work in co-operation (OECD, 2020[2]).
In Denmark, municipalities purchase protective equipment through joint procurement (Aarhus
Kommune, 2020[9]). In France, inter-municipal co-operation bodies have multiplied initiatives to support
their member municipalities by acting as a platform and an operational actor (ADCF, 2020[10]). In
Switzerland, the Conference of Cantonal Governments co-ordinated regular meetings between all 26
cantons (KDK, 2020[11]). In the US, governors of New York, New Jersey, Pennsylvania and Connecticut
adopted a common set of guidelines on social distancing (New York State, 2020[12]).
Figure 2.2. Policy tools at the core of a successful exit strategy
Answers from subnational government officials to the question: How important do you consider the following factors
to be for a successful exit strategy from the crisis?
Note: Subnational governments (SNGs) submitted their answer to the survey in June-July 2020.
Source: OECD-CoR (2020[7]), “The impact of the COVID-19 crisis on regional and local governments: Main findings from the joint CoR-OECD
survey”, http://www.oecd.org/regional/multi-level-governance.htm.
Many countries have experienced co-ordination challenges between national and subnational
governments. Only around half of the respondents representing subnational governments in the EU believe
that co-ordination mechanisms have been effective (Figure 2.3). A critical issue emerged in international
cross-border regions where co-operation has been more difficult because of borders closure and the lack
of effective co-ordination arrangements (OECD, 2020[2]). In many cases, EU member states have
implemented uncoordinated border closures and unilateral measures. Around one-third of respondents to
the OECD-CoR survey reported that cross-border co-operation between subnational governments was
broadly ineffective or non-existent, while only 22% found such co-operation effective (OECD-CoR, 2020[7]).
However, several cross-border co-operation mechanisms worked well and, arguably, allowed for increased
resilience and paving the ground for reinforced co-operation (EU Committee of the Regions, 2020[13]).
Cross-border transfers of COVID-19 patients have been made possible in the context of pre-existing
co-operation agreements among France (Grand-Est), Germany (Baden-Württemberg and Rhineland-
Palatinate), Luxembourg and Switzerland (OECD, 2020[2]). The regions of South Tyrol, Trentino and Tyrol
at the Italian-Austrian border set up a co-ordination unit (OECD, 2020[2]).
42
55
57
72
73
79
90
0 10 20 30 40 50 60 70 80 90 100
Additional human resources for SNGs
Availability of digital tools
Involvement of the private sector and civil society
Possibility to adapt exit measures to the local situation
SNG communication with the public
Additional financial resources for SNGs
Co-ordination in the design and implementationof measures among all levels of government
%
Very important Somewhat important
Not important Don't know or no answer
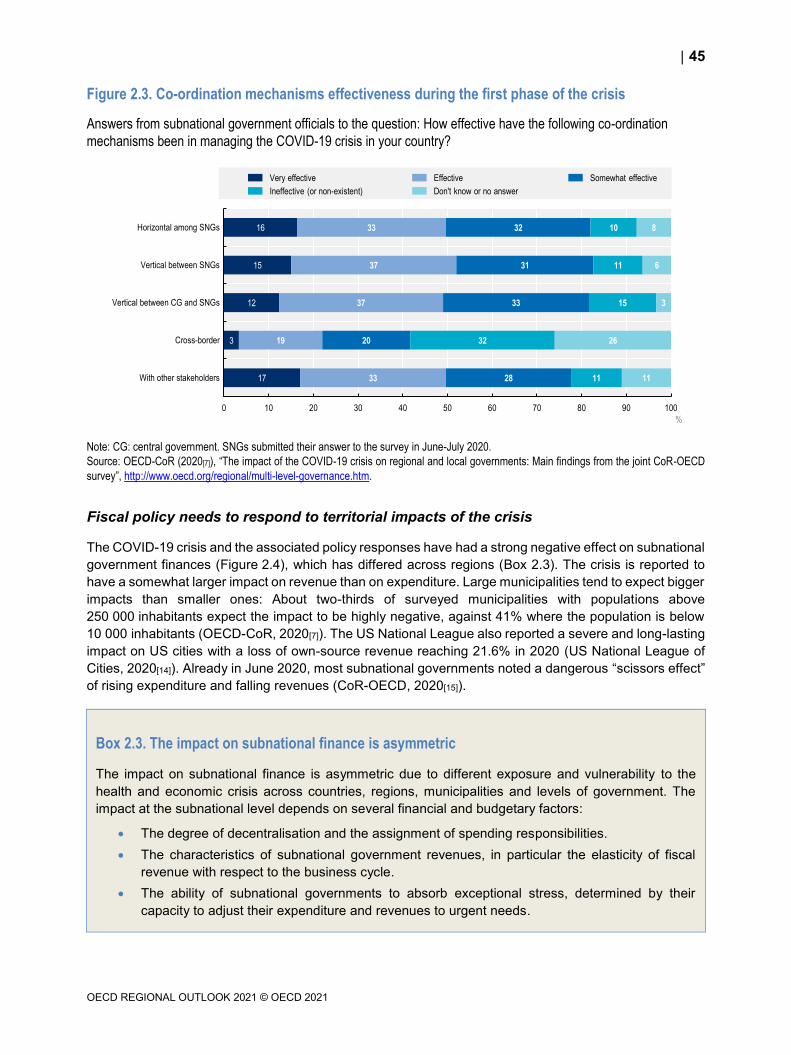
45
OECD REGIONAL OUTLOOK 2021 © OECD 2021
Figure 2.3. Co-ordination mechanisms effectiveness during the first phase of the crisis
Answers from subnational government officials to the question: How effective have the following co-ordination
mechanisms been in managing the COVID-19 crisis in your country?
Note: CG: central government. SNGs submitted their answer to the survey in June-July 2020.
Source: OECD-CoR (2020[7]), “The impact of the COVID-19 crisis on regional and local governments: Main findings from the joint CoR-OECD
survey”, http://www.oecd.org/regional/multi-level-governance.htm.
Fiscal policy needs to respond to territorial impacts of the crisis
The COVID-19 crisis and the associated policy responses have had a strong negative effect on subnational
government finances (Figure 2.4), which has differed across regions (Box 2.3). The crisis is reported to
have a somewhat larger impact on revenue than on expenditure. Large municipalities tend to expect bigger
impacts than smaller ones: About two-thirds of surveyed municipalities with populations above
250 000 inhabitants expect the impact to be highly negative, against 41% where the population is below
10 000 inhabitants (OECD-CoR, 2020[7]). The US National League also reported a severe and long-lasting
impact on US cities with a loss of own-source revenue reaching 21.6% in 2020 (US National League of
Cities, 2020[14]). Already in June 2020, most subnational governments noted a dangerous “scissors effect”
of rising expenditure and falling revenues (CoR-OECD, 2020[15]).
Box 2.3. The impact on subnational finance is asymmetric
The impact on subnational finance is asymmetric due to different exposure and vulnerability to the
health and economic crisis across countries, regions, municipalities and levels of government. The
impact at the subnational level depends on several financial and budgetary factors:
The degree of decentralisation and the assignment of spending responsibilities.
The characteristics of subnational government revenues, in particular the elasticity of fiscal
revenue with respect to the business cycle.
The ability of subnational governments to absorb exceptional stress, determined by their
capacity to adjust their expenditure and revenues to urgent needs.
17
3
12
15
16
33
19
37
37
33
28
20
33
31
32
11
32
15
11
10
11
26
3
6
8
0 10 20 30 40 50 60 70 80 90 100
With other stakeholders
Cross-border
Vertical between CG and SNGs
Vertical between SNGs
Horizontal among SNGs
%
Very effective Effective Somewhat effective
Ineffective (or non-existent) Don't know or no answer
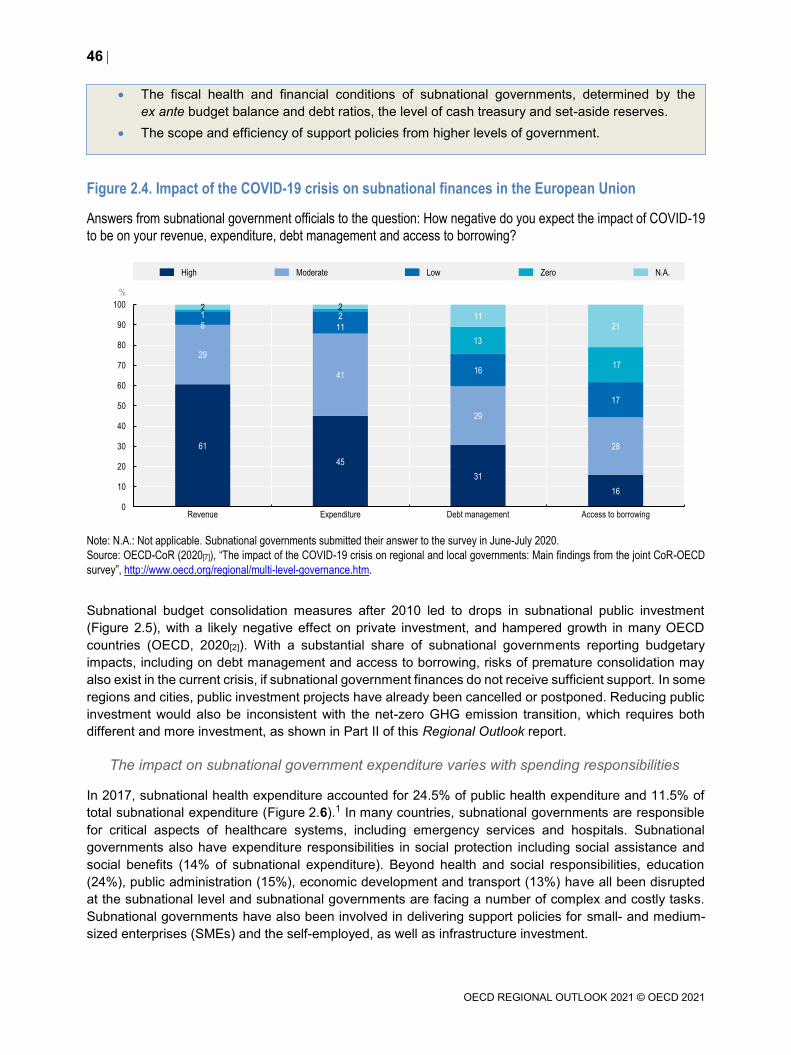
46
OECD REGIONAL OUTLOOK 2021 © OECD 2021
The fiscal health and financial conditions of subnational governments, determined by the
ex ante budget balance and debt ratios, the level of cash treasury and set-aside reserves.
The scope and efficiency of support policies from higher levels of government.
Figure 2.4. Impact of the COVID-19 crisis on subnational finances in the European Union
Answers from subnational government officials to the question: How negative do you expect the impact of COVID-19
to be on your revenue, expenditure, debt management and access to borrowing?
Note: N.A.: Not applicable. Subnational governments submitted their answer to the survey in June-July 2020.
Source: OECD-CoR (2020[7]), “The impact of the COVID-19 crisis on regional and local governments: Main findings from the joint CoR-OECD
survey”, http://www.oecd.org/regional/multi-level-governance.htm.
Subnational budget consolidation measures after 2010 led to drops in subnational public investment
(Figure 2.5), with a likely negative effect on private investment, and hampered growth in many OECD
countries (OECD, 2020[2]). With a substantial share of subnational governments reporting budgetary
impacts, including on debt management and access to borrowing, risks of premature consolidation may
also exist in the current crisis, if subnational government finances do not receive sufficient support. In some
regions and cities, public investment projects have already been cancelled or postponed. Reducing public
investment would also be inconsistent with the net-zero GHG emission transition, which requires both
different and more investment, as shown in Part II of this Regional Outlook report.
The impact on subnational government expenditure varies with spending responsibilities
In 2017, subnational health expenditure accounted for 24.5% of public health expenditure and 11.5% of
total subnational expenditure (Figure 2.6).1 In many countries, subnational governments are responsible
for critical aspects of healthcare systems, including emergency services and hospitals. Subnational
governments also have expenditure responsibilities in social protection including social assistance and
social benefits (14% of subnational expenditure). Beyond health and social responsibilities, education
(24%), public administration (15%), economic development and transport (13%) have all been disrupted
at the subnational level and subnational governments are facing a number of complex and costly tasks.
Subnational governments have also been involved in delivering support policies for small- and medium-
sized enterprises (SMEs) and the self-employed, as well as infrastructure investment.
61
45
31
16
29
41
29
28
6 11
16
17
1 2
13
17
2 211
21
0
10
20
30
40
50
60
70
80
90
100
Revenue Expenditure Debt management Access to borrowing
%
High Moderate Low Zero N.A.
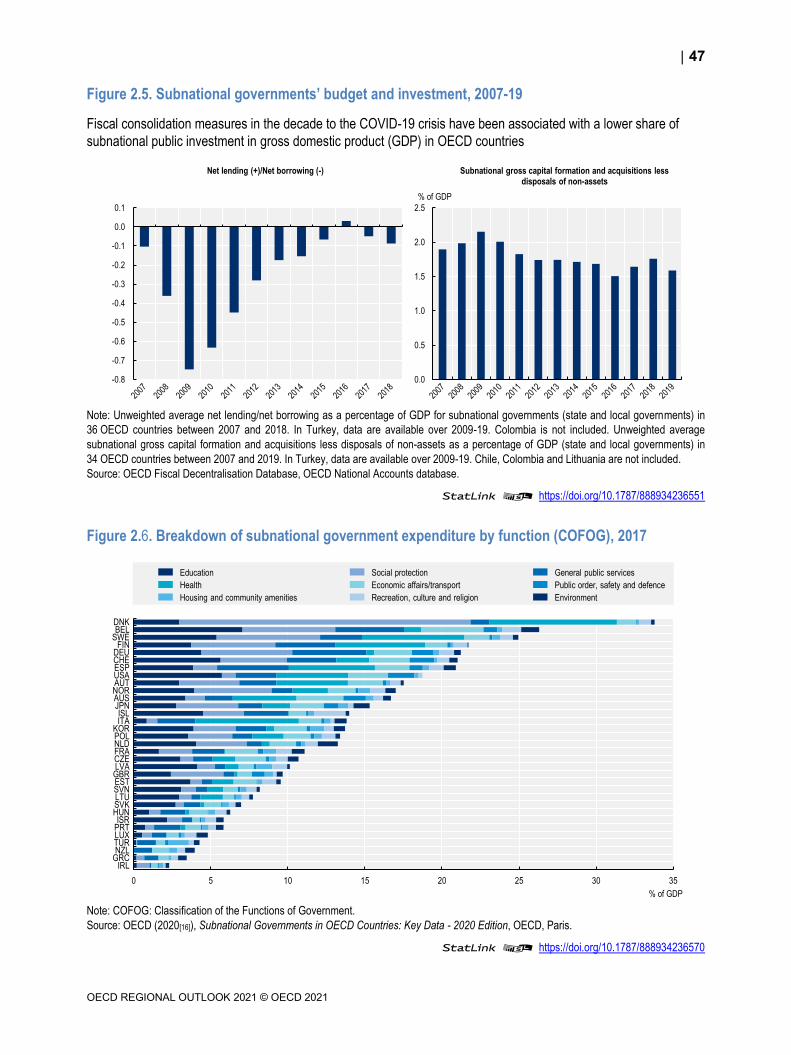
47
OECD REGIONAL OUTLOOK 2021 © OECD 2021
Figure 2.5. Subnational governments’ budget and investment, 2007-19
Fiscal consolidation measures in the decade to the COVID-19 crisis have been associated with a lower share of
subnational public investment in gross domestic product (GDP) in OECD countries
Note: Unweighted average net lending/net borrowing as a percentage of GDP for subnational governments (state and local governments) in
36 OECD countries between 2007 and 2018. In Turkey, data are available over 2009-19. Colombia is not included. Unweighted average
subnational gross capital formation and acquisitions less disposals of non-assets as a percentage of GDP (state and local governments) in
34 OECD countries between 2007 and 2019. In Turkey, data are available over 2009-19. Chile, Colombia and Lithuania are not included.
Source: OECD Fiscal Decentralisation Database, OECD National Accounts database.
StatLink 2 https://doi.org/10.1787/888934236551
Figure 2.6. Breakdown of subnational government expenditure by function (COFOG), 2017
Note: COFOG: Classification of the Functions of Government.
Source: OECD (2020[16]), Subnational Governments in OECD Countries: Key Data - 2020 Edition, OECD, Paris.
StatLink 2 https://doi.org/10.1787/888934236570
-0.8
-0.7
-0.6
-0.5
-0.4
-0.3
-0.2
-0.1
0.0
0.1
Net lending (+)/Net borrowing (-)
0.0
0.5
1.0
1.5
2.0
2.5
% of GDP
Subnational gross capital formation and acquisitions less disposals of non-assets
0 5 10 15 20 25 30 35
IRLGRCNZLTURLUXPRTISR
HUNSVKLTUSVNESTGBRLVACZEFRANLDPOLKOR
ITAISL
JPNAUSNORAUTUSAESPCHEDEUFIN
SWEBELDNK
% of GDP
Education Social protection General public services
Health Economic affairs/transport Public order, safety and defence
Housing and community amenities Recreation, culture and religion Environment
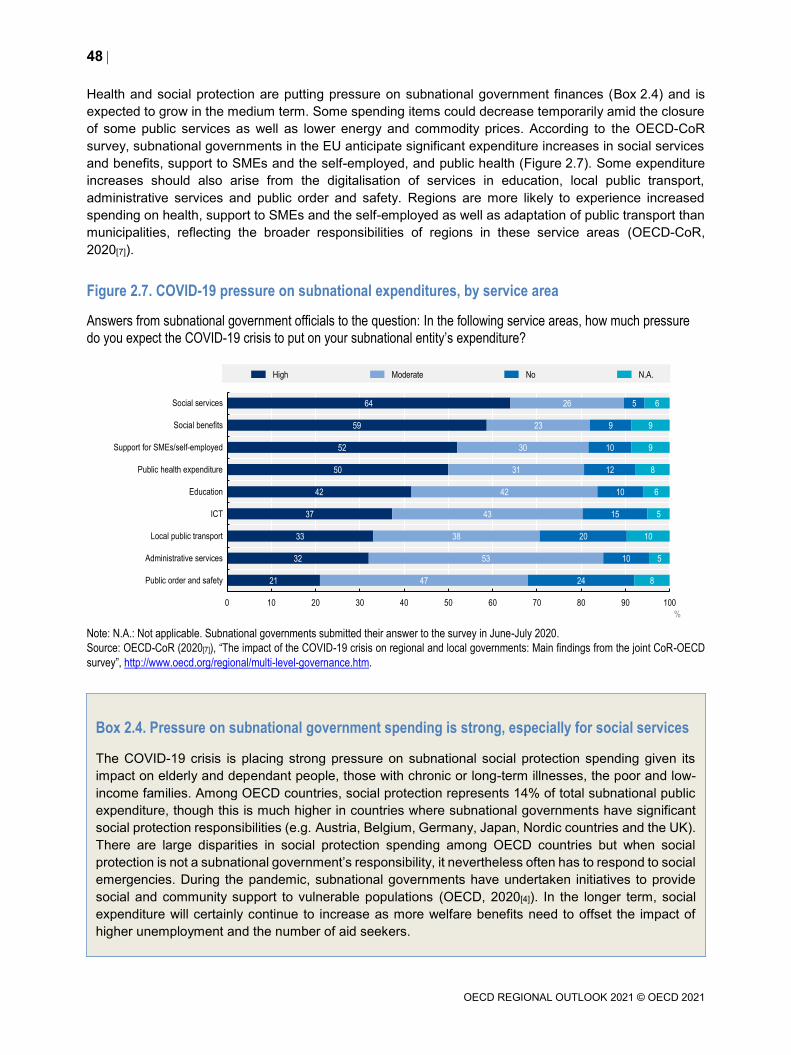
48
OECD REGIONAL OUTLOOK 2021 © OECD 2021
Health and social protection are putting pressure on subnational government finances (Box 2.4) and is
expected to grow in the medium term. Some spending items could decrease temporarily amid the closure
of some public services as well as lower energy and commodity prices. According to the OECD-CoR
survey, subnational governments in the EU anticipate significant expenditure increases in social services
and benefits, support to SMEs and the self-employed, and public health (Figure 2.7). Some expenditure
increases should also arise from the digitalisation of services in education, local public transport,
administrative services and public order and safety. Regions are more likely to experience increased
spending on health, support to SMEs and the self-employed as well as adaptation of public transport than
municipalities, reflecting the broader responsibilities of regions in these service areas (OECD-CoR,
2020[7]).
Figure 2.7. COVID-19 pressure on subnational expenditures, by service area
Answers from subnational government officials to the question: In the following service areas, how much pressure
do you expect the COVID-19 crisis to put on your subnational entity’s expenditure?
Note: N.A.: Not applicable. Subnational governments submitted their answer to the survey in June-July 2020.
Source: OECD-CoR (2020[7]), “The impact of the COVID-19 crisis on regional and local governments: Main findings from the joint CoR-OECD
survey”, http://www.oecd.org/regional/multi-level-governance.htm.
Box 2.4. Pressure on subnational government spending is strong, especially for social services
The COVID-19 crisis is placing strong pressure on subnational social protection spending given its
impact on elderly and dependant people, those with chronic or long-term illnesses, the poor and low-
income families. Among OECD countries, social protection represents 14% of total subnational public
expenditure, though this is much higher in countries where subnational governments have significant
social protection responsibilities (e.g. Austria, Belgium, Germany, Japan, Nordic countries and the UK).
There are large disparities in social protection spending among OECD countries but when social
protection is not a subnational government’s responsibility, it nevertheless often has to respond to social
emergencies. During the pandemic, subnational governments have undertaken initiatives to provide
social and community support to vulnerable populations (OECD, 2020[4]). In the longer term, social
expenditure will certainly continue to increase as more welfare benefits need to offset the impact of
higher unemployment and the number of aid seekers.
21
32
33
37
42
50
52
59
64
47
53
38
43
42
31
30
23
26
24
10
20
15
10
12
10
9
5
8
5
10
5
6
8
9
9
6
0 10 20 30 40 50 60 70 80 90 100
Public order and safety
Administrative services
Local public transport
ICT
Education
Public health expenditure
Support for SMEs/self-employed
Social benefits
Social services
%
High Moderate No N.A.
49
OECD REGIONAL OUTLOOK 2021 © OECD 2021
Regional and local governments have differentiated responsibilities in health services. Therefore, the
crisis will have a differentiated impact within the subnational government sector. In most federal
countries, healthcare is a major responsibility of state governments, which are responsible for
secondary care, hospitals and specialised medical services. The role of municipalities in healthcare
generally concentrates on primary care centres and prevention. However, in some countries,
municipalities or inter-municipal co-operation bodies may have wide responsibilities in healthcare
services and infrastructure. In the EU, 69% of responding regional governments reported facing high
pressure on their health expenditure, compared to 44% of municipalities, likely reflecting their broader
responsibilities in this area in many EU countries (OECD-CoR, 2020[7]). In unitary countries, the role of
regional governments may be also significant (e.g. Denmark, Italy and Sweden).
Economic affairs2 represent 13.6% of subnational spending in the OECD on average. Subnational
governments in the OECD account for approximately 34% of total public spending in this area, although
in some countries, more than 50%, e.g. in Australia, Belgium, Japan and Spain, and even 69% in
the US. Some subnational governments are supporting their local economies, notably SMEs, the
self-employed, informal workers and highly affected sectors. In the longer term, subnational
governments may be further mobilised to participate in stimulus packages targeting public investment.
The impact on subnational government revenue depends on the structure of subnational
government revenue
In countries where subnational governments are largely funded by central government transfers
(e.g. Estonia, Lithuania, Mexico, the Slovak Republic), the negative impact may be smaller than in federal
countries where most transfers to local governments come from state governments that may not be able
to sustain their transfers (Chernick, Copeland and Reschovsky, 2020[17]). Impacts will vary with revenue
structure (Box 2.5). Historical elasticities of subnational government revenue to the business cycle do not
allow to accurately forecast future revenue even if projected GDP growth and output gaps were accurate
(OECD, 2020[8]). Country-level elasticities of subnational government revenue with respect to the business
cycle have been estimated in previous cycles. The current crisis is different because economic sectors are
asymmetrically affected by government response measures, particularly restrictions on mobility and
gatherings, in a way that has never been observed (OECD, 2020[18]). Therefore, within countries, changes
in individual subnational government revenue will depend on the regional economy and tax base exposure
to affected industries, stimulus plans, as well as backward and forward participation in global value chains.
The COVID-19 pandemic is expected to result in a strong drop in shared and own-source tax revenue.
Declining economic activity, employment and consumption arising from COVID-19, and particularly
containment measures, will automatically reduce receipts from personal income tax (PIT), corporate
income tax (CIT) and value added tax (VAT). CIT and VAT may be more affected than PIT as national
governments have supported personal income and saving has risen in some countries. Measures such as
tax breaks, exemptions, deferrals and tax rate cuts decided in stimulus packages will lower tax receipts,
as will increasing non-payment, for example because of bankruptcy. As subnational government revenues
are often based on the previous year (e.g. income taxes), most will see the situation worsen in 2021 and
even 2022. Other subnational taxes may be affected by the recession and fiscal policy decisions: taxes on
businesses (Austria, France, Germany and Luxembourg), economic activities (Italy, Japan, Korea), real
estate activities, consumption and commodities. Recurrent property taxes on buildings and businesses are
less volatile but were sometimes waved to support businesses. Nevertheless, any correction on land and
real estate prices or higher bankruptcies rates would inevitably lead to decreasing revenues in 2021 and
2022.

50
OECD REGIONAL OUTLOOK 2021 © OECD 2021
The closure of public facilities and less public transport use have reduced revenues from user charges and
fees. Drops in such revenue could be compounded by a rise in unpaid fees. Income from physical and
financial assets, such as rental revenues, dividends from local public companies, sales of land and royalty
revenues have dipped when economies went into lockdowns. The global negative demand shock for raw
materials has pushed down prices and output but a strong recovery could be supportive in 2021.
Subnational governments dependent on revenue from oil production may also experience a substantial
revenue decline in 2020, e.g. in Australia, Canada, Mexico and Norway (S&P Global Ratings, 2020[19]).
About two-thirds of subnational governments are anticipating a decline in property income.
Box 2.5. Revenue impacts will vary with revenue structure
In countries where subnational government revenue comes mainly from taxes, user charges, fees and
income from assets, the impact may be even larger (Figure 2.8), although this depends on the sensitivity
of tax bases to the economic activity and policy decisions. In the EU, subnational tax revenue is
anticipated to be the most affected revenue source, followed by tariffs and fees (OECD-CoR, 2020[7]).
Grants and subsidies, as well as property income, are expected to decrease to a lesser extent
(Figure 2.9) (OECD-CoR, 2020[7]).
Figure 2.8. Sources of subnational government revenues vary across countries
Breakdown of subnational government revenues by category, percentage of total revenue, 2018
Note: Australia and Chile: estimates from IMF Government Finance Statistics. 2017 data.
Source: OECD (2020[16]), Subnational Governments in OECD Countries: Key Data - 2020 Edition, OECD, Paris.
StatLink 2 https://doi.org/10.1787888934236589
0 10 20 30 40 50 60 70 80 90 100
ESTLTUSVKMEXNLDTURAUTGBR
IRLGRCBELITA
KORPOLAUSHUN
OECD27 (UWA)LUX
OECD36 (UWA)DNK
OECD9 (UWA)OECD27 (WA)
NORESP
EU28 (WA)SVNISR
PRTCHL
OECD36 (WA)CZEFIN
OECD9 (WA)JPNUSANZL
SWECANFRACHEDEULVAISL
%
Taxes Grants and subsidies Tariffs and fees
Property income Social contributions

51
OECD REGIONAL OUTLOOK 2021 © OECD 2021
Figure 2.9. Impact on subnational revenue, by revenue source
Answers from subnational government officials to the question: Relative to pre-crisis projections, what impact do
you expect on the revenues of your subnational entity?
Note: Subnational governments submitted their answer to the survey in June-July 2020.
Source: OECD-CoR (2020[7]), “The impact of the COVID-19 crisis on regional and local governments: Main findings from the joint CoR-
OECD survey”, http://www.oecd.org/regional/multi-level-governance.htm.
Subnational government debt is rising substantially
The strong decrease in revenues, combined with a marked increase in expenditure is leading to higher
subnational government deficits and debt, as in the wake of the 2008 crisis (OECD, 2020[20]; 2013[21]) albeit
with likely more asymmetric and generally bigger effects than back then. Short-term borrowing to bridge
delays in revenue and cover a lack of liquidity has already significantly increased in some countries. Many
national governments have facilitated subnational government access to short-term borrowing and credit
lines, including specific COVID-19 credit lines. By June 2020, 15% of surveyed subnational governments
in the EU had increased borrowing to cope with the crisis and 24% were planning to increase borrowing
(Figure 2.10). Short-term and emergency loans represented more than half of new subnational government
borrowing in the EU in June 2020.
Long-term borrowing is also expected to increase, including finance recovery programmes. Several
governments have relaxed regulatory constraints on long-term borrowing, notably on capital markets.
Stimulus measures and automatic stabilisers have increased deficits while GDP decreased in most
economies in 2020. As a result, general government debt-to-GDP ratios will rise by an average of
15.7 percentage points in 2020 according to the IMF October 2020 Fiscal Monitor. Global subnational
annual gross borrowing grew in 2020 by about 29% to USD 2.2 trillion, mostly because of the crisis (S&P
Global Ratings, 2020[22]). Australia, Canada, China, Germany and Japan would make up about two-thirds
of gross subnational borrowing in 2020 because subnational governments, particularly regions and large
cities, have applied countercyclical fiscal policies (S&P Global Ratings, 2020[22]). Subnational
governments’ debt-to-GDP ratios of these countries were already above the OECD average before the
pandemic. Poor fiscal performance and creditworthiness may hinder access to new borrowing, although
central banks have pledged to ease monetary conditions and ensure low interest rates (OECD, 2020[18]).
21
21
35
55
42
25
36
28
20
16
16
7
2
24
4
3
15
14
10
7
0 10 20 30 40 50 60 70 80 90 100
Property income
Grants and subsidies
Tariffs and fees
Taxes
%
Large decrease Moderate decrease No change
Increase Don't know or no answer
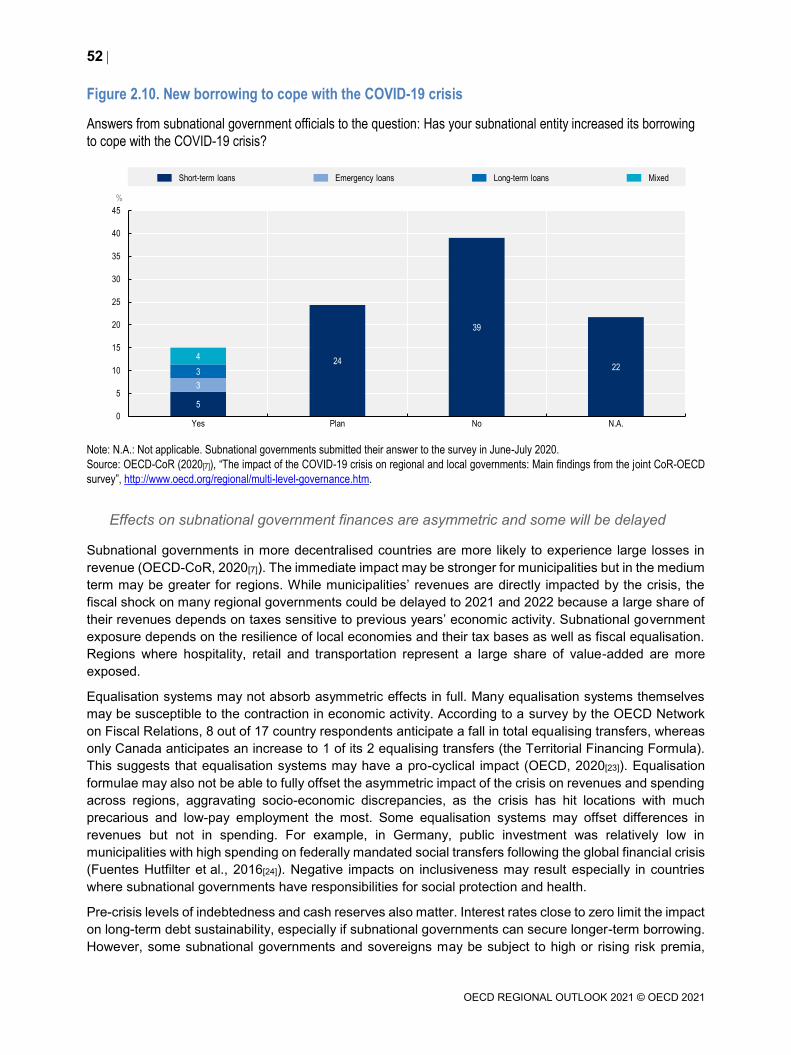
52
OECD REGIONAL OUTLOOK 2021 © OECD 2021
Figure 2.10. New borrowing to cope with the COVID-19 crisis
Answers from subnational government officials to the question: Has your subnational entity increased its borrowing
to cope with the COVID-19 crisis?
Note: N.A.: Not applicable. Subnational governments submitted their answer to the survey in June-July 2020.
Source: OECD-CoR (2020[7]), “The impact of the COVID-19 crisis on regional and local governments: Main findings from the joint CoR-OECD
survey”, http://www.oecd.org/regional/multi-level-governance.htm.
Effects on subnational government finances are asymmetric and some will be delayed
Subnational governments in more decentralised countries are more likely to experience large losses in
revenue (OECD-CoR, 2020[7]). The immediate impact may be stronger for municipalities but in the medium
term may be greater for regions. While municipalities’ revenues are directly impacted by the crisis, the
fiscal shock on many regional governments could be delayed to 2021 and 2022 because a large share of
their revenues depends on taxes sensitive to previous years’ economic activity. Subnational government
exposure depends on the resilience of local economies and their tax bases as well as fiscal equalisation.
Regions where hospitality, retail and transportation represent a large share of value-added are more
exposed.
Equalisation systems may not absorb asymmetric effects in full. Many equalisation systems themselves
may be susceptible to the contraction in economic activity. According to a survey by the OECD Network
on Fiscal Relations, 8 out of 17 country respondents anticipate a fall in total equalising transfers, whereas
only Canada anticipates an increase to 1 of its 2 equalising transfers (the Territorial Financing Formula).
This suggests that equalisation systems may have a pro-cyclical impact (OECD, 2020[23]). Equalisation
formulae may also not be able to fully offset the asymmetric impact of the crisis on revenues and spending
across regions, aggravating socio-economic discrepancies, as the crisis has hit locations with much
precarious and low-pay employment the most. Some equalisation systems may offset differences in
revenues but not in spending. For example, in Germany, public investment was relatively low in
municipalities with high spending on federally mandated social transfers following the global financial crisis
(Fuentes Hutfilter et al., 2016[24]). Negative impacts on inclusiveness may result especially in countries
where subnational governments have responsibilities for social protection and health.
Pre-crisis levels of indebtedness and cash reserves also matter. Interest rates close to zero limit the impact
on long-term debt sustainability, especially if subnational governments can secure longer-term borrowing.
However, some subnational governments and sovereigns may be subject to high or rising risk premia,
5
24
39
22
3
3
4
0
5
10
15
20
25
30
35
40
45
Yes Plan No N.A.
%
Short-term loans Emergency loans Long-term loans Mixed
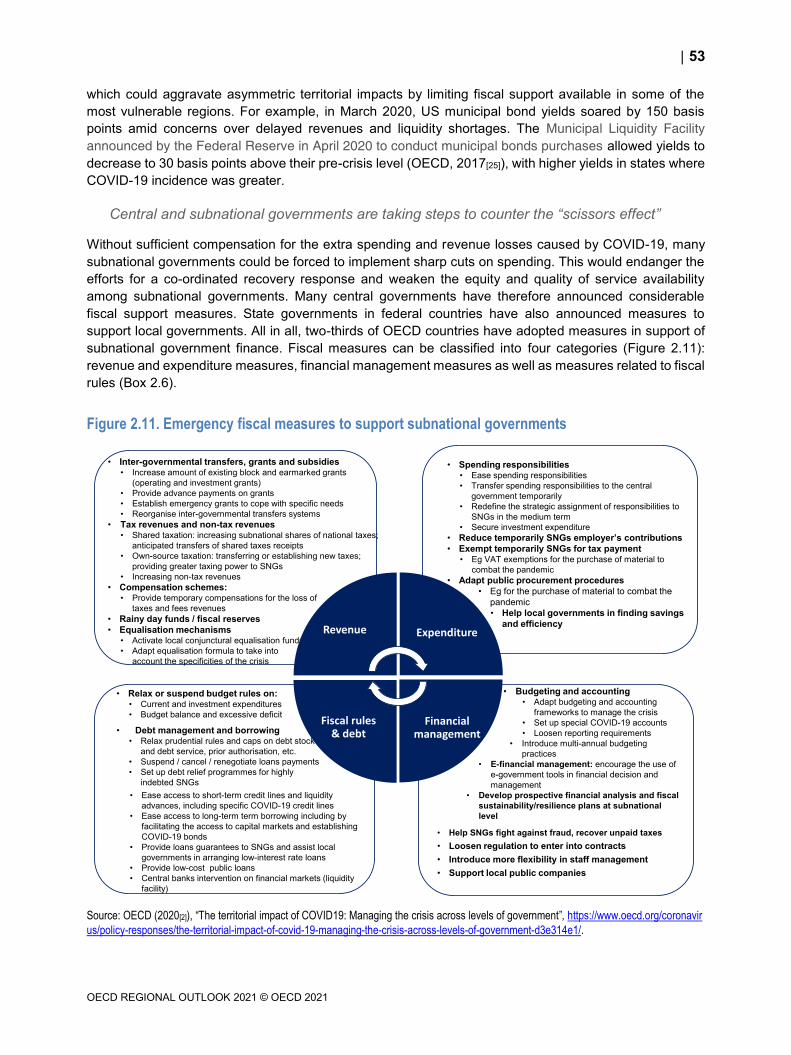
53
OECD REGIONAL OUTLOOK 2021 © OECD 2021
which could aggravate asymmetric territorial impacts by limiting fiscal support available in some of the
most vulnerable regions. For example, in March 2020, US municipal bond yields soared by 150 basis
points amid concerns over delayed revenues and liquidity shortages. The Municipal Liquidity Facility
announced by the Federal Reserve in April 2020 to conduct municipal bonds purchases allowed yields to
decrease to 30 basis points above their pre-crisis level (OECD, 2017[25]), with higher yields in states where
COVID-19 incidence was greater.
Central and subnational governments are taking steps to counter the “scissors effect”
Without sufficient compensation for the extra spending and revenue losses caused by COVID-19, many
subnational governments could be forced to implement sharp cuts on spending. This would endanger the
efforts for a co-ordinated recovery response and weaken the equity and quality of service availability
among subnational governments. Many central governments have therefore announced considerable
fiscal support measures. State governments in federal countries have also announced measures to
support local governments. All in all, two-thirds of OECD countries have adopted measures in support of
subnational government finance. Fiscal measures can be classified into four categories (Figure 2.11):
revenue and expenditure measures, financial management measures as well as measures related to fiscal
rules (Box 2.6).
Figure 2.11. Emergency fiscal measures to support subnational governments
Source: OECD (2020[2]), “The territorial impact of COVID19: Managing the crisis across levels of government”, https://www.oecd.org/coronavir
us/policy-responses/the-territorial-impact-of-covid-19-managing-the-crisis-across-levels-of-government-d3e314e1/.
• Relax or suspend budget rules on:• Current and investment expenditures
• Budget balance and excessive deficit
• Debt management and borrowing• Relax prudential rules and caps on debt stock
and debt service, prior authorisation, etc.
• Suspend / cancel / renegotiate loans payments
• Set up debt relief programmes for highly
indebted SNGs
• Spending responsibilities• Ease spending responsibilities
• Transfer spending responsibilities to the central
government temporarily
• Redefine the strategic assignment of responsibilities to
SNGs in the medium term
• Secure investment expenditure
• Reduce temporarily SNGs employer’s contributions
• Exempt temporarily SNGs for tax payment• Eg VAT exemptions for the purchase of material to
combat the pandemic
• Adapt public procurement procedures
• Eg for the purchase of material to combat the
pandemic
• Help local governments in finding savings
and efficiency
• Inter-governmental transfers, grants and subsidies• Increase amount of existing block and earmarked grants
(operating and investment grants)
• Provide advance payments on grants
• Establish emergency grants to cope with specific needs
• Reorganise inter-governmental transfers systems
• Tax revenues and non-tax revenues• Shared taxation: increasing subnational shares of national taxes;
anticipated transfers of shared taxes receipts
• Own-source taxation: transferring or establishing new taxes;
providing greater taxing power to SNGs
• Increasing non-tax revenues
• Compensation schemes: • Provide temporary compensations for the loss of
taxes and fees revenues
• Rainy day funds / fiscal reserves
• Equalisation mechanisms• Activate local conjunctural equalisation funds
• Adapt equalisation formula to take into
account the specificities of the crisis
ExpenditureRevenue
Fiscal rules & debt
Financial management
• Budgeting and accounting• Adapt budgeting and accounting
frameworks to manage the crisis
• Set up special COVID-19 accounts
• Loosen reporting requirements
• Introduce multi-annual budgeting
practices
• E-financial management: encourage the use of
e-government tools in financial decision and
management
• Develop prospective financial analysis and fiscal
sustainability/resilience plans at subnational
level
• Help SNGs fight against fraud, recover unpaid taxes
• Loosen regulation to enter into contracts
• Introduce more flexibility in staff management
• Support local public companies
• Ease access to short-term credit lines and liquidity
advances, including specific COVID-19 credit lines
• Ease access to long-term term borrowing including by
facilitating the access to capital markets and establishing
COVID-19 bonds
• Provide loans guarantees to SNGs and assist local
governments in arranging low-interest rate loans
• Provide low-cost public loans
• Central banks intervention on financial markets (liquidity
facility)
54
OECD REGIONAL OUTLOOK 2021 © OECD 2021
Box 2.6. Providing fiscal relief to subnational governments
Fiscal rules are generally pro-cyclical when they are rigid. Such rules may be relaxed during a crisis,
along two lines: i) formal escape clauses can be triggered by prescribed circumstances; ii) effective
suspension can be announced when it is unreasonable to expect subnational governments to comply
(OECD, 2020[23]). During the pandemic, revenue measures have been applied and fiscal rules have
been suspended frequently; in the EU, 46% of responding subnational governments reported that some
fiscal rules have been relaxed and 18% that they will be in the near term (OECD-CoR, 2020[7]).
Extraordinary grants to subnational governments can compensate for tax revenue losses and increased
expenditure. They are more appropriate than temporary recentralisation of public services or local tax
rates hikes because they allow for a place-based approach and foster local aggregate demand. As an
immediate response, support from higher levels of government in the form of grants is the most common
measure taken across OECD countries (OECD, 2020[23]). However, future consolidation plans loom.
Reforms that ensure the stability, operational capacity and resilience of subnational finance are
important and should be carefully planned and implemented, especially where subnational regions have
an important role to play in providing social protection.
In countries where fiscal co-ordination is already well developed and effective, support measures have
been developed and discussed between responsible national ministries and representatives of
subnational governments. Formal or informal agreements in several countries with the national
associations of subnational governments provide urgent support, compensation schemes and other
financial measures. Support can also be indirect, such as to public transport, energy and other
subnational-government-owned utility companies.
Public investment can contribute to recovery and reduce upcoming risks
Immediate fiscal responses to COVID-19 granted financial and liquidity support to firms, their workers and
households. Since June, many national governments have announced large economic recovery packages,
much larger than in 2008, focusing on public investment. These investment recovery packages are
prioritising: i) the strengthening of healthcare systems; ii) digitalisation diffusion; iii) the transition to a
carbon-neutral economy (OECD, 2020[2]). The OECD and the International Monetary Fund (IMF) have
made a strong call to scale up public investment to address the challenges to the COVID-19 recovery.
Subnational governments play a key role, as they are responsible for 57% of public investment in OECD
countries. It is crucial that recovery packages are consistent with the transition to net-zero GHG emissions,
targeted by most OECD countries by 2050, to avoid a global climate crisis and make sure investment
remains productive over the next ten years and beyond. As argued below, this consistency is not yet
achieved.
In June 2020, 31% of surveyed EU subnational governments were actively providing public investment
stimulus measures and 30% direct support to the local economy. Only 9% were doing both, suggesting
that in the early phase of the recovery, there was a trade-off between short-term direct support and longer-
term public investment stimulus (OECD-CoR, 2020[7]). In the EU, 40% of responding regions were
providing public investment stimulus and 26% of responding municipalities. While near-zero interest rates
make a strong case for resorting to deficit spending to provide both direct support and public investment,
these trade-offs and the large amounts of public funds disbursed reinforce the case for improving data, so
support is provided to households and firms most in need and spending is effective in achieving near-term
and long-term targets.
The OECD estimates that a 1% GDP increase in public investment in advanced economies and emerging
markets could spur GDP by 0.8% in normal times but more likely by 1% in crisis times across G7 countries,
55
OECD REGIONAL OUTLOOK 2021 © OECD 2021
though impacts vary depending on openness, monetary stance and capacity to borrow without rising risk
premia (OECD, 2018[26]). It could create between 20 and 33 million jobs, directly and indirectly (IMF,
2020[27]). Local, regional and national governments should invest in post-crisis priorities in health,
digitalisation and environment infrastructure (OECD, forthcoming[28]). The EU Recovery plan is providing
funds to this end (Box 2.7).
As highlighted by the OECD Recommendation on Effective Public Investment Across Levels of
Government (2014[29]), the impact of public investment depends on how governments manage this shared
competency across levels of government. Several tools can strengthen the coherence of infrastructure
investment among levels of government, such as co-financing arrangements, contracts between levels of
government, formal consultation processes, national agencies or representatives working with subnational
areas, or other forms of regular inter-governmental dialogue. Seeking complementarities across sectors
into integrated strategies allows more efficient use of public resources and mutually reinforcing
investments, for example in housing and transport networks (OECD, forthcoming[28]).
The demand for infrastructure was already high before the COVID-19 crisis. The OECD has estimated that
globally USD 95 trillion in public and private investment will be needed in energy, transport, water and
telecommunications infrastructure between 2016 and 2030 (OECD, 2017[25]). In view of the long-lived
nature of infrastructure, it is critical that infrastructure investment is undertaken in a way that is consistent
with the net-zero GHG emission objectives adopted by most OECD countries for 2050, otherwise
budgetary and environmental sustainability are compromised. Cities and regions have important needs for
maintenance and new investment in renewable energy, low-carbon buildings, energy efficiency, waste and
pollution management systems and clean public transport. As argued in Part II of this Regional Outlook
report, government spending plans need to be aligned with climate policy scenario analysis, backcasting
infrastructure requirements using the 2050 net-zero GHG emissions objective as a starting point.
Investment stimulus projects need to be well thought through and appraised to be consistent with long-
term targets. This may be a challenge after many years of budgetary consolidation and may require
investing in the capacity of local and regional governments to define and implement such investment
projects.
Employment gains from redirecting and boosting investment so economic activity becomes consistent with
the net-zero transition can relieve the economic impacts of the COVID-19 crisis (Unsworth et al., 2020[30]).
Short-term employment opportunities include accelerated wind turbine installation and operation,
construction and operation of electric vehicle charging infrastructure, active mobility infrastructure and pilot
projects to scale up hydrogen production as well as research and development (R&D) in industrial zero-
emission consistent production. COVID-19 fiscal recovery packages could accelerate progress on the net-
zero transition also with energy-efficient retrofits in buildings (Hepburn et al., 2020[31]). When investing in
low-carbon and climate-resilient infrastructure that supports a regionally balanced economic recovery,
national governments need to recognise the crucial role that local authorities play, including though setting
priorities for the first retrofitting of buildings and in local transport (ADEPT, 2020[32]). Expanding skills
needed to address these challenges is another place-based priority to accelerate the transition.
Box 2.7. The European Union Recovery Plan
The EU is providing significant funds to help member states tackle the COVID-19 crisis, for example:
EUR 37 billion from the EU budget is available to support healthcare systems, SMEs and labour
markets through the Coronavirus Response Investment Initiative.
EUR 28 billion in structural funds from 2014-20 national envelopes not yet allocated to projects
are eligible for crisis response.
56
OECD REGIONAL OUTLOOK 2021 © OECD 2021
EUR 800 million from the EU Solidarity Fund are directed at the hardest-hit countries by
extending the scope of the fund to public health crises.
Unlike in 2008, the EU mobilised the cohesion policy to address the COVID-19 crisis, lifting or modifying
the rules that apply to European Structural and Investment Funds. As of October 2020, more than
100 programmes have changed to respond to the COVID-19 crisis. Through the Coronavirus Response
Investment Initiative Plus, member states can transfer money between different funds. Money can be
redirected to the most affected regions. Finally, member states can request up to 100% financing from
the EU budget between 1 July 2020 and 30 June 2021 for programmes dealing with the pandemic’s
impact.
The EU has enabled maximum flexibility in the application of EU rules on the use of national funds:
State aid measures to support businesses and workers.
Public finances and fiscal policies to accommodate exceptional spending.
On 21 July, the EU announced that EUR 390 billion would be distributed as grants and EUR 360 billion
would be available in loans to member states. The EU proposes borrowing up to EUR 750 billion.
Source: European Council (2020[33]), COVID-19 Coronavirus Outbreak and the EU’s Response,
https://www.consilium.europa.eu/en/policies/coronavirus/.
The public investment strategies are not yet consistent with a climate-neutral economy
A sustainable fiscal response requires it to be climate-consistent. Whether protracted financial, economic
and environmental risks result from higher debt will depend on the consistency of government stimulus
spending with needed future economic transformations, notably the transition to net-zero GHG emissions
by 2050. As shown in Part II of this Regional Outlook report, the consistency of activity, investment and
infrastructure financing needs to be assessed in a place-based manner to ensure sustainable regional
development.
Employing economic stimulus to invest in infrastructure and encourage private investment in a way that is
consistent with the transition to a climate-neutral economy, while discouraging investment that is
inconsistent with this transition, starting this year, could turn the COVID-19 crisis into an opportunity to
prevent a major climate crisis. As discussed in Part II of this Regional Outlook report, doing so early
reduces the cost of the transition and would also reduce financial risks from failed investment. Such
investment requires a place-based approach and could also reduce air, water and land pollution and
thereby reduce health risks and generate human well-being benefits.
Current assessments suggest that consistency of stimulus programmes is not achieved. Only 42% of
respondents in an EU survey of subnational governments stated that they are considering promoting a
green or sustainable agenda as part of their COVID-19 exit strategy and recovery plans (OECD-CoR,
2020[7]). According to the Energy Policy Tracker, national and subnational governments in a range of OECD
countries have committed 40% more funding to support fossil fuel energy than to support clean energy
production and consumption between the start of the COVID-19 pandemic and the end of 2020.
Additionally, at least up until August 2020, the recovery packages of 5 major emitters (China, EU27, India,
South Korea and the US), which committed 8% to 14% of GDP, mostly did not make climate change
mitigation at the core of the planned spending (Climate Action Tracker, 2020[34]). The EU and South Korea
have a focus on green recovery for part of their stimulus packages, while other governments are set to
spend more on sustaining the fossil fuel industry and airlines. The economic stimulus packages,
announced by October 2020 in 16 of the G20 countries, may have a net negative effect on the environment
(Vivid Economics, 2020[35]). Countries that have committed to green recoveries are still allocating more
towards activities that are harmful to the environment and maintain or increase GHG emissions than
57
OECD REGIONAL OUTLOOK 2021 © OECD 2021
towards activities that are beneficial to the environment and reduce emissions. Moreover, biodiversity
aspects have largely been neglected in green recovery plans. However, the share of green spending in
recovery packages announced by the second lockdown has increased compared to those announced
during the first lockdown.
Regional and local governments play a leading role in delivering employment and skills
In almost half of OECD countries with available data, local and regional governments are wholly or partially
responsible for implementing active labour market policies and can therefore contribute to a policy
response that takes territorial differences in crisis impacts into account. For example, based on their
understanding of local labour market dynamics, they can co-ordinate with employers to identify and deliver
“top up” training to help displaced workers transition quickly to new opportunities or co-ordinate local
services for the most disadvantaged job seekers. Personal connections between service providers at the
local level often reinforce this co-ordination.
Recommendations for local employment action, mostly laid out in the report Job Creation and Local
Economic Development 2020: Rebuilding Better (OECD, 2020[1]), include:
Strengthen local employment and training systems to manage the additional pressures.
Consider complementary measures for the hardest-hit places as national schemes are rolled back.
Support firms in implementing social distancing, including through adaptations to the built
environment.
Upgrade frontline public employment service capacities and virtual services, to help places hardest
hit in the short term and support broader economic transitions in places facing longer-term
challenges. Intervene early to prevent longer-term labour market disengagement.
Target active labour market policies to both individual and community characteristics and ensure
accountability mechanisms take local conditions into account. Address other barriers to
employment (e.g. childcare, mental health challenges).
Adapt local training provision in light of increased demands, system constraints and local needs.
Prevent disadvantage from becoming entrenched for young people, the low-skilled and women.
Expand outreach to hard-to-reach populations, including through partnerships with local
community organisations. Particular concern should be to support the career start of young people,
especially among those who do not have the best job prospects, to avoid difficulties at the
beginning of the career having long-lasting adverse impacts.
Integrate the use of teleworking by firms into local development strategies and upgrade digital
infrastructure, particularly in rural areas.
Investing in biodiversity protects ecosystem services essential to human well-being and reduces
risks of zoonotic epidemics. It can also support rural development by creating jobs in activities,
such as ecosystem restoration, reforestation, invasive alien species management and
environmental monitoring and enforcement, which tend to be labour intensive and quick to
implement.
Already following the global financial crisis, lagging places performed better in terms of employment if they
had an industrial composition that facilitated greater inter-sectoral worker flows (e.g. workers from one
sector were able to move into another) and if they enjoyed larger changes in occupational structure. These
findings suggest that growth of local economies increasingly depends on their ability to “rewire” and adjust
to changing labour market realities. This will also be important for regions that need to wind down industrial
activities which are inconsistent with a net-zero-emission transition or which face major challenges, as
discussed in more detail in Part II (OECD, 2020[1]).
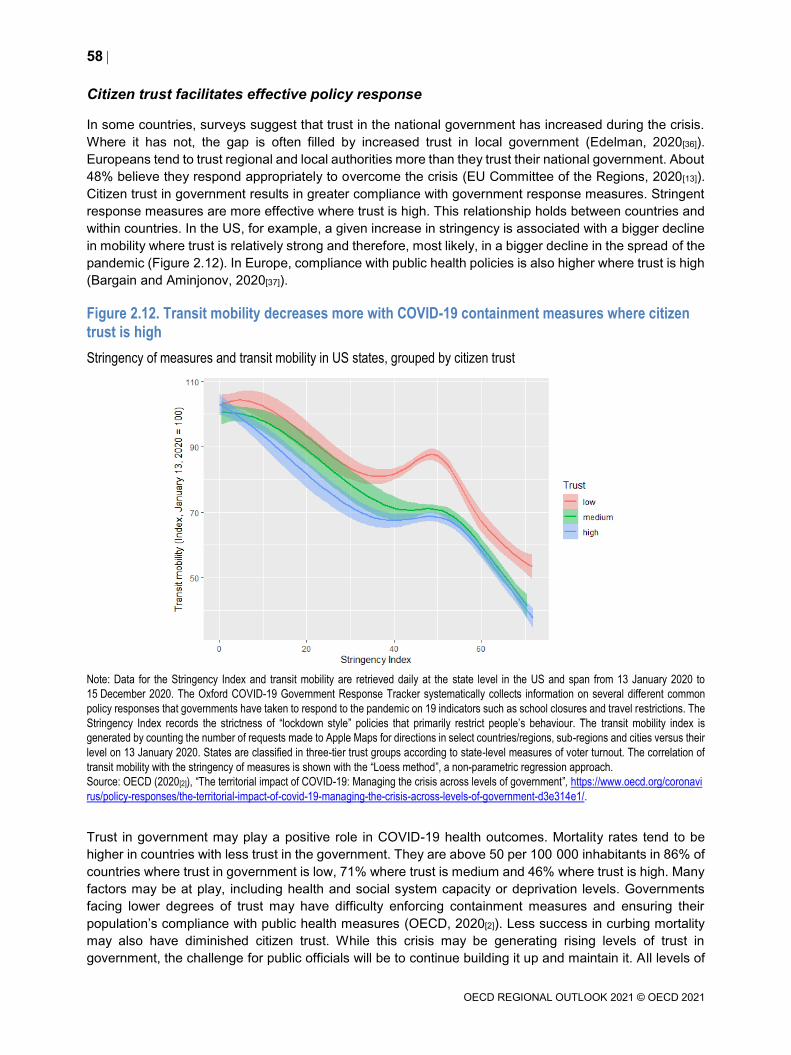
58
OECD REGIONAL OUTLOOK 2021 © OECD 2021
Citizen trust facilitates effective policy response
In some countries, surveys suggest that trust in the national government has increased during the crisis.
Where it has not, the gap is often filled by increased trust in local government (Edelman, 2020[36]).
Europeans tend to trust regional and local authorities more than they trust their national government. About
48% believe they respond appropriately to overcome the crisis (EU Committee of the Regions, 2020[13]).
Citizen trust in government results in greater compliance with government response measures. Stringent
response measures are more effective where trust is high. This relationship holds between countries and
within countries. In the US, for example, a given increase in stringency is associated with a bigger decline
in mobility where trust is relatively strong and therefore, most likely, in a bigger decline in the spread of the
pandemic (Figure 2.12). In Europe, compliance with public health policies is also higher where trust is high
(Bargain and Aminjonov, 2020[37]).
Figure 2.12. Transit mobility decreases more with COVID-19 containment measures where citizen
trust is high
Stringency of measures and transit mobility in US states, grouped by citizen trust
Note: Data for the Stringency Index and transit mobility are retrieved daily at the state level in the US and span from 13 January 2020 to
15 December 2020. The Oxford COVID-19 Government Response Tracker systematically collects information on several different common
policy responses that governments have taken to respond to the pandemic on 19 indicators such as school closures and travel restrictions. The
Stringency Index records the strictness of “lockdown style” policies that primarily restrict people’s behaviour. The transit mobility index is
generated by counting the number of requests made to Apple Maps for directions in select countries/regions, sub-regions and cities versus their
level on 13 January 2020. States are classified in three-tier trust groups according to state-level measures of voter turnout. The correlation of
transit mobility with the stringency of measures is shown with the “Loess method”, a non-parametric regression approach.
Source: OECD (2020[2]), “The territorial impact of COVID-19: Managing the crisis across levels of government”, https://www.oecd.org/coronavi
rus/policy-responses/the-territorial-impact-of-covid-19-managing-the-crisis-across-levels-of-government-d3e314e1/.
Trust in government may play a positive role in COVID-19 health outcomes. Mortality rates tend to be
higher in countries with less trust in the government. They are above 50 per 100 000 inhabitants in 86% of
countries where trust in government is low, 71% where trust is medium and 46% where trust is high. Many
factors may be at play, including health and social system capacity or deprivation levels. Governments
facing lower degrees of trust may have difficulty enforcing containment measures and ensuring their
population’s compliance with public health measures (OECD, 2020[2]). Less success in curbing mortality
may also have diminished citizen trust. While this crisis may be generating rising levels of trust in
government, the challenge for public officials will be to continue building it up and maintain it. All levels of
59
OECD REGIONAL OUTLOOK 2021 © OECD 2021
government may want to take stock and evaluate the trust-building actions. While it can take many years
to build trust, it can be rapidly lost (Edelman, 2020[36]).
Lessons learned from the COVID crisis for regional, urban and rural policies
The substantial costs of the COVID-19 pandemic to human life and economies and their territorially
differentiated distribution highlights that a place-based and co-ordinated emergency response strategy is
central. A place-based approach allows local actors to act swiftly and specifically to vulnerabilities.
Partnerships across government levels allow generating agreed-upon objectives, priorities and plans.
Effective central-government-level leadership needs to set the strategy and guidelines. Bottom-up
approaches have produced innovative ways to deal with the emergency of the crisis and have built up trust
among citizens and policymakers across government levels. A clear, commonly understood and agreed
delineation of roles and responsibilities and well-capacitated, financially endowed subnational
governments facilitate such partnerships. Clear, rapid, regular and accurate communication across levels
and government and citizens helps government respond in a timely and targeted manner and promotes
knowledge sharing. All of this needs to be supported by good data – to spot emerging risks, better target
policy responses and evaluate policy measures for their effectiveness and their costs. By improving trust
in institutions and people such an approach can further improve effectiveness.
Anticipatory action minimises major adverse impacts on health, well-being and the economy. To reinforce
a place-based preventive approach to any potential future pandemic outbreaks, it would be useful to
identify which regions are vulnerable to early transmission of shocks, along global value chains and
transport links for example, as well as those regions which may play key roles to play in preventing the
development of zoonotic pandemics. Ultimately there may not be a trade-off between dealing with the
health crisis and the economic crisis, as postponing interventions may require longer or heavier
restrictions, with a higher cost in terms of health impacts, economic impacts and particularly adverse
impacts on vulnerable people. Countries and regions which have incorporated previous experience in
health crisis management have been better prepared to co-ordinate actions, anticipate and thereby limit
adverse impacts. This can also be a source of learning for others. This reinforces the need for evaluation
too – it should be important to evaluate the impacts of containment and support measures to learn and
share best practice between tiers of government. Promoting the use of digital tools, transferable skills and
active labour market policies also help. Subnational governments have an important role to play.
Urban and rural vulnerabilities need to be addressed in their specificity. In rural regions, this requires
improving access to digital infrastructure, better access to healthcare and other key services. This
illustrates that the quest of cost reduction and efficiency risks being counterproductive if it hurts resilience.
Cities’ resilience would improve with less inequality in housing and access to jobs and key facilities. Better
connections of cities with the rural environments can provide relief for urban and rural dwellers alike,
fostering potentials for local markets.
The crisis has shown that we have not yet adequately addressed inequality – the vulnerable are the most
exposed to risk, lacking the means and buffers to protect themselves. In the COVID-19 crisis, inequality
fuelled the pandemic as the virus raced through overcrowded accommodation and meant the poor often
had to continue working in risky face-to-face jobs to sustain themselves. Workers on non-standard
employment, often on low pay, also face the biggest economic impacts. Without concerted action, this
could derail rebuilding efforts in the regions hit the most, contributing to a downward spiral for affected
regions that may be hard to escape once set in motion, as experience with regional development shows.
Therefore, as national emergency support such as short-time work schemes is phased out, place-based
support for poor and worst-affected households, firms and workers to adapt to the “new normal”, will
become more important (OECD, 2020[1]). Subnational governments are often well placed to help workers
into new jobs, provide needed training and social services. In view of the narrow relationship between

60
OECD REGIONAL OUTLOOK 2021 © OECD 2021
poverty on the one hand and the incidence of infection on the other, combining preventive efforts with
generous support when isolating infected people in disadvantaged areas may be particularly promising. It
may also help maintain a voluntary approach to prevention and crisis management, reinforcing trust.
Multi-level public finance arrangements may have too narrowly focused on debt and deficits for
sustainability. They also need to integrate environmental and social aspects of sustainability. This requires
adequate and prompt fiscal equalisation across regions with compensation to adapt to asymmetric
spending increases and revenue shortfalls. A comprehensive subnational government finance review
would help countries improve fiscal resilience and flexibility, in particular the capacity of subnational
governments to respond to asymmetric increases in poverty and healthcare needs. It will be important to
ensure a good balance in revenue and spending assignments, sufficient autonomy and flexible recourse
to debt. As argued in Part II of this Regional Outlook report, funding arrangements for subnational
governments need to integrate GHG emission reduction objectives. After the financial crisis, investment
recovery funds were often fragmented in small projects at the municipal level, rather than at the regional
level. Intermediary levels of government – regions, states, provinces – should be actively involved in
implementing national investment recovery strategies with long-term and cross-cutting priorities, including
the climate challenge.
More resilient regions: A regional development policy priority post-COVID-19
More resilient regions mean ensuring they are able to absorb, recover from or adapt to the impact of
economic, financial, environmental, political and social shocks or chronic pressure. This is particularly
important when a crisis is systemic, as in the case of COVID-19. It started as an infectious disease but has
ended up affecting most aspects of economic and social life with multiple knock-on effects. The nature of
the knock-on effects may not be known in advance. COVID-19 also reveals that risks to the foundations of
human well-being, notably public health, can be the source of a systemic crisis. The COVID-19 crisis has
demonstrated that anticipation and early action, integrating scientific advice in governance, are key to
addressing such systemic crises. This requires better planning to anticipate needs and prepare for risks
and pre-emptive action to head off emerging risks. Similarly, longer-term risks around climate change and
the transition to climate-neutral models have been postponed too long.
Resilience is about preventing, limiting and reversing damaging knock-on effects while meeting the needs
of citizens and businesses as well as possible. This will only be possible if known upcoming challenges for
protecting and further improving well-being are anticipated and addressed. Therefore, resilience cannot
mean returning to previous modes of regional development. Instead, it requires their transformation. The
close relationship of COVID-19 with global environmental challenges illustrates that regional development
must in particular integrate these challenges to be resilient.
The COVID-19 crisis recovery, therefore, needs to be an opportunity to accelerate the transformation of
economies to address these challenges. Civic duty and community involvement are prevailing over
individual interest to protect vulnerable groups. Local governance and networks are important for regional
recovery and resilience. This can inspire lasting behavioural shifts to make cities and regions more resilient
to address the climate challenge, where effective early action is crucial to minimise costs. To ensure
reconstruction provides lasting benefits and avoids financial risks from failed investment, economic activity
needs to be redeveloped in a way that is consistent with net-zero GHG emissions. Recovery packages do
not yet achieve that. Part II of this OECD Regional Outlook report discusses ways for regional development
to assess benefits and vulnerabilities and make progress to incorporate the climate challenge.
The COVID-19 crisis has also revealed how intricately resilience relates to inclusiveness. Efforts to prevent
or limit the crisis early on protect vulnerable individuals the most. At the same time, alleviating economic
impacts to worst-hit regions and communities and providing the resources to them to respond, is
particularly effective in strengthening resilience, as the system may only be as strong as the most
vulnerable communities in it. It can also garner support for a preventive approach and build up trust.
61
OECD REGIONAL OUTLOOK 2021 © OECD 2021
Since the climate challenge is also systemic, on a larger scale and longer time horizons, the experience
with the COVID-19 crisis has rich lessons for climate policy. This includes the need for a place-based,
inclusive approach. These are explored in Part II of this report.
References
Aarhus Kommune (2020), Joint Municipal Procurement of Protective Equipment,
https://www.aarhus.dk/corona/faelleskommunalt-indkoeb-af-vaernemidler/ (accessed on
9 June 2020).
[9]
ADCF (2020), “Crise sanitaire – Covid19 : Fonctionnement des communautés, soutien à l’activité
économique du territoire, continuité des actions et services publics essentiels”, Assemblée
des Communautés de France, https://www.adcf.org/articles-crise-sanitaire--%EF%BF%BD-
covid19-fonctionnement-des-communautes-soutien-a-l-activite-economique-du-territoire-
continuite-des-actions-et-services-publics-essentiels-5391.
[10]
ADEPT (2020), A Blueprint for Accelerating Climate Action and a Green Recovery at the Local
Level.
[32]
Bargain and Aminjonov (2020), “Trust and compliance with public health policies in the time of
COVID-19”, https://voxeu.org/article/trust-and-compliance-public-health-policies-time-covid-
19.
[37]
Chernick, H., D. Copeland and A. Reschovsky (2020), “The fiscal effects of the COVID-19
pandemic on cities: An initial assessment”, National Tax Journal,
https://doi.org/10.17310/ntj.2020.3.04.
[17]
Climate Action Tracker (2020), “Pandemic recovery: Positive intentions vs policy rollbacks, with
just a hint of green”.
[34]
CoR-OECD (2020), CoR-OECD Survey Questionnaire: “How is COVID-19 affecting regions and
cities?”, https://cor.europa.eu/en/news/Pages/ECON-cor-oecd-survey-covid-19.aspx.
[15]
Edelman (2020), Edelman Trust Barometer 2020 Spring Update: Trust and the Covid-19
Pandemic, Edelman, https://www.edelman.com/sites/g/files/aatuss191/files/2020-
05/2020%20Edelman%20Trust%20Barometer%20Spring%20Update.pdf (accessed
on June 2020).
[36]
EU Committee of the Regions (2020), EU Annual Regional and Local Eurobarometer,
https://cor.europa.eu/en/our-work/EURegionalBarometerDocs/4370-
Barometer%20optimized.pdf.
[13]
European Council (2020), COVID-19 Coronavirus Outbreak and the EU’s Response,
https://www.consilium.europa.eu/en/policies/coronavirus/.
[33]
Fuentes Hutfilter, A. et al. (2016), “Boosting investment performance in Germany”, OECD
Economics Department Working Papers, No. 1326, OECD Publishing, Paris,
https://dx.doi.org/10.1787/5jlr3cv53241-en.
[24]
Haroon, S. et al. (2020), “Covid-19: Breaking the chain of household transmission”, No. 370,
BMJ Publishing Group, http://dx.doi.org/10.1136/bmj.m3181.
[3]
62
OECD REGIONAL OUTLOOK 2021 © OECD 2021
Hepburn, C. et al. (2020), “Will COVID-19 fiscal recovery packages accelerate or retard progress
on climate change?”, Oxford Review of Economic Policy, Vol. 36/Supplement 1, pp. S359-
S381, https://doi.org/10.1093/oxrep/graa015.
[31]
IMF (2020), Policy Responses to COVID-19, International Monetary Fund,
https://www.imf.org/en/Topics/imf-and-covid19/Policy-Responses-to-COVID-19.
[27]
KDK (2020), “Faire front commun face à la pandémie de Covid-19 (Joining forces against the
Covid-19 pandemic)”, Press Release, Conference of Cantonal Governments,
https://kdk.ch/uploads/media/MM-4034-20200327-PVKdK-COVID-19-FR.pdf.
[11]
New York State (2020), “Pennsylvania joins New York, New Jersey and Connecticut’s regional
coalition to combat COVID-19”, https://www.governor.ny.gov/news/pennsylvania-joins-new-
york-new-jersey-and-connecticuts-regional-coalition-combat-covid-19.
[12]
OECD (2020), “Cities Policy Responses”, Tackling Coronavirus (COVID-19): Contributing to a
Global Effort, OECD, Paris, https://read.oecd-ilibrary.org/view/?ref=126_126769-
yen45847kf&title=Coronavirus-COVID-19-Cities-Policy-Responses.
[4]
OECD (2020), “COVID-19 and fiscal relations across levels of government”, Tackling
Coronavirus (COVID-19): Contributing to a Global Effort, OECD, Paris, https://read.oecd-
ilibrary.org/view/?ref=129_129940-barx72laqm&title=COVID-19-and-Fiscal-Relations-across-
Levels-of-Government.
[8]
OECD (2020), “COVID-19 and fiscal relations across levels of government”, OECD Policy
Responses to Coronavirus (COVID-19), OECD, Paris,
https://www.oecd.org/coronavirus/policy-responses/covid-19-and-fiscal-relations-across-
levels-of-government-ab438b9f/#p-d1e2184.
[23]
OECD (2020), “Covid-19 and intergovernmental Fiscal Relations: Early responses and main
lessons from the Financial Crisis”, OECD, Paris.
[20]
OECD (2020), Job Creation and Local Economic Development 2020: Rebuilding Better, OECD
Publishing, Paris, https://dx.doi.org/10.1787/b02b2f39-en.
[1]
OECD (2020), OECD Economic Outlook, Volume 2020 Issue 2, OECD Publishing, Paris,
https://dx.doi.org/10.1787/39a88ab1-en.
[18]
OECD (2020), Subnational Governments in OECD Countries: Key Data - 2020 Edition, OECD,
Paris.
[16]
OECD (2020), Testing for COVID-19: A way to lift confinement restrictions, OECD, Paris,
http://www.oecd.org/stories/policy-responses/testing-for-covid-19-a-way-to-lift-confinement-
restrictions-89756248/.
[6]
OECD (2020), “The territorial impact of COVID-19: Managing the crisis across levels of
government”, OECD Policy Responses to Coronavirus (COVID-19), OECD, Paris,
https://www.oecd.org/coronavirus/policy-responses/the-territorial-impact-of-covid-19-
managing-the-crisis-across-levels-of-government-d3e314e1/.
[2]
OECD (2018), OECD Economic Outlook, Volume 2018 Issue 1, OECD Publishing, Paris,
https://dx.doi.org/10.1787/eco_outlook-v2018-1-en.
[26]
63
OECD REGIONAL OUTLOOK 2021 © OECD 2021
OECD (2017), Investing in Climate, Investing in Growth, OECD Publishing, Paris,
https://dx.doi.org/10.1787/9789264273528-en.
[25]
OECD (2014), OECD Recommendation on Effective Public Investment across levels of
Government, OECD, Paris, https://www.oecd.org/effective-public-investment-toolkit/.
[29]
OECD (2013), Investing Together: Working Effectively across Levels of Government, OECD
Multi-level Governance Studies, OECD Publishing, Paris,
https://dx.doi.org/10.1787/9789264197022-en.
[21]
OECD (forthcoming), Sustainable Infrastructure in Regions and Cities in the Post-COVID-19
World, OECD Publishing, Paris.
[28]
OECD-CoR (2020), “The impact of the COVID-19 crisis on regional and local governments: Main
findings from the joint CoR-OECD survey”, http://www.oecd.org/regional/multi-level-
governance.htm.
[7]
S&P Global Ratings (2020), “COVID-19: Emerging market local governments and non-profit
public-sector entities face rising financial strains”,
https://www.spglobal.com/ratings/en/research/articles/200406-covid-19-emerging-market-
local-governments-and-non-profit-public-sector-entities-face-rising-financial-strai-11422899.
[19]
S&P Global Ratings (2020), “COVID-19: Fiscal response will lift local and regional government
borrowing to record high”, https://www.spglobal.com/ratings/en/research/articles/200609-
covid-19-fiscal-response-will-lift-local-and-regional-government-borrowing-to-record-high-
11518255.
[22]
Unsworth, S. et al. (2020), “Jobs for a strong and sustainable recovery from Covid-19”, Centre
for Economic Performance, London School of Economics and Political Science.
[30]
US National League of Cities (2020), What COVID-19 Means for City Finance,
https://covid19.nlc.org/wp-content/uploads/2020/06/What-Covid-19-Means-For-City-
Finances_Report-Final.pdf.
[14]
Vivid Economics (2020), Greenness of Stimulus Index: An Assessment of COVID-19 Stimulus by
G20 Countries and Other Major Economies in Relation to Climate Action and Biodiversity
Goals - October Release.
[35]
WHO (2020), Covid Strategy Update (April 2020), World Health Organization,
https://www.who.int/publications/i/item/covid-19-strategy-update---14-april-2020.
[5]
Notes
1 24.5% and 11.5% refers to unweighted average for OECD countries. When taking weighted averages
(by population), subnational governments represent 31.8% of total non-consolidated public health
expenditure, 38% of consolidated public health expenditure and 18% of subnational government
expenditure.
2 Economic affairs are mainly composed of transport but also include commercial and labour affairs,
economic interventions, agriculture, energy, mining, manufacturing, construction, etc.

65
OECD REGIONAL OUTLOOK 2021 © OECD 2021
Part II The resilience of
rural and urban regions in
the transition to net-zero
greenhouse gas emissions
66
OECD REGIONAL OUTLOOK 2021 © OECD 2021
Climate change is a global challenge threatening the foundations of human
wellbeing. To limit negative impacts, most OECD countries aim for net-zero
domestic greenhouse gas emissions by 2050. Deep and broad
transformations of economies will be needed. Impacts, local conditions and
vulnerabilities vary across territories and by degree of rurality. For example,
within-country variation in emissions is larger than between countries. Most
OECD countries still have regions with coal-fired electricity generation far
removed from short-term net-zero-consistent benchmarks. Poorer cities
and rural regions are more car-dependent, making them more sensitive to
the costs of decarbonising transport. Further, employment at risk is modest
but regionally concentrated. Therefore, there is a need for place-based and
regionally-balanced policies aligned with national and global objectives, to
address climate change, mitigation and adaptation. Moreover, climate
change mitigation brings well-being benefits, beyond the protection of the
climate, that arise locally and in the near term. These can be major
motivators for local action as they can more than offset mitigation costs.
Delaying action raises costs. Vulnerable communities require support.
3 Reaching net-zero greenhouse gas
emissions: The role for regions and
cities
67
OECD REGIONAL OUTLOOK 2021 © OECD 2021
The case for regional action
Addressing climate change is a global challenge requiring local action
OECD countries are increasingly recognising the urgent need to act on climate change, both to mitigate
global warming and adapt to climate change which is already unavoidable. While these challenges are
global, requiring multilateral and national action, they also require strong local actions and place-based
policies that align with national and global objectives. As argued below, addressing challenges through a
well-being perspective makes it easier and more rewarding for citizens and policymakers in regions and
cities to integrate climate action in all decisions concerning place-based development. Doing so harnesses
the multiple non-climate benefits and helps minimise trade-offs and vulnerabilities. These benefits can
offset the net cost of climate action, often in full. Unlike the climate benefits themselves, many of these
well-being gains arise locally and immediately and, therefore, decisively reinforce the case for integrating
climate policy in regional development.
This Chapter sets out why climate policy and resulting wellbeing impacts are central to regional
development policies, which is also developed in Accelerating Climate Action: Refocusing Policies through
a Well-being Lens (2019[1]). The Chapter also includes a discussion of indicators to support evidence-
based policies, building on existing OECD data that regions can already use to monitor progress as well
as upcoming climate hazards. The following section in this chapter will discuss policies to move regional
policymaking closer to achieving regional development in a way that is consistent with climate objectives.
Many OECD countries have set net-zero targets for their domestic greenhouse gas (GHG) emissions by
2050 or earlier. These include European Nordic countries, Canada, Korea, New Zealand (albeit excluding
agricultural emissions and including international offsets), Switzerland, the United Kingdom (UK) and the
European Union (albeit excluding aviation and shipping). They have done so recognising that high-income
countries have a particular role to play in meeting the objective of the Paris agreement to limit global
warming to well below 2 degrees and make efforts to limit it to 1.5°C (Climate Change Committee, 2019[2]).
In addition, they will need to contribute to support emission reductions in poorer countries. Some emerging
economies, including Chile and Costa Rica, have also set similar targets for their domestic emissions.
Bhutan has already reached net-zero GHG emissions and its target is to keep it that way. Most recently,
China has announced its aim to reach carbon neutrality by 2060. Overall, 126 countries have committed
to climate or carbon neutrality by mid-century (Climate Analytics/New Climate Institute, n.d.[3]). Taken
together, and assuming they are implemented, they may limit global warming to around 2.5°C by the end
of the century. However, if human-made net CO2 emissions remain positive, they will continue to raise
global average temperatures.
Reaching the objectives of the Paris Agreement will prevent major threats to the foundations of human
well-being. These threats are substantially worse under 2°C than under 1.5°C. For example, key risks from
2°C and above for the use of land include worldwide food shortages, high impacts and risks of dryland
water scarcity and large-scale wildfires in many regions (Figure 3.1). The very high risk and impact of
permafrost degradation include the release of GHG (methane and CO2), in turn possibly further
accelerating climate change (IPCC, 2018[4]). The Arctic ice sheet’s temperature sensitivity alone implies
1.3 metres of sea level rise per degree of warming up to 2°C above pre-industrial levels, almost doubling
to 2.4 metres per degree of warming between 2°C and 6°C and increasing to approximately 10 metres per
degree of warming between 6°C and 9°C. This implies very large sea level increases even within the Paris
Agreement temperature limits and catastrophic increases beyond, though they would occur after the end
of the 21st century (Garbe et al., 2020[5]). The experience of the COVID-19 crisis shows that risks to the
foundations of human well-being, notably human health, can create systemic effects throughout the
economy (Box 3.1). The emergence of new human diseases is also closely linked to the loss and
degradation of ecosystems and habitats, which in turn is driven by climate change, resource extraction,
urban and agricultural expansion and pollution (Rohr et al., 2019[6]). With a global temperature rise of
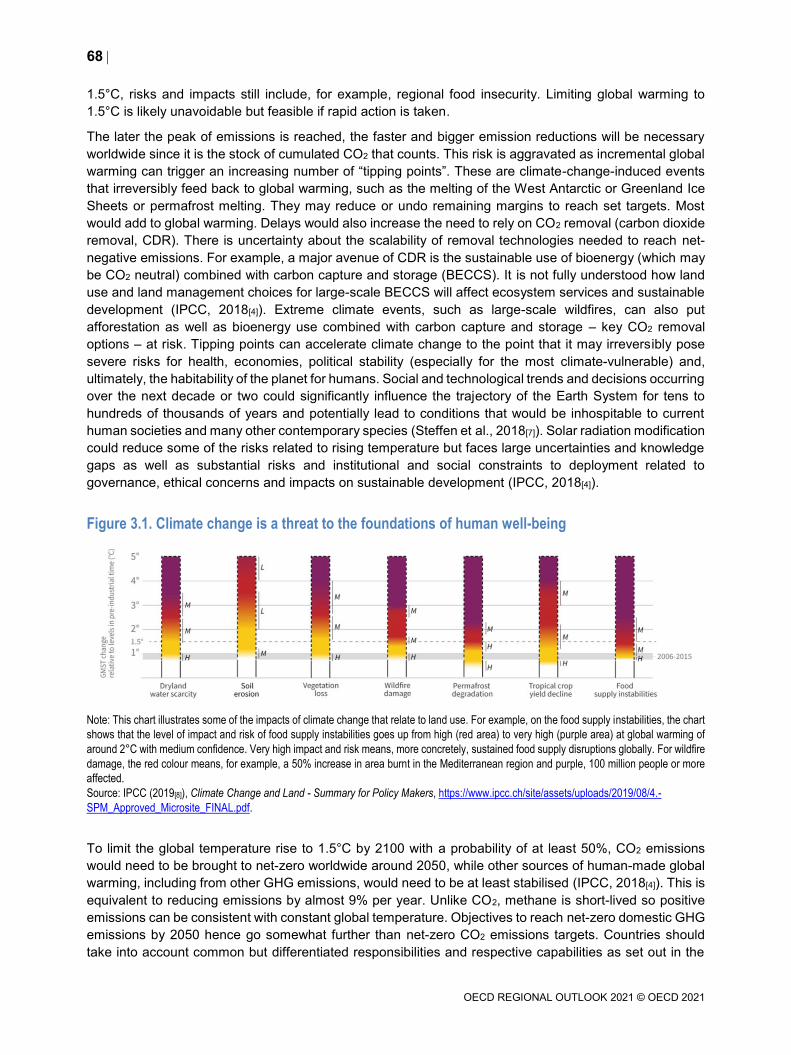
68
OECD REGIONAL OUTLOOK 2021 © OECD 2021
1.5°C, risks and impacts still include, for example, regional food insecurity. Limiting global warming to
1.5°C is likely unavoidable but feasible if rapid action is taken.
The later the peak of emissions is reached, the faster and bigger emission reductions will be necessary
worldwide since it is the stock of cumulated CO2 that counts. This risk is aggravated as incremental global
warming can trigger an increasing number of “tipping points”. These are climate-change-induced events
that irreversibly feed back to global warming, such as the melting of the West Antarctic or Greenland Ice
Sheets or permafrost melting. They may reduce or undo remaining margins to reach set targets. Most
would add to global warming. Delays would also increase the need to rely on CO2 removal (carbon dioxide
removal, CDR). There is uncertainty about the scalability of removal technologies needed to reach net-
negative emissions. For example, a major avenue of CDR is the sustainable use of bioenergy (which may
be CO2 neutral) combined with carbon capture and storage (BECCS). It is not fully understood how land
use and land management choices for large-scale BECCS will affect ecosystem services and sustainable
development (IPCC, 2018[4]). Extreme climate events, such as large-scale wildfires, can also put
afforestation as well as bioenergy use combined with carbon capture and storage – key CO2 removal
options – at risk. Tipping points can accelerate climate change to the point that it may irreversibly pose
severe risks for health, economies, political stability (especially for the most climate-vulnerable) and,
ultimately, the habitability of the planet for humans. Social and technological trends and decisions occurring
over the next decade or two could significantly influence the trajectory of the Earth System for tens to
hundreds of thousands of years and potentially lead to conditions that would be inhospitable to current
human societies and many other contemporary species (Steffen et al., 2018[7]). Solar radiation modification
could reduce some of the risks related to rising temperature but faces large uncertainties and knowledge
gaps as well as substantial risks and institutional and social constraints to deployment related to
governance, ethical concerns and impacts on sustainable development (IPCC, 2018[4]).
Figure 3.1. Climate change is a threat to the foundations of human well-being
Note: This chart illustrates some of the impacts of climate change that relate to land use. For example, on the food supply instabilities, the chart
shows that the level of impact and risk of food supply instabilities goes up from high (red area) to very high (purple area) at global warming of
around 2°C with medium confidence. Very high impact and risk means, more concretely, sustained food supply disruptions globally. For wildfire
damage, the red colour means, for example, a 50% increase in area burnt in the Mediterranean region and purple, 100 million people or more
affected.
Source: IPCC (2019[8]), Climate Change and Land - Summary for Policy Makers, https://www.ipcc.ch/site/assets/uploads/2019/08/4.-
SPM_Approved_Microsite_FINAL.pdf.
To limit the global temperature rise to 1.5°C by 2100 with a probability of at least 50%, CO2 emissions
would need to be brought to net-zero worldwide around 2050, while other sources of human-made global
warming, including from other GHG emissions, would need to be at least stabilised (IPCC, 2018[4]). This is
equivalent to reducing emissions by almost 9% per year. Unlike CO2, methane is short-lived so positive
emissions can be consistent with constant global temperature. Objectives to reach net-zero domestic GHG
emissions by 2050 hence go somewhat further than net-zero CO2 emissions targets. Countries should
take into account common but differentiated responsibilities and respective capabilities as set out in the

69
OECD REGIONAL OUTLOOK 2021 © OECD 2021
Paris Agreement. This may justify more ambitious targets for high-income countries. A target of net-zero
GHG emissions in 2050 will imply net-negative CO2 emissions by 2050. Regions that mostly emit CO2,
including cities, will need to reach net-zero emissions before 2050 and likely before 2045. In any case, to
halt global warming on longer time scales, CO2 emissions need to become net-negative worldwide.
Box 3.1. Lessons from the COVID-19 crisis in a regional, urban and rural context
The COVID-19 crisis has revealed the close relationship between risks to the foundations of human
well-being, environmental impacts and cascading systemic impacts on the economy and society.
Human health risks are key. Climate change also poses risks to the foundations of human well-being,
including health, with potential systemic knock-on effects. These are even bigger and on a longer time
scale. They also vary across regions and cities and, as in the COVID-19 crisis, participation of local and
regional decision-makers and multi-level governance has proven essential.
The COVID-19 crisis shows the importance of anticipation, preparedness and early action to
mitigate human well-being and systemic risks and take cost-minimising action. They are also
key to prevent and limit the well-being risks from climate change and drive down emissions
while extending economic prosperity. They require integrating scientific advice in the decision-
making progress among citizens, parliaments and governments at all levels.
Moving from an economic growth paradigm to well-being and sustainable development
paradigm can help identify systemic risks by putting human health impacts first and thereby
reinforce resilience.
The COVID-19 crisis shows that inclusiveness is key to resilience. Access of all households to
adequate housing, social safety nets, including health services, water and sanitation, energy
supply, adequate income, communication and education improve the resilience of societies.
They will also be key in the transition to net-zero GHG emission economies and to adapt to
climate change. The cost of the crisis response and the zero-emission transition will also need
to be shared fairly across households and firms.
The COVID-19 crisis has shown that societies can embrace strong action to mitigate risks to
the foundations of well-being but also that they are sensitive to economic risks to their
livelihoods. This further reinforces the case for anticipatory, preventive action.
The COVID-19-related lockdowns have had near-term benefits for the environment, including
on CO2 emissions, but at the expense of a major decline in economic activity. This illustrates
how closely intertwined fossil fuels remain with economic activity. So far, GHG emissions and
other environmental impacts have risen with economic activity. This link must be broken.
Small- and medium-sized enterprises (SMEs) have been vulnerable to the COVID-19 related
impacts and their vulnerability has increased risks of precariousness and poverty. But they have
also contributed to resilience with innovation and flexibility. Looking ahead, they may be
particularly vulnerable in the zero-emission transition, as they may be more emission-intensive
and find integrating new technologies more difficult. They may also have less scope to diversify
activity (including geographically) as well as more limited access to financial markets and the
scale economies of new technologies. Framework conditions need to put them in a position to
develop business models consistent with net-zero emission economies.
It is key to identify factors that create resistance to early action. The COVID-19 crisis illustrates
the governance needs to integrate governments and parliaments at all levels, the public,
employers, workers and scientific advice. Vested economic interests around fossil fuels have
been a major source of resistance against climate policy. Clear, democratic, participative
governance structures help to identify risks and actions to mitigate them.
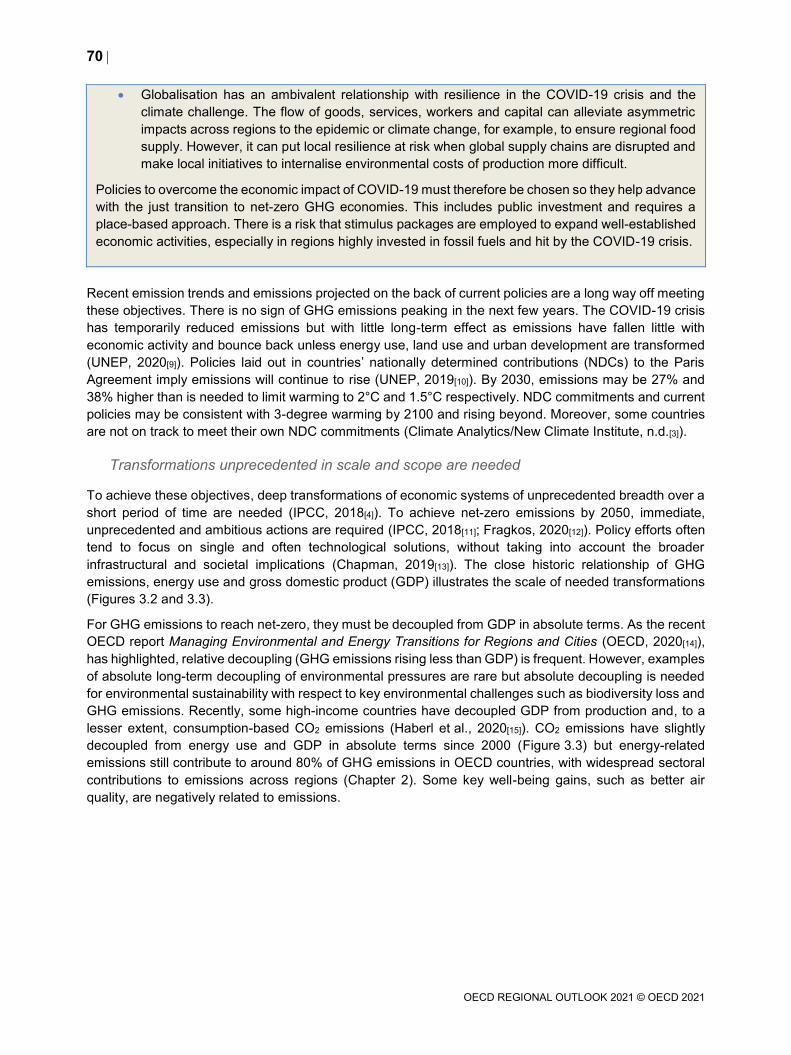
70
OECD REGIONAL OUTLOOK 2021 © OECD 2021
Globalisation has an ambivalent relationship with resilience in the COVID-19 crisis and the
climate challenge. The flow of goods, services, workers and capital can alleviate asymmetric
impacts across regions to the epidemic or climate change, for example, to ensure regional food
supply. However, it can put local resilience at risk when global supply chains are disrupted and
make local initiatives to internalise environmental costs of production more difficult.
Policies to overcome the economic impact of COVID-19 must therefore be chosen so they help advance
with the just transition to net-zero GHG economies. This includes public investment and requires a
place-based approach. There is a risk that stimulus packages are employed to expand well-established
economic activities, especially in regions highly invested in fossil fuels and hit by the COVID-19 crisis.
Recent emission trends and emissions projected on the back of current policies are a long way off meeting
these objectives. There is no sign of GHG emissions peaking in the next few years. The COVID-19 crisis
has temporarily reduced emissions but with little long-term effect as emissions have fallen little with
economic activity and bounce back unless energy use, land use and urban development are transformed
(UNEP, 2020[9]). Policies laid out in countries’ nationally determined contributions (NDCs) to the Paris
Agreement imply emissions will continue to rise (UNEP, 2019[10]). By 2030, emissions may be 27% and
38% higher than is needed to limit warming to 2°C and 1.5°C respectively. NDC commitments and current
policies may be consistent with 3-degree warming by 2100 and rising beyond. Moreover, some countries
are not on track to meet their own NDC commitments (Climate Analytics/New Climate Institute, n.d.[3]).
Transformations unprecedented in scale and scope are needed
To achieve these objectives, deep transformations of economic systems of unprecedented breadth over a
short period of time are needed (IPCC, 2018[4]). To achieve net-zero emissions by 2050, immediate,
unprecedented and ambitious actions are required (IPCC, 2018[11]; Fragkos, 2020[12]). Policy efforts often
tend to focus on single and often technological solutions, without taking into account the broader
infrastructural and societal implications (Chapman, 2019[13]). The close historic relationship of GHG
emissions, energy use and gross domestic product (GDP) illustrates the scale of needed transformations
(Figures 3.2 and 3.3).
For GHG emissions to reach net-zero, they must be decoupled from GDP in absolute terms. As the recent
OECD report Managing Environmental and Energy Transitions for Regions and Cities (OECD, 2020[14]),
has highlighted, relative decoupling (GHG emissions rising less than GDP) is frequent. However, examples
of absolute long-term decoupling of environmental pressures are rare but absolute decoupling is needed
for environmental sustainability with respect to key environmental challenges such as biodiversity loss and
GHG emissions. Recently, some high-income countries have decoupled GDP from production and, to a
lesser extent, consumption-based CO2 emissions (Haberl et al., 2020[15]). CO2 emissions have slightly
decoupled from energy use and GDP in absolute terms since 2000 (Figure 3.3) but energy-related
emissions still contribute to around 80% of GHG emissions in OECD countries, with widespread sectoral
contributions to emissions across regions (Chapter 2). Some key well-being gains, such as better air
quality, are negatively related to emissions.
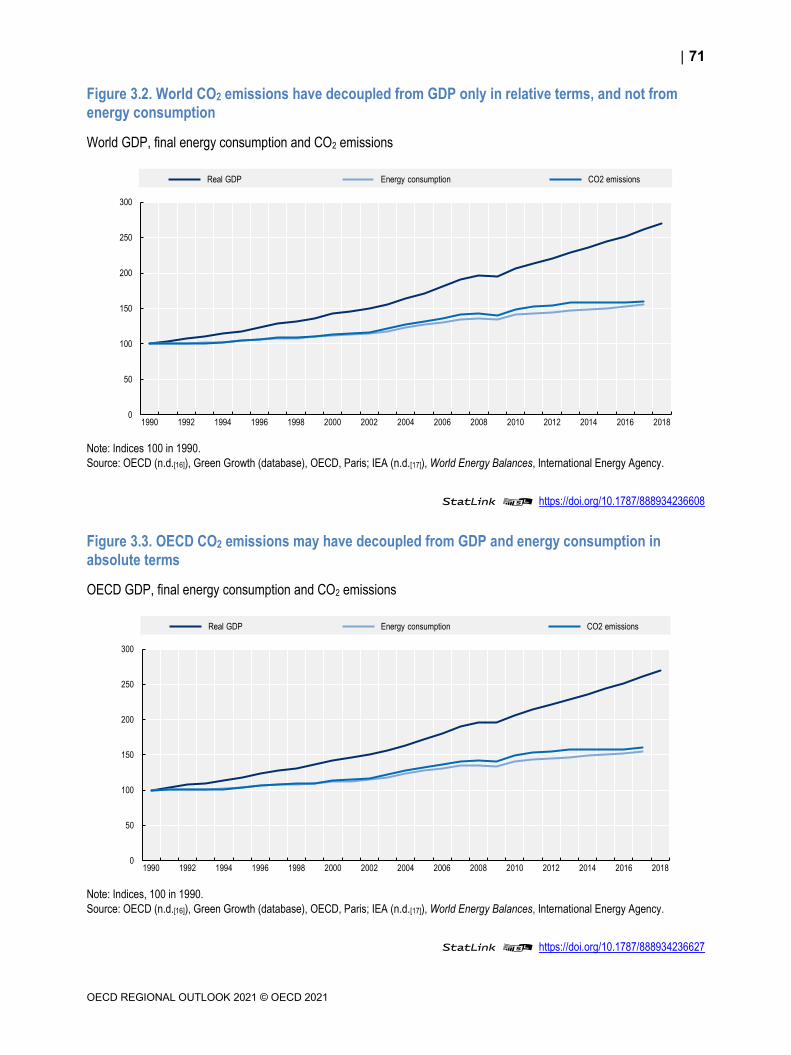
71
OECD REGIONAL OUTLOOK 2021 © OECD 2021
Figure 3.2. World CO2 emissions have decoupled from GDP only in relative terms, and not from energy consumption
World GDP, final energy consumption and CO2 emissions
Note: Indices 100 in 1990.
Source: OECD (n.d.[16]), Green Growth (database), OECD, Paris; IEA (n.d.[17]), World Energy Balances, International Energy Agency.
StatLink 2 https://doi.org/10.1787/888934236608
Figure 3.3. OECD CO2 emissions may have decoupled from GDP and energy consumption in absolute terms
OECD GDP, final energy consumption and CO2 emissions
Note: Indices, 100 in 1990.
Source: OECD (n.d.[16]), Green Growth (database), OECD, Paris; IEA (n.d.[17]), World Energy Balances, International Energy Agency.
StatLink 2 https://doi.org/10.1787/888934236627
0
50
100
150
200
250
300
1990 1992 1994 1996 1998 2000 2002 2004 2006 2008 2010 2012 2014 2016 2018
Real GDP Energy consumption CO2 emissions
0
50
100
150
200
250
300
1990 1992 1994 1996 1998 2000 2002 2004 2006 2008 2010 2012 2014 2016 2018
Real GDP Energy consumption CO2 emissions
72
OECD REGIONAL OUTLOOK 2021 © OECD 2021
The three pillars of climate mitigation action – energy, land use and urban policy (New Climate Economy,
2019[18]) -- are at the heart of regional development.
Moving to net-zero emissions requires most final energy demand to be electrified and most
electricity generation moved to zero-carbon sources, mostly renewable. To limit the costs and
environmental impacts, energy efficiency is key. As pointed out in by the OECD and the European
Union (EU) (2020[14]), the share of renewables needs to rise from 15% of the primary energy supply
in 2015 to two-thirds by 2050 (IEA, 2019[19]). The energy intensity of GDP may need to fall by about
two-thirds by 2050 (IRENA, 2020[20]). Technologies not yet deployed to scale, including hydrogen
and carbon capture and storage, will also play an important role (IEA, 2020[21]). Urban, regional
and rural policymakers will need to integrate transformations in the energy system, including
shifting spatial distribution of electricity supply and energy transformation as well as stronger
differentiation of pricing of electricity across time and space. They will also need to manage the
activities that may be inconsistent with zero emission goals, while protecting vulnerable groups
from employment loss.
Around 23% of global GHG emissions are related to land use (IPCC, 2019[22]). Food systems are
responsible for one-third of global GHG emissions (OECD, 2019[1]). These include agricultural
emissions as well as emissions from land use change, such as deforestation or loss of peatland.
Land use is also central to net-negative CO2 emissions.
Cities account for about 70% of demand-based energy-related CO2 emissions, as the recent OECD
report Managing Environmental and Energy Transitions for Regions and Cities (OECD, 2020[14])
has highlighted, following International Energy Agency (IEA) estimates based on United Nations
(UN) urban population statistics. Urbanisation is expected to continue increasing, especially in
middle-income countries, and is strongly associated with increases in energy demand. New
buildings already need to be constructed consistent with net-zero emissions in high-income
countries and all existing buildings refurbished. The complex socio-economic and geographic
systems of cities and regions within which they are integrated, requires a specific approach to
urban planning and energy-using activities, including transport. How related long-lived
infrastructure is laid out is key. In regions where urbanisation is advancing, incorporating zero-
emission development provides opportunities to provide services of cities at lower cost, while
providing the mitigation, adaptation and associated co-benefits.
Subnational governments play a key role in climate change mitigation
Energy and land use relate closely to local endowments in natural resources and infrastructure which
contribute to define the spatial distribution of economic activity. Local conditions are critical for defining
net-zero emission strategies, for example for connecting people to jobs, for the specific industrial mix and
enterprise fabric of cities and regions. Fifty percent to 80% of adaptation and mitigation actions require
regional and local implementation. They have been undervalued, though in federal countries they tend to
be better acknowledged (OECD, 2020[14]). Yet subnational governments have key relevant competencies
for climate policy (Box 3.2).
Effective place-based action requires co-ordinating national and international policies, to meet national and
international commitments and policy frameworks. Local governments may have direct power over less
than a third of urban GHG emissions reduction potential, with over two-thirds depending on either national
and state governments or co-ordination across levels of government. For example, pricing of GHG
emissions is cost-minimising if broad and even. Therefore, prices are ideally set at the supranational or,
failing that, national level. However, CO2 emissions are priced well below international climate cost
benchmarks and prices are uneven across sectors and fuels (OECD, 2018[23]). Pricing of non-CO2
emissions, such as methane emissions in agriculture, is rare. The difficulties in achieving broad pricing
often reflect distributional issues. Using place-based criteria for the distribution of carbon tax revenues, as

73
OECD REGIONAL OUTLOOK 2021 © OECD 2021
has been done in Canada, may help achieve progress. In any case, pricing is not enough. Excessively
short time horizons in investment decisions and knowledge externalities call for policy instruments to guide
investment, often at the regional level. There is a need to make substitutes available for high-emission
activity, requiring place-based collective decisions about networks such as energy or transport.
Box 3.2. The key competencies of subnational governments in climate policy
The recent OECD report An integrated approach to the Paris Climate Agreement (Matsumoto et al.,
2019[24]) has highlighted that local and regional governments have jurisdiction over crucial sectors for
climate action, including buildings and parts of transportation, other local infrastructure and waste
management. Many decisions taken by local authorities, such as local regulation on transport, building
construction mandates, spatial planning and economic policies, determine GHG emissions directly or
indirectly.
Cities and regions can also set examples of progressive emission reduction. They can develop, diffuse
and implement technological and social innovations, from e-scooters to zero-carbon local housing
strategies. They may be able to take action more rapidly as they have close contact with citizens and
businesses, as well as strong knowledge of local conditions and capabilities.
Local authorities are well-positioned to implement national emission reduction policies and are
instrumental in embedding climate action into spatial planning, infrastructure, local policies and budget
through locally-tailored climate strategies in line with national objectives. Local governments play an
essential role in supporting the most vulnerable as they understand the local issues faced by their
citizens.
Regions, facilitate co-ordination between the national and local levels, as well as co-operation among
local authorities. Regions have a role in climate mitigation and adaptation, given their responsibilities in
several areas having an impact on economic development (Matsumoto et al., 2019[24]).
Local well-being gains can offset the cost of a net-zero-emission transition
The sharp drop in the cost of renewable electricity has lowered the cost of net-zero-emission transitions.
The performance and cost of batteries, which help to integrate electricity from intermittent renewables in
energy use, has also improved sharply. They are often already cheaper than fossil fuel-incumbent
technologies, even without carbon pricing. Recent estimates for the UK suggest the resource cost of the
zero-emission transition may amount up to 1%-2% of GDP until 2050 (Climate Change Committee,
2019[2]). Costs are concentrated on the last 10%-20% of emissions abatement. The resource cost refers
to the net resources that need to be devoted to the transition, include higher investment. Negative GDP
impacts of the transition are more likely and more marked in fossil fuel-exporting regions (EC, 2018[25];
OECD, 2017[26]). Negative impacts are also more likely in regions with emission-intensive activities which
are difficult to decarbonise. The impact on the competitiveness of sectors subject to international
competition may depend on who bears resource costs in these sectors, especially if climate policies
proceed at unequal speed across countries. For example, if taxpayers assume resource costs in such
sectors, competitiveness in these sectors may be preserved, and resources would not need to be
reallocated to other sectors. Such reallocation may or may not affect national GDP (OECD, 2017[26]) but
would further impact the distribution of economic activity across regions.
Investment in research and development (R&D) and deployment of zero-emission technologies can lead
to more rapid cost reductions than projected and such cost reductions could also boost economic activity
(New Climate Economy, 2019[18]). Regions that attract such investment may benefit the most. For example,
the cost of producing and using hydrogen – which can be produced with zero emissions and allows long-
74
OECD REGIONAL OUTLOOK 2021 © OECD 2021
term storage of energy – has fallen substantially since 2019. Such cost declines may be the most likely in
replicable, modular technologies, such as in renewables and batteries. They have not occurred in nuclear
energy nor, so far, in carbon capture and storage (Climate Change Committee, 2019[2]). Policies to boost
zero-emission-consistent investment and innovation bring about such cost reductions. The GDP impact of
decisive climate action may also turn positive if accompanied by GDP-boosting structural reforms and
zero-carbon consistent investment, while carbon tax revenues could deliver substantial public debt
reductions (OECD, 2017[26]).
Achieving net-zero GHG emissions can result in substantial well-being gains, which can offset these costs
including human health. These benefits range from health and productivity to reducing energy poverty.
Overall, the societal well-being gains of climate neutrality remain largely unaccounted for (IPCC, 2018[4]).
A recent quantified assessment for the UK includes time gains from less traffic congestion as well as health
improvements from a shift to active mobility (walking, cycling), from less meat-intensive diets, improved air
quality and reduced traffic noise (Climate Change Committee, 2019[2]). These estimates suggest that
welfare impacts could reach a similar magnitude as the costs in high-income, fossil-fuel importing countries
and regions. The estimates are a broad approximation and do not include well-being benefits which are
difficult to quantify in monetary equivalents, including: health benefits from improved housing quality; lower
water and air pollution; improved biodiversity; climate resilience and recreational benefits from
transformations in land use and agriculture. The benefits of reduced air pollution may also be
underestimated given the increased evidence of the damaging impact of air pollution on a broad range of
human well-being and health outcomes in recent years. Economic outcomes may also improve with health.
Lower air pollution (Dechezleprêtre, 2019[27]) also boosts productivity. Several studies find that air quality
co-benefits offset a large proportion of climate policy costs (Karlsson, Alfredsson and Westling, 2020[28]).
For the East Asia region, the co-benefits of climate change mitigation in terms of human health may reach
6% of GDP, when also including the impact on adaptation costs. This exceeds the estimated cost of
mitigation of 2% of GDP (Xie et al., 2018[29]). Focusing on urban contexts, expenditures may be mostly
offset by the local co-benefits. Welfare effects may be strongly positive yet with slightly negative GDP and
employment effects. Economic co-benefits of climate change mitigation policies in urban mobility, for
example, can be put forward as a forceful argument for policymakers to take action (Wolkinger et al.,
2018[30]).
Well-being gains associated with emission reductions need to be included in project appraisal. To scale
up and deploy finance for environmental and energy transitions, well-being gains should be integrated in
cost-benefit analysis. Environmental and social criteria can be included in cost-benefit analysis to make
environmental costs and benefits part of a broad economic analysis (OECD, 2020[14]). For example, the
valuation of biodiversity and ecosystem services helps monetise environmental impacts of policies and
investment projects (OECD, 2018[31]). Appraisal guidance may need to be updated to reflect these benefits.
Despite potentially low overall costs overall, within countries, mitigation measures may have more profound
impacts on some regions than others, and households and businesses in these regions will need to be
actively supported through the transition to avoid creating new geographies of discontent and societal
pressures that may, in turn, slow progress towards the zero-carbon goals. Central and supranational
regional policy to address differences in regional impacts on well-being, employment and GDP and identify
vulnerable regions and individuals and compensate them. Policymakers will also need to pay attention not
to reward investment that has been inconsistent with the zero-emission transition, as this would harm
incentives for appropriate investment going forward.
Early action is key to avoid high costs
Good policy design is vital to keeping costs low and maximising benefits including a stable long-term
direction with clear governance, regular reviews for flexibility, use of markets to find the best solutions,
support for large-scale deployment and R&D of new technologies (Climate Change Committee, 2019[2]).
Integrating climate policy into development plans promotes synergies to reduces climate change risk and
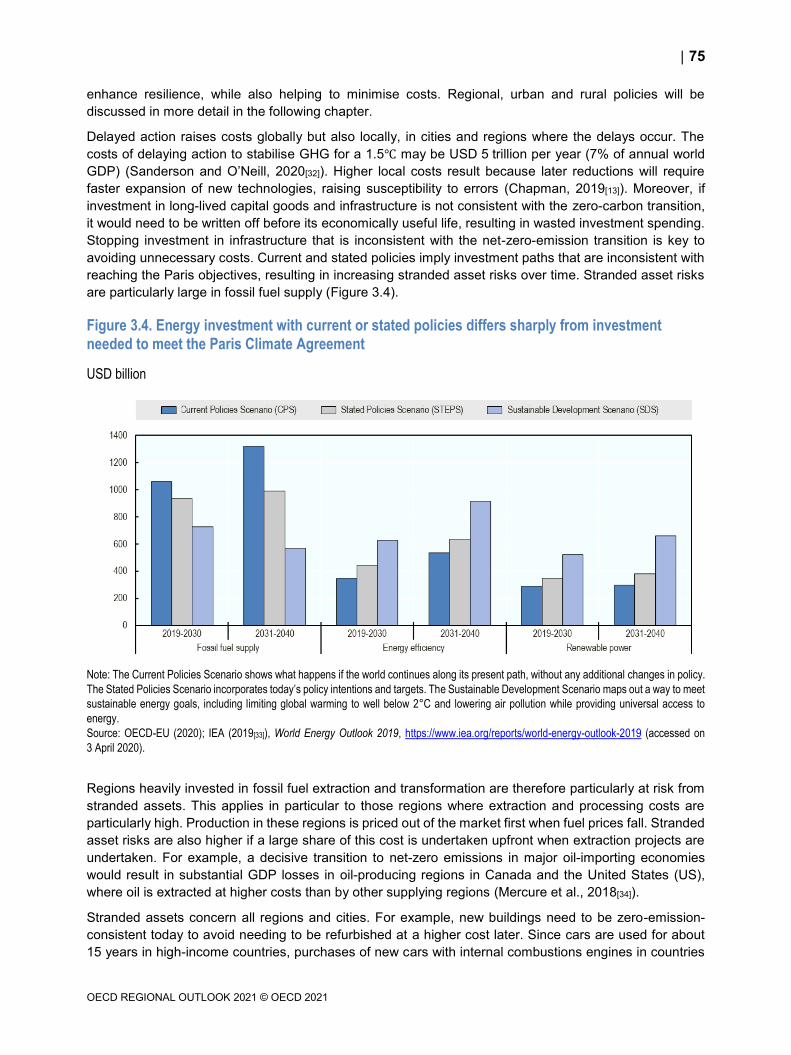
75
OECD REGIONAL OUTLOOK 2021 © OECD 2021
enhance resilience, while also helping to minimise costs. Regional, urban and rural policies will be
discussed in more detail in the following chapter.
Delayed action raises costs globally but also locally, in cities and regions where the delays occur. The
costs of delaying action to stabilise GHG for a 1.5℃ may be USD 5 trillion per year (7% of annual world
GDP) (Sanderson and O’Neill, 2020[32]). Higher local costs result because later reductions will require
faster expansion of new technologies, raising susceptibility to errors (Chapman, 2019[13]). Moreover, if
investment in long-lived capital goods and infrastructure is not consistent with the zero-carbon transition,
it would need to be written off before its economically useful life, resulting in wasted investment spending.
Stopping investment in infrastructure that is inconsistent with the net-zero-emission transition is key to
avoiding unnecessary costs. Current and stated policies imply investment paths that are inconsistent with
reaching the Paris objectives, resulting in increasing stranded asset risks over time. Stranded asset risks
are particularly large in fossil fuel supply (Figure 3.4).
Figure 3.4. Energy investment with current or stated policies differs sharply from investment needed to meet the Paris Climate Agreement
USD billion
Note: The Current Policies Scenario shows what happens if the world continues along its present path, without any additional changes in policy.
The Stated Policies Scenario incorporates today’s policy intentions and targets. The Sustainable Development Scenario maps out a way to meet
sustainable energy goals, including limiting global warming to well below 2°C and lowering air pollution while providing universal access to
energy.
Source: OECD-EU (2020); IEA (2019[33]), World Energy Outlook 2019, https://www.iea.org/reports/world-energy-outlook-2019 (accessed on
3 April 2020).
Regions heavily invested in fossil fuel extraction and transformation are therefore particularly at risk from
stranded assets. This applies in particular to those regions where extraction and processing costs are
particularly high. Production in these regions is priced out of the market first when fuel prices fall. Stranded
asset risks are also higher if a large share of this cost is undertaken upfront when extraction projects are
undertaken. For example, a decisive transition to net-zero emissions in major oil-importing economies
would result in substantial GDP losses in oil-producing regions in Canada and the United States (US),
where oil is extracted at higher costs than by other supplying regions (Mercure et al., 2018[34]).
Stranded assets concern all regions and cities. For example, new buildings need to be zero-emission-
consistent today to avoid needing to be refurbished at a higher cost later. Since cars are used for about
15 years in high-income countries, purchases of new cars with internal combustions engines in countries
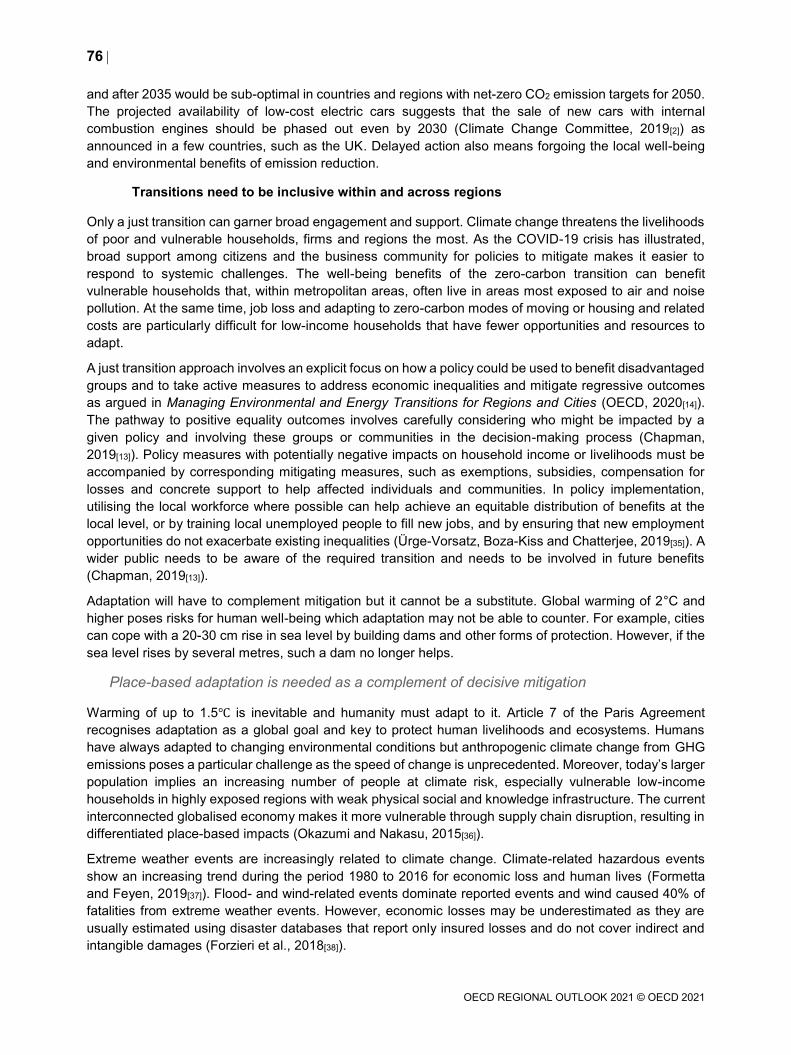
76
OECD REGIONAL OUTLOOK 2021 © OECD 2021
and after 2035 would be sub-optimal in countries and regions with net-zero CO2 emission targets for 2050.
The projected availability of low-cost electric cars suggests that the sale of new cars with internal
combustion engines should be phased out even by 2030 (Climate Change Committee, 2019[2]) as
announced in a few countries, such as the UK. Delayed action also means forgoing the local well-being
and environmental benefits of emission reduction.
Transitions need to be inclusive within and across regions
Only a just transition can garner broad engagement and support. Climate change threatens the livelihoods
of poor and vulnerable households, firms and regions the most. As the COVID-19 crisis has illustrated,
broad support among citizens and the business community for policies to mitigate makes it easier to
respond to systemic challenges. The well-being benefits of the zero-carbon transition can benefit
vulnerable households that, within metropolitan areas, often live in areas most exposed to air and noise
pollution. At the same time, job loss and adapting to zero-carbon modes of moving or housing and related
costs are particularly difficult for low-income households that have fewer opportunities and resources to
adapt.
A just transition approach involves an explicit focus on how a policy could be used to benefit disadvantaged
groups and to take active measures to address economic inequalities and mitigate regressive outcomes
as argued in Managing Environmental and Energy Transitions for Regions and Cities (OECD, 2020[14]).
The pathway to positive equality outcomes involves carefully considering who might be impacted by a
given policy and involving these groups or communities in the decision-making process (Chapman,
2019[13]). Policy measures with potentially negative impacts on household income or livelihoods must be
accompanied by corresponding mitigating measures, such as exemptions, subsidies, compensation for
losses and concrete support to help affected individuals and communities. In policy implementation,
utilising the local workforce where possible can help achieve an equitable distribution of benefits at the
local level, or by training local unemployed people to fill new jobs, and by ensuring that new employment
opportunities do not exacerbate existing inequalities (Ürge-Vorsatz, Boza-Kiss and Chatterjee, 2019[35]). A
wider public needs to be aware of the required transition and needs to be involved in future benefits
(Chapman, 2019[13]).
Adaptation will have to complement mitigation but it cannot be a substitute. Global warming of 2°C and
higher poses risks for human well-being which adaptation may not be able to counter. For example, cities
can cope with a 20-30 cm rise in sea level by building dams and other forms of protection. However, if the
sea level rises by several metres, such a dam no longer helps.
Place-based adaptation is needed as a complement of decisive mitigation
Warming of up to 1.5℃ is inevitable and humanity must adapt to it. Article 7 of the Paris Agreement
recognises adaptation as a global goal and key to protect human livelihoods and ecosystems. Humans
have always adapted to changing environmental conditions but anthropogenic climate change from GHG
emissions poses a particular challenge as the speed of change is unprecedented. Moreover, today’s larger
population implies an increasing number of people at climate risk, especially vulnerable low-income
households in highly exposed regions with weak physical social and knowledge infrastructure. The current
interconnected globalised economy makes it more vulnerable through supply chain disruption, resulting in
differentiated place-based impacts (Okazumi and Nakasu, 2015[36]).
Extreme weather events are increasingly related to climate change. Climate-related hazardous events
show an increasing trend during the period 1980 to 2016 for economic loss and human lives (Formetta
and Feyen, 2019[37]). Flood- and wind-related events dominate reported events and wind caused 40% of
fatalities from extreme weather events. However, economic losses may be underestimated as they are
usually estimated using disaster databases that report only insured losses and do not cover indirect and
intangible damages (Forzieri et al., 2018[38]).
77
OECD REGIONAL OUTLOOK 2021 © OECD 2021
Figure 3.5. Hazards and their impacts from 1980 to 2016
Source: Formetta, G. and L. Feyen (2019[37]), “Empirical evidence of declining global vulnerability to climate-related hazards”,
https://doi.org/10.1016/j.gloenvcha.2019.05.004; with data from Munich Re (n.d.[39]), NatCatServices (database), which reports insured and
direct losses only.
Without adaptation, consequences are substantial. For instance, with current climatic conditions, 1 in
5 people in cities are exposed to flood and 6% of cities risk being entirely flooded, as a recent OECD CFE
report, Cities in the World: A New Perspective on Urbanisation, has shown (2020[40]). Worldwide flood loss
from sea level rise of 40 cm in 2050 in 136 coastal cities is projected to reach USD 1 trillion per year
compared to USD 6 billion in 2005 (Hallegatte et al., 2013[41]). Around 63 million people per year would be
at risk of flooding even under a 1.5℃ warming (IPCC, 2018[11]). Exposure to a higher temperature and
heatwaves raises mortality substantially, even under 1.5°C (Zhang et al., 2018[42]). Without adaptation,
damage from multiple climate hazards to the present stock of infrastructure, for example in Europe, is
projected to increase more than tenfold, from EUR 3.4 billion/year in 2010 to EUR 37 billion/year by 2100
(Forzieri et al., 2018[38]). The estimated damage could be much larger if interdependent and cascading
damages are included. The additional impact of a one decimal increase in temperature is higher, the higher
the temperature.
Adaptation can reduce climate risk substantially and more effectively under 1.5℃ warming than under 2℃
warming (IPCC, 2018[11]) (Box 3.3). Adaptation can also generate additional benefits, including leisure
benefits of nature and environmental awareness (Kim and Song, 2019[43]). It can also stimulate innovation,
78
OECD REGIONAL OUTLOOK 2021 © OECD 2021
which in turn can boost economic activity (Global Commission on Adaptation, 2019[44]). Green
Infrastructure (GI) is especially notable for multiple benefits alongside adaptation (Box 3.4).
Box 3.3. Examples of quantified adaptation benefits
Taking decisive adaptation action such as reducing coastal flood risks in 136 cities in the face of
socio-economic vulnerability can reduce flood loss from USD 1 trillion to USD 52 billion by 2050
(Hallegatte et al., 2013[41]). Decisive adaptation action in Alaska was found to reduce expenditure on
infrastructure by USD 2.3 billion this century (Melvin et al., 2017[45]). Climate-proofing existing
infrastructures generate a benefit-cost ratio of four, only counting avoided losses from future climate
hazards. Better drainage and flood barriers can generate positive returns for 60% of the roads that are
exposed to at least a single flood event by investing just 2% of road value (Koks et al., 2019[46]).
Investing USD 1.8 trillion could generate a net benefit of USD 7.1 trillion by 2030 (Global Commission
on Adaptation, 2019[44]).
Climate change can exacerbate pre-existing social inequalities and social conflict (Hsiang et al., 2017[47];
Hsiang and Burke, 2014[48]). The marginalised and the poor bear the highest costs of damage relative to
their income and are disproportionately at higher risk to hazards (Winsemius et al., 2018[49]). Elderly
people, women and those with lower education level are more vulnerable to increased temperature
variation for example (Marí-Dell’Olmo et al., 2019[50]). Part of the poverty-increasing impact of climate
change comes from the adaptation of markets. For example, climate change will induce changes in land
prices which will make poor people live and work where they are more exposed. Food-importing regions
will be more affected by rising food prices and poor populations will be the most affected. Indigenous
peoples too are especially vulnerable to the impacts of climate change since they usually live in vulnerable
environments, including small islands, high-altitude zones, desert margins and the circumpolar Arctic
(Nakashima et al., 2012[51]). For instance, in Canada’s Northern regions, this is having increasingly
widespread repercussions on the life of Northern Peoples, such as with respect to food, their environment
and ecology (OECD, 2020[52]). Regional governments will need to counter these trends, bearing in mind
that rising poverty may further reduce the poor’s representation in adaptation decisions. They will also
need to emphasise preventive action to avoid moral hazard.
Hence, inclusive regional development not only reduces poverty and improves resilience to a broad range
of socio-economic shocks but also resilience to climate change. Improving inclusive outcomes in terms of
regional convergence of productivity, access to basic infrastructure services, notably health, water and
sanitation and modern energy by 2030, as in the UN Sustainable Development Goal (SDG) objectives, as
well as good social income protection systems diminish the impact of climate change on poverty
substantially. Strong mitigation action will prevent the poverty-increasing effects of climate change.
Box 3.4. Benefits of Green Infrastructure (GI)
Flood mitigation works that include GI components can provide multiple benefits, including energy
saving due to the thermal insulation provided by green roofs as well as carbon sequestration, surface
temperature reduction provided by pervious pavement and emissions reduction from energy saving
(Alves et al., 2019[53]). The benefits net of cost were valued at EUR 2.91/m2/year for the Sint Maarten
Island in the Netherlands (Alves et al., 2019[53]).
The multifunctionality of GI was demonstrated in a case study of 447 projects reporting 964 benefits
(Kim and Song, 2019[43]), which in broader terms were socio-cultural benefits, potential reduction in grey
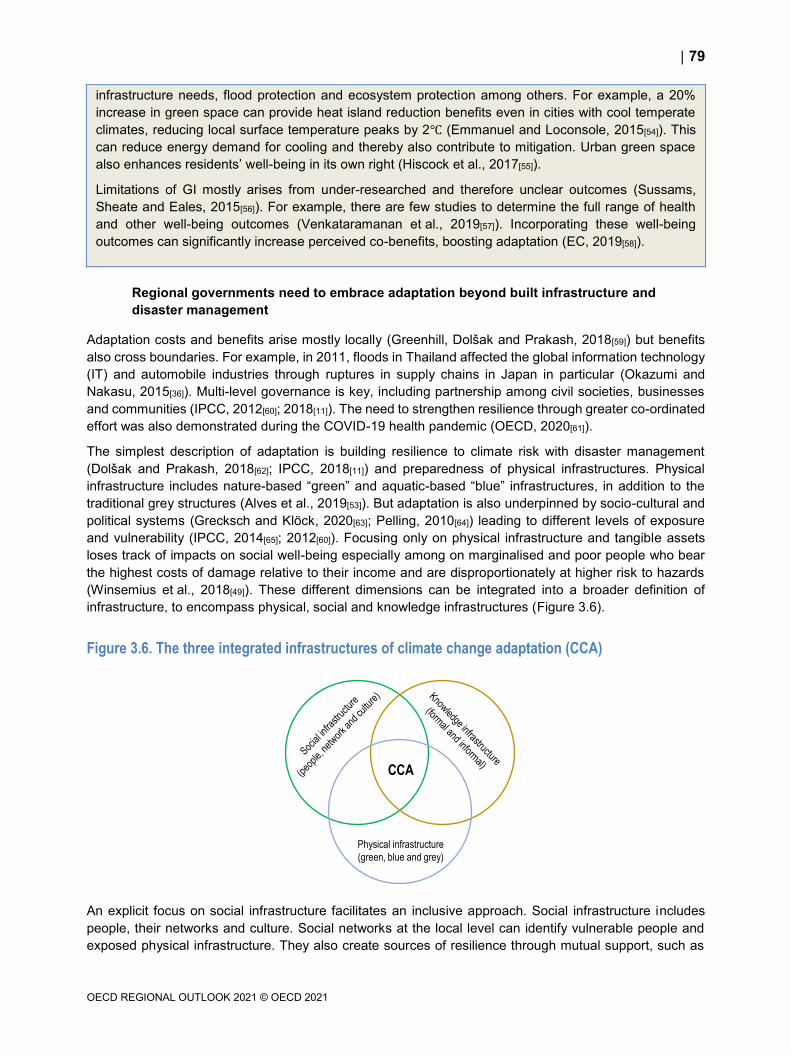
79
OECD REGIONAL OUTLOOK 2021 © OECD 2021
infrastructure needs, flood protection and ecosystem protection among others. For example, a 20%
increase in green space can provide heat island reduction benefits even in cities with cool temperate
climates, reducing local surface temperature peaks by 2℃ (Emmanuel and Loconsole, 2015[54]). This
can reduce energy demand for cooling and thereby also contribute to mitigation. Urban green space
also enhances residents’ well-being in its own right (Hiscock et al., 2017[55]).
Limitations of GI mostly arises from under-researched and therefore unclear outcomes (Sussams,
Sheate and Eales, 2015[56]). For example, there are few studies to determine the full range of health
and other well-being outcomes (Venkataramanan et al., 2019[57]). Incorporating these well-being
outcomes can significantly increase perceived co-benefits, boosting adaptation (EC, 2019[58]).
Regional governments need to embrace adaptation beyond built infrastructure and
disaster management
Adaptation costs and benefits arise mostly locally (Greenhill, Dolšak and Prakash, 2018[59]) but benefits
also cross boundaries. For example, in 2011, floods in Thailand affected the global information technology
(IT) and automobile industries through ruptures in supply chains in Japan in particular (Okazumi and
Nakasu, 2015[36]). Multi-level governance is key, including partnership among civil societies, businesses
and communities (IPCC, 2012[60]; 2018[11]). The need to strengthen resilience through greater co-ordinated
effort was also demonstrated during the COVID-19 health pandemic (OECD, 2020[61]).
The simplest description of adaptation is building resilience to climate risk with disaster management
(Dolšak and Prakash, 2018[62]; IPCC, 2018[11]) and preparedness of physical infrastructures. Physical
infrastructure includes nature-based “green” and aquatic-based “blue” infrastructures, in addition to the
traditional grey structures (Alves et al., 2019[53]). But adaptation is also underpinned by socio-cultural and
political systems (Grecksch and Klöck, 2020[63]; Pelling, 2010[64]) leading to different levels of exposure
and vulnerability (IPCC, 2014[65]; 2012[60]). Focusing only on physical infrastructure and tangible assets
loses track of impacts on social well-being especially among on marginalised and poor people who bear
the highest costs of damage relative to their income and are disproportionately at higher risk to hazards
(Winsemius et al., 2018[49]). These different dimensions can be integrated into a broader definition of
infrastructure, to encompass physical, social and knowledge infrastructures (Figure 3.6).
Figure 3.6. The three integrated infrastructures of climate change adaptation (CCA)
An explicit focus on social infrastructure facilitates an inclusive approach. Social infrastructure includes
people, their networks and culture. Social networks at the local level can identify vulnerable people and
exposed physical infrastructure. They also create sources of resilience through mutual support, such as
CCA
Physical infrastructure
(green, blue and grey)
80
OECD REGIONAL OUTLOOK 2021 © OECD 2021
through business organisations or neighbourhood associations. Subnational governments are well-placed
to draw on the resources of local networks. In rural regions in particular, regional governments are needed
to co-ordinate local government action, as rural municipalities are often very small. Community views on
climate impacts on their livelihoods can help uncover and overcome exposure and vulnerability and
increase communities’ willingness to participate in adaptation (Krauß and Bremer, 2020[66]).
Knowledge infrastructure (Taylor et al., 2020[67]) includes both formal and informal knowledge and its
integration in decision-making (Box 3.5). For example, experiential local knowledge and context-based rich
narratives can be added to existing geographical information tools (Taylor et al., 2020[67]). They can drive
policy discussion towards alternative perspectives on building urban resilience. Integrating these features
in adaptation requires transforming the governance system. (Flores et al., 2019[68]). For example, the
European Climate Adaptation Platform (Climate-ADAPT), a partnership between the European
Commission (EC) and the European Environment Agency, was created to learn and share adaptation
experiences. Drawing on formal and informal knowledge may help improve the range of costs and benefits
taken into account in project appraisal, especially in the context of unknown climate events and systemic
risks.
Box 3.5. Knowledge infrastructure
Formal knowledge is scientific or technical. It includes any technology used for data and information
flow such as early warning and observatory systems, which are primarily used for preventive adaptation.
Informal knowledge consists of local practices and Indigenous experience (Krauß and Bremer, 2020[66]),
which can identify local context-specific vulnerabilities and impacts. It requires stakeholder engagement
and a participatory approach. Integrating local knowledge alongside formal scientific knowledge
enriches the knowledge base (Ainsworth et al., 2020[69]) in the sense of filling the gaps that may exist
within each of these knowledge domains. While policy decisions need to be based on scientific
knowledge, decisions to make the most of synergies and trade-offs require local and informal
knowledge, as the COVID-19 crisis has illustrated. This also improves the chances of collective support.
Climate change will pose challenges to both urban and rural areas (OECD, 2020[14]). Local urban heat
islands, for instance, can increase local temperatures and modify meteorology in cities. These effects can
damage physical and social infrastructure, and increase energy demand for space cooling, further driving
up energy demand during higher peak loads. Tree cover has major impacts on land surface temperature
in heatwaves. Much urban population lives in low-lying coastal areas.
Rural areas may face future increased food market volatility, shifts and losses in plant and animal species
and, depending on the region, increased water scarcity, coastal erosion or wildfires. Changes in the timing
of seasons, temperatures and precipitation will also shift the locations where rural land-based economic
activities, like agriculture, forestry and tourism can thrive. More workers in rural areas may work outdoors,
exposing them more strongly to weather-related risks, such as excessive heat. Both urban and rural areas
are expected to experience major impacts on water quality and quantity, resulting in fierce competition
between water uses. Consequently, water policies need to be adjusted to changing local conditions and
water governance frameworks to manage trade-offs across water users, rural and urban areas, as well as
generations will need to be implemented (OECD, 2021[70]).
81
OECD REGIONAL OUTLOOK 2021 © OECD 2021
City and regional government agencies and organisations have developed adaptation plans and policies.
Examples include disaster risk management, infrastructure systems, agricultural adaptation and public
health. Adaptation requires co-operative private sector and governmental activities and integration with a
broad range of policies, for instance on land use planning, resource management and health. Current
efforts are insufficient. Most businesses do not get involved in adaptation for example. In the UK, only 20%
take preventive action, by following up on risk assessments periodically and by identifying and
implementing solutions (GRI, 2019[71]). This is unlikely to be cost-effective. In high-income OECD countries,
much progress has been made in identifying local hazards and making this information available. However,
this is less true for regions in low-income countries. As a result, adaptation spending is skewed and does
not correspond to vulnerabilities.
Higher resolution climate modelling is needed to identify regional climate change hazards and appropriate
adaptation action. More precise regional attribution of drought and flood risks for example will allow better-
targeted adaptation action. This may require centralising climate modelling research at the continental level
to bundle the resources needed for high-resolution modelling of climate impacts. Close co-ordination of
climate modelling with regional and local policymakers, who understand local vulnerabilities, will also
enable climate modelling to respond to local development needs. Integrating climate modelling and
regional development is therefore important (Shepherd and Sobel, 2020[72]).
Systemic risks from a simultaneous breakdown
Regions are increasingly physically interconnected through trade and digital information flows. This makes
them more vulnerable to system failures and breakdown where a single climate hazard can lead to
cascading extreme events (Pescaroli et al., 2018[73]) also referred to as systemic risks (OECD, 2003[74]). It
can occur with “unusual combinations of processes” (Zscheischler et al., 2018[75]). Climate change may
well add to such systemic risks as they are without historical precedence. It can complicate understanding,
preparation and prediction of future hazards, which interact with socio-economic transformations, such as
automation (Colvin et al., 2020[76]). Cascading risks are growing with climate risk for systems such as
critical infrastructures (Suo, Zhang and Sun, 2019[77]). They may be non-linear, stochastic and
interconnected (Renn, 2016[78]). Box 3.6 provides examples.
Box 3.6. Examples of cascading events
The 2011 Chao Phraya floods in Thailand, where 744 people lost lives and economic growth
decreased by 3.7% alongside chain-reaction damage across the globe through supply chain
disruptions for the automotive and IT industries.
The 2011 tsunami in Japan destabilised the Fukushima nuclear plant with a loss of
15 891 human lives and a damage cost of USD 140 billion (Okazumi and Nakasu, 2015[36]) with
supply chain disruptions in electronics components.
The 2017 flooding in Houston, US, caused by Hurricane Harvey, resulting in the explosion and
fire of a chemicals plant. The US is inflicted with such disaster on a yearly basis, costing
between USD 6 billion to 16 billion (Cutter, 2018[79]).
The cost of such cascading risks when accounting for their interactions is more than the sum of individual
events (Zscheischler et al., 2018[75]). This reinforces the need for coherence between disaster risk
reduction (DRR) and climate change adaptation (CCA) (OECD, 2020[80]).
The ongoing COVID19 health pandemic reminds us that regions need to be resilient to socio-economic
risks, which are the consequence of uncertain cascading events. It further shows that cascading events
can undermine socio-economic development more generally. For example, the cascading impacts of
82
OECD REGIONAL OUTLOOK 2021 © OECD 2021
COVID 19 caused supply chain disruption and lowered investment confidence across the globe, as well
as the human development index to turn negative (UNDP, 2020[81]; OECD, 2020[61]).
To tackle systemic risks (Dodman et al., 2019[82]), top-down impact modelling should be complemented
with science-based storytelling, to allow societies to understand the implications, and bottom-up
approaches, allowing local and regional key stakeholders to engage collaboratively (Zscheischler et al.,
2018[75]). This requires the need for integration of different knowledge paradigms and multi-level
governance. To test the readiness and adaptive capacity of critical infrastructures, low probability events
with high potential impact need to be considered, including weather events (Pescaroli et al., 2018[73]).
Strengthening resilience to systemic crisis events with unknown knock-on effects requires a holistic and
participatory approach (Edwards, 2009[83]; OECD, 2003[74]). An example is the “4 Es” framework:
Engagement, Education, Empowerment and Encouragement (Edwards, 2009[83]). Individual citizens and
communities need to engage with the climate policy agenda to gain trusted information. Critical reflection
on this information empowers them to participate in decision-making and encourages them to respond
quickly to problems before they fully materialise. This is vital to reduce disaster risks. Bounded rationality
may however limit these responses when humans are faced with something they have never experienced.
Governments, therefore, need to elaborate choice options to build resilience (Edwards, 2009[83]). This can
be facilitated by local and regional councils providing dedicated government staff and going beyond
communicating towards engaging with individuals and communities for better collective and individual
decisions. Educating the communities on risk management should connect to their ways of living, which
can empower them to act. This shows the need for place-based resilience programmes within the purview
of local and regional governments.
Where do regions stand: Indicators of progress, well-being impacts and
vulnerabilities
GHG emissions across OECD regions: Many variations across territories but not over
time
Metropolitan regions contribute about 60% of production-based GHG emissions (excluding emissions from
land use and land use change) across OECD countries (Box 3.7, Figure 3.7). However, metropolitan
emissions are the lowest per capita (Figure 3.8). Remote rural regions may emit three times more per
capita than large metropolitan regions, illustrating the extent of transformations of economic activities
required in remote regions. The remote rural regions’ contribution to total emissions is the largest in
transport and industry. They also make the largest contribution to agricultural emissions. In metropolitan
regions, emissions from electricity generation as well as the residential sector also make large
contributions. Regional production-based emissions are particularly useful to understand where production
will require the most transformation and related policy action.
Across all region types, per capita emissions have fallen little since 2010. Emissions and GDP per capita
are positively correlated and more clearly so if the highest-emitting regions are not considered (Annex
Figure 3.A.1). This relationship would be clearer if emissions were measured on a demand basis rather
than on a production basis, as high-income regions consume more goods and services, including
emission-intensive ones. Yet some high-emitting activities, such as heavy industry are located in low-
income countries with low consumption of goods and services. Indeed, among regions with high GDP, the
spread in emissions per capita is particularly wide. In those high GDP regions with low per capita
production-based emissions, demand-based emissions are still likely to be high.
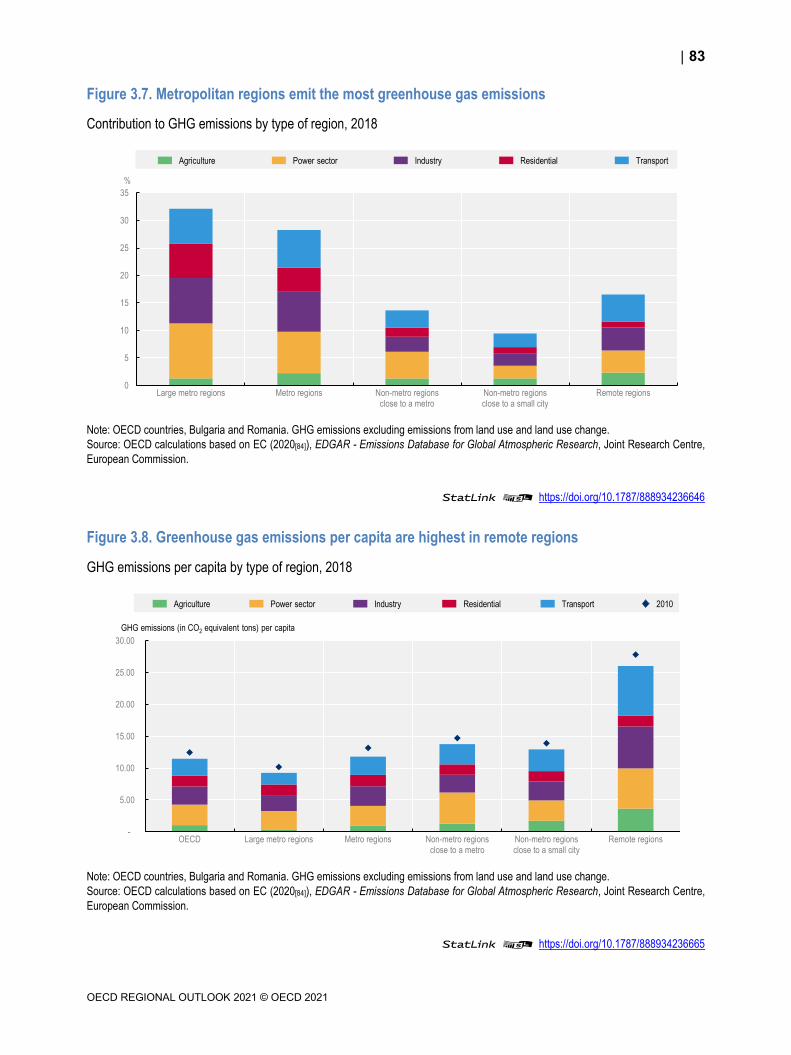
83
OECD REGIONAL OUTLOOK 2021 © OECD 2021
Figure 3.7. Metropolitan regions emit the most greenhouse gas emissions
Contribution to GHG emissions by type of region, 2018
Note: OECD countries, Bulgaria and Romania. GHG emissions excluding emissions from land use and land use change.
Source: OECD calculations based on EC (2020[84]), EDGAR - Emissions Database for Global Atmospheric Research, Joint Research Centre,
European Commission.
StatLink 2 https://doi.org/10.1787/888934236646
Figure 3.8. Greenhouse gas emissions per capita are highest in remote regions
GHG emissions per capita by type of region, 2018
Note: OECD countries, Bulgaria and Romania. GHG emissions excluding emissions from land use and land use change.
Source: OECD calculations based on EC (2020[84]), EDGAR - Emissions Database for Global Atmospheric Research, Joint Research Centre,
European Commission.
StatLink 2 https://doi.org/10.1787/888934236665
0
5
10
15
20
25
30
35
Large metro regions Metro regions Non-metro regionsclose to a metro
Non-metro regionsclose to a small city
Remote regions
%
Agriculture Power sector Industry Residential Transport
-
5.00
10.00
15.00
20.00
25.00
30.00
OECD Large metro regions Metro regions Non-metro regionsclose to a metro
Non-metro regionsclose to a small city
Remote regions
Agriculture Power sector Industry Residential Transport 2010
GHG emissions (in CO2 equivalent tons) per capita

84
OECD REGIONAL OUTLOOK 2021 © OECD 2021
Box 3.7. Regional greenhouse gas emission data
GHG emission data are mostly collected nationally and internationally. Regional data are collected
using local emission inventories only in a few countries. Where available, they are typically not
comparable across countries. Sectors may be defined differently and regionally collected data do not
always cover all emissions. In this OECD Regional Outlook report, regional emissions are estimated on
the basis of the Emissions Database for Global Atmospheric Research of the EC’s Joint Research
Centre (EDGAR, JRC 2020). It attributes national GHG emissions to locations according to about
300 proxies for 26 main sectors and subsectors, depending on the type of technology and International
Energy Agency (IEA) fuel types, following Intergovernmental Panel on Climate Change (IPCC) reporting
formats and guidelines. Locations of emissions are identified with various sources of spatial research
(Janssens-Maenhout et al., 2019[85]). The emissions data used in this study are from Crippa et al.
(2020[86]) for CO2, while non-CO2 GHG emissions data are from EDGAR.1 Total GHG emissions are
expressed as CO2 equivalents calculated using the 100-year global warming potential in the IPCC 5th
Assessment report (AR5). The proxies capture a substantial part but not all of the local emission
determinants. For example, residential emission estimates capture buildings and population but not the
degree of building insulation. Location estimates of agricultural emissions capture the number and
species of ruminant animals but not how they are fed.
The emissions are attributed to five sectors:
1. The power supply sector contains all combustion of fuels for electricity and heat generation.
2. The industry covers the whole value chain from mining primary materials to manufacturing and
recycling products. They include energy use process emissions and fugitive emissions.
3. Agriculture includes agricultural soils, agricultural waste burning, enteric fermentation and
manure management.
4. The residential sector includes buildings and waste.
5. Transport encompasses freight and passenger ground, sea and air transport.
Residential emissions are attributed spatially using high-resolution criteria on population and built-up
density. The dataset classifies six categories of human settlements (mostly uninhabited rural and
dispersed rural areas, villages, towns, suburbs and urban centres) using satellite imagery. These data
are combined with population density from the latest population censuses. Emissions from combustion
in the household and commercial sectors are attributed to total population density maps for all fossil
fuels.
Agricultural emission sources are attributed spatially according to agricultural land use, soil type, local
livestock density and crop type datasets and maps from the UN Food and Agricultural Organization
(FAO). Fuel combustion emissions in the agricultural sector are distributed over “rural” areas (mostly
uninhabited rural and dispersed rural areas) for all fuels with the exception of natural gas which is
assumed to be used mainly in cities, towns, villages and to a lesser extent in rural areas. A fishing map
is also used.
Industrial and power sector emissions are mainly located at the plant location co-ordinates on point
source grid maps. Power plant emissions have been distributed according to the point source
distribution data sets, including intensity parameters and differentiating the fuel types coal, gas and oil.
However, data on the location of power plants date back to 2012. A specific proxy captures emissions
in the non-metallic minerals production (mainly cement and lime) for the world-leading producers of
cement based on the plant locations and annual throughput. The difference between the total of the
facility emissions and the country total of the given sector is distributed using urban population data.
Gas flaring activities are distributed on night-time light data for areas with strong gas flaring activities
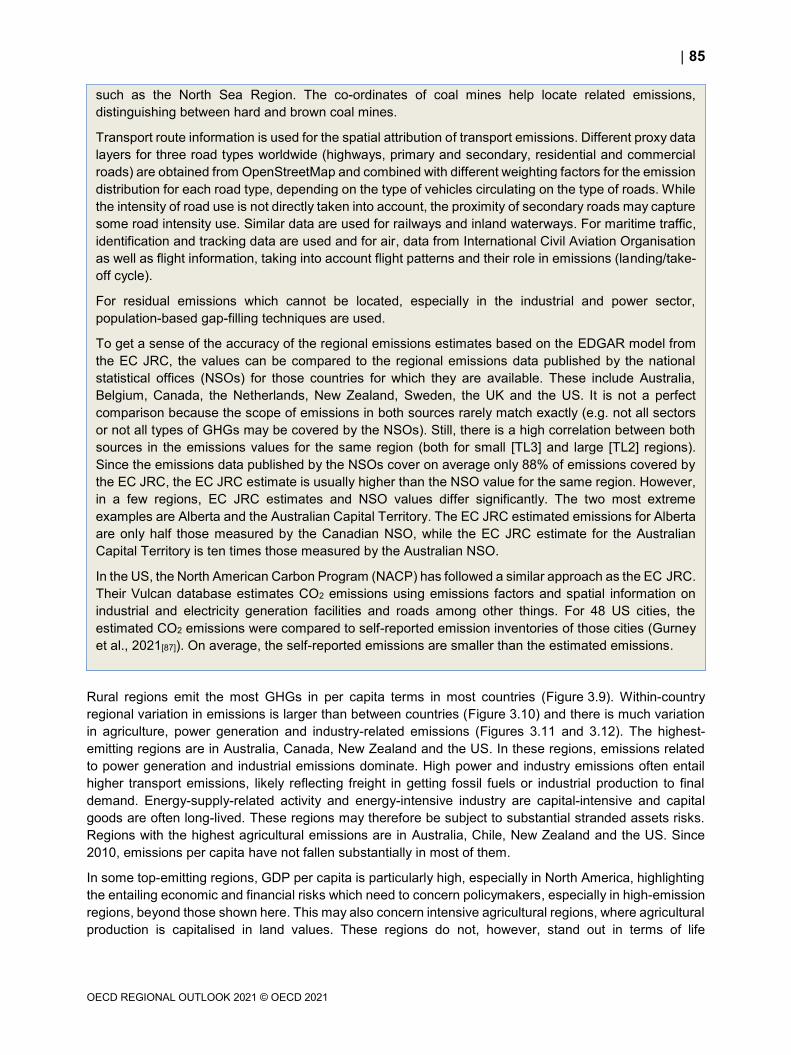
85
OECD REGIONAL OUTLOOK 2021 © OECD 2021
such as the North Sea Region. The co-ordinates of coal mines help locate related emissions,
distinguishing between hard and brown coal mines.
Transport route information is used for the spatial attribution of transport emissions. Different proxy data
layers for three road types worldwide (highways, primary and secondary, residential and commercial
roads) are obtained from OpenStreetMap and combined with different weighting factors for the emission
distribution for each road type, depending on the type of vehicles circulating on the type of roads. While
the intensity of road use is not directly taken into account, the proximity of secondary roads may capture
some road intensity use. Similar data are used for railways and inland waterways. For maritime traffic,
identification and tracking data are used and for air, data from International Civil Aviation Organisation
as well as flight information, taking into account flight patterns and their role in emissions (landing/take-
off cycle).
For residual emissions which cannot be located, especially in the industrial and power sector,
population-based gap-filling techniques are used.
To get a sense of the accuracy of the regional emissions estimates based on the EDGAR model from
the EC JRC, the values can be compared to the regional emissions data published by the national
statistical offices (NSOs) for those countries for which they are available. These include Australia,
Belgium, Canada, the Netherlands, New Zealand, Sweden, the UK and the US. It is not a perfect
comparison because the scope of emissions in both sources rarely match exactly (e.g. not all sectors
or not all types of GHGs may be covered by the NSOs). Still, there is a high correlation between both
sources in the emissions values for the same region (both for small [TL3] and large [TL2] regions).
Since the emissions data published by the NSOs cover on average only 88% of emissions covered by
the EC JRC, the EC JRC estimate is usually higher than the NSO value for the same region. However,
in a few regions, EC JRC estimates and NSO values differ significantly. The two most extreme
examples are Alberta and the Australian Capital Territory. The EC JRC estimated emissions for Alberta
are only half those measured by the Canadian NSO, while the EC JRC estimate for the Australian
Capital Territory is ten times those measured by the Australian NSO.
In the US, the North American Carbon Program (NACP) has followed a similar approach as the EC JRC.
Their Vulcan database estimates CO2 emissions using emissions factors and spatial information on
industrial and electricity generation facilities and roads among other things. For 48 US cities, the
estimated CO2 emissions were compared to self-reported emission inventories of those cities (Gurney
et al., 2021[87]). On average, the self-reported emissions are smaller than the estimated emissions.
Rural regions emit the most GHGs in per capita terms in most countries (Figure 3.9). Within-country
regional variation in emissions is larger than between countries (Figure 3.10) and there is much variation
in agriculture, power generation and industry-related emissions (Figures 3.11 and 3.12). The highest-
emitting regions are in Australia, Canada, New Zealand and the US. In these regions, emissions related
to power generation and industrial emissions dominate. High power and industry emissions often entail
higher transport emissions, likely reflecting freight in getting fossil fuels or industrial production to final
demand. Energy-supply-related activity and energy-intensive industry are capital-intensive and capital
goods are often long-lived. These regions may therefore be subject to substantial stranded assets risks.
Regions with the highest agricultural emissions are in Australia, Chile, New Zealand and the US. Since
2010, emissions per capita have not fallen substantially in most of them.
In some top-emitting regions, GDP per capita is particularly high, especially in North America, highlighting
the entailing economic and financial risks which need to concern policymakers, especially in high-emission
regions, beyond those shown here. This may also concern intensive agricultural regions, where agricultural
production is capitalised in land values. These regions do not, however, stand out in terms of life
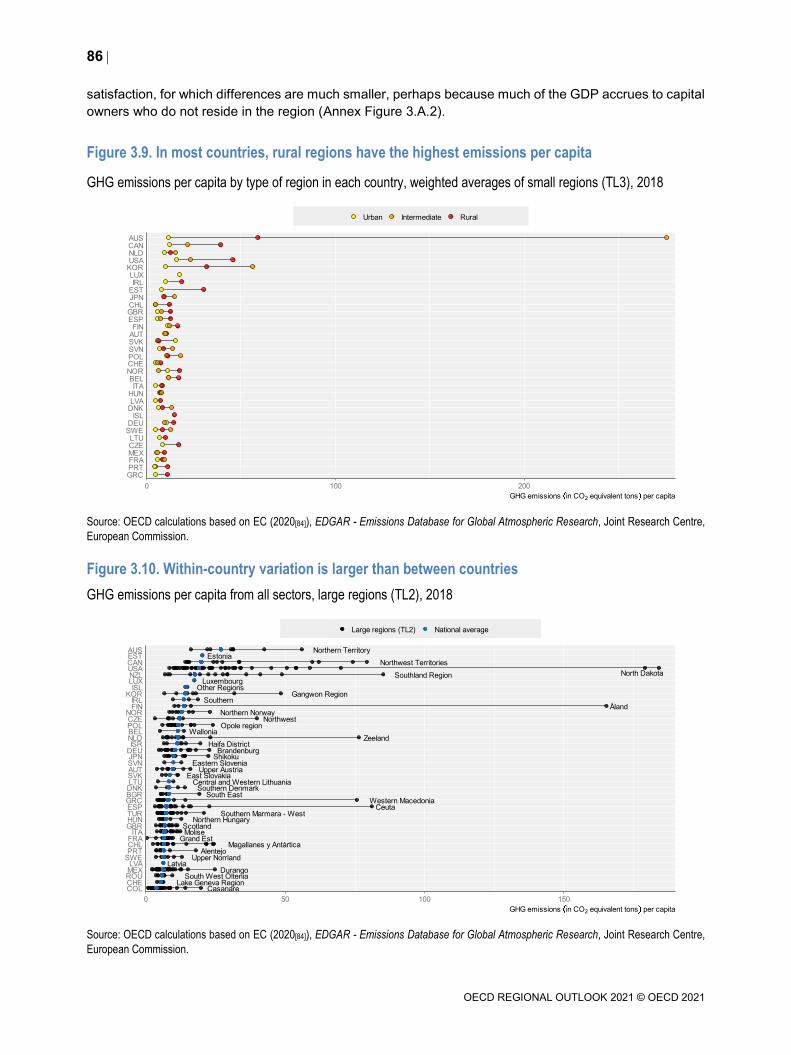
86
OECD REGIONAL OUTLOOK 2021 © OECD 2021
satisfaction, for which differences are much smaller, perhaps because much of the GDP accrues to capital
owners who do not reside in the region (Annex Figure 3.A.2).
Figure 3.9. In most countries, rural regions have the highest emissions per capita
GHG emissions per capita by type of region in each country, weighted averages of small regions (TL3), 2018
Source: OECD calculations based on EC (2020[84]), EDGAR - Emissions Database for Global Atmospheric Research, Joint Research Centre,
European Commission.
Figure 3.10. Within-country variation is larger than between countries
GHG emissions per capita from all sectors, large regions (TL2), 2018
Source: OECD calculations based on EC (2020[84]), EDGAR - Emissions Database for Global Atmospheric Research, Joint Research Centre,
European Commission.
GRCPRTFRAMEXCZELTU
SWEDEU
ISLDNKLVAHUN
ITABEL
NORCHEPOLSVNSVKAUTFIN
ESPGBRCHLJPNESTIRL
LUXKORUSANLDCANAUS
0 100 200
GHG emissions in CO2 equivalent tons per capita
Urban Intermediate Rural
Northern Territory
Upper Austria
Wallonia
South East
Northwest Territories
Lake Geneva Region
Magallanes y Antártica
Casanare
Northwest
Brandenburg
Southern Denmark
Ceuta
Estonia
Åland
Grand Est
Scotland
Western Macedonia
Northern Hungary
Southern
Other Regions
Haifa District
Molise
Shikoku
Gangwon Region
Central and Western Lithuania
Luxembourg
LatviaDurango
Zeeland
Northern Norway
Southland Region
Opole region
Alentejo
South West Oltenia
East Slovakia
Eastern Slovenia
Upper Norrland
Southern Marmara - West
North Dakota
COLCHEROUMEXLVA
SWEPRTCHLFRAITA
GBRHUNTURESPGRCBGRDNKLTUSVKAUTSVNJPNDEUISR
NLDBELPOLCZENOR
FINIRL
KORISL
LUXNZLUSACANESTAUS
0 50 100 150
GHG emissions in CO2 equivalent tons per capita
Large regions (TL2) National average
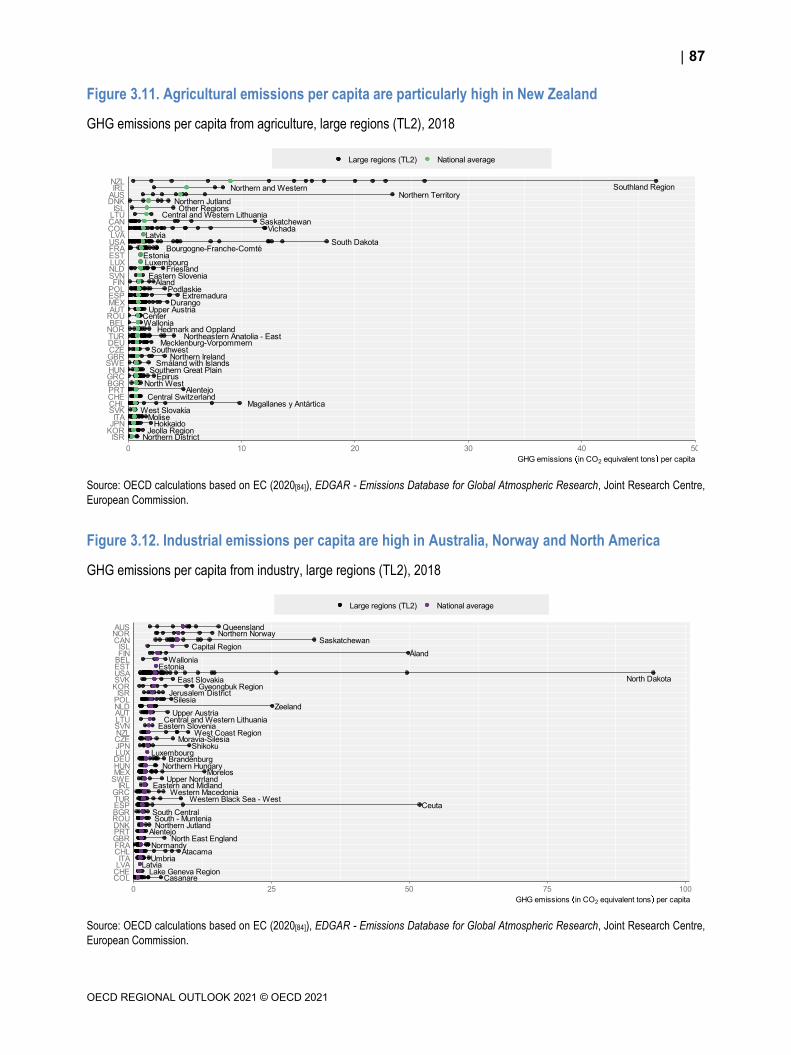
87
OECD REGIONAL OUTLOOK 2021 © OECD 2021
Figure 3.11. Agricultural emissions per capita are particularly high in New Zealand
GHG emissions per capita from agriculture, large regions (TL2), 2018
Source: OECD calculations based on EC (2020[84]), EDGAR - Emissions Database for Global Atmospheric Research, Joint Research Centre,
European Commission.
Figure 3.12. Industrial emissions per capita are high in Australia, Norway and North America
GHG emissions per capita from industry, large regions (TL2), 2018
Source: OECD calculations based on EC (2020[84]), EDGAR - Emissions Database for Global Atmospheric Research, Joint Research Centre,
European Commission.
Northern Territory
Upper Austria
Wallonia
North West
Saskatchewan
Central SwitzerlandMagallanes y Antártica
Vichada
SouthwestMecklenburg-Vorpommern
Northern Jutland
Extremadura
Estonia
Åland
Bourgogne-Franche-Comté
Northern Ireland
EpirusSouthern Great Plain
Northern and Western
Other Regions
Northern District
MoliseHokkaido
Jeolla Region
Central and Western Lithuania
Luxembourg
Latvia
Durango
Friesland
Hedmark and Oppland
Podlaskie
Alentejo
Center
West Slovakia
Eastern Slovenia
Småland with Islands
Northeastern Anatolia - East
South Dakota
Southland Region
ISRKORJPNITA
SVKCHLCHEPRTBGRGRCHUN
SWEGBRCZEDEUTURNORBEL
ROUAUTMEXESPPOLFIN
SVNNLDLUXESTFRAUSALVA
COLCANLTUISL
DNKAUSIRLNZL
0 10 20 30 40 50
GHG emissions in CO2 equivalent tons per capita
Large regions (TL2) National average
Queensland
Upper Austria
Wallonia
South Central
Saskatchewan
Lake Geneva Region
Atacama
Casanare
Moravia-Silesia
Brandenburg
Northern Jutland
Ceuta
Estonia
Åland
NormandyNorth East England
Western Macedonia
Northern Hungary
Eastern and Midland
Capital Region
Jerusalem District
Umbria
Shikoku
Gyeongbuk Region
Central and Western Lithuania
Luxembourg
Latvia
Morelos
Zeeland
Northern Norway
West Coast Region
Silesia
Alentejo
South - Muntenia
East Slovakia
Eastern Slovenia
Upper Norrland
Western Black Sea - West
North Dakota
COLCHELVAITA
CHLFRAGBRPRTDNKROUBGRESPTURGRC
IRLSWEMEXHUNDEULUXJPNCZENZLSVNLTUAUTNLDPOLISR
KORSVKUSAESTBELFINISL
CANNORAUS
0 25 50 75 100
GHG emissions in CO2 equivalent tons per capita
Large regions (TL2) National average

88
OECD REGIONAL OUTLOOK 2021 © OECD 2021
Figure 3.13. Energy emissions per capita are high in some Dutch, Finnish, Greek and US regions
GHG emissions per capita from the power sector, large regions (TL2), 2018
Source: OECD calculations based on EC (2020[84]), EDGAR - Emissions Database for Global Atmospheric Research, Joint Research Centre,
European Commission.
Figure 3.14. In most of the highest-emitting regions, energy supply, transport and industry-related emissions dominate
GHG emissions per capita in the highest-emitting large regions (TL2), 2018
Source: OECD calculations based on EC (2020[84]), EDGAR - Emissions Database for Global Atmospheric Research, Joint Research Centre,
European Commission.
Australian Capital Territory
Upper AustriaFlemish Region
South East
Saskatchewan
Lake Geneva Region
Antofagasta
Boyacá
Northwest
Brandenburg
Southern Denmark
Asturias
Estonia
Grand Est
East Midlands
Western Macedonia
Northern Hungary
Southern
Capital Region
Haifa District
Apulia
Shikoku
Gangwon Region
Central and Western Lithuania
LuxembourgLatvia
Guerrero
Zeeland
Agder and Rogaland
Taranaki Region
Opole region
Alentejo
South West OlteniaBratislava Region
Eastern Slovenia
South Sweden
Southern Marmara - West
Wyoming
Åland
Northern and Western
ISLCOLCHENORFRALTU
SWELUXLVANZLMEXHUNGBRSVKROUESPAUTBELITA
DNKTURPRTCHLIRL
SVNCANGRCNLDFIN
BGRDEUPOLISRJPNCZEUSAKORAUSEST
0 25 50 75 100
GHG emissions in CO2 equivalent tons per capita
Large regions (TL2) National average
0
50
100
150
200
250
300
GHG emissions (in CO2
equivalent tons) per capita
Agriculture Power sector Industry Residential Transport 2010
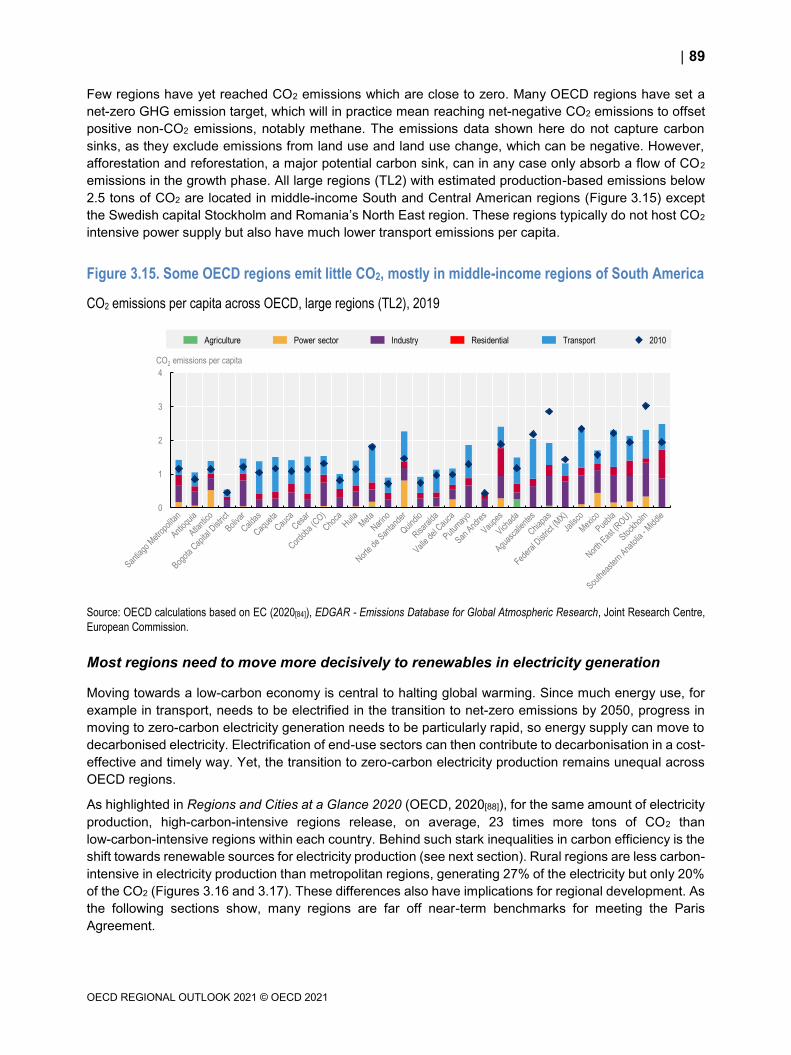
89
OECD REGIONAL OUTLOOK 2021 © OECD 2021
Few regions have yet reached CO2 emissions which are close to zero. Many OECD regions have set a
net-zero GHG emission target, which will in practice mean reaching net-negative CO2 emissions to offset
positive non-CO2 emissions, notably methane. The emissions data shown here do not capture carbon
sinks, as they exclude emissions from land use and land use change, which can be negative. However,
afforestation and reforestation, a major potential carbon sink, can in any case only absorb a flow of CO2
emissions in the growth phase. All large regions (TL2) with estimated production-based emissions below
2.5 tons of CO2 are located in middle-income South and Central American regions (Figure 3.15) except
the Swedish capital Stockholm and Romania’s North East region. These regions typically do not host CO2
intensive power supply but also have much lower transport emissions per capita.
Figure 3.15. Some OECD regions emit little CO2, mostly in middle-income regions of South America
CO2 emissions per capita across OECD, large regions (TL2), 2019
Source: OECD calculations based on EC (2020[84]), EDGAR - Emissions Database for Global Atmospheric Research, Joint Research Centre,
European Commission.
Most regions need to move more decisively to renewables in electricity generation
Moving towards a low-carbon economy is central to halting global warming. Since much energy use, for
example in transport, needs to be electrified in the transition to net-zero emissions by 2050, progress in
moving to zero-carbon electricity generation needs to be particularly rapid, so energy supply can move to
decarbonised electricity. Electrification of end-use sectors can then contribute to decarbonisation in a cost-
effective and timely way. Yet, the transition to zero-carbon electricity production remains unequal across
OECD regions.
As highlighted in Regions and Cities at a Glance 2020 (OECD, 2020[88]), for the same amount of electricity
production, high-carbon-intensive regions release, on average, 23 times more tons of CO2 than
low-carbon-intensive regions within each country. Behind such stark inequalities in carbon efficiency is the
shift towards renewable sources for electricity production (see next section). Rural regions are less carbon-
intensive in electricity production than metropolitan regions, generating 27% of the electricity but only 20%
of the CO2 (Figures 3.16 and 3.17). These differences also have implications for regional development. As
the following sections show, many regions are far off near-term benchmarks for meeting the Paris
Agreement.
0
1
2
3
4
CO2 emissions per capita
Agriculture Power sector Industry Residential Transport 2010
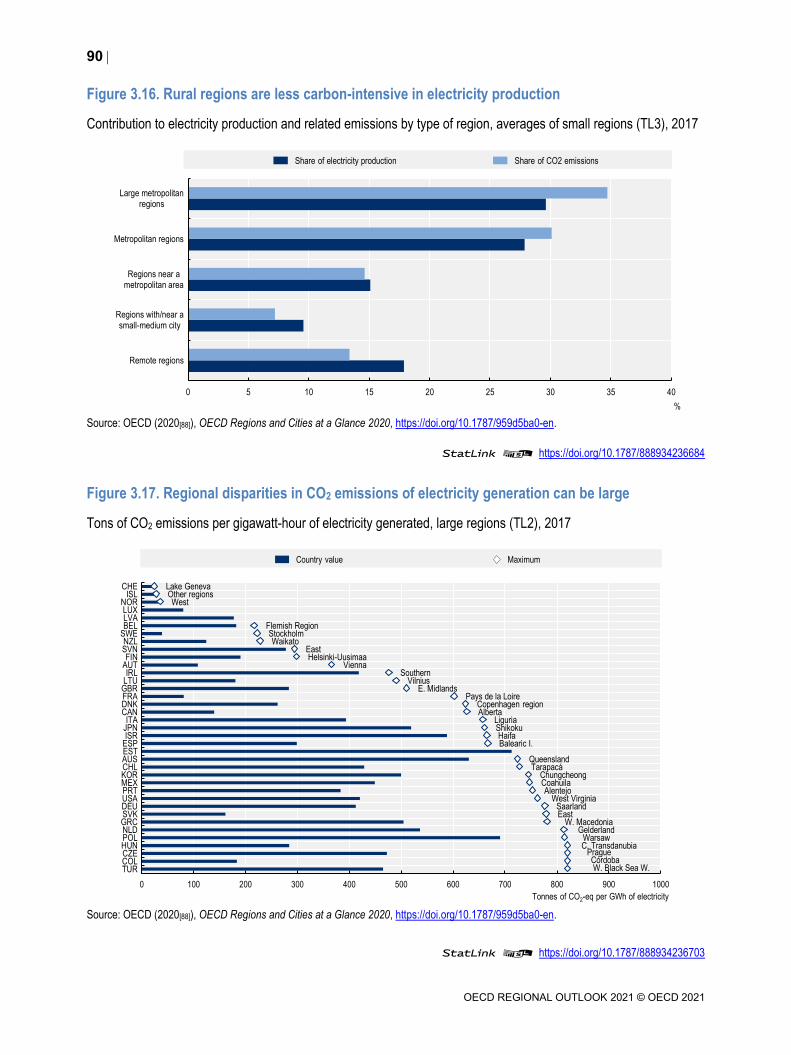
90
OECD REGIONAL OUTLOOK 2021 © OECD 2021
Figure 3.16. Rural regions are less carbon-intensive in electricity production
Contribution to electricity production and related emissions by type of region, averages of small regions (TL3), 2017
Source: OECD (2020[88]), OECD Regions and Cities at a Glance 2020, https://doi.org/10.1787/959d5ba0-en.
StatLink 2 https://doi.org/10.1787/888934236684
Figure 3.17. Regional disparities in CO2 emissions of electricity generation can be large
Tons of CO2 emissions per gigawatt-hour of electricity generated, large regions (TL2), 2017
Source: OECD (2020[88]), OECD Regions and Cities at a Glance 2020, https://doi.org/10.1787/959d5ba0-en.
StatLink 2 https://doi.org/10.1787/888934236703
0 5 10 15 20 25 30 35 40
Remote regions
Regions with/near asmall-medium city
Regions near ametropolitan area
Metropolitan regions
Large metropolitanregions
%
Share of electricity production Share of CO2 emissions
W. Black Sea W.Córdoba
PragueC. TransdanubiaWarsaw
GelderlandW. Macedonia
EastSaarland
West VirginiaAlentejo
CoahuilaChungcheong
TarapacáQueensland
Balearic I.Haifa
ShikokuLiguria
AlbertaCopenhagen region
Pays de la LoireE. Midlands
VilniusSouthern
ViennaHelsinki-Uusimaa
EastWaikato
StockholmFlemish Region
WestOther regionsLake Geneva
0 100 200 300 400 500 600 700 800 900 1000
TURCOLCZEHUNPOLNLDGRCSVKDEUUSAPRTMEXKORCHLAUSESTESPISRJPNITA
CANDNKFRAGBRLTUIRL
AUTFIN
SVNNZL
SWEBELLVALUX
NORISL
CHE
Tonnes of CO2-eq per GWh of electricity
Country value Maximum
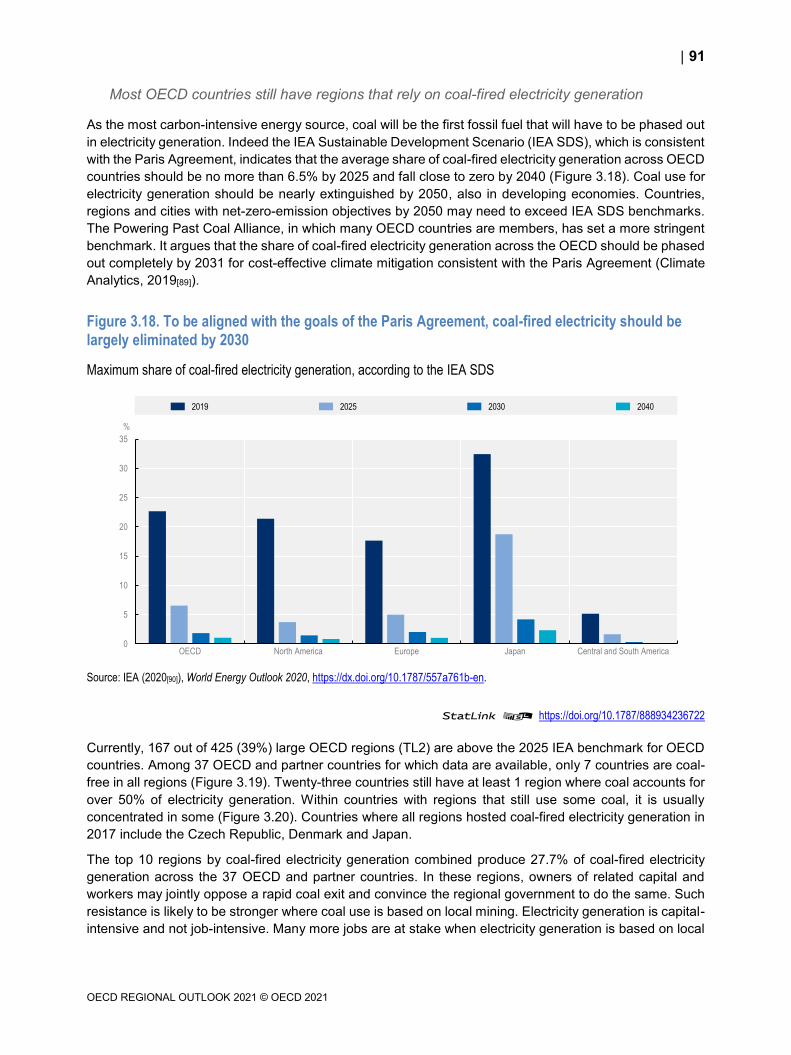
91
OECD REGIONAL OUTLOOK 2021 © OECD 2021
Most OECD countries still have regions that rely on coal-fired electricity generation
As the most carbon-intensive energy source, coal will be the first fossil fuel that will have to be phased out
in electricity generation. Indeed the IEA Sustainable Development Scenario (IEA SDS), which is consistent
with the Paris Agreement, indicates that the average share of coal-fired electricity generation across OECD
countries should be no more than 6.5% by 2025 and fall close to zero by 2040 (Figure 3.18). Coal use for
electricity generation should be nearly extinguished by 2050, also in developing economies. Countries,
regions and cities with net-zero-emission objectives by 2050 may need to exceed IEA SDS benchmarks.
The Powering Past Coal Alliance, in which many OECD countries are members, has set a more stringent
benchmark. It argues that the share of coal-fired electricity generation across the OECD should be phased
out completely by 2031 for cost-effective climate mitigation consistent with the Paris Agreement (Climate
Analytics, 2019[89]).
Figure 3.18. To be aligned with the goals of the Paris Agreement, coal-fired electricity should be largely eliminated by 2030
Maximum share of coal-fired electricity generation, according to the IEA SDS
Source: IEA (2020[90]), World Energy Outlook 2020, https://dx.doi.org/10.1787/557a761b-en.
StatLink 2 https://doi.org/10.1787/888934236722
Currently, 167 out of 425 (39%) large OECD regions (TL2) are above the 2025 IEA benchmark for OECD
countries. Among 37 OECD and partner countries for which data are available, only 7 countries are coal-
free in all regions (Figure 3.19). Twenty-three countries still have at least 1 region where coal accounts for
over 50% of electricity generation. Within countries with regions that still use some coal, it is usually
concentrated in some (Figure 3.20). Countries where all regions hosted coal-fired electricity generation in
2017 include the Czech Republic, Denmark and Japan.
The top 10 regions by coal-fired electricity generation combined produce 27.7% of coal-fired electricity
generation across the 37 OECD and partner countries. In these regions, owners of related capital and
workers may jointly oppose a rapid coal exit and convince the regional government to do the same. Such
resistance is likely to be stronger where coal use is based on local mining. Electricity generation is capital-
intensive and not job-intensive. Many more jobs are at stake when electricity generation is based on local
0
5
10
15
20
25
30
35
OECD North America Europe Japan Central and South America
%
2019 2025 2030 2040
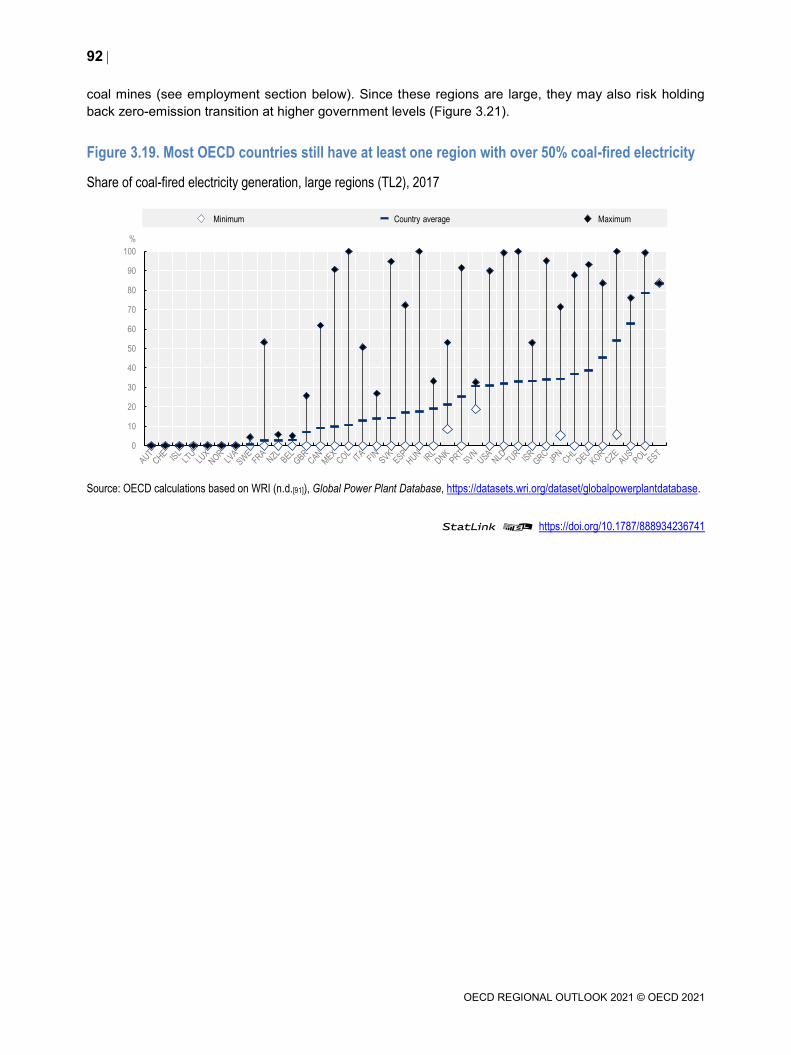
92
OECD REGIONAL OUTLOOK 2021 © OECD 2021
coal mines (see employment section below). Since these regions are large, they may also risk holding
back zero-emission transition at higher government levels (Figure 3.21).
Figure 3.19. Most OECD countries still have at least one region with over 50% coal-fired electricity
Share of coal-fired electricity generation, large regions (TL2), 2017
Source: OECD calculations based on WRI (n.d.[91]), Global Power Plant Database, https://datasets.wri.org/dataset/globalpowerplantdatabase.
StatLink 2 https://doi.org/10.1787/888934236741
0
10
20
30
40
50
60
70
80
90
100
%
Minimum Country average Maximum
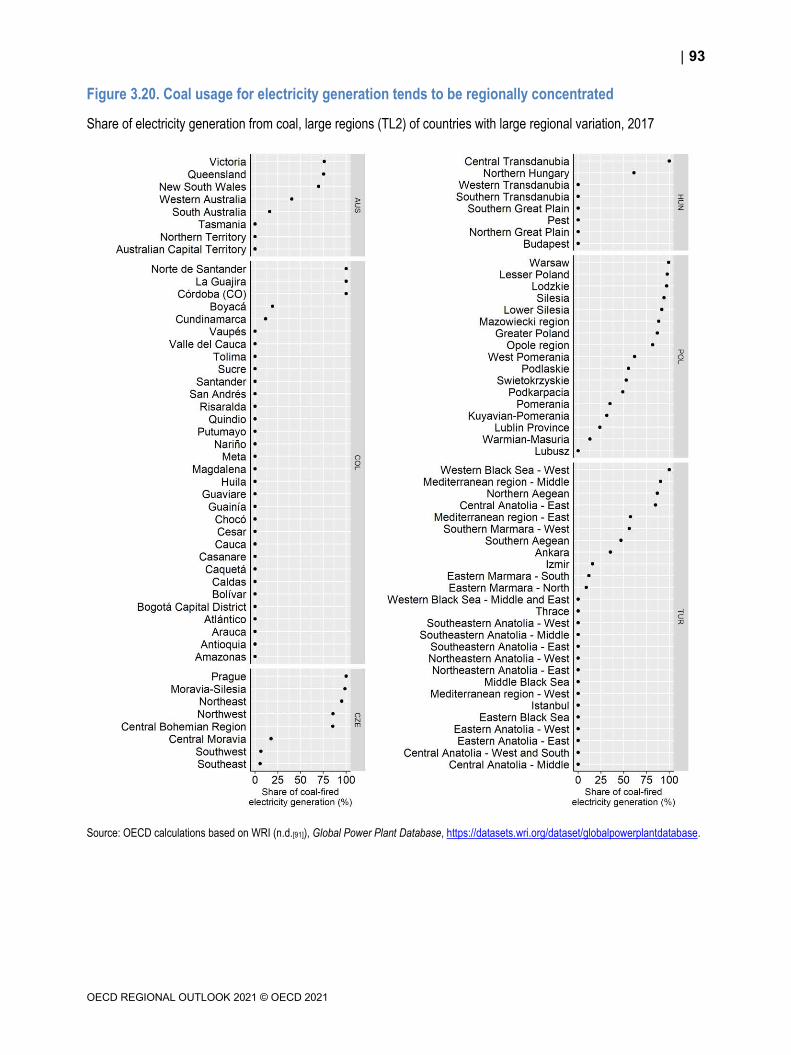
93
OECD REGIONAL OUTLOOK 2021 © OECD 2021
Figure 3.20. Coal usage for electricity generation tends to be regionally concentrated
Share of electricity generation from coal, large regions (TL2) of countries with large regional variation, 2017
Source: OECD calculations based on WRI (n.d.[91]), Global Power Plant Database, https://datasets.wri.org/dataset/globalpowerplantdatabase.
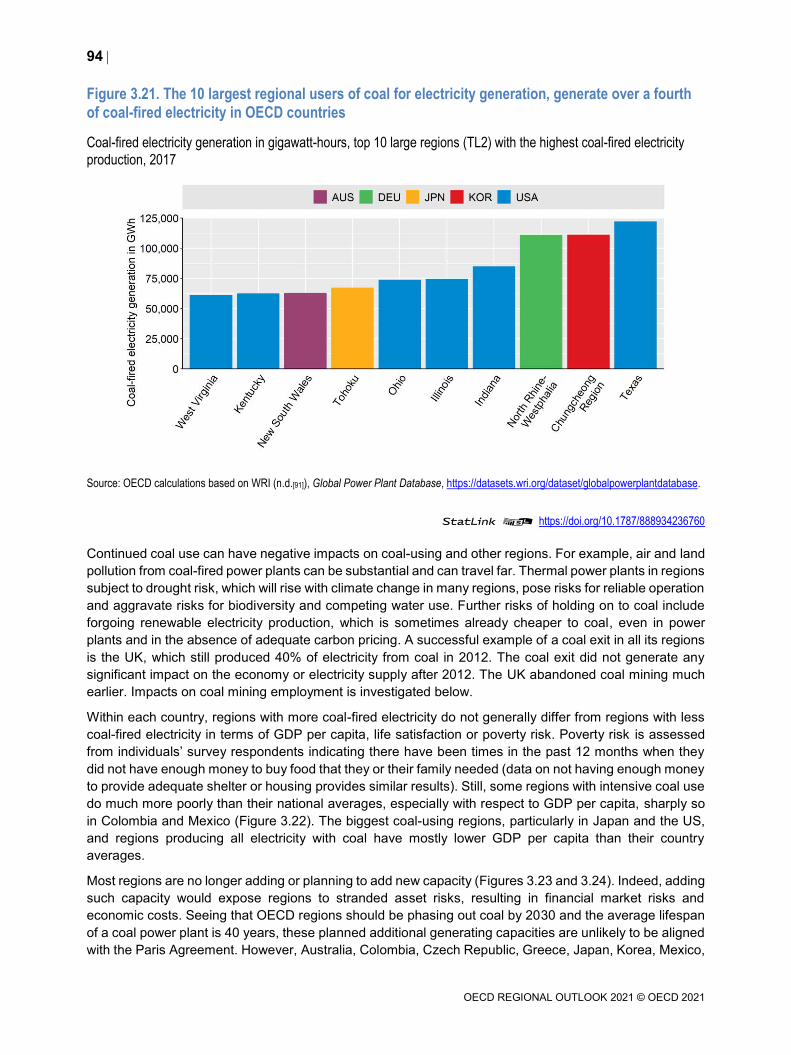
94
OECD REGIONAL OUTLOOK 2021 © OECD 2021
Figure 3.21. The 10 largest regional users of coal for electricity generation, generate over a fourth of coal-fired electricity in OECD countries
Coal-fired electricity generation in gigawatt-hours, top 10 large regions (TL2) with the highest coal-fired electricity
production, 2017
Source: OECD calculations based on WRI (n.d.[91]), Global Power Plant Database, https://datasets.wri.org/dataset/globalpowerplantdatabase.
StatLink 2 https://doi.org/10.1787/888934236760
Continued coal use can have negative impacts on coal-using and other regions. For example, air and land
pollution from coal-fired power plants can be substantial and can travel far. Thermal power plants in regions
subject to drought risk, which will rise with climate change in many regions, pose risks for reliable operation
and aggravate risks for biodiversity and competing water use. Further risks of holding on to coal include
forgoing renewable electricity production, which is sometimes already cheaper to coal, even in power
plants and in the absence of adequate carbon pricing. A successful example of a coal exit in all its regions
is the UK, which still produced 40% of electricity from coal in 2012. The coal exit did not generate any
significant impact on the economy or electricity supply after 2012. The UK abandoned coal mining much
earlier. Impacts on coal mining employment is investigated below.
Within each country, regions with more coal-fired electricity do not generally differ from regions with less
coal-fired electricity in terms of GDP per capita, life satisfaction or poverty risk. Poverty risk is assessed
from individuals’ survey respondents indicating there have been times in the past 12 months when they
did not have enough money to buy food that they or their family needed (data on not having enough money
to provide adequate shelter or housing provides similar results). Still, some regions with intensive coal use
do much more poorly than their national averages, especially with respect to GDP per capita, sharply so
in Colombia and Mexico (Figure 3.22). The biggest coal-using regions, particularly in Japan and the US,
and regions producing all electricity with coal have mostly lower GDP per capita than their country
averages.
Most regions are no longer adding or planning to add new capacity (Figures 3.23 and 3.24). Indeed, adding
such capacity would expose regions to stranded asset risks, resulting in financial market risks and
economic costs. Seeing that OECD regions should be phasing out coal by 2030 and the average lifespan
of a coal power plant is 40 years, these planned additional generating capacities are unlikely to be aligned
with the Paris Agreement. However, Australia, Colombia, Czech Republic, Greece, Japan, Korea, Mexico,
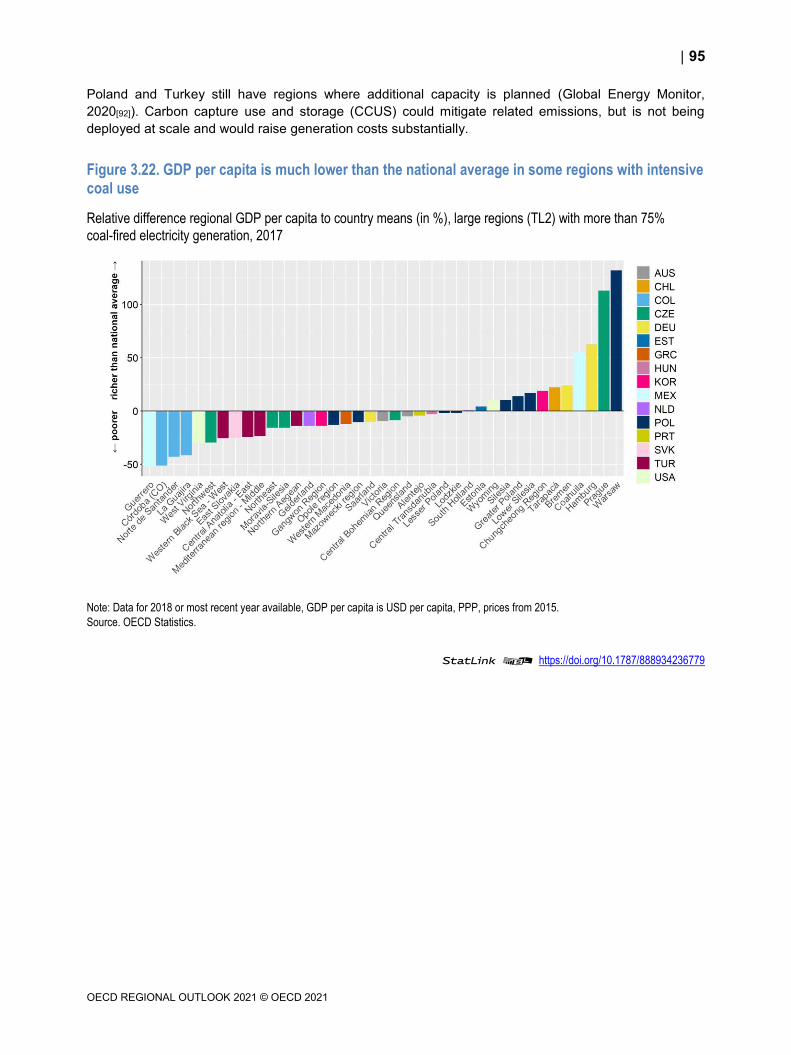
95
OECD REGIONAL OUTLOOK 2021 © OECD 2021
Poland and Turkey still have regions where additional capacity is planned (Global Energy Monitor,
2020[92]). Carbon capture use and storage (CCUS) could mitigate related emissions, but is not being
deployed at scale and would raise generation costs substantially.
Figure 3.22. GDP per capita is much lower than the national average in some regions with intensive coal use
Relative difference regional GDP per capita to country means (in %), large regions (TL2) with more than 75%
coal-fired electricity generation, 2017
Note: Data for 2018 or most recent year available, GDP per capita is USD per capita, PPP, prices from 2015.
Source. OECD Statistics.
StatLink 2 https://doi.org/10.1787/888934236779

96
OECD REGIONAL OUTLOOK 2021 © OECD 2021
Figure 3.23. Fewer OECD regions are adding new coal-fired electricity capacity
Shares of coal-fired electricity generation in large regions (TL2), 2017, and whether that region still has new
coal-fired electricity capacity planned* (last updated in April 2021)
Note: This map is for illustrative purposes and is without prejudice to the status of or sovereignty over any territory covered by this map.
* New planned capacity is defined as new capacity announced, pre-permit, permit or in construction.
Source: OECD calculations based on WRI (n.d.[91]), Global Power Plant Database, https://datasets.wri.org/dataset/globalpowerplantdatabase;
Global Energy Monitor (2020[92]), Global Coal Plant Tracker, https://endcoal.org/tracker/ (accessed on 16 April 2021); Source of administrative
boundaries: National statistical offices, Eurostat (European Commission) © EuroGeographics and FAO Global Administrative.

97
OECD REGIONAL OUTLOOK 2021 © OECD 2021
Figure 3.24. Most OECD regions, especially in the Americas, are no longer adding new coal-fired electricity capacity
Shares of coal-fired electricity generation in large regions (TL2), 2017, and whether that region still has new coal-
fired electricity capacity planned* (last updated in April 2021)
Note: This map is for illustrative purposes and is without prejudice to the status of or sovereignty over any territory covered by this map.
* New planned capacity is defined as new capacity announced, pre-permit, permit or in construction.
Source: OECD calculations based on WRI (n.d.[91]), Global Power Plant Database, https://datasets.wri.org/dataset/globalpowerplantdatabase;
Global Energy Monitor (2020[92]), Global Coal Plant Tracker, https://endcoal.org/tracker/ (accessed on 16 April 2021); Source of administrative
boundaries: National statistical offices, Eurostat (European Commission) © EuroGeographics and FAO Global Administrative.
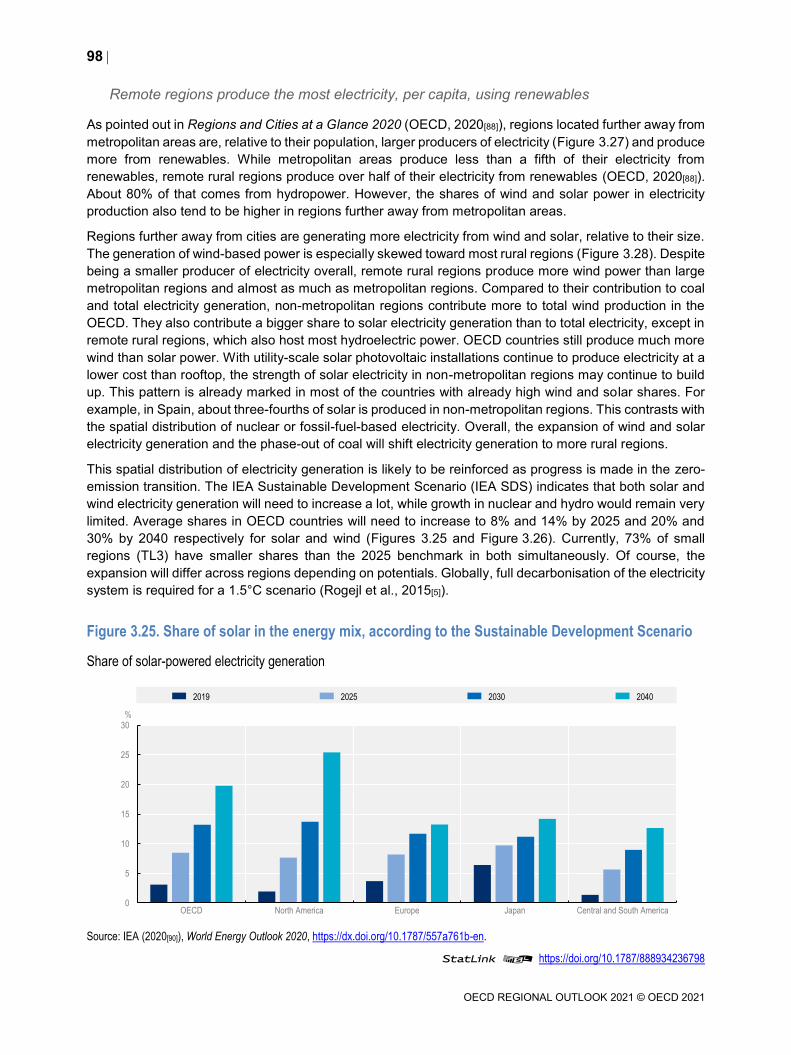
98
OECD REGIONAL OUTLOOK 2021 © OECD 2021
Remote regions produce the most electricity, per capita, using renewables
As pointed out in Regions and Cities at a Glance 2020 (OECD, 2020[88]), regions located further away from
metropolitan areas are, relative to their population, larger producers of electricity (Figure 3.27) and produce
more from renewables. While metropolitan areas produce less than a fifth of their electricity from
renewables, remote rural regions produce over half of their electricity from renewables (OECD, 2020[88]).
About 80% of that comes from hydropower. However, the shares of wind and solar power in electricity
production also tend to be higher in regions further away from metropolitan areas.
Regions further away from cities are generating more electricity from wind and solar, relative to their size.
The generation of wind-based power is especially skewed toward most rural regions (Figure 3.28). Despite
being a smaller producer of electricity overall, remote rural regions produce more wind power than large
metropolitan regions and almost as much as metropolitan regions. Compared to their contribution to coal
and total electricity generation, non-metropolitan regions contribute more to total wind production in the
OECD. They also contribute a bigger share to solar electricity generation than to total electricity, except in
remote rural regions, which also host most hydroelectric power. OECD countries still produce much more
wind than solar power. With utility-scale solar photovoltaic installations continue to produce electricity at a
lower cost than rooftop, the strength of solar electricity in non-metropolitan regions may continue to build
up. This pattern is already marked in most of the countries with already high wind and solar shares. For
example, in Spain, about three-fourths of solar is produced in non-metropolitan regions. This contrasts with
the spatial distribution of nuclear or fossil-fuel-based electricity. Overall, the expansion of wind and solar
electricity generation and the phase-out of coal will shift electricity generation to more rural regions.
This spatial distribution of electricity generation is likely to be reinforced as progress is made in the zero-
emission transition. The IEA Sustainable Development Scenario (IEA SDS) indicates that both solar and
wind electricity generation will need to increase a lot, while growth in nuclear and hydro would remain very
limited. Average shares in OECD countries will need to increase to 8% and 14% by 2025 and 20% and
30% by 2040 respectively for solar and wind (Figures 3.25 and Figure 3.26). Currently, 73% of small
regions (TL3) have smaller shares than the 2025 benchmark in both simultaneously. Of course, the
expansion will differ across regions depending on potentials. Globally, full decarbonisation of the electricity
system is required for a 1.5°C scenario (Rogejl et al., 2015[5]).
Figure 3.25. Share of solar in the energy mix, according to the Sustainable Development Scenario
Share of solar-powered electricity generation
Source: IEA (2020[90]), World Energy Outlook 2020, https://dx.doi.org/10.1787/557a761b-en.
StatLink 2 https://doi.org/10.1787/888934236798
0
5
10
15
20
25
30
OECD North America Europe Japan Central and South America
%
2019 2025 2030 2040

99
OECD REGIONAL OUTLOOK 2021 © OECD 2021
Figure 3.26. Share of wind in the energy mix, according to the Sustainable Development Scenario
Share of wind-powered electricity generation
Source: IEA (2020[90]), World Energy Outlook 2020, https://dx.doi.org/10.1787/557a761b-en.
StatLink 2 https://doi.org/10.1787/888934236817
These trends will have regional development implications for rural regions. Wind and solar installations are
land-intensive. This is one reason why curtailing energy demand growth is important. In addition, shifting
electricity generation towards intermittent renewables solar and wind will require a redesign of electricity
markets, making room for flexibility in demand, coupled with extensive storage and high-resolution pricing
of electricity over time and space. This may reinforce the comparative advantage of high-energy-use
sectors in regions with high renewables supply, including the production of hydrogen as well as the
production of synthetic fuels on the basis of hydrogen, which will play a crucial role in decarbonising sectors
which cannot easily be electrified, such as in industrial applications, road freight, sea and air transport.
Taking advantage of intermittent renewable electricity when it is abundant and can be produced at close
to zero marginal cost also requires technology adoption, such as responsive charging of electric vehicles
or heat pumps. While electricity market design is a central government level task, rural and urban regions
can take steps to take advantage of cheap renewable electricity when it is the most abundant, as discussed
in Chapter 4.
0
5
10
15
20
25
30
35
40
OECD North America Europe Japan Central and South America
%
2019 2025 2030 2040
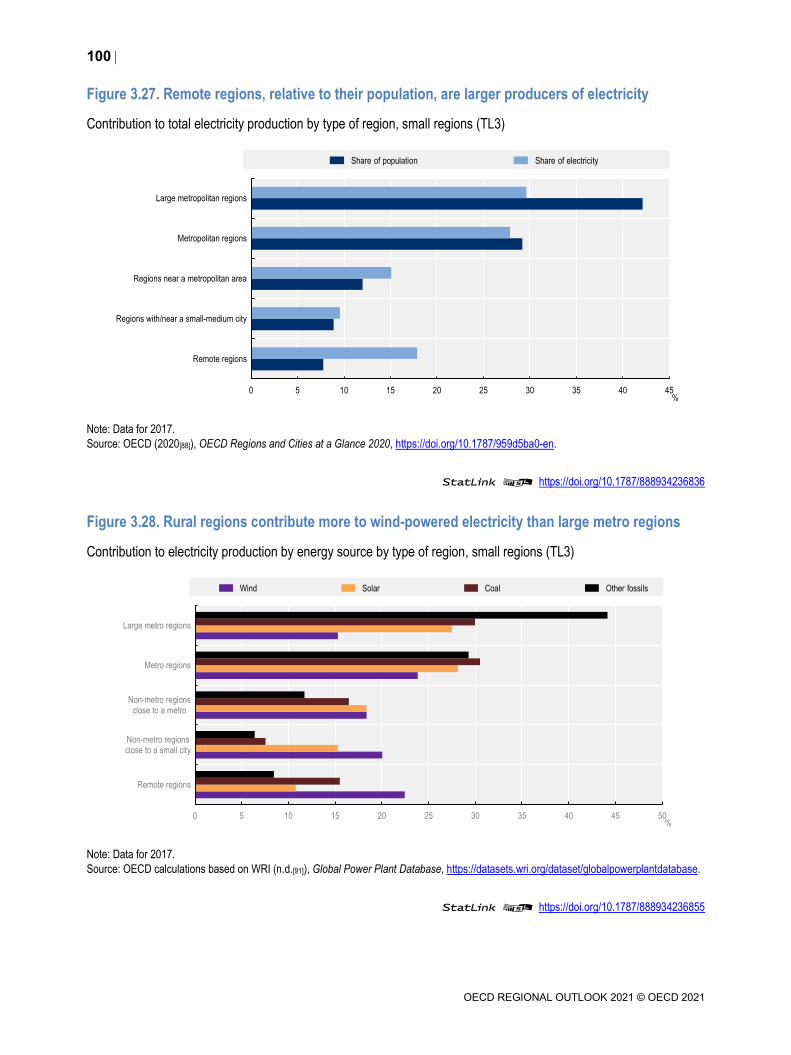
100
OECD REGIONAL OUTLOOK 2021 © OECD 2021
Figure 3.27. Remote regions, relative to their population, are larger producers of electricity
Contribution to total electricity production by type of region, small regions (TL3)
Note: Data for 2017.
Source: OECD (2020[88]), OECD Regions and Cities at a Glance 2020, https://doi.org/10.1787/959d5ba0-en.
StatLink 2 https://doi.org/10.1787/888934236836
Figure 3.28. Rural regions contribute more to wind-powered electricity than large metro regions
Contribution to electricity production by energy source by type of region, small regions (TL3)
Note: Data for 2017.
Source: OECD calculations based on WRI (n.d.[91]), Global Power Plant Database, https://datasets.wri.org/dataset/globalpowerplantdatabase.
StatLink 2 https://doi.org/10.1787/888934236855
0 5 10 15 20 25 30 35 40 45
Remote regions
Regions with/near a small-medium city
Regions near a metropolitan area
Metropolitan regions
Large metropolitan regions
%
Share of population Share of electricity
0 5 10 15 20 25 30 35 40 45 50
Remote regions
Non-metro regionsclose to a small city
Non-metro regionsclose to a metro
Metro regions
Large metro regions
%
Wind Solar Coal Other fossils
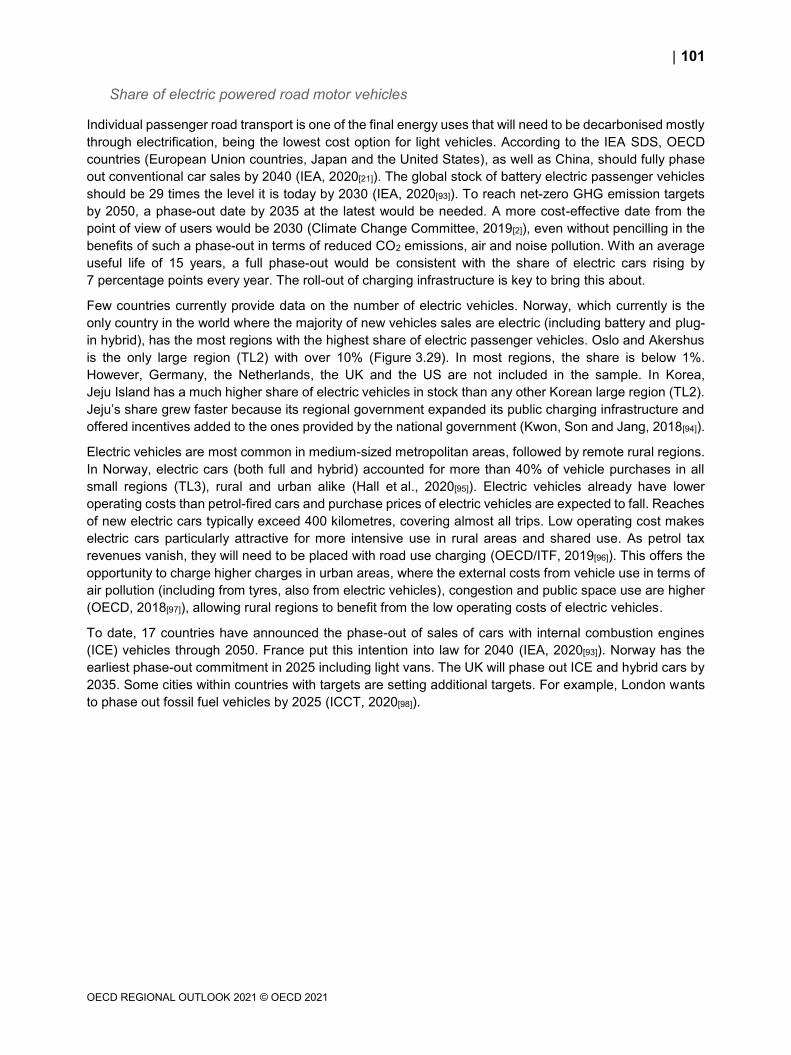
101
OECD REGIONAL OUTLOOK 2021 © OECD 2021
Share of electric powered road motor vehicles
Individual passenger road transport is one of the final energy uses that will need to be decarbonised mostly
through electrification, being the lowest cost option for light vehicles. According to the IEA SDS, OECD
countries (European Union countries, Japan and the United States), as well as China, should fully phase
out conventional car sales by 2040 (IEA, 2020[21]). The global stock of battery electric passenger vehicles
should be 29 times the level it is today by 2030 (IEA, 2020[93]). To reach net-zero GHG emission targets
by 2050, a phase-out date by 2035 at the latest would be needed. A more cost-effective date from the
point of view of users would be 2030 (Climate Change Committee, 2019[2]), even without pencilling in the
benefits of such a phase-out in terms of reduced CO2 emissions, air and noise pollution. With an average
useful life of 15 years, a full phase-out would be consistent with the share of electric cars rising by
7 percentage points every year. The roll-out of charging infrastructure is key to bring this about.
Few countries currently provide data on the number of electric vehicles. Norway, which currently is the
only country in the world where the majority of new vehicles sales are electric (including battery and plug-
in hybrid), has the most regions with the highest share of electric passenger vehicles. Oslo and Akershus
is the only large region (TL2) with over 10% (Figure 3.29). In most regions, the share is below 1%.
However, Germany, the Netherlands, the UK and the US are not included in the sample. In Korea,
Jeju Island has a much higher share of electric vehicles in stock than any other Korean large region (TL2).
Jeju’s share grew faster because its regional government expanded its public charging infrastructure and
offered incentives added to the ones provided by the national government (Kwon, Son and Jang, 2018[94]).
Electric vehicles are most common in medium-sized metropolitan areas, followed by remote rural regions.
In Norway, electric cars (both full and hybrid) accounted for more than 40% of vehicle purchases in all
small regions (TL3), rural and urban alike (Hall et al., 2020[95]). Electric vehicles already have lower
operating costs than petrol-fired cars and purchase prices of electric vehicles are expected to fall. Reaches
of new electric cars typically exceed 400 kilometres, covering almost all trips. Low operating cost makes
electric cars particularly attractive for more intensive use in rural areas and shared use. As petrol tax
revenues vanish, they will need to be placed with road use charging (OECD/ITF, 2019[96]). This offers the
opportunity to charge higher charges in urban areas, where the external costs from vehicle use in terms of
air pollution (including from tyres, also from electric vehicles), congestion and public space use are higher
(OECD, 2018[97]), allowing rural regions to benefit from the low operating costs of electric vehicles.
To date, 17 countries have announced the phase-out of sales of cars with internal combustion engines
(ICE) vehicles through 2050. France put this intention into law for 2040 (IEA, 2020[93]). Norway has the
earliest phase-out commitment in 2025 including light vans. The UK will phase out ICE and hybrid cars by
2035. Some cities within countries with targets are setting additional targets. For example, London wants
to phase out fossil fuel vehicles by 2025 (ICCT, 2020[98]).

102
OECD REGIONAL OUTLOOK 2021 © OECD 2021
Figure 3.29. Norway’s capital region is miles ahead of any other OECD region
Number of electric vehicles per 100 vehicles, large regions (TL2), 2018
Note: Selection of European countries (Austria, Hungary, Ireland, Norway, Slovak Republic and Sweden) and Korea, Mexico and Russia.
Source: OECD Statistics.
StatLink 2 https://doi.org/10.1787/888934236874
The best-documented well-being gains from the net-zero-emission transition are from
lower air pollution
Policies towards net-zero GHG emissions can bring many benefits beyond halting climate change, which
often accrues locally, and can therefore also serve to encourage local climate action (Box 3.8). Air pollution
is among the greatest environmental health threats across the world. This is particularly true for cities,
where the higher concentration of people, transport and economic activity compared to less dense areas
make them more exposed to air pollution (OECD, 2020[88]; OECD, 2020[14]). The most relevant is exposure
to fine particulate matter (PM2.5). Air quality is also a source of health resilience. Air pollution contributes
to the airborne transmission of SARS-CoV-2 and a higher risk of mortality due to COVID-19 (Comunian
et al., 2020[99]; Cole, Ozgen and Strobl, 2020[100]).
A large majority of the population in OECD countries is exposed to small particle pollution above the World
Health Organization (WHO)-recommended threshold of 10 micrograms per cubic metre and virtually all
populations in enhanced engagement countries (Figure 3.30). As pointed out in Regions and Cities at a
Glance 2020 (OECD, 2020[88]), most cities together with their commuting zones are on average exposed
to PM2.5 above the threshold. South Asian functional urban areas (FUAs) have the lowest air quality. Air
pollution has been on the rise in the last 10 years in low-middle countries and has fallen little in high-income
countries.
Most air pollution results from the burning of fossil fuels in transport, industry and heating. In the EU, the
highest PM2.5 concentrations are measured in stations close to urban contexts and in proximity to major
roads (EEA, 2020[101]). Close to half of transport emissions comes from tyre use. In some countries,
agriculture and the burning of waste also contribute significantly, for example through tilling and the burning
103
OECD REGIONAL OUTLOOK 2021 © OECD 2021
of agricultural waste. In some locations, in particular those exposed to desert winds, natural sources
contribute too. Moving towards zero CO2 emissions will reduce most air pollution. Reducing the circulation
of cars (especially, but not only, fuel-fired cars) can also lower energy consumption, pollution (including
from vehicle tyres) and congestion, while improved agricultural practices can reduce agricultural emissions
from fertilisation, both with benefits for the zero-emission-transition.
In most OECD countries, all large TL2 regions have at least 25% of the population exposed to pollution
above the WHO-recommended threshold (Figure 3.31). Some more coal-dependent economies, on the
other hand, have more regions exposed to air pollution. Of the 23 regions where at least some population
is exposed to 3.5 times the safe level of PM2.5, 13 are Turkish. By far the worst region in terms of air
quality is Chile’s most sparsely populated region Aysén. Regions with higher PM2.5 levels tend to have a
lower average life satisfaction compared to their country’s average.
Box 3.8. Key local well-being benefits from a zero-emission transition
Adopting policies that are consistent with achieving the Paris Agreement objectives and prioritise health,
could annually save 6.4 million lives due to healthier diets, 1.6 million lives due to cleaner air and
2.1 million lives worldwide due to increased physical activity, compared to policies that follow the NDCs,
which are not yet ambitious enough to be consistent with these objectives (Hamilton et al., 2021[102]).
Reduced air pollution
Small particulate matter (PM2.5) is the biggest cause of human mortality induced by air pollution.
Outdoor particulate matter causes about 422 000 premature deaths in OECD countries every year, a
number which has barely fallen over the last 30 years with an equivalent estimated welfare loss of
around 3% of GDP. The marginal benefit of pollution abatement on reducing mortality is high at
relatively low levels around and even below the WHO-recommended threshold of 10 micrograms (Roy
and Braathen, 2017[103]). For regions and cities where small particle pollution is much higher, often in
middle-income countries, zero-carbon policies are therefore attractive from a local well-being-
perspective, with a need to reduce pollution substantially and sustainably, with expanding economic
activity.
Major disease effects include stroke, cardiovascular and respiratory disease. Air pollution amplifies
respiratory infectious diseases such as COVID-19. It affects children’s health the most (WHO, 2018[104]).
Education outcomes for young children exposed to higher air pollution are substantially and lastingly
lower, even if exposure is temporary and even in a high-income region such as Florida in the US
(Heissel, Persico and Simon, 2019[105]). Air pollution reduces worker productivity, reflecting illness and
absence but perhaps also cognitive performance (Dechezleprêtre, Rivers and Stadler, 2019[106]).
Worker productivity could be at least 5% higher if average exposure was below the WHO threshold: for
example in Israel, productivity effects can be attributed to cognitive effects and illness. Air pollution also
appears to contribute substantially to the incidence of old-age dementia (Bishop, Ketcham and
Kuminoff, 2018[107]).
For instance, Schucht et al. (2015[108]) estimate at least 85% of mitigation costs are covered by
co-benefits from decreased particle and ozone levels. An empirical analysis by Chapman et al.
(2018[109]) of several active travel interventions (e.g. walking and cycling) in two provincial cities in
New Zealand also shows clear parallel reductions in diseases and emissions, amounting to an
11:1 benefit-cost ratio.
Reduced noise pollution
Noise pollution, especially from transport, is a growing health risk. Persistent exposure to high levels of
noise can have both physical and mental health consequences. The main health threats for which
104
OECD REGIONAL OUTLOOK 2021 © OECD 2021
causal associations have been found are cardiovascular disease, hearing and cognitive impairment,
sleep disturbance, tinnitus and annoyance (WHO/JRC, 2011[110]). In addition, noise exposure has been
found to affect patient outcomes and staff performance in hospitals as well as impair cognitive
performance in schoolchildren (Basner et al., 2014[111]). Electric vehicles reduce noise especially at
modest speeds when motor noise dominates noise from movement. Moving to active mobility and urban
transport in cities can also reduce noise.
In the EU, at least 20% of the population are exposed to harmful levels of traffic noise. Chronic exposure
to noise levels above the WHO standard causes 12 000 premature deaths per year worldwide and
contributes to 48 000 cases of ischaemic heart disease. In addition, 6.5 million people suffer from
chronic high sleep disturbance and 22 million people from “prolonged high levels of annoyance” due to
noise pollution from transport or industry (EEA, 2020[112]).
Traffic congestion
The cost of traffic congestion includes time loss as well as productivity losses from higher costs in the
exchange of goods and services, especially within highly productive FUAs. The productivity impact of
congestion is magnified because productivity is intermediate service, affecting productivity in all sectors
where transport is an input. Congestion hinders the region’s economic and social development, raises
the cost of doing business and makes it harder to attain environmental goals. Costs in high-income
economies are estimated: for example 1% is usually cited for the average cost of congestion in Europe
and between 0.7% and 0.9% in the US. However, cities in middle-income countries appear to be
substantially more congested. Congestion is increasing in most cities.
Healthier diets
The EAT-Lancet Commission on Food, Planet, Health (2018[113]) recently reported that reaching a
healthy diet globally would require dividing the global consumption of red meat (beef, lamb and pork)
by nearly three (more than six in North America). A change in dietary patterns would also mitigate
climate change through two distinct channels: first, it would reduce direct emissions from animals;
second, it would ease pressure on land use, since a large proportion of crops are grown to feed
livestock. In its report on climate change and land (IPCC, 2019[8]), the IPCC estimates that changing
diets have a major GHG reduction potential.
Active mobility
It is estimated that if all Londoners walked or cycled for 20 minutes a day, public health spending could
be close to 0.1% of GDP lower and add 60 000 years of healthy life per year thanks to prevented illness
and early death. Typically, policies that encourage active mobility also increase road safety, as it is
safer roads that encourage walking and cycling.
Thermal insulation
Health benefits of building energy efficiency investment subsidies in New Zealand have been estimated
to pay off the costs alone, even with high discount rates (Grimes et al., 2012[114]). In the presence of
energy poverty, the health benefits of loft insulation have been estimated to exceed the costs by a
multiple and be almost equal to the cost for wall insulation (Frontier Economics, 2015[115]). However, if
thermal insulation employs toxic materials or leads to poor ventilation, it can also result in health costs.
Improved water, soil and biodiversity protection
Reducing fertiliser use could result in reduced nutrient runoff and water pollution, leading to healthier
aquatic ecosystems. It also reduces ammonia volatilisation, which participates in the formation of
particulate matters and therefore improves air quality. Low-emission farm practices which strengthen
CO2 sinks also protect biodiversity.
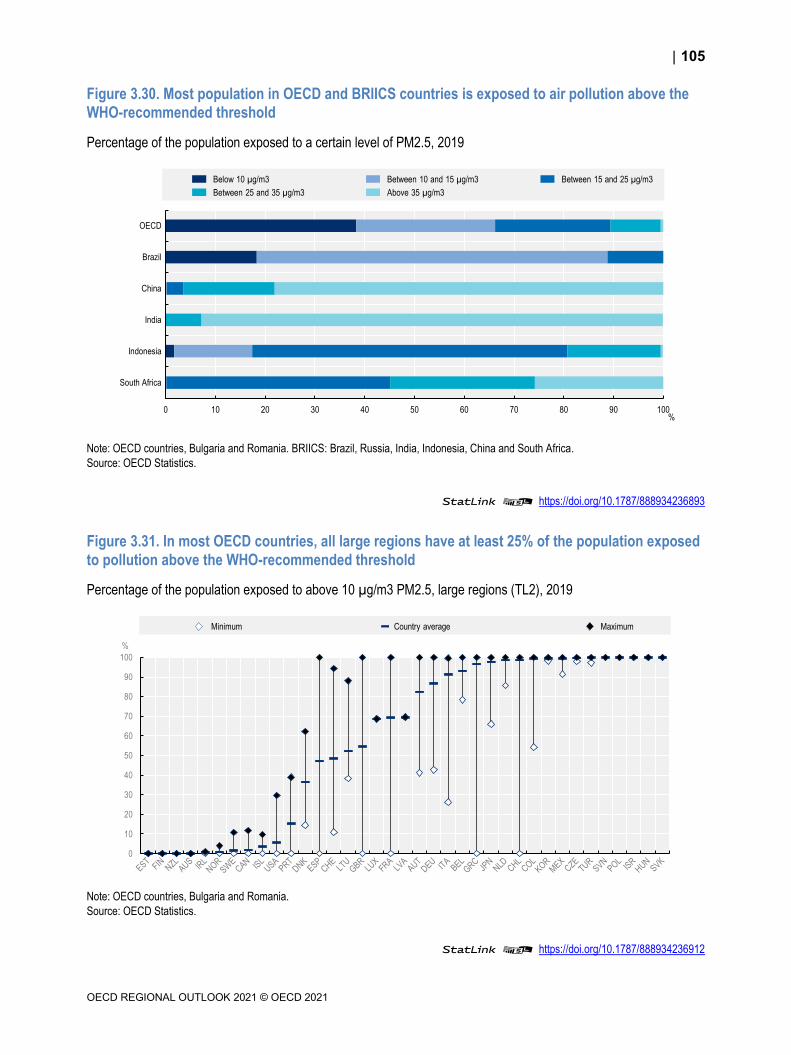
105
OECD REGIONAL OUTLOOK 2021 © OECD 2021
Figure 3.30. Most population in OECD and BRIICS countries is exposed to air pollution above the WHO-recommended threshold
Percentage of the population exposed to a certain level of PM2.5, 2019
Note: OECD countries, Bulgaria and Romania. BRIICS: Brazil, Russia, India, Indonesia, China and South Africa.
Source: OECD Statistics.
StatLink 2 https://doi.org/10.1787/888934236893
Figure 3.31. In most OECD countries, all large regions have at least 25% of the population exposed to pollution above the WHO-recommended threshold
Percentage of the population exposed to above 10 µg/m3 PM2.5, large regions (TL2), 2019
Note: OECD countries, Bulgaria and Romania.
Source: OECD Statistics.
StatLink 2 https://doi.org/10.1787/888934236912
0 10 20 30 40 50 60 70 80 90 100
OECD
Brazil
China
India
Indonesia
South Africa
%
Below 10 µg/m3 Between 10 and 15 µg/m3 Between 15 and 25 µg/m3
Between 25 and 35 µg/m3 Above 35 µg/m3
0
10
20
30
40
50
60
70
80
90
100
%
Minimum Country average Maximum

106
OECD REGIONAL OUTLOOK 2021 © OECD 2021
Employment risk from the transition appears limited
The transition to net-zero emissions will bring economic restructuring. Some sectors will shed employment.
Others may be transformed substantially. This section provides an economic analysis of such risks. It uses
employment data only, as regional value-added data are not available at a sufficiently detailed sectoral
level. An OECD general equilibrium model, ENV-Linkages, is used to identify employment impacts across
sectors of economic activity that would result from the IEA SDS, which describes an emissions pathway
consistent with the Paris Agreement.
Employment data for subnational regions are only available for broad, two-digit economic sectors. The
data allow identifying future regional sectoral employment in a few cases with precision but only in a few
sectors, notably employment in the extraction of coal. For example, the data do not allow to distinguish
employment in renewable electricity generation, which will increase, from employment in fossil fuel
electricity generation, which will fall. In any case, electricity generation employs few workers. The analysis
below considers employment in sectors where general equilibrium modelling suggests some employment
loss will occur. These sectors may however also include activities that may not lose employment.
Conversely, it may not include employment in activities that may lose employment, if these activities are in
sectors in which some activities may experience employment gains (Box 3.9). Moreover, local employment
risks differ depending on production costs. For example, as decarbonisation is expected to depress oil
prices, production will disappear first in those regions where extraction costs are highest. In these regions,
the stranded asset risk from investment in these activities is highest. Regional policymakers in member
countries need more precise data to assess place-based employment at risk.
Box 3.9. The impact of the net-zero carbon transition on regional employment: Methodological approach
The selection of sectors where regions are experiencing (both direct and indirect) employment losses
as economies move towards net-zero GHG emissions is based on a simulation with the OECD ENV-
Linkages model. However, the sectoral employment data is only available for the large OECD TL2
regions and the sectoral data available for these regions is coarse. The selected sectors are therefore
broader than those identified in ENV-Linkages.
OECD ENV-Linkages is a dynamic general equilibrium model that allows illustrating economic impacts
of climate mitigation policy scenarios several decades into the future, linking activity and employment
to GHG emissions (Château, Dellink and Lanzi, 2014[116]). This Regional Outlook report uses sectoral
employment outcomes of a scenario that allows the goals of the Paris Agreement to be reached,
following the IEA SDS. It compares employment in this scenario with employment in a baseline scenario
of no further climate policies. Table 3.1 shows sectors that lose at least 3% of employment in OECD
countries by 2040. This is the threshold chosen to identify sectors with regional employment risks.
Employment changes in the EU (EU17) and individual economies, such as Canada, Japan and the US,
are largely similar to those of the OECD as a whole. In some cases, the reduction in employment due
to the zero-carbon transition is not as large for the OECD as a whole but exceeds 6% in EU17, Canada,
Japan or the US. Based on this criterion, air and water transport and manufacture of other transport
equipment were also included.
Matching sectoral modelling outcomes to available regional data results in a broad classification of
employment risks
Regional employment data covering a selection of OECD countries is only available for broad two-digit
sectors in the International Standard Industrial Classification of All Economic Activities (ISIC). These
are considerably less granular than the Global Trade Analysis Project (GTAP) sectors in the
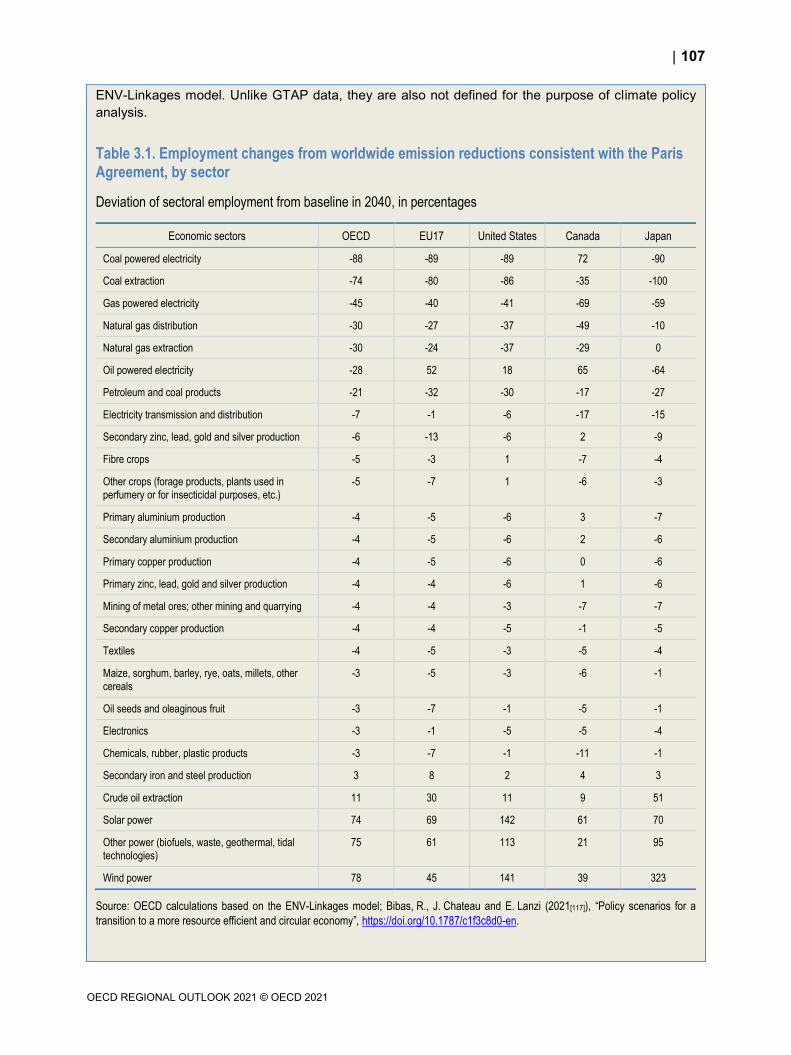
107
OECD REGIONAL OUTLOOK 2021 © OECD 2021
ENV-Linkages model. Unlike GTAP data, they are also not defined for the purpose of climate policy
analysis.
Table 3.1. Employment changes from worldwide emission reductions consistent with the Paris Agreement, by sector
Deviation of sectoral employment from baseline in 2040, in percentages
Economic sectors OECD EU17 United States Canada Japan
Coal powered electricity -88 -89 -89 72 -90
Coal extraction -74 -80 -86 -35 -100
Gas powered electricity -45 -40 -41 -69 -59
Natural gas distribution -30 -27 -37 -49 -10
Natural gas extraction -30 -24 -37 -29 0
Oil powered electricity -28 52 18 65 -64
Petroleum and coal products -21 -32 -30 -17 -27
Electricity transmission and distribution -7 -1 -6 -17 -15
Secondary zinc, lead, gold and silver production -6 -13 -6 2 -9
Fibre crops -5 -3 1 -7 -4
Other crops (forage products, plants used in perfumery or for insecticidal purposes, etc.)
-5 -7 1 -6 -3
Primary aluminium production -4 -5 -6 3 -7
Secondary aluminium production -4 -5 -6 2 -6
Primary copper production -4 -5 -6 0 -6
Primary zinc, lead, gold and silver production -4 -4 -6 1 -6
Mining of metal ores; other mining and quarrying -4 -4 -3 -7 -7
Secondary copper production -4 -4 -5 -1 -5
Textiles -4 -5 -3 -5 -4
Maize, sorghum, barley, rye, oats, millets, other cereals
-3 -5 -3 -6 -1
Oil seeds and oleaginous fruit -3 -7 -1 -5 -1
Electronics -3 -1 -5 -5 -4
Chemicals, rubber, plastic products -3 -7 -1 -11 -1
Secondary iron and steel production 3 8 2 4 3
Crude oil extraction 11 30 11 9 51
Solar power 74 69 142 61 70
Other power (biofuels, waste, geothermal, tidal technologies)
75 61 113 21 95
Wind power 78 45 141 39 323
Source: OECD calculations based on the ENV-Linkages model; Bibas, R., J. Chateau and E. Lanzi (2021[117]), “Policy scenarios for a
transition to a more resource efficient and circular economy”, https://doi.org/10.1787/c1f3c8d0-en.
108
OECD REGIONAL OUTLOOK 2021 © OECD 2021
Most GTAP sectors correspond to three- or four-digit ISIC sectors, which are more granular than
two-digit sectors. The chosen two-digit ISIC sectors therefore often also include employment the
modelling does not identify as being subject to employment loss. In a few cases, two-digit ISIC sectors
include GTAP sectors with both gains and losses. In these cases, potential employment losses cannot
be taken into account. This applies in particular to employment in fossil fuel-fired and renewable
electricity generation which are part of a single two-digit ISIC sector (“electric power generation,
transmission and distribution”). Moreover, sectoral employment risks can differ across regions for other
reasons that cannot be taken into account. For example, climate mitigation policies should depress
fossil fuel prices, resulting in the phase-out of production in those regions first where production cost is
highest.
Overall, the two-digit ISIC sectors identified as being at risk of employment losses due to the net-zero
carbon transition include: Mining of coal and lignite; Other mining and quarrying; Manufacture of textiles;
Manufacture of coke and refined petroleum products; Manufacture of chemicals and chemical products;
Manufacture of rubber and plastics products; Manufacture of other transport equipment; Water
transport; Air transport. The petrochemical sectors contain most of the employment in sectors likely at
risk of employment losses due to the net-zero carbon transition in OECD and partner countries: 32% of
employment in sectors at risk is employed in the manufacture of rubber and plastics products and 20%
is employed in the manufacture of chemicals and chemical products.
Data are available for the large regions (TL2) in 30 OECD member countries and 3 partner countries
(Bulgaria, Malta and Romania). The OECD countries that are not currently included are Chile,
Colombia, Iceland, Israel, Mexico, New Zealand and Turkey. For all countries except Australia and
Japan, the data is for 2017. For Australia, the data is from 2019 and for Japan, the data is from 2016.
There will be both employment losses and gains due to the net-zero transition. Relative employment gains
are estimated to be the largest in renewable power production and recycling of materials (Box 3.9,
Table 3.1). Policies to promote renewable energy and other low-carbon activities will create demand for
new service jobs (Rydge, Martin and Valero, 2018[118]). Overall, renewable energy is expected to be more
employment-intensive than the fossil-fuelled energy it replaces (EC, 2018[25]). Other employment gains
may come from the electrification of passenger vehicles and from early-stage innovation to diffusion for
example (Unsworth et al., 2020[119]). Employment gains from the transition are difficult to project at the
regional level. In any case, they may not coincide with the spatial distribution of employment losses,
Employment losses are regionally concentrated and thus need place-based policies to ensure that no
region is left behind. Policies to avoid regional decline and ensure a just transition for workers and local
communities are discussed in Chapter 4.
Only 2.3% of employment is in sectors that are at risk of some employment loss across all countries
included in the analysis. This is in line with earlier analysis, which indicates that decisive climate policy
produces modest sectoral reallocation in comparison to historic sectoral job reallocation patterns (OECD,
2017[26]), although the two-digit sectoral data suggest that the Czech Republic, Germany, Korea, Poland
and Switzerland might be hit slightly harder. Not a single country for which data are available has more
than 4.5% of employment in sectors that on average are most at risk of employment loss.
The Czech Republic, Finland, Italy, Korea, Poland and Switzerland all have at least 1 riskier region where
more than 5% of employment are in sectors at risk of employment losses (Figure 3.32).
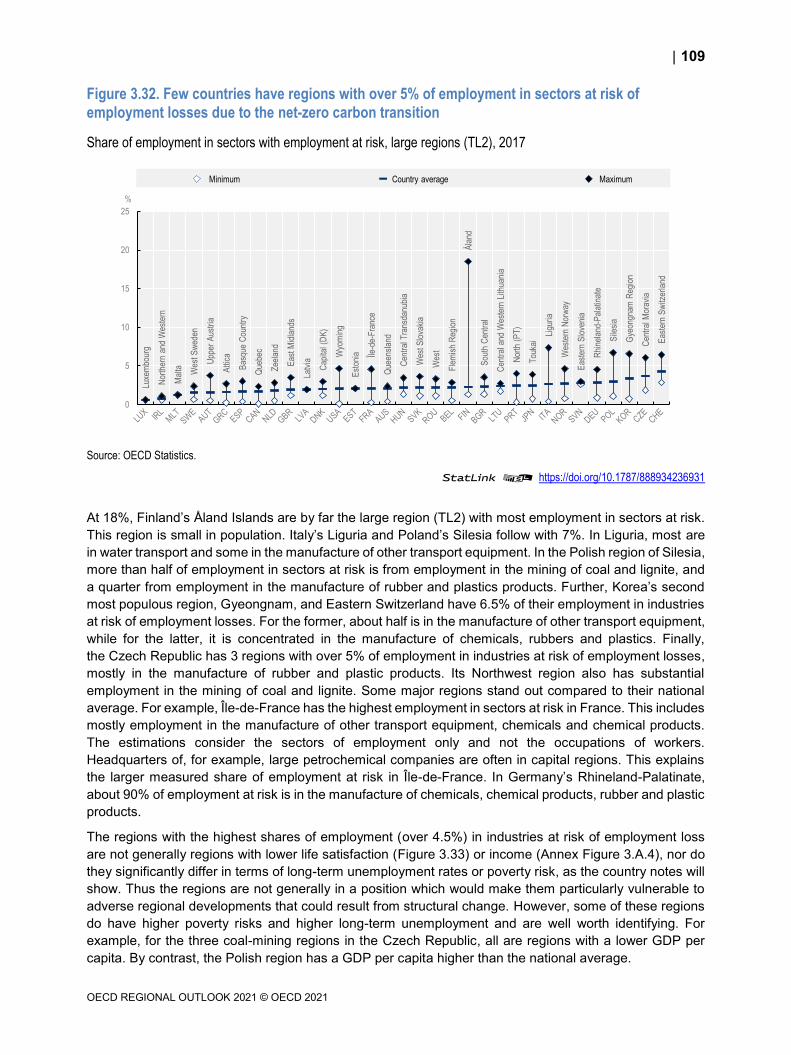
109
OECD REGIONAL OUTLOOK 2021 © OECD 2021
Figure 3.32. Few countries have regions with over 5% of employment in sectors at risk of employment losses due to the net-zero carbon transition
Share of employment in sectors with employment at risk, large regions (TL2), 2017
Source: OECD Statistics.
StatLink 2 https://doi.org/10.1787/888934236931
At 18%, Finland’s Åland Islands are by far the large region (TL2) with most employment in sectors at risk.
This region is small in population. Italy’s Liguria and Poland’s Silesia follow with 7%. In Liguria, most are
in water transport and some in the manufacture of other transport equipment. In the Polish region of Silesia,
more than half of employment in sectors at risk is from employment in the mining of coal and lignite, and
a quarter from employment in the manufacture of rubber and plastics products. Further, Korea’s second
most populous region, Gyeongnam, and Eastern Switzerland have 6.5% of their employment in industries
at risk of employment losses. For the former, about half is in the manufacture of other transport equipment,
while for the latter, it is concentrated in the manufacture of chemicals, rubbers and plastics. Finally,
the Czech Republic has 3 regions with over 5% of employment in industries at risk of employment losses,
mostly in the manufacture of rubber and plastic products. Its Northwest region also has substantial
employment in the mining of coal and lignite. Some major regions stand out compared to their national
average. For example, Île-de-France has the highest employment in sectors at risk in France. This includes
mostly employment in the manufacture of other transport equipment, chemicals and chemical products.
The estimations consider the sectors of employment only and not the occupations of workers.
Headquarters of, for example, large petrochemical companies are often in capital regions. This explains
the larger measured share of employment at risk in Île-de-France. In Germany’s Rhineland-Palatinate,
about 90% of employment at risk is in the manufacture of chemicals, chemical products, rubber and plastic
products.
The regions with the highest shares of employment (over 4.5%) in industries at risk of employment loss
are not generally regions with lower life satisfaction (Figure 3.33) or income (Annex Figure 3.A.4), nor do
they significantly differ in terms of long-term unemployment rates or poverty risk, as the country notes will
show. Thus the regions are not generally in a position which would make them particularly vulnerable to
adverse regional developments that could result from structural change. However, some of these regions
do have higher poverty risks and higher long-term unemployment and are well worth identifying. For
example, for the three coal-mining regions in the Czech Republic, all are regions with a lower GDP per
capita. By contrast, the Polish region has a GDP per capita higher than the national average.
Luxe
mbo
urg
Nor
ther
n an
d W
este
rn
Mal
ta Wes
t Sw
eden
Upp
er A
ustr
ia
Atti
ca
Bas
que
Cou
ntry
Que
bec
Zee
land
Eas
t Mid
land
s
Latv
ia
Cap
ital (
DK
)
Wyo
min
g
Est
onia Île
-de-
Fra
nce
Que
ensl
and
Cen
tral
Tra
nsda
nubi
a
Wes
t Slo
vaki
a
Wes
t
Fle
mis
h R
egio
n
Åla
nd
Sou
th C
entr
al
Cen
tral
and
Wes
tern
Lith
uani
a
Nor
th (
PT
)
Tou
kai
Ligu
ria
Wes
tern
Nor
way
Eas
tern
Slo
veni
a
Rhi
nela
nd-P
alat
inat
e
Sile
sia
Gye
ongn
am R
egio
n
Cen
tral
Mor
avia
Eas
tern
Sw
itzer
land
0
5
10
15
20
25
%
Minimum Country average Maximum
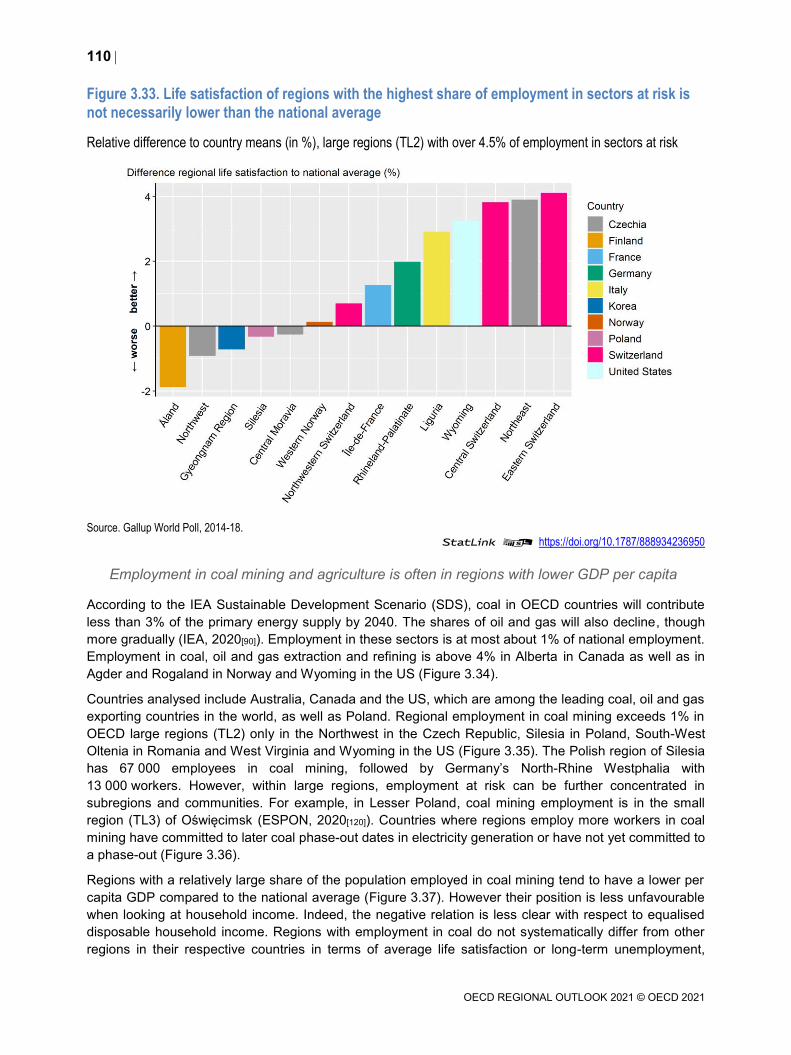
110
OECD REGIONAL OUTLOOK 2021 © OECD 2021
Figure 3.33. Life satisfaction of regions with the highest share of employment in sectors at risk is not necessarily lower than the national average
Relative difference to country means (in %), large regions (TL2) with over 4.5% of employment in sectors at risk
Source. Gallup World Poll, 2014-18.
StatLink 2 https://doi.org/10.1787/888934236950
Employment in coal mining and agriculture is often in regions with lower GDP per capita
According to the IEA Sustainable Development Scenario (SDS), coal in OECD countries will contribute
less than 3% of the primary energy supply by 2040. The shares of oil and gas will also decline, though
more gradually (IEA, 2020[90]). Employment in these sectors is at most about 1% of national employment.
Employment in coal, oil and gas extraction and refining is above 4% in Alberta in Canada as well as in
Agder and Rogaland in Norway and Wyoming in the US (Figure 3.34).
Countries analysed include Australia, Canada and the US, which are among the leading coal, oil and gas
exporting countries in the world, as well as Poland. Regional employment in coal mining exceeds 1% in
OECD large regions (TL2) only in the Northwest in the Czech Republic, Silesia in Poland, South-West
Oltenia in Romania and West Virginia and Wyoming in the US (Figure 3.35). The Polish region of Silesia
has 67 000 employees in coal mining, followed by Germany’s North-Rhine Westphalia with
13 000 workers. However, within large regions, employment at risk can be further concentrated in
subregions and communities. For example, in Lesser Poland, coal mining employment is in the small
region (TL3) of Oświęcimsk (ESPON, 2020[120]). Countries where regions employ more workers in coal
mining have committed to later coal phase-out dates in electricity generation or have not yet committed to
a phase-out (Figure 3.36).
Regions with a relatively large share of the population employed in coal mining tend to have a lower per
capita GDP compared to the national average (Figure 3.37). However their position is less unfavourable
when looking at household income. Indeed, the negative relation is less clear with respect to equalised
disposable household income. Regions with employment in coal do not systematically differ from other
regions in their respective countries in terms of average life satisfaction or long-term unemployment,
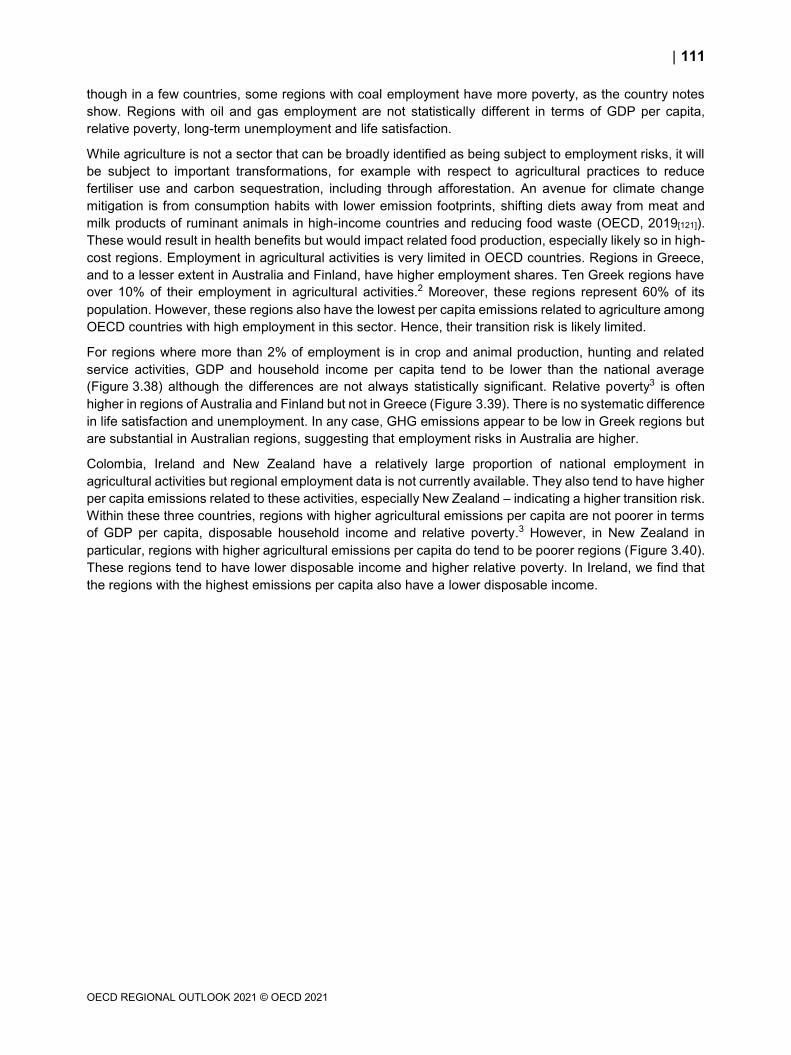
111
OECD REGIONAL OUTLOOK 2021 © OECD 2021
though in a few countries, some regions with coal employment have more poverty, as the country notes
show. Regions with oil and gas employment are not statistically different in terms of GDP per capita,
relative poverty, long-term unemployment and life satisfaction.
While agriculture is not a sector that can be broadly identified as being subject to employment risks, it will
be subject to important transformations, for example with respect to agricultural practices to reduce
fertiliser use and carbon sequestration, including through afforestation. An avenue for climate change
mitigation is from consumption habits with lower emission footprints, shifting diets away from meat and
milk products of ruminant animals in high-income countries and reducing food waste (OECD, 2019[121]).
These would result in health benefits but would impact related food production, especially likely so in high-
cost regions. Employment in agricultural activities is very limited in OECD countries. Regions in Greece,
and to a lesser extent in Australia and Finland, have higher employment shares. Ten Greek regions have
over 10% of their employment in agricultural activities.2 Moreover, these regions represent 60% of its
population. However, these regions also have the lowest per capita emissions related to agriculture among
OECD countries with high employment in this sector. Hence, their transition risk is likely limited.
For regions where more than 2% of employment is in crop and animal production, hunting and related
service activities, GDP and household income per capita tend to be lower than the national average
(Figure 3.38) although the differences are not always statistically significant. Relative poverty3 is often
higher in regions of Australia and Finland but not in Greece (Figure 3.39). There is no systematic difference
in life satisfaction and unemployment. In any case, GHG emissions appear to be low in Greek regions but
are substantial in Australian regions, suggesting that employment risks in Australia are higher.
Colombia, Ireland and New Zealand have a relatively large proportion of national employment in
agricultural activities but regional employment data is not currently available. They also tend to have higher
per capita emissions related to these activities, especially New Zealand – indicating a higher transition risk.
Within these three countries, regions with higher agricultural emissions per capita are not poorer in terms
of GDP per capita, disposable household income and relative poverty.3 However, in New Zealand in
particular, regions with higher agricultural emissions per capita do tend to be poorer regions (Figure 3.40).
These regions tend to have lower disposable income and higher relative poverty. In Ireland, we find that
the regions with the highest emissions per capita also have a lower disposable income.
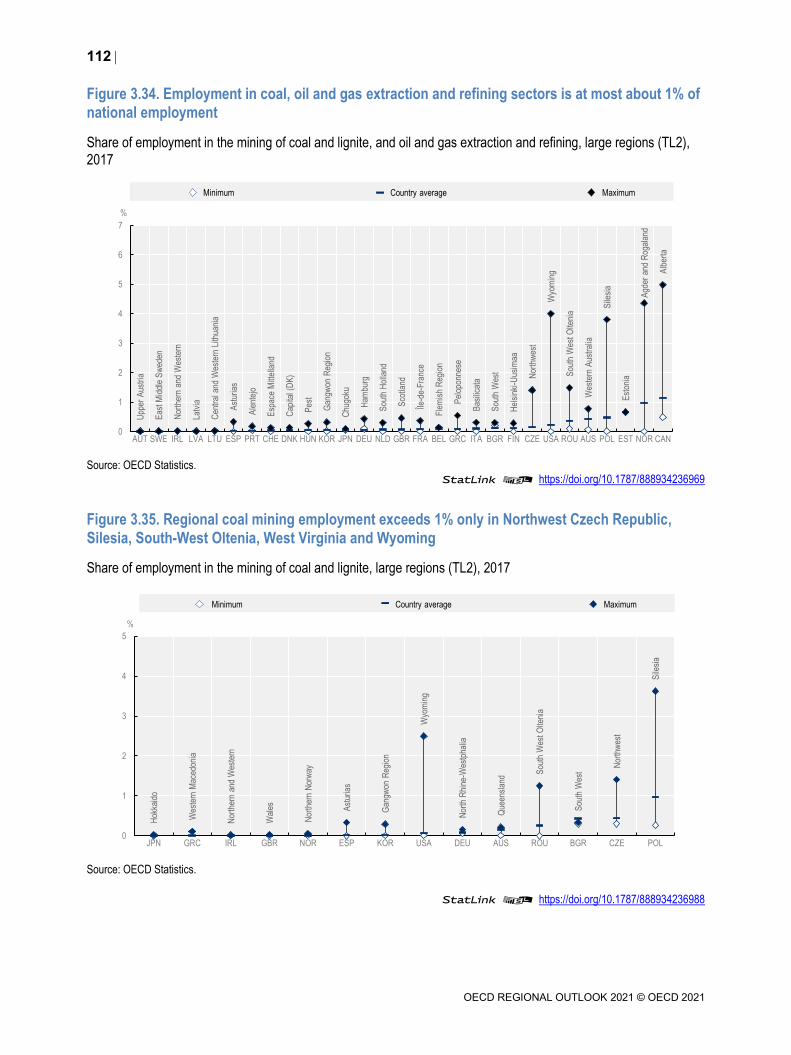
112
OECD REGIONAL OUTLOOK 2021 © OECD 2021
Figure 3.34. Employment in coal, oil and gas extraction and refining sectors is at most about 1% of national employment
Share of employment in the mining of coal and lignite, and oil and gas extraction and refining, large regions (TL2),
2017
Source: OECD Statistics.
StatLink 2 https://doi.org/10.1787/888934236969
Figure 3.35. Regional coal mining employment exceeds 1% only in Northwest Czech Republic, Silesia, South-West Oltenia, West Virginia and Wyoming
Share of employment in the mining of coal and lignite, large regions (TL2), 2017
Source: OECD Statistics.
StatLink 2 https://doi.org/10.1787/888934236988
Upp
er A
ustr
ia
Eas
t Mid
dle
Sw
eden
Nor
ther
n an
d W
este
rn
Latv
ia
Cen
tral
and
Wes
tern
Lith
uani
a
Ast
uria
s
Ale
ntej
o
Esp
ace
Mitt
ella
nd
Cap
ital (
DK
)
Pes
t
Gan
gwon
Reg
ion
Chu
goku
Ham
burg
Sou
th H
olla
nd
Sco
tland
Île-d
e-F
ranc
e
Fle
mis
h R
egio
n
Pel
opon
nese
Bas
ilica
ta
Sou
th W
est
Hel
sink
i-U
usim
aa
Nor
thw
est
Wyo
min
g
Sou
th W
est O
lteni
a
Wes
tern
Aus
tral
ia
Sile
sia
Est
onia
Agd
er a
nd R
ogal
and
Alb
erta
0
1
2
3
4
5
6
7
AUT SWE IRL LVA LTU ESP PRT CHE DNK HUN KOR JPN DEU NLD GBR FRA BEL GRC ITA BGR FIN CZE USA ROU AUS POL EST NOR CAN
%
Minimum Country average Maximum
Hok
kaid
o
Wes
tern
Mac
edon
ia
Nor
ther
n an
d W
este
rn
Wal
es
Nor
ther
n N
orw
ay
Ast
uria
s
Gan
gwon
Reg
ion
Wyo
min
g
Nor
th R
hine
-Wes
tpha
lia
Que
ensl
and
Sou
th W
est O
lteni
a
Sou
th W
est
Nor
thw
est
Sile
sia
0
1
2
3
4
5
JPN GRC IRL GBR NOR ESP KOR USA DEU AUS ROU BGR CZE POL
%
Minimum Country average Maximum

113
OECD REGIONAL OUTLOOK 2021 © OECD 2021
Figure 3.36. Countries with more coal mining employment have no or later coal phase-out dates in electricity generation
Share of employment in the mining of coal and lignite and coal phase-out pledge date, large regions (TL2), 2017
Source: OECD Statistics and Powering Past Coal Alliance.
Figure 3.37. Regions with the highest shares of the population employed in coal mining tend to have a lower per capita GDP compared to the national average
Relative difference to country means, large regions (TL2)
Note: Data for 2018 or most recent year available, no data for Bulgaria and Romania, GDP per capita is USD per capita, PPP, prices from 2015.
Source: OECD Statistics.
StatLink 2 https://doi.org/10.1787/888934237007
114
OECD REGIONAL OUTLOOK 2021 © OECD 2021
Figure 3.38. Some regions with over 2% employment in agriculture have lower GDP per capita than the national average
Relative difference to country means, large regions (TL2) with over 2% of employment in agriculture
Note: Data for 2018 or most recent year available, GDP per capita is USD per capita, PPP, prices from 2015. Agriculture is defined as crop and
animal production, hunting and related service activities.
Source: OECD Statistics.
StatLink 2 https://doi.org/10.1787/888934237026
Figure 3.39. Poverty is often higher in regions with over 2% of employment in agriculture in Australia and Finland but not in Greece
Relative difference to country means, large regions (TL2) with over 2% of employment in agriculture
Note: Data for 2018. Agriculture is defined as crop and animal production, hunting and related service activities.
Source: Gallup World Poll, 2014-18.
StatLink 2 https://doi.org/10.1787/888934237045
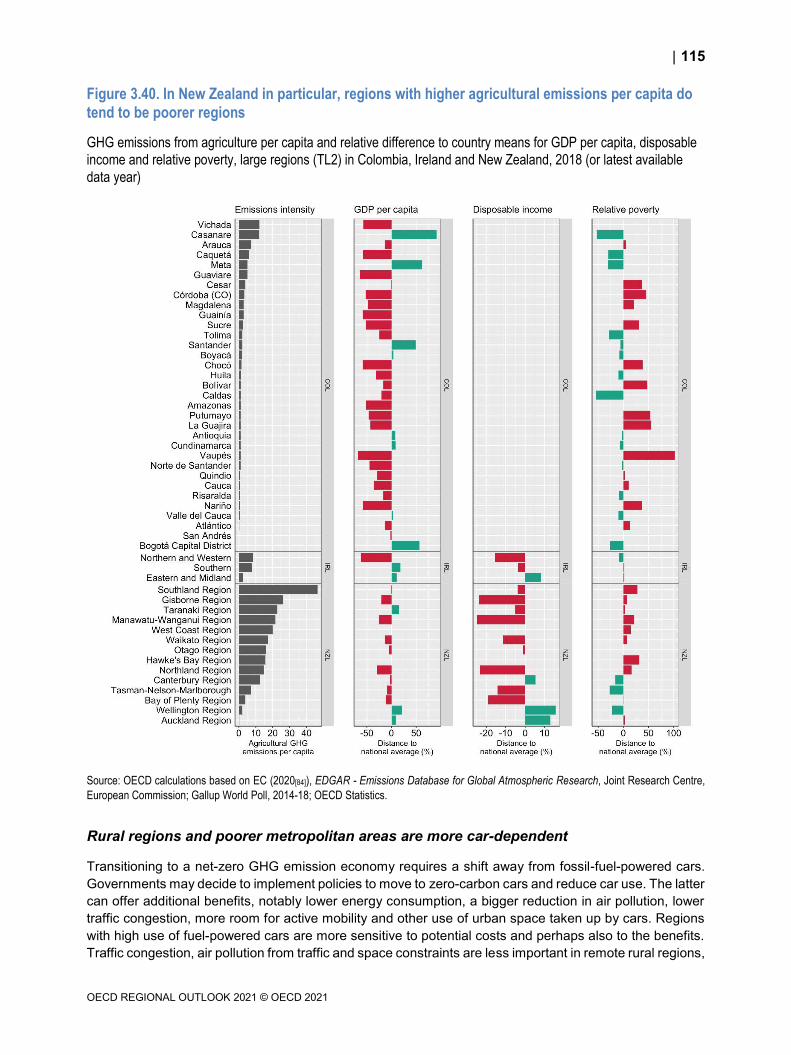
115
OECD REGIONAL OUTLOOK 2021 © OECD 2021
Figure 3.40. In New Zealand in particular, regions with higher agricultural emissions per capita do tend to be poorer regions
GHG emissions from agriculture per capita and relative difference to country means for GDP per capita, disposable
income and relative poverty, large regions (TL2) in Colombia, Ireland and New Zealand, 2018 (or latest available
data year)
Source: OECD calculations based on EC (2020[84]), EDGAR - Emissions Database for Global Atmospheric Research, Joint Research Centre,
European Commission; Gallup World Poll, 2014-18; OECD Statistics.
Rural regions and poorer metropolitan areas are more car-dependent
Transitioning to a net-zero GHG emission economy requires a shift away from fossil-fuel-powered cars.
Governments may decide to implement policies to move to zero-carbon cars and reduce car use. The latter
can offer additional benefits, notably lower energy consumption, a bigger reduction in air pollution, lower
traffic congestion, more room for active mobility and other use of urban space taken up by cars. Regions
with high use of fuel-powered cars are more sensitive to potential costs and perhaps also to the benefits.
Traffic congestion, air pollution from traffic and space constraints are less important in remote rural regions,
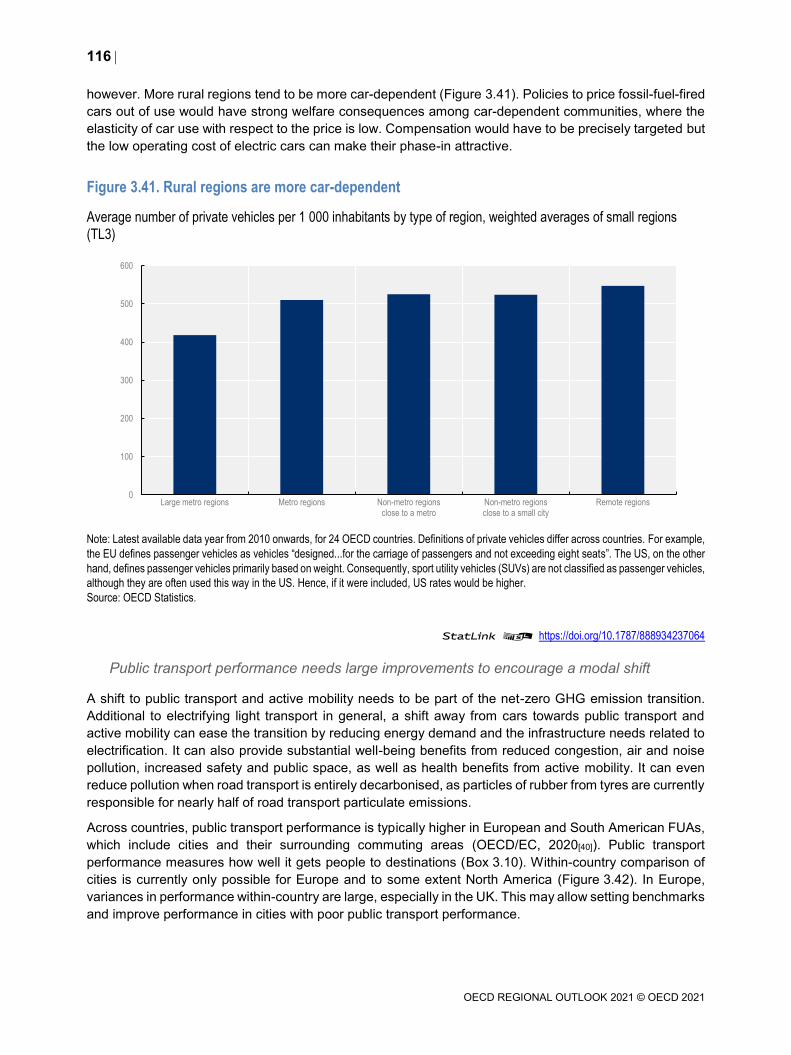
116
OECD REGIONAL OUTLOOK 2021 © OECD 2021
however. More rural regions tend to be more car-dependent (Figure 3.41). Policies to price fossil-fuel-fired
cars out of use would have strong welfare consequences among car-dependent communities, where the
elasticity of car use with respect to the price is low. Compensation would have to be precisely targeted but
the low operating cost of electric cars can make their phase-in attractive.
Figure 3.41. Rural regions are more car-dependent
Average number of private vehicles per 1 000 inhabitants by type of region, weighted averages of small regions
(TL3)
Note: Latest available data year from 2010 onwards, for 24 OECD countries. Definitions of private vehicles differ across countries. For example,
the EU defines passenger vehicles as vehicles “designed...for the carriage of passengers and not exceeding eight seats”. The US, on the other
hand, defines passenger vehicles primarily based on weight. Consequently, sport utility vehicles (SUVs) are not classified as passenger vehicles,
although they are often used this way in the US. Hence, if it were included, US rates would be higher.
Source: OECD Statistics.
StatLink 2 https://doi.org/10.1787/888934237064
Public transport performance needs large improvements to encourage a modal shift
A shift to public transport and active mobility needs to be part of the net-zero GHG emission transition.
Additional to electrifying light transport in general, a shift away from cars towards public transport and
active mobility can ease the transition by reducing energy demand and the infrastructure needs related to
electrification. It can also provide substantial well-being benefits from reduced congestion, air and noise
pollution, increased safety and public space, as well as health benefits from active mobility. It can even
reduce pollution when road transport is entirely decarbonised, as particles of rubber from tyres are currently
responsible for nearly half of road transport particulate emissions.
Across countries, public transport performance is typically higher in European and South American FUAs,
which include cities and their surrounding commuting areas (OECD/EC, 2020[40]). Public transport
performance measures how well it gets people to destinations (Box 3.10). Within-country comparison of
cities is currently only possible for Europe and to some extent North America (Figure 3.42). In Europe,
variances in performance within-country are large, especially in the UK. This may allow setting benchmarks
and improve performance in cities with poor public transport performance.
0
100
200
300
400
500
600
Remote regionsNon-metro regionsclose to a small city
Non-metro regionsclose to a metro
Metro regionsLarge metro regions
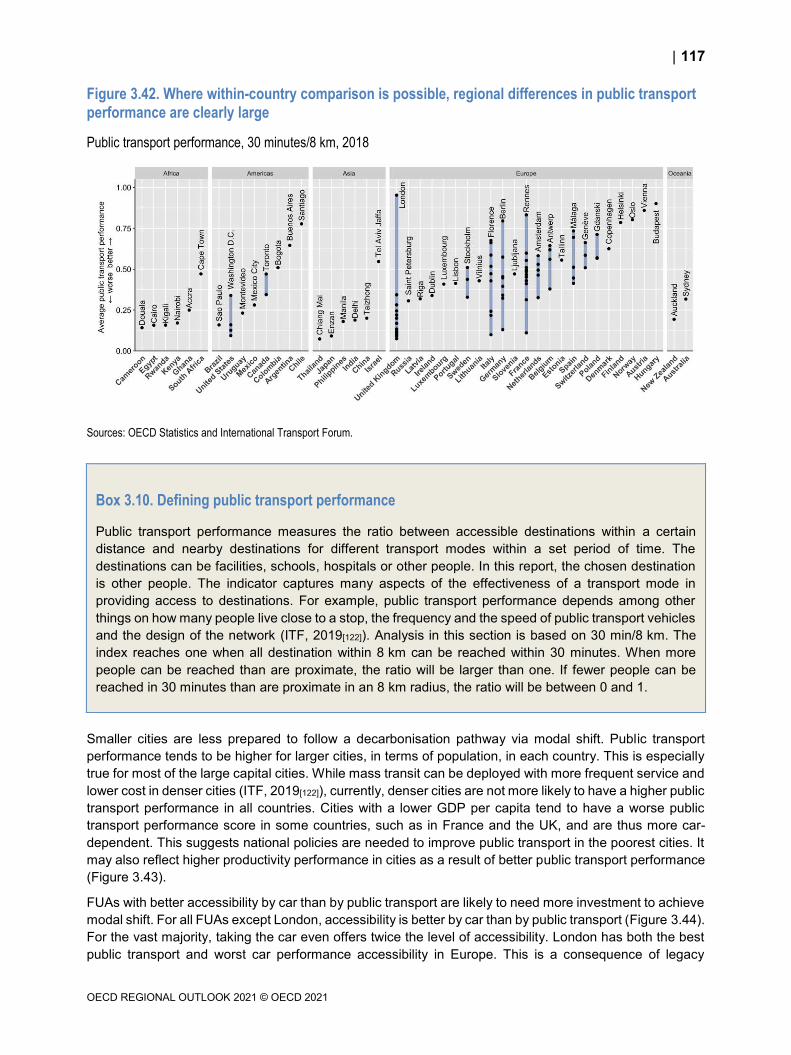
117
OECD REGIONAL OUTLOOK 2021 © OECD 2021
Figure 3.42. Where within-country comparison is possible, regional differences in public transport performance are clearly large
Public transport performance, 30 minutes/8 km, 2018
Sources: OECD Statistics and International Transport Forum.
Box 3.10. Defining public transport performance
Public transport performance measures the ratio between accessible destinations within a certain
distance and nearby destinations for different transport modes within a set period of time. The
destinations can be facilities, schools, hospitals or other people. In this report, the chosen destination
is other people. The indicator captures many aspects of the effectiveness of a transport mode in
providing access to destinations. For example, public transport performance depends among other
things on how many people live close to a stop, the frequency and the speed of public transport vehicles
and the design of the network (ITF, 2019[122]). Analysis in this section is based on 30 min/8 km. The
index reaches one when all destination within 8 km can be reached within 30 minutes. When more
people can be reached than are proximate, the ratio will be larger than one. If fewer people can be
reached in 30 minutes than are proximate in an 8 km radius, the ratio will be between 0 and 1.
Smaller cities are less prepared to follow a decarbonisation pathway via modal shift. Public transport
performance tends to be higher for larger cities, in terms of population, in each country. This is especially
true for most of the large capital cities. While mass transit can be deployed with more frequent service and
lower cost in denser cities (ITF, 2019[122]), currently, denser cities are not more likely to have a higher public
transport performance in all countries. Cities with a lower GDP per capita tend to have a worse public
transport performance score in some countries, such as in France and the UK, and are thus more car-
dependent. This suggests national policies are needed to improve public transport in the poorest cities. It
may also reflect higher productivity performance in cities as a result of better public transport performance
(Figure 3.43).
FUAs with better accessibility by car than by public transport are likely to need more investment to achieve
modal shift. For all FUAs except London, accessibility is better by car than by public transport (Figure 3.44).
For the vast majority, taking the car even offers twice the level of accessibility. London has both the best
public transport and worst car performance accessibility in Europe. This is a consequence of legacy
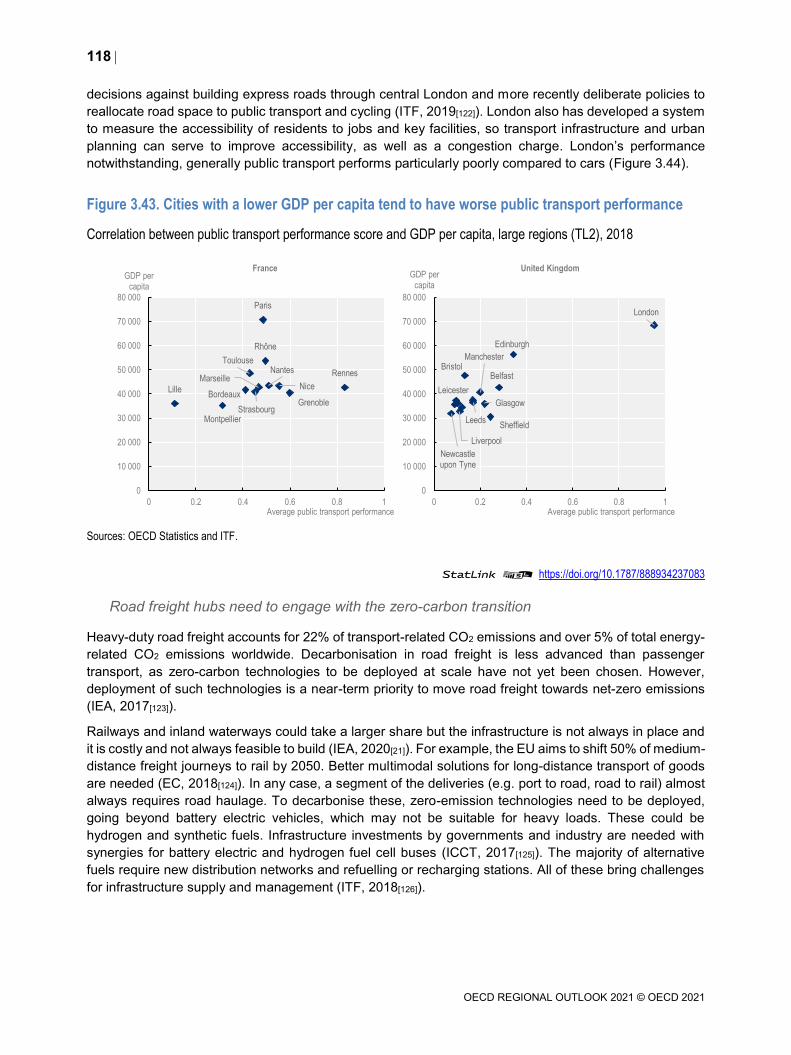
118
OECD REGIONAL OUTLOOK 2021 © OECD 2021
decisions against building express roads through central London and more recently deliberate policies to
reallocate road space to public transport and cycling (ITF, 2019[122]). London also has developed a system
to measure the accessibility of residents to jobs and key facilities, so transport infrastructure and urban
planning can serve to improve accessibility, as well as a congestion charge. London’s performance
notwithstanding, generally public transport performs particularly poorly compared to cars (Figure 3.44).
Figure 3.43. Cities with a lower GDP per capita tend to have worse public transport performance
Correlation between public transport performance score and GDP per capita, large regions (TL2), 2018
Sources: OECD Statistics and ITF.
StatLink 2 https://doi.org/10.1787/888934237083
Road freight hubs need to engage with the zero-carbon transition
Heavy-duty road freight accounts for 22% of transport-related CO2 emissions and over 5% of total energy-
related CO2 emissions worldwide. Decarbonisation in road freight is less advanced than passenger
transport, as zero-carbon technologies to be deployed at scale have not yet been chosen. However,
deployment of such technologies is a near-term priority to move road freight towards net-zero emissions
(IEA, 2017[123]).
Railways and inland waterways could take a larger share but the infrastructure is not always in place and
it is costly and not always feasible to build (IEA, 2020[21]). For example, the EU aims to shift 50% of medium-
distance freight journeys to rail by 2050. Better multimodal solutions for long-distance transport of goods
are needed (EC, 2018[124]). In any case, a segment of the deliveries (e.g. port to road, road to rail) almost
always requires road haulage. To decarbonise these, zero-emission technologies need to be deployed,
going beyond battery electric vehicles, which may not be suitable for heavy loads. These could be
hydrogen and synthetic fuels. Infrastructure investments by governments and industry are needed with
synergies for battery electric and hydrogen fuel cell buses (ICCT, 2017[125]). The majority of alternative
fuels require new distribution networks and refuelling or recharging stations. All of these bring challenges
for infrastructure supply and management (ITF, 2018[126]).
Paris
Rhône
Toulouse
Strasbourg
Bordeaux
Nantes
Lille
Montpellier
Rennes
Grenoble
MarseilleNice
0
10 000
20 000
30 000
40 000
50 000
60 000
70 000
80 000
0 0.2 0.4 0.6 0.8 1
GDP per capita
Average public transport performance
France
London
Leeds
Glasgow
Liverpool
Edinburgh
Manchester
Sheffield
BristolBelfast
Newcastle upon Tyne
Leicester
0
10 000
20 000
30 000
40 000
50 000
60 000
70 000
80 000
0 0.2 0.4 0.6 0.8 1
GDP per capita
Average public transport performance
United Kingdom
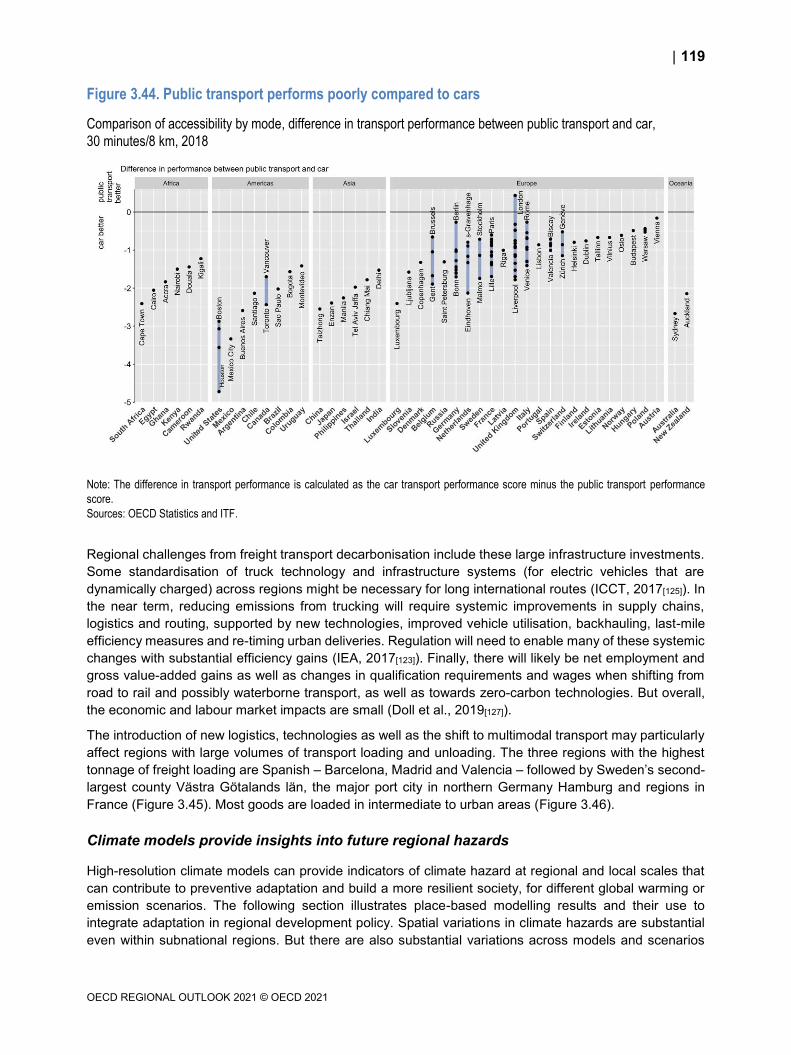
119
OECD REGIONAL OUTLOOK 2021 © OECD 2021
Figure 3.44. Public transport performs poorly compared to cars
Comparison of accessibility by mode, difference in transport performance between public transport and car,
30 minutes/8 km, 2018
Note: The difference in transport performance is calculated as the car transport performance score minus the public transport performance
score.
Sources: OECD Statistics and ITF.
Regional challenges from freight transport decarbonisation include these large infrastructure investments.
Some standardisation of truck technology and infrastructure systems (for electric vehicles that are
dynamically charged) across regions might be necessary for long international routes (ICCT, 2017[125]). In
the near term, reducing emissions from trucking will require systemic improvements in supply chains,
logistics and routing, supported by new technologies, improved vehicle utilisation, backhauling, last-mile
efficiency measures and re-timing urban deliveries. Regulation will need to enable many of these systemic
changes with substantial efficiency gains (IEA, 2017[123]). Finally, there will likely be net employment and
gross value-added gains as well as changes in qualification requirements and wages when shifting from
road to rail and possibly waterborne transport, as well as towards zero-carbon technologies. But overall,
the economic and labour market impacts are small (Doll et al., 2019[127]).
The introduction of new logistics, technologies as well as the shift to multimodal transport may particularly
affect regions with large volumes of transport loading and unloading. The three regions with the highest
tonnage of freight loading are Spanish – Barcelona, Madrid and Valencia – followed by Sweden’s second-
largest county Västra Götalands län, the major port city in northern Germany Hamburg and regions in
France (Figure 3.45). Most goods are loaded in intermediate to urban areas (Figure 3.46).
Climate models provide insights into future regional hazards
High-resolution climate models can provide indicators of climate hazard at regional and local scales that
can contribute to preventive adaptation and build a more resilient society, for different global warming or
emission scenarios. The following section illustrates place-based modelling results and their use to
integrate adaptation in regional development policy. Spatial variations in climate hazards are substantial
even within subnational regions. But there are also substantial variations across models and scenarios

120
OECD REGIONAL OUTLOOK 2021 © OECD 2021
especially for projected climate hazards (Schoof and Robeson, 2016[128]). Ensemble of models can improve
the robustness of the results but may also risk averaging out extreme outcomes.
Figure 3.45. Spanish regions have the highest tonnage of road freight loading
National annual road freight in 1 000 tons, locations of loading, small regions (NUTS3), 2019
Note: EU countries.
Source: Eurostat.
StatLink 2 https://doi.org/10.1787/888934237102
Figure 3.46. Most road freight goods are loaded in intermediate to urban areas
National annual road freight in 1 000 tons, locations of loading, weighted averages of small regions (TL3), 2019
Note: EU countries.
Source: Eurostat.
StatLink 2 https://doi.org/10.1787/888934237121
0
1 000
2 000
3 000
4 000
5 000
6 000
Predominantly rural Intermediate Predominantly urban
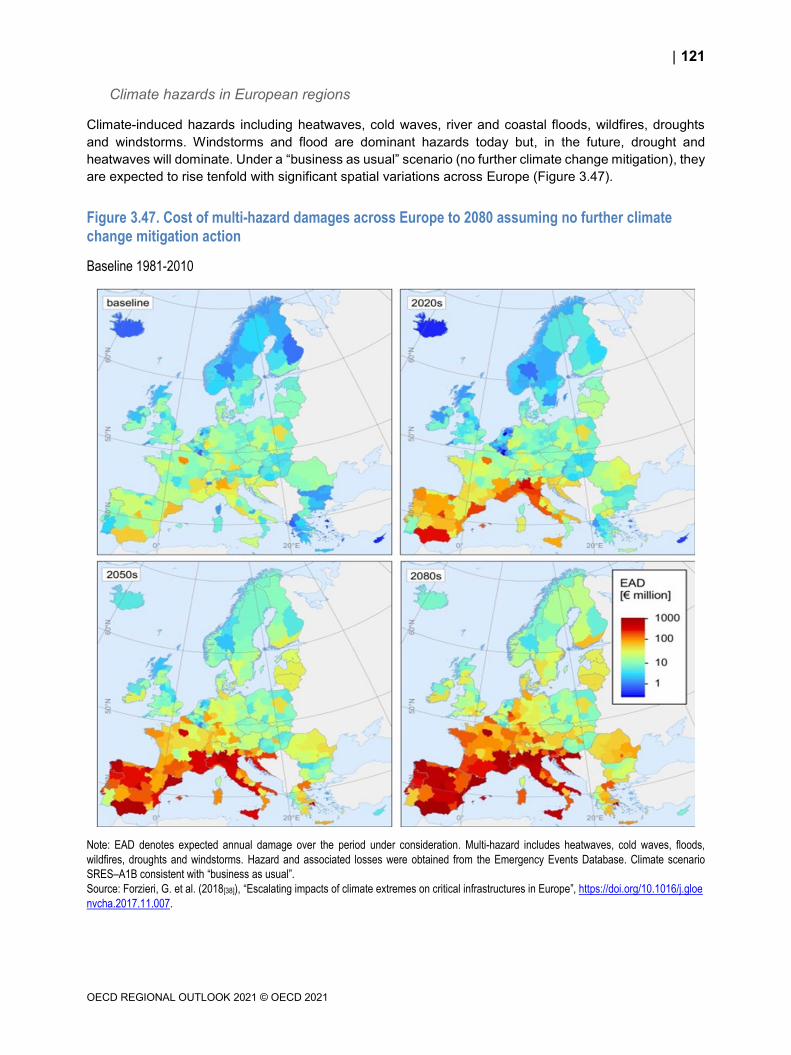
121
OECD REGIONAL OUTLOOK 2021 © OECD 2021
Climate hazards in European regions
Climate-induced hazards including heatwaves, cold waves, river and coastal floods, wildfires, droughts
and windstorms. Windstorms and flood are dominant hazards today but, in the future, drought and
heatwaves will dominate. Under a “business as usual” scenario (no further climate change mitigation), they
are expected to rise tenfold with significant spatial variations across Europe (Figure 3.47).
Figure 3.47. Cost of multi-hazard damages across Europe to 2080 assuming no further climate change mitigation action
Baseline 1981-2010
Note: EAD denotes expected annual damage over the period under consideration. Multi-hazard includes heatwaves, cold waves, floods,
wildfires, droughts and windstorms. Hazard and associated losses were obtained from the Emergency Events Database. Climate scenario
SRES–A1B consistent with “business as usual”.
Source: Forzieri, G. et al. (2018[38]), “Escalating impacts of climate extremes on critical infrastructures in Europe”, https://doi.org/10.1016/j.gloe
nvcha.2017.11.007.
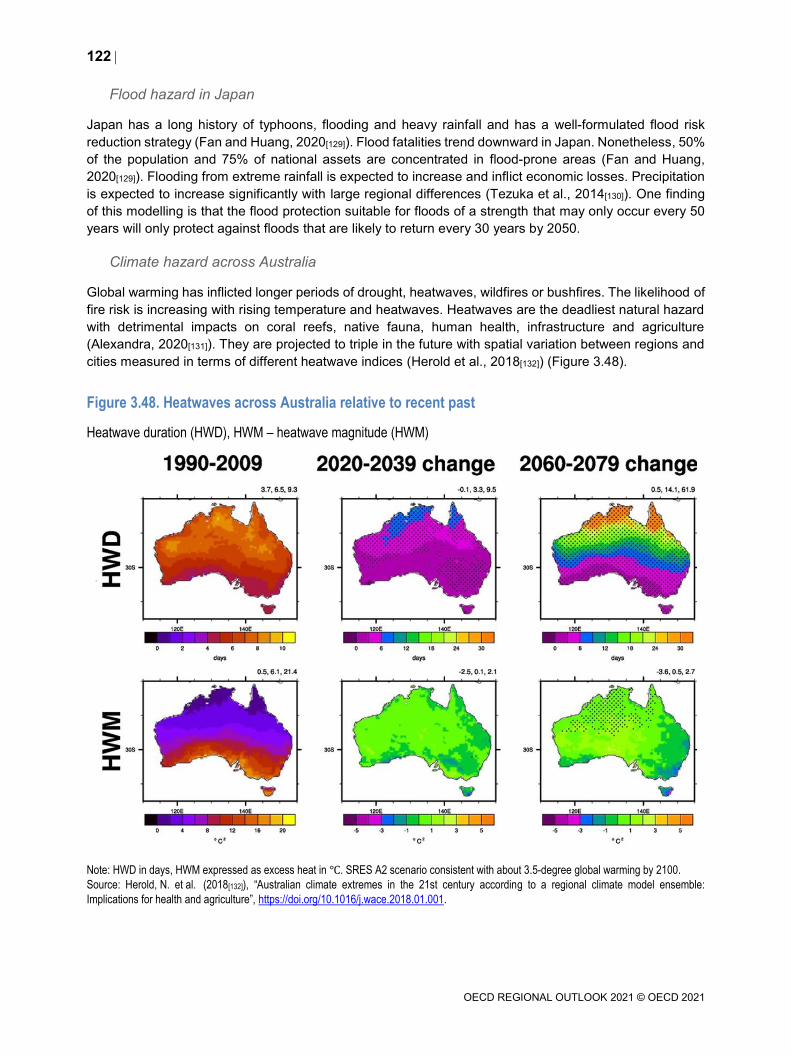
122
OECD REGIONAL OUTLOOK 2021 © OECD 2021
Flood hazard in Japan
Japan has a long history of typhoons, flooding and heavy rainfall and has a well-formulated flood risk
reduction strategy (Fan and Huang, 2020[129]). Flood fatalities trend downward in Japan. Nonetheless, 50%
of the population and 75% of national assets are concentrated in flood-prone areas (Fan and Huang,
2020[129]). Flooding from extreme rainfall is expected to increase and inflict economic losses. Precipitation
is expected to increase significantly with large regional differences (Tezuka et al., 2014[130]). One finding
of this modelling is that the flood protection suitable for floods of a strength that may only occur every 50
years will only protect against floods that are likely to return every 30 years by 2050.
Climate hazard across Australia
Global warming has inflicted longer periods of drought, heatwaves, wildfires or bushfires. The likelihood of
fire risk is increasing with rising temperature and heatwaves. Heatwaves are the deadliest natural hazard
with detrimental impacts on coral reefs, native fauna, human health, infrastructure and agriculture
(Alexandra, 2020[131]). They are projected to triple in the future with spatial variation between regions and
cities measured in terms of different heatwave indices (Herold et al., 2018[132]) (Figure 3.48).
Figure 3.48. Heatwaves across Australia relative to recent past
Heatwave duration (HWD), HWM – heatwave magnitude (HWM)
Note: HWD in days, HWM expressed as excess heat in ℃. SRES A2 scenario consistent with about 3.5-degree global warming by 2100.
Source: Herold, N. et al. (2018[132]), “Australian climate extremes in the 21st century according to a regional climate model ensemble:
Implications for health and agriculture”, https://doi.org/10.1016/j.wace.2018.01.001.
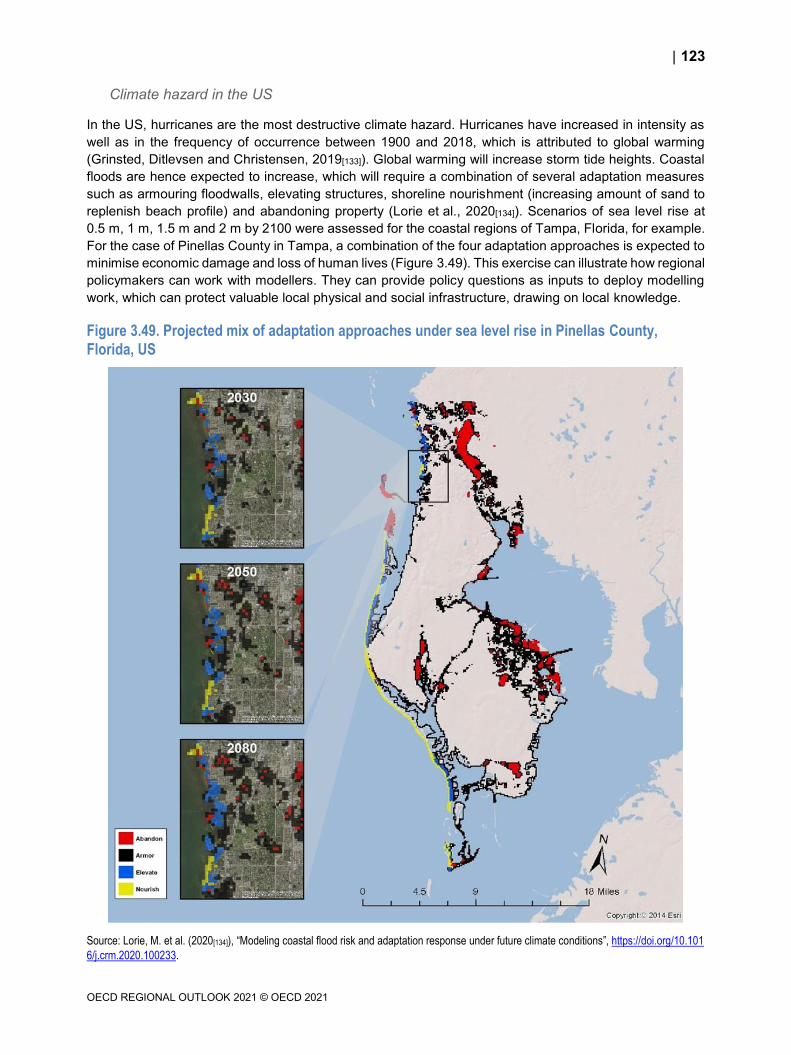
123
OECD REGIONAL OUTLOOK 2021 © OECD 2021
Climate hazard in the US
In the US, hurricanes are the most destructive climate hazard. Hurricanes have increased in intensity as
well as in the frequency of occurrence between 1900 and 2018, which is attributed to global warming
(Grinsted, Ditlevsen and Christensen, 2019[133]). Global warming will increase storm tide heights. Coastal
floods are hence expected to increase, which will require a combination of several adaptation measures
such as armouring floodwalls, elevating structures, shoreline nourishment (increasing amount of sand to
replenish beach profile) and abandoning property (Lorie et al., 2020[134]). Scenarios of sea level rise at
0.5 m, 1 m, 1.5 m and 2 m by 2100 were assessed for the coastal regions of Tampa, Florida, for example.
For the case of Pinellas County in Tampa, a combination of the four adaptation approaches is expected to
minimise economic damage and loss of human lives (Figure 3.49). This exercise can illustrate how regional
policymakers can work with modellers. They can provide policy questions as inputs to deploy modelling
work, which can protect valuable local physical and social infrastructure, drawing on local knowledge.
Figure 3.49. Projected mix of adaptation approaches under sea level rise in Pinellas County, Florida, US
Source: Lorie, M. et al. (2020[134]), “Modeling coastal flood risk and adaptation response under future climate conditions”, https://doi.org/10.101
6/j.crm.2020.100233.

124
OECD REGIONAL OUTLOOK 2021 © OECD 2021
Climate impacts include the number of days with minimum temperature above 20°C (Schoof and Robeson,
2016[128]) indicating more chances of heatwaves. Also, there will be a net reduction in agricultural yields by
9% per 1°C rise in warming after accounting for yield increase from CO2 concentration in cold places
(Hsiang et al., 2017[47]).
Road infrastructure damage in Mexico
Mexico is vulnerable to drought as most of its territory is arid or semi-arid (Soto-Montes-de-Oca and Alfie-
Cohen, 2019[135]). The drought risk is expected to increase. For example, by 2080 (in a scenario consistent
with global warming of 2°C), dry events will increase by 175%, whereas wet periods will decrease by 86%,
aggravating scarcity of water (Herrera-Pantoja and Hiscock, 2015[136]). Some local communities will need
to anticipate human and livestock morbidity, discomfort in working outside and the likelihood of abandoning
agriculture (Soto-Montes-de-Oca and Alfie-Cohen, 2019[135]).
Changing temperature and precipitation are also projected to inflict damage to the road infrastructure. The
cost of repairing and maintaining roads’ functionality may range between USD 1.3 billion to 4.8 billion at
the national level during the period 2015-50 (Figure 3.50). These costs vary from 1% of road inventory for
the least vulnerable state to 100% for the most vulnerable state under severe climatic change. The
modelling work provided vital information such as in terms of the future cost of damage on road networks,
which can inform science-based decision-making to integrate adaptation actions in road infrastructure
planning.
Figure 3.50. Climate-change-induced road maintenance costs vary strongly across Mexican regions
Cumulative cost (in million USD) from road infrastructure damage across states in Mexico between 2015 and 2050
Note: Scenario corresponds to 2℃ warming by the end of the 21st century.
Source: Espinet, X. et al. (2016[137]), “Planning resilient roads for the future environment and climate change: Quantifying the vulnerability of the
primary transport infrastructure system”, https://doi.org/10.1016/j.tranpol.2016.06.003.
125
OECD REGIONAL OUTLOOK 2021 © OECD 2021
Summing up: Policy conclusions from Chapter 3
Climate change is a global challenge requiring local action. Reaching the objectives of the Paris
Agreement will prevent major threats to the foundations of human well-being. These are substantially
worse under 2°C of global warming than under 1.5°C. Most OECD countries, therefore, aim at reaching
net-zero domestic GHG emissions in 2050. Deep transformations of unprecedented breadth over a short
period of time are needed to reach this target. There is a need for place-based policies that align with
national and global objectives to address climate change mitigation and adaptation.
o Well-being benefits beyond the protection of the climate can more than offset the cost
of climate action in many regions. A large majority of the population in OECD regions and
cities is exposed to unhealthy levels of small particulate pollution, with negative effects on
mortality, disease, vulnerability to COVID-19, child health, education and worker productivity.
Other well-being gains include reduced noise pollution and traffic congestion, healthier diets,
enhanced health due to increased active mobility, health benefits through thermal insulation
and improved water, soil and biodiversity protection. Negative GDP effects of the transition are
more marked in fossil-fuel exporting regions. Some regions with intensive coal use do much
more poorly than their national averages, especially with respect to GDP per capita, and need
support not to be left behind.
Delayed action raises costs substantially, including in the cities and regions where they occur.
Anticipation and support for vulnerable local populations are critical. Anticipation prevents potentially
disastrous climate impacts which hit the vulnerable the most in their livelihoods. Adequate income and
access to key services, such as healthcare and water, are key for the vulnerable to be resilient to climate-
change-related impacts.
Subnational governments need to play a key role in the net-zero transition:
Local conditions are critical for defining net-zero-emission strategies, for example for connecting
people to jobs, for the specific industrial mix and enterprise fabric of cities and regions.
Subnational governments have key relevant competencies for climate policy. The three pillars of
climate mitigation action – energy, land use, urban policy – are at the heart of regional
development. Local and regional governments play an essential role in supporting the most
vulnerable as they understand the local issues.
Governments at all levels should assess all their investment decisions against the net-zero-
emission transition. Some regions heavily invested in fossil fuel extraction and transformation are
particularly at risk from losses if investment in these activities continues.
Well-being benefits beyond climate often arise regionally in the near term and require local and
regional action to harness them.
The impacts, exposures and vulnerabilities to climate change differ across locations and need to
be identified and addressed locally and regionally.
Indicators to measure regional progress on the net-zero-emission transition have shown that:
GHG emissions vary hugely across territories and degree of rurality:
o Regions with different production-based emissions will have different transition pathways.
o While metropolitan regions contribute most to total GHG emissions (about 60%), rural regions’
emissions per capita are higher.
o Within-country variation in emissions is higher than between countries.
o Regions with higher production-based emissions per capita tend to have higher GDP per
capita.
Most OECD countries still have regions that rely on coal-fired electricity generation:
126
OECD REGIONAL OUTLOOK 2021 © OECD 2021
o Coal in electricity generation should be largely phased out by 2030 but the transition to zero-
carbon electricity remains unequal across regions.
o Some regions in Australia, Colombia, Greece, Japan, Korea, Poland and Turkey are still
planning or adding new coal-fired electricity generation capacity, which exposes them to losses
on the investment.
Regions need to move more decisively to renewables:
o Remote regions produce the most electricity, per capita, using renewables. The generation of
wind-based power is especially skewed toward most rural regions.
o Overall, the expansion of wind and solar electricity generation and the phase-out of coal will
shift electricity generation to more rural regions as progress is made in the zero-emission
transition. These trends will have regional development implications for rural regions.
o While electricity market design is a central government level task, rural and urban regions can
take steps to take advantage of cheap renewable electricity when it is the most abundant, as
discussed in Chapter 4.
Electric cars, public transport and active mobility need to grow more rapidly:
o A cost-effective date for phasing out the sale of new fossil-powered cars is 2030.
o Regional governments can encourage electric vehicle uptake by expanding public charging
infrastructure and offering additional incentives. Shifting mobility towards public transport and
active mobility can ease the transition by reducing transport energy demand as well as
infrastructure and material needs. Policies to encourage such a shift are described in
Chapter 4.
These indicators are also examined for each country in the online country notes. However, across the
OECD, regional data to measure transition progress is lacking. For example, regional progress in making
energy use in all buildings consistent with net-zero emissions and required renovations cannot be tracked.
Employment losses from the transition appear limited:
The employment risks are modest compared to historical job allocation and anticipated
restructuring due to digitalisation. On average, 2.3% of employment is at risk in OECD regions.
Job losses are regionally concentrated. Some of the regions with over 5% of employment at risk
have higher poverty risks and higher long-term unemployment. Polices to ensure that no region is
left behind are further discussed in Chapter 4.
There will also be employment gains from the transition.
Place-based adaptation needs to complement decisive mitigation:
Regional policymakers can work with modellers to identify exposures and vulnerabilities to protect
valuable local physical and social infrastructure, drawing on local knowledge.

127
OECD REGIONAL OUTLOOK 2021 © OECD 2021
Annex 3.A. Annex charts
Annex Figure 3.A.1. Regional emissions per capita and GDP per capita are positively correlated
GHG emissions per capita and GDP per capita, large regions (TL2), 2018
Source: OECD calculations based on EC (2020[84]), EDGAR - Emissions Database for Global Atmospheric Research, Joint Research Centre,
European Commission; OECD Statistics.

128
OECD REGIONAL OUTLOOK 2021 © OECD 2021
Annex Figure 3.A.2. In some top-emitting regions, GDP per capita is very high with little difference in life satisfaction
Relative difference to country means, large regions (TL2), 2018
Note: Panel B: No data for Canada and Spain.
Source: Panel A: OECD Statistics; Panel B: Gallup World Poll, 2014-18.
A. Distance to national average GDP per capita
B. Distance to national average life satisfaction
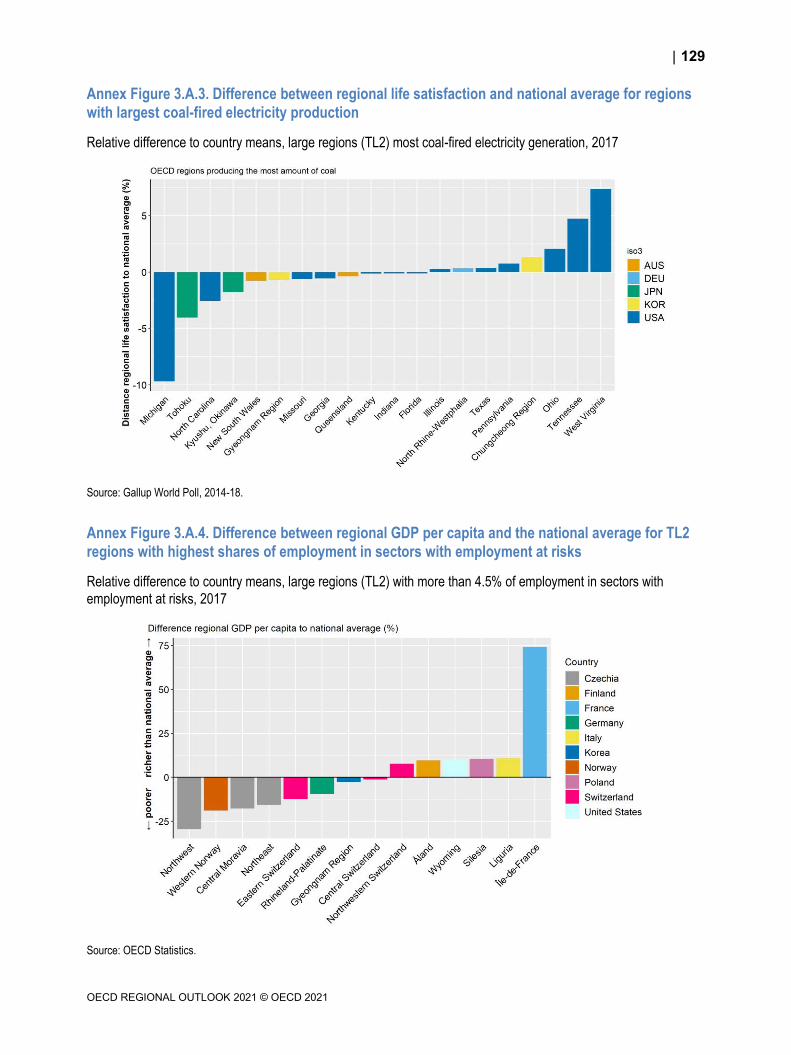
129
OECD REGIONAL OUTLOOK 2021 © OECD 2021
Annex Figure 3.A.3. Difference between regional life satisfaction and national average for regions with largest coal-fired electricity production
Relative difference to country means, large regions (TL2) most coal-fired electricity generation, 2017
Source: Gallup World Poll, 2014-18.
Annex Figure 3.A.4. Difference between regional GDP per capita and the national average for TL2 regions with highest shares of employment in sectors with employment at risks
Relative difference to country means, large regions (TL2) with more than 4.5% of employment in sectors with
employment at risks, 2017
Source: OECD Statistics.
130
OECD REGIONAL OUTLOOK 2021 © OECD 2021
References
Ainsworth, G. et al. (2020), “Integrating scientific and local knowledge to address conservation
conflicts: Towards a practical framework based on lessons learned from a Scottish case
study”, Environmental Science & Policy, Vol. 107, pp. 46-55,
https://doi.org/10.1016/j.envsci.2020.02.017.
[69]
Alexandra, J. (2020), “Burning bush and disaster justice in Victoria, Australia: Can regional
planning prevent bushfires becoming disasters?”, in Lukasiewicz, A. and C. Baldwin (eds.),
Natural Hazards and Disaster Justice: Challenges for Australia and Its Neighbours, Springer
Singapore Pte. Limited, https://doi.org/10.1007/978-981-15-0466-2_4.
[131]
Alves, A. et al. (2019), “Assessing the co-benefits of green-blue-grey infrastructure for
sustainable urban flood risk management”, Journal of Environmental Management, Vol. 239,
pp. 244-254, https://doi.org/10.1016/j.jenvman.2019.03.036.
[53]
Basner, M. et al. (2014), “Auditory and non-auditory effects of noise on health”, The Lancet,
Vol. 383/9925, pp. 1325-1332, http://dx.doi.org/10.1016/s0140-6736(13)61613-x.
[111]
Bibas, R., J. Chateau and E. Lanzi (2021), “Policy scenarios for a transition to a more resource
efficient and circular economy”, OECD Environment Working Papers, No. 169, OECD
Publishing, Paris, https://doi.org/10.1787/c1f3c8d0-en.
[117]
Bishop, K., J. Ketcham and N. Kuminoff (2018), Hazed and Confused: The Effect of Air Pollution
on Dementia, National Bureau of Economic Research, Cambridge, MA,
http://dx.doi.org/10.3386/w24970.
[107]
Chapman, R. (2019), “Managing the transition to a climate-neutral economy in cities and
regions”, Background paper for an OECD/EC workshop on 17 May 2019 within the workshop
series “Managing environmental and energy transitions for regions and cities”, Paris.
[13]
Chapman, R. et al. (2018), “A cost benefit analysis of an active travel intervention with health
and carbon emission reduction benefits”, International Journal of Environmental Research
and Public Health, Vol. 15/5, p. 962.
[109]
Château, J., R. Dellink and E. Lanzi (2014), “An Overview of the OECD ENV-Linkages
Model: Version 3”, OECD Environment Working Papers, No. 65, OECD Publishing, Paris,
https://dx.doi.org/10.1787/5jz2qck2b2vd-en.
[116]
Climate Analytics (2019), Global and Regional Coal Phase-out Requirements of the Paris
Agreement: Insights from the IPCC Special Report on 1.5°C.
[89]
Climate Analytics/New Climate Institute (n.d.), Climate Action Tracker,
https://climateactiontracker.org/ (accessed on September 2020).
[3]
Climate Change Committee (2019), Net Zero - The UK’s Contribution to Stopping Global
Warming, Climate Change Committee, https://www.theccc.org.uk/publication/net-zero-the-
uks-contribution-to-stopping-global-warming/ (accessed on 23 October 2019).
[2]
Cole, M., C. Ozgen and E. Strobl (2020), “Air pollution exposure and Covid-19 in Dutch
municipalities”, Environmental and Resource Economics, Vol. 76/4, pp. 581-610,
https://doi.org/10.1007/s10640-020-00491-4.
[100]
131
OECD REGIONAL OUTLOOK 2021 © OECD 2021
Colvin, R. et al. (2020), “Implications of climate change for future disasters”, in Lukasiewicz, A.
and C. Baldwin (eds.), Natural Hazards and Disaster Justice: Challenges for Australia and Its
Neighbours, Springer Singapore Pte. Limited, https://doi.org/10.1007/978-981-15-0466-2_2.
[76]
Comunian, S. et al. (2020), “Air pollution and Covid-19: The role of particulate matter in the
spread and increase of Covid-19’s morbidity and mortality”, International Journal of
Environmental Research and Public Health, Vol. 17/12, p. 4487.
[99]
Crippa, M. et al. (2020), Fossil CO2 Emissions of All World Countries - 2020 Report, EUR 30358
EN, Publications Office of the European Union, Luxembourg,
http://dx.doi.org/10.2760/143674.
[86]
Cutter, S. (2018), “Compound, cascading, or complex disasters: What’s in a name?”,
Environment: Science and Policy for Sustainable Development, Vol. 60/6, pp. 16-25,
http://dx.doi.org/10.1080/00139157.2018.1517518.
[79]
Dechezleprêtre, A. (2019), “The economic cost of air pollution: Evidence from Europe”. [27]
Dechezleprêtre, A., N. Rivers and B. Stadler (2019), “The economic cost of air pollution:
Evidence from Europe”, OECD Economics Department Working Papers, No. 1584, OECD
Publishing, Paris, https://dx.doi.org/10.1787/56119490-en.
[106]
Dodman, D. et al. (2019), “A spectrum of methods for a spectrum of risk: Generating evidence to
understand and reduce urban risk in sub-Saharan Africa”, Area, Vol. 51/3, pp. 586-594,
http://dx.doi.org/10.1111/area.12510.
[82]
Doll, K. et al. (2019), From Local to European Low Emission Freight Concepts, Summary Report
3: European Rail Freight Corridors for Europe, Fraunhofer Institute for Systems and
Innovation Research ISI.
[127]
Dolšak, N. and A. Prakash (2018), “The politics of climate change adaptation”, Annual Review of
Environment and Resources, Vol. 43/1, pp. 317-341, http://dx.doi.org/10.1146/annurev-
environ-102017-025739.
[62]
EAT-Lancet Commission (2018), Food Planet Health: Healthy Diets From Sustainable Food
Systems, Summary Report of the EAT-Lancet Commission,
https://eatforum.org/content/uploads/2019/01/EAT-
Lancet_Commission_Summary_Report.pdf.
[113]
EC (2020), EDGAR - Emissions Database for Global Atmospheric Research, Joint Research
Centre, European Commission.
[84]
EC (2019), Review of Progress on Implementation of the EU Green Infrastructure Strategy:
Report from the Commission to the European Parliament, the Council, the European
Economic and Social Committee and the Committee of the Regions, European Commission.
[58]
EC (2018), “A clean planet for all: A European long-term strategic vision for a prosperous,
modern, competitive and climate neutral economy”, No. COM(2018) 773, In-depth Analysis in
Support of the Commission Communication, European Commission.
[25]
EC (2018), Final Report of the High-Level Panel of the European Decarbonisation Pathways
Initiative, European Commission.
[124]
Edwards, C. (2009), Resilient Nation, http://www.continuitycentral.com/ResilientNation.pdf. [83]
132
OECD REGIONAL OUTLOOK 2021 © OECD 2021
EEA (2020), Air Quality in Europe, 2020 Report, European Environment Agency. [101]
EEA (2020), Environmental Noise in Europe - 2020, European Environment Agency,
http://dx.doi.org/10.2800/686249.
[112]
Emmanuel, R. and A. Loconsole (2015), “Green infrastructure as an adaptation approach to
tackling urban overheating in the Glasgow Clyde Valley Region, UK”, Landscape and Urban
Planning, Vol. 138, pp. 71-86, https://doi.org/10.1016/j.landurbplan.2015.02.012.
[54]
Espinet, X. et al. (2016), “Planning resilient roads for the future environment and climate change:
Quantifying the vulnerability of the primary transport infrastructure system”, Transport Policy,
Vol. 50, pp. 78-86, https://doi.org/10.1016/j.tranpol.2016.06.003.
[137]
ESPON (2020), Policy Brief: Structural Change in Coal Phase-out Regions. [120]
Fan, J. and G. Huang (2020), “Evaluation of flood risk management in Japan through a recent
case”, Sustainability, Vol. 12/13, p. 17, http://dx.doi.org/10.3390/su12135357.
[129]
Flores, C. et al. (2019), “Governance assessment of the flood’s infrastructure policy in San Pedro
Cholula, Mexico: Potential for a leapfrog to water sensitive”, Sustainability, Vol. 11/24,
http://dx.doi.org/10.3390/su11247144.
[68]
Formetta, G. and L. Feyen (2019), “Empirical evidence of declining global vulnerability to
climate-related hazards”, Global Environmental Change, Vol. 57,
https://doi.org/10.1016/j.gloenvcha.2019.05.004.
[37]
Forzieri, G. et al. (2018), “Escalating impacts of climate extremes on critical infrastructures in
Europe”, Global Environmental Change, Vol. 48,
https://doi.org/10.1016/j.gloenvcha.2017.11.007.
[38]
Fragkos, P. (2020), “Global energy system transformations to 1.5°C: The impact of revised
Intergovernmental Panel on Climate Change carbon budgets”, Energy Technology, Vol. 8/9,
p. 2000395, https://doi.org/10.1002/ente.202000395.
[12]
Frontier Economics (2015), Energy efficiency: An infrastructure priority, https://www.frontier-
economics.com/media/1009/20150923_energy-efficiency_an-infrastructure-
priority_frontier.pdf (accessed on 15 October 2020).
[115]
Garbe, J. et al. (2020), “The hysteresis of the Antarctic Ice Sheet”, Nature, Vol. 585/7826,
pp. 538-544, http://dx.doi.org/10.1038/s41586-020-2727-5.
[5]
Global Commission on Adaptation (2019), Adapt Now: A Global Call for Leadership on Climate
Resilience, Global Centre on Adaptation and World Resource Institute,
https://gca.org/reports/adapt-now-a-global-call-for-leadership-on-climate-resilience/.
[44]
Global Energy Monitor (2020), Global Coal Plant Tracker, https://endcoal.org/tracker/ (accessed
on 7 October 2020).
[92]
Grecksch, K. and C. Klöck (2020), “Access and allocation in climate change adaptation”,
International Environmental Agreements: Politics, Law and Economics, Vol. 20/2, pp. 271-
286, http://dx.doi.org/10.1007/s10784-020-09477-5.
[63]
133
OECD REGIONAL OUTLOOK 2021 © OECD 2021
Greenhill, B., N. Dolšak and A. Prakash (2018), “Exploring the adaptation-mitigation relationship:
Does information on the costs of adapting to climate change influence support for
mitigation?”, Environmental Communication, Vol. 12/7, pp. 911-927,
http://dx.doi.org/10.1080/17524032.2018.1508046.
[59]
GRI (2019), UK Business Adaptation Survey, Global Reporting Initiative. [71]
Grimes, A. et al. (2012), Cost Benefit Analysis of the Warm Up New Zealand: Heat Smart
Programme, Report to the Ministry of Economic Development.
[114]
Grinsted, A., P. Ditlevsen and J. Christensen (2019), “Normalized US hurricane damage
estimates using area of total destruction, 1900-2018”, Proceedings of the National Academy
of Sciences, Vol. 116/48, http://dx.doi.org/10.1073/pnas.1912277116.
[133]
Gurney, K. et al. (2021), “Under-reporting of greenhouse gas emissions in U.S. cities”, Nature
Communications, Vol. 12/1, pp. 1-7.
[87]
Haberl, H. et al. (2020), “A systematic review of the evidence on decoupling of GDP, resource
use and GHG emissions, part II: Synthesizing the insights”, Environmental Research Letters,
Vol. 15/6, http://dx.doi.org/10.1088/1748-9326.
[15]
Hall, D. et al. (2020), European Electric Vehicle Factbook 2019/2020, International Council on
Clean Transportation, https://theicct.org/publications/european-electric-vehicle-factbook-
20192020.
[95]
Hallegatte, S. et al. (2013), “Future flood losses in major coastal cities”, Nature Climate Change,
Vol. 3/9, pp. 802-806, http://dx.doi.org/10.1038/nclimate1979.
[41]
Hamilton, I. et al. (2021), “The public health implications of the Paris Agreement: A modelling
study”, The Lancet Planetary Health, Vol. 5/2, pp. e74-e83, http://dx.doi.org/10.1016/s2542-
5196(20)30249-7.
[102]
Heissel, J., C. Persico and D. Simon (2019), Does Pollution Drive Achievement? The Effect of
Traffic Pollution on Academic Performance, National Bureau of Economic Research,
Cambridge, MA, http://dx.doi.org/10.3386/w25489.
[105]
Herold, N. et al. (2018), “Australian climate extremes in the 21st century according to a regional
climate model ensemble: Implications for health and agriculture”, Weather and Climate
Extremes, Vol. 20, pp. 54-68, https://doi.org/10.1016/j.wace.2018.01.001.
[132]
Herrera-Pantoja, M. and K. Hiscock (2015), “Projected impacts of climate change on water
availability indicators in a semi-arid region of central Mexico”, Environmental Science &
Policy, Vol. 54, pp. 81-89, https://doi.org/10.1016/j.envsci.2015.06.020.
[136]
Hiscock, R. et al. (2017), “City scale climate change policies: Do they matter for wellbeing?”,
Preventive Medicine Reports, Vol. 6, pp. 265-270,
http://dx.doi.org/10.1016/j.pmedr.2017.03.019.
[55]
Hsiang, S. and M. Burke (2014), “Climate, conflict, and social stability: What does the evidence
say?”, Climatic Change, Vol. 123/1, pp. 39-55, http://dx.doi.org/10.1007/s10584-013-0868-3.
[48]
Hsiang, S. et al. (2017), “Estimating economic damage from climate change in the United
States”, Science, Vol. 356/6345, http://dx.doi.org/10.1126/science.aal4369.
[47]

134
OECD REGIONAL OUTLOOK 2021 © OECD 2021
ICCT (2020), “The end of the road? An overview of combustion-engine car phase-out
announcements across Europe”, International Council on Clean Transportation.
[98]
ICCT (2017), “Transitioning to zero-emission heavy-duty freight vehicles”, International Council
on Clean Transportation.
[125]
IEA (2020), Energy Technology Perspectives 2020, OECD Publishing, Paris,
https://dx.doi.org/10.1787/d07136f0-en.
[21]
IEA (2020), Global EV Outlook 2020: Entering the Decade of Electric Drive?, OECD Publishing,
Paris, https://dx.doi.org/10.1787/d394399e-en.
[93]
IEA (2020), World Energy Outlook 2020, OECD Publishing, Paris,
https://dx.doi.org/10.1787/557a761b-en.
[90]
IEA (2019), Global Energy & CO2 Status Report 2019, IEA, Paris,
https://www.iea.org/reports/global-energy-co2-status-report-2019/emissions (accessed on
3 April 2020).
[19]
IEA (2019), World Energy Outlook 2019, IEA, Paris, https://www.iea.org/reports/world-energy-
outlook-2019 (accessed on 3 April 2020).
[33]
IEA (2017), Energy Technology Perspectives 2017: Catalysing Energy Technology
Transformations, International Energy Agency, Paris, https://dx.doi.org/10.1787/energy_tech-
2017-en.
[123]
IEA (n.d.), World Energy Balances, International Energy Agency. [17]
IPCC (2019), Climate Change and Land, Intergovernmental Panel on Climate Change. [22]
IPCC (2019), Climate Change and Land - Summary for Policymakers, IPCC Special Report on
Climate Change, Desertification, Land Degradation, Sustainable Land Management, Food
Security, and Greenhouse Gas Fluxes in Terrestrial Ecosystems, Intergovernmental Panel on
Climate Change, https://www.ipcc.ch/site/assets/uploads/2019/08/4.-
SPM_Approved_Microsite_FINAL.pdf.
[8]
IPCC (2018), Global Warming of 1.5 ºC, Intergovernmental Panel on Climate Change,
https://www.ipcc.ch/sr15/ (accessed on 13 May 2020).
[4]
IPCC (2018), Global warming of 1.5°C - Summary for Policymakers, Intergovernmental Panel on
Climate Change, http://report.ipcc.ch/sr15/pdf/sr15_spm_final.pdf.
[11]
IPCC (2014), Climate Change 2014: Synthesis Report, Contribution of Working Groups I, II and
III to the Fifth Assessment Report of the Intergovernmental Panel on Climate Change.
[65]
IPCC (2012), Managing the Risks of Extreme Events and Disasters to Advance Climate Change
Adaptation. Special Report of Working Groups I and II of the Intergovernmental Panel on
Climate Change, Intergovernmental Panel on Climate Change, Cambridge University Press,
https://www.ipcc.ch/report/managing-the-risks-of-extreme-events-and-disasters-to-advance-
climate-change-adaptation/.
[60]
IRENA (2020), Global Renewables Outlook: Energy Transformation 2050, International
Renewable Energy Agency, https://www.irena.org/publications/2020/Apr/Global-Renewables-
Outlook-2020 (accessed on 17 July 2020).
[20]

135
OECD REGIONAL OUTLOOK 2021 © OECD 2021
ITF (2019), “Benchmarking Accessibility in Cities: Measuring the Impact of Proximity and
Transport Performance”, International Transport Forum Policy Papers, No. 68, OECD
Publishing, Paris, https://doi.org/10.1787/4b1f722b-en.
[122]
ITF (2018), “Towards Road Freight Decarbonisation: Trends, Measures and Policies”,
International Transport Forum Policy Papers, No. 64, OECD Publishing, Paris,
https://doi.org/10.1787/3dc0b429-en.
[126]
Janssens-Maenhout, G. et al. (2019), “EDGAR v4. 3.2 Global Atlas of the three major
greenhouse gas emissions for the period 1970-2012”, Earth System Science Data, Vol. 11/3,
pp. 959-1002.
[85]
Karlsson, M., E. Alfredsson and N. Westling (2020), “Climate policy co-benefits: A review”,
Climate Policy, Vol. 20/3, pp. 292-316, https://doi.org/10.1080/14693062.2020.1724070.
[28]
Kim, D. and S. Song (2019), “The multifunctional benefits of green infrastructure in community
development: An analytical review based on 447 cases”, Sustainability, Vol. 11/14, pp. 1-17,
http://dx.doi.org/10.3390/su11143917.
[43]
Koks, E. et al. (2019), “A global multi-hazard risk analysis of road and railway infrastructure
assets”, Nature Communications, Vol. 10/1, p. 11, http://dx.doi.org/10.1038/s41467-019-
10442-3.
[46]
Krauß, W. and S. Bremer (2020), “The role of place-based narratives of change in climate risk
governance”, Climate Risk Management, Vol. 28, pp. 1-7,
https://doi.org/10.1016/j.crm.2020.100221.
[66]
Kwon, Y., S. Son and K. Jang (2018), “Evaluation of incentive policies for electric vehicles: An
experimental study on Jeju Island”, Transportation Research Part A: Policy and Practice,
Vol. 116, pp. 404-412.
[94]
Lorie, M. et al. (2020), “Modeling coastal flood risk and adaptation response under future climate
conditions”, Climate Risk Management, Vol. 29, pp. 1-16,
https://doi.org/10.1016/j.crm.2020.100233.
[134]
Marí-Dell’Olmo, M. et al. (2019), “Social inequalities in the association between temperature and
mortality in a South European context”, International Journal of Public Health, Vol. 64/1,
pp. 27-37, http://dx.doi.org/10.1007/s00038-018-1094-6.
[50]
Matsumoto, T. et al. (2019), “An integrated approach to the Paris climate Agreement: The role of
regions and cities”, OECD Regional Development Working Papers, No. 2019/13, OECD
Publishing, Paris, https://dx.doi.org/10.1787/96b5676d-en.
[24]
Melvin, A. et al. (2017), “Climate change damages to Alaska public infrastructure and the
economics of proactive adaptation”, Proceedings of the National Academy of Sciences,
Vol. 114/2, pp. E122-E131, http://dx.doi.org/10.1073/pnas.1611056113.
[45]
Mercure, J. et al. (2018), “Macroeconmic impact of stranded fossil fuel assets”, Nature Climate
Change, http://dx.doi.org/10.1038/s41558-018-0182-1.
[34]
Munich Re (n.d.), NatCatServices (database). [39]
Nakashima, D. et al. (2012), Weathering Uncertainty: Traditional Knowledge for Climate Change
Assessment and Adaptation, UNESCO, Paris and UNU, Darwin.
[51]

136
OECD REGIONAL OUTLOOK 2021 © OECD 2021
New Climate Economy (2019), Unlocking the Inclusive Growth Story of the 21st Century:
Accelerating Climate Action in Urgent Times.
[18]
OECD (2021), Toolkit for Water Policies and Governance: Converging Towards the OECD
Council Recommendation on Water, OECD Publishing, Paris,
https://doi.org/10.1787/ed1a7936-en.
[70]
OECD (2020), Common Ground Between the Paris Agreement and the Sendai
Framework: Climate Change Adaptation and Disaster Risk Reduction, OECD Publishing,
Paris, https://dx.doi.org/10.1787/3edc8d09-en.
[80]
OECD (2020), “COVID-19 and the low-carbon transition: Impacts and possible policy
responses”, OECD Policy Responses to Coronavirus (COVID-19), OECD, Paris,
http://www.oecd.org/coronavirus/policy-responses/covid-19-and-the-low-carbon-transition-
impacts-and-possible-policy-responses-749738fc/.
[61]
OECD (2020), Linking Indigenous Communities with Regional Development in Canada, OECD
Rural Policy Reviews, OECD Publishing, Paris, https://dx.doi.org/10.1787/fa0f60c6-en.
[52]
OECD (2020), Managing Environmental and Energy Transitions for Regions and Cities, OECD
Publishing, Paris, https://doi.org/10.1787/f0c6621f-en.
[14]
OECD (2020), OECD Regions and Cities at a Glance 2020, OECD Publishing, Paris,
https://doi.org/10.1787/959d5ba0-en.
[88]
OECD (2019), Accelerating Climate Action: Refocusing Policies through a Well-being Lens,
OECD Publishing, Paris, https://dx.doi.org/10.1787/2f4c8c9a-en.
[1]
OECD (2019), Enhancing Climate Change Mitigation through Agriculture, OECD Publishing,
Paris, https://dx.doi.org/10.1787/e9a79226-en.
[121]
OECD (2018), Cost-Benefit Analysis and the Environment: Further Developments and Policy
Use, OECD Publishing, Paris, https://dx.doi.org/10.1787/9789264085169-en.
[31]
OECD (2018), Effective Carbon Rates 2018: Pricing Carbon Emissions Through Taxes and
Emissions Trading, OECD Publishing, Paris, https://dx.doi.org/10.1787/9789264305304-en.
[23]
OECD (2018), Taxing Energy Use 2018: Companion to the Taxing Energy Use Database, OECD
Publishing, Paris, https://dx.doi.org/10.1787/9789264289635-en.
[97]
OECD (2017), Investing in Climate, Investing in Growth, OECD Publishing, Paris,
https://dx.doi.org/10.1787/9789264273528-en.
[26]
OECD (2003), Emerging Risks in the 21st Century: An Agenda for Action, OECD Publishing,
Paris, https://dx.doi.org/10.1787/9789264101227-en.
[74]
OECD (n.d.), Green Growth (database), OECD, Paris. [16]
OECD/EC (2020), Cities in the World: A New Perspective on Urbanisation, OECD Urban
Studies, OECD Publishing, Paris, https://doi.org/10.1787/d0efcbda-en.
[40]
OECD/ITF (2019), Tax Revenue Implications of Decarbonising Road Transport: Scenarios for
Slovenia, OECD Publishing, Paris, https://dx.doi.org/10.1787/87b39a2f-en.
[96]

137
OECD REGIONAL OUTLOOK 2021 © OECD 2021
Okazumi, T. and T. Nakasu (2015), “Lessons learned from two unprecedented disasters in 2011
– Great East Japan Earthquake and Tsunami in Japan and Chao Phraya River flood in
Thailand”, International Journal of Disaster Risk Reduction, Vol. 13, pp. 200-206,
https://doi.org/10.1016/j.ijdrr.2015.05.008.
[36]
Pelling, M. (2010), Adaptation to Climate Change: From Resilience to Transformation, Taylor &
Francis Group,
https://www.taylorfrancis.com/books/mono/10.4324/9780203889046/adaptation-climate-
change-mark-pelling.
[64]
Pescaroli, G. et al. (2018), “Increasing resilience to cascading events: The M.OR.D.OR.
scenario”, Safety Science, Vol. 110, pp. 131-140, https://doi.org/10.1016/j.ssci.2017.12.012.
[73]
Renn, O. (2016), “Systemic risks: The new kid on the block”, Environment: Science and Policy
for Sustainable Development, Vol. 58/2, pp. 26-36,
http://dx.doi.org/10.1080/00139157.2016.1134019.
[78]
Rohr, J. et al. (2019), “Emerging human infectious diseases and the links to global food
production”, Nature Sustainability, Vol. 2, pp. 445-456, http://dx.doi.org/10.1038/s41893-019-
0293-3.
[6]
Roy, R. and N. Braathen (2017), “The Rising Cost of Ambient Air Pollution thus far in the 21st
Century: Results from the BRIICS and the OECD Countries”, OECD Environment Working
Papers, No. 124, OECD Publishing, Paris, https://dx.doi.org/10.1787/d1b2b844-en.
[103]
Rydge, J., R. Martin and A. Valero (2018), “Sustainable growth in the UK: Seizing the
opportunities from technological change and the transition to a low-carbon economy”,
Grantham Research Institute on Climate Change and the Environment, London.
[118]
Sanderson, B. and B. O’Neill (2020), “Assessing the costs of historical inaction on climate
change”, Scientific Reports, Vol. 10/1, pp. 1-12, http://dx.doi.org/10.1038/s41598-020-66275-
4.
[32]
Schoof, J. and S. Robeson (2016), “Projecting changes in regional temperature and precipitation
extremes in the United States”, Weather and Climate Extremes, Vol. 11, pp. 28-40,
https://doi.org/10.1016/j.wace.2015.09.004.
[128]
Schucht, S. et al. (2015), “Moving towards ambitious climate policies: Monetised health benefits
from improved air quality could offset mitigation costs in Europe”, Environmental Science &
Policy, Vol. 50, pp. 252-269, https://doi.org/10.1016/j.envsci.2015.03.001.
[108]
Shepherd, T. and A. Sobel (2020), “Localness in climate change”, Comparative Studies of South
Asia, Africa and the Middle East, Vol. 40/1, pp. 7-16, http://dx.doi.org/10.1215/1089201X-
8185983.
[72]
Soto-Montes-de-Oca, G. and M. Alfie-Cohen (2019), “Impact of climate change in Mexican peri-
urban areas with risk of drought”, Journal of Arid Environments, Vol. 162, pp. 74-88,
https://doi.org/10.1016/j.jaridenv.2018.10.006.
[135]
Steffen, W. et al. (2018), “Trajectories of the Earth System in the anthropocene”, PNAS,
Vol. 115/33, pp. 8252-8259, http://dx.doi.org/10.1073/pnas.1810141115/-/DCSupplemental.
[7]
138
OECD REGIONAL OUTLOOK 2021 © OECD 2021
Suo, W., J. Zhang and X. Sun (2019), “Risk assessment of critical infrastructures in a complex
interdependent scenario: A four-stage hybrid decision support approach”, Safety Science,
Vol. 120, pp. 692-705, https://doi.org/10.1016/j.ssci.2019.07.043.
[77]
Sussams, L., W. Sheate and R. Eales (2015), “Green infrastructure as a climate change
adaptation policy intervention: Muddying the waters or clearing a path to a more secure
future?”, Journal of Environmental Management, Vol. 147, pp. 184-193,
https://doi.org/10.1016/j.jenvman.2014.09.003.
[56]
Taylor, F. et al. (2020), “Messy maps: Qualitative GIS representations of resilience”, Landscape
and Urban Planning, Vol. 198, pp. 1-11, https://doi.org/10.1016/j.landurbplan.2020.103771.
[67]
Tezuka, S. et al. (2014), “Estimation of the effects of climate change on flood-triggered economic
losses in Japan”, International Journal of Disaster Risk Reduction, Vol. 9, pp. 58-67,
https://doi.org/10.1016/j.ijdrr.2014.03.004.
[130]
UNDP (2020), COVID-19 and Human Development: Assessing the Crisis, Envisioning the
Recovery, United Nations Development Programme,
http://hdr.undp.org/sites/default/files/covid-19_and_human_development_0.pdf.
[81]
UNEP (2020), Emissions Gap Report 2020, United Nations Environment Programme. [9]
UNEP (2019), Emissions Gap Report 2019, United Nations Environment Programme,
https://www.unenvironment.org/resources/emissions-gap-report-2019 (accessed on
19 July 2020).
[10]
Unsworth, S. et al. (2020), “Seizing sustainable growth opportunities from zero emissions
passenger vehicles in the UK”, Grantham Research Institute on Climate Change and the
Environment, London, http://Working Paper.
[119]
Ürge-Vorsatz, D., B. Boza-Kiss and S. Chatterjee (2019), “What policies can prepare cities and
regions for the transition to a climate-neutral economy?”, Background paper for an OECD/EC
Workshop on 17 May 2019 within the workshop series “Managing environmental and energy
transitions for regions and cities".
[35]
Venkataramanan, V. et al. (2019), “A systematic review of the human health and social well-
being outcomes of green infrastructure for stormwater and flood management”, Journal of
Environmental Management, Vol. 246, pp. 868-880,
https://doi.org/10.1016/j.jenvman.2019.05.028.
[57]
WHO (2018), Air Pollution and Child Health: Prescribing Clean Air. Summary, World Health
Organization, Geneva, http://apps.who.int/bookorders.
[104]
WHO/JRC (2011), “Burden of disease from environmental noise: Quantification of healthy life
years lost in Europe”, World Health Organization.
[110]
Winsemius, H. et al. (2018), “Disaster risk, climate change, and poverty: Assessing the global
exposure of poor people to floods and droughts”, Environment and Development Economics,
Vol. 23/3, pp. 328-348, http://dx.doi.org/10.1017/S1355770X17000444.
[49]
Wolkinger, B. et al. (2018), “Evaluating health co-benefits of climate change mitigation in urban
mobility”, International Journal of Environmental Research and Public Health, Vol. 15/5,
p. 880, http://dx.doi.org/10.3390/ijerph15050880.
[30]
139
OECD REGIONAL OUTLOOK 2021 © OECD 2021
WRI (n.d.), Global Power Plant Database, World Resources Institute,
https://datasets.wri.org/dataset/globalpowerplantdatabase.
[91]
Xie, Y. et al. (2018), “Co-benefits of climate mitigation on air quality and human health in Asian
countries”, Environment International, Vol. 119, pp. 309-318.
[29]
Zhang, Y. et al. (2018), “The MJA–Lancet Countdown on health and climate change: Australian
policy inaction threatens lives”, Medical Journal of Australia, Vol. 209/11, pp. 474e1-474e21,
http://dx.doi.org/10.5694/mja18.00789.
[42]
Zscheischler, J. et al. (2018), “Future climate risk from compound events”, Nature Climate
Change, Vol. 8/6, pp. 469-477, http://dx.doi.org/10.1038/s41558-018-0156-3.
[75]
Notes
1 See https://edgar.jrc.ec.europa.eu/overview.php?v=verify_h2020.
2 Defined as crop and animal production, hunting and related service activities.
3 Relative poverty is defined here as the percentage of people having experienced times in the past
12 months when they did not have enough money to buy food that they or their family needed

141
OECD REGIONAL OUTLOOK 2021 © OECD 2021
Climate change is a global challenge requiring local, inclusive, early action.
Subnational governments need to play a key role. Multi-level governance
and finance should identify the steps to take by all government levels.
Transfers between subnational governments need to be linked to climate
policy goals. Integrating scientific advice improves success. Cities can
adopt policies that reach net-zero emissions and improve urban living.
Metropolitan regions contribute more than 60% of production-based
greenhouse gas (GHG) emissions. Urban policies should co-ordinate
sectoral policies, such as transport and housing, to reach net-zero
emissions. Cities hold large potentials for modular technologies to integrate
renewables, heat pumps or green infrastructure. Circular economy
initiatives can make consumption more consistent with net-zero emissions.
Rewarding ecosystem benefits boosts emission reductions and rural
development. Participation in profits and decision-making makes renewable
projects more attractive. Ageing, lower education levels and less diversified
economic activity put rural regions with carbon-intensive industry at bigger
risk and per capita emissions are often higher than in metropolitan regions.
In regions at risk of losing employment in emission-intensive economic
activity, building consensus early among local stakeholders from education,
innovative business, regional and local governments is key to make best
use of local assets.
4 Selected policy avenues

142
OECD REGIONAL OUTLOOK 2021 © OECD 2021
Integrating subnational governments in climate policy governance and financing
Subnational governments are central for the net-zero greenhouse-gas-emission transition by 2050. As
highlighted in paper “Financing climate objectives in cities and regions to deliver sustainable and inclusive
growth” (OECD, 2019[1]), in 2000-16, subnational governments were responsible for 55% of public
spending and 64% of public investment in sectors having a direct impact on climate change and other
environmental issues. Yet, subnational climate-related spending and investment represented, on average,
only around 1.3% and 0.4% of gross domestic product (GDP) respectively in that same period (OECD,
2019[1]).
Cities and regions provide critical emission reduction opportunities, as they often have jurisdiction over key
sectors for climate action. They are also motivated to act because many of the well-being gains of the net-
zero-emission transition, such as improved health outcomes, accrue locally (Chapter 3). As Chapter 3 has
also shown, regions differ enormously in terms of activities generating emissions and potential socio-
economic impacts and, therefore, in the actions needed to move to net-zero emissions. Since local
governments are in close contact with citizens and local businesses, local governments are generally in a
better position to influence behaviour by implementing emission-reduction policies based on their
knowledge of local conditions and capabilities.
Subnational governments will not be able to manage the net-zero transition on their own. Reaching national
net-zero emission targets requires co-ordinated action across regions and a massive upscaling of
subnational climate finance. Ensuring effective multi-level governance systems are needed to optimise
regional and local policy, programming and investment contributions. This becomes even more urgent
after the COVID-19 pandemic, which has further weakened subnational spending abilities.
One important policy avenue to manage the net-zero transition will be creating incentives for subnational
governments to focus spending and investment on the net-zero transition. These incentives can be broadly
understood as combining different types of financial transfers from national to subnational governments,
such as grants, subsidies, contracts, etc. with specific objectives towards reaching the net-zero transition.
One example of such an incentive is conditionalities. Several countries have introduced environmental
conditionalities in the allocation of their grants and subsidies for infrastructure projects to make sure that
the project is consistent with the objective of the net-zero transition. Sound multi-level governance of
climate policy means managing interactions and financial flows at and among different levels of
government – from the global and supra-national level to the national, regional and local levels. The first
part of this section highlights governance challenges associated with co-ordinating and financing the
net-zero transition and presents a range of instruments to overcome these. The second part of the section
explores how subnational governments can scale up and deploy different climate finance instruments.
Subnational governments need to be integrated into climate policy governance
A successful net-zero transition requires multi-level governance systems that are “fit for purpose” and can
support integrated or synchronised government actions across policy sectors and actors, in order to:
Help different levels of government navigate the complex and dispersed processes that generate
net-zero transitions.
Ensure coherence across policy sectors, build an appropriate scale for intervention and optimise
climate finance initiatives.
Maximise well-being gains while minimising the trade-offs associated with climate policy
implementation.

143
OECD REGIONAL OUTLOOK 2021 © OECD 2021
Several factors can make or break subnational climate governance:
The political and legal context: The extent to which subnational governments govern climate action
depends on and is affected by the national and international political and legal contexts. Results of
a survey conducted by the European Environment Agency (EEA) show that cities identify national
laws, standards and regulations, the distribution of state powers and actions, and national-level
policy objectives as drivers of sustainability transitions. Despite the increasing number of regional
and local climate initiatives, current efforts to tackle climate change at the subnational level remain
poorly recognised and not well integrated into national policy frameworks. Approximately one out
of four countries that recently submitted nationally determined contributions1 (NDCs) do not
consider subnational governments in their effort to reduce national emissions and adapt to the
impact of climate change (Hsu et al., 2018[2]; Matsumoto et al., 2019[3]).
The degree of autonomy and decentralisation: In two-thirds of OECD countries, the economic
importance of subnational governments has increased between 1995 and 2016, measured as a
spending share of GDP and total public spending. Decentralisation may expand citizen
participation by bringing government closer to citizens and by better targeting public service
provision to local needs. This can also help meet regionally and locally identified climate priorities.
Yet, a lack of administrative, technical or strategic capacities, limited resources or limited clarity in
the assignment of responsibilities can be barriers to effective local action and can result in poorly
co-ordinated investments. Decentralisation can result in geographical fragmentation and poorly
co-ordinated investment. To avoid and overcome these barriers, the OECD report Making
Decentralisation Work: A Handbook for Policy-Makers offers guidance on designing and
implementing effective decentralisation systems to optimise the associated potential advantages,
such as greater accountability and more efficient, better targeted public service delivery (OECD,
2019[4]).
Access to finance for climate action: The extent to which subnational governments have access to
funding and can optimise its use for climate-related investment and spending is a key factor in
climate governance. Subnational governments need more financial support from the international
community and national governments, just as they need more incentives to apply their own
revenues towards the net-zero transition. Multi-level governance mechanisms are essential for
planning and co-ordinating the net-zero transition.
Applying a place-based approach to the net-zero transition requires ongoing and productive dialogue
among different levels of government. This can embed climate change action in regional development
policy across diverse sectors and activities, such as energy, urban planning and sustainable land use. It
also demands a seamless flow of information and resources. The transition comes with unintended
consequences and trade-offs among social, economic and environmental sustainability outcomes.
Managing these calls for continuously identifying and evaluating the risks and opportunities associated
with transitions. Foresight exercises and backcasting policy actions from them can be useful techniques.
They help policymakers develop timelines for technology and investment decisions. Progress towards the
goal of net-zero emissions in 2050 should be measured by setting clear and realistic short- and medium-
term targets, bearing in mind the economically useful life of assets and the availability of zero-emission
consistent alternatives. Such targets include, for example, sustaining the current growth rate of renewables
and increasing the annual refurbishment rates of existing buildings to close to 5%, so all buildings are
refurbished consistent with net-zero emissions before 2050.
Successful climate policy governance relies on multi-level governance systems that can identify and broker
an agreement on long-term strategic goals to set coherent policy priorities at different government levels.
It also relies on monitoring and evaluation systems that first allow governments to identify whether they
are reaching their aims and do so in a cost-effective way, taking into account well-being impacts and,
second, serve as an accountability mechanism to stakeholders and citizens. While climate-related
objectives, strategies and policies may be set at the international and national levels, implementation by
144
OECD REGIONAL OUTLOOK 2021 © OECD 2021
subnational governments can generate action that is more appropriate to local characteristics. Regions
can also play an important role as a co-ordinator of climate action undertaken at the local level. A periodic
review helps policymakers adjust and enable policy learning. Scientific advisory bodies can help regions
and cities to define and monitor a range of short-term sectoral benchmarks and their contribution to the
long-term objective of net-zero emissions. Integrating an autonomous scientific advice body in political
decision-making at the central government level has made a substantial difference in reducing emissions
cost-effectively, as the United Kingdom (UK) has shown (Box 4.1). This includes a single advisory body
involved in setting medium-term and long-term objectives, the evaluation of policies ex ante and ex post
against objectives, as well as the approval of policies and objectives by parliament. The central role of
place-based policies argues in favour of extending this approach to regional and urban climate action. The
climate challenge and the COVID-19 crisis have common characteristics. Countries can therefore learn
from the multi-level governance arrangements in the course of the COVID-19 crisis. For example,
associations of regional and local governments are playing an important role to support vertical
co-ordination during the pandemic (Chapter 2).
Box 4.1. Integration of scientific advisory bodies
National and regional scientific bodies provide independent advice to governments on setting and
meeting greenhouse gas (GHG) emission targets. They also help subnational governments understand
whether current decisions, especially on infrastructure investment, are compatible with carbon budgets
and the emission reduction trajectories of long-term plans. This creates the necessary link between
scientific knowledge, national long-term targets and the decision-making process. Many countries have
introduced such bodies. Given the strong case for place-based climate action, regional policymakers
should incorporate scientific advisory bodies as knowledge and evidence channels within the multi-level
governance system supporting the transitions.
The UK Climate Change Committee
In the UK, parliament sets legally binding five-year emission-reduction budgets and the government is
required to propose policies to meet them. The Climate Change Committee evaluates and monitors the
government’s policies ex ante and ex post and makes concrete recommendations for these five-year
budgets. The government is legally obligated to respond to the committee’s annual reports. Reporting
to parliament also occurs annually and all views are made public, stimulating public debate and
engagement with a science-based policy programme. The Climate Change Committee comprises
8 experts on climate change, science, economics, behavioural science and business administration,
with the additional support of a secretariat of approximately 30 professionals and an annual budget.
The committee is also the only scientific advisory body in the UK that gives a single voice to climate
advice.
The UK’s experience underscores how the advice that is integrated into decision-making can help
achieve lasting emission reductions that are sustained by broad consensus, although it has not yet
included subnational government levels. Emission reduction in the UK is greater than in other large
OECD economies, and emissions have fallen considerably since the introduction of the UK Climate
Change Act in 2008 (Figure 4.1). Emissions in electricity generation fell by 58% since 2012, as the
share of coal in electricity generation dropped from around 40% to less than 8% in 2017 without
negative impacts on supply or costs (Newbery, Reiner and Ritz, 2018[5]).
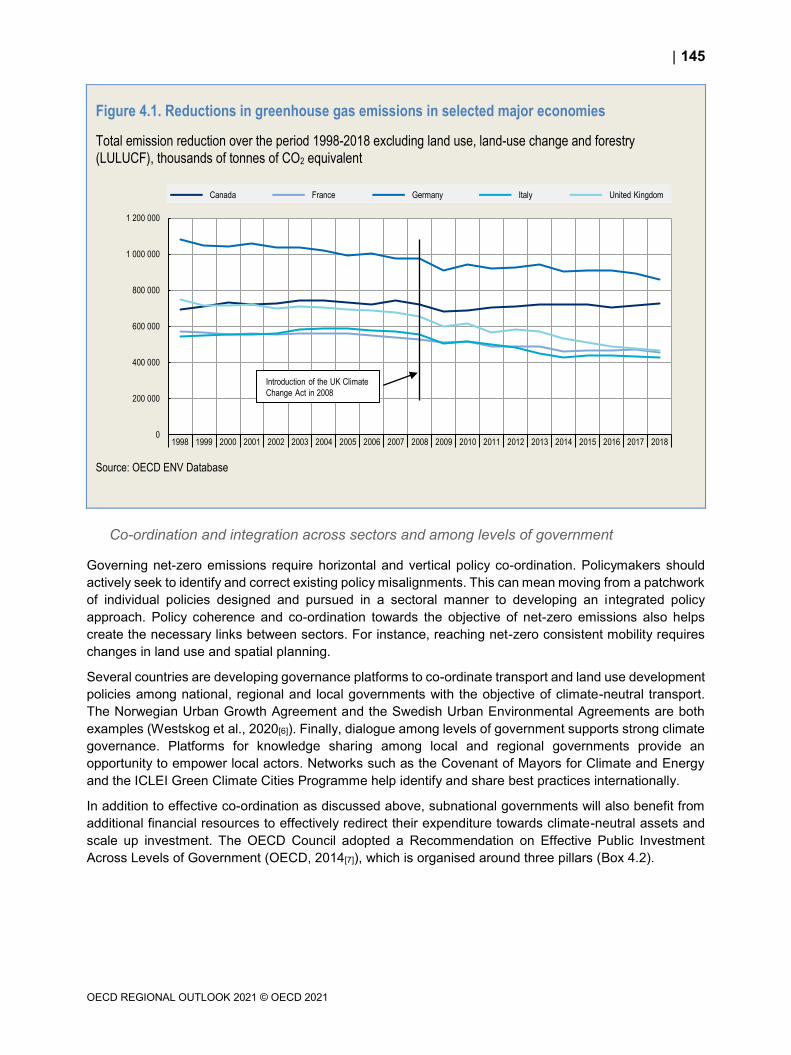
145
OECD REGIONAL OUTLOOK 2021 © OECD 2021
Figure 4.1. Reductions in greenhouse gas emissions in selected major economies
Total emission reduction over the period 1998-2018 excluding land use, land-use change and forestry
(LULUCF), thousands of tonnes of CO2 equivalent
Source: OECD ENV Database
Co-ordination and integration across sectors and among levels of government
Governing net-zero emissions require horizontal and vertical policy co-ordination. Policymakers should
actively seek to identify and correct existing policy misalignments. This can mean moving from a patchwork
of individual policies designed and pursued in a sectoral manner to developing an integrated policy
approach. Policy coherence and co-ordination towards the objective of net-zero emissions also helps
create the necessary links between sectors. For instance, reaching net-zero consistent mobility requires
changes in land use and spatial planning.
Several countries are developing governance platforms to co-ordinate transport and land use development
policies among national, regional and local governments with the objective of climate-neutral transport.
The Norwegian Urban Growth Agreement and the Swedish Urban Environmental Agreements are both
examples (Westskog et al., 2020[6]). Finally, dialogue among levels of government supports strong climate
governance. Platforms for knowledge sharing among local and regional governments provide an
opportunity to empower local actors. Networks such as the Covenant of Mayors for Climate and Energy
and the ICLEI Green Climate Cities Programme help identify and share best practices internationally.
In addition to effective co-ordination as discussed above, subnational governments will also benefit from
additional financial resources to effectively redirect their expenditure towards climate-neutral assets and
scale up investment. The OECD Council adopted a Recommendation on Effective Public Investment
Across Levels of Government (OECD, 2014[7]), which is organised around three pillars (Box 4.2).
0
200 000
400 000
600 000
800 000
1 000 000
1 200 000
1998 1999 2000 2001 2002 2003 2004 2005 2006 2007 2008 2009 2010 2011 2012 2013 2014 2015 2016 2017 2018
Canada France Germany Italy United Kingdom
Introduction of the UK Climate
Change Act in 2008
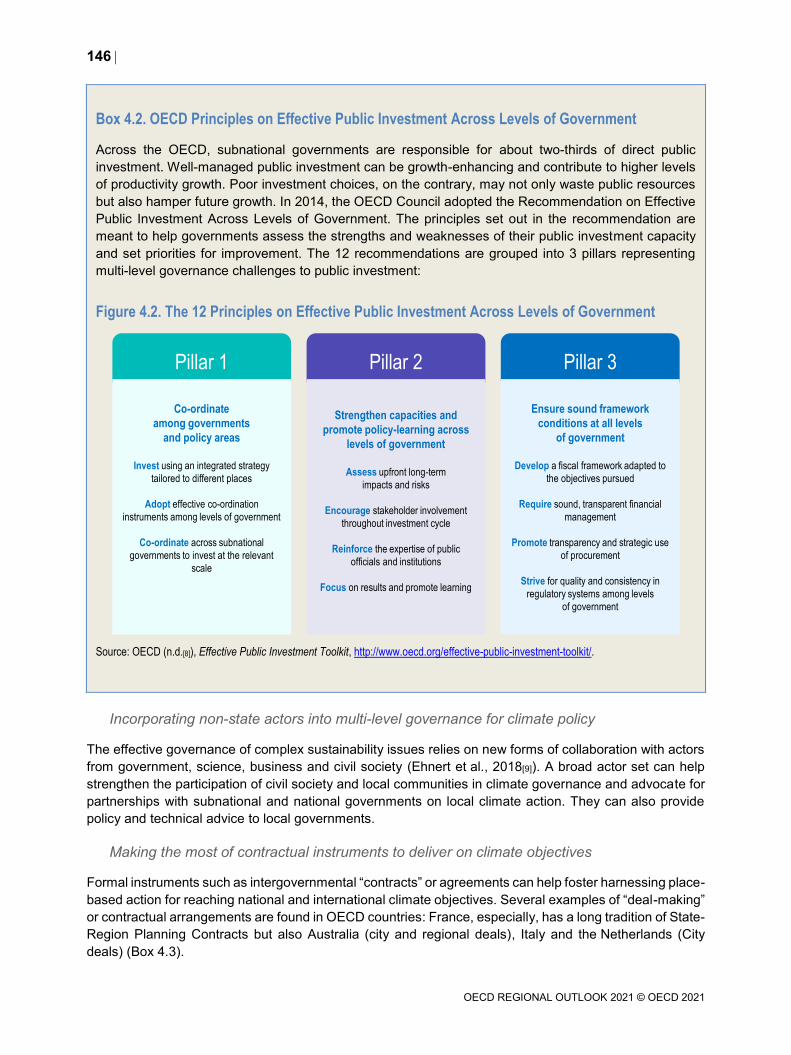
146
OECD REGIONAL OUTLOOK 2021 © OECD 2021
Box 4.2. OECD Principles on Effective Public Investment Across Levels of Government
Across the OECD, subnational governments are responsible for about two-thirds of direct public
investment. Well-managed public investment can be growth-enhancing and contribute to higher levels
of productivity growth. Poor investment choices, on the contrary, may not only waste public resources
but also hamper future growth. In 2014, the OECD Council adopted the Recommendation on Effective
Public Investment Across Levels of Government. The principles set out in the recommendation are
meant to help governments assess the strengths and weaknesses of their public investment capacity
and set priorities for improvement. The 12 recommendations are grouped into 3 pillars representing
multi-level governance challenges to public investment:
Figure 4.2. The 12 Principles on Effective Public Investment Across Levels of Government
Source: OECD (n.d.[8]), Effective Public Investment Toolkit, http://www.oecd.org/effective-public-investment-toolkit/.
Incorporating non-state actors into multi-level governance for climate policy
The effective governance of complex sustainability issues relies on new forms of collaboration with actors
from government, science, business and civil society (Ehnert et al., 2018[9]). A broad actor set can help
strengthen the participation of civil society and local communities in climate governance and advocate for
partnerships with subnational and national governments on local climate action. They can also provide
policy and technical advice to local governments.
Making the most of contractual instruments to deliver on climate objectives
Formal instruments such as intergovernmental “contracts” or agreements can help foster harnessing place-
based action for reaching national and international climate objectives. Several examples of “deal-making”
or contractual arrangements are found in OECD countries: France, especially, has a long tradition of State-
Region Planning Contracts but also Australia (city and regional deals), Italy and the Netherlands (City
deals) (Box 4.3).
Pillar 1 Pillar 2 Pillar 3
Co-ordinate
among governments
and policy areas
Invest using an integrated strategy
tailored to different places
Adopt effective co-ordination
instruments among levels of government
Co-ordinate across subnational
governments to invest at the relevant
scale
Strengthen capacities and
promote policy-learning across
levels of government
Assess upfront long-term
impacts and risks
Encourage stakeholder involvement
throughout investment cycle
Reinforce the expertise of public
officials and institutions
Focus on results and promote learning
Ensure sound framework
conditions at all levels
of government
Develop a fiscal framework adapted to
the objectives pursued
Require sound, transparent financial
management
Promote transparency and strategic use
of procurement
Strive for quality and consistency in
regulatory systems among levels
of government

147
OECD REGIONAL OUTLOOK 2021 © OECD 2021
Box 4.3. Making the most of multi-level governance tools to reach net-zero emissions by 2050
A number of countries have designed intergovernmental agreements linked to promoting and achieving
climate objectives.
In France, the State-Region Planning Contracts launched in 1984 have played a critical role in
shaping autonomous policymaking among regions. The 6th generation of contracts (2015-20)
includes transport, the environment and energy transition. The contracts provide regions with
8.5% of their budget. Co-funding varies across regions and according to the priorities.
In Italy, the Italian Pacts for the South (2016) support economic growth, employment and
environmental sustainability goals in the southern regions. They define priorities, actions for
implementation and responsibilities of parties.
In the Netherlands, the Climate Adaptation City Deal was signed in 2016 between the Ministry
of Infrastructure and the Environment, three regional water authorities, five cities (Dordrecht,
Gouda, Rotterdam, The Hague and Zwolle) and other partners (research centres and
companies). The aim is to create a learning environment for climate adaptation at the urban
level for the next four years.
Source: OECD (2018[10]), Rethinking Regional Development Policy-making, https://dx.doi.org/10.1787/9789264293014-en.
Financing instruments for the transition to net-zero emissions
Subnational governments are major spenders and investors in the transition to net-zero emissions and
particularly in the infrastructure that will be required to meet the ambitions of the Paris Agreement.
However, the COVID-19 pandemic is placing significant pressure on subnational government finance.
Shrinking revenues could lead the subnational government to restrict their expenditure to mandatory and
the most pressing areas, including staff costs, debt obligations, social benefits and services and support
to the most vulnerable population and businesses. This may come at the expense of environmental and
climate-related operating and capital expenditure. To preserve fiscal capacity for investment, all potential
internal and external financing sources need to be mobilised to cover green investment needs. Subnational
governments should make full use of their traditional budget instruments to reach the net-zero emission
target by 2050. There are different sources of subnational government revenue that could be designed to
foster and help finance the net-zero transition. These include grants and subsidies, as well as own-source
revenues such as subnational taxes, user charges and fees, and income from assets, which tend to be
under the direct control of subnational governments (although often constrained).
The following sections address the following four challenges:
1. How to make the most of grants and subsidies to deliver on climate objectives.
2. How to develop and optimise taxation, user charges and other revenues to support climate
objectives.
3. How to make use of external finance mechanisms and attract private investors for subnational
climate-related projects.
4. How to better align subnational government expenditure with net-zero emission objectives and
direct subnational spending and investment towards climate priorities.
148
OECD REGIONAL OUTLOOK 2021 © OECD 2021
Making the most of grants and subsidies to deliver on climate objectives
In OECD countries, grants and subsidies to subnational governments represent around 37% of their
revenue, around USD 3.5 trillion in 2018 (OECD, 2020[11]). Grants and subsidies may be unconditional
(block grants) or earmarked to finance subnational government responsibilities in a wide range of sectors
(education, social protection, health, environment, etc.), covering current or capital expenditure needs.
They may be allocated by international organisations (including the European Union), national
governments as well as state governments in federal countries. Through their grants and subsidies
policies, international organisations, national and state governments are already influencing subnational
spending and investment towards climate priorities. They can serve climate objectives in two ways:
Environmental and climate considerations should be integrated into national transfer policies to
subnational governments, including for general and earmarked grants, to provide incentives and
resources to contribute to the net-zero emissions target.
Specific earmarked grants and subsidies could be additionally introduced to finance targeted policy
instruments to reach the net-zero policy target.
Making the most of grants and subsidies to deliver on the objectives of the net-zero transition implies that
these grants and subsidies need to be designed to provide incentives for subnational governments to
deliver on the objective of the net-zero transition. There are several ways to do this. For example,
governments could review their entire intergovernmental grant system through a climate lens. As stressed
in the Chicago Proposal for Financing Sustainable Cities (OECD, 2012[12]), grants can be used to correct
incentives for unsustainable behaviour and reward subnational governments that create environmental
benefits through their policies. Climate objectives and indicators, as well as an assessment of climate
change impacts, should be more systematically integrated into intergovernmental transfers. The national
system of grants should also ensure cross-sectoral policy coherence (e.g. with the energy, agriculture,
transportation and land use planning sectors) with climate objectives. How to best design the incentives
for subnational governments to prioritise investments and expenditures that support the objective of the
net-zero transition will depend on the type of region. For some regions, the transition might require specific
objectives with regard to afforestation; for others the transition to renewable energy production and use or
sustainable transport provision might be most feasible. Incentives for subnational governments need to be
consistent with predictable provision to foster the net-zero transition, so local governments steer the
transition and send the right signals locally, especially for investment decisions that need to be taken now.
When conditionalities are attached to grants, they are primarily used to align national and subnational
spending priorities, to promote subnational spending in particular areas, to address fiduciary and
accountability concerns and to promote minimum public service standards (OECD, 2018[10]). This
mechanism, which can support environment- and climate-friendly practices and standards, may be further
promoted in the context of the green recovery plans.
The European Union (EU) has considerably extended the use of conditionalities in its cohesion policy in
the 2014-20 period. These include ex ante conditionalities (general and thematic), macroeconomic
conditionality and the link to country-specific recommendations (OECD, 2018[10]). Environmental
conditionalities are now an integral part of many policy areas.
Some countries have also introduced environmental conditionalities in the allocation of their grants and
subsidies for their infrastructure projects. In Canada for example, the Climate Lens programme is a
requirement for projects seeking funding through the Investing in Canada Infrastructure Program, Disaster
Mitigation and Adaptation Fund, and Smart Cities Challenge (see Box 4.4).
149
OECD REGIONAL OUTLOOK 2021 © OECD 2021
Box 4.4. The Climate Lens in Canada
The Climate Lens encourages consideration of climate impact and low-carbon options in the planning
of infrastructure projects. Launched in June 2018, the Climate Lens was updated in September 2019
to clarify requirements and add a reference to additional external resources, such as the Canadian
Centre for Climate Services. The Climate Lens has two components: the GHG mitigation assessment,
which measures the anticipated GHG emission impact of an infrastructure project, and the climate
change resilience assessment, which uses a risk management approach to anticipate, prevent and
adapt to any climate change-related disruptions or impacts related to an infrastructure project. In 2019,
70 projects funded under the Investing in Canada Infrastructure Program were required to complete
Climate Lens GHG mitigation assessments and 65 were required to complete climate change resilience
assessments.
Source: Government of Canada (2020[13]).
The use of conditionalities is not without controversy. Some evidence suggests that the use of
conditionalities has not always been effective in improving economic policies in recipient countries. There
are different inefficiencies associated with the uptake of conditionalities (OECD, 2018[10]). Some particular
issues are crucial for the effectiveness of conditionalities, which should be taken into consideration when
designing and implementing a grant system using conditions (see Box 4.5).
Box 4.5. How to best use conditionalities?
Designers of conditionality-driven agreements need to have a clear understanding of the trade-offs and
consequences of their design. This needs to take into account objectives, choice of instruments, degree
of administrative burden and capacity of all parties to implement the agreement and realise the desired
objectives. The lack of adequate capacities and skills may partially explain why conditionalities have
not necessarily reached the expected outcomes. There is also a need to ensure ownership and
legitimacy by establishing mutual accountability, especially to ensure that the application of
conditionalities to different recipients is fair, consistent or even relevant. There is thus increasing
pressure for transparency and accountability as well as programme evaluation and monitoring. The
system should also be kept simple. An excessive amount of legislation and guidance or the proliferation
of multiple conditions coupled with weak capacities may lead to inefficient or low use of funds by
subnational governments. Simplicity also comes with the need for greater flexibility to adapt
programmes to specific local circumstances and development needs.
Linking conditionalities to outcomes is ideal but is very difficult to put in practice. For example, the United
States (US) applied this mechanism in environmental grant programmes and performance partnerships
where outcome measures for pollution levels were negotiated with individual states. The government
faced significant difficulties in negotiating the exact outcome(s) on which to link the conditionality
because the states did not feel they had enough control over all of the contributing factors. Outcomes
are often uncontrollable. The challenge is designing indicators that are objective, measurable, timely,
meaningful, comprehensible, well documented and widely disseminated. For performance-based
management to support greater accountability in the application and uptake of conditionalities, all
parties must subscribe to human resource management frameworks that espouse results-based
management and evaluation. In addition, having independent evaluation is important, i.e. undertaken
150
OECD REGIONAL OUTLOOK 2021 © OECD 2021
by outside actors, as the incentive structures in donor institutions do not often support truly objective
and independent evaluation.
Source: OECD (2018[10]), Rethinking Regional Development Policy-making, https://dx.doi.org/10.1787/9789264293014-en; Berkowitz, P.,
Á. Rubianes and J. Pieńkowski (2017[14]), “The European Union’s experiences with policy conditionalities”, Background paper prepared for
the Seminar “Conditionalities for More Effective Public Investment” held 28 April 2017 at the OECD Headquarters, Paris.
Establishing and developing specific climate funds targeted at subnational governments
The international community and national/state governments could further develop specific or matching
grants to support climate-related projects developed by regions and municipalities. The international
community (multilateral banks such as the World Bank, as well as bilateral banks, the United Nations
Development Programme [UNDP], the Global Environment Facility, etc.) has established a series of funds
providing support from developed countries to developing countries. These funds are earmarked for
environmental protection and climate action. While a large part of these funds provides loans, in 2018
around 20% were allocated as grants (OECD, 2020[15]). While subnational governments can benefit from
these multilateral funds, in reality, there is limited access for regional and local governments. Few donors
are permitted to work directly with subnational governments and most resources are channelled through
international implementing entities and the national governments of recipient countries. Even when
subnational governments are accredited as intermediaries, they often face capacity challenges.
Subnational governments willing to benefit from these funds will have to negotiate access with their national
government and ensure compatibility with bilateral agreements negotiated between the fund and the
government (OECD, 2019[1]; Colenbrander, Lindfield and Lufkin, 2018[16]).
At the European level, in the context of the Green Deal and the post-COVID-19 recovery measures, there
is a new impetus for climate action at the national and subnational levels. The European Green Deal,
adopted by the European Commission (EC) in December 2019, aims to make the EU climate-neutral by
2050.
Some national and state governments have also established dedicated funds to finance subnational
government projects (Canada, Germany, the state of Jalisco, Mexico, the state of California in the US,
etc.) but much more could be done to really foster climate priorities at the subnational level (see Box 4.6).
Box 4.6. Multilateral, European and national/state climate funds
Multilateral climate funds
Multilateral climate funds play an important role in supporting developing countries to adopt low-
emission, climate-resilient development trajectories through loans, guarantees, grants et equity
investment. They also have a role in capacity building, research, piloting and demonstrating new
approaches and technologies, and removing barriers to other climate finance flows (Climate Funds
Update, 2020[17]). Among the most important in terms of the pledge are the Green Climate Fund (GCF),
the Clean Technology Fund (CTF), the Amazon Fund, the Least Developed Countries Fund (LDCF)
and the Global Climate Change Alliance (GCCA), the Pilot Program for Climate Resilience (PPCR) and
the Adaptation Fund (Climate Funds Update, 2020[17]). There are several estimates concerning the
global amount mobilised by multilateral climate funds, depending on the source. A recent OECD
estimate from 2020 puts the public and private climate finance flows provided by developed countries
to developing countries in the context of the United Nations (UN) Framework Convention on Climate
Change (UNFCCC) at USD 78.9 billion in 2018. In 2018, 21% of all climate finance was for adaptation,
70% for mitigation and 9% were cross-cutting. Over 2016-18, Asia benefitted from the largest share

151
OECD REGIONAL OUTLOOK 2021 © OECD 2021
(43%) of total climate finance, followed by Africa (25%) and the Americas (17%) (OECD, 2020[15]). The
GCF and the Adaptation Fund have introduced a number of relatively new institutional features with the
aim of channelling a larger share of climate finance to the local level. However, local government
participation remains low (Colenbrander, Lindfield and Lufkin, 2018[16]).
EU cohesion funds, the Green Deal and EU funds for climate action:
o EU cohesion policy provides a key source of financing that member states have employed
for environmental investments, in particular through the European Regional Development
Fund (ERDF) and the Cohesion Fund (CF), which primarily finance infrastructure and
physical investments. Going forward, a large part of the funding provided in 2021-27 will
have to contribute to achieving the Green Deal objectives. In addition to cohesion policy,
the EU plans to finance the policies set out in the Green Deal through an investment plan,
InvestEU, which forecasts at least EUR 1 trillion in investment, and the Just Transition Fund,
which provides EUR 40 billion to support economic diversification and reconversion in
regions and sectors that are most vulnerable to the transition towards the green economy.
National and state climate funds supporting subnational climate-related projects:
o In Canada, in 2019, the federal government announced CAD 1.01 billion in endowment
funding for the Federation of Canadian Municipalities’ Green Municipal Fund, for
3 programmes: Sustainable Affordable Housing Innovation, Community EcoEfficiency
Acceleration, and Low Carbon Cities Canada (LC3). These programmes support local
actions to improve the energy efficiency of homes and community buildings and reduce
GHG emissions. In summer 2019, seven LC3 Urban Climate Centres were announced in
Canada’s seven largest urban environments: Calgary, Edmonton, Halifax, Hamilton,
Montreal, Ottawa, Toronto and Vancouver (Environment and Climate Change Canada,
2020[18])
o In Germany, the National Climate Initiative (NCI) is the main instrument to support
subnational green finance across a range of sectors, such as transport, energy and
sanitation services. However, the capacity of the fund is likely insufficient. In the 2008-19
period, the NCI invested EUR 1.07 billion in over 32 450 projects domestically, which
leveraged a total of EUR 3.5 billion in investment.
o In Mexico, the state of Jalisco has created a framework to provide funds to municipalities
as well as to associations of municipalities to implement climate protection projects. In
addition, an environmental fund opens up further financing opportunities for climate change
projects by municipalities. Funds are allocated via calls for proposals, where councils may
apply based on their climate action plans (OECD, 2020[19]). Since 2015, the state of Jalisco
adopted its Law for Action on Climate Change (LACC) that requests all municipalities to
have a Municipal Climate Change Programme (Programa Municipal de Cambio Climático,
PMCC).
Developing and optimising tax revenues, user charges/fees and other revenues to support
climate objectives
Developing and optimising subnational government tax revenue instruments
In 2018, tax revenues (shared and own-source taxes) accounted for a large share of subnational
government revenues on average in OECD countries (44%). However, as the share of tax in subnational
revenues varies greatly from one country to another – from 3% in Estonia to 79% in Iceland – the potential
of subnational tax systems to foster environmental and climate priorities also varies greatly across
countries.
152
OECD REGIONAL OUTLOOK 2021 © OECD 2021
There are different ways to green subnational tax systems, including eliminating the anti-green bias of
existing subnational taxes, using local taxes to foster green practices and developing subnational
environmental taxes. This could also imply providing subnational governments with more taxing powers.
National and subnational governments should screen and audit their subnational tax systems to identify
taxes, tax provisions and tax incentives that could favour non-environmentally friendly green and climate
practices. A classic example is property tax on land and buildings. Depending on how they are designed,
property taxes can encourage urban sprawl or by contrast, favour the development of urban cores and
transport linkages. Reforming property taxation may therefore be a valuable tool to achieve more
sustainable urban development patterns. For example, split rate property taxes, whereby higher tax rates
are set on the value of land than on the value of buildings and other improvements, can promote denser
development and give rise to more compact cities. Lower tax rates on the value of buildings and other
improvements can encourage owners to build more intensively or renovate their properties to increase
their value (OECD, 2018[20]). Tax incentives for the development of land on the outskirts of cities can be
also eliminated to prevent the conversion of farmland and forests into urban land (OECD, 2018[20]).
Taxes that specifically target regional environmental impacts could be further developed at the subnational
level. Many of them would also contribute to GHG emission reduction or climate adaptation. Environmental
taxes include tax transport (cars sales/registration taxes, annual vehicle circulation taxes), pollution
(including waste taxes and taxes on the use of pesticides and/or fertilisers) and taxes on water abstraction
and resources extraction. Environmental taxes, which are already well developed at the subnational level
in several OECD countries, offer a potential source of expanded revenue for subnational governments.
Waste taxes, for example, can encourage emission reduction by encouraging circular economy practices,
helping to reduce high demand-based emissions in high-income cities for example. Cost-reflective water
chargers will be important in the context of climate adaptation, as many regions will face rising draught risk
as well as increasing water demand in agriculture.
Subnational governments’ powers of taxation are limited, however. Reforming tax systems at a subnational
level mostly depends on the decision of central or federal governments. While subnational governments
have taxing power on their own-source tax system (ability to modify rates and bases), tax provisions are
framed by national regulations and subnational tax power on rates and bases may be constrained and
limited. National governments could allocate the full benefit (or a share) of certain national environmental
taxes to subnational governments and also provide them with more flexibility and taxing power to
implement a regional or local climate-friendly tax policy. This can be done through rates and bases but
also by creating local ecotaxes. Some of these tax arrangements are linked to land value capture and
further developed below.
Enhancing the potential of user charges and fees for climate objectives
User charges and fees can raise revenue that supports the transition. These include congestion charges,
parking fees, high occupancy toll lanes, water and wastewater user fees, urban tolls or utility fees (water,
waste and energy) (Merk et al., 2012[21]). Road user charges will need to replace fossil fuel taxes when
fossil fuel vehicles are phased out, both to replace revenue streams from fossil fuel taxes as well as price
negative externalities related to vehicle use such as congestion, accidents and noise. Moreover, road use
charges that are time- and place-contingent can price externalities more efficiently, especially in urban
areas, where external costs are much higher than typical fuel tax rates today (OECD/ITF, 2019[22]).
However, road use charges in urban areas need to be embedded in an overall urban transport strategy as
argued in the urban policy section below.
In London, Milan, Singapore and Stockholm, congestion charges have resulted in reduced carbon
emissions. In the case of Milan and Singapore, this drop has been linked to the level of pollution
emitted from vehicles (OECD, 2019[1]). Oslo, Norway, has become one of the world’s electric vehicle
(EV) capitals. It has developed a series of proactive measures that encourage the development of

153
OECD REGIONAL OUTLOOK 2021 © OECD 2021
EVs that include road tolls and municipal parking fees that only apply to fossil fuel vehicles (since the late
1990s). In the waste sector, Seoul, Korea, has developed and continuously improved a pay-as-you-throw
system since the 1990s. General waste is charged on a volume-based fee (VBF) system for households,
businesses and office buildings instead of a disposal bill based on building areas or property taxes.
However, there are several limitations attached to the development of user charges and fees, including
the legal ability of subnational governments to create and determine the level of such fees, in particular in
areas considered as essential (e.g. energy sector), the capacity and willingness to pay of users and
capacity management (OECD, 2019[1]).
Developing property income and land-based financing instruments
Local authorities can reclaim gains from investments or changes in land regulations, thereby generating
revenue that can be used to close some of the funding gaps of the transition. This also includes funding
infrastructure through land value capture, enabling communities to recover and reinvest land value
increases resulting from public investment and other government actions (Lincoln Institute, 2018[23]). For
example, local governments in Japan use land readjustment, a form of joint development, to finance
infrastructure improvements. While these have not specifically funded green investments, many have
funded passenger rail development, thereby reducing travel-related emissions compared to car travel.
Land value capture instruments are useful in the context of zero-carbon transitions because they require
substantial investment, for example in public transport, which raises real estate prices. Land value capture
instruments can therefore serve to fund investment as well as limit rents from higher real estate prices.
Emissions trading systems (ETS)
Cap and trade is a policy mechanism to reduce GHG emissions. High polluting industries are required to
pay when they exceed predetermined emission amounts. In order to emit over the prescribed amount,
companies are forced to purchase emission allowances. While many ETS operate at the national level,
some subnational governments operate their own (OECD, 2019[1]). For example, in the US, the Regional
Greenhouse Gas Initiative (RGGI), launched in 2012 as a co-operative effort among several US states (as
of today 11 states: Connecticut, Delaware, Maine, Maryland, Massachusetts, New Hampshire,
New Jersey, New York, Rhode Island, Vermont and Virginia), was the first mandatory market-based
programme to reduce GHG emissions from the power sector. Another example is the California Cap-and-
Trade Program, which is the main source of funding for the state of California’s climate investments. At the
city level, as part of a local law that sets emission intensity limits for most large buildings starting in 2024,
the New York City government is required to study the feasibility of a citywide ETS for the buildings sector
and release its findings by 2021 (World Bank, 2020[24]).
Globally, there are now 61 carbon pricing initiatives in place or scheduled for implementation, consisting
of 31 ETS and 30 carbon taxes, covering 12 gigatons of carbon dioxide equivalent (GtCO2e) or about 22%
of global GHG emissions (versus 20% in 2019). These initiatives cover 46 national and 32 subnational
jurisdictions, the latter being mainly in North America (see Canada and the US above). Governments raised
more than USD 45 billion from carbon pricing in 2019. Almost half of the revenues were dedicated to
environmental or broader development projects and more than 40% went to the general budget (World
Bank, 2020[24]).
Despite the increase of carbon prices in many jurisdictions, they remain substantially lower than necessary
to be consistent with the Paris Agreement (World Bank, 2020[24]). In addition, carbon pricing comes with
social limitations that need to be addressed. Some jurisdictions have delayed measures to strengthen their
carbon pricing instruments and have extended compliance deadlines due to the restrictions (World Bank,
2020[24]). For efficiency adequate carbon pricing should be as uniform as possible, and therefore preferably
be set at international or at least national, rather than subnational, level.
154
OECD REGIONAL OUTLOOK 2021 © OECD 2021
Making use of external finance mechanisms and attracting private investors for subnational
climate-related projects
A number of potential instruments exist for mobilising external financing for the net-zero transition,
including debt financing, subnational public-private partnerships (PPPs) and equity funds.
Developing debt financing for green and climate-related projects
Debt financing is used to complement self-financing and capital transfers to finance investment projects.
This is especially true at the local level where borrowing is allowed only to finance capital expenditure.
However, some subnational governments may face difficulties in borrowing because of strict prudential
rules, among other constraints such as the lack of creditworthiness. Estimates suggest that around 20%
of the largest 500 cities in developing countries are deemed creditworthy in international markets (OECD,
2019[1]). It may be even more difficult to borrow on capital markets (bond financing). In a large number of
countries, subnational governments, or certain categories of subnational governments, are not allowed to
issue bonds on capital markets. This said, even in countries where subnational governments are allowed
to issue bonds, the practice is not widespread.
In Japan and North America, bond financing is widespread while loan financing is predominant in Europe,
except at the state government level in federal countries (such as Germany, Spain and Switzerland). In
Canada and the US, bonds represent more than 90% of the subnational government debt stock
(OECD/UCLG, 2019[25]).
Borrowing frameworks could be adapted to allow borrowing for subnational government investments,
especially if investments support the net-zero transition. National governments could also facilitate local
government access to capital markets. National and/or regional governments could actively assist local
governments by providing technical assistance for project appraisal and implementation, and assist local
governments to explore joint borrowing across jurisdictions. They also help by setting up specialised
agencies to pool local debt, thereby facilitating access to lower-cost capital finance for infrastructure
investment such as in Nordic countries. In Sweden for example, the local government funding agency
Kommuninvest makes use of the high creditworthiness of Swedish municipalities to help them raise capital
through the issuance of bonds, which it places in Europe, Japan and other countries (OECD, 2020[26]).
Some promising debt instruments to mobilise private finance could be further promoted, in particular green
and climate bonds. Targeted at financing environment-related investments, green and climate bonds must
meet the eligibility criteria determined by the Green Bond Principles (GBP) or the Green Loan Principles
(GLP). Despite rapid growth (USD 754 billion of cumulative issuance since inception in 2007, including
USD 259 billion issued in 2019), green bonds still account for a small share of the global bond market.
Subnational governments are increasingly active in the green bond market (USD 11.6 billion issues in 2019
by local governments vs. USD 3.7 billion in 2014) but there is significant room for scale-up. The share of
subnational government accounted for only 4.4% of green bond issuance in 2019. In some countries
(e.g. France, Japan, Sweden and the US), subnational governments are becoming significant issuers of
green bonds or climate bonds, yet there is still significant scope for improved use of these instruments.
Scaling up the use of green bonds is especially difficult in countries where subnational governments are
restricted from borrowing on capital markets. In addition, to establish an enabling environment for allowing
and facilitating the subnational governments’ access to capital markets, governments could also develop
guidelines, standards, reporting and certification practices to create the foundation for a green bond
market. They could also provide technical assistance to develop bankable green projects and support for
capacity building at the local level. Another way to support the development of a local green bond market
is credit enhancement from governments/multilateral institutions, possible provision of tax incentives for
an initial period to foster market development and the development of green banks and green funds
(Climate Bonds Initiative, 2015[27]).
155
OECD REGIONAL OUTLOOK 2021 © OECD 2021
Mobilising public-private partnerships (PPPs) to foster climate objectives
PPPs may also be an interesting mechanism to support green growth projects at the subnational level.
PPPs are a long-term contract between a private party and a government entity for providing a public asset
or service, with some of the risk and management responsibility shifted to the private party. Although the
average value of PPPs is generally higher at the national level, the number of PPPs may be greatest at
the subnational level in some countries. For example, in Germany, subnational PPPs constitute
approximately 80% of PPP investment. Green PPPs may offer added value. For example, in Slovenia, the
city of Ljubljana developed two PPPs through energy performance contracting (PPP EPC). These are
recognised as the most successful PPP EPC in the country and in the EU, and have been replicated by
other Slovenian cities. These projects are based on the principle of EPC within which the majority of
building stock (schools, cultural centres, sports and healthcare facilities, etc.), owned by the city is being
deeply energy retrofitted and, where possible, renewable energy sources are being introduced.
Consequently, their GHG emissions are being reduced. For the first project (EOL1), the 25 deeply
retrofitted buildings received 51% of their funding from private partners, 40% from cohesion policy funds
and 9% from the city (OECD, 2020[19]).
Subnational PPPs are however not without risks. Challenges emerge in areas such as financing and
funding. Private borrowing costs might be higher than public ones, for example, raising the costs of the
PPP project overall. PPPs require intergovernmental regulatory coherence, cross-jurisdictional
co-ordination, economies of scale and asymmetric information between the contracting parties, which may
put local governments at a disadvantage. It also requires management capacity in subnational
governments (OECD, 2019[1]).
Attracting private sector financing through equity funds
Private institutional investors, such as pension funds and insurance companies, have some USD 70 trillion
in assets under management in OECD countries and could invest more in climate-neutral projects. Such
actors are currently investing very little in climate-related projects at the subnational level. Yet, there are
at least two barriers to overcome. These relate to inadequate international and national legal frameworks
for private long-term investments and public-private co-investments rules, as well as the size of urban
projects, which increases the cost for private investors. Successful experiences of mobilising institutional
investor capital for climate-friendly investment projects do exist. In particular, investment can take place
through specialised infrastructure equity funds, which may also involve other private investors, such as
urban developers (OECD, 2019[1]).
Aligning subnational government expenditure with net-zero-emission objectives and direct
subnational spending and investment towards climate priorities
Subnational governments can set climate targets and incorporate them into their spending policies and
budget priorities. Greening expenditure applies to both current and capital expenditure. It is important to
recall that, on average in the OECD, investment expenditure represents around 13% of subnational
expenditure while current expenditure represents the remaining part. Therefore, a comprehensive review
of the budget should be conducted for both current and capital expenditure (OECD, 2020[11]).
Several tools can be mobilised to direct spending and investment towards environmental and climate
objectives. They include: i) providing climate-related financial support to firms and households;
ii) integrating environmental benefits in costs analysis; iii) developing the use of green public procurement;
and iv) developing subnational green budgeting.
156
OECD REGIONAL OUTLOOK 2021 © OECD 2021
Providing climate-related financial support to firms and households through dedicated
regional and local climate funds
At a regional level, several states, provinces and regional governments operate their own dedicated green
and climate funds. At the local level, some cities have also used their power to establish climate funds to
finance sustainable and climate-friendly projects within their city. These funds are derived from different
sources, including the proceeds from the sale of emission allowance and support projects in many areas:
energy efficiency, renewable energy, affordable housing, public transportation, increased mobility options
through transit, walking and biking, zero-emission vehicles, environmental restoration, water savings, more
sustainable agriculture, recycling, etc. Support is provided in different ways, including direct investment in
projects, subsidies, loans, credit enhancement solutions, guarantees, equity, etc. Creating such funds has
three main advantages for subnational governments, in addition to supporting climate objectives. The first
is giving a clear signal to citizens, businesses and investors regarding the region or city’s ongoing
commitment to support projects that reduce emissions and increase resilience. Second, they can help de-
risk finance from more conventional sources. Finally, by acting as a guarantor or an underwriter, climate
funds can entice more private sector actors or other commercial lenders to invest in cities’ projects and
allow the region or the city to invest and have a stake in their own projects (C40 Cities, 2016[28]).
Box 4.7. Regional and local climate funds targeted at firms and households
Many regions and cities, using different sources of revenues, have established climate funds directed
to businesses, households and non-governmental organisations (NGOs) to support green and climate-
related projects.
In California, the Greenhouse Gas Reduction Fund (GGRF) is funded by the proceeds from
the Cap-and-Trade Program (see above). The fund support programmes and projects that
reduce GHG emissions in the state in application of the California Global Warming Solutions
Act of 2006. As of 2020, more than USD 11 billion have been appropriated by the legislature to
state agencies implementing GHG emission reduction programmes and projects. As of
March 2020, cumulatively, USD 5.3 billion in projects have been implemented across the state,
with 57% of those investments benefitting California’s priority populations, with more than
428 000 individual projects implemented (OECD, 2020[29]).
In France, the city of Paris launched in 2018 the Paris Green Fund (Paris Fonds Vert) to support
private innovation and small- and medium-sized enterprises (SMEs) in support of the ecological
transition of Paris. The city of Paris allocated EUR 15 million into the fund initially, with a first
target to reach EUR 200 million thanks to the involvement of private investors. The fund has
three main functions: first, to serve as a growth equity fund aiming at financing companies that
are already in a growth phase and/or at a more mature stage in their development; second, to
serve as a green fund to invest in several sectors transport, energy, energy efficiency, waste
management, buildings and digital innovation; and third, to serve as a territorial fund. All
activities funded through the Paris Green Fund must demonstrate a positive impact on the
ecological transition of the city of Paris. The territorial impact of the fund will be evaluated by an
external body according to six main metrics: carbon impact (induced and avoided emissions);
energy impact; impact on air quality; overall economic impact and just transition; resilience to
the consequences of climate change; recycling and waste reduction (OECD, 2019[1]).
157
OECD REGIONAL OUTLOOK 2021 © OECD 2021
In the Netherlands, the Amsterdam Climate Fund, established by the city in 2019, is intended
to encourage residents, businesses and institutions to take significant measures to reduce
carbon emissions, including disconnecting buildings from natural gas. In the case that projects
do not pay for themselves (inevitable losses), initiators can apply for a contribution from the fund
(City of Amsterdam, 2020[30]).
Developing green public procurement
Public procurement needs to be consistent with the net-zero emission transition. On average in the OECD,
public procurement represents 12% of GDP and 29% of government expenditure; subnational
government’s procurement represents more than half of this expenditure. In addition to greening public
consumption and investment policies, green public procurement (GPP) can provide industry with incentives
for developing environment-friendly products and services, particularly in markets where public purchasers
represent a large share, such as construction or public transport. GPP covers: i) gross fixed capital
formation; and ii) intermediate consumption, such as energy-efficiency light bulbs, recycled paper, etc.
(OECD, 2015[31]; 2019[32]).
GPP is most effective when integrated into broad subnational emission-reduction strategies with concrete
net-zero benchmarks. These benchmarks provide the framework for public procurement. In the
pre-procurement phase, subnational governments that engage in preliminary market consultation improve
their understanding of existing technologies. During the procurement process, subnational governments
can formulate minimum and binding requirements for the tender. Environmental certification (e.g. EU
Ecolabel, Energy Star, etc.) and other performance specifications are useful and can be defined in multi-
level governance arrangements. Additionally, ESG criteria should be defined and implemented in public
procurement as in private finance. For example, the EU Taxonomy defines economic activities that
contribute towards climate neutrality by 2050 and argues for more consistent reporting (EC, 2021[33]).
Another example is the Glasgow Financial Alliance for Net Zero which brings together large firms across
the financial sector to co-ordinate short-term targets towards net-zero emissions by 2050 (UNCC, 2021[34]).
Continuous monitoring and evaluation are key. This should be integrated into policy and regulation (EC,
2014[35]; OECD, 2015[31]). For instance, the Italian city of Rome has integrated a monitoring system into its
green procurement tool (see Box 4.8).
Box 4.8. Green public procurement in Cities
In 2006, Denmark’s Ministry of the Environment and Food, together with the three largest cities
(Aarhus, Copenhagen and Odense) established the Danish Partnership for Green Public
Procurement. Since then, this initiative has expanded to 12 municipalities, 2 regions and 1 water
supply company, representing 13% of Denmark’s annual public procurement in Denmark
(approximately EUR 5.5 billion) and 30% of the total procurement volume of Danish local
governments. The partnership aims to develop joint, mandatory procurement objectives and
criteria that have major positive impacts on the environment, ensuring a certain level of
co-ordination in GPP actions from the largest public sector procurers. These criteria can also
function as a guide for municipalities where incorporating environmental requirements in the
procurement process is less developed. Furthermore, the partnership also establishes working
groups that share knowledge between the cities to solve joint procurement challenges and
develop specific criteria within different product areas. Relevant materials are available on an
online platform for easy peer learning. In addition, by sharing consistent sets of green criteria,
the partnership makes it easier for the market to respond to sustainability demands from public
purchases. Finally, the national government has developed a webpage, the Responsible

158
OECD REGIONAL OUTLOOK 2021 © OECD 2021
Procurer, where procurers can find green criteria, based on EU GPP criteria and other national
recommendations, ready to copy and paste into tender documents for a number of product
areas and Total Cost of Ownership tools for selected product areas.
In Frankfurt, Germany, new buildings must meet strict energy use standards. Several
environmentally harmful materials are forbidden. Based on tenders, subnational governments
analyse and evaluate the life cycle environmental impact and costing of the product.
In 2009, the Italian Metropolitan City of Rome developed its first action plan for GPP with a
manual monitoring system. The city reduced CO2 emissions by 749 tonnes between 2011 and
2014. However, many procurement forms were incomplete or inaccurate. To improve data
collection and reporting, in 2014, the city integrated GPP monitoring into its accounting system
and, in 2016, launched a digital version. The new monitoring helps municipal staff to verify the
completeness and quality of GPP tenders. The city has also set up a telephone help desk, an
updated online library of laws and regulations regarding GPP, a support guide and training for
staff across departments.
Source: Ministry of Environment and Food of Denmark (2020[36]), Sustainable Procurement, https://eng.mst.dk/sustainability/sustainable-
consumption-and-production/sustainable-procurement/; City of Frankfurt (2014[37]), European Green Capital Award, https://www.frankfurt-
greencity.de/de/vernetzt/auszeichnungen/european-green-capital-award/; EC (2016[38]), “Strategy and approach to SPP in the municipality
of Copenhagen”, https://ec.europa.eu/environment/gpp/pdf/news_alert/Issue64_Case_Study_130_Copenhagen.pdf; C40 Cities (2019[39]),
“Cities leading the way: Seven climate action plans to deliver on the Paris Agreement”.
Developing subnational green budgeting to align revenue and expenditure with zero
emissions
Green budgeting can support subnational governments to better align their expenditures and revenues
with climate objectives. It requires a systematic examination of existing and potential budget measures
and policies, their interdependencies, externalities and joint benefits, and mainstreaming an
environmentally informed approach to the national and subnational budgetary frameworks. It provides
decision-makers with a clearer understanding of the environmental impacts of budgeting choices. Green
budgeting can help regions and cities to identify spending that is inconsistent with the net-zero-emission
transition and helps prioritise net-zero-consistent spending. This type of budgeting is still rare. Budgetary
practices tend not to fulfil their potential to make revenues and spending consistent with national or regional
climate objectives (OECD, 2020[40]; forthcoming[41]).
Four types of green budgeting exist and can be applied by subnational governments. First, monetary
budgeting can be related to carbon budgeting. Carbon budgets identify the target carbon emissions. Based
on their carbon budgets, subnational governments can develop short-term and long-term targets towards
net-zero emissions (see section on subnational governments need to be integrated into climate policy
governance). Second, environmental budgeting and reporting enable governments to track the emission
impact associated with each budget line item, to align budget priorities with the carbon budget. Third, green
accounting expresses environmental externalities in monetary terms, i.e. by attributing a price to carbon.
It can also price other environmental impacts such as biodiversity, clean air, etc. Fourth, “common good”
balance sheets aim at gathering the scores for performance indicators related to the environment but also
to social justice, human dignity, solidarity and democratic governance. This adds complexity but provides
a valuable opportunity to identify the multiple non-climate benefits climate action can bring and which often
arise locally (EnergyCities, 2019[42]; OECD, 2020[43]).

159
OECD REGIONAL OUTLOOK 2021 © OECD 2021
Urban policies are central to climate change mitigation and regional development
Cities are hubs for high-productivity activity in close integration with surrounding low-density areas. On the
path towards 2050, when many countries aim at reaching net-zero GHG emissions, cities will play a key
role. More than half of the world population lives in metropolitan areas. They account for 70% of GDP and
about two-thirds of energy demand. This will require different and more investment but could also lead to
many positive impacts in urban areas. These can include business opportunities, health benefits from lower
air and noise pollution, as well as productivity gains from lower air pollution, congestion and improved
accessibility (Box 4.9). Taking advantage of zero-emission innovations in energy, mobility and buildings,
cities can lower public service provision cost and provide healthier and more climate-resilient urban
environments. Moving ahead early will provide competitive gains for cities, as well-being gains make cities
more attractive to mobile workers and productivity gains attract knowledge-intensive business. Moreover,
moving early will save costs from avoiding transition-inconsistent investment.
In cities, CO2 emissions predominate. As highlighted in Chapter 3, reaching net-zero GHG emissions will
imply reaching net-negative CO2 emissions by 2050 and net-zero CO2 emissions several years earlier.
CO2 emissions should reach zero particularly quickly in the electricity sector, where technology is readily
available and cheap, to allow cost-efficient decarbonisation of energy end-use sectors, including
passenger and light road freight transport.
Metropolitan regions may account for more than 60% of production-based GHG emissions in OECD
countries. The contribution of metropolitan regions to emissions is particularly large in North America and
OECD Asia (Figure 4.3). In Japan and Korea, populations are particularly concentrated in metropolitan
areas. In North American metropolitan regions, per capita emissions are particularly high (Figure 4.4). Per
capita emissions are lowest in European and South American metropolitan regions, mostly on account of
transport. This highlights the importance of public transport in controlling emissions, with many European
cities doing better (Chapter 3). In Australian and East Asian countries, electricity generation and industry
also contribute substantially to emissions because of coal use. In these metropolitan regions, local
well-being gains from exiting coal are particularly likely to be large as air pollution would decline, saving a
substantial number of premature deaths. Across all continents, OECD large metropolitan regions have
lower per capita emissions than their smaller peers. Moving to net-zero emissions in an urban context
requires an integrated approach to urban land use, housing and transport and is one of three pillars of
climate action.
In some middle-income countries, the share of urban CO2 emissions is much higher than in OECD
countries. In China, India and Indonesia, urban centres contribute more than 40% to national CO2
emissions, compared to 20% in most OECD countries (Crippa et al., forthcoming[44]). Between 2015-50,
the world’s city populations are projected to grow from 48% in 2015 to 50%, mostly in middle-income
countries as reported in Cities in the World (OECD/EC, 2020[45]). Urbanisation in these countries is a key
driver of world energy demand and emissions growth, as workers migrate to cities with high or rising
emissions to take up jobs in more energy-intensive industries, adopt more energy-consuming lifestyles
and earn higher incomes. Zero-carbon-consistent urbanisation, with support from high-income countries,
is a key challenge but also an opportunity. For example, zero-emission-consistent transport infrastructure
can be developed at a lower cost than conventional infrastructure if integrated from the onset (OECD,
2017[46]). It also allows the decoupling of air pollution from economic production.
In high-income cities, consumption-based emissions are typically much higher than production and
location-based emissions, as they consume many goods produced elsewhere (Box 4.9). Consumption-
based emissions in cities may or may not be production-based in their country, depending on whether the
goods and services consumed in the city are imported. In any case, cities have options to reduce
consumption-based emissions such as reducing waste and encouraging the circular economy, some at
particularly low cost, as described below. Policies to lower consumption-based emissions also offer the
advantage that they do not result in displacement of production and emissions, especially if the emissions’

160
OECD REGIONAL OUTLOOK 2021 © OECD 2021
content of the consumed goods is easily established. Reducing consumption-based emissions can also
contribute to a more equitable sharing of the carbon burden.
Figure 4.3. Metropolitan regions contribute the most to greenhouse gas emissions in North America and OECD Asia
Contribution to total GHG emissions across continents, 2018
Note: OECD countries, Bulgaria and Romania. GHG emissions excluding emissions from land use and land use change.
Source: OECD calculations based on EC (2020[47]), EDGAR - Emissions Database for Global Atmospheric Research, Joint Research Centre,
European Commission.
Figure 4.4. Per capita emissions in metropolitan regions are particularly large in Australia, North America and OECD Asia
GHG emissions per capita, 2018
Note: OECD countries, Bulgaria and Romania. GHG emissions excluding emissions from land use and land use change.
Source: OECD calculations based on EC (2020[47]), EDGAR - Emissions Database for Global Atmospheric Research, Joint Research Centre,
European Commission.
0
10
20
30
40
50
60
70
80
Oceania Europe North America Central and South America OECD Asia
%
Agriculture Power sector Industry Residential Transport
0
2
4
6
8
10
12
14
16
18
Oceania Europe North America Central and South America OECD Asia
GHG emissions (in CO2 equivalent tons) per capita
Agriculture Power sector Industry Residential Transport

161
OECD REGIONAL OUTLOOK 2021 © OECD 2021
Box 4.9. Consumption-based greenhouse gas emissions in cities
Consumption-based emissions rise more strongly with city per capita income than production-based
emissions (Sudmant et al., 2018[48]), reinforcing the case for monitoring consumption-based emissions.
In Bristol, for example, the city’s consumption-based emissions are three times the production-based
emissions, largely due to the impacts of food and drink. In other UK cities, they may be twice as high
(Sudmant et al., 2018[48]). Cities in America and Europe produce consumption-based emissions thrice
that of production-based emissions. A study on 10 European cities projected consumption-based
emissions to increase by 35% by 2050. Across 79 C40 cities, consumption-based emissions were
higher by 60% on average compared to emissions generated locally from production-based emissions
(e.g. from economic production, transport or the heating of buildings) (C40 Cities, 2018[49]).
Taking into account consumption-based emissions provides additional opportunities for reducing
emissions and supporting a more circular economy, for example by reducing consumption of goods that
generate substantial emissions where they are produced. This can help accelerate the transition at a
lower cost. City action to transform consumption habits can reduce these emissions at low cost
(Millward-Hopkins et al., 2017[50]). In Bristol, investments of approximately GBP 3 billion in low-carbon
infrastructure, such as buildings, could reduce production-based emissions by 25% in 2035. Eliminating
the city’s current levels of food waste would reduce emissions by a similar amount but with little
investment or other costs (Millward-Hopkins et al., 2017[50]). Policies that can tackle consumption-based
emissions include product and procurement standards, city and infrastructure planning, and economic
measures to incentivise product longevity and a sharing economy.
The commitments to address climate change varies strongly across cities. Some cities have taken strong
leadership in GHG emission targets, aiming for net-zero emissions well before 2050. The city of Bristol,
UK, has adopted a net-zero emissions target for 2030, including consumption-based emissions. But across
327 European cities, for example, reduction targets for 2050 range from a mere 3% to 100%, giving an
average emission reduction of 47%, which acutely falls short of the EU target to reach net-zero GHG
emissions overall by 2050 (Salvia et al., 2021[51]). Most cities with over 500 000 inhabitants have
comprehensive standalone mitigation or adaptation plans. Where local climate change planning is required
by national governments (Denmark, France, the Slovak Republic and the United Kingdom), cities have
been nearly twice as likely to produce local mitigation plans (OECD, 2020[26]). Moreover, setting targets for
emissions is not enough. For example, cities that do not host power plants and where energy use in
buildings is electric may have low production-based emissions but will still need to contribute to energy
efficiency targets and renewables deployment to contribute to national targets.
Effective metropolitan governance is critical for integrating climate policy
A key message from the UN New Urban Agenda (OECD/UN-Habitat, 2018[52]) is that urban CO2 emissions
and air pollution are best addressed at the metropolitan level. Tackling climate change while achieving the
other Sustainable Development Goals (SDGs) requires urban governance, building competencies and
technical capacities to redirect and unlock investment for sustainable infrastructure.
Urban areas sometimes extend across regions and hundreds of municipalities. The socio-economic flows,
notably travel-to-work, exchanges and services provision, which need to be decarbonised, do not match
administrative boundaries. For example, in the metropolitan area of Mexico City, Valle de México,
two-thirds of GHG emissions and 80% of particulate matter pollution come from outside the administrative
borders of the city (OECD, 2015[53]) and more than 40% of residents commute across a municipal boundary
to get to work or school and access services (OECD, 2015[53]). In the Hamburg Metropolitan Region,
162
OECD REGIONAL OUTLOOK 2021 © OECD 2021
350 000 out of 760 000 commuters enter the city on a daily basis (OECD, 2019[54]). The region brings
together 20 districts and more than 1 100 municipalities from 4 federal states including the city of Hamburg
itself (OECD, 2019[54]).
Metropolitan areas, therefore, need to be governed with respect to the delimitations of travel-to-work areas.
Metropolitan governance for urban planning, transport and housing will allow the residents to benefit from
public transport and housing co-ordinated throughout commuting zones, while improving accessibility of
jobs and services, reducing air pollution and congestion as well as eliminating GHG emissions. The
benefits of such co-ordination are large. Metropolitan areas without their own governance tend to have
more emissions and air pollution as well as lower levels of productivity (OECD, 2015[55]). Metropolitan
governance also results in denser and more contiguous residential development, which helps reduce
emissions and higher satisfaction of residents with public transport. The experience of OECD countries
offers lessons for metropolitan governance reforms (OECD, 2015[56]). They are complex processes,
requiring political support, effective co-ordination and reliable funding (Box 4.10).
Box 4.10. Governance lessons from several metropolitan areas across the OECD
Motivate collaboration by identifying concrete metropolitan projects
Kick-starting initiatives around tangible projects can help rally forces. For example, in the Øresund
metropolitan region in eastern Denmark and southern Sweden, the opening of a bridge between
Copenhagen and Malmö in 2000 stimulated integration. Municipal and regional authorities form the
Øresund Committee, its main cross-border governance body. The bridge has opened job opportunities
for the benefit of both sides. In the Hamburg Metropolitan Region in Germany, improving environmental
sustainability and harnessing the potential of renewable energy production reinforced metropolitan
governance, as this requires co-operation among the different local-level actors in policy domains such
as housing and transport (OECD, 2019[54]).
Build metropolitan ownership among local stakeholders
Metropolitan governance reform needs strong advocates. For example, in 2015, the Dutch national
government undertook a series of institutional reforms that led to the creation of the metropolitan regions
of Amsterdam and Rotterdam-The Hague (OECD, 2016[57]). In the US, the metropolitan land use and
transport planning agency for the Chicago metropolitan area was the product of a two-year campaign
initiated by a regional non-profit organisation representing the business community (OECD, 2012[58]).
In the UK, the government gives metropolitan areas specific powers through the City Deals initiative.
Under City Deals, local governments decide what needs to be done locally and set targets in areas
such as jobs, affordable housing and emissions reduction. In Valle de México, the Environmental
Commission for the Megalopolis co-ordinates decision-making and provides a vision for air quality
improvement across local governments. It promotes an integrated approach for diagnostics, analysis
and actions (OECD, 2015[53]). Co-operation among municipalities works best on a voluntary basis with
incentives from the top but also with a strategy to engage those who feel threatened, sometimes by
giving compensation.
Tailor reliable sources of metropolitan financing
A key element for metropolitan areas is to secure an appropriate, reliable stream of funding to facilitate
collaboration. They generally face problems related to disparities in revenue-raising potential,
expenditure needs and investment capacity. Financial resources need to match the new governance
structure’s responsibilities. Property tax is the main source of income of metropolitan areas as it
provides stability to revenue. In Mexico, the national government contributes to the funding of
163
OECD REGIONAL OUTLOOK 2021 © OECD 2021
infrastructure projects in metropolitan areas to complement local resources. Metropolitan areas and the
municipalities in them apply together providing incentives to create metropolitan areas (OECD, 2015[53]).
Design incentives and compensation for metropolitan compromises
Effective metropolitan governance requires clear communication around the costs of maintaining
business as usual and the long-term gains of reforms. Co-operation among municipalities tends to work
best on a voluntary basis with incentives from the top, while also having a strategy for engaging those
who feel threatened by the reform and leveraging their buy-in. Examples of such incentives are
devolution and financial incentives. For instance, for the City Deals in the UK, the government gave a
range of new powers to cities that committed to strengthening collaborative governance in their area.
Implement a long-term process of monitoring and evaluation
Metropolitan governance requires continuous improvement through strong, reliable instruments for
monitoring and evaluation. In Toronto, Canada, for example, the city authorities set up mechanisms to
gather feedback from citizens and other stakeholders on metropolitan issues on a regular basis. One
such mechanisms is the Greater Toronto City Summit Alliance, which convenes members of the
three levels of government with business, labour, academic and non-profit sectors every four years to
drive collective action for example in transport, energy, socio-economic inclusion. In Perth, Australia,
an independent expert panel conducts a metropolitan review to examine the city’s social, economic and
environmental challenges and formulate reform proposals. Reforms may take the form of incremental
experimentation through the implementation of pilot projects. In Sweden, governance reforms aimed at
merging counties with a directly elected regional assembly and responsibility for regional development
were first tested in two pilot regions (Västra Götaland around Gothenburg and Skåne around Malmö)
with multi-annual evaluation before extending it to other counties.
Source: OECD (2015[56]), Governing the City, http://dx.doi.org/10.1787/9789264226500-en.
National urban policy frameworks are beginning to integrate climate policy
National urban policies (NUPs) can co-ordinate sectoral policies relevant for the net-zero-emission
transition in cities. A NUP is a government-led, coherent set of decisions to co-ordinate actors in order to
promote more productive, inclusive and resilient urban development consistent with environmental goals
(UN-Habitat, 2014[59]). A NUP must be accompanied by an effective institutional framework and
governance that allow for co-ordination and collaboration with urban stakeholders (OECD/UN-Habitat,
2018[52]). NUPs can cover a wide range of national policies with a profound effect on urban development.
They can help deliver climate change mitigation and adaptation responses and achieve cross-sectoral
synergies. Land use zoning, for instance, impacts sectors such as transport, housing, energy, natural
resources, water and waste. For example, national ministries have often pursued housing programmes
without subnational governments and without co-ordinating the housing programme with local transport
(OECD, 2015[60]; Rode et al., 2017[61]). This often results in low-cost urban periphery construction, more
car dependence, a higher carbon footprint and emissions from a land use change such as deforestation.
This ultimately results in higher costs from connecting housing to infrastructure, aggravated by congestion
(Moreno Monroy et al., 2020[62]) as recently illustrated in a case study of Ethiopia (OECD, forthcoming[63]).
The location of housing developments at urban peripheries can also result in high home vacancy rates, as
in Mexico (OECD, 2015[60]). National governments can improve local capacity to implement national
development plans, consistent with climate objectives, and establish a central body responsible for cross-
sectoral co-ordination of key policy areas, such as in Colombia’s interagency commission (Rode et al.,
2017[61]).

164
OECD REGIONAL OUTLOOK 2021 © OECD 2021
Among 65 countries that have participated in a survey of NUPs, including 22 OECD countries, most, but
not all, have integrated climate action. According to preliminary survey findings (OECD/UN-Habitat,
forthcoming[64]), 51 country NUPs addressed adaptation and mitigation, while 13 reported that their NUP
did not address climate change at all. Some countries have identified related co-benefits in their NUPs
(Figure 4.5). Half of the countries (26) identified “enhanced urban biodiversity and ecosystems” and “better
protected lives and livelihoods from extreme weather”. These allow nature-based urban solutions to
provide wider ecosystem services and protect against extreme heat or flooding. “Increased local energy
production in cities” was a key objective for only 16 respondents. Only 14 national governments – 2 of
which are from OECD member countries – regard economic competitiveness and job creation as a reason
to integrate climate change into NUPs.
Where climate action is included in NUPs, the survey results do not allow us to assess whether they are
consistent with national or Paris Agreement emission reduction objectives. To deploy sectoral policies
consistent with net-zero GHG emissions in 2050 in housing, for example, national governments will have
to integrate the refurbishment of the entire buildings stock. This is likely to require refurbishing around 5%
of cities buildings per year. NUPs can also integrate scenario analysis to set benchmarks for urban
renewable electricity generation, transport and the reduction of consumption-based emissions as
discussed below.
Figure 4.5. Key objectives identified by national governments to mainstream climate action in their NUPs
Note: 52 respondents (22 OECD member countries) reported their NUP addressed climate change through mitigation, adaptation or both.
Source: OECD/UN-Habitat (forthcoming[64]), Global State of National Urban Policy: 2nd Edition, OECD Publishing, Paris/United Nations Human
Settlement Programme, Nairobi.
Networks of cities and their metropolitan areas must also be supported, as highlighted in the report
Managing Environmental and Energy Transitions for Regions and Cities (OECD, 2020[26]). They in turn
can support the replication, scaling up and mainstreaming of successful experiments. Urban pilot projects
to introduce novel transport systems that contribute to the net-zero-emission transition in a city, such as
digital-based ride-sharing described below, can serve rapid diffusion and should also be integrated into
NUPs.
There are two main ways to support more structured learning in and between cities:
3
12
8
13
19
21
17
22
22
16
2
2
8
8
11
11
16
11
12
18
0 5 10 15 20 25 30 35 40
Others
Improved economic competitiveness and jobcreation in cities by taking a lead in climate action
Increased local energy production in cities
Reinforced security of basic urban services and critical natural resources
More risk-sensitive land use in urban areas
Enhanced biodiversity, natural heritage and overall ecosystems in cities
Reduced greenhouse gas emissions
Better protected lives and livelihoods from extreme weather,particularly those of vulnerable urban populations
Reduced air and water pollution in cities, leading to improvedhealth and increased life expectancy
More sustainable urban mobility
Non-OECD OECD

165
OECD REGIONAL OUTLOOK 2021 © OECD 2021
Intracity learning focuses on the exchange of information and knowledge between initiatives and
actors within the boundaries of a particular city or region. Urban policymakers can promote
knowledge exchange and collaboration (Bulkeley and Castán Broto, 2013[65]).
Intercity learning focuses on the exchange of information and knowledge about practices,
experiences and knowledge between cities via networks. City networks, such as C40 and
Champion Mayors, can help spread urban innovation by transferring lessons across localities.
Members of climate networks such as C40 cities adopt more ambitious climate targets and actions
(Salvia et al., 2021[51]), although this may in part be because cities with relatively ambitious climate
action may wish to showcase it through membership. C40 Cities have committed to zero location
and production-based emissions by 2050 (C40 Cities, 2016[66]).
Knowledge about how successful experiments and innovation travels across contexts and how they are
transferred is still limited but knowledge-sharing initiatives have an important role (Lee and Jung, 2018[67]).
National city and municipality networks, such as the Dutch Klimaatverbond, Sweden’s Klimatkommunerna
and Finland’s KINKU network, may play this role (Hakelberg, 2014[68]). These networks still generally
appear to be financed by member cities themselves.
Preparing the “net-negative electric city” by 2050
Scenario analysis for 2050 net-zero GHG emission targets has called for reaching 100% renewable energy
by 2030 (C40 Cities, 2016[66]). Half of the around 300 cities studied do not have renewable energy targets
in their climate mitigation plans (Salvia et al., 2021[51]). Only a few cities have achieved 100% electrification
of non-residential buildings. For residential and transport sectors, electrification is well below 50% (C40
Cities, 2016[66]). Yet 100% must be reached well before 2050. This suggests the need to ramp up the use
of electricity in end-use energy demand, which need to be coupled with energy efficiency programmes to
achieve “net-negative electric cities”. Net-negative electric cities sequester more carbon than they emit in
total (Kennedy et al., 2018[69]), thereby achieving net-negative CO2 emissions. They are developed by
decarbonising electricity generation, electrifying most energy end-use (such as transport) and reducing
energy consumption to reach net-negative emissions. Modular technologies such as rooftop solar or
photovoltaic electricity (PV) panels, small-scale wind turbines, batteries and heat pumps allow the
harnessing of renewable energy sources. These distributed energy systems may avoid costly and
extensive electric transmission lines.
Conducive regulation at the national level is important. For example, in Spain, permitting shared electricity
generation among neighbours increased the profitability of solar panels, thereby boosting uptake (López
Prol and Steininger, 2020[70]). The C40 cities express concern that without national-level support for the
electric grid renewables targets could be missed. Small-scale urban-distributed renewable electricity
generation requires co-ordination within the overall electricity system, for example, to avoid oversized
batteries that raise the costs exponentially (Green and Newman, 2017[71]; Quoilina and Zucker, 2016[72]).
Cities can initiate dialogue between regulators, utilities and “prosumers” (small-scale producers and
consumers) for an optimal mix of scales and technologies to minimise costs. White Gum Valley in Western
Australia demonstrates the supporting role played by local actors including the city (Hojckova et al.,
2020[73]).
Emerging technologies such as blockchain-based energy services facilitating peer-to-peer (P2P) trading,
such as those operational in Brooklyn, US, and White Gum Valley, Western Australia (Hojckova et al.,
2020[73]), can boost distributed renewable energy deployment, adjusting electricity supply and demand to
the intermittent nature of solar and wind. In fact, blockchain-based energy systems could be a cornerstone
for a wholly decarbonised energy system (Ahl et al., 2020[74]). Cities can foster blockchain technology to
meet their renewable energy and emission-reduction targets through P2P or peer-utility-peer trading. For
example, where there are shared solar panels and batteries in multi-unit apartments under common
property, trading can be done between those multi-unit apartments. Batteries and hydrogen storage will
166
OECD REGIONAL OUTLOOK 2021 © OECD 2021
be critical for electric network stability under a 100% renewable energy system. These clusters of
technologies need to be integrated to deliver a zero-carbon city (Newman, 2020[75]).
Bottlenecks in the electric distribution networks could be an emerging issue for electrification of end-use
energy services as well as to accommodate a rising number of renewables prosumers. For example, the
city of Bristol projects its electricity demand to increase by 50% by 2030 to electrify its heat and transport
energy demand (City of Bristol, 2020[76]). These suggest the need to upgrade local distribution networks
(Green and Newman, 2017[71]). Cities’ vertically integrated electric utilities may also face conflicting
interests as upgrading the network will allow more prosumers to sell their excess electricity to the grid to
the detriment of their own sales of utilities (Green and Newman, 2017[71]).
Electric heat pumps will be the major technology to be employed for heat in residential, commercial and
some industrial uses while improving energy efficiency. These are available in a range of different
technologies, which may require collective decisions. For example, heat pumps themselves can be
provided for individual housing units or collectively. Where natural gas has been widely employed and
infrastructure exists, hydrogen use could be an option (Climate Change Committee, 2019[77]). Biomass-
based combined heat and power (CHP) plants can decarbonise both power and heat end-use demand
without electrifying heat. Electricity generation with sustainably sourced biomass, combined with carbon
capture and storage (BECCS) can generate net-negative emissions (Kennedy et al., 2018[69]), and could
be of interest to cities where such power plants have access to eligible storage sites and CO2 transport
infrastructure. Coupling PV installation with desalination to produce energy and water contributes to
alleviating water scarcity (Shannak and Alnory, 2019[78]). Local and regional governments and their citizens
will need to get involved in these decisions as soon as possible for needed infrastructures to be laid out
and industry capacity to produce it to be deployed at sufficient scale.
The biophilic design of the urban environment considers green spaces, hanging gardens and green roofs
among others. These contribute to climate mitigation (Newman, 2020[75]) and can damp heat waves. Such
heat waves will become common in many cities, which are still in temperate climates today. It can improve
well-being in contemporary cities (Totaforti, 2020[79]). Urban land management that adopts arrangements
observed in natural ecosystems, including for agricultural production (“permaculture”) in cities can reduce,
albeit modestly, energy use in the food system while also strengthening resilience and well-being (Morel,
Léger and Ferguson, 2019[80]). The plants and crops can also provide some carbon sequestration. Urban
permaculture can contribute to reducing waste, eliminating emissions through circular economy practices,
as described below (C40 Cities, 2016[66]).
Prioritising solar energy in cities
Prioritising photovoltaic electricity generation is indispensable to achieve climate targets with massive
installation to be undertaken within a period of 10 years (Jäger-Waldau et al., 2020[81]). While potentials
vary depending on sunshine and other geographic factors (see the online country notes to this Regional
Outlook report), there are huge untapped potentials for cities. For example, in US cities, the share of
suitable rooftops ranges from 15% in Washington to 55% in Chicago, 84% in San Bernardino and 85% in
Riverside. But actual rooftop solar penetration ranges from 0.3% in Chicago, 7% in Riverside, 8% in San
Bernardino and 12% in Washington (Reames, 2020[82]). This reinforces the need to legislate, for example
new house construction to install solar panels. Such legislation can be at the city or regional level, as in
California. Australia is the world leader in this domain. More than 2 million houses have rooftop solar panels
with a combined capacity of 7 GW, contributing 62% of total PV capacity, although this may also reflect
lagging policy support for large, utility-scale installations. Rooftop PV technology is continuing to expand
(Say, Schill and John, 2020[83]).

167
OECD REGIONAL OUTLOOK 2021 © OECD 2021
Beyond electricity market regulation, which is mostly national, city governments can influence the uptake
of solar panels by households.
In the US city of Riverside, for example, socio-economic factors such as lack of Internet access
and older housing stock were found to reduce solar panel adoption. Low-income reduces solar
panel penetration in both Chicago and San Bernardino. Language barriers also reduced the
adoption of solar panels in San Bernardino. This calls for cities to proactively engage with the
communities. This is particularly important as subsidies for solar panels risk otherwise being
regressive.
Regulation of multi-apartment shared property matters. In Australia, residents in multi-unit
apartments can install shared batteries and solar panels on the roof of a common property, which
can be managed by owners’ corporations without the involvement of utilities (Roberts, Bruce and
MacGill, 2017[84]). This shared system can reduce load variability, reduce costs compared to
standalone systems, whilst providing 60% self-sufficiency to residents (Syed, Morrison and
Darbyshire, 2020[85]).
Cities can promote large-scale solar panels alongside other renewables outside city borders, as is
the case of the city of Adelaide in South Australia in its pursuit of carbon neutrality by 2023 (City of
Adelaide, 2019[86]).
Cities can stimulate investment through incentive schemes. For example, in Adelaide, one
Australian Dollar (AUD) of city-provided funding generated AUD 6.45 in investment in sustainable
technologies such as light-emitting diodes, solar hot water systems and electric vehicle charging
stations among others (City of Adelaide, 2019[86]).
Sustainable urban mobility
As highlighted in Managing Environmental and Energy Transitions for Regions and Cities (OECD, 2020[26]),
transport emits around 23% of energy-related CO2 emissions, mostly in road transport. Around half of
passenger transport takes place in urban areas and urban transport accounts for about 40% of transport
energy use (IEA, 2016[87]). It is the sector with the highest growth in GHG emissions (ITF, 2019[88]). Demand
for transport may continue to grow, driven by urbanisation, population growth and rising incomes,
especially in middle-income countries.
Transport accounts for much local air pollution, noise and accidents and uses up much precious urban
space, especially from car parking, whilst generating congestion and delays (EEA, 2019[89]). Urban policy
can seek synergies between emission reduction and reducing all these urban ills. For example, policies to
reduce individual car use through improved local accessibility, transport-oriented development, public
transport improvements and digital-based ride-sharing (see below) could harness these benefits more than
solely relying on electric cars, while also reducing energy consumption.
The spatial distribution of population within a city or metropolitan area can have a strong
influence on the cost of providing public transport
As shown in the Cities in the World report (OECD/EC, 2020[45]), there is a clear link between cities’ shape
and the needed length of its public transport network to provide the same quality of service. Cities such as
Hong Kong, China, or Mumbai, India, which have a very strong concentration of their population in the
central part of the city, can provide public transport to 80% of its residents with a network of only 6 km per
100 000 inhabitants. Houston needs a 26-fold and Atlanta a 45-fold longer network than Hong Kong,
China, to provide the same access. In practice, this usually means that a much lower share of the
population has access to public transport in cities like Atlanta and Houston. Thus, as neighbourhood
density falls, the total network costs increase. For example, reducing the density from 15 000 to
12 000 increases costs by 30%, while reducing it from 6 000 to 3 000 increases costs by 120%.
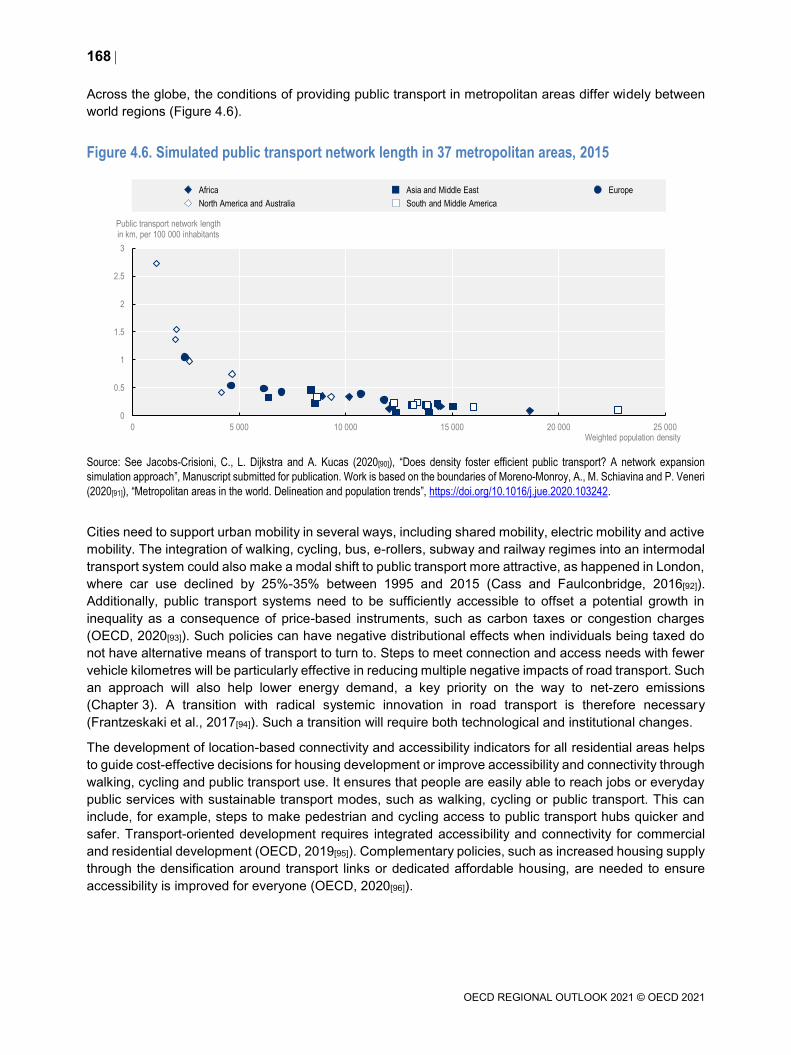
168
OECD REGIONAL OUTLOOK 2021 © OECD 2021
Across the globe, the conditions of providing public transport in metropolitan areas differ widely between
world regions (Figure 4.6).
Figure 4.6. Simulated public transport network length in 37 metropolitan areas, 2015
Source: See Jacobs-Crisioni, C., L. Dijkstra and A. Kucas (2020[90]), “Does density foster efficient public transport? A network expansion
simulation approach”, Manuscript submitted for publication. Work is based on the boundaries of Moreno-Monroy, A., M. Schiavina and P. Veneri
(2020[91]), “Metropolitan areas in the world. Delineation and population trends”, https://doi.org/10.1016/j.jue.2020.103242.
Cities need to support urban mobility in several ways, including shared mobility, electric mobility and active
mobility. The integration of walking, cycling, bus, e-rollers, subway and railway regimes into an intermodal
transport system could also make a modal shift to public transport more attractive, as happened in London,
where car use declined by 25%-35% between 1995 and 2015 (Cass and Faulconbridge, 2016[92]).
Additionally, public transport systems need to be sufficiently accessible to offset a potential growth in
inequality as a consequence of price-based instruments, such as carbon taxes or congestion charges
(OECD, 2020[93]). Such policies can have negative distributional effects when individuals being taxed do
not have alternative means of transport to turn to. Steps to meet connection and access needs with fewer
vehicle kilometres will be particularly effective in reducing multiple negative impacts of road transport. Such
an approach will also help lower energy demand, a key priority on the way to net-zero emissions
(Chapter 3). A transition with radical systemic innovation in road transport is therefore necessary
(Frantzeskaki et al., 2017[94]). Such a transition will require both technological and institutional changes.
The development of location-based connectivity and accessibility indicators for all residential areas helps
to guide cost-effective decisions for housing development or improve accessibility and connectivity through
walking, cycling and public transport use. It ensures that people are easily able to reach jobs or everyday
public services with sustainable transport modes, such as walking, cycling or public transport. This can
include, for example, steps to make pedestrian and cycling access to public transport hubs quicker and
safer. Transport-oriented development requires integrated accessibility and connectivity for commercial
and residential development (OECD, 2019[95]). Complementary policies, such as increased housing supply
through the densification around transport links or dedicated affordable housing, are needed to ensure
accessibility is improved for everyone (OECD, 2020[96]).
0
0.5
1
1.5
2
2.5
3
0 5 000 10 000 15 000 20 000 25 000
Public transport network length in km, per 100 000 inhabitants
Weighted population density
Africa Asia and Middle East Europe
North America and Australia South and Middle America
169
OECD REGIONAL OUTLOOK 2021 © OECD 2021
Shared mobility solutions
Digital-based ride-sharing can lower CO2 emissions sharply and deliver large reductions of traffic,
eliminating congestion, freeing expensive urban space while improving connectivity and accessibility,
provided it replaces individual car use. It improves connectivity and accessibility especially for low-income
households and households in suburban areas, which are often less well connected to public transport. In
such ride-sharing models, individual private car rides and ideally all rides in an entire metropolitan area are
replaced by rides in shared taxis or minibuses. These services are modelled to be available on demand,
at the doorstep or at the next street corner. Supply and demand of on-demand services are co-ordinated
by a digital platform, which optimises routing (Box 4.11). Professional staff drive the vehicles.
Recent modelling for the daily mobility patterns of metropolitan area Dublin, Ireland, shows that the number
of vehicles, traffic, CO2 emissions and congestion would be reduced by up to 98%, 38%, 31%, and 37%
respectively (ITF, 2018[97]). Broadly similar results have been obtained for other cities, such as Auckland,
Helsinki, Lisbon and Lyon (ITF, 2020[98]). Ride-sharing is also low-cost. For Dublin, the cost of shared
minibus services would be less than the price of a public transport ticket, yet would not need to be
subsidised. Shared rides could substitute inefficient bus lines and provide feeder service to rail. Further
benefits would include substantially lower pollution and freeing up space occupied by parked cars, for
example, for active mobility. Emission reductions are larger if the shared vehicle fleet is electric.
Survey results suggest that 20% of car drivers would be willing to switch to shared rides in Dublin, although
this share could be substantially higher if more information about the ride-sharing system (e.g. example
about the lower cost of ride-sharing for users compared to using and operating private cars, for many,
incentives to switch, such as lower prices for early adopters) are provided. If 20% of private car trips were
replaced with shared modes, shared services could still be provided at a sufficiently low cost to ensure
uptake. Emissions could fall by around 20% and congestion by 7%. Survey results for Lyon suggest that
most citizens are willing to use shared modes.
Relying on on-demand ride-sharing also reduces the cost of electrifying transport. By reducing the number
of vehicles and using them more intensively, ride-sharing would take advantage of the low operating costs
of electric vehicles, while limiting electricity demand, material used for battery and car production and
infrastructure needs. At the same time, more intensive vehicle use results in more frequent renewal and
therefore quicker technology diffusion (ITF, 2018[97]; 2020[98]). Digital-based sharing models and
multimodal transport systems require steps to regulate smart mobility and the role of data (Box 4.11).
Box 4.11. Regulating smart mobility and the role of data
Smart mobility can contribute to the net-zero emission transition by fostering ride-sharing, multimodal
public transport combined with active mobility and shared micromobility. Each of these requires an
adapted regulatory framework that enables innovation to further the net-zero-emission agenda without
hindering equity, safety, flexibility or efficiency (ITF/OECD, 2020[99]). The regulatory framework should
be transparent, agile and linked to over-arching public policy objectives. For example, the city of Paris
re-assessed its shared micromobility based on a voluntary charter signed by e-scooter companies
(ITF/OECD, 2020[99]).
Transport systems and their users generate an increasing amount of data, representing a source of
improvement in transport system performance. City authorities may adopt frameworks that enable
targeted data sharing that respect privacy, operational needs and commercial sensitivities, while
guaranteeing cyber-resilience (ITF/OECD, 2020[99]), provided they serve policy objectives, such as
accessibility, environmental outcomes, equity and safety. Finland’s National Transport Code (NTC) lays
the groundwork for data sharing in support of Mobility as a Service (MaaS). The aim is to create an
170
OECD REGIONAL OUTLOOK 2021 © OECD 2021
open and level playing field where operators can co-ordinate their services and create new applications
(Finnish Ministry of Transport and Communications, 2019[100]). In 2019, France approved the National
Mobility Law (Loi d’orientation des mobilités 2019) that sets out requirements regarding data sharing in
support of smart and sustainable mobility. These requirements concern public transport operators and
all other providers of mobility services (Assemblée Nationale française, 2019[101]).
Source: ITF/OECD (2020[99]), Leveraging Digital Technology and Data for Human-centric Smart Cities: The Case of Smart Mobility,
https://www.itf-oecd.org/sites/default/files/docs/data-human-centric-cities-mobility-g20.pdf.
Fostering active mobility
Cycling and walking are low-cost means of transport to users and taxpayers alike. To users, they provide
the health benefits from regular exercise on daily trips they need to undertake anyway. To governments,
infrastructure is cheap to build. Facilitating cycling and walking benefits low-income households. For
example, cycle-hire facilities increased cycling substantially, in particular in low-income areas of London
(Lovelace et al., 2020[102]). The reach of cycling as a means of transport can be extended to 20 kilometres
with electric bicycles. Fostering active mobility should be seen as a complement to public transport. Low-
cost options for cities to facilitate walking typically also facilitate public transport use.
City governments have redistributed street space to pedestrians and cyclists as part of their post-lockdown
COVID-19 strategies (Kraus and Koch, 2020[103]). On average 11.5 kilometres of provisional pop-up bike
lanes have been built per city in 106 European cities. Each kilometre may have increased cycling by 0.6%.
The new infrastructure could generate USD 2.3 billion in health benefits per year. This suggests that every
kilometre of cycle land produces annual health benefits of about USD 2 million, so the investment may
often pay off in less than a year.
The application of a broad range of ethical fair allocation principles also argues in favour of moving street
space from cars to pedestrians and cyclists on a larger scale (Creutzig et al., 2020[104]). For example, it
would improve the safer, more autonomous use of streets for the least able, in particular children, the
elderly and the disabled. Especially the allocation of curbside space to car parking appears difficult to justify
on any fair allocation principle. In Berlin, for example, parked cars hold 22% of street space but only a 5%
share of users (Figure 4.7). Cycling, on the other hand, uses less than 10% of space for 16% of users. A
fairer allocation would reduce the space allocated to car parking by more than half while increasing the
street space allocated to biking, walking and public transport. Some of the allocation mechanisms and
principles considered include well-being, environmental efficacy, economic efficiency and intergenerational
justice.
Road use charges need to complement the widespread uptake of electric vehicles
As highlighted in Managing Environmental and Energy Transitions for Regions and Cities (OECD, 2020[26]),
electric vehicles (EVs) have great potential as a way for cities to reduce local air pollution and GHG
emissions. However, they still contribute to congestion and air pollution due to particles released from tyres
and braking. Therefore, a shift to EVs should be positioned within a wider plan for city journeys to be made
by public transport, ride-sharing, bike or on foot. Some cities have announced specific goals for EVs
(Table 4.1).
Little is known if and how local policies and strategies affect EV usage and its supporting infrastructure
(Roelich et al., 2015[105]). One successful policy has been to invest in public charging infrastructure. The
need for public charging varies based on housing stock, private charging availability and commuting
patterns.

171
OECD REGIONAL OUTLOOK 2021 © OECD 2021
Figure 4.7. Fair street space allocation provides more space for biking, walking and public transport while significantly reducing the space for parking
Street space by usage and space allocation for five transport modes, Berlin, Germany
Note: The arrows show the suggested direction of change from considering a range of ethical principles. Cones represent uncertainty values.
Source: Creutzig, F. et al. (2020[104]), “Fair street space allocation: Ethical principles and empirical insights”, http://dx.doi.org/10.1080/0144164
7.2020.1762795.
Table 4.1. Electric vehicle goals announced by selected major cities
City Target
Amsterdam (NL) Zero-emissions transport within the city by 2025
London (UK) 70 000 ultra-low-emission vehicles sold by 2020; 250 000 by 2025
Los Angeles (US) 10% of vehicle stock electric by 2025; 25% electric by 2035
New York City (US) 20% EV sales share by 2025
Oslo (NO) Zero-emission transport within the city by 2030
Shenzen (CN) 120 000 new energy vehicles sold by 2020
Tianjin (CN) 30 000 new energy vehicles sold by 2020
Source: OECD (2020[26]), Managing Environmental and Energy Transitions for Regions and Cities, https://doi.org/10.1787/f0c6621f-en; Hall, D.,
H. Cui and N. Lutsey (2017[106]), “Electric vehicle capitals of the world: What markets are leading the transition to electric?”,
http://www.theicct.org/EV-capitals-of-the-world (accessed on 22 May 2020).
Electric cars already have lower operating costs than cars with internal combustion engines and they are
likely to become cheaper for most users within this decade, even including the purchase price. The
diffusion of electric cars could therefore risk intensifying car use in cities, aggravating congestion.
Automated driving adds to these risks, as it will reduce the opportunity cost of the time spent in the car.
Fuel taxes have priced only a fraction of the full external costs in cities, where they are particularly high. In
any case, fuel taxes disappear with net-zero-emission policies and EV use. Electrification of car use will
need to come with the adoption of road use charges in order to replace fuel taxes also for revenue
(Atkinson, 2019[107]). This will lower excess driving demand and shift mobility to other modes of transport
(OECD/ITF, 2019[22]).
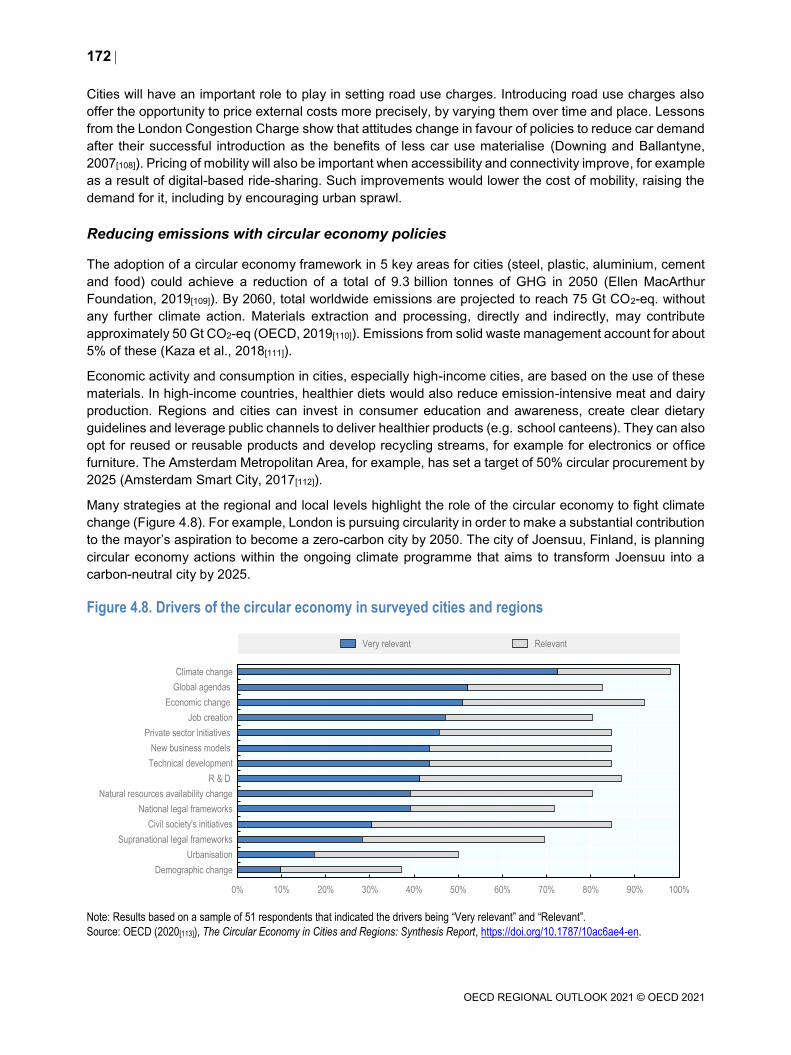
172
OECD REGIONAL OUTLOOK 2021 © OECD 2021
Cities will have an important role to play in setting road use charges. Introducing road use charges also
offer the opportunity to price external costs more precisely, by varying them over time and place. Lessons
from the London Congestion Charge show that attitudes change in favour of policies to reduce car demand
after their successful introduction as the benefits of less car use materialise (Downing and Ballantyne,
2007[108]). Pricing of mobility will also be important when accessibility and connectivity improve, for example
as a result of digital-based ride-sharing. Such improvements would lower the cost of mobility, raising the
demand for it, including by encouraging urban sprawl.
Reducing emissions with circular economy policies
The adoption of a circular economy framework in 5 key areas for cities (steel, plastic, aluminium, cement
and food) could achieve a reduction of a total of 9.3 billion tonnes of GHG in 2050 (Ellen MacArthur
Foundation, 2019[109]). By 2060, total worldwide emissions are projected to reach 75 Gt CO2-eq. without
any further climate action. Materials extraction and processing, directly and indirectly, may contribute
approximately 50 Gt CO2-eq (OECD, 2019[110]). Emissions from solid waste management account for about
5% of these (Kaza et al., 2018[111]).
Economic activity and consumption in cities, especially high-income cities, are based on the use of these
materials. In high-income countries, healthier diets would also reduce emission-intensive meat and dairy
production. Regions and cities can invest in consumer education and awareness, create clear dietary
guidelines and leverage public channels to deliver healthier products (e.g. school canteens). They can also
opt for reused or reusable products and develop recycling streams, for example for electronics or office
furniture. The Amsterdam Metropolitan Area, for example, has set a target of 50% circular procurement by
2025 (Amsterdam Smart City, 2017[112]).
Many strategies at the regional and local levels highlight the role of the circular economy to fight climate
change (Figure 4.8). For example, London is pursuing circularity in order to make a substantial contribution
to the mayor’s aspiration to become a zero-carbon city by 2050. The city of Joensuu, Finland, is planning
circular economy actions within the ongoing climate programme that aims to transform Joensuu into a
carbon-neutral city by 2025.
Figure 4.8. Drivers of the circular economy in surveyed cities and regions
Note: Results based on a sample of 51 respondents that indicated the drivers being “Very relevant” and “Relevant”.
Source: OECD (2020[113]), The Circular Economy in Cities and Regions: Synthesis Report, https://doi.org/10.1787/10ac6ae4-en.
0% 10% 20% 30% 40% 50% 60% 70% 80% 90% 100%
Demographic change
Urbanisation
Supranational legal frameworks
Civil society's initiatives
National legal frameworks
Natural resources availability change
R & D
Technical development
New business models
Private sector initiatives
Job creation
Economic change
Global agendas
Climate change
Very relevant Relevant
173
OECD REGIONAL OUTLOOK 2021 © OECD 2021
Often the circular economy in cities and regions is seen as synonymous with recycling but it goes beyond.
A circular urban economy is one where waste is prevented; goods are used for longer; the disposable
model is replaced by a recovery one; a market for secondary raw materials is in place and secondary
materials would satisfy a prominent percentage of the demand of materials for goods production. A circular
waste system would develop and commercialise technology to identify, sort and deliver high-quality
secondary material. Digitalisation and data management should connect products with waste handling and
the design and production phase should take into account feedback from waste handling and extend the
life of products and goods.
Many cities are putting in place initiatives to support product design, reuse and recycling. The city of
Helsinki, Finland, launched in 2019, the Closed Plastic Circle to develop tendering processes that include
criteria to promote plastic recycling (Smart Clean, 2019[114]). In the US, Austin is advancing towards zero
waste through the Austin Resource Recovery Master Plan; San Francisco aims by 2030 to reduce
municipal solid waste generation by 15% and reduce disposal to landfill and incineration by 50%. While
recycling is projected to grow, the share of landfill in municipal waste treatment remains high in OECD
countries. It decreased from 63% to 42% between 1995 and 2018 but still accounts for most of the waste
management related emissions (OECD, 2019[115]).
Some sectors are key to cut carbon emissions in cities following a circular economy approach, such as the
built environment. The building sector is responsible for about a third of all carbon emissions worldwide
(World Green Building Council, 2017[116]; Ellen MacArthur Foundation, 2020[117]) (Box 4.12). The circular
economy can contribute to reducing the sector’s CO2 emissions by minimising material use and maximising
reuse. Applying circular economy principles to the built environment would imply rethinking upstream and
downstream processes. It also implies new forms of collaboration amongst designers, constructors,
contractors, real estate investors, suppliers of low- and high-tech building materials and owners, while
looking at the life cycle from construction to end of life. Key phases can be identified as planning, design,
construction, operation and end of current life (Stronati and Berry, 2018[118]):
1. Planning in a circular way implies considering the entire lifecycle of the asset. Examples are
modular approaches so that materials and buildings’ blocks can be easily dismantled and reused.
2. A proper design in the project phase takes into account the material choice, the consumption of
water and energy in buildings to reduce consumption and minimise waste and allow reuse of
buildings.
3. The choice of materials for the construction phase entails identifying more sustainable materials
and minimising the variety of materials used. Material passports and material banks can foster
reuse.
4. The operation phase concerns the use of energy and technologies for resource efficiency. The
operation also includes data and innovative technologies as enablers to extending building life.
5. The end life of a building would create a new life for the waste material produced (Stronati and
Berry, 2018[118]). In Groningen, Netherlands, a project using the disused sugar factory aims to
create a “zero-waste” neighbourhood: De Loskade is projected to be a “removable” and “short-
stay” neighbourhood. Temporary properties will be dismantled after the rental period that ends in
2030 and rebuilt in other areas. Extensive pilots and testing are taking place at De Loskade, for
example gas-free installations and energy-efficient homes (Municipality of Groningen, 2019[119];
Van Wijnen, 2019[120]).
174
OECD REGIONAL OUTLOOK 2021 © OECD 2021
Box 4.12. The key role of cities and regions in low-carbon transition in buildings
While buildings account for nearly a third of energy-related GHG emissions globally, these percentages
reach roughly 70% in cities like London, New York and Tokyo (Greater London Authority, 2018[121];
Bureau of Environment, 2018[122]; New York City Mayor’s Office of Sustainability, 2017[123]).
Energy efficiency improvements in buildings will generate numerous co-benefits, including job creation,
health improvements and increased energy affordability, which can all contribute to a green and
inclusive recovery from the COVID-19 crisis. Building works are particularly suitable for a rapid
employment-intensive recovery.
The potential for job creation is estimated to be from 8 to 27 working years per EUR 1 million
spent on energy efficiency measures depending on a country’s economic context (IEA,
2014[124]). They include low- to medium-skilled jobs (OECD, 2013[125]).
The health benefits reduced respiratory and cardiovascular conditions due to improved indoor
air temperature, as well as improved mental health such as reduced depression. A Japanese
survey found a significant reduction in blood pressure (MLIT, 2019[126]). Public health spending
could be substantially lower (IEA, 2014[124]).
Energy efficiency improvements of housing can also lead to increased energy affordability
especially among low-income households, provided they do not bear the cost of the capital
outlays when they arise initially. For example, the study on Cincinnati’s low-income
weatherisation programme found that the average arrears of households joining the programme
fell by more than 60% after energy efficiency improvements (IEA, 2014[124]).
Action needs to sharply accelerate to meet the net-zero domestic GHG emission targets. Virtually all
existing buildings will need to be renovated in-depth to be consistent with net-zero emission. The rate
of building energy renovations needs to increase considerably, from rates of 1%-2% of existing stock
today to ideally 5% per year as soon as possible to meet net-zero-emission targets by 2050 (OECD,
2020[127]). his will also imply equipping them with energy-saving heating equipment. In the EU, buildings
built before 1945 still account for 23% of all building stock and their average insulation level (of external
walls) is more than 5 times lower than that of buildings built after 2010 (EC, n.d.[128]), which suggests
they should be renovated first.
In order to avoid lock-in of inefficient building stock and costly future renovations, net-zero-emission
standards should already apply to new buildings. In the EU, the Energy Performance of Buildings
Directive requires all new buildings to be nearly zero-energy buildings from 31 December 2020 (EC,
2019[129]). However, implementation will depend on member countries.
Decarbonising the existing building stock requires a co-ordinated approach across levels of
government. In view of multiple market failures, including split incentives between owners and tenants,
capital market imperfections and too-short-time horizons in investment decisions, compulsory energy
standards to reach standards at set dates may be best suited (Deasley and Thornhill, 2017[130]). Such
an approach would also allow governments to target financial support to those households and firms
which need the most support. For cost-effectiveness, it will be important for renovation programmes to
incorporate consistency with the net-zero emission objective from the outset.
Cities and regions have a unique ability to promote the decarbonisation of building stock through
effective implementation, prioritisation and effective engagement of citizens and local businesses. This
includes gathering information on renovation needs, taking advantage of public building procurement
and certifying energy efficiency standards.
175
OECD REGIONAL OUTLOOK 2021 © OECD 2021
Applying circular economy principles to food production and consumption can contribute to reducing GHG
emissions at a low cost. Cities are major food consumers. A total of 2.9 billion tonnes are annually destined
to cities with 0.5 billion tonnes wasted (Ellen MacArthur Foundation, 2019[131]) Achieving a regenerative
food system in cities will entail an annual reduction of GHG emissions by 4.3 billion tonnes of CO2-
equivalent and the generation of annual food benefits worth USD 2.7 trillion by 2050. By 2050, cities will
consume 80% of food (FAO, 2020[132]). Circular food systems in cities and regions are based on
strengthening synergies across the food value chain, from production to distribution, consumption and
waste handling.
In a circular economy, food waste should be reduced as much as possible or transformed into usable
products for agriculture. For example, the city of Groningen, Netherlands, launched Food Battle Groningen
to raise awareness on reducing food waste. Local not-for-profit organisations are taking the lead by pushing
the demand towards local food consumption, reducing food waste and promoting urban agriculture. The
city of Toronto, Canada, has put in place the Urban Harvest programme to help reduce food waste and
benefit the broader community by collecting surplus fruit and vegetables from residents’ backyards and
redistributing them to local food banks and programmes. The city of Guelph aims to become Canada’s first
technology-enabled circular food economy, reimagining an inclusive food-secure ecosystem that by 2025
increases access to affordable, nutritious food by 50%, where 50 new circular businesses and
collaborations are created and circular economic revenues are increased by 50%. The programme aims
to make the most of its distinctive characteristics (the presence of major agri-food industry players,
agriculture research institutions and a developed household organic waste collection scheme) to: grow
food regeneratively and locally when possible; minimise food waste; and design and market healthier food
products (Government of Canada, 2020[133]).
The transition to a circular economy does not come without obstacles. Matching biological and technical
cycles of cities and regions and the various ways in which resources can be repurposed and reused, from
water to energy and mobility, is a complex task. From a business perspective, there is no efficient
secondary market for most of the collected household waste. Still, virgin materials are less expensive than
secondary products. Collaboration along a value chain can be best established at a regional and urban
scale. Insufficient financial resources, inadequate regulatory frameworks, financial risks, cultural barriers
and the lack of a holistic vision are amongst the major obstacles identified by more than one-third of the
interviewed stakeholders in the OECD survey (2020[134]).
The circular economy can be implemented if proper governance conditions are in place. The OECD
(2020[134]) identified three clusters corresponding to the complementary roles of cities and regions as
promoters, facilitators and enablers of the circular economy:
1. Promoters: Cities and regions can promote the circular economy acting as a role model, providing
clear information and establishing goals and targets, in particular through: defining who does what
and leading by example (roles and responsibilities); developing a circular economy strategy with
clear goals and actions (strategic vision); promoting a circular economy culture and enhancing trust
(awareness and transparency).
2. Facilitators: Cities and regions can facilitate connections and dialogue and provide soft and hard
infrastructure for new circular businesses, in particular through: implementing effective multi-level
governance (co-ordination); fostering system thinking (policy coherence); facilitating collaboration
amongst public, not-for-profit actors and businesses (stakeholder engagement) and adopting a
functional approach (appropriate scale).
3. Enablers: Cities and regions create the enabling conditions for the transition to a circular economy
to happen, e.g.: identify the regulatory instruments that need to be adapted to foster the transition
to the circular economy (regulation); help mobilise financial resources and allocate them efficiently
(financing); adapt human and technical resources to the challenges to be met (capacity building);
176
OECD REGIONAL OUTLOOK 2021 © OECD 2021
support business development (innovation); and generate an information system and assess
results (data and assessment).
Cities need to address specific adaptation challenges
Climate change poses unique challenges for adaptation in cities. Prolonged extreme temperature events
will increase energy demand and exacerbate inequalities in access to cooling at work and in homes,
especially in cities because of the heat island effect of built environments (IEA, 2016[87]). Urban areas are
expected to experience major impacts on water availability and supply with potential changes in water
quality and quantity, potentially resulting in fierce competition (OECD, 2016[135]).
Extreme precipitation and related storms, floods, torrents and landslides will increasingly damage critical
urban infrastructure as well as private assets. One in 5 urban dwellers, representing 613 million people, is
currently exposed to a 100-year flood and up to 6% of cities are at risk of being entirely flooded (OECD/EC,
2020[45]). By 2030, urban property damaged by riverine floods is estimated to increase threefold, from
USD 157 billion to USD 535 billion annually (WRI, 2020[136]). The US, for example, may experience an
additional USD 16 billion in annual flood damages to urban property by 2030 (WRI, 2020[136]). Sea level
rise poses further risks, albeit arising with more delay: 14% of all urban dwellers (as well as 11% of dwellers
of towns and semi-dense areas) live in low-lying coastal areas (OECD/EC, 2020[45]). Urban property
damaged by coastal storm surge and sea level rise is estimated to increase tenfold by 2030, from
USD 17 billion to USD 177 billion annually (WRI, 2020[136]). OECD modelling projections for a sea-level
rise of 1.3 metres by 2100 indicate that without adequate adaptation measures coastal flooding may cause
global annual damage costs up to USD 50 trillion – nearly 4% of global GDP – by the end of the century
(OECD, 2019[137]).
The impacts of climate change vary widely across cities. Climate models have greatly improved in precision
and scale, with spatial resolutions on the order of 100 km, yet this scope remains much too large for most
cities (Shepherd and Sobel, 2020[138]). Climate modelling at lower resolutions may magnify uncertainties.
To know the exact future impacts of climate change at local urban levels is unfeasible and can be a
problematic expectation if policymakers defer action. Rather, policymakers should implement measures to
reduce overall risk exposure – that is to say, by minimising vulnerability tied to social, economic,
environmental and physical factors or processes, which can compound hazards, long-term stress
(economic decline, natural resource degradation) and sudden disastrous shocks (drought, flood) (OECD,
2018[139]; Figueiredo, Honiden and Schumann, 2018[140]).
National and local policymakers can jointly undertake measures to reduce risk exposure and enhance the
adaptability and resilience of cities. The OECD has developed a set of recommendations on urban
resilience and disaster risk management. A vulnerability risk assessment (VRA) and, building on it, a local
resilience action plan (LRAP) forms the basis of policy and financing priorities (Box 4.13). NUPs can be a
good platform to foster a national-local relationship. They can provide a general implementation roadmap
and unlock financing and capacity building. Preliminary survey results from the 2nd edition of the Global
State of National Urban Policy (OECD/UN-Habitat, forthcoming[64]) reveal that the 2 most common
adaptation measures in NUPs are to “conduct a comprehensive VRA focusing on urban areas” (65% of
respondents) and “adopt risk-sensitive land use policies” (62% of respondents).
177
OECD REGIONAL OUTLOOK 2021 © OECD 2021
Box 4.13. Key recommendations on urban resilience and disaster risk management
The OECD report Building Resilient Cities: An Assessment of Disaster Risk Management Policies in
Southeast Asia (2018[139]) provides a general framework for assessing disaster risk management
policies and resilience in cities as well policy recommendations for five cities in Southeast Asia:
Bandung (Indonesia), Bangkok (Thailand), Cebu (Philippines), Hai Phong (Viet Nam) and Iskandar
(Malaysia). City governments can conduct VRAs and LRAPs with a high degree of autonomy. They are
also typically in charge of adopting risk-sensitive land use policies. Many measures to improve urban
resilience are most effectively achieved when national and local governments work hand in hand.
The main recommendations in the report are the following:
1. Conduct a comprehensive VRA in each city in order to develop an LRAP. A VRA identifies and
locates people, places and assets that are expected to be most exposed to natural hazards
risks. Next, the vulnerability and adaptive capacity are estimated. VRAs and asset inventory
practices form the basis of an LRAP, which should work as an interface with other urban policy.
2. Adopt risk-sensitive land use policies combining regulatory and fiscal instruments to guide urban
development away from risk-prone areas.
3. Integrate disaster risk management policies and urban green growth policies, especially in the
infrastructure sector, to generate “co-benefits”. Property taxes, fees, tariffs and land value
capture mechanisms can provide funding, drawing on the benefits.
4. Develop disaster risk financing (DRF) mechanisms. Typically, ex ante disaster risk financing
tools involve significant opportunity costs, especially in terms of investment potential.
5. Promote the use of information and communication technologies. Key tools include early
warning systems, emergency services and other disaster response efforts in sectors such as
transport, energy, water and solid waste.
6. Foster vertical and horizontal co-ordination. National governments have an important role in
aligning national and subnational risk management policies and creating an enabling
environment that allows local governments to act more effectively and efficiently. Establishing
a dedicated agency on climate risk/adaptation can help to facilitate co-ordination among
sectoral departments as well as vertical coherence across levels of government. Conducting
in-depth country reviews of urban risk management policies can also be useful to guide public
action and decisions.
7. Engage with stakeholders to promote inclusiveness. Co-ordinated response mechanisms
between civil society and local governments as well as public awareness campaigns targeting
citizens who are at the greatest risk and financially vulnerable are critical to enhancing urban
resilience. Local authorities can encourage the private sector, notably SMEs, to design business
continuity and recovery plans to reduce economic disruption.
Source: OECD (2018[139]), Building Resilient Cities: An Assessment of Disaster Risk Management Policies in Southeast Asia,
https://dx.doi.org/10.1787/9789264305397-en.
Improving the resilience of rural regions in the net-zero-emission transition
Rural regions are pivotal in the transition to a net-zero-emission economy and building resilience to climate
change because of their natural endowments. Rural regions are home to around 30% of the OECD’s
population and cover approximately 80% of its territory, containing the vast majority of the land, water and
178
OECD REGIONAL OUTLOOK 2021 © OECD 2021
other natural resources. These lands are needed for food and renewable production from wind, water and
biomass. They are also where we find natural beauty, biodiversity and ecosystem services that produce
clean air, detoxify waste, clear water, sequester carbon and allow for recreation. Forests and wetlands, for
instance, function as natural carbon sinks – trees and other vegetation sequester an amount equivalent to
roughly one-third of global emissions (IPCC, 2019[141]). Wind, water, biomass and waste present in rural
lands are used to create clean energy. These fundamental values to our well-being are increasingly
recognised, as is the duty to protect them for current and future generations.
The specialisation of rural areas in resource-based industries makes them a contributor to climate change.
Rural economies produce almost all of the food, energy, lumber, metals, minerals and other materials that
make our way of life possible. Population growth and increased living standards have enlarged the demand
for many of these materials. This has put strong pressures on extraction and production, often leading to
increasing emission and depleting the earth’s ability to absorb CO2. Agriculture and forestry, for instance,
are responsible for around 25% of global GHG emissions when emissions from land use and land use
change are included (OECD et al., 2015[142]). GHG emissions per capita in remote rural regions are
particularly high (Chapter 3). The extraction and primary processing of metals, which largely happens in
rural regions, further accounts for 26% of global CO2 emissions (UNEP, 2019[143]). In the light of the growing
demand for minerals and metals – the world consumption of raw materials is set to double by 2060 – the
extractive industry is required to contribute to the mitigation of climate change and become more
sustainable.
Many rural economies (e.g. agriculture, forestry, fisheries, mining and energy, etc.) are already suffering
from the increased frequency and intensity of extreme weather events such as storms, floods, torrents and
landslides. In many rural regions across the world, increasing heat waves will contribute to water scarcity,
with risks to food production. As nature loses its capacity to provide important services, rural economies
will suffer significant losses as they rely on the direct extraction of resources from forests, agricultural land
and oceans or the provision of ecosystem services such as healthy soils, clean water, pollination and a
stable climate (WEF/PwC, 2020[144]).
Rural communities often struggle to adapt and prepare for transformational challenges required to move
to net-zero emissions. Over the past decades, the benefits of globalisation and technological change have
not reached many rural places and regional inequalities have grown. Rural economies are experiencing
increased competition from less developed counties. The shift to a service economy has largely benefitted
cities and important infrastructure including broadband is missing. Population ageing, limited economic
diversity and dependence on external markets and transport often accelerate their vulnerability.
Consequently, many rural communities feel left behind and exposed to a range of challenges they have to
deal with (OECD, 2020[19]). Rural regions and their workers specialised in economic activities which need
to be phased out in the transition to net-zero emissions will need dedicated support.
While rural places are not without their challenges, they are also, unquestionably, places of opportunity
that are key in delivering wider well-being to current and future generations. Rural policies have an
important role to play in reaching net-zero GHG emission targets, while also generating benefits for rural
communities. This can happen through more sustainable land management, higher valorisation of
ecosystem services, making use of innovative production processes around agriculture, mining and
renewable energies and new modes of transportation. At the same time, this requires a fundamental
transformation to rural economies and societies. This section shows opportunities for rural development
by making rural regions more resilient to climate change and in the net-zero-emission transition.
Rural regions come in different shapes and forms: policies need to reflect this diversity to be effective. In
place of an urban-rural dichotomy, the Rural Well-being Policy Framework (OECD, 2020[19]) identifies three
types of rural regions on a rural-urban continuum: i) rural inside functional urban areas (FUAs); ii) rural
close to cities; and iii) remote rural. The framework identifies the interactions between the three types of
rural places and cities, each with stark structural differences, and distinct challenges and opportunities.

179
OECD REGIONAL OUTLOOK 2021 © OECD 2021
Understanding this diversity helps to shape policy responses for the transition to a net-zero-emission
economy. Rural regions close to cities, for instance, can substitute carbon-intensive car use more easily
than remote regions. Remote regions on the other hand have an advantage in providing renewable energy
but are less economically diverse.
Land use is key in directly contributing and removing GHG emissions, mostly through
agriculture and forestry
Current and predominant forms of land use in rural regions are a large direct contributor to GHG emissions
as well as land and biodiversity degradation, notably through agriculture and forestry. Today, 70% of the
global, ice-free land surface is affected by human use (IPCC, 2019[141]). The food system is responsible
for around 30% of global GHG emissions. Of this total, 46% come from direct production (largely methane
from enteric fermentation of ruminants), 36% from land use change (deforestation), 13% from post-
production (processing, storage, transport, waste disposal) and 5% from pre-production (animal-feed
production, energy use, fertiliser manufacture) (OECD, 2019[95]). In addition, agriculture also puts pressure
on resources such as water, soil quality and other ecosystems and biodiversity. Many of these are linked
to the intensification of farming practices to meet growing food demand (e.g. excessive use of fertilisers,
pesticides and antibiotics, industrial livestock systems and unsustainable grazing, specialisation and
uniformity of landscapes, and land conversion) (OECD, 2019[95]; Hardelin and Lankoski, 2018[145]). Today,
around 25% of animal and plant species are threatened with extinction (IPBES, 2019[146]). The link between
biodiversity loss and climate change is well documented. It is estimated that 5% of all species are
threatened with extinction by 2 degrees Celsius (°C) of warming above pre-industrial levels, while the earth
could lose a staggering 16% of its species if the average global temperature rise exceeds 4.3°C. This loss
of diversity poses a serious risk to global food security by undermining the resilience of many agricultural
systems to threats such as pests, pathogens and climate change (IPBES, 2019[146]). To address this, local
efforts including knowledgeable local actors plays a key role.
Land use offers great potential to reduce emissions and increase the removal of GHG emission from the
atmosphere. Agriculture and forestry have the potential to do this, including through afforestation,
reforestation, bioenergy use with carbon capture, use and storage. Afforestation, reforestation and
peatland restoration are near-term priorities if their potential is to be fully utilised for reaching net-zero GHG
emission objectives by 2050. Countries will require net-negative CO2 emissions in order to reach net-zero
GHG emissions by 2050 with CO2 emission falling lower in net-negative territory beyond 2050. Rural
regions will be key for the potential for carbon dioxide withdrawal.
Decisions on land use are currently largely defined by short-term economic criteria, while wider
environmental and social aspects are left aside (OECD, 2019[95]). In light of the ongoing climate crisis and
the fundamental role land use plays in the net-zero emission agenda, there is a clear need to transform
land use to a more sustainable model that works towards multiple well-being objectives. Yet, the potential
for rural development from more sustainable land use still needs to be unlocked. There is a range of
instruments policymakers can use to reduce emissions from land use, including standards and rules for
land management, increasing investments in technologies and research, targeting environmental
outcomes or production practices and payments for the provision of ecosystem services. This section
discusses what rural places can do to manage the opportunities and challenges that follow from
transitioning to more sustainable land use processes and what options arise for rural development in the
process.
Current approaches
There is a range of policy instruments that aim to address climate change and ecosystem degradation on
the land use side. The most common policies can be organised around the categories of regulatory
approaches, i.e. rules and standards for land use planning, economic instruments (taxes, abatement
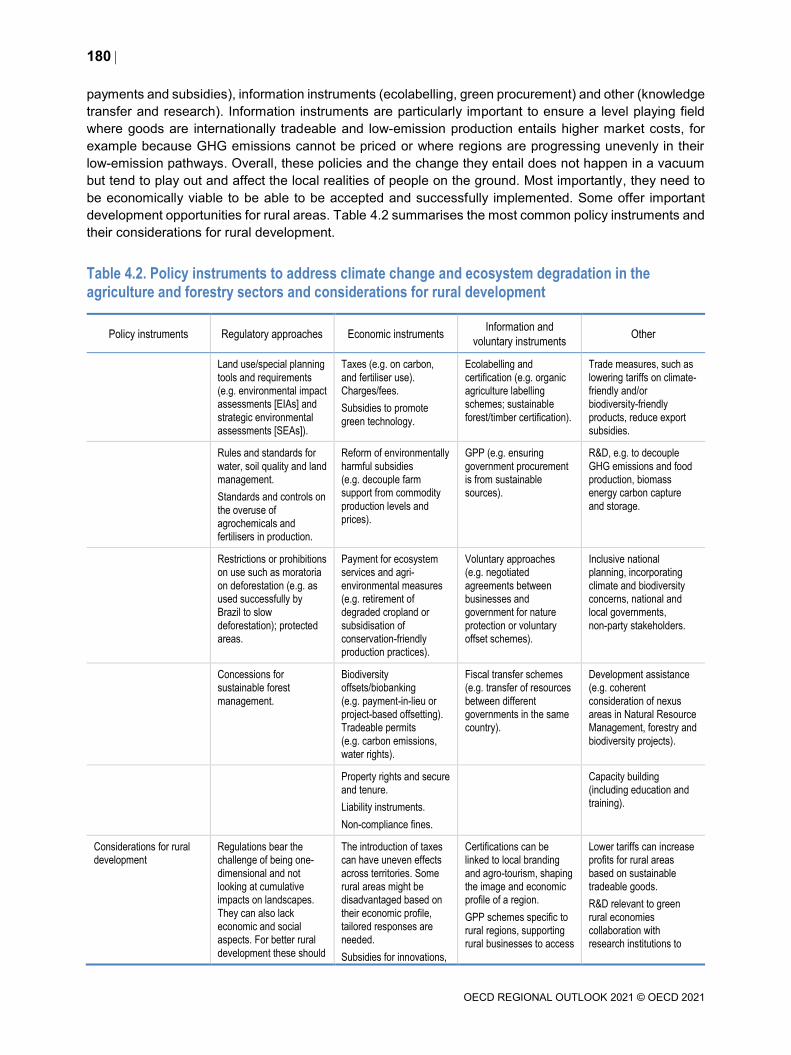
180
OECD REGIONAL OUTLOOK 2021 © OECD 2021
payments and subsidies), information instruments (ecolabelling, green procurement) and other (knowledge
transfer and research). Information instruments are particularly important to ensure a level playing field
where goods are internationally tradeable and low-emission production entails higher market costs, for
example because GHG emissions cannot be priced or where regions are progressing unevenly in their
low-emission pathways. Overall, these policies and the change they entail does not happen in a vacuum
but tend to play out and affect the local realities of people on the ground. Most importantly, they need to
be economically viable to be able to be accepted and successfully implemented. Some offer important
development opportunities for rural areas. Table 4.2 summarises the most common policy instruments and
their considerations for rural development.
Table 4.2. Policy instruments to address climate change and ecosystem degradation in the agriculture and forestry sectors and considerations for rural development
Policy instruments Regulatory approaches Economic instruments Information and
voluntary instruments Other
Land use/special planning
tools and requirements (e.g. environmental impact assessments [EIAs] and
strategic environmental assessments [SEAs]).
Taxes (e.g. on carbon,
and fertiliser use). Charges/fees.
Subsidies to promote
green technology.
Ecolabelling and
certification (e.g. organic agriculture labelling schemes; sustainable
forest/timber certification).
Trade measures, such as
lowering tariffs on climate-friendly and/or biodiversity-friendly
products, reduce export subsidies.
Rules and standards for
water, soil quality and land management.
Standards and controls on
the overuse of agrochemicals and fertilisers in production.
Reform of environmentally
harmful subsidies (e.g. decouple farm support from commodity
production levels and prices).
GPP (e.g. ensuring
government procurement is from sustainable sources).
R&D, e.g. to decouple
GHG emissions and food production, biomass energy carbon capture
and storage.
Restrictions or prohibitions on use such as moratoria
on deforestation (e.g. as used successfully by Brazil to slow
deforestation); protected areas.
Payment for ecosystem services and agri-
environmental measures (e.g. retirement of degraded cropland or
subsidisation of conservation-friendly production practices).
Voluntary approaches (e.g. negotiated
agreements between businesses and government for nature
protection or voluntary offset schemes).
Inclusive national planning, incorporating
climate and biodiversity concerns, national and local governments,
non-party stakeholders.
Concessions for sustainable forest
management.
Biodiversity offsets/biobanking
(e.g. payment-in-lieu or project-based offsetting). Tradeable permits
(e.g. carbon emissions, water rights).
Fiscal transfer schemes (e.g. transfer of resources
between different governments in the same country).
Development assistance (e.g. coherent
consideration of nexus areas in Natural Resource Management, forestry and
biodiversity projects).
Property rights and secure and tenure.
Liability instruments.
Non-compliance fines.
Capacity building (including education and training).
Considerations for rural development
Regulations bear the challenge of being one-
dimensional and not looking at cumulative impacts on landscapes.
They can also lack economic and social aspects. For better rural
development these should
The introduction of taxes can have uneven effects
across territories. Some rural areas might be disadvantaged based on
their economic profile, tailored responses are needed.
Subsidies for innovations,
Certifications can be linked to local branding
and agro-tourism, shaping the image and economic profile of a region.
GPP schemes specific to rural regions, supporting rural businesses to access
Lower tariffs can increase profits for rural areas
based on sustainable tradeable goods.
R&D relevant to green
rural economies collaboration with research institutions to
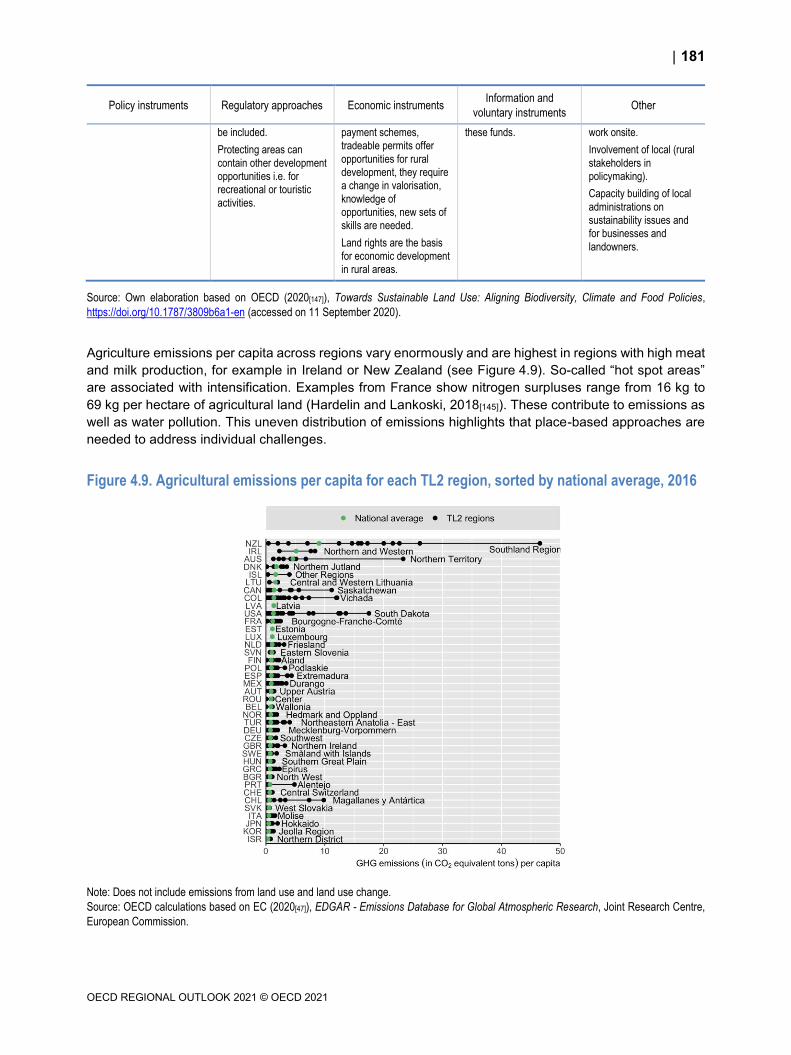
181
OECD REGIONAL OUTLOOK 2021 © OECD 2021
Policy instruments Regulatory approaches Economic instruments Information and
voluntary instruments Other
be included.
Protecting areas can
contain other development opportunities i.e. for recreational or touristic
activities.
payment schemes, tradeable permits offer
opportunities for rural development, they require a change in valorisation,
knowledge of opportunities, new sets of skills are needed.
Land rights are the basis for economic development in rural areas.
these funds. work onsite.
Involvement of local (rural
stakeholders in policymaking).
Capacity building of local
administrations on sustainability issues and for businesses and
landowners.
Source: Own elaboration based on OECD (2020[147]), Towards Sustainable Land Use: Aligning Biodiversity, Climate and Food Policies,
https://doi.org/10.1787/3809b6a1-en (accessed on 11 September 2020).
Agriculture emissions per capita across regions vary enormously and are highest in regions with high meat
and milk production, for example in Ireland or New Zealand (see Figure 4.9). So-called “hot spot areas”
are associated with intensification. Examples from France show nitrogen surpluses range from 16 kg to
69 kg per hectare of agricultural land (Hardelin and Lankoski, 2018[145]). These contribute to emissions as
well as water pollution. This uneven distribution of emissions highlights that place-based approaches are
needed to address individual challenges.
Figure 4.9. Agricultural emissions per capita for each TL2 region, sorted by national average, 2016
Note: Does not include emissions from land use and land use change.
Source: OECD calculations based on EC (2020[47]), EDGAR - Emissions Database for Global Atmospheric Research, Joint Research Centre,
European Commission.
182
OECD REGIONAL OUTLOOK 2021 © OECD 2021
Housing, transportation, energy, water, agriculture, tourism and economic development all make demands
on how land is used. For instance, maximising food production without regard to environmental impacts
can raise GHG emissions and negatively impact habitats (and biodiversity), while increasing carbon
sequestration from afforestation and bioenergy use combined with carbon capture, use and storage
(CCUS) can reduce arable land. Likewise, extending protection in one area might shift deforestation but
can also generate income. Consequently, sustainable land use presents a complex governance challenge
that has to deliver simultaneously on social, economic and environmental policy outcomes as well as a
large number of stakeholders (OECD, 2020[147]). Sectoral policies dealing with only one aspect are usually
not suitable to address interconnected needs. The OECD Principles on Rural Policy stress the need to
promote integrated spatial planning with Principle 4: “Set a forward-looking vision for rural policies”,
requiring land use planning to consider multiple aspects such as environmental quality, waste
management, natural resources development, community attractiveness, climate change mitigation and
adaptation as well as population ageing and out-migration (OECD, 2019[148]).
Regional governments have significant roles to play in transitioning to more sustainable land use, but
co-ordination is needed. While the national governments generally set the over-arching framework,
subnational governments, in particular at the local level, are in charge of spatial planning and land use
policies. In order to co-ordinate well, national and regional governments can establish frameworks to
support integrated planning across functional territories. The Austrian Conference on Spatial Planning, for
example, provides effective co-ordination across levels of government and across policy sectors. Better
integration and co-ordination of policies is particularly important if a wider range of policy instruments is
used to steer land use. Without better co-ordination mechanisms, it will not be possible to align an even
more diverse set of policies to influence land use effectively (OECD, 2017[149]).
Land use policies must pay greater attention to the incentives that other public policies provide to use land.
Whenever possible, policies unrelated to land use should not provide incentives that contradict spatial
objectives. For example, countries that wish to restrict urban sprawl should not provide greater tax
incentives for ownership of single-family homes over multi-family homes. More generally, policies outside
of the planning system should be used to encourage desired forms of spatial development. Tax policies
are of particular importance; higher transport taxes, for example, increase the costs of commuting and thus
provide incentives to live closer to employment centres, in turn encouraging compact development (OECD,
2017[149]).
Managing rural land use change through landscape approaches
Landscape planning approaches can help regional policymakers balance the social, environmental and
productivity goals in their regions. These approaches offer an alternative to siloed measures focusing on
production sectors or farm-level and consider the social, economic and ecological functions of an area
holistically to develop spatial and development plans. They offer an organising framework, facilitate the
investigation of different courses of action and are increasingly being used, for example as part of the
World Bank Forest Action Plan FY16-20 (OECD, 2020[147]). Most importantly, however, they give
practitioners a tool to adapt to local conditions (Sayer et al., 2014[150]).
Supporting landscape approaches in rural regions:
Introduction of new decision-making tools that incorporate non-market values. Multi-criteria
decision analysis (MCDA) is a method that can combine ecological objectives with social and
economic criteria and is able to consider non-market values of ecosystem services. It has been
developed to allow the inclusion of data from various sources (e.g. economic, ecological,
stakeholder opinions) into quantitative decision-making models and has been used extensively for
land use. Multiple Danish studies have shown that the tool is useful to identify areas for land use
improvements through scenarios that allocate weights to environmental services (Vogdrup-
Schmidt, Strange and Thorsen, 2017[151]; 2019[152]). MCDA requires sound sociotechnical design,
183
OECD REGIONAL OUTLOOK 2021 © OECD 2021
reflecting both the social (who participates, when and how) and technical (which methods, which
software) considerations. Overall, MCDA is made up of the following participants: decision-makers
who choose between alternatives; stakeholders who are the source of scores and weights; analysts
who are responsible for design and implementation; and experts who provide advice. Generally,
the method relies heavily on the weights used by the decision-maker and/or relevant stakeholders
(Kennedy et al., 2016[153]).
Improve local data availability. Data can strengthen the design, implementation, monitoring and
enforcement of landscape approaches. Data availability, however, is often a challenge, especially
in rural places. Geographic information systems (GIS) are fundamental tools of local land use
planning. The use of satellite spatial data can provide important insights on land use change, land
degradation and waste. In Europe, the European Environment Agency (EEA) is an important
source of open data on land use, including the CORINE Land Cover (CLC) dataset, which provides
land cover information at a resolution as fine as 100 m. Further, the INSPIRE Directive aims to
create a new EU-wide spatial data infrastructure (Weber, Eilertsen and Suopajärvi, 2017[154]). Apart
from ecological information, cultural, historical and visual aspects are much more difficult to capture
through data.
Landscape approaches can and should integrate regional climate adaptation challenges.
Regional climate modelling can provide important insights into local adaptation challenges. Future
climate-change-induced extreme weather events will get worse in many regions but will also
change in nature. Heat waves and drought will become common in many regions where they have
not been so far. Regional policymakers need to work with climate modellers and local authorities
to harness local knowledge and define potential socio-economic vulnerabilities, on which regional
climate models can provide further insights.
Support through larger rural policy agendas. Rural policy across OECD countries is currently
undergoing a paradigm shift from a sectoral focus to a more place-based approach, underpinned
by the recognition that rural places are diverse and structural changes, such as climate change,
need to be addressed through a multidimensional multi-stakeholder approach (OECD, 2020[19]).
New rural policy approaches can work to support local landscape approaches by giving them the
needed validation and authoritative support recognising the value of working across policy and
administrative barriers. A first step in the right direction is that a number of countries already embed
climate change objectives in local economic development strategies and programmes and seek to
break up silos this way (OECD, 2013[155]). While the EU Rural Development Programme (RDP),
under Pillar II of the Common Agricultural Policy (CAP), is still largely focused on funding individual
actors who undertake different actions (Rega, 2014[156]), its LEADER programme, albeit small,
seeks to address aspects of territorial governance, so important for the implementation of
landscape processes, and the co-ordination of actors that undertake individual actions.
Creating value from ecosystem services
In rural communities, policy drivers and market incentives are still forcing land users to prioritise
unsustainable economic development over climate protection. Market values only capture provisioning
ecosystem services such as the production of food, wood and energy, rather than the full range of
supporting, regulating and cultural ecosystem services, including nutrient cycles, pollination, water
filtration, biodiversity, disaster prevention (i.e. floods), recreation and cultural heritage (Natural Capital
Germany, 2016[157]). In this context, policymakers must find ways to reward the provision of supporting,
regulating and cultural ecosystem services. For instance, in agriculture, market price support is currently
based on crop-specific area payments. Commodity production increases but often at the expense of higher
GHG emissions and a lower capacity of vegetation and soils to absorb carbon. Biodiversity and water
quality may also worsen (Hardelin and Lankoski, 2018[145]) Yet, land use practices consistent with climate
objectives must be scaled up sharply. Redirecting subsidies for agriculture to payments for ecosystem
184
OECD REGIONAL OUTLOOK 2021 © OECD 2021
services, to strengthen CO2 sinks by preserving carbon-rich soils and vegetation and encourage emission
reduction, is one policy option to scale up climate action in rural regions (Box 4.14).
Box 4.14. Ecosystem service payments to integrate GHG reduction in rural regional
development
Payments for ecosystem services (PES) can mitigate climate change through increased carbon
sequestration and reduced emissions. They are most likely to be effective in intensive farming and if
they are outcome-oriented (OECD, 2020[26]). Redirecting subsidies for agriculture in this way would also
remove environmentally harmful subsidies. These actions need to be scaled to reach net-zero GHG
emission objectives for 2050. Options with the highest potential include afforestation, conversion of
cropland to grassland and reduced tilling. Payments per ton of sequestered carbon below estimated
climate costs have induced conversion of agricultural land to forest land, changes in tillage practices
and crop mixes on remaining agricultural land, and changes in livestock management. They often also
contribute to climate adaptation and substantial further climate and well-being benefits.
The conservation of high-carbon ecosystems, such as peatlands, wetlands, mangroves and forests,
has an immediate impact on carbon emissions from land use and multiple benefits for the
conservation of water resources, thereby reducing draught vulnerability, biodiversity, flood control
and halting land degradation recreational benefits (IPCC, 2019[141]). Costa Rica established a
programme of PES that compensates farmers and landowners for forest conservation (OECD,
2020[26]).
Afforestation, reforestation and peatland restoration require more time to deploy their potential. The
need to be scaled up quickly so they can still contribute in time for net-zero emission objectives by
2050. For example, in the UK, afforestation should rise from below 10 000 hectares per year to
27 000 hectares by 2025 rewarded (Climate Change Committee, 2019[77]). Small-scale deployment
with a broad variety of native species, involving local stakeholders, afforestation in degraded areas
can minimise trade-offs for food production and make the most of co-benefits, notably the protection
of biodiversity, resilience against extreme weather events or wildfires and the protection of soils
(IPCC, 2019[141]). The protection of soils and biodiversity in particular are, alongside climate change,
key global environmental challenges. Protecting them is also important to reduce the risk of future
pandemics, as pointed out in Chapter 1.
Sustainable management of forests and biofuel crops can play an important role in reducing
emissions by allowing the use of biomass firing and timber. This requires managing the carbon
stocks in plants and soils. Performance over and above established thresholds can be rewarded.
Firing of biomass from sustainably managed forests and biocrops can also contribute to negative
emissions if combined with carbon capture, use and storage (BECCS). Access to CO2 storage and
the most suitable sites for BECCS plants is key for this purpose (Climate Change Committee,
2019[77]).
Farming practices such as reduced tillage, permanent soil cover, use of organic products, diversified
cropping systems and agroforestry can sequester carbon and reduce GHG emissions from
fertilisers and animal farming. Growing leguminous crops can be used to fertilise the soil and
therefore limit the use of chemical fertilisers. These practices generate further environmental
benefits. The adoption of reduced tillage also reduces soil erosion and has the potential to
significantly improve water quality, aquatic ecosystems and lower air pollution. Farmers in the
Canadian province of Alberta, Canada, can earn carbon offset credits with carbon saving practices
(OECD, 2020[26]).
185
OECD REGIONAL OUTLOOK 2021 © OECD 2021
Result-oriented payments require monitoring with satellite imagery, sensors or other digital tools. Such
tools may also be needed to identify where particular practices, such as afforestation, have the desired
benefits. Policy must support land managers with skills, training and information. Payment schemes
may also need to deal with the caveat that sequestration could be reversed if farmers switch back to
conventional practices or forest cover is lost (IPCC, 2019[141]; OECD, 2020[26]).
Understanding and rewarding the true value of ecosystem benefits, including GHG emission reductions,
offers potentials for rural development – but also holds challenges. A key challenge for policies to protect
ecosystem services, such as ecosystem service payments, is the difficulty to measure and manage them.
Currently, measurements and metrics largely depend on multidimensional spatial and temporal variations.
Furthermore, ill-defined payment schemes can lead to unintended consequences, for instance through the
introduction of fast-growing (often non-native) trees that satisfy carbon sequestration but also consume
much water or cause soil loss (Chan et al., 2017[158]). Hence, while ecosystem service payments can make
sustainable land use practices economically viable, they cannot regulate such practices alone through the
incentives they provide. Other challenges relate to building the required local scale and limited
understanding of and inhibition in switching behaviours. This means that smart policy design needs to
integrate economic incentives as well as potential social and cultural barriers and ecologic consequences.
PES are used to incentivise land managers to provide certain services (conservation and restoration,
water, carbon and biodiversity purposes) in certain regions. Payment schemes related to ecosystem
services often do not pay for the service itself but cover the cost of adopting certain practices to increase
the provision of ecosystem services. This approach may miss rewarding those who already protect
ecosystem services at the time of introduction. Alternative approaches seek to involve producers,
extractors and the supply chain in mitigating impacts, for instance through paying ecosystem “stewards”
(i.e. the land users who are already undertaking positive actions) (Chan et al., 2017[158]). Overall, PES
programmes are diverse and can be public, private or a combination of both, voluntary or mandatory, as
well as small or large in monetary and geographical scale (OECD, 2013[159]; Hardelin and Lankoski,
2018[145]).
The following considerations may serve to link rural development and PES:
Regional policy and linked fiscal transfers need to recognise the fundamental benefit of
ecosystem services from natural asset protection. Assessing, measuring and communicating
positive externalities of ecosystem services can help to promote understanding and inform regional
policymaking. In the UK, the National Ecosystem Assessment framework considers economic
value, health value and shared social value when evaluating changes in ecosystems (UK National
Ecosystem Assessment, 2011[160]). Other examples include the EU Mapping and Assessment of
Ecosystems and their Services (MAES), which aims to build a coherent analytical framework as
well as common typologies of ecosystems for mapping across the EU. As part of this initiative, the
EFESE (L’évaluation française des écosystèmes et des services écosystématiques) in France has
produced six assessments of different ecosystems (OECD, 2020[147]). Despite some success in
using the results of MAES in policy design, a recent EU assessment suggests that unclear
relationship of results and regulatory frameworks in respect to land use/landscape planning, lack
of human and financial resources to make results operational and rigid national legislation not open
to incorporation of the ecosystem services concept hamper the process (Ling et al., 2018[161]).
The geographical scope is an important element for successful PES. The application of PES
is often heterogeneous with a wide variety of approaches, low availability of information and
inconsistent monitoring and evaluation. This limits the needed geographical scope to improve the
sustainability of larger land use systems as participation is often split among small land parcels
and does not correspond to the spatially dependent nature of ecosystem services. National
systems like the one in Mexico (the world’s first) can help address fragmentation. Mexico’s PES
186
OECD REGIONAL OUTLOOK 2021 © OECD 2021
scheme was introduced in 2003, mainly targeting forest ecosystems. The scheme avoided
18 000 ha of deforestation between 2003 and 2007 and reduced forest fragmentation (OECD,
2020[147]). More local approaches to build scale include stimulating co-ordination between land
users across parcel or farm boundaries. One option to incentivise this includes agglomeration
bonus payments for participants co-operating cross-boundary (Wätzold and Drechsler, 2014[162]).
PES should seek to contribute to economic development opportunities more broadly. This
can include driving regional innovation, diversifying the economic base or adding to community
well-being. In Australia, PES are linked with the economic development of Indigenous
communities. One example is earning revenues from carbon credits. Indigenous fire management
practices have reduced the intensity of bushfires, limiting carbon release. Roughly 118 ranger
groups exist across the country and employ over 2 900 Indigenous Australians. Overall, rangers
reported they felt greater individual and community well-being, including self-worth, health, closer
connections to family and country as well as safer communities, strengthened culture, ability to find
meaningful employment, increased respect for women and more role models for younger people
(NIAA, n.d.[163]). These land management practices have also driven technological innovation. For
example, the Yawuru Indigenous community in Western Australia is developing capability in GIS
mapping to support their land and water management (Raderschall, Krawchenko and Leblanc,
2020[164]). Other local benefits from PES can include the development of new leisure services, as
research has shown that tourists prefer rural landscapes of forest patches interlinked with
hedgerows, rather than open landscape dedicated to agriculture or only forest (Hardelin and
Lankoski, 2018[145]). Further benefits can include local branding of the products and advertising
from sustainable land use.
Regional institutions can offer support, provide information, raise awareness and promote
social inclusion. Existing power structures and inequalities can easily undermine equitable
access to PES. In Costa Rica’s national PES programme for instance, participants continue to be
wealthier and more educated landowners, despite the addition of explicit social goals and
associated requirements to include less wealthy and more vulnerable people (Chan et al.,
2017[158]). A review in Indonesia highlighted the importance of local-level working groups to improve
programme uptake, provide information and promote co-ordination between beneficiaries and
other stakeholders (OECD, 2020[147]).
Make PES attractive for land users. Inflexible programmes targeting only one ecosystem service
are often not successful because ecosystem services function as bundles. So-called stacking
approaches allow land managers to receive payments for different ecosystems services provided
in the same area, thereby increasing the cost-effectiveness (Lankoski et al., 2015[165]). Also,
stacking can be used to incentivise the development of higher-quality projects, such as restoring a
wetland instead of simply planting a vegetative buffer. Similarly, bundled payments describe
programmes where participants receive single payments for multiple ecosystem services (Cooley
et al., 2011[166]). The French Flowering Meadows agri-environmental measure (AEM) is known for
its flexibility: the results-oriented scheme allows farmers to choose how they achieve the desired
result. Farmers commit to ensuring that at least four plants from a reference list of 20 species with
high ecological value are in their meadows. The reference list was drafted by a range of
stakeholders, including farmers. Acting in collaboration with other stakeholders to define the goals
and means may also increase motivation (Fleury et al., 2015[167]).
Clearly defined and enforced land tenure is a prerequisite for sustainable land use. If land
users have sufficient certainty over land tenure and clarity about who owns or has the rights to
manage land, they will be more willing to plant trees or restore peatland (Wreford, Ignaciuk and
Gruère, 2017[168]). Lack of clarity can also lead to illegal logging, mining and agricultural activities,
in Brazil, Indonesia and Mexico for example. Supporting and intensifying ongoing land reform
efforts is essential for effective land use policies (OECD, 2020[147]).

187
OECD REGIONAL OUTLOOK 2021 © OECD 2021
Identify land use incentives that are inconsistent with the net-zero-emission transition and
ecosystem services. Switzerland, for example, has reformed its direct payment system by
removing direct payments to livestock farmers and increasing payments to farmers engaging in
extensive upland grazing. Transition payments were used to minimise negative impacts on farmers
and environmental groups helped make sure that potential beneficiaries were informed (OECD,
2017[169]).
Rural regions need to take an active role in the energy and industrial transition
The territorial impact of the energy transition is already present today but will need to increase sharply in
scale. Wind and solar energy make up roughly 11% of total electricity generation today in OECD countries
but their share will have to increase to 50% by 2040, much of it in rural regions (Chapter 3). Remote regions
record a higher share of renewables (51% of total production) than regions that are close to a small or
medium city (33% of total production, Figure 4.10) This means that some rural areas have a clear
comparative advantage in producing renewable electricity, largely because of their favourable geographies
such as elevated and open spaces, biomass availability and low population density. However, not all rural
geographies offer equally favourable conditions. It is therefore important to identify potential based on a
place-based analysis (Phillips, 2019[170]; OECD, 2012[171]; Poggi, Firmino and Amado, 2018[172]). Some
regions, especially those that rely on traditional energy industries, may lose activity to renewable energy
(RE) generation locations, leading to economic losses. In this context, energy transition also needs to
enable economic development through economic diversification and job creation where possible. This
section will outline how rural regions can best benefit from their comparative advantage in RE and which
barriers need to be overcome.
Rural regions have a comparative advantage in producing renewable energy
Rural regions, especially remote ones, are leading in renewable electricity production. Overall, rural
regions account for 43% of the electricity produced in OECD countries, generate 38% of their electricity
using renewable sources. In total, regions far from metropolitan areas account for around half of the total
electricity produced from renewable sources in the OECD, with hydropower being the most used
renewable source (OECD, 2020[173]).
Cost reductions in renewables and innovations have opened up new possibilities for rural areas. Since
2010, the cost of investment for photovoltaics decreased by 82%, for onshore wind by 39% and offshore
wind by 29%. These falling costs have enlarged the possible group of owners with raising the potential for
profit margins. In terms of innovations, offshore wind, in particular, has high potential to meet electricity
demand, offering higher capacity factors due to ever-larger turbines that tap higher, more reliable wind
speeds and floating turbines that open up possibilities for new locations for instance in the North Sea
(IRENA, 2020[174]; IEA, 2019[175]).
Renewable energy can have positive effects on the job market but aspects such as technology type and
regional fit matter. For example, in EU countries, under the scenario of 80% emission reduction by 2050,
deploying wind and solar panels may create one million jobs (direct and indirect) between 2014 and 2050.
The share of jobs across three stages of wind and solar panel deployment will be 40% at the manufacturing
stage, 23% at the installation stage and 37% at the operations and maintenance stage. Estimates however
vary, depending on the learning rate of the technology, fossil fuel prices, energy demand and policy
initiative among others (Ortega et al., 2020[176]).
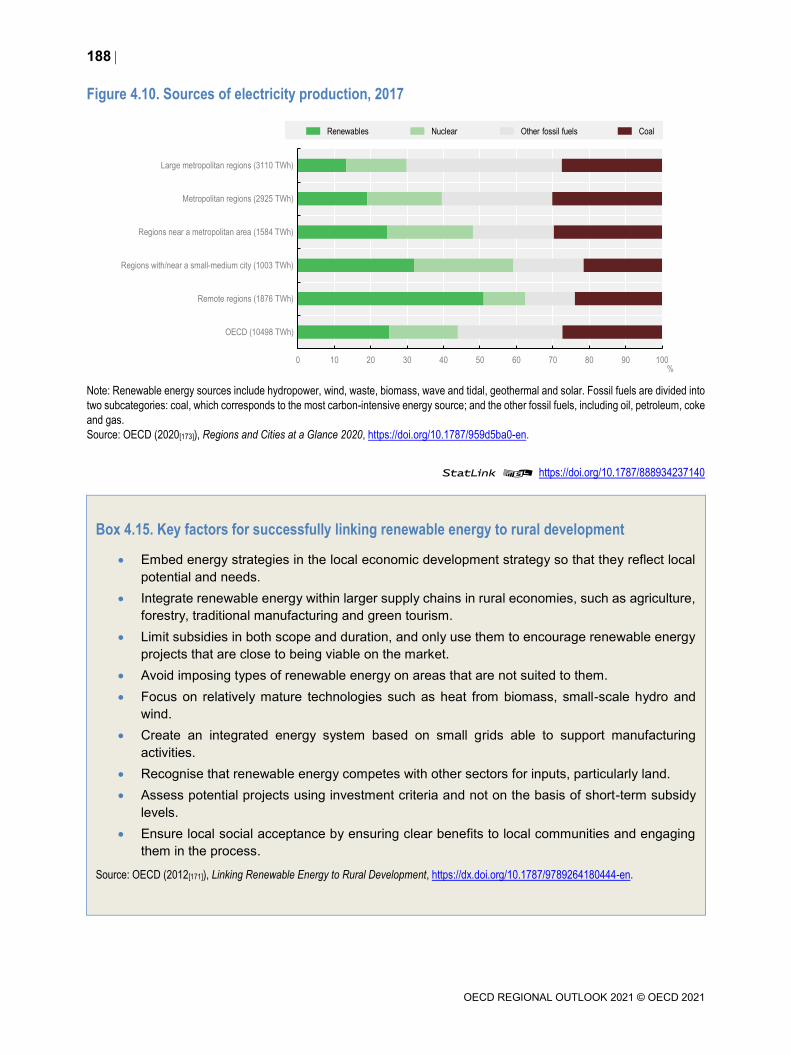
188
OECD REGIONAL OUTLOOK 2021 © OECD 2021
Figure 4.10. Sources of electricity production, 2017
Note: Renewable energy sources include hydropower, wind, waste, biomass, wave and tidal, geothermal and solar. Fossil fuels are divided into
two subcategories: coal, which corresponds to the most carbon-intensive energy source; and the other fossil fuels, including oil, petroleum, coke
and gas.
Source: OECD (2020[173]), Regions and Cities at a Glance 2020, https://doi.org/10.1787/959d5ba0-en.
StatLink 2 https://doi.org/10.1787/888934237140
Box 4.15. Key factors for successfully linking renewable energy to rural development
Embed energy strategies in the local economic development strategy so that they reflect local
potential and needs.
Integrate renewable energy within larger supply chains in rural economies, such as agriculture,
forestry, traditional manufacturing and green tourism.
Limit subsidies in both scope and duration, and only use them to encourage renewable energy
projects that are close to being viable on the market.
Avoid imposing types of renewable energy on areas that are not suited to them.
Focus on relatively mature technologies such as heat from biomass, small-scale hydro and
wind.
Create an integrated energy system based on small grids able to support manufacturing
activities.
Recognise that renewable energy competes with other sectors for inputs, particularly land.
Assess potential projects using investment criteria and not on the basis of short-term subsidy
levels.
Ensure local social acceptance by ensuring clear benefits to local communities and engaging
them in the process.
Source: OECD (2012[171]), Linking Renewable Energy to Rural Development, https://dx.doi.org/10.1787/9789264180444-en.
0 10 20 30 40 50 60 70 80 90 100
OECD (10498 TWh)
Remote regions (1876 TWh)
Regions with/near a small-medium city (1003 TWh)
Regions near a metropolitan area (1584 TWh)
Metropolitan regions (2925 TWh)
Large metropolitan regions (3110 TWh)
%
Renewables Nuclear Other fossil fuels Coal
189
OECD REGIONAL OUTLOOK 2021 © OECD 2021
Developing renewable energy projects to the advantage of rural development is not straightforward.
Evidence is mixed on whether construction, operation and maintenance activities from renewable energy
projects actually support long-term rural development (Clausen and Rudolph, 2020[177]; OECD, 2012[171]).
While there is an indication that renewable energy creates jobs, for instance from operation and
maintenance of equipment, studies suggest that the largest potential for employment is rather indirect and
can develop along the value chains, the reallocation of abandoned facilities or more affordable local energy
can make other production activities possible, including food processing, storage and transport (European
Court of Auditors, 2018[178]; OECD, 2012[171]; ILO, 2019[179]). In addition, considerations on how profits of
local resource use are distributed and retained locally to benefit social and economic development is a
central question (OECD, 2020[26]). Experience with other types of resource extraction including mining has
demonstrated the importance of assuring local community benefits and local participation in resource
development projects to ensure community ownership and acceptability.
Regional level governments play an essential role in decision-making for renewable energy. While
national-level governments are important to establish legal frameworks and supply financial support for
technological innovations, the final decisions about renewable energy deployment are better placed at the
local or regional level. This is because potentials for renewable energy development are unevenly
distributed across countries and closely linked to spatially diverse natural conditions (OECD, 2012[171]).
Conducting economic and social benefits assessments can help decision-makers to understand what kind
of impact renewable energy deployment can have in their regions and help to illustrate regional benefits to
the population (Jenniches, 2018[180]).
Making use of renewable potentials for the benefit of rural regions
Enhance innovation potential
RE deployment can generate innovation (in products, practices and policies) that result in new business
opportunities in rural regions (OECD, 2012[171]). Rural communities can and do engage in R&D related to
RE. Lately, innovations have developed specifically around: transmission and storage (smart grids,
batteries, hydrogen); applications (e-mobility, green ports); and administration and service (legal,
consulting, supply chain, financial service, etc.). Nord-Norge, in Norway, for instance, is drawing on what
it has in abundance – water and energy – in order to produce green hydrogen (IEA-RETD, 2016[181]).
Hydrogen can be used for fossil-free fuel for transportation in shipping and heavy road transport and in
manufacturing, provided it is produced with renewable electricity. As governments seek to increase
hydrogen production, they should involve rural areas.
Other rural regions have engaged in specific RE projects to push the technological frontier towards new
technologies. In Canada, Nova Scotia, one of the poorest Canadian provinces, has started to generate,
store and export tidal energy. As tidal energy is still in the early stages of development, the region seeks
to utilise the early adopter advantage in this industry to develop services exportable to other parts of the
world. To this end, it has set up consulting businesses that support other rural communities with tidal power
potential (IEA-RETD, 2016[181]). In September 2020, the Canadian government announced major
investment in four tidal energy projects – two of them located in Nova Scotia – to build a tidal turbine array
using subsea tidal technology in the Bay of Fundy and research environmental effects at the local university
(Government of Canada, 2020[182]).
Networks are key to foster innovation around RE. Innovations are recognised as co-learning and a
co-creation process, involving many other actors rather than a single “inventor”. Specifically, innovation
normally involves joint and mutually supporting activities that involve regional and local governments,
enterprises, universities and research institutions and users. Key ingredients for regional innovations are
related to building and fostering this network, through good external and internal linkages, local decision-
making power and ownership but also the support at the structural level with regards to investments and
regulatory frameworks (OECD, 2012[171]).

190
OECD REGIONAL OUTLOOK 2021 © OECD 2021
While electricity markets are increasingly integrated as renewables expand, stronger local production of
renewable electricity may support the creation of new forms of activity, complementing present activities
such as agriculture. Examples include processing, storage and transport in food systems. Particular
benefits can be overserved in remote regions that are poorly integrated into energy networks. On the
Scottish Isles, for instance, the installation of local grids has freed residents from dependence on diesel
generators and supported drinking water and heating as well as several new businesses in the tourism
and leisure industry such as restaurants, shops, guest houses and self-catering accommodation (Chmiel
and Bhattacharyya, 2015[183]).
Revive existing facilities
Existing infrastructure and buildings can constitute an opportunity for new companies in the RE sector.
Economic transition and population decline can render existing facilities in rural regions unused.
Reappropriation of existing building and infrastructure for renewables-related businesses can bring these
abandoned places back to life. A factory in Trenton, Nova Scotia, formerly used to build locomotives and
train wagons, is now being used to build windmill pylons. In other countries such as Norway, unused water
distribution pipes and storage find additional usage to drive turbines and generate electricity.
Rural regions which have been involved in carbon-intensive industries might have opportunities to reuse
existing spaces and knowledge for RE development. A recent report attests a significant potential for RE
development in previous coal regions. It states that the deployment of renewable energy technologies in
the coal regions can create up to 315 000 jobs by 2030 and up to 460 000 by 2050 in the EU and that
investments significantly benefit from the availability of infrastructure, land, skills and industrial heritage
already in place. In the region of Visonta, Hungary, 72 500 solar panels have been installed on coal mine
sites, as well as in Klettwitz, Germany, where wind farms are placed on similar sites (Kapetaki and Ruiz,
2020[184]).
Ensure community involvement and benefits
Community ownership and participation in benefits and decision-making support rural development. A case
study from rural Sweden, for instance, found that in the absence of community benefit schemes,
employment opportunities are modest and depend on the presence of local manufactures (Ejdemo and
Söderholm, 2015[185]). Across many OECD countries, there has been resistance to the siting of renewable
energy developments in rural areas. Reasons for these are varied and include biodiversity loss, competing
land use (such as agriculture), as well as visual impacts. Loss of view or increased noise might reduce
property values or opportunities for the tourism industry (Phillips, 2019[170]; Poggi, Firmino and Amado,
2018[172]). To address these issues, two aspects are important: i) procedural fairness, i.e. the ways in which
communities are involved in the RE development decision-making leading to implementation; and ii)
distributional fairness, i.e. fairness in the benefits communities receive from installation as well costs and
risks (González et al., 2016[186]).
Procedural fairness improves trust with large companies or developers. Trust has been highlighted as one
of the most important factors needed to gain the acceptance of RE development by communities (González
et al., 2016[186]). Trust can be increased if residents feel the information is handled with transparency and
accuracy throughout all stages of the project and their concerns are reflected in prospected operations.
Communities who perceive that decisions are made to benefit all as opposed to only a few also display
more trust. Options to improve trust include setting in place inclusive and sufficient mechanisms for
dialogue and consultation as well as ensuring concerns are taken into account in decision-making (Moffat
and Zhang, 2014[187]). This, however, is often lacking because of unbalanced power relations, limited
community capacity and funds (rural communities often have small administrations and tight budgets in
comparison to large energy companies), missing guidance or legal frameworks.
191
OECD REGIONAL OUTLOOK 2021 © OECD 2021
Regional and national policymakers are responsible for clarifying planning and permission processes and
act as mediators. The state of North Rhine-Westphalia, Germany, for instance has set up state-wind energy
dialogues and mediation on renewable energy projects at the local level. The process includes information,
consultation and expert advice as well as round table discussions and an interactive website with
information on planning and permission processes, conducted by an independent agency to ensure
neutrality and unbiased support. Mediations include targeted problem-solving within municipalities and
help negotiate positions, ideas and interests directly. Other German state governments have established
similar platforms. Between them, they exchange ideas, latest developments and experiences (The Climate
Group, 2016[188]).
Benefit-sharing agreements and funds can be critical tools to support rural development from renewable
energy. Such agreements and funds can set rural communities on a path of sustainable development and
increase social acceptability. But the extent to which benefit-sharing agreements and funds deliver robust
results for rural communities differs considerably. Much comes down to the nature of the benefits and
ownership regimes and how they are implemented. The mining industry has a long tradition of benefit-
sharing agreements (Raderschall, Krawchenko and Leblanc, 2020[164]). These can be instructive for
renewables deployment. Local-level benefit-sharing approaches can take a range of forms, including:
Financial payment into some form of “community fund” that can be used for the benefit of local
residents.
The delivery of some form of community “benefit in kind”, such as a facility or infrastructure
improvement.
“Share ownership” or “profit sharing” where residents of an area receive a stake in an energy
development such that community benefits are tied to its performance (Phillips, 2019[170]; Kerr,
Johnson and Weir, 2017[189]).
Among these options, community ownership or co-ownership offer the greatest potential and have
achieved promising results. This increases the potential for benefits (in this case revenues) to be retained
and reinvested in a way that allows for local enhancements of rural communities, reducing dependence on
outside investments or grants. Greater community involvement also fosters the creation of new capacities
and skills, mobilises local skills for renewables deployment, increases local identification and community
cohesion and empowerment (Clausen and Rudolph, 2020[177]). The REScoope MECISE project showed
that a stronger involvement of European citizens is needed to achieve the transition to renewable energy.
Decentralised ownership of projects encourages greater acceptance of renewable energy and benefits
local communities. Renewable energy communities can be made up of natural persons, local authorities
(including municipalities) and SMEs (OECD, 2020[190]). The following mechanisms can help to enable
communities to better exploit these opportunities:
Rural regions and communities might require access to professional/technical skills and
capabilities in order to effectively engage with renewable energy proponents. Power and
information asymmetries can be barriers to community ownership models. In order for smaller
administration or communities to make informed decisions regarding RE developments, they
require access to various expertise including commercial, legal, financial, land use and geological
expertise and data. In some cases, these skills can be developed, in others, they need to rely on
external experts. This advice is expensive and the costs should not be the sole responsibility of the
rural region but part of the project cost. Information sharing platforms and peer learning between
rural regions can further improve capacity building and support peer learning.
Governments set the rules – they must acknowledge capacity and power imbalances and
set fair and transparent processes. Small-scale RE developments still face obstacles including
legal restrictions, disproportionate administrative and planning procedures, lack of finance and
punitive tariffs that inhibit investments – these need to be identified and removed. This happens for
instance because small initiatives do not have the same means to deal with documentation

192
OECD REGIONAL OUTLOOK 2021 © OECD 2021
required in permitting granting procedures. Access to one-stop-shops where small initiatives can
easily submit relevant documentation, have access to technical information and can expect clear
waiting times to get projects approved can be an opportunity to support processes. Targeted
financial tools, revolving funds or favourable loans, grants or tax reductions for investments by
small energy projects can also help. Governments are also crucial in setting up engagement and
consultation (OECD, 2020[190]). This can happen through the provision of guidelines, dialogues,
mediation as well as setting the rules and regulations by which industries operate.
Local benefit-sharing approaches should be guided by a coherent regional policy
framework. Funds should be distributed to meet specific objectives and funding amounts should
be related to these policy aims. Furthermore, local planning can facilitate communities to identify
their assets and opportunities and determine their development priorities through locally-led
governance.
A prominent example that demonstrates the regional and local effects of the energy transition are coal
regions. As coal is often geographically concentrated, highly specialised local economies and strong
cultural identities linked to the industry have developed in these territories. Research on transitioning coal
regions shows that, in the past, policy approaches to phasing out lack coherent long-term visions and
strategies for dealing with unemployment and loss of income. To enable a just transition,2 programmes
need to be carefully designed and adjusted to local contexts. Countries are seeking solutions to these
challenges in different ways and have started initiatives to assist regions with structural changes. In
Germany, the Commission on Growth, Structural Change and Employment suggested steps to address
the impact of the energy transition on mining communities (BMWi, 2019[191]). Further, the EC Coal Regions
in Transition Platform is preparing a roadmap for the phase-out of coal, with a special focus on
strengthening growth and employment for the people living and working in affected regions (EC, 2019[192]).
A promising example is the Latrobe Valley in the state of Victoria, Australia. The region will have to close
all 4 coal power stations over the next 27 years. To secure the economic, social and environmental future
of the region the Victorian Government has established an authority to co-ordinate the transition and has
endowed it with roughly AUD 300 million to promote economic diversification, growth and resilience
through a range of projects (Cain, 2019[193]).
Rural regions face specific challenges and opportunities in the context of decarbonising
transport
Globally, transport accounts for one-quarter of total CO2 emissions, largely driven by freight and rural
passenger transport. Over the past 50 years, CO2 emissions from the transport sector have grown faster
than any other sector (OECD, 2019[95]). Furthermore, worldwide transport CO2 emissions are projected to
grow by 60% by 2050 (ITF, 2019[88]). While eliminating transport emissions is crucial for rural and urban
areas alike, a strong policy focus on urban passenger transport shows results with a projected decrease
of 19% by 2050. Freight and non-urban passenger transport, on the other hand, are projected to increase
in demand – 225% by 2050 (ITF, 2019[88]). This demonstrates the significant policy action needed to
decarbonise rural transportation in order to reach the Paris Agreement.
Overall, policies can reduce emissions from the transport sector through multiple channels:
Reducing the emissions intensity per passenger kilometre travelled, by encouraging a shift from
private vehicles to public transport, biking or walking and by incentivising carpooling or car sharing.
Reducing the emissions intensity per vehicle kilometre travelled, through measures that encourage
shifts from fossil fuel-powered cars to more energy-efficient vehicles such as EVs and increasing
and investing in opportunities for less carbon-intensive energy generation.
Reducing the total number of kilometres travelled, by encouraging fewer trips, for instance by
making increased transportation cost and by incentivising teleworking (OECD, 2020[190]).

193
OECD REGIONAL OUTLOOK 2021 © OECD 2021
Policy solutions for decarbonising transport need to account for spatial configurations. Predominantly rural
and intermediate regions are especially car-dependent. Measures to punish high CO2 emissions, for
instance by increasing tax on fuel to disincentive car use, disproportionally affects rural dwellers.
Redistributive policy from urban to rural areas or differential taxation of car usage, depending on whether
it takes place in rural or urban areas, are solutions to this problem (OECD, forthcoming[194]). In addition, in
places close to cities, improved bicycle infrastructure and service offers as well as improvement in public
transport (express lanes and optimisation of train lines) are important to offer alternatives to car use (The
Shift Project, 2017[195]). Also, electric bicycles can increase the reach of cycling substantially. In remote
places, improving the safety of roads for soft transport can also increase walking and cycling in rural areas,
with important health benefits. In addition, solutions need to focus on zero-carbon engines and
technological innovations to reduce emissions. Low-income households should not be left behind
(Kamruzzaman, Hine and Yigitcanlar, 2015[196]). This section will present key policy consideration for
decarbonising transport in rural regions.
Figure 4.11. Average number of private vehicles per 1 000 inhabitants, by type of region
Note: Latest available data year from 2010 onwards. Definitions of private vehicles differ across countries. For example, the EU defines
passenger vehicles as vehicles “designed...for the carriage of passengers and not exceeding eight seats”.3 The US, on the other hand, defines
passenger vehicles primarily based on weight.4 Consequently, sports utility vehicle (SUVs) are not classified as passenger vehicles, although
they are often used this way in the US. Hence, if they were to be included, US rates would be higher.
Source: OECD Statistics.
StatLink 2 https://doi.org/10.1787/888934237159
Multimodal transport has climate benefits and systems foster rural-urban linkages but require integrated
planning. Multimodal systems enable residents to move around by using a combination of walking, cycling
and public transportation. While these are already widely applied in cities, there are also opportunities for
rural places and small towns, especially those in proximity to urban areas (Porru et al., 2020[197]).
Multimodal transport infrastructure that integrates rural regions into the local labour market of cities located
in their proximity, creates a greater variety in job opportunities and raises the living standards of inhabitants.
In addition to these benefits, multimodal transportation also provides more inclusive mobility by increasing
affordability and adding options for non-divers (i.e. elderly, people with disabilities and youth) (OECD,
2020[198]). Well-designed multimodal transport requires integrating different modes of transportation and
facilitating the switch between transport modes. Unique ticketing systems and other accommodations for
travellers, such as public transport vehicles with space for bikes or scooters, can favour these systems.
0 100 200 300 400 500 600
Remote regions
Non-metro regionsclose to a small city
Non-metro regionsclose to a metro
Metro regions
Large metro regions
No. of vehicles per 1 000 inhabitants
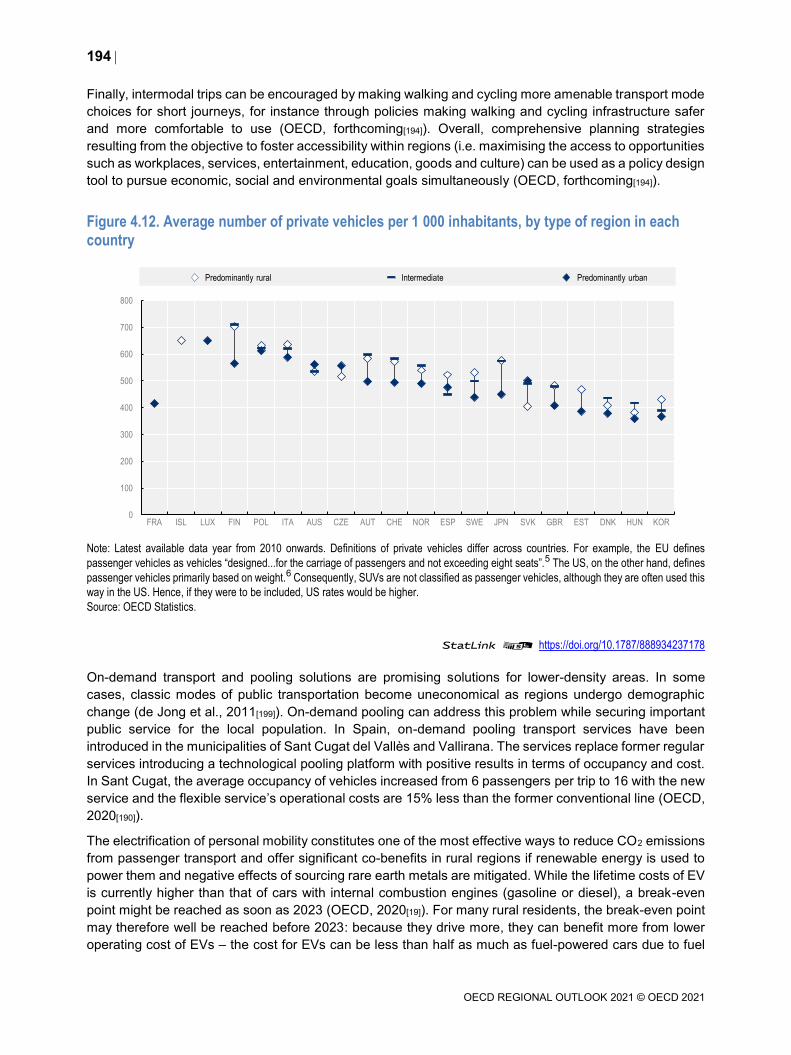
194
OECD REGIONAL OUTLOOK 2021 © OECD 2021
Finally, intermodal trips can be encouraged by making walking and cycling more amenable transport mode
choices for short journeys, for instance through policies making walking and cycling infrastructure safer
and more comfortable to use (OECD, forthcoming[194]). Overall, comprehensive planning strategies
resulting from the objective to foster accessibility within regions (i.e. maximising the access to opportunities
such as workplaces, services, entertainment, education, goods and culture) can be used as a policy design
tool to pursue economic, social and environmental goals simultaneously (OECD, forthcoming[194]).
Figure 4.12. Average number of private vehicles per 1 000 inhabitants, by type of region in each country
Note: Latest available data year from 2010 onwards. Definitions of private vehicles differ across countries. For example, the EU defines
passenger vehicles as vehicles “designed...for the carriage of passengers and not exceeding eight seats”.5 The US, on the other hand, defines
passenger vehicles primarily based on weight.6 Consequently, SUVs are not classified as passenger vehicles, although they are often used this
way in the US. Hence, if they were to be included, US rates would be higher.
Source: OECD Statistics.
StatLink 2 https://doi.org/10.1787/888934237178
On-demand transport and pooling solutions are promising solutions for lower-density areas. In some
cases, classic modes of public transportation become uneconomical as regions undergo demographic
change (de Jong et al., 2011[199]). On-demand pooling can address this problem while securing important
public service for the local population. In Spain, on-demand pooling transport services have been
introduced in the municipalities of Sant Cugat del Vallès and Vallirana. The services replace former regular
services introducing a technological pooling platform with positive results in terms of occupancy and cost.
In Sant Cugat, the average occupancy of vehicles increased from 6 passengers per trip to 16 with the new
service and the flexible service’s operational costs are 15% less than the former conventional line (OECD,
2020[190]).
The electrification of personal mobility constitutes one of the most effective ways to reduce CO2 emissions
from passenger transport and offer significant co-benefits in rural regions if renewable energy is used to
power them and negative effects of sourcing rare earth metals are mitigated. While the lifetime costs of EV
is currently higher than that of cars with internal combustion engines (gasoline or diesel), a break-even
point might be reached as soon as 2023 (OECD, 2020[19]). For many rural residents, the break-even point
may therefore well be reached before 2023: because they drive more, they can benefit more from lower
operating cost of EVs – the cost for EVs can be less than half as much as fuel-powered cars due to fuel
0
100
200
300
400
500
600
700
800
FRA ISL LUX FIN POL ITA AUS CZE AUT CHE NOR ESP SWE JPN SVK GBR EST DNK HUN KOR
Predominantly rural Intermediate Predominantly urban
195
OECD REGIONAL OUTLOOK 2021 © OECD 2021
savings and less maintenance (McMahon, 2018[200]). While important, price incentives are not sufficient
from a rural development perspective. The use of EVs in rural regions offers important opportunities for
rural economies in the context of the needed large-scale deployment of renewables. Sector coupling links
renewable energy production with local consumption closing resource loops. Smart charging of vehicles,
for instance, could be used to absorb electricity produced at almost no cost at moments of abundant
renewable supply and vehicles can provide electricity back to the grid in times of peak demand. Rural
development policymakers should therefore support regulatory policy reforms which foster the integration
of renewables in the electricity market, including high-resolution pricing over time and space, and flexible
demand response, facilitating sector coupling. Further, the sourcing of rare earth metals such as lithium,
graphite and cobalt for the production of EV has reportedly significant negative externalities on local rural
communities and ecosystems (Ballinger et al., 2019[201]). Promoting EVs in one rural region should not
come at the expense of another. Hence, it is important for policymakers to assure that the extraction of
natural resources generates improved and sustainable well-being for producing regions and those local
communities receive adequate benefits.
Uptake of EVs requires investments in charging infrastructure, especially in rural regions. While, new
electric cars typically offer ranges of 400 km or higher, lack of charging stations can pose barriers to rapid
EV adoption. Most governments continue to provide financial incentives to increase demand rather than
investing in charging infrastructure (ITF, 2019[88]). In rural regions, the dispersed nature of residences and
infrastructure requires recharge points to be placed strategically, for instance at supermarkets and schools.
Governments also need to consider increasing demand for total electricity with increasing market
penetration of EVs, which calls for more co-ordinated charging and local reinforcements of grids. Investing
in the construction and upgrading of transport infrastructure is also important to improve the connectivity
between rural and urban areas and boost local economies (OECD, forthcoming[202]). A leading example of
investments in EV infrastructure can be found in Southern Alberta, Canada. In the province, civil society
groups, local businesses and local and regional governments collectively invest in EV charging
infrastructure to facilitate emission reductions, economic development and tourism. The project has
installed 22 charging stations, powered using renewable energy sourced from the region (Peaks To
Prairies, 2019[203]).
Green hydrogen production can offer rural regions specialised in renewable energy an opportunity for
economic development. Many rural economies require heavy-duty transport including trucks, maritime and
aviation to export their tradeable goods. At the same time, projections see road freight activity at least
doubling by 2050, offsetting efficiency gains and increasing road freight CO2 emissions (ITF, 2018[204]).
Green hydrogen can be used to produce alternative fuels for heavy-duty transport and decarbonise
industrial processes at the same time. The first hydrogen-fuelled trucks have recently been put onto the
road and governments start to invest strategically in this technology. Portugal is planning a new solar-
powered hydrogen plant, which will produce hydrogen by electrolysis by 2023. The Netherlands unveiled
a hydrogen strategy in late March, outlining plans for 500 megawatts (MW) of green electrolyser capacity
by 2025 (EBRD, 2020[205]). While prices are not competitive yet, increased demand could reduce the cost.
The fact that renewable energy is required for zero-carbon hydrogen production makes rural regions a key
player in the development of this technology and would allow them to sell it to regions with limited potential
or higher costs of renewable power generation.
Reducing travel demand in rural places can save emissions and has the potential to (re)vitalise local
business and services. Business and service availability play a role in reducing transport-related CO2
emissions in rural regions. The decline in local service provision in areas outside cities often results in the
need for longer trips. Rural people also prefer to use local services. Temporarily subsidising local services
can result in long-term financial viability, while at the same time reducing emissions (Kamruzzaman, Hine
and Yigitcanlar, 2015[196]). Further, innovations such as the collective distribution of e-commerce purchases
to reduce individual travel can be used to support local businesses, as they function as order and receipt
points (The Shift Project, 2017[195]). Other possible interventions involve aspects such as increasing scope
196
OECD REGIONAL OUTLOOK 2021 © OECD 2021
for telework. These can reduce travel and induce local interaction, for instance, if telework is located in
rural co-working places. Germany’s first rural co-working space is situated in Bad Belzig, Brandenburg.
The Community and Concentrated Work in Nature (Coconat) is a temporary work station in a remodelled
estate. Since 2017, it has become a meeting place for digital nomads, urban working tourist and regional
dwellers working for the digital and knowledge industry (Coconat, 2020[206]).
Leaving no region behind
Regions facing job losses in the net-zero-emission transition need to attract new
economic activity
The analysis in Chapter 3 suggests that in most large TL2 regions, employment in sectors at risk of job
loss from the net-zero-emission transition is modest. However, there are significant differences between
regions and some of this employment is geographically concentrated even within these regions. The socio-
economic characteristics of these regions are diverse. As shown in Chapter 3, some regions with
particularly high emissions in industry or power generation have unusually high GDP, though this does not
translate into equally high subjective well-being. In some of these cases, high GDP per capita may relate
to the economic rents from the extraction and processing of fuels and materials. In others, including coal
regions, GDP per capita is below average and poverty and unemployment may already be high. Rural
regions can be particularly vulnerable because economic opportunities are scarcer and life satisfaction
tends to be lower (Box 4.16). Especially for these regions, digitalisation can help overcome some traditional
rural challenges, such as low density and shrinking local markets. However, rural communities often face
more of a lack of digital connectivity than urban areas, reflecting a need to strengthen technological and
civil infrastructure, quality education and skills training (OECD, 2020[19]). For all regions, it is important to
find ways to benefit from the transition to a net-zero-emission economy, attracting new activity that is
consistent with this transition. Doing so in a way that harnesses skills and assets rooted in these regions,
including those inherited from industries that are set to disappear in the transition, can help avoid protracted
regional decade-long decline, often characterised by self-reinforcing emigration of businesses and
workers.
Box 4.16. Economic opportunities tend to be weaker in rural regions
Economic opportunities follow a clear urban gradient
OECD analysis in Cities in the World (OECD/EC, 2020[45]) based on a consistent definition of human
settlements and data from the Gallup World Poll shows that economic opportunities follow an urban
gradient across the world. Some rural regions face difficulties in generating employment and high-
income jobs, which helps explain domestic migration to large cities (OECD/EC, 2020[45]). For example,
regular employment opportunities are significantly more common in cities than elsewhere.
Local conditions for starting a business offer one pathway for economic mobility and renewing economic
activity (OECD/EC, 2020[45]). On average, they tend to be slightly better in more densely populated
areas. In some countries, entrepreneurship-friendly local conditions differ significantly across space.
Rural areas in countries in Central Asia and Eastern Europe especially struggle to provide adequate
conditions for business creations with the share of rural residents believing that their area is a good
place to start a business falling 20-30 percentage points below that of city residents in Bulgaria,
Lithuania, Poland or Russia.
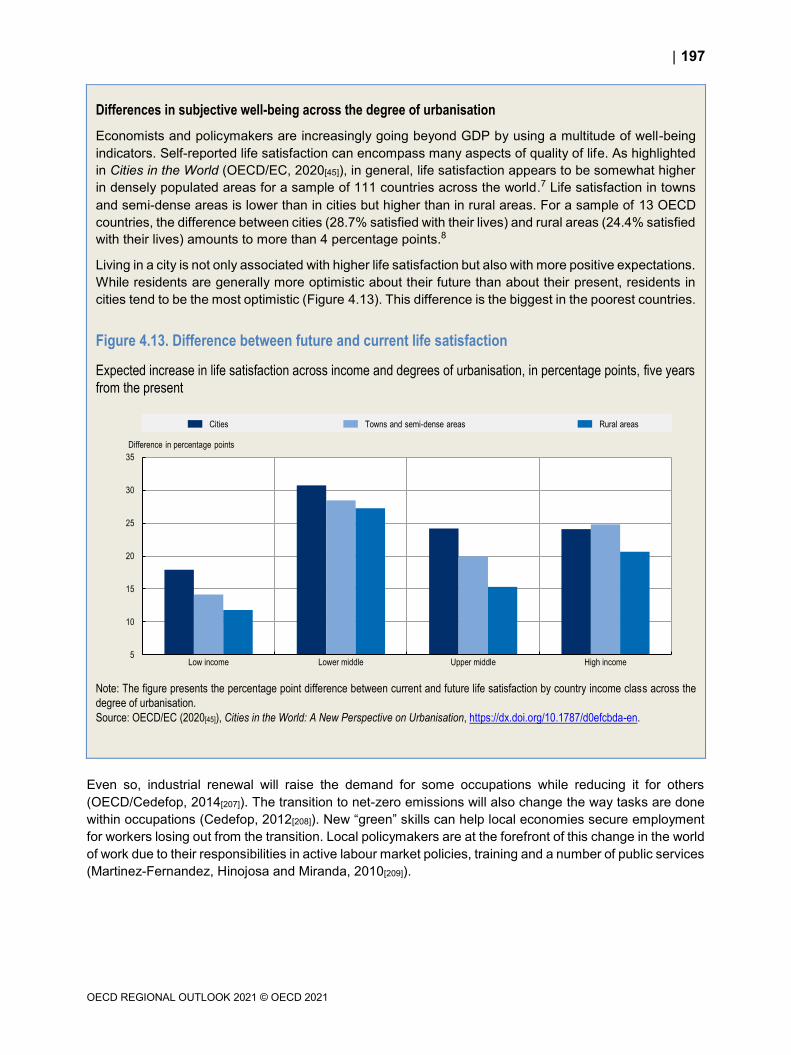
197
OECD REGIONAL OUTLOOK 2021 © OECD 2021
Differences in subjective well-being across the degree of urbanisation
Economists and policymakers are increasingly going beyond GDP by using a multitude of well-being
indicators. Self-reported life satisfaction can encompass many aspects of quality of life. As highlighted
in Cities in the World (OECD/EC, 2020[45]), in general, life satisfaction appears to be somewhat higher
in densely populated areas for a sample of 111 countries across the world.7 Life satisfaction in towns
and semi-dense areas is lower than in cities but higher than in rural areas. For a sample of 13 OECD
countries, the difference between cities (28.7% satisfied with their lives) and rural areas (24.4% satisfied
with their lives) amounts to more than 4 percentage points.8
Living in a city is not only associated with higher life satisfaction but also with more positive expectations.
While residents are generally more optimistic about their future than about their present, residents in
cities tend to be the most optimistic (Figure 4.13). This difference is the biggest in the poorest countries.
Figure 4.13. Difference between future and current life satisfaction
Expected increase in life satisfaction across income and degrees of urbanisation, in percentage points, five years
from the present
Note: The figure presents the percentage point difference between current and future life satisfaction by country income class across the
degree of urbanisation.
Source: OECD/EC (2020[45]), Cities in the World: A New Perspective on Urbanisation, https://dx.doi.org/10.1787/d0efcbda-en.
Even so, industrial renewal will raise the demand for some occupations while reducing it for others
(OECD/Cedefop, 2014[207]). The transition to net-zero emissions will also change the way tasks are done
within occupations (Cedefop, 2012[208]). New “green” skills can help local economies secure employment
for workers losing out from the transition. Local policymakers are at the forefront of this change in the world
of work due to their responsibilities in active labour market policies, training and a number of public services
(Martinez-Fernandez, Hinojosa and Miranda, 2010[209]).
5
10
15
20
25
30
35
Low income Lower middle Upper middle High income
Cities Towns and semi-dense areas Rural areas
Difference in percentage points

198
OECD REGIONAL OUTLOOK 2021 © OECD 2021
Place-based innovation policies need to support and direct structural change
As shown in Regions in Industrial Transition (OECD, 2019[210]), industrial innovation policies based on the
concept of smart specialisation aim to boost economic activity through economic diversification and by
connecting new activities to established local businesses and worker skills. This avoids employment loss
and the emigration of businesses, firms and workers, which tend to characterise persistent regional
decline. Establishing clear priorities in the regional development policy agenda according to this principle
facilitates the allocation of available resources in the face of industrial transitions (McCann and Ortega-
Argilés, 2015[211]). The approach helps avoid spreading public support thinly across a wide spectrum of
activities or to copy experiences that may have been successful elsewhere with no real regard for regional
context. Both have resulted in proliferating small-scale initiatives incapable of exploiting the full benefits of
the positive network externalities characterising industrial clusters that help establish an industrial fabric
that will prevent regional decline (Foray, 2017[212]).
Unlike previous shocks to the industrial fabric of regions, the net-zero-emission transition allows identifying
economic activities that are likely to suffer employment losses or substantial technological or business
model transformations well in advance, making this approach particularly useful to prepare regional
transitions. To be able to anticipate the transition, a clear timetable for phasing out industrial activities that
are inconsistent with the transition or require a major transformation is useful. Such a timetable can remove
uncertainty, avoid risks of stranded assets and can be based on scenario analysis. For example, countries
in the Powering Past Coal Alliance, committed to exiting coal use in electricity generation by 2030, argue
that this was a cost-effective date for high-income countries to pursue efforts to limit global warming to
1.5°C.
Smart specialisation has two main characteristics:
First, a smart specialisation strategy (S3) consists of identifying the economic activities that have
potential, based on established local resources, including worker skills, infrastructure, local
technology and other comparative advantages, and prioritise the development of these sectors
through innovative activities or technologies. Selection criteria can include a critical mass of
companies in a specialisation, innovation capacity, clustering and entrepreneurial dynamics. The
consistency of smart specialisation with the net-zero emission transition is critical (Asheim,
Grillitsch and Trippl, 2017[213]).
Second, the choice of the activities that will receive government support should be based on the
evidence collected through the interaction of key stakeholders (central, regional and local
governments, businesses and higher education institutions). The aim is to explore and assess new
activities and their possible development trajectories as well as their policy needs. The search for
and discovery of new activities is known as the entrepreneurial discovery process (Foray, David
and Hall, 2009[214]).
Successful industrial transformation needs to rest on the participation of local actors and an
evidence-based approach
Engaging stakeholders to identify investment priorities for smart specialisation requires an inclusive and
interactive bottom-up process in which participants from different environments uncover and produce
information about potential new activities. Most regions are endowed with important innovation actors,
such as higher education institutions, innovative businesses, the regional and local governments and civil
society. Their knowledge is however often fragmented over sites and organisations. Smart specialisation
processes, therefore, introduce a range of tools to foster collaboration, such as working groups, advisory
boards, partnerships and public-private committees. Recent approaches argue that stakeholder
engagement should be built together with evidence-based analyses, such as studies relating local to global
scientific, technological and economic trends (Kroll, 2015[215]).
199
OECD REGIONAL OUTLOOK 2021 © OECD 2021
A key question is whether governments have the right governance mechanisms to build long-lasting broad
partnerships with private sector actors. Arguably, the process of smart specialisation has been most
successful in the Northern countries, e.g. Sweden, home to high-quality institutions and strong existing
innovation networks. Leveraging multi-stakeholder networks to identify future-oriented priority areas can
however also work in moderately innovative regions. The Pomorskie region in Poland provides an example
of a well-designed entrepreneurial discovery process within an environment that lacks a legacy of strong
collaborative ties (Box 4.17).
Box 4.17. Stakeholder engagement for smart specialisation in Pomorskie, Poland
The Pomorskie regional government took a collaborative approach to the development of smart
specialisation priorities through the entrepreneurial discovery process. Smart specialisation investment
priorities in Pomorskie were identified largely through a bottom-up process entailing the following main
steps:
Step 1: An economic diagnostic of key regional strengths and weaknesses, accompanied by
public consultation and the formation of partnerships.
Step 2: A call for proposals to research and industry stakeholders for joint smart specialisation
projects.
Step 3: An initial assessment of proposals by a selection board composed of national and
international experts and a public hearing. The selection took into account global trends, market
potential, economic and technological potential, a domestic and international benchmarking, the
proposed strategy and action plan, and the potential of the partnership. This led to a narrowing
down to six specialisations and partnerships.
Step 4: Four smart specialisations were selected.
Step 5: An implementation plan was set up for each specialisation.
Step 6: Partnership agreements with priority access to EU funding were established for each
specialisation.
Source: OECD (2019[216]), “Local entrepreneurship ecosystems and emerging industries: Case study of Pomorskie, Poland”,
https://doi.org/10.1787/8fd63992-en (accessed on 30 November 2020).
The OECD report on Broad-Based Innovation Policy for all Regions (OECD, 2020[217]) has shown that
regional development agencies can play an important role in fostering innovation. In Andalusia, Spain, for
example, the regional Innovation and Development Agency (IDEA) has been instrumental in strengthening
the capacities of the aerospace industry. It provided a platform for universities and companies to realise
that researchers could develop prototypes with local SMEs. With the Centre for Technological Innovation
and Advanced Aeronautical and Naval Manufacturing (CFA), the region then provided a place and
infrastructure where collaboration can take place (OECD, 2020[217]).
Building consensus around future specialisations can help target policy instruments better to serve
transition-consistent structural transformation. These policy instruments include support for firms to
become more innovative and to encourage knowledge exchange and collaboration. University-industry
partnerships can be supported through collaborative research tools such as grants and innovation
vouchers. The OECD evaluation of the smart specialisation academy in Värmland has indeed shown that
the co-operation between the regional government and the local university – in this case with a formal
agreement – has been important to identify future activities that build on regional strengths and research
and development capacities.

200
OECD REGIONAL OUTLOOK 2021 © OECD 2021
Regulatory or fiscal incentives strengthen the engagement of local actors for regional innovation and
collaboration. Examples are direct funding to businesses for R&D or R&D tax credits, which are mostly
provided at the national level. At the regional level, R&D contract opportunities can help develop innovative
products or organisational practices that can increase productivity. Universities can also receive funding
from the government to support spin-offs and academic entrepreneurship, one good way to spur
entrepreneurial dynamism in the region. Open research laboratories or student hiring are additional
instruments to support exchange between industry and university. Important preconditions to make
collaboration instruments work are adequate and sustainable funding, clear rules on property rights and
confidentiality issues, and sufficient trust among actors. An example of a university taking a leadership role
in local industrial transitions comes from Northeast Ohio in the US (Box 4.18).
Regions that transform their industries to become consistent with the net-zero GHG emissions need to
take into account international contexts when activities are subject to international competition. For
example, zero-emission consistent steel production faces higher costs than conventional steel production.
Carbon border adjustments are one option (OECD, 2020[218]); integrating trade agreements could include
environmental criteria while minimising compliance costs (Bellmann and van der Ven, 2020[219]). Else,
government incentives to decarbonise these industries may need to be designed to keep them competitive
(DIW, 2018[220]). Another approach may be for regions hosting similar activities to work together across
international borders, for example in maritime port regions.
Box 4.18. How higher education institutions play a role in industrial transition
In Akron, Ohio, in the US, a university mobilised its industrial heritage to build an advanced research centre
In the 1970s and 1980s, large tire companies based in Akron struggled with international competition,
leading to closures and layoffs. Due to the large share of jobs represented by the rubber and tire
manufacturers, plant closures had a severe effect on the city’s and the region’s well-being. Although
the government, businesses and citizens also played important roles, the University of Akron played a
key role in attracting new employment by further developing its polymer and material science labs.
These labs were still intact from Akron’s industrial period.
The university began expanding the number of students and making partnerships with innovative
industries and the Ohio government. The latter invested an initial USD 2.1 billion into funding
technological companies’ partnerships with research institutions. One major outlet of university
research has been in technologies relevant for the green transition yet drawing on established skills,
such as pollution measurement instruments, clean energy sensors and fuel-cell polymer development.
Source: OECD (2018[221]), Job Creation and Local Economic Development 2018: Preparing for the Future of Work,
https://dx.doi.org/10.1787/9789264305342-en; Ledebur, L. and J. Taylor (2008[222]), “A restoring prosperity case study: Akron, Ohio”,
https://www.brookings.edu/wp-content/uploads/2016/06/200809_Akron.pdf; Van Agtmael, A. and F. Bakker (2016[223]), “How cities can use
local colleges to revive themselves”, https://www.theatlantic.com/business/archive/2016/03/cities-colleges-akron-polymers/472881/.
As outlined in the OECD report Regions in Industrial Transition (2019[210]), policymakers can support digital
take-up by people, firms and local governments. They can help firms and their workers acquire digital
competencies and support business innovation networks. Policy instruments can include targeted loans
and vouchers to small firms. Training support can include a mix of support activities, events, webinars,
counselling and training programmes to foster digital competencies. These programmes often have a
specific focus on SMEs, as they frequently lag in the adoption of digital technologies.

201
OECD REGIONAL OUTLOOK 2021 © OECD 2021
Prompt remediation and restoration of contaminated sites, especially when mining activities are
abandoned, support ecological redevelopment as well as economic development on brownfield sites with
access to infrastructure and increase the local economic attractiveness for new business development
(Sartor, 2018[224]). Mining companies should establish appropriate financial mechanisms for the
remediation of past damage to land and water resources. If individual companies’ resources are
insufficient, this should be financed by revenues from a charge on the mining industry as a whole (OECD,
2013[225]).
Skills mapping can help identify skill needs for industrial transitions
Skills anticipation and assessment help identify skill needs in future investment priority areas in regions in
industrial transition and in accordance with projected labour market trends by sector, local area and/or
occupation. Indeed, in regions facing industrial transition, it is often uncertain how the skills of former
“brown” workers are transferable to emerging jobs, particularly those in low-carbon sectors (OECD,
2019[210]). Skill mapping does not always require new institutions, as many OECD countries already have
sectoral skills councils, observatories and skills advisory bodies that could play the role (OECD/Cedefop,
2014[207]). The region of Wallonia, Belgium, has entrusted detailed skills mapping exercises to the region’s
public employment service (Box 4.19).
Box 4.19. Industry and skills mapping by the Public Employment Service in Wallonia
Wallonia’s Public Employment Service is undertaking a prospective analysis – the Le Forem study – to
identify local skill needs in strategic business areas. The objective of the exercise is to develop
appropriate training offers for Wallonia’s strategic and future-oriented economic activities and to
communicate the identified skill needs to relevant audiences. The analysis first classifies future
occupations and associated core skills in eight sectors. It then identifies a set of related skills that could
subsequently arise from developing the sectors. The approach follows a four-step qualitative process:
1. Analytical staff from the Public Employment Service produce reports to identify the sectors in
which economic activities of strategic future importance take place.
2. A panel of experts consisting of directors of local skills centres, firm managers, Le Forem
account managers and representatives of sector associations answers to a set of questions that
are then included in the sector reports. The objective is to detect activity/sectoral trends in the
chosen eight sectors and their effects on occupations.
3. Based on the received inputs, the skills required for each occupation are identified. To this end,
expert workshops, organised by occupation, identify key evolution factors and the potential
evolution scenarios. They then select the most likely (or desired) scenario, also identifying the
associated skill needs.
4. The local training department receives the results of the analysis in order to start designing
appropriate training programmes. The results are also published and sent to the education
authorities.
The sectors and associated industries value the programme since they themselves do not have the
capacity or resources to undertake such an extensive study.
Source: OECD (2019[210]), Regions in Industrial Transition: Policies for People and Places, https://dx.doi.org/10.1787/c76ec2a1-en.
202
OECD REGIONAL OUTLOOK 2021 © OECD 2021
On-the-job training helps laid-off workers to settle in new employment structures
Reflecting strategically on existing skills and making use of them to transform local industrial specialisation
so it becomes consistent with the net-zero-emission transition can help avoid depreciation of skills and
make training in green skills correspond with local job creation (OECD, 2019[210]). The OECD Programme
on Local Economic and Employment Development (LEED) has highlighted that green skills can take the
form of industry-specific technical skills as well as transversal skills. Transversal skills include technological
knowledge (e.g. energy efficiency), innovation management as well as “transversal generic skills” to
support worker transitions (OECD/Cedefop, 2014[207]; OECD, 2017[226]). Green skills will be required across
occupations and economic sectors, and play an important role in local industrial transitions (OECD,
2017[226]). “Greening” of skills is likely to require upskilling, as low-carbon sectors are estimated to require
more skills than carbon-intensive industries. It can help accelerate transitions, for example in waste
management systems. It has been highlighted that transferring workers to new jobs and providing on-the-
job training at a new place of employment should be given priority over external and/or additional retraining
programmes to avoid large-scale training programmes being set up without a connection to job prospects.
Such on-the-job training may therefore be a good candidate to receive government funding and facilitate
the transition (IDDRI, 2017[227]).
Policies to support redundant workers may include entrepreneurial training. However, it should be noted
that only a limited share (2%-3%) of displaced workers typically return to work by starting a business
(OECD/EC, 2017[228]). Although findings vary, overall, start-ups supported in this way have relatively high
survival rates, though they require multifaceted support, including coaching (Caliendo, 2016[229]).
Governments can tailor local employment services to the needs of regions in industrial
transition
Several regions across the OECD have supported workers in transitioning to quality employment in other
more sustainable sectors or production methods. In Flanders, Belgium, the Public Employment Service
has given discretion to local employment offices to create partnerships with local labour market actors as
highlighted in the OECD report Boosting Skills for Greener Jobs in Flanders, Belgium (2017[226]). The
Flanders Public Employment Service has developed a green transition plan that has integrated
sustainability principles and green skills in training programmes to tackle some of the region’s sustainability
risks (Box 4.20). Paired together, local delivery flexibility and green Active Labour Market Policy (ALMP)
strategies can help vulnerable workers from “brown” industries benefit from locally relevant ALMP
packages.
Box 4.20. Employment services in Flanders, Belgium, gear programmes to green transitions
VDAB is introducing sustainability principles across ALMPs and giving local offices policy discretion
VDAB, the regional public employment service of Flanders, has developed an array of ALMPs focused
on the green transition. Training modules have started integrating relevant skills. For instance, in the
construction sector, programmes have begun integrating sustainable building and energy efficiency
methods. VDAB has also developed a building centre to co-ordinate with actors in the sector and
develop training curricula.
VDAB has also given more flexibility to its regional employment offices to deliver services. District
offices can forge their own partnerships with local labour market actors and develop their own strategies
based on local realities. The OECD has highlighted that multiple sectors in the region, such as chemical
product manufacturing, basic metal manufacturing and energy production may face pressure. In 2010,
these sectors represented 16.7% of employment in Flanders and upwards of 18% in West Flanders.

203
OECD REGIONAL OUTLOOK 2021 © OECD 2021
Local offices can anticipate these risks and develop strategies with local companies and unions to
ensure processes and workers adopt more sustainable methods. These partnerships complement
VDAB’s large-scale job matching programme and Flanders-wide programmes, as well as VDAB’s links
with Belgium’s federal employment service.
Source: OECD (2017[226]), Boosting Skills for Greener Jobs in Flanders, Belgium, https://dx.doi.org/10.1787/9789264265264-en; OECD
(2018[221]), Job Creation and Local Economic Development 2018: Preparing for the Future of Work, OECD Publishing, Paris,
https://dx.doi.org/10.1787/9789264305342-en.
Engaging employers – and SMEs in particular – is essential for training success and lifelong
learning in the workplace
Engaging employers in skills development programmes can help align skills programmes with industry
needs. Subnational leadership can play a role in reaching out to employers to promote awareness and
participation in training (OECD/ILO, 2017[230]). Regions undergoing sharp employment transitions can liaise
with firms to understand their skill requirements. For example, OECD firm interviews conducted in
Pomorskie, Poland, found the training system may not dispense the green economy skills needed in the
local labour market (OECD, 2017[231]). Training systems may benefit from greater knowledge of local skill
needs, particularly in emerging green industries or occupations, so that they can be integrated into their
learning programmes.
The OECD has highlighted that governments should encourage firms to support their workforce through
lifelong learning (OECD, 2018[221]). This can take the form of workplace or offsite training and education,
ensuring workers both grow professionally and absorb skills needed to green production processes
(OECD/Cedefop, 2014[207]). Production methods will need to become more energy and resource-efficient,
calling for upskilling. Development training subsidies, training vouchers and tax incentives can encourage
upskilling.
Given the strong presence of small firms in regions in industrial transition, it is important to involve SMEs
in skills planning. This can take the form of encouraging their participation in regional employer councils or
co-designing and co-delivering training initiatives with vocational colleges, universities and large firms. The
OECD has highlighted the role of integrating SMEs into such networks to foster trust-based relationships
among firms, knowledge sharing and generate opportunities to pool training costs and resources.
Compensation policies
As regional industries face sustainability risks, some workers will be able to retrain and find gainful
employment, while others will be unable to find work with equal pay and conditions. Some workers will
require prolonged economic support. Specific economic compensation for laid-off workers supports the
well-being of communities during transitions. In economically undiversified regions, tax revenues and local
incomes can be heavily reliant on high emission companies and their employees (OECD, 2019[210]). Worker
compensation policies specific to industrial transitions support workers financially in addition to
unemployment benefits and compensation rights established in national labour law. Compensation can
range from temporary unemployment schemes to early retirement.
Extensive case studies in France, Germany, Italy, Slovenia and Sweden found that policy co-ordination,
stakeholder involvement, rapid and appropriate taking of action, comprehensive communication to workers
and adequate financing are key (OECD, 2020[190]). Many workers were largely hesitant to travel for work
or relocate, highlighting the relevance of local labour market solutions. Younger or higher skill workers are
more willing to move for work and find employment more easily. Companies, unions and governments
need to take into account the preferences and situations of workers with widely different backgrounds, as
well as local labour market realities.

204
OECD REGIONAL OUTLOOK 2021 © OECD 2021
Summing up: Policy conclusions from Chapter 4
While climate-related objectives and strategies are largely international and national, subnational
governments need to take the action that is appropriate for local characteristics.
Multi-level climate governance and finance need to identify goals for government levels and regions to
reach national 2050 net-zero emission targets. Subnational governments are responsible for most of public
spending and investment in sectors with a direct impact on climate change and other environmental issues.
Transfers between subnational governments need to be linked to climate policy goals, so
subnational governments have the incentives and resources to make all their policy actions
consistent with reaching net-zero emissions.
Revenue and spending systems should be overhauled, including subnational green budgeting and
GPP and by eliminating environmentally harmful subsidies. For example, property taxes on land
and buildings and land value capture mechanisms can be designed to avoid urban sprawl and
finance infrastructure.
Borrowing frameworks should make room for investment serving the net-zero emission transition.
Cities account for most energy consumption and emissions. In high-income cities, emissions inherent in
the consumption of goods and services are often a multiple of locally generated emissions.
Effective governance integrates climate policy at three levels:
o National – National urban policy (NUP) frameworks need to co-ordinate sectoral policies to
make them consistent with net-zero emissions and improve well-being.
o Metropolitan – metropolitan governance can enable coherent urban planning, housing and
transport policies towards the 2050 net-zero GHG emission target, while improving well-being,
across municipalities belonging to the same travel-to-work area.
o Intracity – policies to decarbonise urban planning, transport and housing should be
co-ordinated across municipalities belonging to the same commuting areas.
o Intercity – networks of cities should be supported to share knowledge across cities.
Cities hold large potentials for modular technologies to integrate solar rooftop photovoltaic panels,
small-scale wind turbines and heat pumps. Regulating energy markets is at the national level but
cities can influence uptake.
Encouraging walking, cycling and public transport to substitute individual car use, in addition to
electrifying passenger transport, reduces materials needs and can avoid inequality, as well as
deliver broad well-being benefits. Location-based connectivity and accessibility indicators can
guide cost-effective improvements.
The spread of low-density neighbourhoods should be avoided to reduce network costs.
Provided it replaces individual car use, digital-based on-demand ride-sharing lowers CO2
emissions, energy consumption and congestion while saving on costs and boosting innovation.
The adoption of the local circular economy framework can help accelerate reaching the net-zero
transition at a lower cost, for example in building materials, by eliminating food waste and by
encouraging a sharing economy.
Cities should address specific adaptation challenges with vulnerability risk assessments (and local
resilience action plans).
Road use charges need to replace fuel taxes as fossil fuels are phased out and reflect mobility
costs, such as congestion.
All new buildings must be consistent with net-zero emissions in energy use and all existing
buildings refurbished to such standards within 25 years.
205
OECD REGIONAL OUTLOOK 2021 © OECD 2021
Because of their natural endowments, rural regions are pivotal in the transition to a net-zero-emission
economy and in building resilience to climate change.
Decisions on land use are still largely defined by short-term, sector-specific production objectives.
Integrating social, economic and ecological impacts is key.
Ecosystem services in rural regions are key to the foundations of well-being in urban and rural
regions alike. Understanding and rewarding ecosystem benefits, including for GHG emission
reductions, for example through afforestation that is respectful of local biodiversity, offers potential
for rural development.
Rural regions need to take an active role in the energy transition to benefit from renewables
potentials. Through rural community participation in benefits and decision-making, trust can be built
to support the needed expansion of renewables.
Rural regions may benefit the most from the low operating costs of EVs but need to pay particular
attention to charging infrastructure and affordable vehicles. On-demand shared transport and
pooling solutions are also promising solutions.
Smart specialisation can help leave no region behind as high-carbon activity is phased out. It aims at
connecting new activities to established local businesses, worker skills and assets, involved in activities
that need to be phased out and beyond.
Regions facing job losses in the net-zero-emission transition need to attract new economic activity
that is consistent with this transition. Building consensus around future specialisations through
early local stakeholder involvement, such as from higher education, innovative businesses,
regional and local governments, is key.
Skills mapping can help identify future occupations and associated skill needs for industrial
transitions. Engaging local employers in skill development programmes can help align them with
industry needs for the net-zero-emission transition.
Ageing and less-educated populations, as well as less diversified economic activity, put some
rural regions at particular risk. Innovative processes around agriculture, reinforcing regional
urban-rural connections, for example in food markets, renewable energies and new modes of
transportation, can be attractive options to diversify.
206
OECD REGIONAL OUTLOOK 2021 © OECD 2021
References
Ahl, A. et al. (2020), “Exploring blockchain for the energy transition: Opportunities and
challenges based on a case study in Japan”, Renewable and Sustainable Energy Reviews,
Vol. 117, https://doi.org/10.1016/j.rser.2019.109488.
[74]
Amsterdam Smart City (2017), Roadmap Circular Land Tendering,
https://amsterdamsmartcity.com/projects/roadmap-circular-land-tendering (accessed on
30 March 2020).
[112]
Asheim, B., M. Grillitsch and M. Trippl (2017), “Smart specialisation as an innovation-driven
strategy for economic diversification”, in Radosevic, S. et al. (eds.), Advances in the Theory
and Practice of Smart Specialisation, Academic Press.
[213]
Assemblée Nationale française (2019), Loi d’Orientation des mobilités (LOM),
http://www.assemblee-nationale.fr/dyn/15/dossiers/loi_orientation_mobilites.
[101]
Atkinson, R. (2019), “A policymaker’s guide to road user charges”, Information Technology and
Innovation Foundation, Washington, DC, https://itif.org/publications/2019/04/22/policymakers-
guide-road-user-charges (accessed on 24 May 2020).
[107]
Ballinger, B. et al. (2019), “The vulnerability of electric vehicle deployment to critical mineral
supply”, Applied Energy, Vol. 255/113844, https://doi.org/10.1016/j.apenergy.2019.113844.
[201]
Bellmann, C. and C. van der Ven (2020), “Greening regional trade agreements on non-tariff
measures through technical barriers to trade and regulatory co-operation”, OECD Trade and
Environment Working Papers, No. 2020/04, OECD Publishing, Paris,
https://dx.doi.org/10.1787/dfc41618-en.
[219]
Berkowitz, P., Á. Rubianes and J. Pieńkowski (2017), “The European Union’s experiences with
policy conditionalities”, Background paper prepared for the Seminar “Conditionalities for More
Effective Public Investment” held 28 April 2017 at the OECD Headquarters, Paris.
[14]
BMWi (2019), Commission on Growth, Structural Change and Employment, Federal Ministry for
Economic Affairs and Energy, https://www.bmwi.de/Redaktion/EN/Publikationen/commission-
on-growth-structural-change-and-employment.html (accessed on 29 October 2019).
[191]
Bulkeley, H. and V. Castán Broto (2013), “Government by experiment? Global cities and the
governing of climate change”, Transactions of the Institute of British Geographers, Vol. 38/3,
pp. 361-375, http://dx.doi.org/10.1111/j.1475-5661.2012.00535.x.
[65]
Bureau of Environment (2018), Final Energy Consumption and Greenhouse Gas Emissions in
Tokyo (FY2015), Tokyo Metropolitan Government,
http://www.kankyo.metro.tokyo.jp/en/climate/index.files/GHG2015.pdf (accessed on
30 November 2020).
[122]
C40 Cities (2019), “Cities leading the way: Seven climate action plans to deliver on the Paris
Agreement”.
[39]
C40 Cities (2018), Consumption-based GHG Emissions of C40 cities,
https://resourcecentre.c40.org/resources/consumption-based-ghg-emissions.
[49]
C40 Cities (2016), C40 Cities Good Practice Guide, City Climate Funds - Sustainable
Infrastructure Finance Network.
[28]

207
OECD REGIONAL OUTLOOK 2021 © OECD 2021
C40 Cities (2016), Deadline 2020: How Cities Will Get the Job Done, C40 Cities,
https://www.c40.org/researches/deadline-2020.
[66]
Cain, K. (2019), “A just transition for La Trobe Valley”, https://www.climate-transparency.org/wp-
content/uploads/2019/03/17.Karen-Cain-Latrobe-Valley-Authority-February-2019.pdf.
[193]
Caliendo, M. (2016), “Start-up subsidies for the unemployed: Opportunities and limitation”, IZA
World of Labor, Vol. 200, http://dx.doi.org/10.15185/izawol.200.
[229]
Cass, N. and J. Faulconbridge (2016), “Commuting practices: New insights into modal shift from
theories of social practice”, Transport Policy, Vol. 45, pp. 1-14,
http://dx.doi.org/10.1016/j.tranpol.2015.08.002.
[92]
Cedefop (2012), Green Skills and Environmental Awareness in Vocational Education and
Training, https://www.cedefop.europa.eu/en/publications-and-resources/publications/5524.
[208]
Chan, K. et al. (2017), “Payments for ecosystem services: Rife with problems and potential - For
transformation towards sustainability”, Ecological Economics, pp. 110-122,
http://dx.doi.org/10.1016/j.ecolecon.2017.04.029.
[158]
Chmiel, Z. and S. Bhattacharyya (2015), “Analysis of off-grid electricity system at Isle of Eigg
(Scotland): Lessons for developing countries”, Renewable Energy, Vol. 81, pp. 578-588,
http://dx.doi.org/10.1016/j.renene.2015.03.061.
[183]
City of Adelaide (2019), Carbon Neutral Adelaide: Status Report,
https://d31atr86jnqrq2.cloudfront.net/docs/report-carbon-neutral-adelaide-status-report-july-
19.pdf?mtime=20200130131451&focal=none (accessed on 15 November 2020).
[86]
City of Amsterdam (2020), New Amsterdam Climate - Roadmap - Amsterdam Climate Neutral
2050.
[30]
City of Bristol (2020), One City Climate Strategy: A Strategy for a Carbon Neutral, Climate
Resilient Bristol by 2030, https://www.bristolonecity.com/wp-content/uploads/2020/02/one-
city-climate-strategy.pdf.
[76]
City of Frankfurt (2014), European Green Capital Award, Environmental Indicator 11,
https://www.frankfurt-greencity.de/de/vernetzt/auszeichnungen/european-green-capital-
award/.
[37]
Clausen, L. and D. Rudolph (2020), “Renewable energy for sustainable rural development:
Synergies and mismatches”, Energy Policy, Vol. 138,
http://dx.doi.org/10.1016/j.enpol.2020.111289.
[177]
Climate Bonds Initiative (2015), Scaling up green bond markets for sustainable development,
https://www.climatebonds.net/files/files/GB-Public_Sector_Guide-Final-1A.pdf.
[27]
Climate Change Committee (2019), Net Zero - The UK’s Contribution to Stopping Global
Warming, https://www.theccc.org.uk/publication/net-zero-the-uks-contribution-to-stopping-
global-warming/ (accessed on 23 October 2019).
[77]
Climate Funds Update (2020), Data Washboard, Heinrich-Böll-Stiftung, Washington, DC, and
ODI.
[17]
208
OECD REGIONAL OUTLOOK 2021 © OECD 2021
Coconat (2020), Coconat - A Workation Retreat, https://coconat-space.com/ (accessed on
23 July 2020).
[206]
Colenbrander, S., M. Lindfield and J. Lufkin (2018), “Financing low carbon, climate-resilient
cities”, Conference: IPCC Cities and Climate Change Science Conference, Edmonton,
Canada.
[16]
Cooley, D. et al. (2011), “Stacking ecosystem services payments: Risks and solutions”, Nicholas
Institute Working Paper, Nicholas Institute for Environmental Policy Solutions.
[166]
Creutzig, F. et al. (2020), “Fair street space allocation: Ethical principles and empirical insights”,
Transport Reviews, Vol. 40/6, pp. 711-733,
http://dx.doi.org/10.1080/01441647.2020.1762795.
[104]
Crippa, M. et al. (forthcoming), “Global anthropogenic emissions in habited areas: Patterns,
trends, and challenges”.
[44]
de Jong, W. et al. (2011), “The key factors for providing successful public transport in low-density
areas inThe Netherlands”, Research in Transportation Business & Management, Vol. 2,
pp. 65-73.
[199]
Deasley, S. and C. Thornhill (2017), Affordable Warmth, Clean Growth: Action Plan for a
Comprehensive Buildings Energy Infrastructure Programme, Frontier Economics, Energy
Efficiency Infrastucture Group, https://www.theeeig.co.uk/media/1026/fe-energy-efficiency-
final-clean-250917.pdf (accessed on 9 February 2021).
[130]
DIW (2018), “Filling gaps in the policy package to decarbonise production and use of materials”. [220]
Downing, P. and J. Ballantyne (2007), Tipping Point or Turning Point? Social Marketing and
Climate Change, Ipsos Mori, https://www.ipsos.com/sites/default/files/publication/1970-
01/sri_tipping_point_or_turning_point_climate_change.pdf (accessed on 26 March 2020).
[108]
EBRD (2020), “Is green hydrogen the sustainable fuel of the future?”,
https://www.ebrd.com/news/2020/is-green-hydrogen-the-sustainable-fuel-of-the-future-.html.
[205]
EC (2021), “Sustainable finance and EU taxonomy: Commission takes further steps to channel
money towards sustainable activities”, European Commission,
https://ec.europa.eu/commission/presscorner/detail/en/ip_21_1804.
[33]
EC (2020), EDGAR - Emissions Database for Global Atmospheric Research, Joint Research
Centre, European Commission.
[47]
EC (2019), Coal Regions in Transition, European Commission,
https://ec.europa.eu/energy/en/topics/oil-gas-and-coal/EU-coal-regions/coal-regions-transition
(accessed on 29 October 2019).
[192]
EC (2019), Energy Performance of Buildings Directive, European Commission,
https://ec.europa.eu/energy/topics/energy-efficiency/energy-efficient-buildings/energy-
performance-buildings-directive_en (accessed on accessed on 30 November 2020).
[129]
EC (2016), “Strategy and approach to SPP in the municipality of Copenhagen”, GPP in Practice,
No. 64, European Commission,
https://ec.europa.eu/environment/gpp/pdf/news_alert/Issue64_Case_Study_130_Copenhage
n.pdf.
[38]
209
OECD REGIONAL OUTLOOK 2021 © OECD 2021
EC (2014), European Procurement Directives, European Commission,
https://ec.europa.eu/environment/gpp/eu_public_directives_en.htm.
[35]
EC (n.d.), EU Buildings Database, European Commission, https://ec.europa.eu/energy/eu-
buildings-database_en (accessed on accessed on 30 November 2020).
[128]
EEA (2019), The First and Last Mile - The Key to Sustainable Urban Transport, European
Environment Agency, https://www.eea.europa.eu/publications/the-first-and-last-mile
(accessed on 11 March 2020).
[89]
Ehnert, F. et al. (2018), “Urban sustainability transitions in a context of multi-level governance: A
comparison of four European states”, Environmental Innovation and Societal Transitions,
Vol. 26, pp. 101-116, http://dx.doi.org/10.1016/j.eist.2017.05.002.
[9]
Ejdemo, T. and P. Söderholm (2015), Wind power, regional development and benefit-sharing:
The case of Northern Sweden, Elsevier Ltd, http://dx.doi.org/10.1016/j.rser.2015.03.082.
[185]
Ellen MacArthur Foundation (2020), The Circular Economy In Detail,
http://www.ellenmacarthurfoundation.org/explore/the-circular-economy-in-detail (accessed on
27 July 2020).
[117]
Ellen MacArthur Foundation (2019), Cities and Circular Economy for Food. [131]
Ellen MacArthur Foundation (2019), Completing the Picture: How the Circular Economy Tackles
Climate Change.
[109]
EnergyCities (2019), Climate-Maintreaming Municipal Budgets, https://energy-cities.eu/wp-
content/uploads/2019/01/climate-mainstreaming_budgets.pdf.
[42]
Environment and Climate Change Canada (2020), Pan-Canadian Framework on Green Growth
and Climate Change - Third Annual Synthesis Report on the Status of Implementation,
http://publications.gc.ca/collections/collection_2020/eccc/En1-77-2019-eng.pdf.
[18]
European Court of Auditors (2018), Renewable Energy for Sustainable Rural Development:
Significant Potential Synergies, but Mostly Unrealised, Special Report - pursuant to Article
287(4), second subparagraph, TFEU.
[178]
FAO (2020), Urban Food Agenda , Food and Agriculture Organization of the United Nations,
http://www.fao.org/urban-food-agenda/en/ (accessed on 30 September 2020).
[132]
Fath, B. (ed.) (2019), “Permaculture”, Encyclopedia of Ecology (Second Edition), Vol. 4, pp. 559-
567, https://doi.org/10.1016/B978-0-12-409548-9.10598-6.
[80]
Figueiredo, L., T. Honiden and A. Schumann (2018), “Indicators for Resilient Cities”, OECD
Regional Development Working Papers, No. 2018/02, OECD Publishing, Paris,
https://dx.doi.org/10.1787/6f1f6065-en.
[140]
Finnish Ministry of Transport and Communications (2019), Law Amending the Transport
Services Act, https://www.finlex.fi/fi/laki/alkup/2019/20190371#Pidp446384592.
[100]
Fleury, P. et al. (2015), ““Flowering Meadows”, a result-oriented agri-environmental measure:
Technical and value changes in favour of biodiversity”, Land Use Policy, Vol. 46, pp. 103-114,
http://dx.doi.org/10.1016/j.landusepol.2015.02.007.
[167]
210
OECD REGIONAL OUTLOOK 2021 © OECD 2021
Foray, D. (2017), “The economic fundamentals of smart specialization strategies”, in
Radosevic, S. et al. (eds.), Advances in the Theory and Practice of Smart Specialization,
Academic Press.
[212]
Foray, D., P. David and B. Hall (2009), “Smart specialisation - The concept”, in Knowledge for
Growth: Prospects for Science, Technology and Innovation: Selected Papers,
http://ec.europa.eu/invest-in-research/monitoring/knowledge_en.htm. (accessed on
6 November 2019).
[214]
Frantzeskaki, N. et al. (2017), Urban Sustainability Transitions, Taylor and Francis,
http://dx.doi.org/10.4324/9781315228389.
[94]
González, A. et al. (2016), “On the acceptance and sustainability of renewable energy projects -
A systems thinking perspective”, Sustainability 8, http://dx.doi.org/10.3390/su8111171.
[186]
Government of Canada (2020), City of Guelph and Wellington County, Ontario,
https://www.infrastructure.gc.ca/cities-villes/videos/guelph-eng.html.
[133]
Government of Canada (2020), Government invests in Canada’s tidal power industry,
https://www.canada.ca/en/natural-resources-canada/news/2020/09/government-invests-in-
canadas-tidal-power-industry.html (accessed on 13 October 2020).
[182]
Greater London Authority (2018), London Environment Strategy,
https://www.london.gov.uk/sites/default/files/london_environment_strategy_0.pdf (accessed
on 30 November 2020).
[121]
Green, J. and P. Newman (2017), “Citizen utilities: The emerging power paradigm”, Energy
Policy, Vol. 105, pp. 283-293, https://doi.org/10.1016/j.enpol.2017.02.004.
[71]
Hakelberg, L. (2014), “Governance by diffusion: Transnational municipal networks and the
spread of local climate strategies in Europe”, Global Environmental Politics, Vol. 14/1,
pp. 107-129, http://dx.doi.org/10.1162/GLEP_a_00216.
[68]
Hall, D., H. Cui and N. Lutsey (2017), “Electric vehicle capitals of the world: What markets are
leading the transition to electric?”, The International Council of Clean Transportation,
http://www.theicct.org/EV-capitals-of-the-world (accessed on 22 May 2020).
[106]
Hardelin, J. and J. Lankoski (2018), “Land use and ecosystem services”, OECD Food,
Agriculture and Fisheries Papers, No. 114, OECD Publishing, Paris,
https://dx.doi.org/10.1787/c7ec938e-en.
[145]
Hojckova, K. et al. (2020), “Entrepreneurial use of context for technological system creation and
expansion: The case of blockchain-based peer-to-peer electricity trading”, Research Policy,
Vol. 49/8, https://doi.org/10.1016/j.respol.2020.104046.
[73]
Hsu, A. et al. (2018), “Bridging the emissions gap - The role of nonstate and subnational actors”,
in Emissions Gap Report 2018, United Nations Environment Programme, Nairobi,
http://www.un.org/Depts/Cartographic/english/htmain.htm (accessed on 12 March 2020).
[2]
IDDRI (2017), Lessons from Previous ’Coal Transitions’, https://www.iddri.org/en/publications-
and-events/report/lessons-previous-coal-transitions (accessed on 25 November 2020).
[227]
IEA (2019), World Energy Outlook 2019, OECD Publishing, Paris,
https://doi.org/10.1787/caf32f3b-en (accessed on 8 October 2020).
[175]
211
OECD REGIONAL OUTLOOK 2021 © OECD 2021
IEA (2016), Energy Technology Perspectives 2016, OECD Publishing, Paris,
https://doi.org/10.1787/energy_tech-2016-en (accessed on 27 March 2020).
[87]
IEA (2014), Capturing the Multiple Benefits of Energy Efficiency: A Guide to Quantifying the
Value Added, International Energy Agency, Paris, https://dx.doi.org/10.1787/9789264220720-
en.
[124]
IEA-RETD (2016), Revitalisation of Local Economy by Development of Renewable Energy
(REvLOCAL) - Norway, http://iea-retd.org (accessed on 13 October 2020).
[181]
ILO (2019), A Just Transition Towards a Resilient and Sustainable Rural Economy, International
Labour Organization.
[179]
ILO (2015), Guidelines for a Just Transition towards Environmentally Sustainable Economies
and Societies for All, International Labour Organization,
https://www.ilo.org/wcmsp5/groups/public/---ed_emp/---
emp_ent/documents/publication/wcms_432859.pdf.
[232]
IPBES (2019), The global assessment report on biodiversity and ecosystem services,
https://ipbes.net/sites/default/files/2020-
02/ipbes_global_assessment_report_summary_for_policymakers_en.pdf.
[146]
IPCC (2019), Climate Change and Land - Summary for Policymakers, Intergovernmental Panel
on Climate Change, https://www.ipcc.ch/site/assets/uploads/2019/08/4.-
SPM_Approved_Microsite_FINAL.pdf (accessed on 14 August 2019).
[141]
IRENA (2020), “How falling costs make renewables a cost-effective investment”, International
Renewable Energy Agency, https://www.irena.org/newsroom/articles/2020/Jun/How-Falling-
Costs-Make-Renewables-a-Cost-effective-Investment (accessed on 8 October 2020).
[174]
ITF (2020), “Shared Mobility Simulations for Lyon”, International Transport Forum Policy Papers,
No. 74, OECD Publishing, Paris, https://doi.org/10.1787/031951c3-en (accessed on
26 May 2020).
[98]
ITF (2019), ITF Transport Outlook 2019, OECD Publishing, Paris,
https://doi.org/10.1787/transp_outlook-en-2019-en.
[88]
ITF (2018), Shared Mobility Simulations for Dublin, OECD Publishing, Paris,
https://doi.org/10.1787/e7b26d59-en (accessed on 4 May 2020).
[97]
ITF (2018), “Towards Road Freight Decarbonisation: Trends, Measures and Policies”,
International Transport Forum Policy Papers, No. 64, OECD Publishing, Paris,
https://doi.org/10.1787/3dc0b429-en (accessed on 26 May 2020).
[204]
ITF/OECD (2020), Leveraging Digital Technology and Data for Human-centric Smart Cities: The
Case of Smart Mobility, Report for the G20 Digital Economy Task Force, https://www.itf-
oecd.org/sites/default/files/docs/data-human-centric-cities-mobility-g20.pdf.
[99]
Jacobs-Crisioni, C., L. Dijkstra and A. Kucas (2020), “Does density foster efficient public
transport? A network expansion simulation approach”, Manuscript submitted for publication.
[90]
Jäger-Waldau, A. et al. (2020), “How photovoltaics can contribute to GHG emission reductions of
55% in the EU by 2030”, Renewable and Sustainable Energy Reviews, Vol. 126,
https://doi.org/10.1016/j.rser.2020.109836.
[81]
212
OECD REGIONAL OUTLOOK 2021 © OECD 2021
Jenniches, S. (2018), Assessing the regional economic impacts of renewable energy sources - A
literature review, Elsevier Ltd, http://dx.doi.org/10.1016/j.rser.2018.05.008.
[180]
Kamruzzaman, M., J. Hine and T. Yigitcanlar (2015), “Investigating the link between carbon
dioxide emissions and transport-related social exclusion in rural Northern Ireland”,
International Journal of Environmental Science and Technology, Vol. 12,
http://dx.doi.org/10.1007/s13762-015-0771-8.
[196]
Kapetaki, Z. and P. Ruiz (2020), “Clean energy technologies in coal regions: Opportunities for
jobs and growth - Deployment potential and impacts”, No. EUR 29895 EN, Publications Office
of the European Union, Luxembourg, http://dx.doi.org/10.2760/063496.
[184]
Kaza, S. et al. (2018), What a Waste 2.0: A Global Snapshot of Solid Waste Management to
2050, World Bank, Washington, DC, http://dx.doi.org/10.1596/978-1-4648-1329-0.
[111]
Kennedy, C. et al. (2016), “Optimizing land use decision-making to sustain Brazilian agricultural
profits, biodiversity and ecosystem services”, Biological Conservation, Vol. 204, pp. 221-230,
http://dx.doi.org/10.1016/j.biocon.2016.10.039.
[153]
Kennedy, C. et al. (2018), “Keeping global climate change within 1.5°C through net negative
electric cities”, Current Opinion in Environmental Sustainability, Vol. 30, pp. 18-25,
https://doi.org/10.1016/j.cosust.2018.02.009.
[69]
Kerr, S., K. Johnson and S. Weir (2017), “Understanding community benefit payments from
renewable energy development”, Energy Policy, Vol. 105, pp. 202-211,
https://doi.org/10.1016/j.enpol.2017.02.034.
[189]
Kraus, S. and N. Koch (2020), “Effect of pop-up bike lanes on cycling in European cities”. [103]
Kroll, H. (2015), “Efforts to implement smart specialization in practice - Leading unlike horses to
the water”, European Planning Studies, Vol. 23/10, pp. 2079-2098,
http://dx.doi.org/10.1080/09654313.2014.1003036.
[215]
Lankoski, J. et al. (2015), “Environmental Co-benefits and Stacking in Environmental Markets”,
OECD Food, Agriculture and Fisheries Papers, No. 72, OECD Publishing, Paris,
https://doi.org/10.1787/5js6g5khdvhj-en (accessed on 2 October 2020).
[165]
Ledebur, L. and J. Taylor (2008), “A restoring prosperity case study: Akron, Ohio”,
https://www.brookings.edu/wp-content/uploads/2016/06/200809_Akron.pdf.
[222]
Lee, T. and H. Jung (2018), “Mapping city-to-city networks for climate change action: Geographic
bases, link modalities, functions, and activity”, Journal of Cleaner Production, Vol. 182,
pp. 96-104, http://dx.doi.org/10.1016/j.jclepro.2018.02.034.
[67]
Lincoln Institute (2018), “Land value capture: Tools to finance our urban future”,
https://www.lincolninst.edu/sites/default/files/pubfiles/land-value-capture-policy-brief.pdf
(accessed on 5 November 2020).
[23]
Ling, M. et al. (2018), A Review of Ecosystem Service Valuation Progress and Approaches by
the Member States of the European Union, UNEP-WCMC Cambridge, UK,
https://ec.europa.eu/environment/nature/capital_accounting/pdf/eu_es_valuation_review.pdf.
[161]

213
OECD REGIONAL OUTLOOK 2021 © OECD 2021
López Prol, J. and K. Steininger (2020), “Photovoltaic self-consumption is now profitable in
Spain: Effects of the new regulation on prosumers’ internal rate of return”, Energy Policy,
Vol. 146, https://doi.org/10.1016/j.enpol.2020.111793.
[70]
Lovelace, R. et al. (2020), “Is the London Cycle Hire Scheme becoming more inclusive? An
evaluation of the shifting spatial distribution of uptake based on 70 million trips”,
Transportation Research Part A: Policy and Practice, Vol. 140, pp. 1-15,
http://dx.doi.org/10.1016/j.tra.2020.07.017.
[102]
Martinez-Fernandez, C., C. Hinojosa and G. Miranda (2010), “Greening Jobs and Skills: Labour
Market Implications of Addressing Climate Change”, OECD Local Economic and Employment
Development (LEED) Papers, No. 2010/2, OECD Publishing, Paris,
https://dx.doi.org/10.1787/5kmbjgl8sd0r-en.
[209]
Matsumoto, T. et al. (2019), “An integrated approach to the Paris climate Agreement: The role of
regions and cities”, OECD Regional Development Working Papers, No. 2019/13, OECD
Publishing, Paris, https://dx.doi.org/10.1787/96b5676d-en.
[3]
McCann, P. and R. Ortega-Argilés (2015), “Smart specialization, regional growth and
applications to European Union Cohesion Policy”, Regional Studies, Vol. 49/8, pp. 1291-
1302, http://dx.doi.org/10.1080/00343404.2013.799769.
[211]
McMahon, J. (2018), “Electric vehicles cost less than half as much to drive”,
https://www.forbes.com/sites/jeffmcmahon/2018/01/14/electric-vehicles-cost-less-than-half-
as-much-to-drive/#7edac46f3f97.
[200]
Merk, O. et al. (2012), “Financing Green Urban Infrastructure”, OECD Regional Development
Working Papers, No. 2012/10, OECD Publishing, Paris,
https://dx.doi.org/10.1787/5k92p0c6j6r0-en.
[21]
Millward-Hopkins, J. et al. (2017), “Uncovering blind spots in urban carbon management: The
role of consumption-based carbon accounting in Bristol, UK”, Regional Environmental
Change, Vol. 17/5, pp. 1467-1478, http://dx.doi.org/10.1007/s10113-017-1112-x.
[50]
Ministry of Environment and Food of Denmark (2020), Sustainable Procurement,
https://eng.mst.dk/sustainability/sustainable-consumption-and-production/sustainable-
procurement/.
[36]
MLIT (2019), “The study on the impacts of energy efficiency renovations on the physical health
of residents”, https://www.mlit.go.jp/common/001270049.pdf.
[126]
Moffat, K. and A. Zhang (2014), “The paths to social licence to operate: An integrative model
explaining community acceptance of mining”, Resources Policy, Vol. 39/1, pp. 61-70,
http://dx.doi.org/10.1016/j.resourpol.2013.11.003.
[187]
Moreno Monroy, A. et al. (2020), “Housing policies for sustainable and inclusive cities: How
national governments can deliver affordable housing and compact urban development”,
OECD Regional Development Working Papers, No. 2020/03, OECD Publishing, Paris,
https://dx.doi.org/10.1787/d63e9434-en.
[62]
Moreno-Monroy, A., M. Schiavina and P. Veneri (2020), “Metropolitan areas in the world.
Delineation and population trends”, Journal of Urban Economics,
https://doi.org/10.1016/j.jue.2020.103242.
[91]
214
OECD REGIONAL OUTLOOK 2021 © OECD 2021
Municipality of Groningen (2019), “Proposal - City of Groningen for circular and regenerative
cities: Focus on industrial areas as regenerative drivers for the cities of the future”.
[119]
Natural Capital Germany (2016), Ecosystem Services in Rural Areas – Basis for Human
Wellbeing and Sustainable Economic Development - Summary for Decision-makers, Leibniz
University Hanover, Hanover, Helmholtz Centre for Environmental Research – UFZ, Leipzig,
https://www.ufz.de/export/data/global/190551_TEEB_DE_Landbericht_Kurzfassung_engl_we
b_bf.pdf (accessed on 19 August 2019).
[157]
New York City Mayor’s Office of Sustainability (2017), 1.5°C: Aligning New York City with the
Paris Climate Agreement, https://www1.nyc.gov/site/sustainability/codes/1.5-climate-action-
plan.page.
[123]
Newbery, D., D. Reiner and R. Ritz (2018), “When is a carbon price floor desirable? When is a
carbon price floor desirable? Acknowledgements”, Cambridge Working Paper in Economics,
No. 1833, University of Cambridge, Cambridge, https://www.eprg.group.cam.ac.uk/wp-
content/uploads/2018/06/1816-Text.pdf (accessed on 24 April 2019).
[5]
Newman, P. (2020), “COVID, cities and climate: Historical precedents and potential transitions
for the new economy”, Urban Science, Vol. 4/3, p. 29,
http://dx.doi.org/10.3390/urbansci4030032.
[75]
NIAA (n.d.), The Indigenous Ranger Program, National Indigenous Australians Agency,
https://www.niaa.gov.au/indigenous-affairs/environment/indigenous-rangers-working-country
(accessed on 30 September 2020).
[163]
OECD (2020), Broad-based Innovation Policy for All Regions and Cities, OECD Publishing,
Paris, https://dx.doi.org/10.1787/299731d2-en.
[217]
OECD (2020), Climate Finance Provided and Mobilised by Developed Countries in 2013-18,
Climate Finance and the USD 100 Billion Goal, OECD Publishing, Paris,
https://dx.doi.org/10.1787/f0773d55-en.
[15]
OECD (2020), Climate Finance Provided and Mobilised by Developed Countries in 2013-18,
Climate Finance and the USD 100 Billion Goal, OECD Publishing, Paris,
https://dx.doi.org/10.1787/f0773d55-en.
[29]
OECD (2020), “Climate Policy Leadership in an Interconnected World: What Role for Border
Carbon Adjustments?”, OECD, Paris.
[218]
OECD (2020), Decarbonising Urban Mobility with Land Use and Transport Policies: The Case of
Auckland, New Zealand, OECD Publishing, Paris, https://dx.doi.org/10.1787/095848a3-en.
[190]
OECD (2020), Decarbonising Urban Mobility with Land Use and Transport Policies: The Case of
Auckland, New Zealand, OECD Publishing, Paris, https://dx.doi.org/10.1787/095848a3-en.
[198]
OECD (2020), “Financing environmental and energy transitions for regions and cities”, in
Managing Environmental and Energy Transitions for Regions and Cities, OECD Publishing,
Paris, https://doi.org/10.1787/be4b02a7-en.
[43]
OECD (2020), Improving Transport Planning for Accessible Cities, OECD Urban Studies, OECD
Publishing, Paris, https://dx.doi.org/10.1787/fcb2eae0-en.
[93]
215
OECD REGIONAL OUTLOOK 2021 © OECD 2021
OECD (2020), Managing Environmental and Energy Transitions for Regions and Cities, OECD
Publishing, Paris, https://doi.org/10.1787/f0c6621f-en.
[26]
OECD (2020), Managing Environmental and Energy Transitions for Regions and Cities, OECD
Publishing, Paris, https://dx.doi.org/10.1787/f0c6621f-en.
[127]
OECD (2020), OECD Regions and Cities at a Glance 2020, OECD Publishing, Paris,
https://doi.org/10.1787/959d5ba0-en.
[173]
OECD (2020), OECD Survey on Circular Economy in Cities and Regions, OECD, Paris. [134]
OECD (2020), Pan -Canadian Framework on Clean Growth and Climate Change – Third Annual
Synthesis Report on the Status of Implementation, Gpovernment of Canada Publications,
https://dx.doi.org/10.1787/d25cef80-en.
[13]
OECD (2020), Rural Well-being: Geography of Opportunities, OECD Rural Studies, OECD
Publishing, Paris, https://dx.doi.org/10.1787/d25cef80-en.
[19]
OECD (2020), Subnational Governments in the OECD: Key Data, OECD, Paris. [11]
OECD (2020), The Circular Economy in Cities and Regions: Synthesis Report, OECD Urban
Studies, OECD Publishing, Paris, https://dx.doi.org/10.1787/10ac6ae4-en.
[113]
OECD (2020), The OECD Framework for Green Budgeting, OECD, Paris. [40]
OECD (2020), Towards Sustainable Land Use: Aligning Biodiversity, Climate and Food Policies,
OECD Publishing, Paris, https://doi.org/10.1787/3809b6a1-en (accessed on
11 September 2020).
[147]
OECD (2020), Transport Bridging Divides, OECD Urban Studies, OECD Publishing, Paris,
https://dx.doi.org/10.1787/55ae1fd8-en.
[96]
OECD (2019), Accelerating Climate Action: Refocusing Policies through a Well-being Lens,
OECD Publishing, Paris, https://dx.doi.org/10.1787/2f4c8c9a-en.
[95]
OECD (2019), Environment at a Glance Indicators, OECD Publishing, Paris,
https://dx.doi.org/10.1787/ac4b8b89-en.
[115]
OECD (2019), “Financing climate objectives in cities and regions to deliver sustainable and
inclusive growth”, OECD Environment Policy Papers, No. 17, OECD Publishing, Paris,
https://dx.doi.org/10.1787/ee3ce00b-en.
[1]
OECD (2019), Global Material Resources Outlook to 2060: Economic Drivers and Environmental
Consequences, OECD Publishing, Paris, https://dx.doi.org/10.1787/9789264307452-en.
[110]
OECD (2019), “Local entrepreneurship ecosystems and emerging industries: Case study of
Pomorskie, Poland”, OECD Local Economic and Employment Development (LEED) Papers,
No. 2019/05, OECD Publishing, Paris, https://doi.org/10.1787/8fd63992-en (accessed on
30 November 2020).
[216]
OECD (2019), Making Decentralisation Work: A Handbook for Policy-Makers, OECD Multi-level
Governance Studies, OECD Publishing, Paris, https://dx.doi.org/10.1787/g2g9faa7-en.
[4]
OECD (2019), OECD Principles on Urban and Rural Policy, OECD, Paris. [148]
216
OECD REGIONAL OUTLOOK 2021 © OECD 2021
OECD (2019), OECD Territorial Reviews: Hamburg Metropolitan Region, Germany, OECD
Territorial Reviews, OECD Publishing, Paris, https://dx.doi.org/10.1787/29afa27f-en.
[54]
OECD (2019), Public Procurement, OECD, Paris,
https://www.oecd.org/governance/ethics/public-procurement.htm.
[32]
OECD (2019), Regions in Industrial Transition: Policies for People and Places, OECD
Publishing, Paris, https://dx.doi.org/10.1787/c76ec2a1-en.
[210]
OECD (2019), Responding to Rising Seas: OECD Country Approaches to Tackling Coastal
Risks, OECD Publishing, Paris, https://dx.doi.org/10.1787/9789264312487-en.
[137]
OECD (2018), Building Resilient Cities: An Assessment of Disaster Risk Management Policies in
Southeast Asia, OECD Green Growth Studies, OECD Publishing, Paris,
https://dx.doi.org/10.1787/9789264305397-en.
[139]
OECD (2018), Job Creation and Local Economic Development 2018: Preparing for the Future of
Work, OECD Publishing, Paris, https://dx.doi.org/10.1787/9789264305342-en.
[221]
OECD (2018), Rethinking Regional Development Policy-making, OECD Multi-level Governance
Studies, OECD Publishing, Paris, https://dx.doi.org/10.1787/9789264293014-en.
[10]
OECD (2018), Rethinking Urban Sprawl: Moving Towards Sustainable Cities, OECD Publishing,
Paris, https://dx.doi.org/10.1787/9789264189881-en.
[20]
OECD (2017), Boosting Skills for Greener Jobs in Flanders, Belgium, OECD Green Growth
Studies, OECD Publishing, Paris, https://dx.doi.org/10.1787/9789264265264-en.
[226]
OECD (2017), Greening the Blue Economy in Pomorskie, Poland, OECD Green Growth Studies,
OECD Publishing, Paris, https://dx.doi.org/10.1787/9789264281509-en.
[231]
OECD (2017), Investing in Climate, Investing in Growth, OECD Publishing, Paris,
https://dx.doi.org/10.1787/9789264273528-en.
[46]
OECD (2017), “Reforming agricultural subsidies to support biodiversity in Switzerland”, OECD
Environment Policy Papers, No. 8, OECD Publishing, Paris,
https://doi.org/10.1787/53c0e549-en (accessed on 22 June 2020).
[169]
OECD (2017), The Governance of Land Use in OECD Countries: Policy Analysis and
Recommendations, OECD Publishing, Paris, https://doi.org/10.1787/9789264268609-en.
[149]
OECD (2016), OECD Territorial Reviews: The Metropolitan Region of Rotterdam-The Hague,
Netherlands, OECD Territorial Reviews, OECD Publishing, Paris,
https://dx.doi.org/10.1787/9789264249387-en.
[57]
OECD (2016), Water Governance in Cities, OECD Studies on Water, OECD Publishing, Paris,
https://dx.doi.org/10.1787/9789264251090-en.
[135]
OECD (2015), Going Green: Best Practices for Sustainable Procurement, OECD, Paris,
https://www.oecd.org/gov/ethics/Going_Green_Best_Practices_for_Sustainable_Procurement
.pdf.
[31]
OECD (2015), Governing the City, OECD Publishing, Paris,
https://dx.doi.org/10.1787/9789264226500-en.
[56]
217
OECD REGIONAL OUTLOOK 2021 © OECD 2021
OECD (2015), OECD Territorial Reviews: Valle de México, Mexico, OECD Territorial Reviews,
OECD Publishing, Paris, https://dx.doi.org/10.1787/9789264245174-en.
[53]
OECD (2015), OECD Urban Policy Reviews: Mexico 2015: Transforming Urban Policy and
Housing Finance, OECD Urban Policy Reviews, OECD Publishing, Paris,
https://dx.doi.org/10.1787/9789264227293-en.
[60]
OECD (2015), The Metropolitan Century: Understanding Urbanisation and its Consequences,
OECD Publishing, Paris, https://dx.doi.org/10.1787/9789264228733-en.
[55]
OECD (2014), OECD Recommendation on Effective Public Investment Across Levels of
Government, OECD, Paris.
[7]
OECD (2013), Green Growth in Cities, OECD Green Growth Studies, OECD Publishing, Paris,
https://dx.doi.org/10.1787/9789264195325-en.
[125]
OECD (2013), OECD Environmental Performance Reviews: South Africa 2013, OECD
Environmental Performance Reviews, OECD Publishing, Paris,
https://dx.doi.org/10.1787/9789264202887-en.
[225]
OECD (2013), Policy Instruments to Support Green Growth in Agriculture, OECD Green Growth
Studies, OECD Publishing, Paris, https://dx.doi.org/10.1787/9789264203525-en.
[155]
OECD (2013), Scaling-up Finance Mechanisms for Biodiversity, OECD Publishing, Paris,
https://dx.doi.org/10.1787/9789264193833-en.
[159]
OECD (2012), Chicago Proposal for Financing Sustainable Cities, OECD, Paris. [12]
OECD (2012), Linking Renewable Energy to Rural Development, OECD Green Growth Studies,
OECD Publishing, Paris, https://dx.doi.org/10.1787/9789264180444-en.
[171]
OECD (2012), OECD Territorial Reviews: The Chicago Tri-State Metropolitan Area, United
States 2012, OECD Territorial Reviews, OECD Publishing, Paris,
https://dx.doi.org/10.1787/9789264170315-en.
[58]
OECD (n.d.), Effective Public Investment Toolkit, http://www.oecd.org/effective-public-
investment-toolkit/.
[8]
OECD (forthcoming), Housing policies in Ethiopia: An assessment of policy instruments to
promote sustainable and inclusive cities, OECD Publishing, Paris.
[63]
OECD (forthcoming), Improving Transport Planning for Accessible Cities, OECD Publishing,
Paris.
[194]
OECD (forthcoming), Inventory of Building Blocks and Country Practices for Green Budgeting,
OECD Publishing, Paris.
[41]
OECD (forthcoming), Transport Bridging Divides, OECD Publishing, Paris. [202]
OECD/Cedefop (2014), Greener Skills and Jobs, OECD Green Growth Studies, OECD
Publishing, Paris, https://dx.doi.org/10.1787/9789264208704-en.
[207]
OECD/EC (2020), Cities in the World: A New Perspective on Urbanisation, OECD Urban
Studies, OECD Publishing, Paris, https://dx.doi.org/10.1787/d0efcbda-en.
[45]

218
OECD REGIONAL OUTLOOK 2021 © OECD 2021
OECD/EC (2017), The Missing Entrepreneurs 2017: Policies for Inclusive Entrepreneurship,
OECD Publishing, Paris, https://doi.org/10.1787/9789264283602-en.
[228]
OECD et al. (2015), Aligning Policies for a Low-carbon Economy, OECD Publishing, Paris,
http://dx.doi.org/10.1787/9789264233294-en (accessed on 21 August 2019).
[142]
OECD/ILO (2017), Engaging Employers in Apprenticeship Opportunities: Making It Happen
Locally, OECD Publishing, Paris, https://dx.doi.org/10.1787/9789264266681-en.
[230]
OECD/ITF (2019), Tax Revenue Implications of Decarbonising Road Transport: Scenarios for
Slovenia, OECD Publishing, Paris, https://dx.doi.org/10.1787/87b39a2f-en.
[22]
OECD/UCLG (2019), 2019 Report of the World Observatory on Subnational Government
Finance and Investment - Key Findings, OECD, Paris.
[25]
OECD/UN-Habitat (2018), Global State of National Urban Policy, OECD Publishing, Paris/United
Nations Human Settlements Programme, Nairobi, https://dx.doi.org/10.1787/9789264290747-
en.
[52]
OECD/UN-Habitat (forthcoming), Global State of National Urban Policy: 2nd Edition, OECD
Publishing, Paris/United Nations Human Settlement Programme, Nairobi.
[64]
Ortega, M. et al. (2020), “Analysing the influence of trade, technology learning and policy on the
employment prospects of wind and solar energy deployment: The EU case”, Renewable and
Sustainable Energy Reviews, Vol. 122, pp. 1-17, https://doi.org/10.1016/j.rser.2019.109657.
[176]
Peaks To Prairies (2019), Homepage, https://peakstoprairies.ca/ (accessed on
15 November 2020).
[203]
Phillips, M. (2019), “Challenges and policies to support rural environmental and energy
transitions”, Background Report for an OECD/EC Workshop Series on Managing
environmental and energy transitions for cities and regions, OECD, 5 September 2019, Paris.
[170]
Poggi, F., A. Firmino and M. Amado (2018), “Planning renewable energy in rural areas: Impacts
on occupation and land use”, Energy, Vol. 155, pp. 630-640,
https://doi.org/10.1016/j.energy.2018.05.009.
[172]
Porru, S. et al. (2020), “Smart mobility and public transport: Opportunities and challenges in rural
and urban areas”, Journal of Traffic and Transportation Engineering, Vol. 7/1, pp. 88-97,
https://doi.org/10.1016/j.jtte.2019.10.002.
[197]
Quoilina, S. and A. Zucker (2016), “Techno-economic evaluation of self-consumption with
PV/battery systems under different regulation schemes”, Proceedings of the 29th international
conference on Efficiency, Cost, Optimisation, Simulation and Environmental Impact of Energy
Systems, http://hdl.handle.net/2268/205134 (accessed on 15 November 2020).
[72]
Raderschall, L., T. Krawchenko and L. Leblanc (2020), “Leading practices for resource benefit
sharing and development for and with Indigenous communities”, OECD Regional
Development Papers, No. 1, OECD Publishing, Paris, https://doi.org/10.1787/177906e7-en.
[164]
Reames, T. (2020), “Distributional disparities in residential rooftop solar potential and penetration
in four cities in the United States”, Energy Research & Social Science, Vol. 69,
https://doi.org/10.1016/j.erss.2020.101612.
[82]
219
OECD REGIONAL OUTLOOK 2021 © OECD 2021
Rega, C. (2014), “Introduction: Rural development and landscape planning - Key concepts and
issues at stake”, in Landscape Planning and Rural Development, Springer,
http://dx.doi.org/10.1007/978-3-319-05759-0_1.
[156]
Roberts, M., A. Bruce and I. MacGill (2017), “PV for apartment buildings: Which side of the
meter?”.
[84]
Rode, P. et al. (2017), “Integrating national policies to deliver compact, connected cities: An
overview of transport and housing”, Coalition for Urban Transitions, London and Washington,
DC, https://urbantransitions.global/en/publication/integrating-national-policies-to-deliver-
compact-connected-cities-an-overview-of-transport-and-housing/ (accessed on
6 October 2020).
[61]
Roelich, K. et al. (2015), “Towards resource-efficient and service-oriented integrated
infrastructure operation”, Technological Forecasting and Social Change, Vol. 92, pp. 40-52,
http://dx.doi.org/10.1016/j.techfore.2014.11.008.
[105]
Salvia, M. et al. (2021), “Will climate mitigation ambitions lead to carbon neutrality? An analysis
of the local-level plans of 327 cities in the EU”, Renewable and Sustainable Energy Reviews,
Vol. 135, p. 14, https://doi.org/10.1016/j.rser.2020.110253.
[51]
Sartor, O. (2018), Implementing Coal Transitions: Insights from Case Studies of Major Coal-
consuming Economies, IDDRI, https://www.iddri.org/en/publications-and-
events/report/implementing-coal-transition-insights-case-studies-major-coal (accessed on
30 November 2020).
[224]
Sayer, J. et al. (2014), “Landscape approaches: What are the pre-conditions for success?”,
Sustainability Science, Vol. 10/2, pp. 345-355,
https://www.academia.edu/15186450/Landscape_approaches_what_are_the_pre_conditions
_for_success (accessed on 23 September 2020).
[150]
Say, K., W. Schill and M. John (2020), “Degrees of displacement: The impact of household PV
battery prosumage on utility generation and storage”, Applied Energy, Vol. 276,
https://doi.org/10.1016/j.apenergy.2020.115466.
[83]
Shannak, S. and M. Alnory (2019), “Decision-making method for evaluating solar desalination
options: The case of Saudi Arabia”, Journal of Science and Technology Policy Management,
Vol. 11/3, pp. 343-356, https://doi-org.dbgw.lis.curtin.edu.au/10.110.
[78]
Shepherd, T. and A. Sobel (2020), “Localness in climate change”, Comparative Studies of South
Asia, Africa and the Middle East, Vol. 40/1, pp. 7-16, http://dx.doi.org/10.1215/1089201x-
8185983.
[138]
Smart Clean (2019), “Closed plastic circle in Helsinki region and Lahti”,
http://smartclean.fi/en/2019/02/11/closed-plastic-circle-in-helsinki-region-and-lahti/.
[114]
Stronati, D. and A. Berry (2018), “Circular economy - Think piece for the built environment
sector”, https://www.mca.org.uk/wp-
content/uploads/sites/60/2019/02/Circular_Economy_Thought_Leadership_final.pdf.
[118]
Sudmant, A. et al. (2018), “Producer cities and consumer cities: Using production- and
consumption-based carbon accounts to guide climate action in China, the UK, and the US”,
Journal of Cleaner Production, Vol. 176, pp. 654-662,
http://dx.doi.org/10.1016/j.jclepro.2017.12.139.
[48]

220
OECD REGIONAL OUTLOOK 2021 © OECD 2021
Syed, M., G. Morrison and J. Darbyshire (2020), “Shared solar and battery storage configuration
effectiveness for reducing the grid reliance of apartment complexes”, Energies,
http://dx.doi.org/doi:10.3390/en13184820.
[85]
The Climate Group (2016), “How North Rhine-Westphalia responds to the concerns of citizens
about renewable energy development by facilitating dialogue”,
https://www.theclimategroup.org/sites/default/files/2020-
11/under2_coalition_case_study_etp_nrw.pdf.
[188]
The Shift Project (2017), “Décarboner la mobilité dans les zones de moyenne densité”,
https://theshiftproject.org/wp-
content/uploads/2018/03/resume_aux_decideurs_rapport_decarboner_la_mobilite_dans_les_
zdm_the_shift_project_web_v2.pdf (accessed on 21 August 2019).
[195]
Totaforti, S. (2020), “Emerging biophilic urbanism: The value of the human–nature relationship in
the urban space”, Sustainability, Vol. 12/13, http://dx.doi.org/10.3390/su12135487.
[79]
UK National Ecosystem Assessment (2011), “UK National Ecosystem Assessment: Synthesis of
the key findings”, http://dx.doi.org/10.1007/s10640-010-9418-x.
[160]
UNCC (2021), “New financial alliance for net zero emissions launches”, United Nations Climate
Change, https://unfccc.int/news/new-financial-alliance-for-net-zero-emissions-launches.
[34]
UNEP (2019), Global Resources Outlook 2019, United Nations Environment Programme,
https://www.resourcepanel.org/reports/global-resources-outlook (accessed on 24 May 2019).
[143]
UN-Habitat (2014), The Evolution of National Urban Policies – A Global Overview, UN-Habitat,
Nairobi, https://unhabitat.org/books/the-evolution-of-national-urban-policies (accessed on
6 October 2020).
[59]
Van Agtmael, A. and F. Bakker (2016), “How cities can use local colleges to revive themselves”,
https://www.theatlantic.com/business/archive/2016/03/cities-colleges-akron-
polymers/472881/.
[223]
Van Wijnen (2019), Circulariteit - Van Wijnen - Meer dan bouwen,
https://www.vanwijnen.nl/thema/circulariteit-2/ (accessed on 5 June 2019).
[120]
Vogdrup-Schmidt, M. et al. (2019), “Using spatial multi-criteria decision analysis to develop new
and sustainable directions for the future use of agricultural land in Denmark”, Ecological
Indicators, Vol. 103, pp. 34-42, http://dx.doi.org/10.1016/j.ecolind.2019.03.056.
[152]
Vogdrup-Schmidt, M., N. Strange and B. Thorsen (2017), “Trade-off analysis of ecosystem
service provision in nature networks”, Ecosystem Services, Vol. 23, pp. 165-173,
http://dx.doi.org/10.1016/j.ecoser.2016.12.011.
[151]
Wätzold, F. and M. Drechsler (2014), “Agglomeration payment, agglomeration bonus or
homogeneous payment?”, Resource and Energy Economics, Vol. 37, pp. 85-101,
http://dx.doi.org/10.1016/j.reseneeco.2013.11.011.
[162]
Weber, R., M. Eilertsen and L. Suopajärvi (2017), Local land use planning: Guidance on spatial
data, geographic information systems and foresight in the Arctic.
[154]

221
OECD REGIONAL OUTLOOK 2021 © OECD 2021
WEF/PwC (2020), Nature Risk Rising: Why the Crisis Engulfing Nature Matters for Business and
the Economy, World Economic Forum,
http://www3.weforum.org/docs/WEF_New_Nature_Economy_Report_2020.pdf (accessed on
11 September 2020).
[144]
Westskog, H. et al. (2020), “Urban contractual agreements as an adaptive governance strategy:
under what conditions do they work in multi-level cooperation?”, Journal of Environmental
Policy & Planning, pp. 1-14, http://dx.doi.org/10.1080/1523908x.2020.1784115.
[6]
World Bank (2020), State and Trends of Carbon Pricing 2020, World Bank, Washington, DC,
https://openknowledge.worldbank.org/handle/10986/33809.
[24]
World Green Building Council (2017), Global Status Report 2017,
https://www.worldgbc.org/news-media/global-status-report-2017 (accessed on
6 November 2019).
[116]
Wreford, A., A. Ignaciuk and G. Gruère (2017), “Overcoming barriers to the adoption of climate-
friendly practices in agriculture”, OECD Food, Agriculture and Fisheries Papers, No. 101,
OECD Publishing, Paris, https://dx.doi.org/10.1787/97767de8-en.
[168]
WRI (2020), “Aqueduct floods: The number of people affected by floods will double between
2010 and 2030”, World Resources Institute, Washington DC,
https://www.wri.org/blog/2020/04/aqueduct-floods-investment-green-gray-infrastructure
(accessed on 6 October 2020).
[136]
Notes
1 The Paris Agreement (Article 4, paragraph 2) requires each party to prepare, communicate and maintain
the successive nationally determined contributions (NDCs) that it intends to achieve. Parties shall pursue
domestic mitigation measures, with the aim of achieving the objectives of such contributions.
2 In 2015, the International Labour Organization (ILO) adopted a set of guidelines based on inputs from
governments, businesses and trade unions to ensure “A just transition”. These guidelines highlight the
need for policy coherence between actions taken on climate change and economic development,
industrial, labour market and enterprise policies. They emphasise the need to pay special attention to
regions and workers that could be negatively affected. The guidelines recommend action to anticipate
adverse effects of the transition, implement international labour standards and actively promote social
dialogue (ILO, 2015[232]).
3 See https://eur-lex.europa.eu/legal-content/EN/TXT/?uri=CELEX:32009R0443.
4 See https://www.epa.gov/emission-standards-reference-guide/epa-emission-standards-light-duty-
vehicles-and-trucks-and.
5 See https://eur-lex.europa.eu/legal-content/EN/TXT/?uri=CELEX:32009R0443.
6 See https://www.epa.gov/emission-standards-reference-guide/epa-emission-standards-light-duty-
vehicles-and-trucks-and.

222
OECD REGIONAL OUTLOOK 2021 © OECD 2021
7 Data come from Gallup World Poll and consist of countries from all world regions and all country income
groups. In total, 13% are high-income countries, 65% middle-income countries (32% upper and 33% lower
middle income) and 22% low-income countries.
8 All reported averages for the Gallup data by income group or world region are unweighted country
averages.

OECD Regional Outlook 2021ADDRESSING COVID‑19 AND MOVING TO NET ZERO GREENHOUSE GAS EMISSIONS
The COVID‑19 crisis has revealed the close relationship between environmental risks and those to the foundations of human well‑being – and the cascading effects on the economy and society. It has also highlighted the importance of anticipation and early action. These are also key to integrating climate policy into regional development, albeit on a larger scale. As with COVID‑19, the climate challenge is global, but the response needs to build on regional and local actors, natural environments, geographies and infrastructures.
The 2021 edition of the OECD Regional Outlook shows that a place‑based approach is vital for resilience in the face of both these challenges. It analyses the different territorial impacts of COVID‑19 on health and economy, as well as policy responses. The report explores the different territorial implications of moving to net‑zero greenhouse gas emissions by 2050 whilst adapting to inevitable climate change, and provides fresh analysis of regional data. It provides insights for integrating the climate challenge into multi‑level governance, urban and rural development so as to leave no region behind. It highlights the opportunity we have to draw lessons from COVID‑19 for a place‑based response to the climate challenge.
9HSTCQE*ibjfgg+
PRINT ISBN 978‑92‑64‑81956‑6PDF ISBN 978‑92‑64‑98835‑4
OE
CD
Reg
ion
al Ou
tloo
k 2021 AD
DR
ES
SIN
G C
OV
ID‑19 A
ND
MO
VIN
G T
O N
ET
ZE
RO
GR
EE
NH
OU
SE
GA
S E
MIS
SIO
NS