Ods Graphics
Anders Nilsson
Onsdag 23 maj, 2013
Anders Nilsson
Nytt i 9.2, del av SAS/GRAPH
Flyttat till Base i 9.3
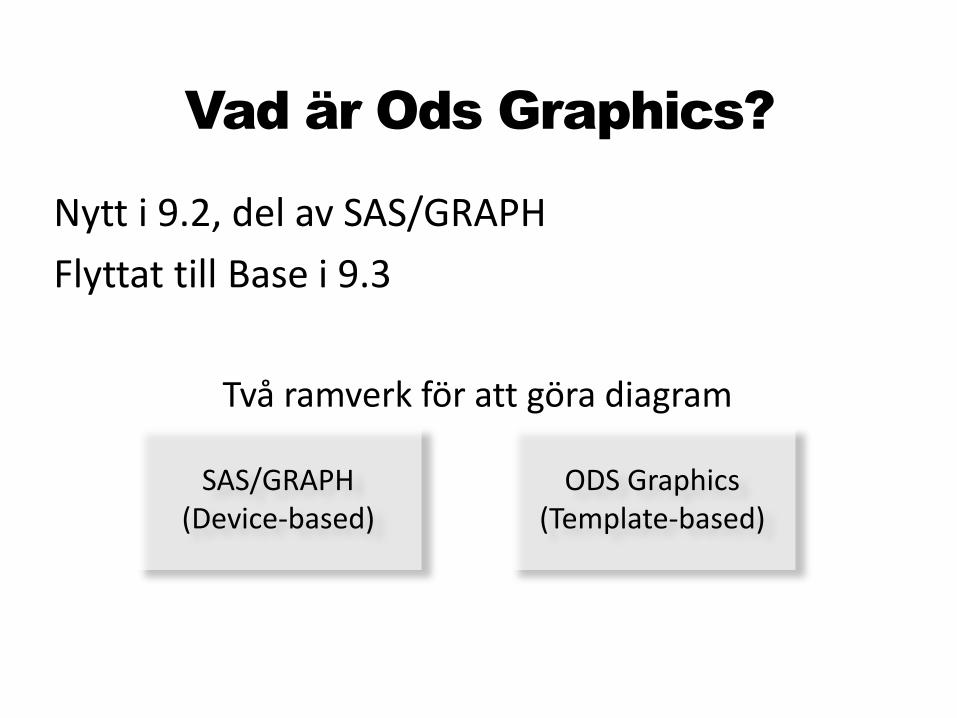
Vad är Ods Graphics?
ODS Graphics(Template-based)
SAS/GRAPH(Device-based)
Två ramverk för att göra diagram

”Template-based graphics”
Ods Graphics och GTL
Graph Template
SAS Data Set
Style Template +
+
proc template; define style Styles.Default;
class GraphFonts"Fonts used in graph styles" / 'GraphDataFont' = ("<sans-serif>, <MTsans-serif>",7pt) 'GraphUnicodeFont' = ("<MTsans-serif-unicode>",9pt) 'GraphValueFont' = ("<sans-serif>, <MTsans-serif>",9pt) 'GraphLabel2Font' = ("<sans-serif>, <MTsans-serif>",10pt) 'GraphLabelFont' = ("<sans-serif>, <MTsans-serif>",10pt,bold) 'GraphFootnoteFont' = ("<sans-serif>, <MTsans-serif>",10pt) 'GraphTitleFont' = ("<sans-serif>, <MTsans-serif>",11pt,bold);

Ods Graphics - Innehåll
Enkelt
Medel
Svårt
Väldigt enkeltFönstermiljöerODS Graphics EditorODS Graphics Designer
Diagram via statistik-procTex. Freq, reg, ttest,…
SG-procTex. SGplot, SGscatter,
SGpanel,...
GTL+SGrenderProc template
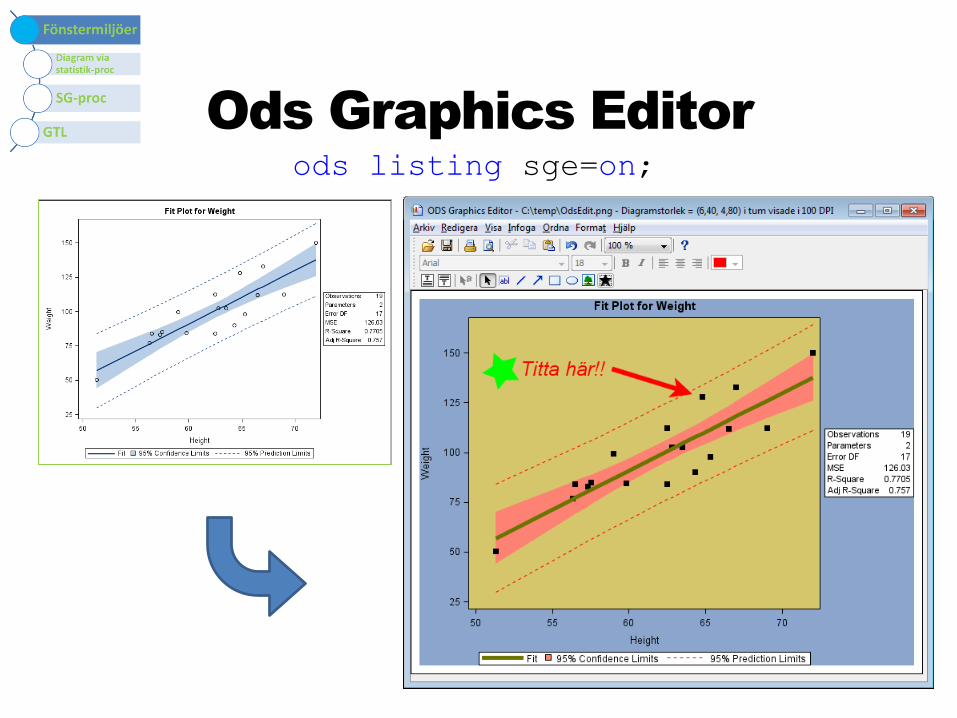
Ods Graphics Editor
ods listing sge=on;

Ods Graphics Designer

Ods Graphics Designer
proc template;
define style styles.MinNyaStil;
parent=styles.LISTING;
class GraphData1 /
lineStyle = 1
markerSymbol = "circle"
color = CX00FF00
contrastColor = CX2A25D9;
class GraphData2 /
lineStyle = 4
markerSymbol = "plus"
color = CXFFFF00
contrastColor = CX00FFFF;
class GraphData3 /
lineStyle = 8
markerSymbol = "X"
color = CX2A25D9
contrastColor = CX01665E;
end;
run;

Ods Graphics - färdiga graph-templates
ods graphics on;
proc reg data=sashelp.class;
model weight=height;
run;quit;
ods graphics off;

ods graphics on;
proc reg data=sashelp.class plots(only)=fit;
model weight=height;
run;quit;
ods graphics off;
Ods Graphics - färdiga graph-templates
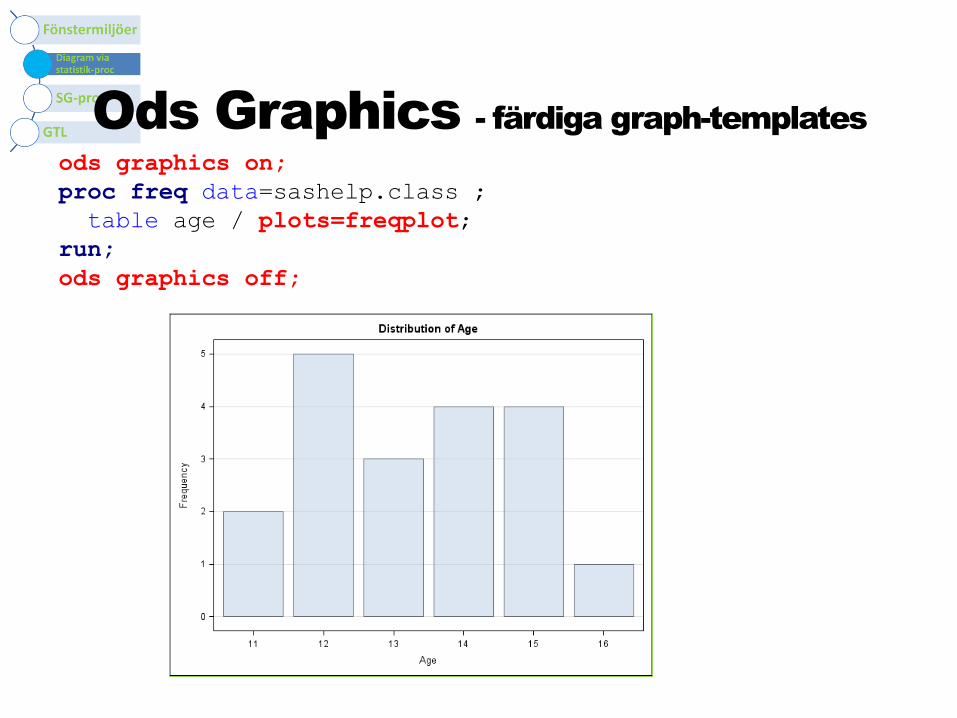
ods graphics on;
proc freq data=sashelp.class ;
table age / plots=freqplot;
run;
ods graphics off;
Ods Graphics - färdiga graph-templates

Ods Graphics hjälp
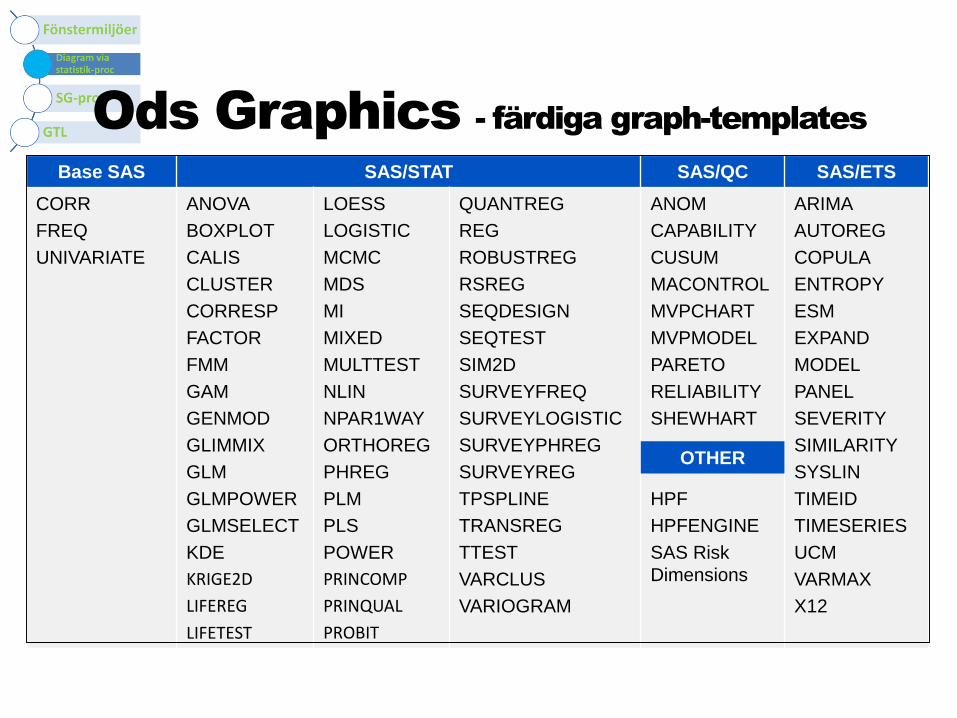
Base SAS SAS/STAT SAS/QC SAS/ETS
CORR
FREQ
UNIVARIATE
ANOVA
BOXPLOT
CALIS
CLUSTER
CORRESP
FACTOR
FMM
GAM
GENMOD
GLIMMIX
GLM
GLMPOWER
GLMSELECT
KDE
KRIGE2D
LIFEREG
LIFETEST
LOESS
LOGISTIC
MCMC
MDS
MI
MIXED
MULTTEST
NLIN
NPAR1WAY
ORTHOREG
PHREG
PLM
PLS
POWER
PRINCOMP
PRINQUAL
PROBIT
QUANTREG
REG
ROBUSTREG
RSREG
SEQDESIGN
SEQTEST
SIM2D
SURVEYFREQ
SURVEYLOGISTIC
SURVEYPHREG
SURVEYREG
TPSPLINE
TRANSREG
TTEST
VARCLUS
VARIOGRAM
ANOM
CAPABILITY
CUSUM
MACONTROL
MVPCHART
MVPMODEL
PARETO
RELIABILITY
SHEWHART
HPF
HPFENGINE
SAS Risk
Dimensions
ARIMA
AUTOREG
COPULA
ENTROPY
ESM
EXPAND
MODEL
PANEL
SEVERITY
SIMILARITY
SYSLIN
TIMEID
TIMESERIES
UCM
VARMAX
X12
OTHER
Ods Graphics - färdiga graph-templates

Ods Graphics – SGproc:ar
SGplot
SGscatter
SGpanel
SGrender
SGdesign
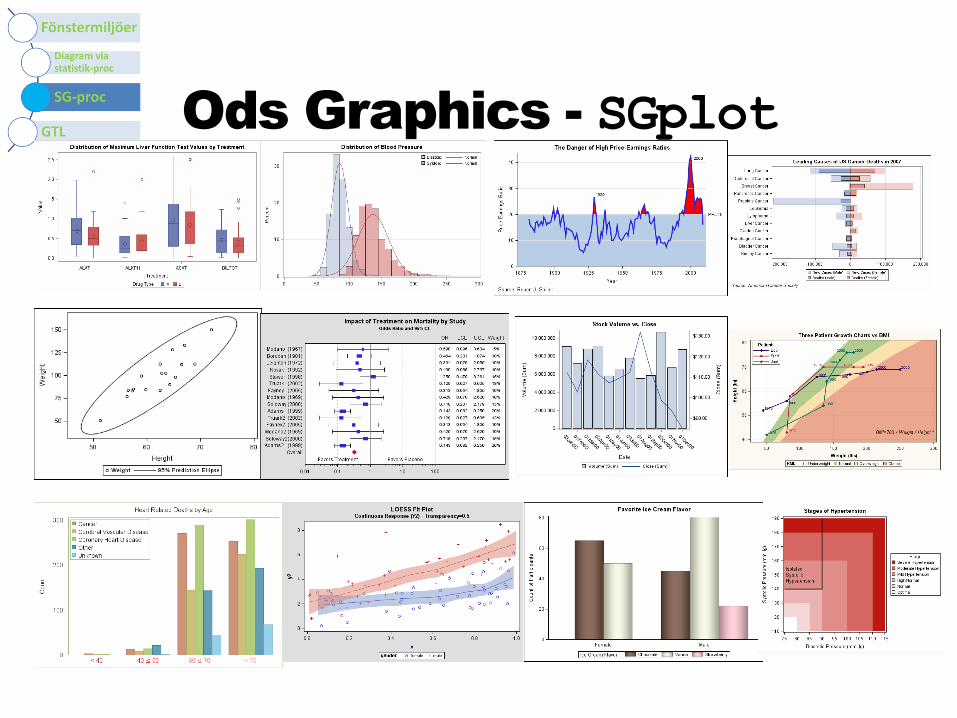
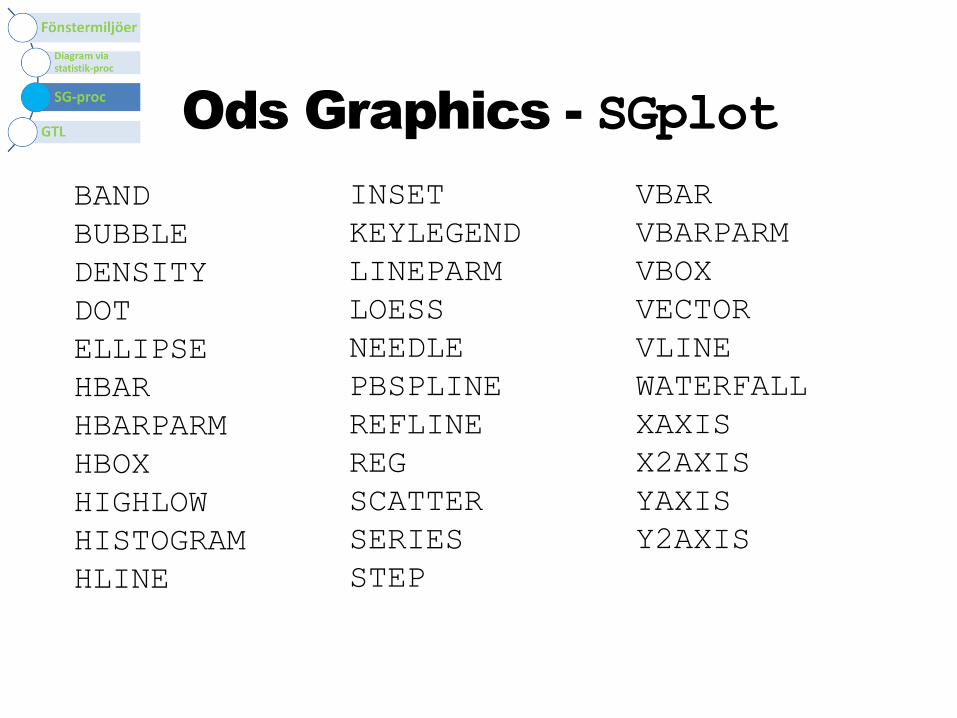
Ods Graphics - SGplot
Ods Graphics - SGplot
BAND
BUBBLE
DENSITY
DOT
ELLIPSE
HBAR
HBARPARM
HBOX
HIGHLOW
HISTOGRAM
HLINE
VBAR
VBARPARM
VBOX
VECTOR
VLINE
WATERFALL
XAXIS
X2AXIS
YAXIS
Y2AXIS
INSET
KEYLEGEND
LINEPARM
LOESS
NEEDLE
PBSPLINE
REFLINE
REG
SCATTER
SERIES
STEP
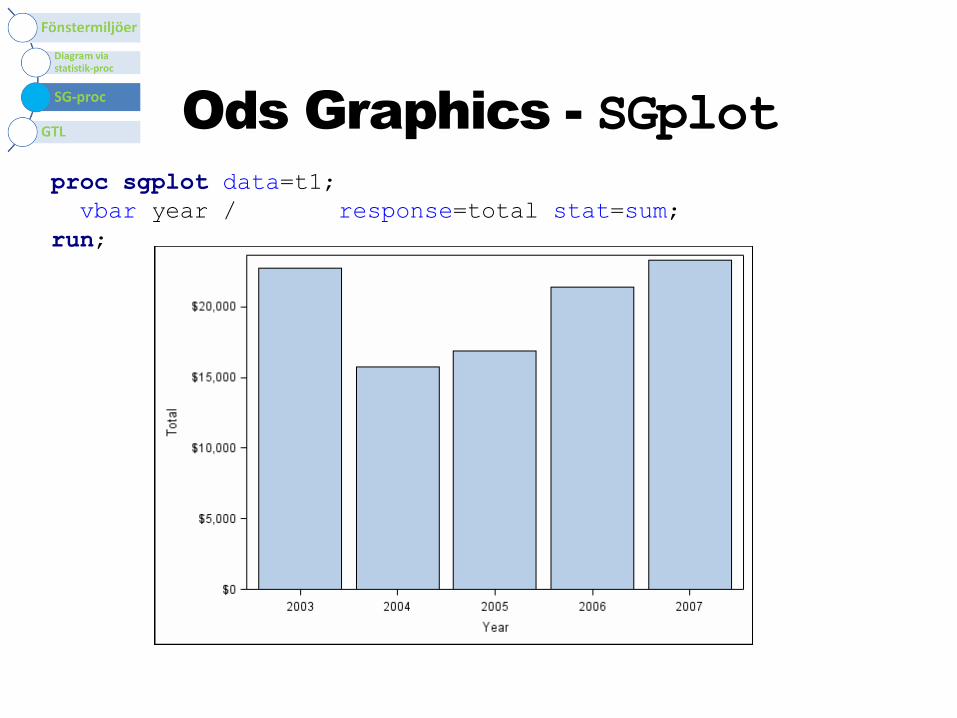
Ods Graphics - SGplot
proc sgplot data=t1;
vbar year / response=total stat=sum;
run;
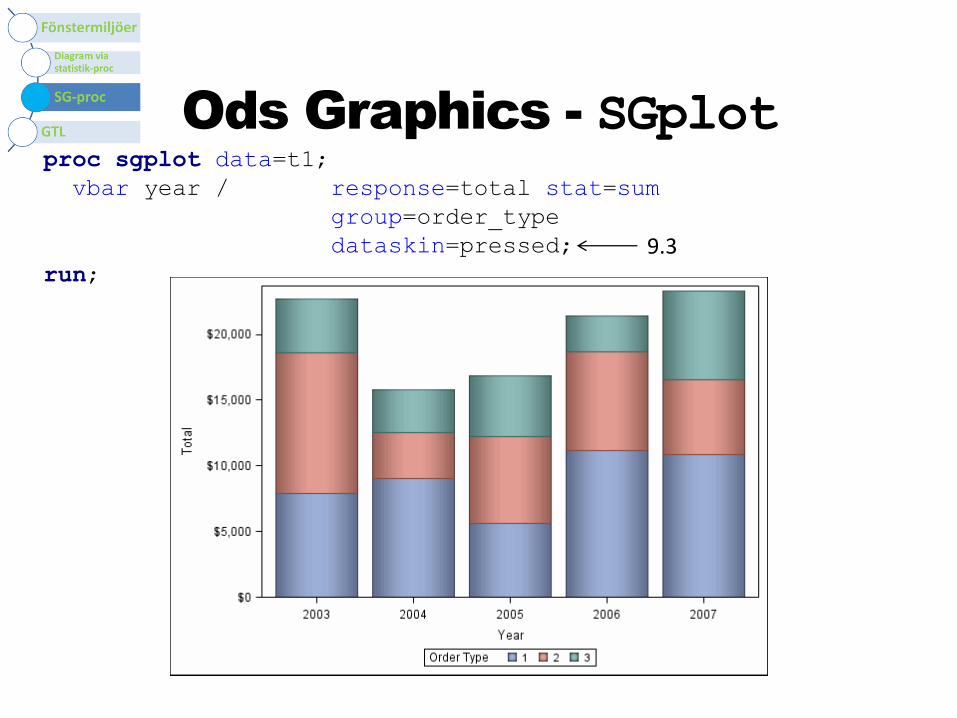
Ods Graphics - SGplotproc sgplot data=t1;
vbar year / response=total stat=sum
group=order_type
dataskin=pressed;
run;
9.3
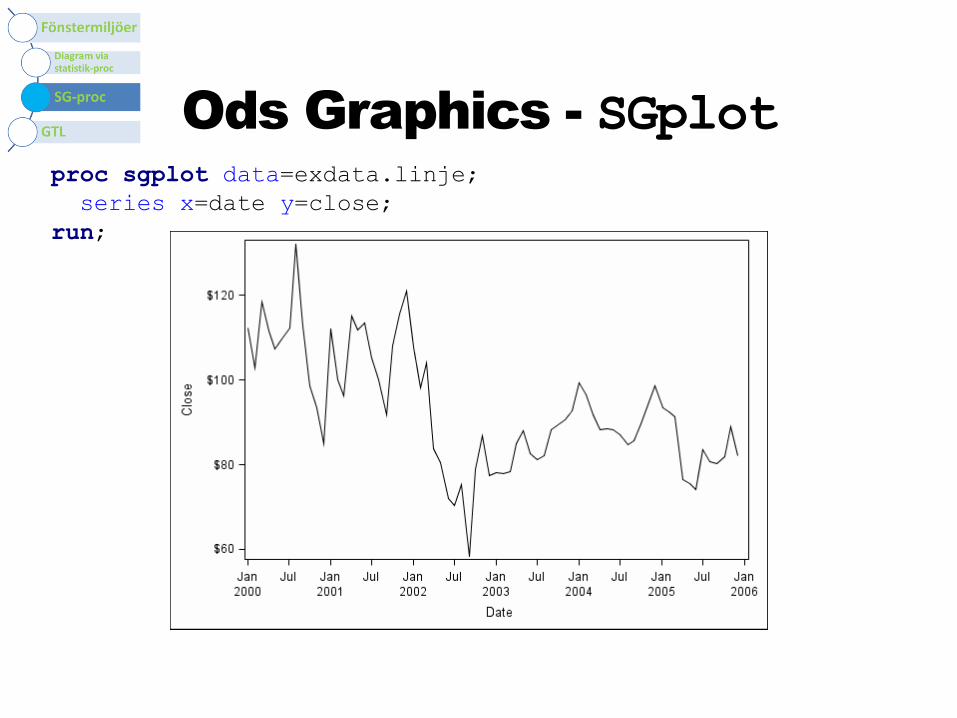
Ods Graphics - SGplotproc sgplot data=exdata.linje;
series x=date y=close;
run;
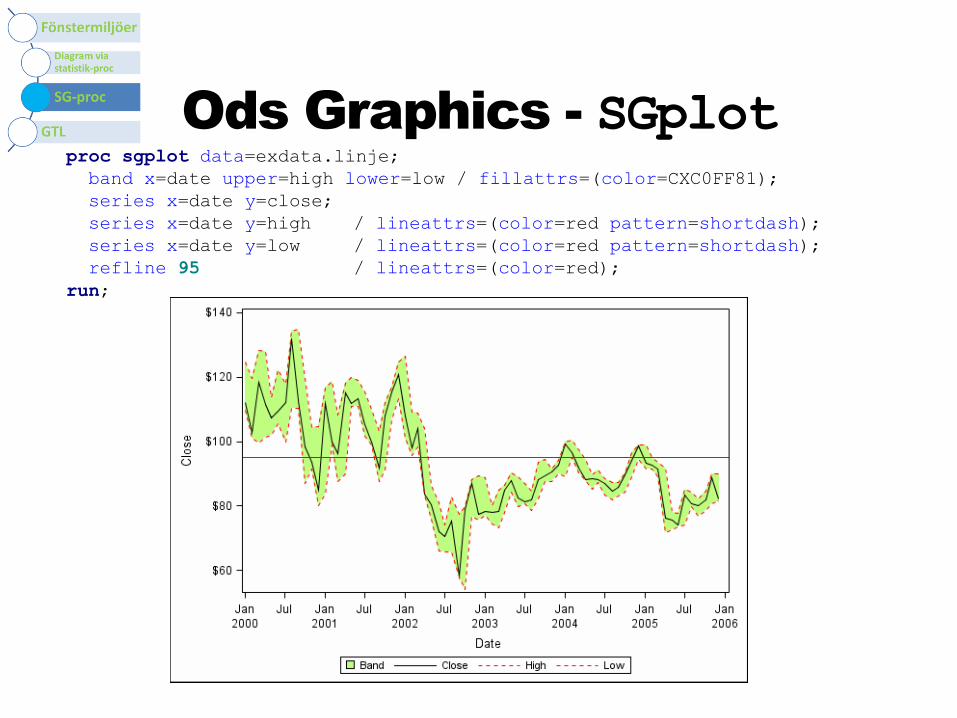
Ods Graphics - SGplotproc sgplot data=exdata.linje;
band x=date upper=high lower=low / fillattrs=(color=CXC0FF81);
series x=date y=close;
series x=date y=high / lineattrs=(color=red pattern=shortdash);
series x=date y=low / lineattrs=(color=red pattern=shortdash);
refline 95 / lineattrs=(color=red);
run;
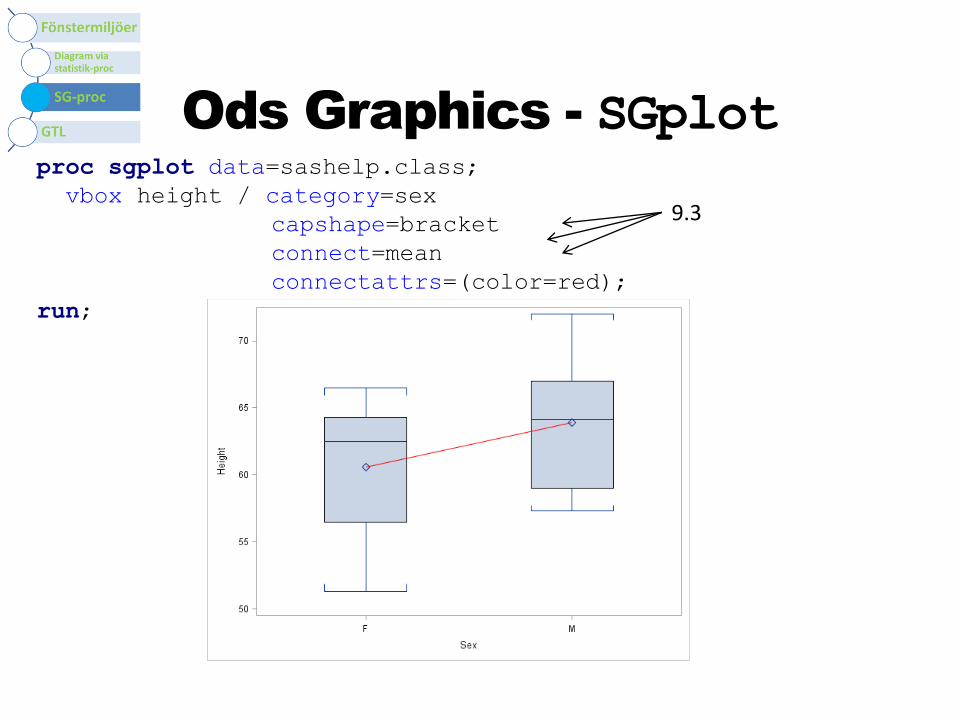
Ods Graphics - SGplotproc sgplot data=sashelp.class;
vbox height / category=sex
capshape=bracket
connect=mean
connectattrs=(color=red);
run;
9.3

Ods Graphics –Annotate (9.3)
Ovanpå ditt diagram kan du lägga till text, linjer, pilar, ovaler, rektanglar, polygoner, bilder.
4 typer av variabler:• Vad ska ritas? • Var ska detta ritas?• Koordinatsystem• Vilka attribut? Färg, linjetyp, osv.
Diagram-data
Annotate-data
+

Ods Graphics –Annotate (9.3)
proc sgplot data=orion.profit sganno=AnnotateTabell;
vbar country/ response=sales stat=mean;
run;

Ods Graphics –Attribute map (9.3)
title 'Summan av längder';
proc sgplot data=sashelp.class dattrmap=AttributeTabell;
vbar age / response=height group=sex
groupdisplay=cluster attrid=gdr;
run;

Ods Graphics - GTL
GTL = Graph Template Language
• Generera GTL-kod genom att peka och klicka
• Färdig GTL-kod används (finns i SasHelp)
• GTL-kod genereras automatiskt från SG-koden
• Skriv egen GTL-kod
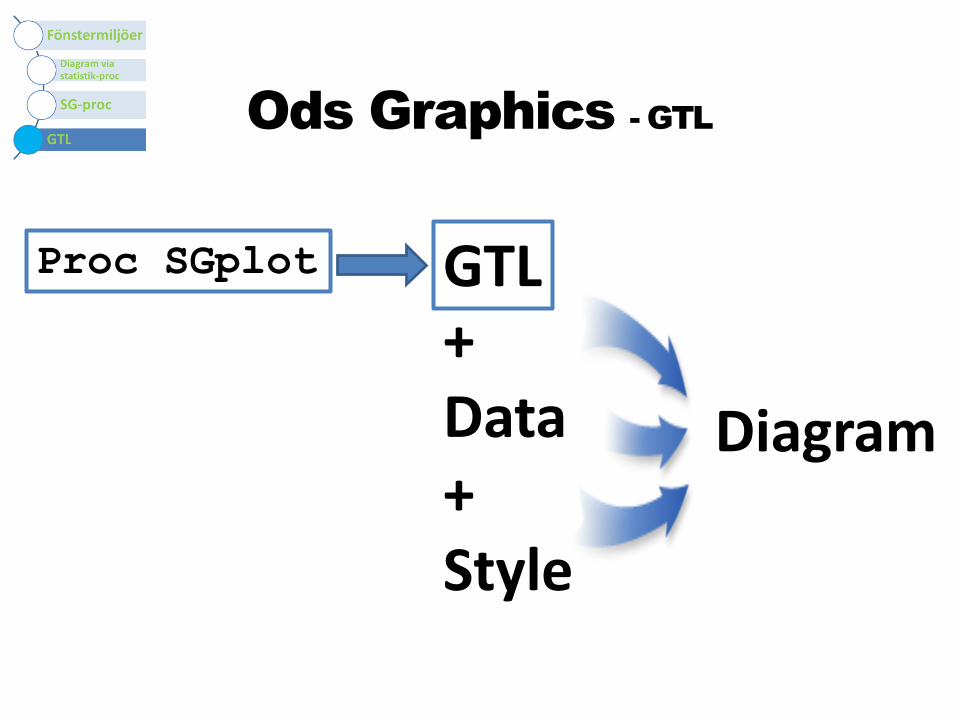
Ods Graphics - GTL
Proc SGplot
+Data+Style
Diagram
GTL
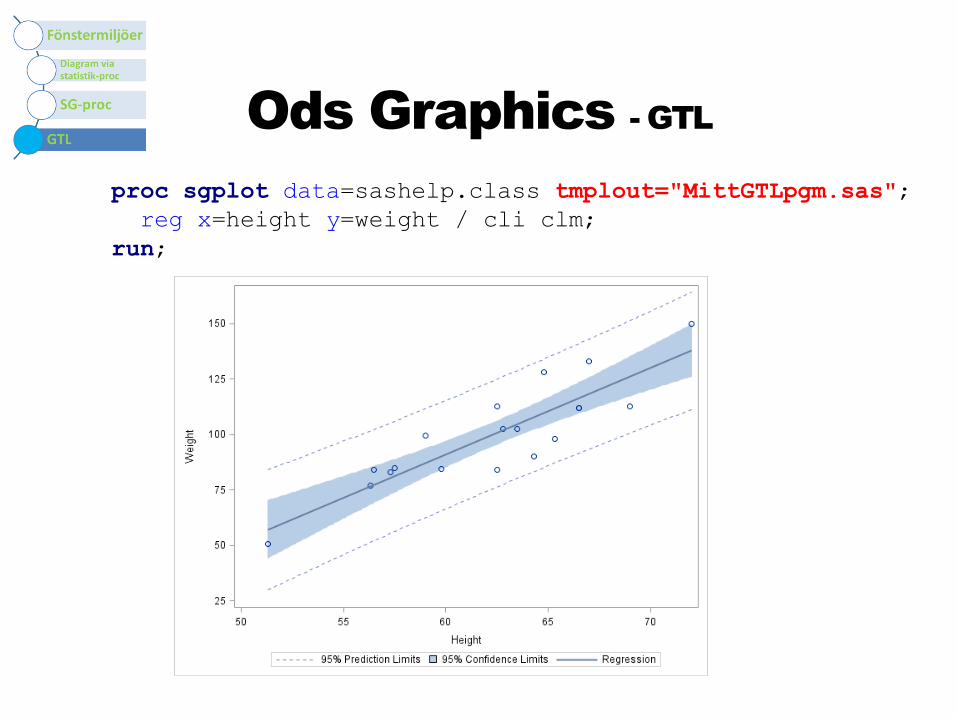
Ods Graphics - GTL
proc sgplot data=sashelp.class tmplout="MittGTLpgm.sas";
reg x=height y=weight / cli clm;
run;

Ods Graphics - GTL
proc template;
define statgraph sgplot;
begingraph /;
layout overlay;
ModelBand "G76FA8QG" / display=(outline)
OutLineAttrs=GraphPredictionLimits Name="MODELBAND"
LegendLabel="95% Prediction Limits";
ModelBand "G76FA8QH" / Name="MODELBAND1" LegendLabel="95%
Confidence Limits";
ScatterPlot X=Height Y=Weight / primary=true;
RegressionPlot X=Height Y=Weight / NAME="REG"
LegendLabel="Regression" clm="G76FA8QH" cli="G76FA8QG";
DiscreteLegend "MODELBAND" "MODELBAND1" "REG";
endlayout;
endgraph;
end;
run;

Ods Graphics - GTL
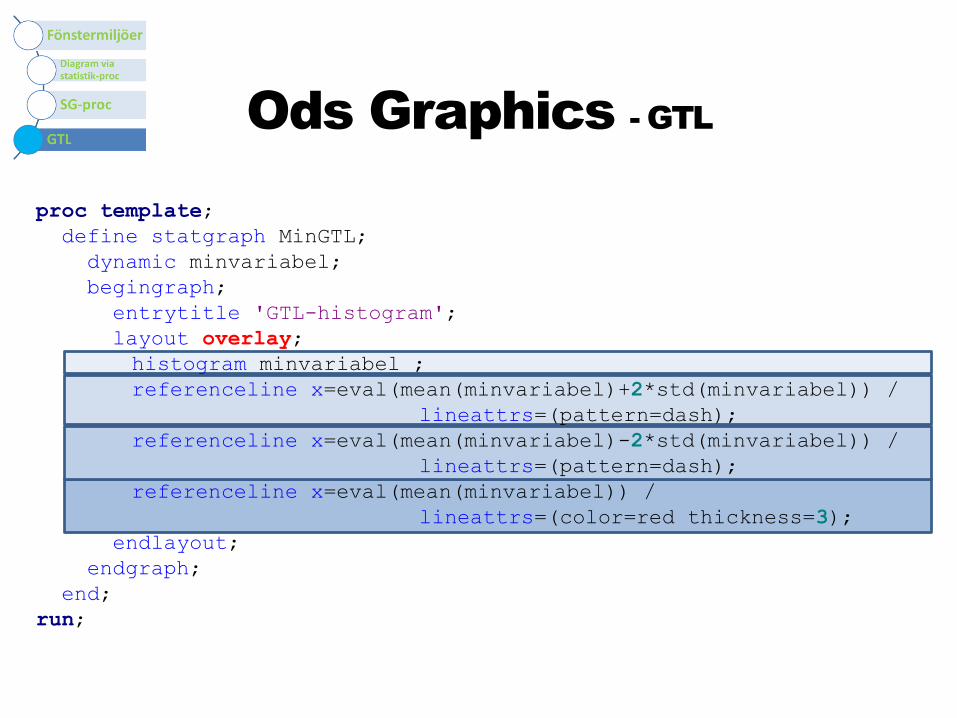
proc template;
define statgraph MinGTL;
dynamic minvariabel;
begingraph;
entrytitle 'GTL-histogram';
layout overlay;
histogram minvariabel ;
referenceline x=eval(mean(minvariabel)+2*std(minvariabel)) /
lineattrs=(pattern=dash);
referenceline x=eval(mean(minvariabel)-2*std(minvariabel)) /
lineattrs=(pattern=dash);
referenceline x=eval(mean(minvariabel)) /
lineattrs=(color=red thickness=3);
endlayout;
endgraph;
end;
run;
Ods Graphics - GTL
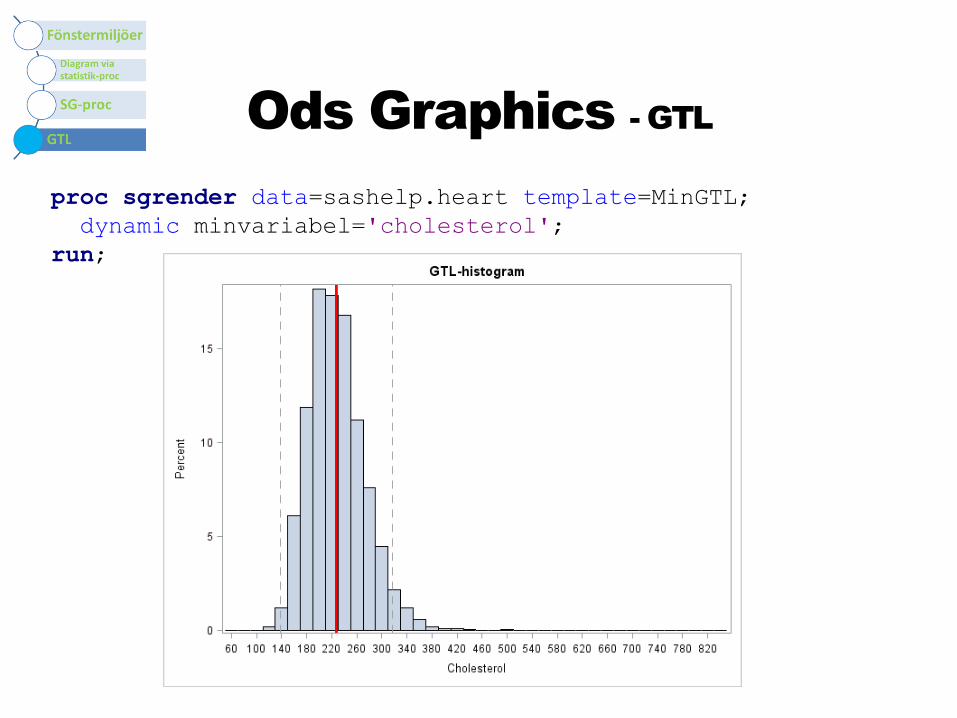
proc sgrender data=sashelp.heart template=MinGTL;
dynamic minvariabel='cholesterol';
run;
Ods Graphics - GTL
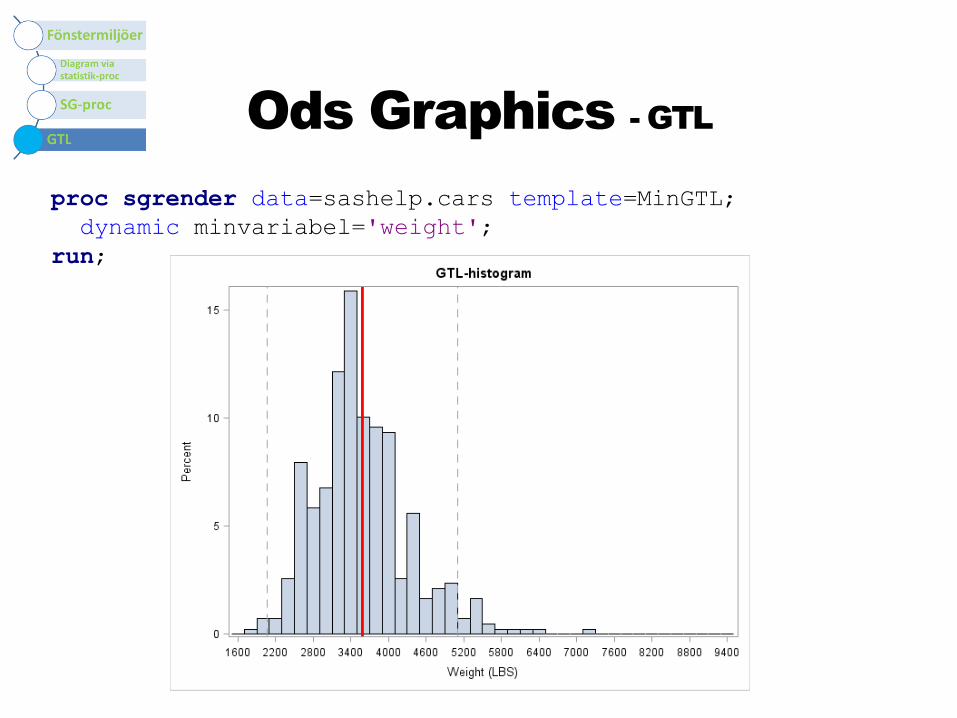
proc sgrender data=sashelp.cars template=MinGTL;
dynamic minvariabel='weight';
run;
Ods Graphics - GTL
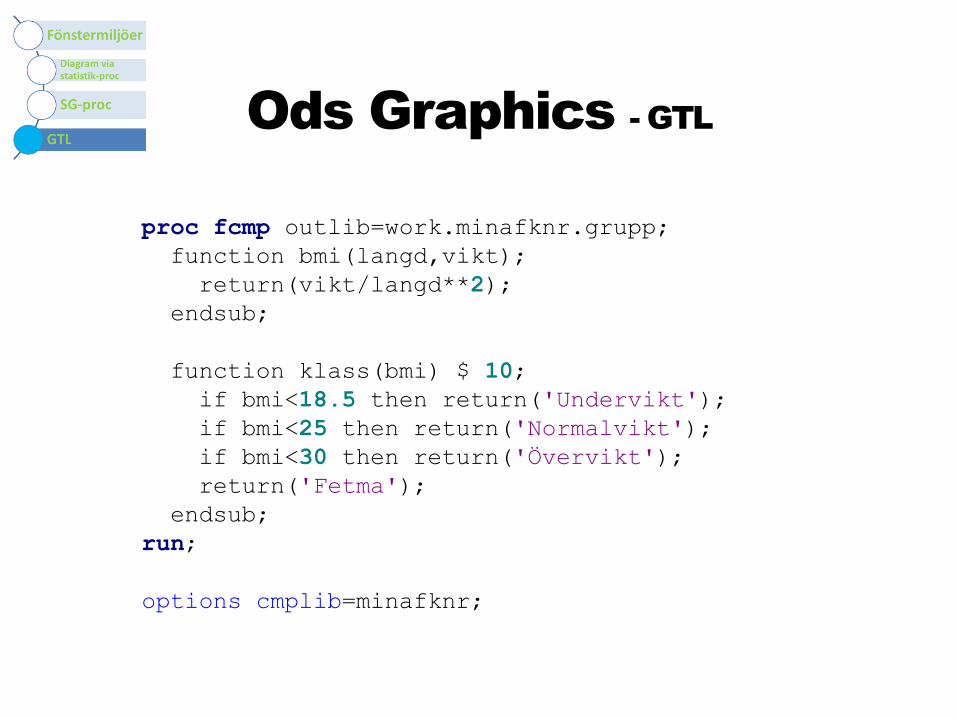
proc fcmp outlib=work.minafknr.grupp;
function bmi(langd,vikt);
return(vikt/langd**2);
endsub;
function klass(bmi) $ 10;
if bmi<18.5 then return('Undervikt');
if bmi<25 then return('Normalvikt');
if bmi<30 then return('Övervikt');
return('Fetma');
endsub;
run;
options cmplib=minafknr;
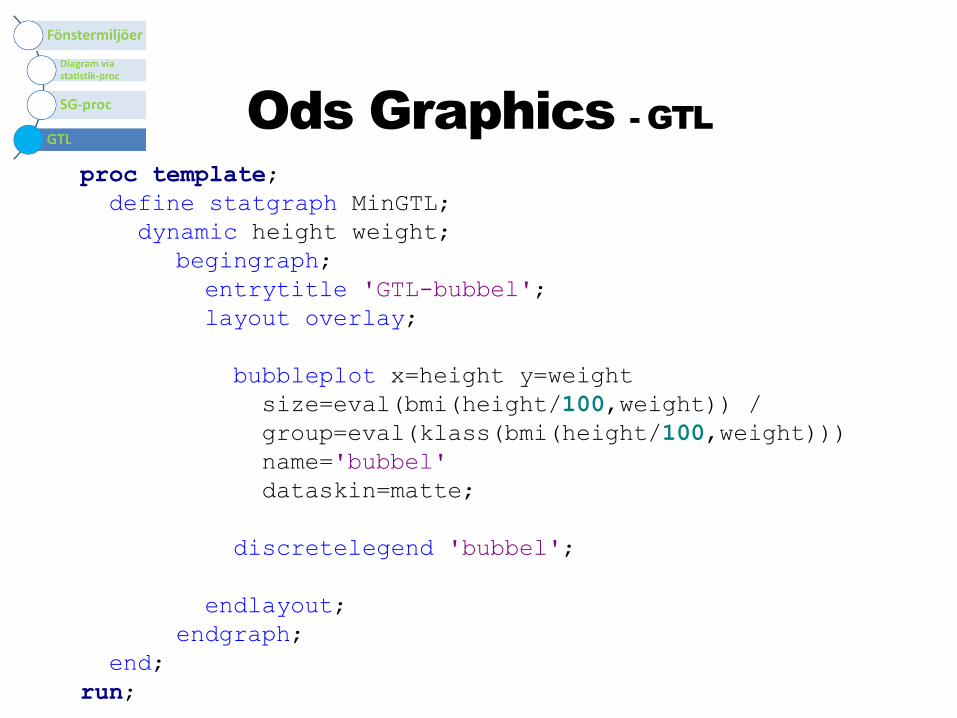
Ods Graphics - GTL
proc template;
define statgraph MinGTL;
dynamic height weight;
begingraph;
entrytitle 'GTL-bubbel';
layout overlay;
bubbleplot x=height y=weight
size=eval(bmi(height/100,weight)) /
group=eval(klass(bmi(height/100,weight)))
name='bubbel'
dataskin=matte;
discretelegend 'bubbel';
endlayout;
endgraph;
end;
run;
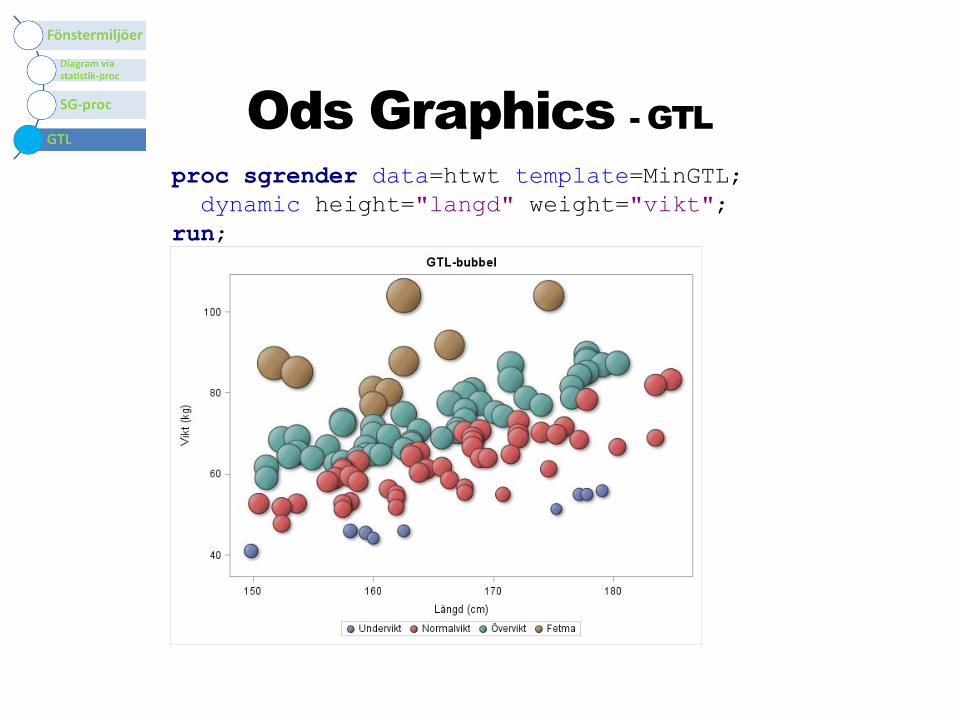
Ods Graphics - GTL
proc sgrender data=htwt template=MinGTL;
dynamic height="langd" weight="vikt";
run;

Frågor?