Corporate Presentation
August 2016
Disclaimer This presentation has been prepared by Quess Corp Limited (“Company") solely for information purposes without any regard to any specific objectives, financial situations or informational needs of any particular person.
This presentation may not be copied, distributed or disseminated, directly or indirectly, in any manner. Failure to comply with this directive may result in a violation of the applicable law in certain jurisdictions. By
reviewing this presentation, you agree to be bound by the restrictions contained herein, and to maintain absolute confidentiality, regarding the information disclosed in these materials.
This presentation does not constitute or form part of and should not be construed as, directly or indirectly, any offer or invitation or inducement to sell or issue, or any solicitation of any offer to purchase or subscribe for,
any securities of the Company by any person in any jurisdiction, including in India, nor shall it or any part of it or the fact of its distribution form the basis of, or be relied on in connection with, any investment decision or
any contract or commitment therefor.
This presentation contains statements that constitute forward looking statements. These statements include descriptions regarding the intent, belief or current expectations of the Company or its directors and officers
with respect to the results of operations and financial condition of the Company. These statements can be recognized by the use of words such as ''expects", "plans", 'will", "estimates", "projects", or other words of
similar meaning. Such forward-looking statements are not guarantees of future performance and involve risks and uncertainties, and actual results may differ materially from those in such forward-looking statements as
a result of various factors and assumptions which the Company believes to be reasonable in light of its operating experience in recent years. The risks and uncertainties relating to these statements include, but not
limited to, risks and uncertainties, regarding fluctuations in earnings, our ability to manage growth, competition, our ability to manage our international operations, government policies, regulations, etc. The Company
does not undertake any obligation to revise or update any forward looking statement that may be made from time to time by or on behalf of the Company including to reflect actual results, changes in assumptions or
changes in factors affecting these statements. Given these risks, uncertainties and other factors, viewers of this presentation are cautioned not to place undue reliance on these forward looking statements. This
presentation may contain certain currency exchange rates and the same have been provided only for the convenience of readers. No representation is made that the Rupee amounts actually represent such USD
amounts or could have been, or could be, converted into USD at the indicated rates.
This presentation is not a complete description of the Company and may not be all inclusive and may not contain all of the information that you may consider material. The information contained in this presentation has
not been independently verified. No representation, warranty, guarantee or undertaking, express or implied, is or will be made as to, and no reliance should be placed on, the accuracy, completeness, correctness or
fairness of the information, estimates, projections and opinions contained in this presentation. Viewers of this presentation must make their own assessment of the relevance, accuracy and adequacy of the information
contained in this presentation and must make such independent investigation as they may consider necessary or appropriate for such purpose. Such information and opinions are in all events not current after the date
of this presentation. Further, past performance is not necessarily indicative of future results. Any opinions expressed in this presentation or the contents of this presentation are subject to change without notice. This
presentation should not be construed as legal, tax, accounting, investment or other advice.
Any person placing reliance on the information contained in this presentation or any other communication by the Company does so at his or her own risk and none of the Company nor any of its affiliates, advisers or
representatives, any placement agent, promoters or any other persons that may participate in any offering of any securities of the Company shall have any responsibility or liability whatsoever, whether arising in tort,
contract or otherwise, for any errors, omissions, insufficiencies or inaccuracies in such information or opinions or for any loss, cost or damage suffered or incurred howsoever arising, directly or indirectly, from any use of
this presentation or its contents or otherwise in connection with this presentation.
This presentation has not been and will not be registered as a prospectus with any Registrar of Companies in India. This presentation is not a prospectus, a statement in lieu of a prospectus, an offering circular, an
advertisement, a private placement offer letter or an offer document under the Companies Act, 2013 and the rules made thereunder, the Securities and Exchange Board of India (Issue of Capital and Disclosure
Requirements) Regulations, 2009, as amended, or any other applicable law.
2

Who Are We?
3

India’s Leading Integrated Biz Services Provider
4
Founded September 2007
Present in
Operations in North America,
Middle East and SE Asia
Pan India presence with 47
offices across 26 cities
Employees(1)
1,27,250
Credit Rating [ICRA]AA-
Listed
Listing Date: July 12, 2016
Exchanges: BSE & NSE
Ticker: QUESS
Integrated Facility
Management (IFM)
Global Technology
Solutions (GTS)
IT Solutions,
Services &
Products
Integrated
Maintenance of
Facilities
People and
Services (P&S)
Recruitment,
Staffing, RPO & Skill
Development
Industrial Asset
Management (IAM)
Industrial Asset
O&M & Managed
Services
67.72%(2)
62.58%(3)
(1) Data as of June 30, 2016;
(2) As of June 30, 2016;
(3) As of Jul 12, 2016
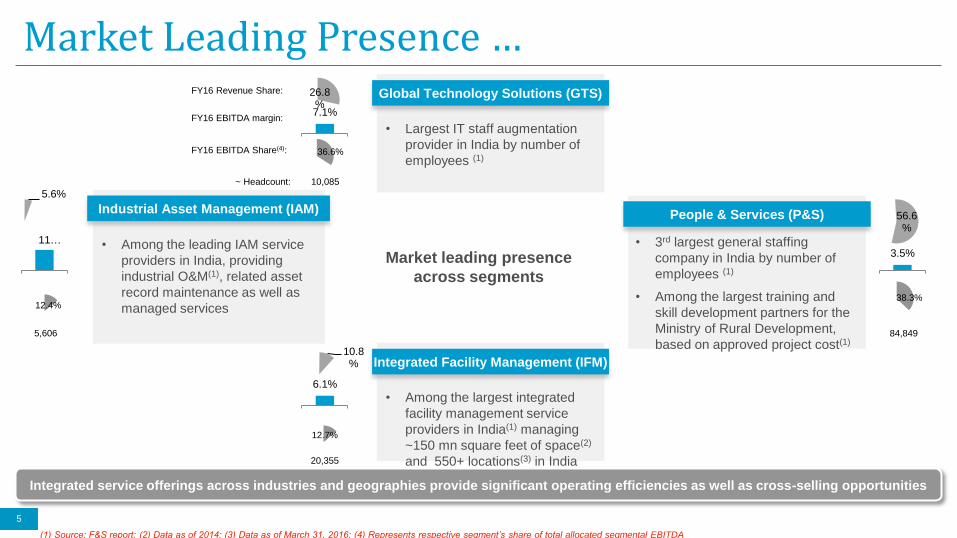
Market Leading Presence …
5
Market leading presence
across segments
• 3rd largest general staffing
company in India by number of
employees (1)
• Among the largest training and
skill development partners for the
Ministry of Rural Development,
based on approved project cost(1)
People & Services (P&S)
• Among the leading IAM service
providers in India, providing
industrial O&M(1), related asset
record maintenance as well as
managed services
Industrial Asset Management (IAM)
• Largest IT staff augmentation
provider in India by number of
employees (1)
Global Technology Solutions (GTS)
• Among the largest integrated
facility management service
providers in India(1) managing
~150 mn square feet of space(2)
and 550+ locations(3) in India
Integrated Facility Management (IFM)
Integrated service offerings across industries and geographies provide significant operating efficiencies as well as cross-selling opportunities
(1) Source: F&S report; (2) Data as of 2014; (3) Data as of March 31, 2016; (4) Represents respective segment’s share of total allocated segmental EBITDA
26.8%
56.6%
10.8%
5.6%
FY16 Revenue Share:
FY16 EBITDA margin:
3.5%
7.1%
6.1%
11…
~ Headcount: 10,085
20,355
84,849 5,606
FY16 EBITDA Share(4): 36.6%
38.3%
12.7%
12.4%

• Presence across North America, Middle East and South East Asia
with more than 2000 employees outside India
• Pan-India presence with 47 offices across 26 cities in India(1)
• 66 centers across India providing skill development services(1)
• Two sophisticated data centers at Ridgefield Park, New Jersey and
Roanoke, Virginia which are SSAE 16 SOC1 Type II compliant
facilities
Expansive global operations
…With Global Operations And A Pan-India Reach
6
Canada
USA
UAE
Sri Lanka
India Philippines
Malaysia Singapore
Jammu
Chandigarh
Gurgaon
Rudrapur New Delhi (2)
Jaipur Lucknow
Patna
Ahmedabad
Mumbai (5)
Pune (2)
Bengaluru(10)
Hyderabad (3)
Bhopal
Bhubaneshwar
Kolkata
Ranchi
Chennai (5)
Trichy Cochin
Coimbatore
Raipur
Guwahati
Vishakhapatnam
Imphal
Indore
Note: Numbers in brackets refer to number of offices in respective location; FY12 and FY16 denote 12 months ended March 31, 2011 and March 31, 2016 respectively;
(1) As of March 31, 2016

Financial Highlights
7

294 463 420 1,362 1,716
4.6% 4.6% 4.2% 5.3% 5.0%
0.0%
10.0%
0
2,000
FY12 FY13 FY14 FY15 FY16
EBITDA Margin
6,394 10,044 10,081
25,728
34,424
FY12 FY13 FY14 FY15 FY16
Delivering Profitable Growth Across Segments…
8
Robust Consolidated Revenue Growth…
…With Improving EBITDA Margin Profile…
…Translating to Sustained PAT* Growth
Diversified Revenue Base…
…with Increasing Share of Higher Margin Segments
FY12 FY16
Consolidated Revenue share INR mn
INR mn
INR mn
Note: Figures in INR mn, unless mentioned otherwise; FY12, FY13 and FY16 denote 12 months ended March 31, 2012, 2013 and 2016 respectively; while FY14 denotes 9 months ended
December 31, 2013, FY15 denotes 15 months ended March 31, 2015
* Restated net profit after tax before share of loss from associate and minority interest for the periods / years
Note: Figures in INR mn, unless mentioned otherwise; FY11, FY12 and FY13 denote 12 months ended March 31, 2011, 2012 and 2013 respectively; while FY14 denotes 9 months ended
December 31, 2013, FY15 denotes 15 months ended March 31, 2015 and H1 FY16 denotes 6 months ended September 30, 2015
* Restated net profit after tax before share of loss from associate and minority interest for the periods / years
GTS 32.1%
P&S 56.7%
Others 0.1%
IFM 11.2% GTS 26.8%
P&S 56.6%
Others 0.2%
IFM 10.8%
IAM 5.6%
7.1%
3.5%
6.1%
11.5%
GTS P&S IFM IAMF
Y16 E
BIT
DA
Marg
in
55% CAGR
83 171 192 672 885
1.3% 1.7% 1.9% 2.6% 2.6%
0.0%
5.0%
0
1,000
FY12 FY13 FY14 FY15 FY16
PAT Margin

… Asset Light Model With Robust Return Ratios
9
Improving Return on Equity… …With Strong Return on Capital Employed
Continuous Improvement in Debtor Days… … Accompanied by Stable Leverage Ratio
Note: Ratios for FY14 and FY15 annualized to 12 month period for comparative purpose;
RoE = Net profit after tax/ Net Worth; RoCE = EBITDA/ (Net Worth + Long-term borrowings + Short-term borrowings + Minority Interest);
Debtor Days = Trade receivables / Revenue from operations*360; Leverage Ratio = (Long-term borrowings + Short-term borrowings ) / EBITDA
11.7%
17.7% 12.9%
21.3% 25.6%
FY12 FY13 FY14 FY15 FY16
66 57
33 48 45
FY12 FY13 FY14 FY15 FY16
24.5%
26.8%
22.5% 23.1% 23.8%
FY12 FY13 FY14 FY15 FY16
1.9x 1.9x
1.1x
2.0x 2.2x
FY12 FY13 FY14 FY15 FY16
So What Does The Future Hold?
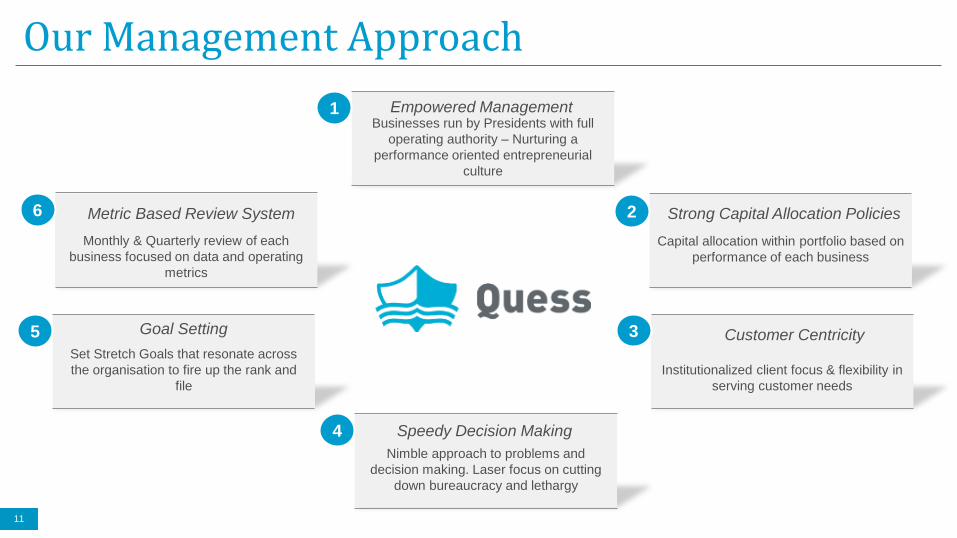
Our Management Approach
11
Set Stretch Goals that resonate across
the organisation to fire up the rank and
file
Businesses run by Presidents with full
operating authority – Nurturing a
performance oriented entrepreneurial
culture
Capital allocation within portfolio based on
performance of each business
Institutionalized client focus & flexibility in
serving customer needs
Monthly & Quarterly review of each
business focused on data and operating
metrics
1
6
3
2
5
Empowered Management
Strong Capital Allocation Policies Metric Based Review System
Customer Centricity Goal Setting
Nimble approach to problems and
decision making. Laser focus on cutting
down bureaucracy and lethargy
4 Speedy Decision Making

What Goes Behind Each Investment We Make?
12
Each Investment / Business shall have the potential to grow at 4x domestic GDP growth
rate
We aim to recover our Investments in 4-5 Years at EBITDA level, with focus on cash
generation
We will not bet our future on any one Investment
We seek targets that will be RoCE accretive
Growth
Strategy
Payback
Risk Control
Accretive
Targets
We stay away from Hostile Situations and Auctions. We believe in backing people. Friendly
Approach

2
3
4
1
Our Strategy Going Forward
13
• Expand our service portfolio and our operations through strategic
acquisitions that complement our existing operations
• Continue to improve operating margins
• Capitalize on rapid growth of e-commerce in India. Focus on last mile
logistics, shared business services and security services
• Verticalisation with focus on domain depth and operational excellence

Thank You!
Quess Corp Limited (formerly IKYA Human Capital Solutions Limited)
Quess House, 3/3/2 Bellandur Gate, Sarjapur Road
Bangalore 560103, Karnataka, India


![Investor Update Q2 FY16 / H1 FY16 [Company Update]](https://static.cupdf.com/doc/110x72/577ca80a1a28abea748caad0/investor-update-q2-fy16-h1-fy16-company-update.jpg)