NUTRITIION CONTROVERSIES:Tackling tough topics with facts,
not emotion
Keith-Thomas Ayoob, EdD, RD, FADA, CDNAssociate Clinical Professor of Pediatrics
Albert Einstein College of MedicineNew Jersey School Nutrition Association
August 16, 2012
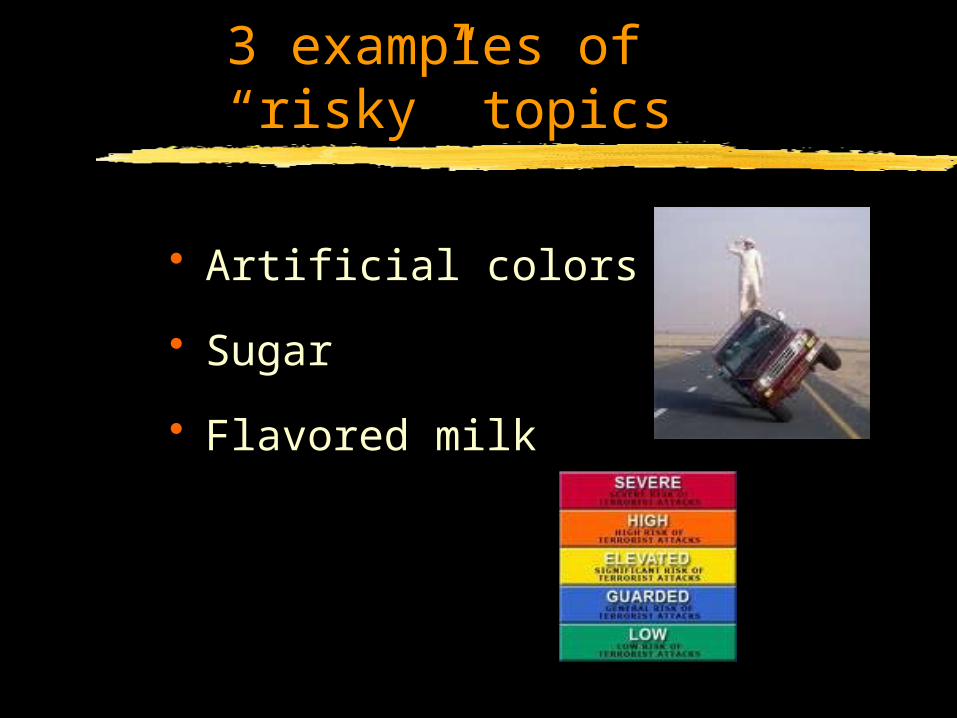
3 examples of “risky” topics
• Artificial colors
• Sugar
• Flavored milk

Common thoughts…
• Sugar is making kids Hyperactive/diabetic/high
• “Artificial colors make them hyperactive”

A R T I F I C I A LC O L O R S

What ARE they?
• Regulated by FDA• 2 kinds of colors in food:
Certified color additives Colors exempt from certification
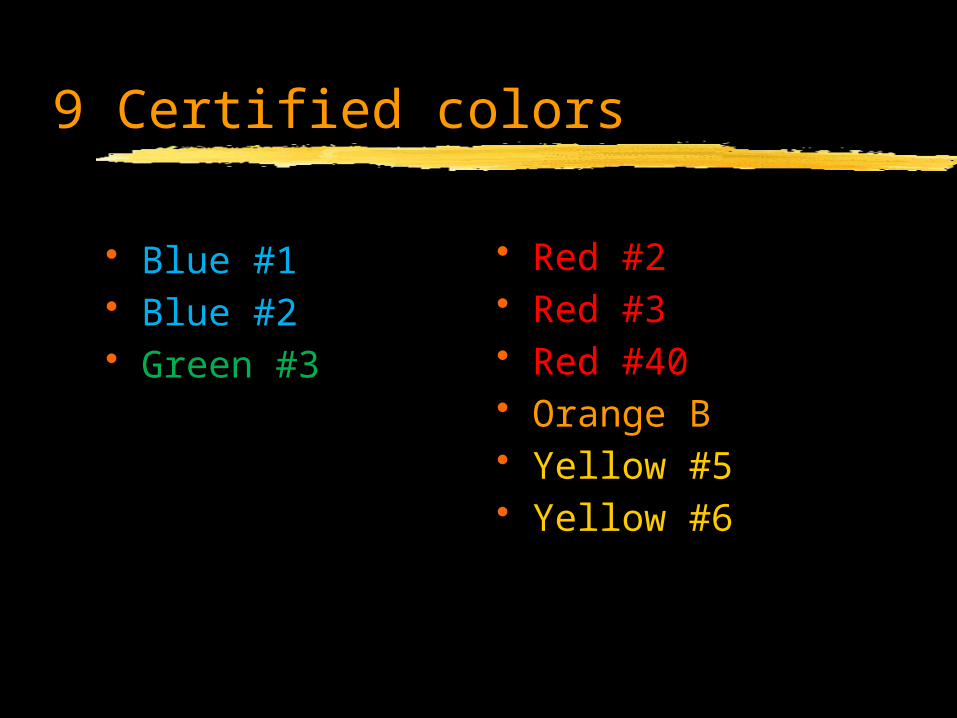
9 Certified colors
• Blue #1• Blue #2• Green #3
• Red #2• Red #3• Red #40• Orange B• Yellow #5• Yellow #6
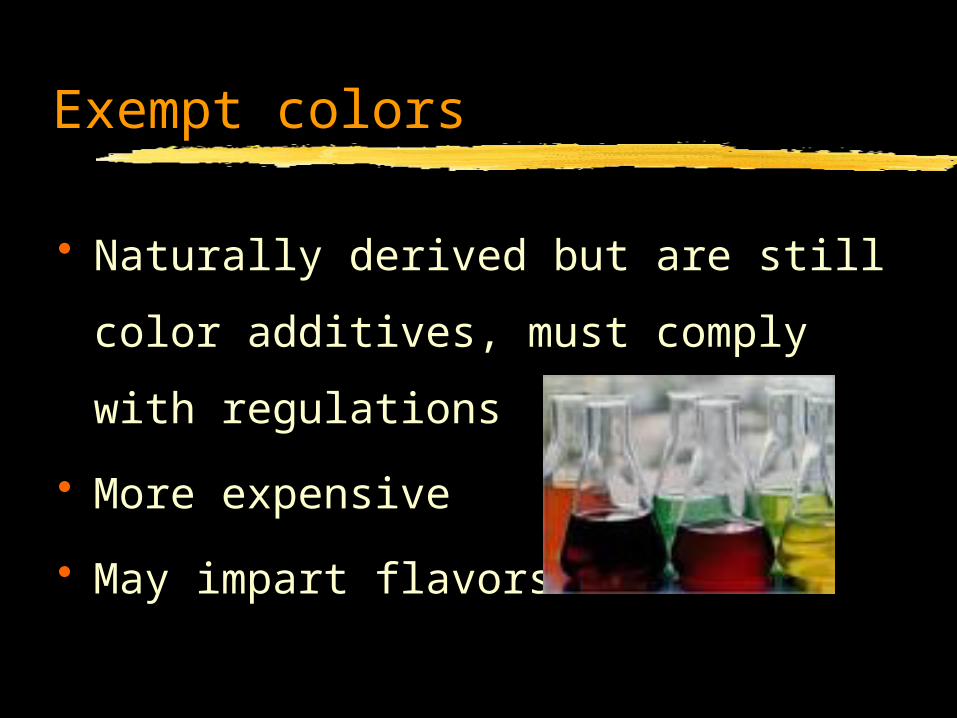
Exempt colors
• Naturally derived but are still color
additives, must comply with
regulations
• More expensive
• May impart flavors
What are they doing in our food?
• Compensate for color losses• Maintain uniformity when colors
naturally vary• Enhance naturally occurring colors

THE BIG QUESTION:
DO COLORS IN FOOD CAUSE HYPERACTIVITY?

HISTORY
• Started with Feingold in the 1970s• Hyperactivity caused by:
Salicylates Artificial flavors Artificial colors
Feingold, BF Delaware Med J 1977

McCann et al (2007)
3 yo 8/9 yo Composition
N = 153 144
Mix A 20 mg AC 25 mg AC 4 AC + Na benzoate
Mix B 30 mg AC 62 mg AC 4 AC + Na benzoate
• General population• Double-blind, placebo-controlled
• Global hyperactivity aggregate scores

McCann et al (2007)
• Comparing Mix A against placebo, Mix B against placebo: 3 y.o.: in both cases, Mix showed
significantly greater hyperactivity scores
8/9 y.o.: in both cases, Mix showed significantly greater hyperactivity scores
…but….

McCann et al (2007)
• When adjusted for: Week during trial Sex Maternal education SES GHA in baseline week Pretrial diet………
McCann et al (2007)
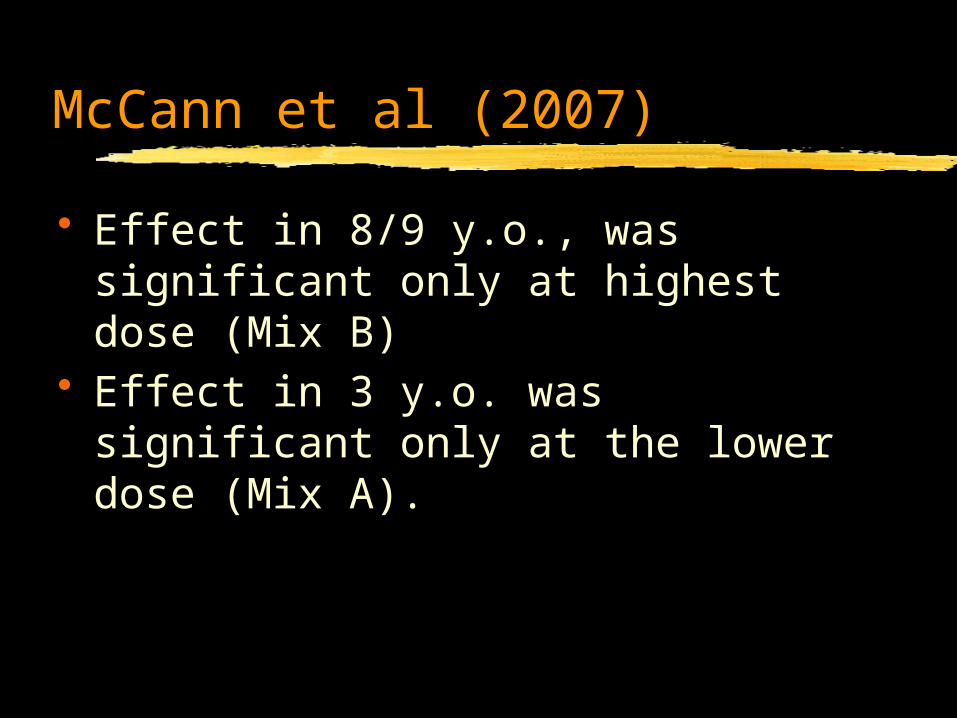
• Effect in 8/9 y.o., was significant only at highest dose (Mix B)
• Effect in 3 y.o. was significant only at the lower dose (Mix A).

McCann et al (2007)
Among authors’ conclusions:
“…substantial individual differences in the response of children to the additives.”

Conclusions of EFSA panel
• “…the study provides limited evidence that the two mixtures had a small and statistically significant effect on activity and attention.”
• They also concluded that the McCann study did not provide an acceptable basis for altering the ADI for colors.EFSA Journal, 2008

Guidance
• Perceived or real, some subset of children may be especially sensitive or high-responders to ACs
• Look at quantity/frequency 4 oz. of candy for a 3-year-old and 8 oz. of candy for an 8-y.o. is
EXCESSIVE Smaller amounts may matter little or
none• Assess context, setting, situation

SUGARSUGARSUGAR

The buzz
• Sugar gets kids hyperactive• Sugar makes kids overweight• HFCS: The new trans fat. It gives
you diabetes, metabolic syndrome, etc.
• Fructose causes high blood pressure.

How much sugar do we eat?
• Total added sugars eaten, per capita1: 1999: 107.7 lb. 2007: 97.0 lb. (=120 gm/day)
1 - ers.usda.gov, accessed 9/21/09

Mean calories from added sugars by age and sex
Boys Girls0
50
100
150
200
250
300
350
400
450
500
Total2-5 yr6-11 yr12-19 yr
CDC/NCHS -- March 2012

Percent of total calories by sex and age
Boys Girls0
2
4
6
8
10
12
14
16
18
20
Total2-5 yr6-11 yr12-19 yr
CDC/NCHS March 2012
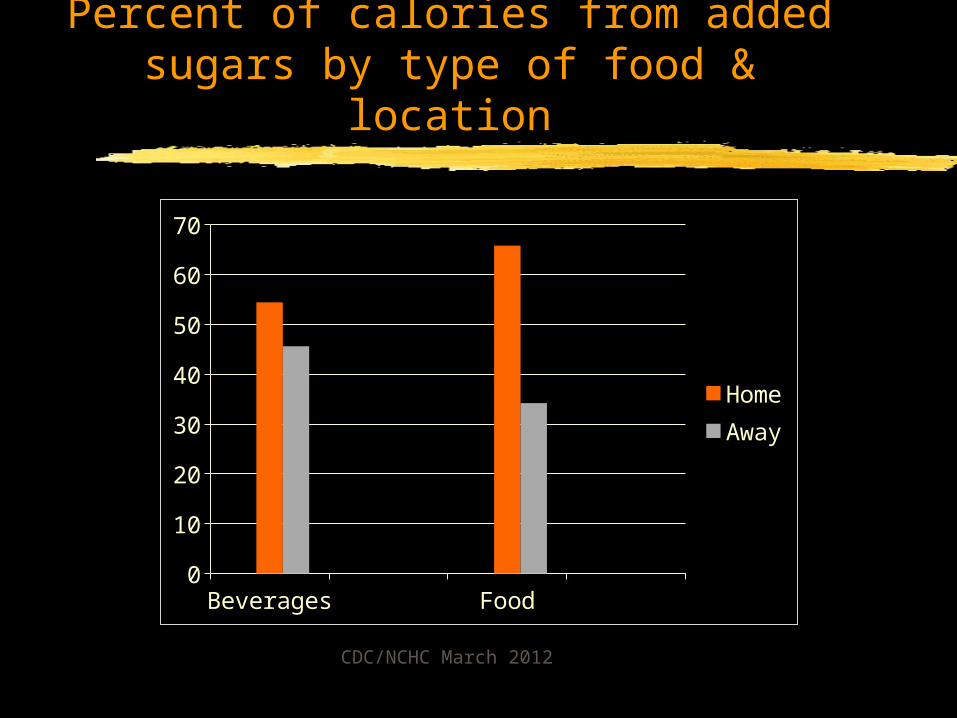
Percent of calories from added sugars by type of food & location
Bev-er-
ages
Food0
10
20
30
40
50
60
70
HomeAway
CDC/NCHC March 2012
NHANES 2001-02
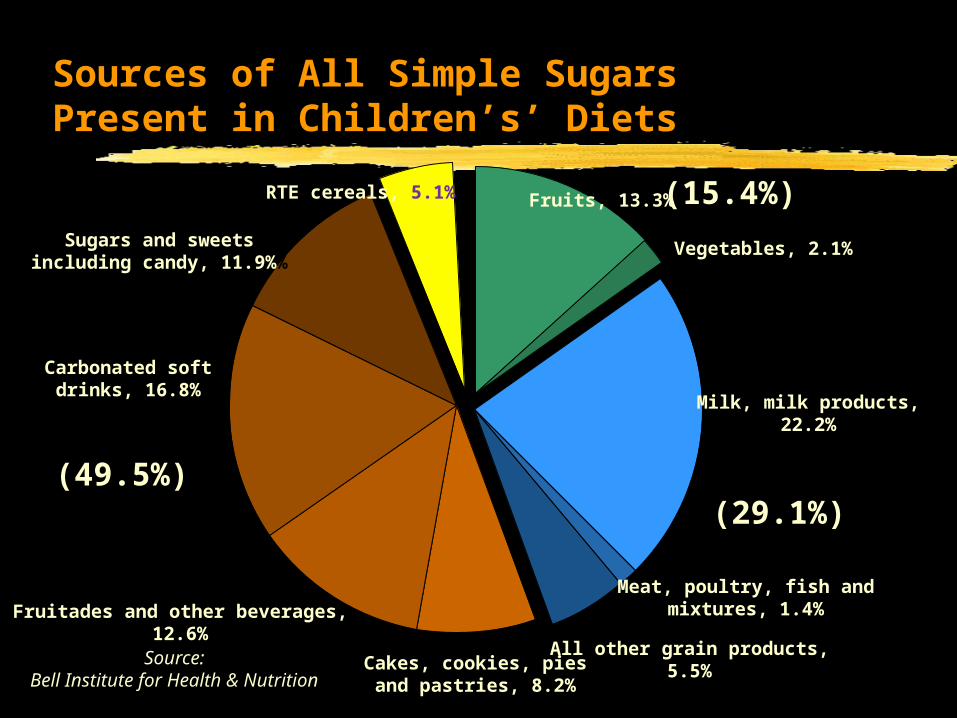
Sources of All Simple Sugars Present in Children’s’ Diets
Fruits, 13.3%
Vegetables, 2.1%
(15.4%)
Milk, milk products,22.2%
Meat, poultry, fish andmixtures, 1.4%
All other grain products,5.5%
(29.1%)
Cakes, cookies, piesand pastries, 8.2%
Sugars and sweetsincluding candy, 11.9%%
Carbonated softdrinks, 16.8%
Fruitades and other beverages,12.6%
(49.5%)
RTE cereals, 5.1%
Misc. = 0.9
Source:Bell Institute for Health & Nutrition
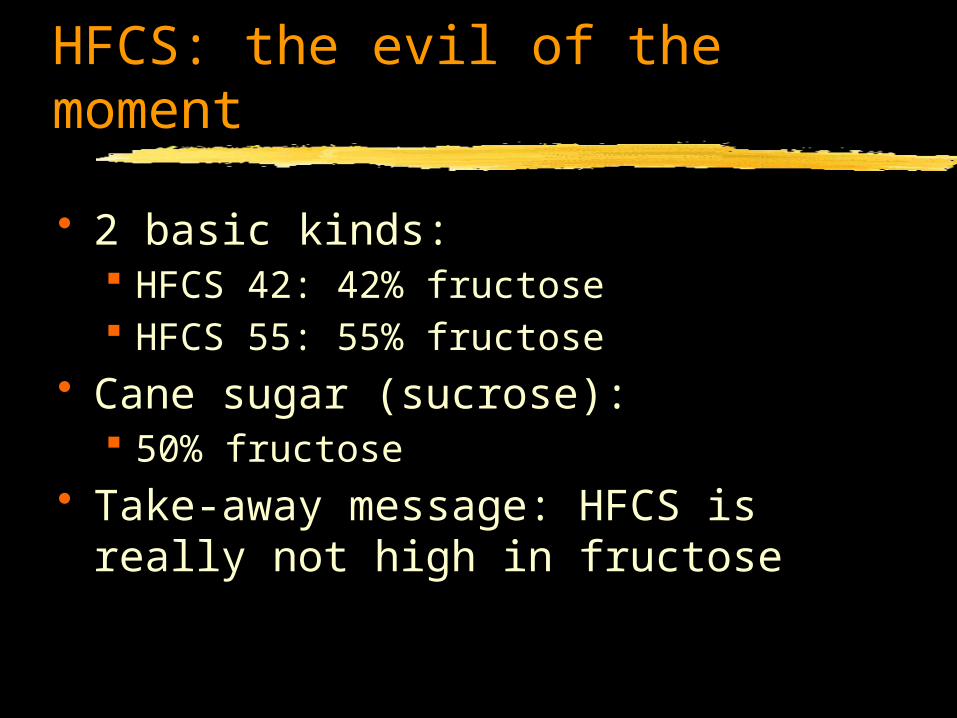
HFCS: the evil of the moment
• 2 basic kinds: HFCS 42: 42% fructose HFCS 55: 55% fructose
• Cane sugar (sucrose): 50% fructose
• Take-away message: HFCS is really not high in fructose

What IS high in fructose:
• Apple juice: 65% fructose, 35% glucose
• Pear juice: 74% fructose, 26% glucose
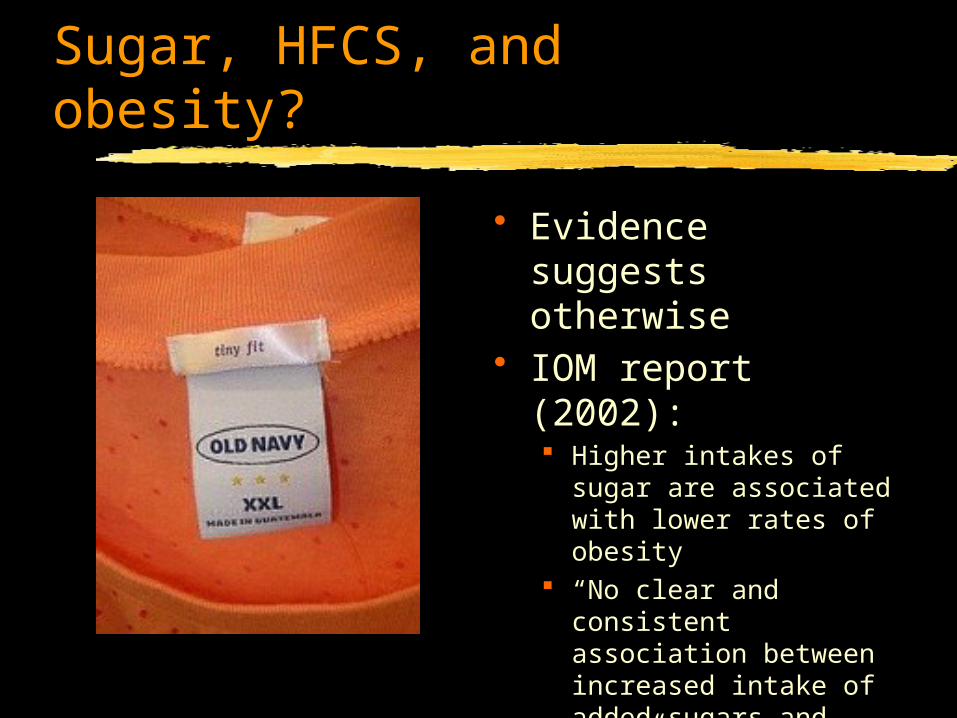
Sugar, HFCS, and obesity?
• Evidence suggests otherwise
• IOM report (2002): Higher intakes of sugar
are associated with lower rates of obesity
“No clear and consistent association between increased intake of added sugars and BMI.”
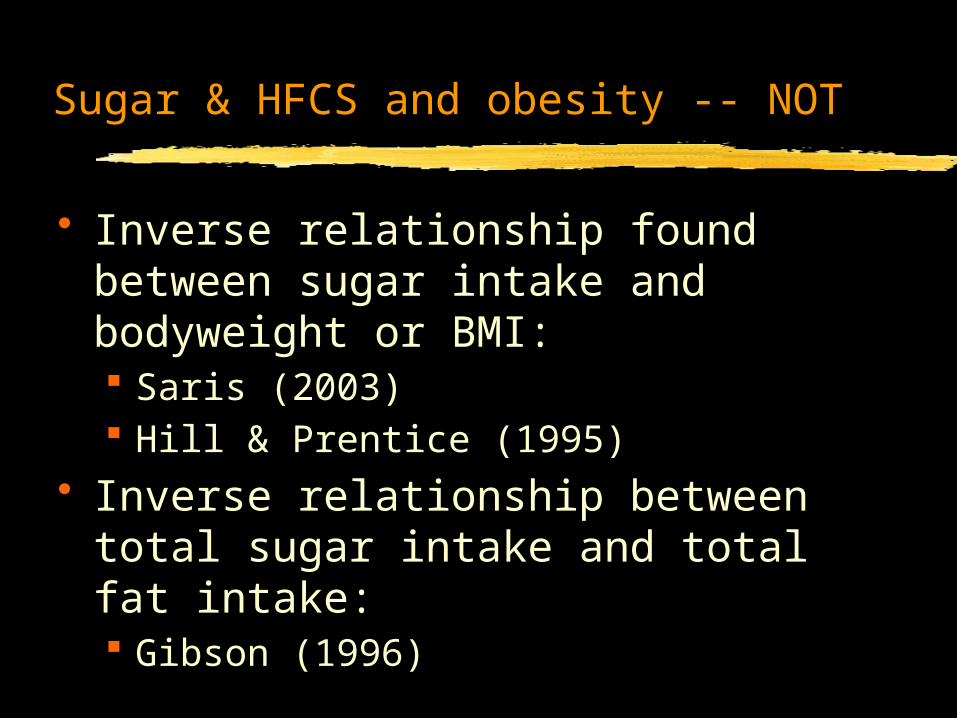
Sugar & HFCS and obesity -- NOT
• Inverse relationship found between sugar intake and bodyweight or BMI:
Saris (2003) Hill & Prentice (1995)
• Inverse relationship between total sugar intake and total fat intake: Gibson (1996)

Sucrose and weight loss, satiety
• 42 women – two groups All on low-fat, low calorie diets 1 group consumed 43% of energy as
sugar• Result:
No differences in weight loss, mood, hunger, stress level
Equal decreases in BP, %BF, plasma lipids
Surwit, AJCN 1997
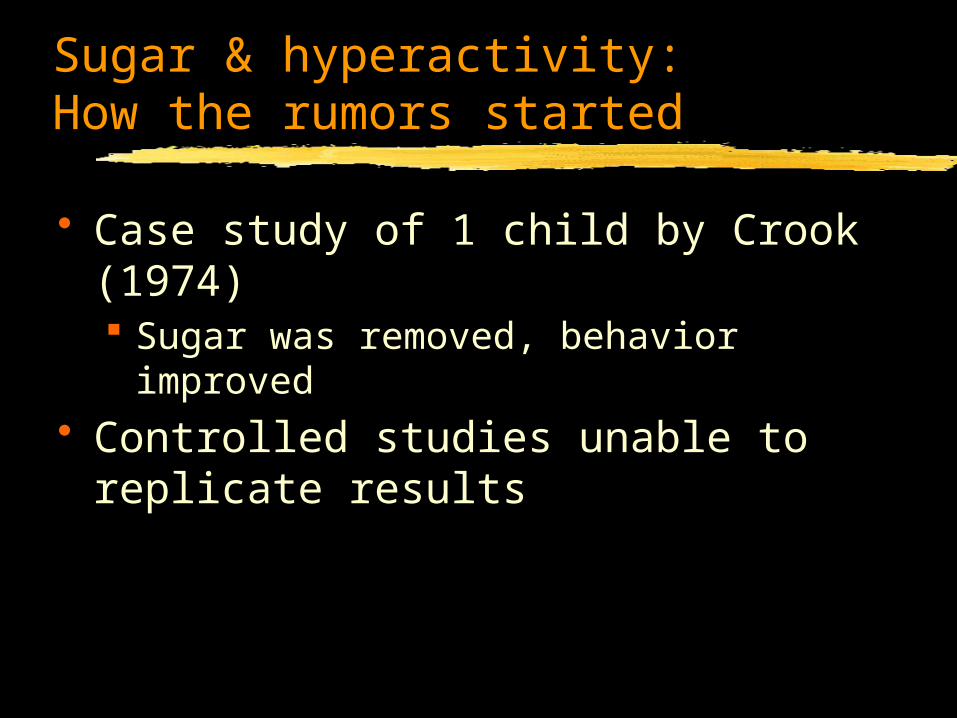
Sugar & hyperactivity: How the rumors started
• Case study of 1 child by Crook (1974) Sugar was removed, behavior improved
• Controlled studies unable to replicate results

Sugar and behavior
• Negative associations generally dismissed by the scientific community1
• Perception of sugar by parents and consumers continues to defy years of sound science and logic.
• Some evidence that behavior is positively affected by sugar.
1 – IOM, Dietary carb, 2002

Meta-analysis by Wolraich, et al (1995)
• 23 studies Double blinded, placebo-controlled Known quantity of sugar Reported statistics useful for computing
dependent measures
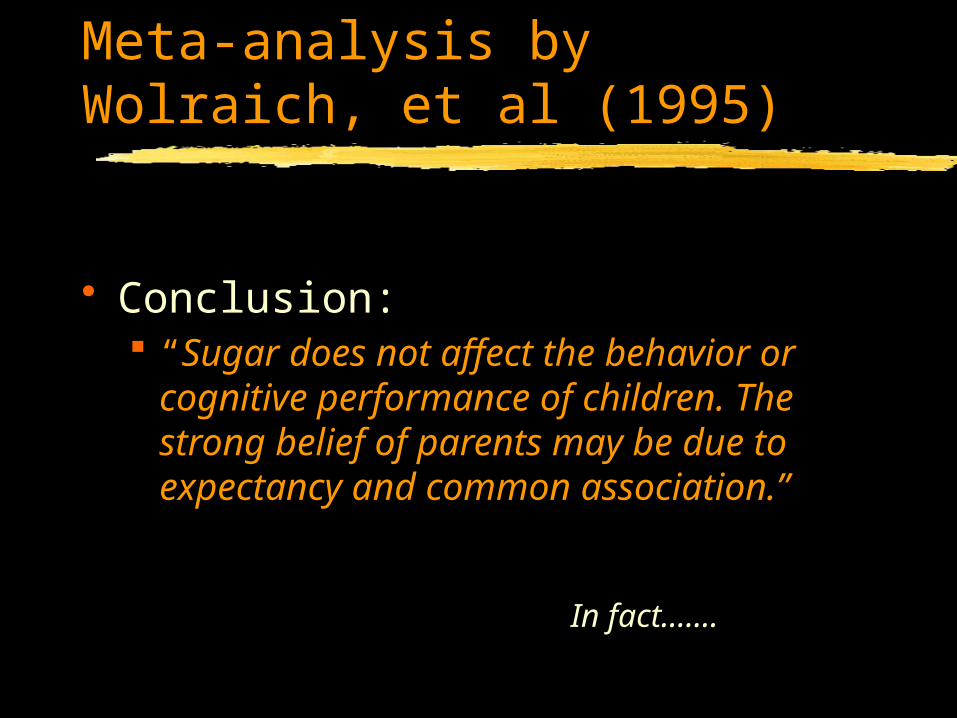
Meta-analysis by Wolraich, et al (1995)
• Conclusion: “Sugar does not affect the behavior
or cognitive performance of children. The strong belief of parents may be due to expectancy and common association.”
In fact…….
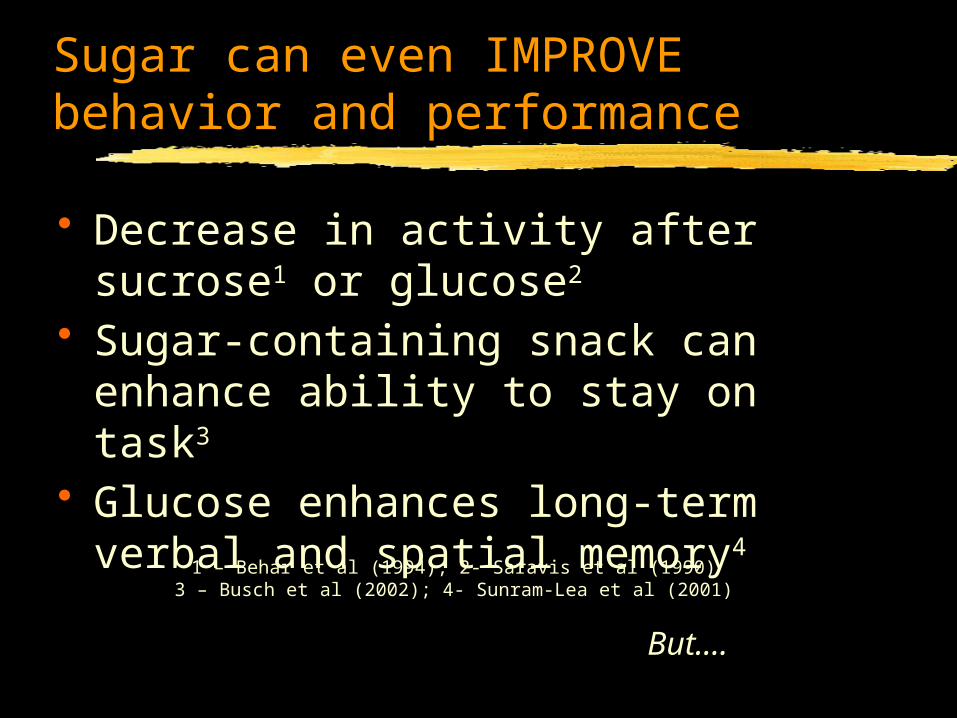
Sugar can even IMPROVE behavior and performance
• Decrease in activity after sucrose1 or glucose2
• Sugar-containing snack can enhance ability to stay on task3
• Glucose enhances long-term verbal and spatial memory4
1 – Behar et al (1994); 2- Saravis et al (1990)3 – Busch et al (2002); 4- Sunram-Lea et al (2001)
But….
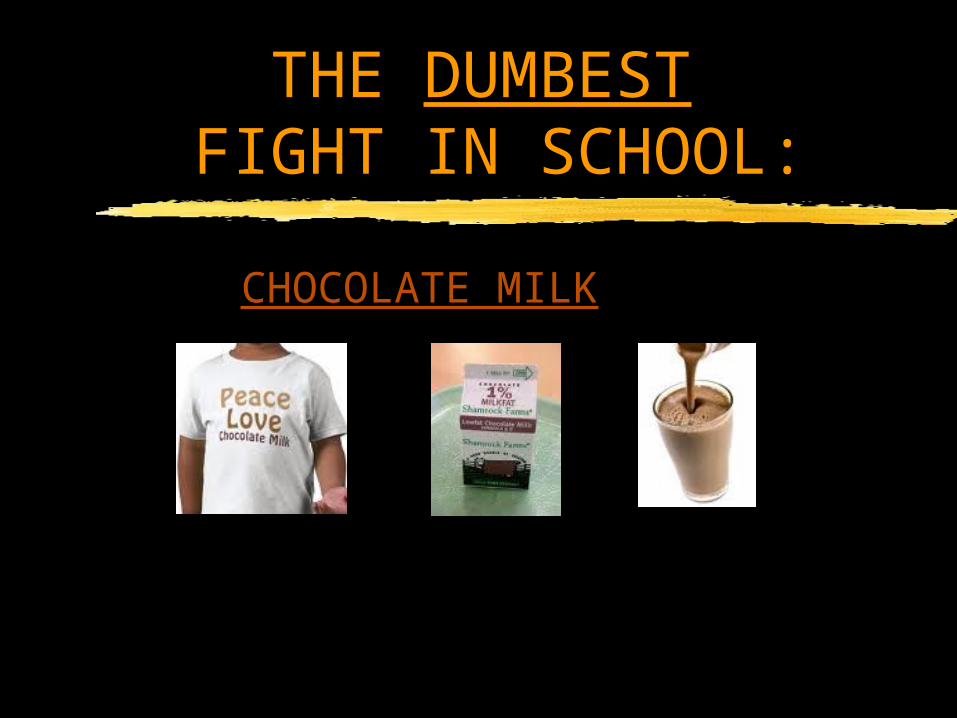
THE DUMBEST FIGHT IN SCHOOL:
CHOCOLATE MILK

Based on Consumer Self-report Data, Americans Under-consume Dairy
1999 2000 2001 2002 2003 2004 2005 2006 2007 2008 20090.0
0.5
1.0
1.5
2.0
2.5
3.0
1.741.85
2.07
1.42
Kids 2 to 5Kids 6 to 12Teens 13 to 17Adults 18+
36
Pyramid Servings of Dairy (Milk, Cheese, Yogurt) in Average Day
Source: NPD Nutrient Intake Database (Self-reported consumption); Years ending
February
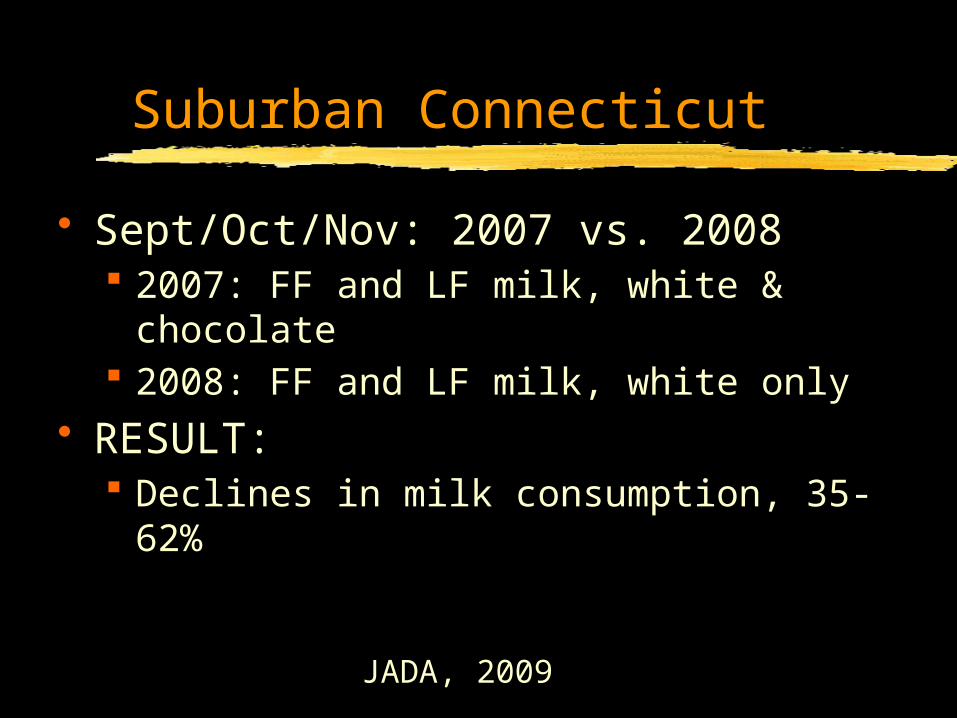
Suburban Connecticut
• Sept/Oct/Nov: 2007 vs. 2008 2007: FF and LF milk, white & chocolate 2008: FF and LF milk, white only
• RESULT: Declines in milk consumption, 35-62%
JADA, 2009

WHEN FLAVORED MILK “DROPS-OUT”…
• 58 elementary & middle schools• 7 school districts across the
country• Flavored milk was eliminated • Also studied:
# of cartons chosen Amount of milk consumed
2010, Milk PEP

…KIDS SPEAK WITH THEIR HANDS
Series1
-40%
-35%
-30%
-25%
-20%
-15%
-10%
-5%
0%
-23%-35%
Cartonschosen
Actual consumption
2010, Milk PEP
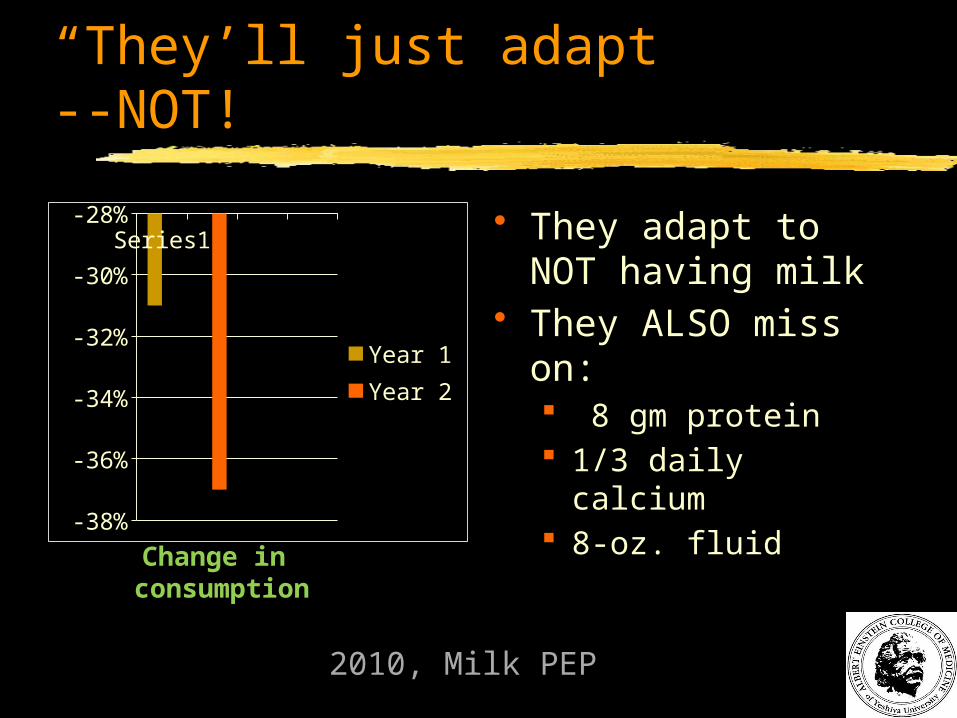
“They’ll just adapt” --NOT!
Se-ries1
-38%-37%-36%-35%-34%-33%-32%-31%-30%-29%-28%
Year 1Year 2
• They adapt to NOT having milk
• They ALSO miss on: 8 gm protein 1/3 daily calcium 8-oz. fluid
2010, Milk PEP
Change in consumption

Wansink & Just
• Two cafeteria lines: Typical meals “healthy express”
• Add low-fat chocolate milk to healthy express line: 18% increase in better-for-you
foods 28% decrease in low-nutrient
foods
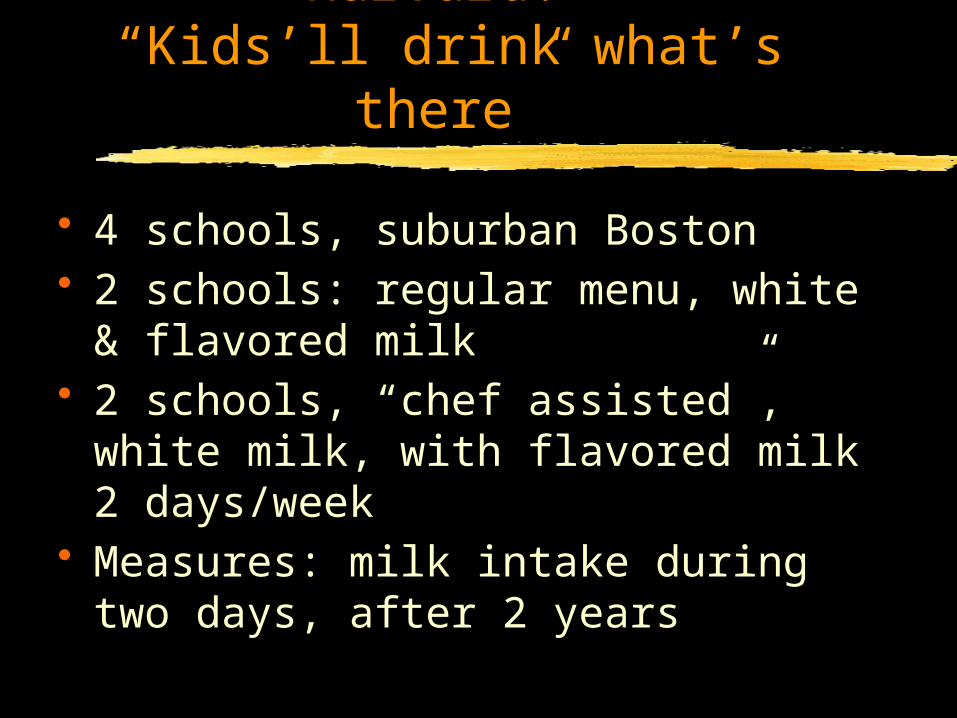
Harvard: “Kids’ll drink what’s there”
• 4 schools, suburban Boston• 2 schools: regular menu, white &
flavored milk• 2 schools, “chef assisted”, white
milk, with flavored milk 2 days/week• Measures: milk intake during two
days, after 2 years
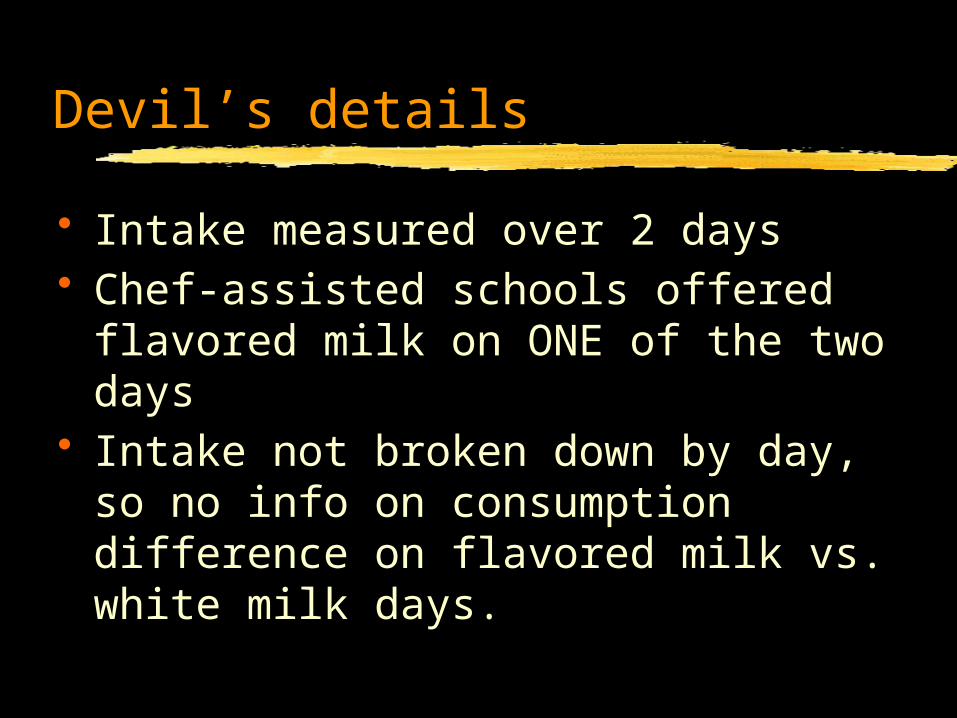
Devil’s details
• Intake measured over 2 days• Chef-assisted schools offered
flavored milk on ONE of the two days• Intake not broken down by day, so
no info on consumption difference on flavored milk vs. white milk days.

Emotion: “40 cal/day of sugar = 11 lb/yr”
• Are the 35% of kids who skip milk losing weight?
• So…..80 FEWER cals/day = 22 lb LOSS/year?

Flavored milk: FACT
• 2763 children 6-11 years 1125 teens, 12-17 years• 3 groups:
Non-consumers of flavored milk
0-240 g >240 g
Johnson, R et al, 2002, JADA
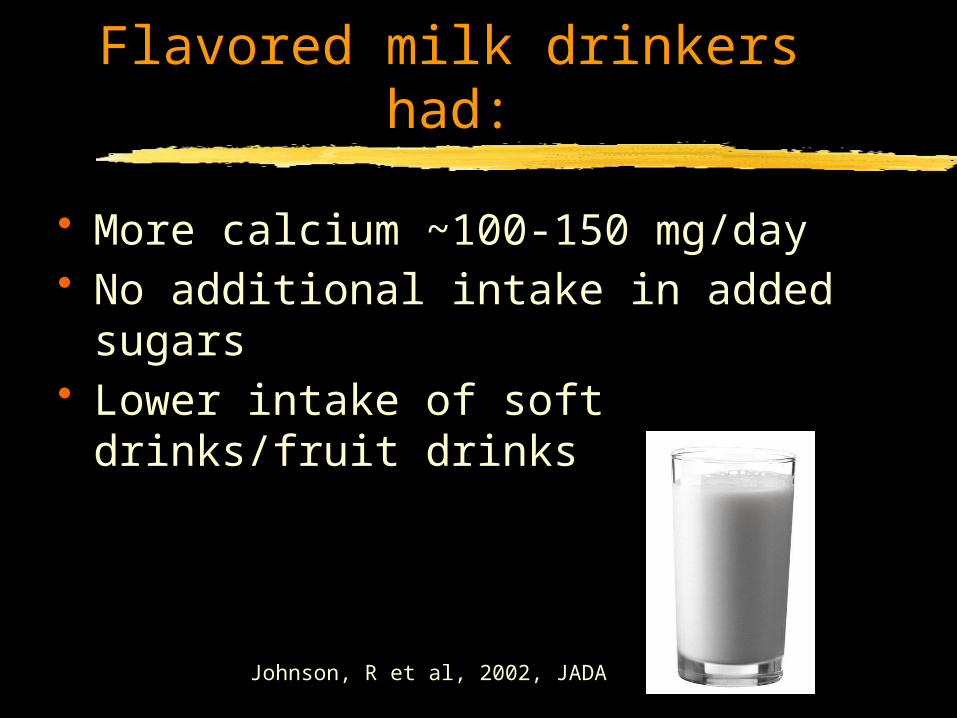
Flavored milk drinkers had:
• More calcium ~100-150 mg/day• No additional intake in added sugars• Lower intake of soft drinks/fruit
drinks
Johnson, R et al, 2002, JADA
Sugary drinks
How much are they getting?Where’s it coming from?
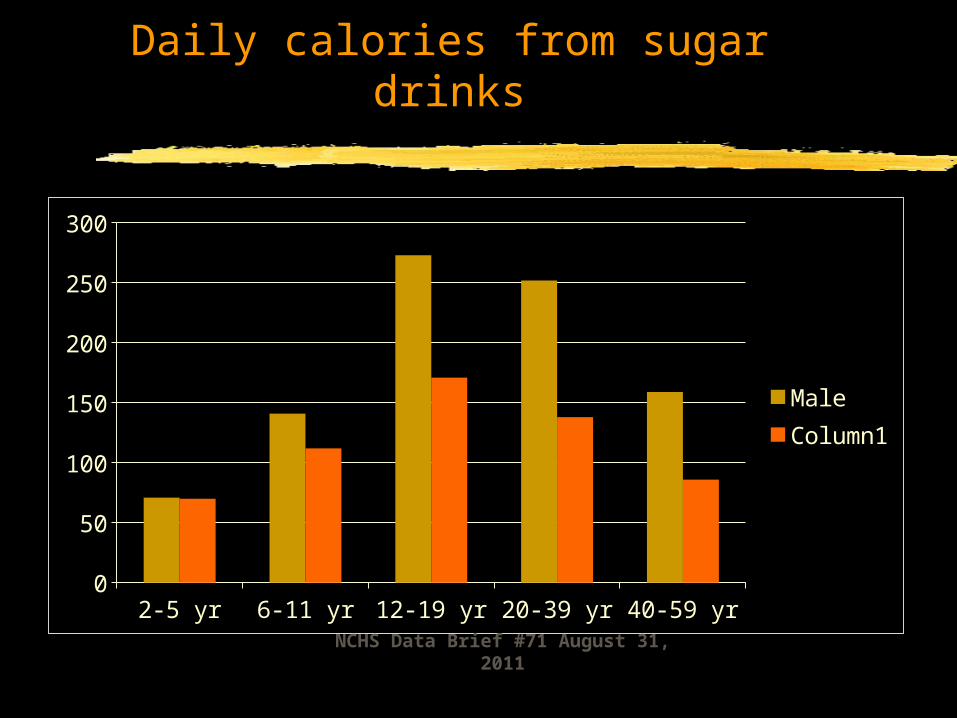
Daily calories from sugar drinks
2-5 yr 6-11 yr 12-19 yr 20-39 yr 40-59 yr0
50
100
150
200
250
300
MaleFemale
NCHS Data Brief #71 August 31, 2011
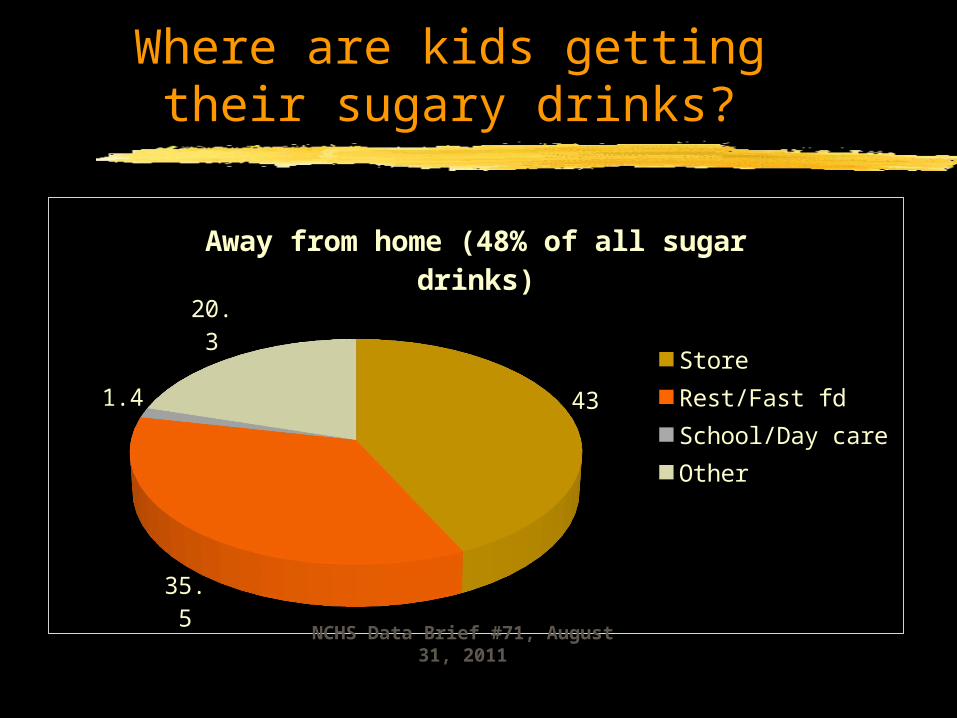
Where are kids getting their sugary drinks?
43
35.5
1.4
20.3
Away from home (48% of all sugar drinks)
StoreRest/Fast fdSchool/Day careOther
NCHS Data Brief #71, August 31, 2011

Discretionary calories: How much is too much?
1400 cal/d
2000 cal/d
2400 cal/d
Total DC 171 cal 267 cal 362 cal
From fat 14 g 18 g 22 g
From sugar
16 g 32 g 48 g
Ref: 2005 US Dietary Guidelines for Americans

Discretionary calories
“…small amounts of sugars added to nutrient-dense foods, such as breakfast cereals and reduced-fat milk products, may increase a person’s intake of such foods… thus improving nutrient intake without contributing excessive calories.”
e.g. to drive the consumption of nutrient-rich foods
2005 US Dietary Guidelines for Americans

The sugar shake-down
• Sugar’s not “angel food” but it’s not “devil’s food” either
• It does NOT get kids “hyper” More likely to be situational
• Not a matter of “good” or “bad” but “how much” and “how often”
REMEMBER THE GOAL
HEALTHIER CHILDREN
Keith-Thomas Ayoob, EdD, RD, FADA
Associate Clinical Professor of PediatricsAlbert Einstein College of Medicine
Bronx, NY718-430-3970 [email protected]
http://www.usnews.com/debate-club/should-sugar-be-regulated/consumers-need-to-be-empowered-not-made-into-victims