


Novel hybrid nanocomposites for applications in sensing, catalysis and imaging
Alaa Mahdi Munshi, MApplSc
This thesis is presented for the degree of Doctor of Philosophy of The University of Western Australia School of Molecular Sciences
2017

Page | i
THESIS DECLARATION I, Alaa Mahdi Munshi, certify that:
This thesis has been substantially accomplished during enrolment in the degree.
This thesis does not contain material which has been accepted for the award of any other
degree or diploma in my name, in any university or other tertiary institution.
No part of this work will, in the future, be used in a submission in my name, for any other
degree or diploma in any university or other tertiary institution without the prior approval
of The University of Western Australia and where applicable, any partner institution
responsible for the joint-award of this degree.
This thesis does not contain any material previously published or written by another
person, except where due reference has been made in the text.
The work(s) are not in any way a violation or infringement of any copyright, trademark,
patent, or other rights whatsoever of any person.
The work described in this thesis was funded by the Australian Research
Council [LP120200660 and FT130101688].
This thesis contains published work and/or work prepared for publication, some of
which has been co-authored.
Signat
Date:
13/11/2017
Page | ii
ABSTRACT
The emerging field of nanomaterials not only possesses the capability of expanding
existing research tools but also the capability to build novel, multifunctional
nanomaterials that are useful for addressing challenges and limitations faced by various
applications such as biological, sensing and catalysis. Nanocomposite platforms that
combined two or more nanosystems have shown abundant advantageous properties and
have become a powerful tools for sensing, catalysis and imaging applications.
Therefore, the goal of this thesis was to develop three different multifunctional
nanomaterials, namely magnetite-coated gold nanorod (GNR-Fe3O4) hybrids (with two
different aspect ratios), gold-coated magnetite (Fe3O4@Au) nanoparticles and thiolated
poly(HEMA-ran-GMA) G4 dendrimer-CdTe quantum dots (QD-polymer
nanocomposites).
The first chapter introduced a detailed literature review of hydrogen peroxide (H2O2)
electrochemical sensors and the nanomaterials applied in H2O2 sensing, the A3-coupling
reaction and QD nanoparticles.
The objectives of this thesis were addressed as published papers and the results were
presented in the following two chapters.
Two GNR-Fe3O4 hybrids with different aspect ratios were designed and fabricated on GC
electrodes for use as H2O2 electrochemical sensors. The challenges associated with
existing materials used for this application include poor reliability, delayed response
times, low sensitivity and poor selectivity. The catalytic and electrochemical
performances toward H2O2 sensing of the two GNR-Fe3O4 hybrids fabricated in this study
were examined by CV and amperometric measurements. Both hybrids showed high
sensitivity and selectivity toward H2O2 while retaining low detection limits. The short
GNR-Fe3O4 hybrid displayed superior catalytic activity for detecting H2O2 as compared
to the long GNR-Fe3O4 hybrid. These results suggested that the aspect ratio of the GNR
can be used to control and improve the detection performance of the H2O2 sensor.
Catalytic performance was enhanced for GNRs with a large surface area available for
H2O2 reduction and in which Fe3O4 could be uniformly coated onto its surface. These
findings are significant toward the improvement and design of next-generation hybrid
nanomaterials intended for H2O2 sensing.
Page | iii
Fe3O4@Au nanoparticles were investigated as a catalyst for the three-component
coupling (A3-coupling) reaction of an aldehyde, an amine and an alkyne to produce a
propargylamine. Two studies were carried using Fe3O4@Au nanocatalysts. In the first
study, the effect of the generation of Fe3O4@Au chain-like structures in the presence of
an external magnetic field on the rate of the A3-coupling reaction was investigated. The
results showed that the rate of the reaction could be remotely controlled in situ by
applying an external magnetic field, thereby facilitating the self-assembly of linearly
aligned chains of Fe3O4@Au nanocatalysts. The rate of the A3-coupling reaction was
decreased in the presence of the magnetic field because the chain formation decreased the
exposed surface area available for catalysis on the surface of the Fe3O4@Au
nanocatalysts. This work represented a significant finding of a new external parameter
that can be used to control the rate of the reaction in situ.
In the second study, Fe3O4@Au nanocatalysts showed high catalytic activity in the A3-
coupling reactions of piperidine, phenylacetylene and several aldehydes to form the
desired propargylamines with good to excellent conversions. In addition, this catalyst
could be magnetically recovered and recycled five times without a significant decrease
in catalytic activity. A further study was carried out using DFT computational analysis to
calculate the aldehyde LUMO densities in an attempt to explain the experimental
reactivity of the various aldehydes. The results indicated that magnetically recyclable,
environmentally friendly Fe3O4@Au nanocatalysts could potentially be used not only in
C-C coupling reactions but in hetero-coupling reactions as well in the future study.
Finally, a novel strategy for synthesising CdTe QD-polymer nanocomposites in an
aqueous solution was developed. The thiolated poly(HEMA-ran-GMA) 4G dendrimer
was used as a stabiliser and size regulator for the CdTe QDs. Morphological and
photophysical characteristics were examined for these nanocomposites. This work
presented a facile and promising strategy for synthesising CdTe QD-polymer
nanocomposites that are potentially useful in biosensing and biological applications.
The final chapter of this thesis presented a summary of the results detailed in the
published papers and introduced the future directions of this thesis.
Page | iv
TABLE OF CONTENTS Thesis Declaration ............................................................................................................. i
Abstract ............................................................................................................................. ii
Table of Contents ............................................................................................................. iv
Abbreviations .................................................................................................................. vii
Acknowledgments ............................................................................................................ xi
Authorship declaration: Co-Authored Publications ....................................................... xii
Details of Publications and Conferences ....................................................................... xiv
CHAPTER 1
INTRODUCTION AND LITERATURE REVIEW ....................................................... 1
1.1 Introduction ............................................................................................................. 1
1.2 Hydrogen Peroxide sensors ..................................................................................... 2
1.2.1 Introduction to hydrogen peroxide sensing ..................................................... 2
1.2.2 Electrochemical sensor cells ............................................................................. 3
1.2.3 Electrochemical sensor methods ...................................................................... 7
1.2.4 Materials used for electrocatalytic H2O2 sensing .......................................... 14
1.3 Three-component coupling reaction ...................................................................... 24
1.3.1 Introduction to the three-component coupling reaction (A3-coupling reaction)
................................................................................................................................. 24
1.3.2 Proposed mechanism of A3-coupling reaction .............................................. 25
1.3.3 A3-coupling reaction ...................................................................................... 26
1.3.4 A3-coupling reaction with nanomateriales .................................................... 34
1.3.5 Asymmetric A3-coupling reaction ................................................................. 42
1.3.6 The adjusment in A3-coupling reaction ......................................................... 45
1.4 Quantum dots nanoparticales ............................................................................... 46
1.4.1 Introduction to the quantum dots nanoparticales (QDs) ................................. 46
1.4.2 Synthesis of fluorescnt QDs ........................................................................... 49
1.4.3 Core-Shell QDs .............................................................................................. 50
1.4.4 QDs surface modification ............................................................................... 52
Page | v
1.5 Summary ............................................................................................................... 54
1.6 The Challenges ...................................................................................................... 55
1.7 The objectives ....................................................................................................... 56
CHAPTER 2
INTRODUCTION TO SERIES OF PAPERS ............................................................... 57
2.1 Development of GNR-Fe3O4 hybrids for H2O2 sensing ....................................... 57
2.2 Magnetically controlled A3-coupling reaction ..................................................... 60
2.3 Fe3O4@Au nanocatalyst for A3-coupling reaction ............................................... 62
2.4 Synthesis of multifunctional CdTe QD-polymer nanocomposites ....................... 65
CHAPTER 3
SERIES OF PAPERS ................................................................................................... 67
3.1 Influence of aspect ratio of magnetite coated gold nanorods in hydrogen peroxide
sensing ........................................................................................................................ 68
3.2 Magnetically directed assembly of nanocrystals for catalytic control of a three-
component coupling reaction ..................................................................................... 74
3.3 Magnetically recoverable Fe3O4@Au-coated nanoscale catalysts for the A3-
coupling reaction ......................................................................................................... 78
3.4 Dendronised polymers as templates for in-situ one-pot quantum dot synthesis .. 83
CHAPTER 4
CONCLUSIONS AND FUTURE WORK .................................................................... 87
4.1 GNR-Fe3O4 hybrids in H2O2 sensing .................................................................... 87
4.2 Magnetically controlled A3-coupling reaction ...................................................... 88
4.3 Catalytic activity of Fe3O4@Au in A3-coupling reaction ..................................... 89
4.4 Synthesis of CdTe QD-polymer nanocomposites ................................................. 90
4.5 Final remarks ......................................................................................................... 92
REFERENCES ............................................................................................................... 94
APPENDIX A .............................................................................................................. 117
Supporting Information for Papers ............................................................................... 117
Supporting Information for Influence of aspect ratio of magnetite coated gold nanorods
in hydrogen peroxide sensing .................................................................................... 118
Page | vi
Supporting Information for Magnetically directed assembly of nanocrystals for
catalytic control of a three-component coupling reaction ......................................... 127
Supporting Information for Magnetically recoverable Fe3O4@Au-coated nanoscale
catalysts for A3-coupling reaction ............................................................................. 134
Supporting Information for Dendronised polymers as templates for in-situ one-pot
quantum dot synthesis ............................................................................................... 144
APPENDIX B .............................................................................................................. 155
Published Papers Not Included in The Thesis .............................................................. 155
Page | vii
ABBREVIATIONS
acac Acetylacetonate
au Atomic unit
A3-coupling reaction Three component coupling reaction
Ag/AgCl electrode Silver-silver chloride electrode
AgNPs Silver nanoparticles
Ag3PW12O40 Silver salt of the 12-tungstophosphoric acid
AuNPs Gold nanoparticles
BDMS Tert-butyldimethylsilyl
bpy 2, 2’-bipyridine
[bmim]PF6 1-Butyl-3-methylimidazolium hexafluorophosphate
CAT Catalase
CdTe Cadmium telluride
CHDA Trans-cyclohexane-1,4-dicarboxylate
CV Cyclic voltammetry
CoO Cobalt oxide
CNTs Carbon nanotubes
CuNPs Copper nanoparticles
CuO Copper oxide
CTAB Cetyltrimethylammonium bromide
Cyt c Cytochrome c
2D Two-dimensional
DDT Dichlorodiphenyltrichloroethane
DFT Density functional theory
DMF Dimethylformamide
Ep Potential cathode peak
E`p Potential anodic peak
∆E Difference between the reduction and oxidation
potential peaks
ECell Cell potential
E0Cell Standard cell potential
EDS Energy-dispersive X-ray spectroscopy
ESP Electrostatic potential
Page | viii
F Faraday constant
FTIR Fourier transform infrared
Fe Iron
Fe2O3 Ferric oxide nanoparticles
FRET Fluorescence resonance energy transfer
GC electrodes Glassy carbon electrodes
GO Graphene oxide
GMA Glycidyl methacrylate
GNR Gold nanorod
G4 dendrimer Fourth generation dendrimer
H2S Hydrogen sulfide
Hb Hemoglobin
HDA Hexadecylamine
HDDO 1,2-hexadecanediol
H2PtCl6 Chloroplatinic acid
HEMA Hydroxyethyl methacrylate
HRP Horseradish peroxidase
H2O2 Hydrogen peroxide
HPA Hexylphosphonic acid
i Cathodic current
i´ Anodic current
IDAs Interdigitated array electrodes
lnQ Natural logarithm of the reaction quotient
IRMOF-3 Isoreticular metal–organic framework
IrO2 iridium dioxide
LBL Layer-by-layer assembly
LDH Layered double hydroxide
LUMO Lowest unoccupied molecular orbital
MB Myoglobin
MCN Mesoporous carbon nitride
MeCN Acetonitrile
MnO Manganese dioxide
MOFs Metal–organic frameworks
MP Micro peroxidase
Page | ix
MPA 3-mercaptopropionic acid
MPS 3-(mercaptopropyl) trimethoxysilane
MS4A 4A molecular sieves
MUA Mercaptoundecanoic acid
MWCNT Multi-walled carbon nanotube
Myr Myristate
n Number of charges or moles
NAP-MgO Nanocrystalline magnesium oxide
NaOH Sodium hydroxide
NaHTe Sodium hydrogen telluride
NCNTs Nitrogen-doped carbon nanotubes
NHC N-heterocyclic carbene
NMCNTs Nitrogen-doped multiwalled carbon nanotubes
NMR Nuclear magnetic resonance
OAc Acetate
PANI Polyaniline
PAMAM Polyamidoamine
PEI Polyethyleneimine
PB Prussian blue
PBNCs Prussian blue nanocubes
PdNPs Palladium nanoparticles
PEG Poly(ethylene glycol)
PEI Polyethyleneimine
PL Photoluminescence
PMO-IL Periodic mesoporous organosilica with an imidazolium
ionic liquid framework
PM Post-covalent modification
poly(NIPAM-co-4-VP] poly(N-isopropylacrylamide-co-4-vinylpyridine)
PPh3 Triphenylphosphine
PtNPs Platinum nanoparticles
pybox Bis(oxazolinyl)pyridine
QDs Quantum dots
QY Quantum yield
R The universal gas constant
Page | x
rGO Reduced graphene oxide
SiO2 Silica
SIPr 1,3-bis(2,6-diisopropylphenyl) imidazolidene
SIRE Injectable recognition elements
TBP Tributylphosphine
TEM Transmission electron microscopy
TGA Thioglycolic acid
THF Tetrahydrofuran
TOA Trioctylamine
TOP Trioctylphosphine
TOPO Trioctylphosphine oxide
TMS Trimethylsilyl
TPDT N-[3–(trimethoxysilyl)propyl] diethylenetriamine]
TiO2 Titanium dioxide
UV–Vis Ultraviolet-visible
XRD X-ray diffraction
Page | xi
ACKNOWLEDGEMENTS
I would like to express my genuine gratitude to thank the people, who without their help
and potential support, this thesis would not have been possible.
I would like firstly, to acknowledge my coordinating supervisor
Profesor Killugudi Swaminatha Iyer, who has supported me throughout my PhD and
research studies with his guidance, patience, incentive, enthusiasm and immense
knowledge. He has always steered my research project in the right the direction and this
research work would not be possible without his supervision. I would also like to
acknowledge my second supervisor Profesor Martin Saunders, who was always available
whenever I needed help or had a question in my PhD research project. I would like to
thank Professor Colin Raston of the School of Chemical and Physical Science at Flinders
University for supervising and enlightening me the first year of my PhD research. In
addition to my PhD supervisors, I want to thank Dr Nicole Smith and Dr Cameron Evans
for their valuable guidance and input through my PhD study and research in many areas.
My sincere thanks also go to Professor Max Massi and Anna Ranieri of the School of
Science at Curtin University for the Photophysics measurements analysis and Professor
Mark Spackman, Dr Sajesh Thomas and Ming Shi for their help in the computational
chemistry analysis. I would like to thank my fellow students in Bionano Group (both past
and present) Dr Domonic Ho, Dr Vipul Agarwal, Diwei Ho, Jessica Kretzmann. I would
also like to acknowledge Lindy Brophy for proofreading the first draft of this thesis.
Additionally, I would like to thank Dr Jane Cross, Dr Dino Spagnoli and Priya Naidu for
proofreading the second draft of this thesis and their valuable and insightful comments. I
want to acknowledge The Centre for Microscopy, Characterisation and Analysis in the
University of Western Australia for providing the support and equipment that I needed
for my PhD research work. For funding, I would like to acknowledge Australian Research
Council (ARC), The Perth Mint and Australian Nanotechnology Network (ANN). I also
want to thank Umm al-Qura University for their financial support granted through the
postgraduate scholarship. Last but not least, I deeply want to thank my family for their
help, care and support throughout my PhD study.
Page | xii
AUTHORSHIP DECLARATION: CO-AUTHORED PUBLICATIONS
This thesis contained published work and work prepared for publication. The detailed
bibliography of the publications and authors contributions are listed below.
Details of the work:
1. Munshi, A. M.; Ho, D.; Saunders, M.; Agarwal, V.; Raston, C. L.; Iyer, K. S.,
Influence of aspect ratio of magnetite coated gold nanorods in hydrogen peroxide
sensing. Sens. Actuator B-Chem. 2016, 235, 492-497. (Published)
Location in thesis:
Chapter 3, 3.1 Influence of aspect ratio of magnetite coated gold nanorods in hydrogen
peroxide sensing.
Author contribution to work: Munshi collaborated with Ho to synthesise magnetite
nanoparticles gold nanorods; Agarwal to acquired DLS measurements on the magnetite
coated gold nanorods; ; remaining authors supervised the work. Contribution by Munshi:
90%
Details of the work:
2. Munshi, A. M.; Agarwal, V.; Ho, D.; Raston, C. L.; Saunders, M.; Smith, N. M.; Iyer,
K. S., Magnetically directed sssembly of nanocrystals for catalytic control of a three-
component coupling reaction. Cryst. Growth Des. 2016, 16 (9), 4773-4776.
(Published)
Location in the thesis:
Chapter 3, 3.2 Magnetically Directed Assembly of Nanocrystals for Catalytic Control
of a Three-Component Coupling Reaction.
Author contribution to work: Munshi collaborated with Agarwal and Ho to synthesise
chain-like Fe3O4@Au nanoparticles; remaining authors supervised the work.
Contribution by Munshi: 90%
Page | xiii
Details of the work:
3. Munshi, A. M.; Shi, S. P.; Thomas, M.; Saunders, M.; M. A. Spackman.; Iyer, K.
S.; Smith, N. M., Magnetically recoverable Fe3O4@Au-coated nanoscale catalysts
for the A3 coupling reaction. Dalton Trans. 2017, 46 (16), 5133-5137. (Published)
Location in the thesis:
Chapter 3, 3.3 Magnetically recoverable Fe3O4@Au-coated nanoscale catalysts for the
A3-coupling reaction.
Author contribution to work: Munshi collaborated with Shi, Thomas and Spackman to
perform computational analysis; remaining authors Saunders, Iyer and Smith supervised
the work. Contribution by Munshi: 85%
Details of the work:
4. Munshi, A. M.; Kretzmann, J. A.; Evans, C.W.; Ranieri, A.M.; Massi, M.; Norret, M.; Saunders, M.; Iyer, K. S., Dendronised polymers as templates for in-situ one-pot quantum dot synthesis. J. Mater. Chem. C. (Submitted)
Location in the thesis:
Chapter 3, 3.4 Synthesis and characterisation of polymeric CdTe quantum dot
composites.
Author contribution to work: Munshi collaborated with Kretzmann and Norret to
synthesise the polymer. Ranieri and Massi to acquire the photophysics measurement;
remaining authors supervised the work. Contribution by Munshi: 80%
Student signature: A
Date: 13-11-2017
I, K. Swaminathan Iyer certify that the student statements regarding their contribution
to each of the works listed above
Coordinating supervisor signature
Date: 13-11-2017
Page | xiv
DETAILS OF PUBLICATIONS AND CONFERENCES
Publications
1. Munshi, A. M.; Ho, D.; Saunders, M.; Agarwal, V.; Raston, C. L.; Iyer, K. S.,
Influence of aspect ratio of magnetite coated gold nanorods in hydrogen peroxide
sensing. Sens. Actuator B-Chem. 2016, 235, 492-497. (Published)
2. Munshi, A. M.; Agarwal, V.; Ho, D.; Raston, C. L.; Saunders, M.; Smith, N. M.; Iyer,
K. S., Magnetically Directed Assembly of Nanocrystals for Catalytic Control of a
Three-Component Coupling Reaction. Cryst. Growth Des. 2016, 16 (9), 4773-4776.
(Published)
3. Munshi, A. M.; Shi, S. P.; Thomas, M.; Saunders, M.; M. A. Spackman.; Iyer, K.
S.; Smith, N. M., Magnetically recoverable Fe3O4@Au-coated nanoscale catalysts
for the A3 coupling reaction. (Published)
4. Munshi, A. M.; Kretzmann, J. A.; Evans, C.W.; Ranieri, A.M.; Massi, M.; Norret,
M.; Saunders, M.; Iyer, K. S., Dendronised polymers as templates for in-situ one-pot
quantum dot synthesis. J. Mater. Chem. C. (Submitted)
5. Ho, D.; Zou, J.; Chen, X.; Munshi, A.; Smith, N. M.; Agarwal, V.; Hodgetts, S. I.;
Plant, G. W.; Bakker, A. J.; Harvey, A. R.; Luzinov, I.; Iyer, K. S., Hierarchical
Patterning of Multifunctional Conducting Polymer Nanoparticles as a Bionic
Platform for Topographic Contact Guidance. ACS Nano 2015, 9 (2), 1767-1774.
(Published)
Location in the thesis:
Appendix B.
Author contribution: Munshi acquired the TEM images photophysics protocol for
electrospinning, performed characterisation and contributed to the manuscript.
Contribution by Munshi: 20%.
6. Agarwal, V., Ho, D., Ho, D., Galabura, Y., Yasin, F. M.D., Gong, P., Ye, W., Singh,
R., Munshi, A., Saunders, M., Woodward, R. C., St. Pierre, T., Wood, F.M., Fear, M.,
Lorenser, D., Sampson, D. D., Zdyrko, B., Smith, N.M., Luzinov, I., Iyer, K.S., A
Page | xv
Functional Reactive Polymer Electrospun Matrix, ACS Appl. Mater.
Interfaces 2016 8 (7), 4934-4939. (Published)
Location in thesis:
Appendix B.
Author contribution: Munshi synthesised palladium nanoparticles and acquired TEM
images. Contribution by Munshi: 20%
7. Smith, N. M.; Ho, D.; Munshi. A. M.; House, M. J.; Dunlop, S. A.; Fitzgerald,
M.; Iyer, K. S., Poly(glycidyl methacrylate) coated dual mode upconverting
nanoparticles for neuronal cell imaging. New J. Chem 2016, 40 (8), 6692-6696.
(Published).
Location in thesis:
Appendix B.
Author contribution: Munshi acquired TEM images and Selected area electron
diffraction. Contribution by Munshi: 20%.
Conferences
Poster Presentation
1. The 23rd Australian Conference on Microscopy and Microanalysis (ACMM23)
and the International Conference on Nanoscience and Nanotechnology (ICONN
2014), 2-6 February, 2014, the Adelaide Convention Centre, South Australia,
Australia.
Au-Fe3O4 Hybrid nanocatalysts in electrochemical sensing for H2O2
2. Nanotechnology Entrepreneurship Workshop for Early Career Researchers, 10-
11 June, 2015, Griffth University, Gold Coast, Australia.
Fe3O4-Au nanoparticles coreshell catalysts for three-component coupling
reaction.
Page | 1
CHAPTER 1
INTRODUCTION AND LITERATURE REVIEW
1.1 Introduction
In recent years, nanomaterials have attracted increasing research attention because, in
addition to their large surface area, they have unique optical, physical, chemical and
electrical properties that make them potential candidates for use in catalysis, sensing and
biological applications.1,2 Moreover, the simplicity of synthesising and characterising
nanoparticles, as well as functionalising their surface, has broadened their potential
applications.3 The properties and characteristics of noble metal nanoparticles can be
controlled by tuning their size and shape, which are fundamental parameters to be
considered for the realisation of novel features.3 Overall, considering all of the above
mentioned, it is not surprising that the demand to develop and produce diverse
nanostructured materials has increased significantly.
The use of nanoparticles in sensing applications, mainly H2O2 sensing, has yielded fruitful
results because of their low cost, high selectivity and sensitivity, fast detection and
enhanced electron transfer and mass transport.4 In catalytic applications, nanomaterials
have been demonstrated to show high activity, selectivity, easy recovery from the reaction
mixture and reusability, which can be attributed to their ability to mimic heterogeneous
and homogeneous catalysts.3 Lastly, the unique optical, chemical and physical properties
of quantum dots, or semiconductor nanoparticles, make them favourable candidates for
imaging applications and allow them to function as common platforms for the design of
multifunctional nanoprobes.5
This thesis reports three different multifunctional nanosystems. Firstly, magnetite-coated
gold nanorod (GNR-Fe3O4) hybrids (with two different aspect ratios); secondly, gold-
coated magnetite (Fe3O4@Au) nanoparticles; and thirdly, CdTe-polymeric quantum dots
(QDs). The utility of these systems will be discussed in the following sections, where a
comprehensive overview of the current literature covering the use of nanoparticles in
H2O2 sensing, the A3-coupling reactions and the different structures and designs of QDs
for bioimaging/sensing applications is presented. The application of nanomaterials in
H2O2 sensing will be first discussed. This will comprise the preamble of existing H2O2
Page | 2
sensing techniques, the working principle of the electrochemical cell, some of
electrochemical techniques principles and review of the nanomaterials applied in H2O2
sensing. Subsequent to this, the A3-coupling reaction will be reviewed. This will include
the introduction of this reaction, the proposed mechanism in the A3-coupling reaction, the
catalytic activity of several metal catalysts homogeneous and heterogeneous system and
the catalyst efficacy of various metals nanomaterials in the A3-coupling reaction. The
summary of asymmetric the A3-coupling reaction and the adjustments in the A3-coupling
reaction will then be introduced. Finally, the synthesis of QD nanoparticles and the
surface modification of the QDs will be discussed.
1.2 Hydrogen peroxide sensors
1.2.1 Introduction to hydrogen peroxide sensing
Hydrogen peroxide (H2O2) is one of the most well-known molecules in the laboratory and
plays a significant role in several domestic and industrial applications, such as clinical
research, food processing and environmental manufacturing.6-8 It is also utilised in
various biological processes and intercellular pathways, usually acting as a messenger
and is a side product of several enzyme-catalysed biological functions such as urate
oxidase, glucose oxidase, lysine oxidase, D-amino acid oxidase and oxalate oxidase.9-12
H2O2 levels should not be greater than fifty µM in plants and animals, as levels above this
concentration are cytotoxic.13 In addition, H2O2 is implicated in some health issues such
as premature ageing and asthma.14-16 It is, thus, crucial to accurately measure H2O2 levels
using a sensitive, fast and inexpensive method. Several methods are commonly used for
the determination of H2O2, including fluorometry,17 titrimetry,18 spectrophotometry19 and
chromatography.20
However, these methods have some procedural complications, including expensive
instrumentation, long measuring times, poor sensitivity and selectivity.21 In recent years
electrochemical sensors have been developed as an economical, accurate, simple,
sensitive and accessible method for H2O2 determination.22
Page | 3
In electrochemical sensors, H2O2 is either oxidised or reduced on the surface of a solid
electrode. However, the sensing performance of these devices is restricted due to the slow
kinetics of these redox processes and a high overpotential.23 Additionally, some materials
such as urate and ascorbate can interfere with the processes.23 Recent studies in
electrochemical sensors are therefore designed at electrode modifications, in order to
increase their ability to transfer electrons and reduce the overpotential.23 Thus, a wide
range of materials, including transition metals,24 redox proteins25 and dyes26 are being
extensively researched for use in the electrochemical sensing of H2O2.23
Lately, nanomaterials have drawn research attention due to their favourable and unique
electronic, physical and chemical properties, which make them more suitable for
electrochemical and electrocatalytic applications than their bulk counterparts.
Nanomaterials have been shown to possess high sensitivity, biocompatibility, stability
and catalytic activity.27-29 The physical structure of nanomaterials can be easily
manipulated, increasing their sensing ability and requiring smaller volumes of analyte
material. Recently, a comprehensive research study has been focused on engineering and
forming new H2O2 sensors and improving their analytic functioning.23
Electrochemical sensor cells usually comprise of two or three electrodes that perform the
sensor function. The electrochemical sensing depends on the reaction at the electrode
surface; therefore, different electrode substrate materials have been investigated to
improve their efficiency in electrochemical analysis.
1.2.2 Electrochemical sensor cells
Commonly, measurement by electrochemical cell is conducted using a two- or three-
electrode system but the three-electrode system is favourable, as using a reference
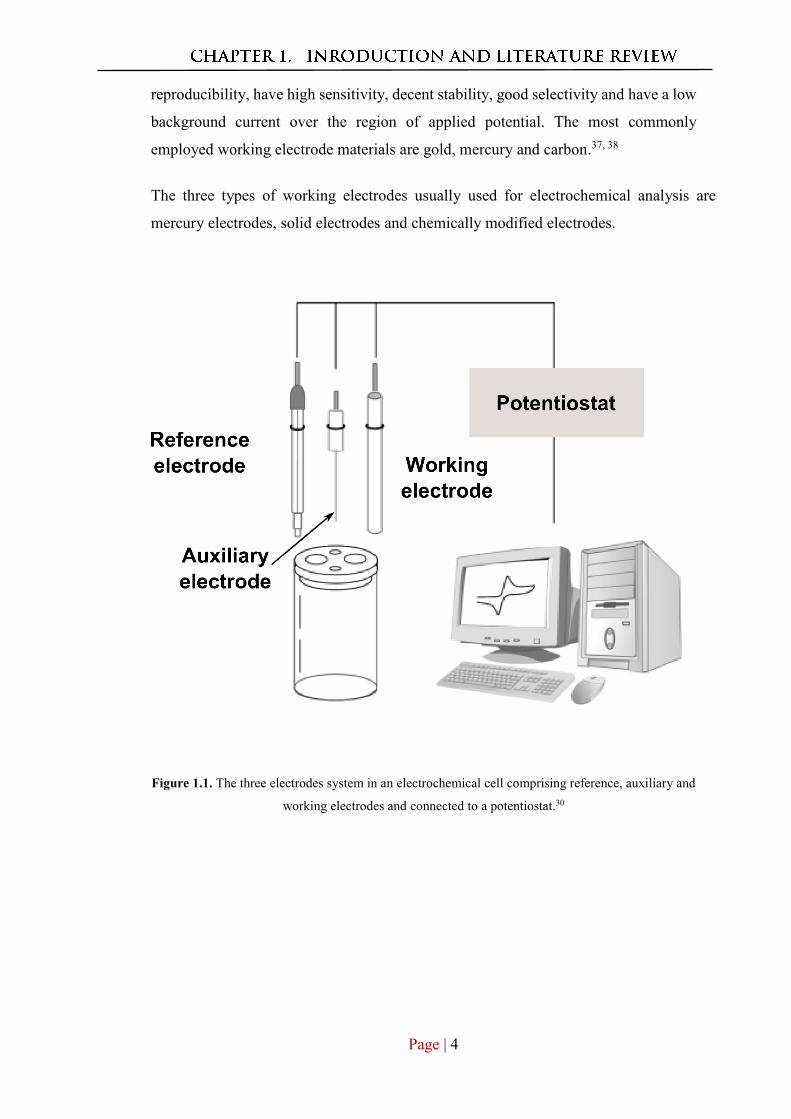
electrode can reduce resistance.30 A three-electrode system comprising a counter
electrode, a reference electrode and a working electrode is illustrated in Figure 1.1.30
The counter (or ‘auxiliary’) electrode, commonly made of platinum, has a large surface
area to help reduce electron resistance and produce a high current.31-33 The reference
electrode, for instance, a saturated calomel electrode (SCE)34 or silver-silver chloride
electrode Ag/AgCl electrode has a stable potential.35, 36
The working electrode is the most important part of the electrochemical cell and is
critical for experimental accuracy.37, 38 It must be able to redox the analyte, have good
Page | 4
reproducibility, have high sensitivity, decent stability, good selectivity and have a low
background current over the region of applied potential. The most commonly
employed working electrode materials are gold, mercury and carbon.37, 38
The three types of working electrodes usually used for electrochemical analysis are
mercury electrodes, solid electrodes and chemically modified electrodes.
Figure 1.1. The three electrodes system in an electrochemical cell comprising reference, auxiliary and
working electrodes and connected to a potentiostat.30
Page | 5
1.2.2.1 Mercury electrodes
The smooth surface of mercury electrodes shows high reducibility, renewability and a
broad cathodic potential.39, 40 Mercury electrodes are also available in a variety of
structures such as hanging mercury drop electrodes,41 dropping mercury electrodes,42
and mercury film electrodes.43 Dropping mercury electrodes are simple to use because
cleaning or polishing are not required.44 Conversely, mercury film electrodes are
difficult to prepare, clean and recycle.43 Additional concerns with the use of mercury
electrodes are their toxicity, disposal and narrow anodic range.45, 46 These factors limit
their use in biological, environmental and clinical applications.45, 46 Therefore, in many
cases mercury electrodes have been replaced by bismuth electrodes, due to their
similar characteristics.47
1.2.2.2 Solid electrodes
Unlike mercury electrodes, solid electrodes possess a wide anodic potential window.
Moreover, various kinds of solid electrodes have been employed as working
electrodes; for example, platinum,48 gold,49 silver50 and carbon electrodes.51 For high
performance and reproducibility, solid electrodes need to be retreated and polished
with various methods, depending on the nature of the electrode.52, 53 Metal electrodes
such as gold, platinum and silver have a wide anodic potential and are easy to
assemble. However, they have a narrow cathodic potential window and small
hydrogen overvoltage.54 Conversely, carbon electrodes possess many attractive
qualities such as high stability, conductivity, activity under different conditions, low
background voltage, low cost, a wide anodic potential window, a smooth surface, non-
toxicity and facile renewability.55, 56 All these features have made carbon electrodes
such as epoxy-bonded graphite electrodes,57carbon paste electrodes,58 glassy carbon
(GC) electrodes59 and carbon fibre electrodes60 among the most commonly used in
research.
1.2.2.3 Chemically modified electrodes
In 1973, Lane and Hubard reported their initial work on the modification of electrodes,
in which they chemisorbed different olefin compounds onto the surface of platinum
electrodes.61, 62 Since then, electrodes have been significantly improved, with various
materials being used to modify electrode surfaces, such as conducting polymers63 and
Page | 6
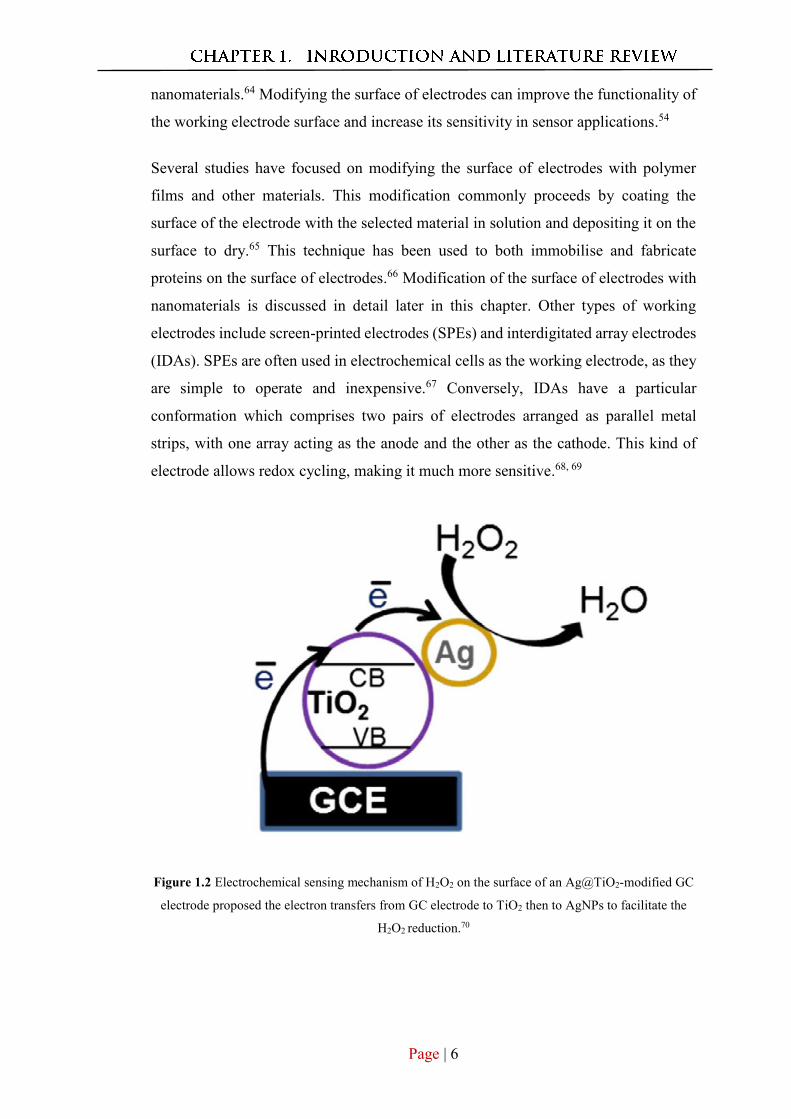
nanomaterials.64 Modifying the surface of electrodes can improve the functionality of
the working electrode surface and increase its sensitivity in sensor applications.54
Several studies have focused on modifying the surface of electrodes with polymer
films and other materials. This modification commonly proceeds by coating the
surface of the electrode with the selected material in solution and depositing it on the
surface to dry.65 This technique has been used to both immobilise and fabricate
proteins on the surface of electrodes.66 Modification of the surface of electrodes with
nanomaterials is discussed in detail later in this chapter. Other types of working
electrodes include screen-printed electrodes (SPEs) and interdigitated array electrodes
(IDAs). SPEs are often used in electrochemical cells as the working electrode, as they
are simple to operate and inexpensive.67 Conversely, IDAs have a particular
conformation which comprises two pairs of electrodes arranged as parallel metal
strips, with one array acting as the anode and the other as the cathode. This kind of
electrode allows redox cycling, making it much more sensitive.68, 69
Figure 1.2 Electrochemical sensing mechanism of H2O2 on the surface of an Ag@TiO2-modified GC
electrode proposed the electron transfers from GC electrode to TiO2 then to AgNPs to facilitate the
H2O2 reduction.70
Page | 7
Electrochemical cell sensors consist of three electrodes (working, reference and
counter), an electrolyte and a potentiostat, which are the potential generator and
controller. Figure 1.1 illustrates all three electrodes in the cell.30 The reaction begins
when the working electrodes contact the analyte; then the external circuit allows the
current to pass through the working electrode to the counter electrode. However, the
reference electrode remains stable and works as a reference to allow the accurate
monitoring of the potential of the working electrode. Consequently in a sensor, the
potential remains between the working electrode and the reference electrode.71 The
amount of current produced is thus related to the amount of target analyte (H2O2) that
has been oxidised or reduced on the surface of the working electrode. Figure 1.2
illustrates the reaction on the surface of Ag@TiO2-modified GC electrode and the net
reaction of the H2O2 on the surface of the working electrode is shown below.70
H2O2 + 2e− + 2H+ ⇌ 2H2O
Various electrochemical techniques have been applied to sense H2O2 in samples.
Therefore it is important to introduce the principle of these techniques briefly.
1.2.3 Electrochemical sensor methods
Electrochemical sensing can be performed using different operating methods. Those that
are most commonly applied to detect H2O2 are the Voltammetric and amperometric
methods,44, 67 which measure changes in current and the potentiometric method, which
measures changes in potential.72
1.2.3.1 Voltammetry method
The voltammetry method is an electrochemical technique in which current is measured
over a potential range. The current signal typically appears as a plateau or peak that is
related to the target analyte concentration.44, 73 This technique, also known as
polarography, was invented by the Czech chemist Jaroslav-Heyrovsky in 1922, using a
dropping mercury electrode. Since then, several voltammetric techniques have been
developed, including linear sweep voltammetry, cyclic voltammetry, differential pulse
voltammetry and square-wave voltammetry.44, 73
Page | 8
1.2.3.1.1 Linear sweep voltammetry
Linear sweep voltammetry is the basic method of potential measurement in
electrochemical analysis. This method is similar to CV but uses an irreversible scan. In
linear sweep voltammetry, the applied potential is varied linearly with time and the
measured current is plotted vs. the applied potential.71, 74
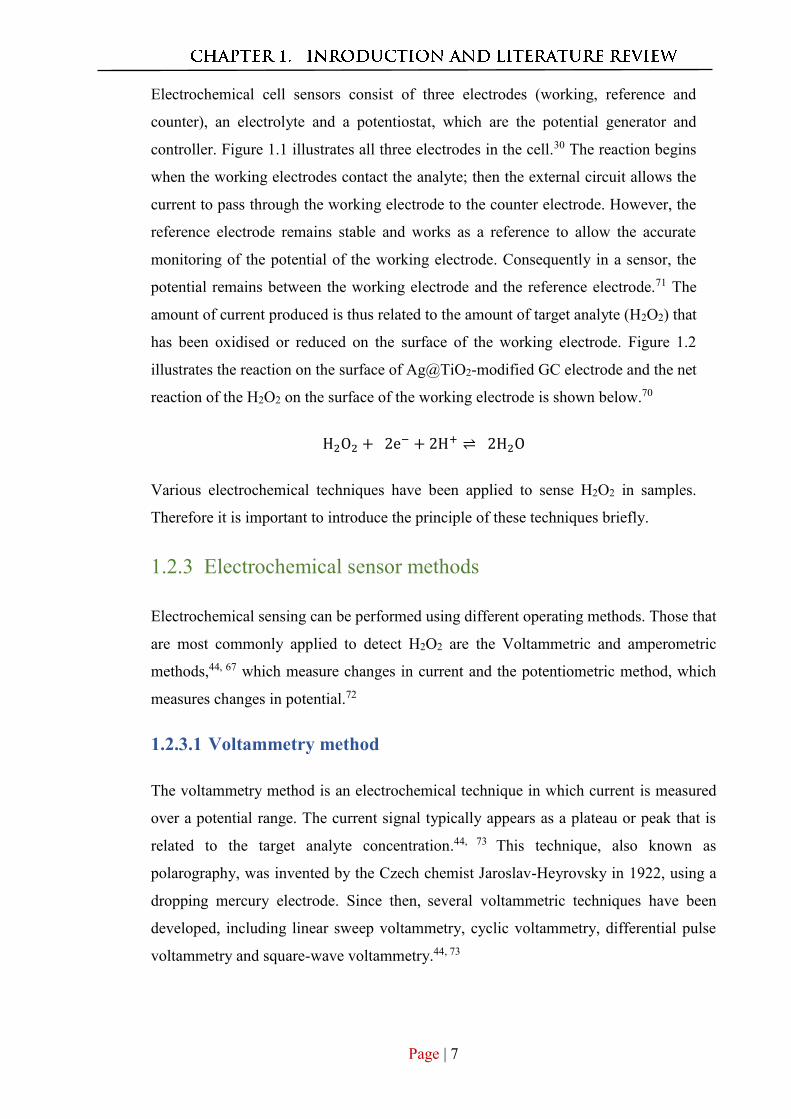
Figure 1.3 shows the current rising to a peak and the value of the current peak height
increasing gradually with H2O2 concentrations at GC/TPDT-SiO2@Au nanoparticles
electrode in 0.1M phosphate buffer at 50mVs-1 scan rate.75
Figure 1.3 linear sweep voltammetry of addition of series concentration of H2O2 at GC/TPDT-SiO2@Au
nanoparticles electrode in 0.1M phosphate buffer at 50mVs-1 scan rate.76
1.2.3.1.2 Cyclic voltammetry
Cyclic voltammetry (CV) is an electrochemical method that is used to measure reduction
or oxidation reactions and provide information about the chemical processes occurring at
the electrode.77 CV measures the variation of current, which is related to the reaction on
the surface of the working electrode, with single or multiple cycles of the potential
applied.77
Page | 9
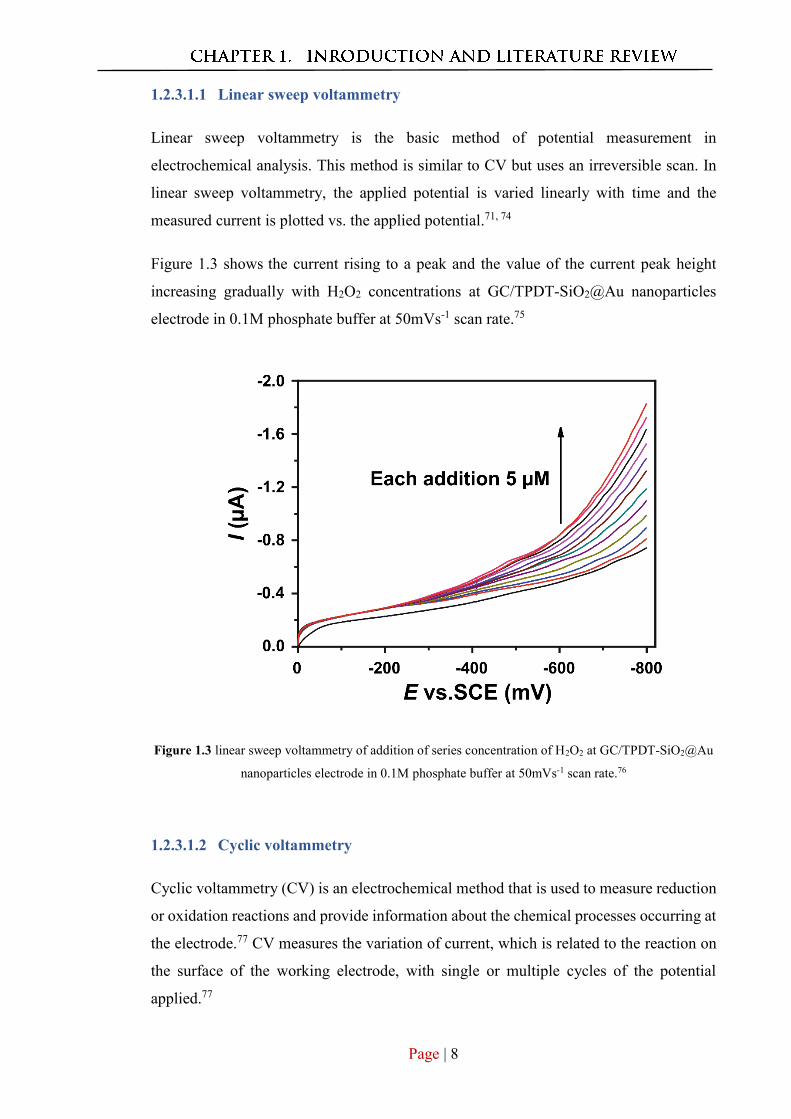
The voltage in the voltammetry method is dependent on the measuring target analyte.
Therefore, this method provides information on the concentration of the analyte and
reaction kinetics.77 Figure 1.4 shows a voltammogram for the reversible reaction
Fe(CN)63− + e− ⇌ Fe(CN)6
4−
Showing the current plotted against the voltage and introducing the main measuring
parameters for the CV technique: Ep is the potential cathode peak, Ep´ is the potential
anodic peak, i is the cathodic current and i´ is the anodic current. ∆E is the difference
between the reduction and oxidation potential peaks
Figure 1.4 The cyclic voltammogram presenting the main parameters (Ep, E`p, i, i`and ΔE) and the
reduction and oxidation peaks.77
∆E = Ep´ − Ep
The forward scan starts with low current at the initial voltage which then proceeds as the
reduction reaction begins to form the product. The current then increases to reach the
Page | 10
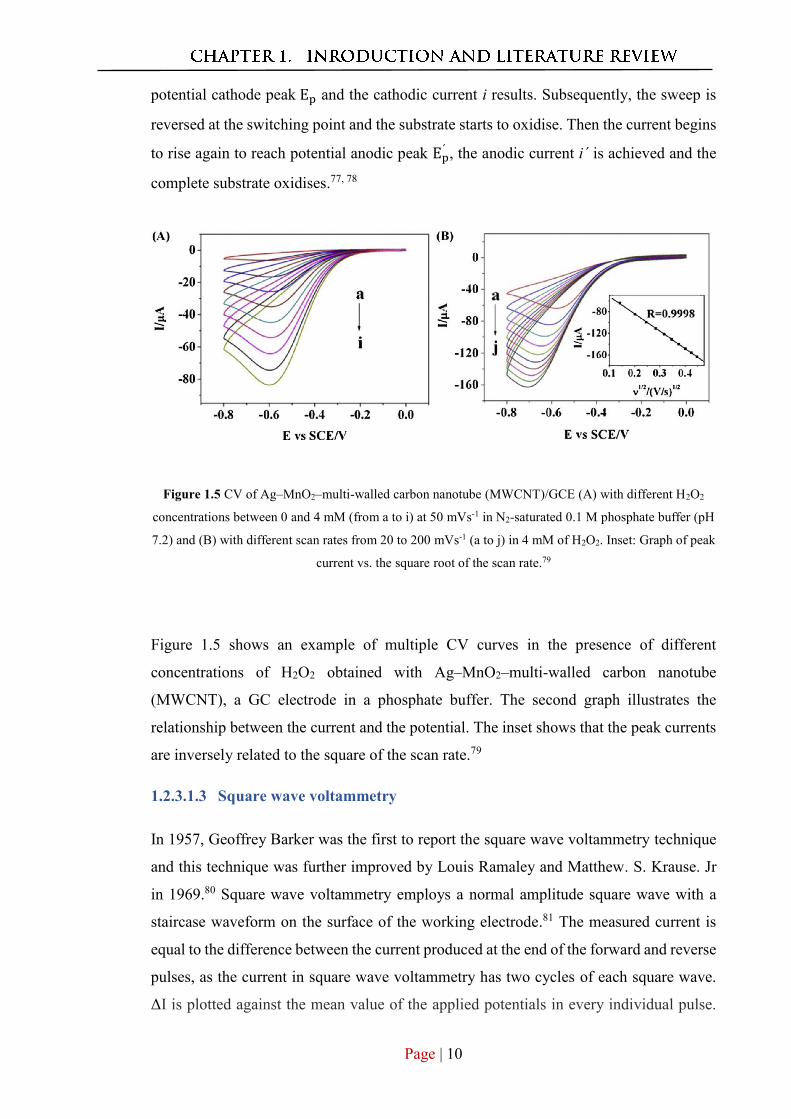
potential cathode peak Ep and the cathodic current i results. Subsequently, the sweep is
reversed at the switching point and the substrate starts to oxidise. Then the current begins
to rise again to reach potential anodic peak Ep´ , the anodic current i´ is achieved and the
complete substrate oxidises.77, 78
Figure 1.5 CV of Ag–MnO2–multi-walled carbon nanotube (MWCNT)/GCE (A) with different H2O2
concentrations between 0 and 4 mM (from a to i) at 50 mVs-1 in N2-saturated 0.1 M phosphate buffer (pH
7.2) and (B) with different scan rates from 20 to 200 mVs-1 (a to j) in 4 mM of H2O2. Inset: Graph of peak
current vs. the square root of the scan rate.79
Figure 1.5 shows an example of multiple CV curves in the presence of different
concentrations of H2O2 obtained with Ag–MnO2–multi-walled carbon nanotube
(MWCNT), a GC electrode in a phosphate buffer. The second graph illustrates the
relationship between the current and the potential. The inset shows that the peak currents
are inversely related to the square of the scan rate.79
1.2.3.1.3 Square wave voltammetry
In 1957, Geoffrey Barker was the first to report the square wave voltammetry technique
and this technique was further improved by Louis Ramaley and Matthew. S. Krause. Jr
in 1969.80 Square wave voltammetry employs a normal amplitude square wave with a
staircase waveform on the surface of the working electrode.81 The measured current is
equal to the difference between the current produced at the end of the forward and reverse
pulses, as the current in square wave voltammetry has two cycles of each square wave.
ΔI is plotted against the mean value of the applied potentials in every individual pulse.
Page | 11
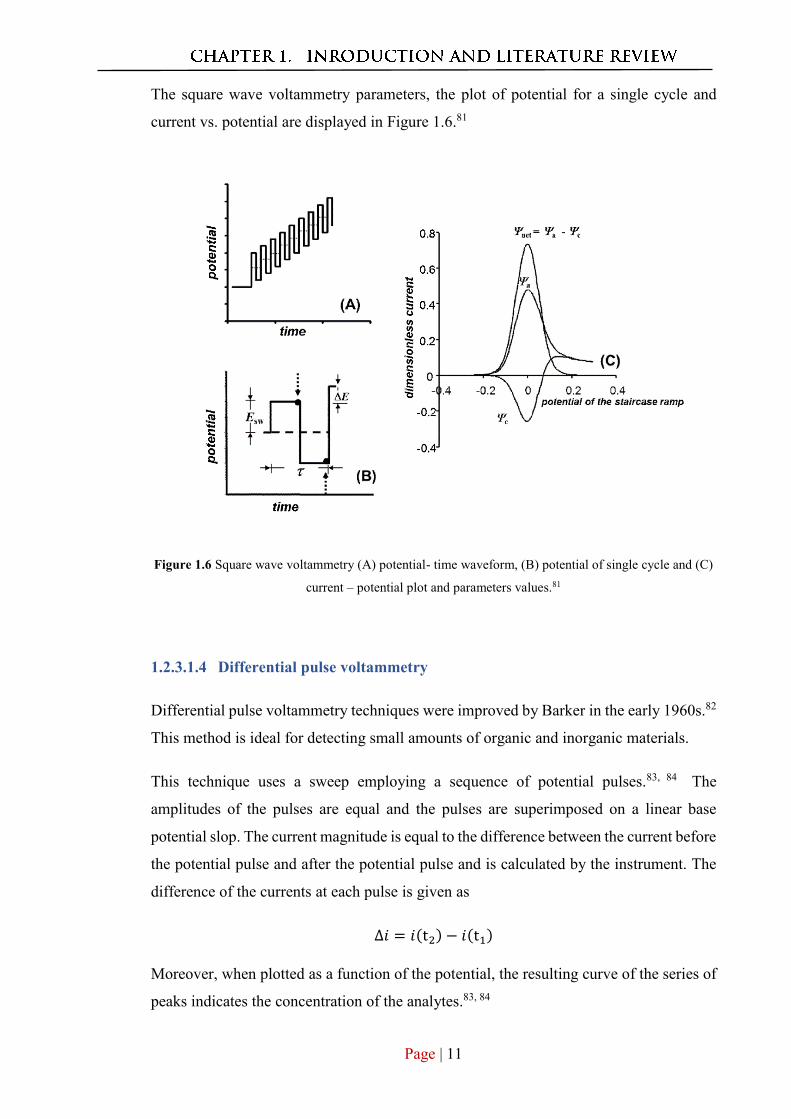
The square wave voltammetry parameters, the plot of potential for a single cycle and
current vs. potential are displayed in Figure 1.6.81
Figure 1.6 Square wave voltammetry (A) potential- time waveform, (B) potential of single cycle and (C)
current – potential plot and parameters values.81
1.2.3.1.4 Differential pulse voltammetry
Differential pulse voltammetry techniques were improved by Barker in the early 1960s.82
This method is ideal for detecting small amounts of organic and inorganic materials.
This technique uses a sweep employing a sequence of potential pulses.83, 84 The
amplitudes of the pulses are equal and the pulses are superimposed on a linear base
potential slop. The current magnitude is equal to the difference between the current before
the potential pulse and after the potential pulse and is calculated by the instrument. The
difference of the currents at each pulse is given as
∆𝑖 = 𝑖(t2) − 𝑖(t1)
Moreover, when plotted as a function of the potential, the resulting curve of the series of
peaks indicates the concentration of the analytes.83, 84
Page | 12
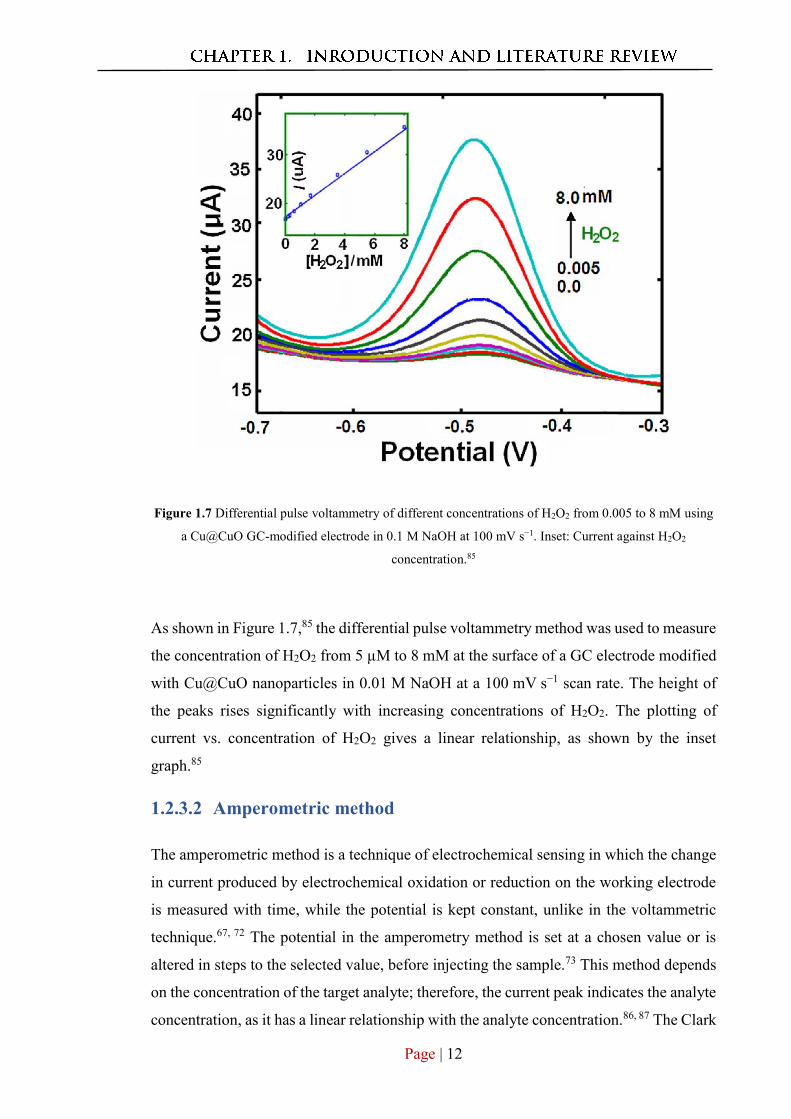
Figure 1.7 Differential pulse voltammetry of different concentrations of H2O2 from 0.005 to 8 mM using
a Cu@CuO GC-modified electrode in 0.1 M NaOH at 100 mV s−1. Inset: Current against H2O2
concentration.85
As shown in Figure 1.7,85 the differential pulse voltammetry method was used to measure
the concentration of H2O2 from 5 µM to 8 mM at the surface of a GC electrode modified
with Cu@CuO nanoparticles in 0.01 M NaOH at a 100 mV s−1 scan rate. The height of
the peaks rises significantly with increasing concentrations of H2O2. The plotting of
current vs. concentration of H2O2 gives a linear relationship, as shown by the inset
graph.85
1.2.3.2 Amperometric method
The amperometric method is a technique of electrochemical sensing in which the change
in current produced by electrochemical oxidation or reduction on the working electrode
is measured with time, while the potential is kept constant, unlike in the voltammetric
technique.67, 72 The potential in the amperometry method is set at a chosen value or is
altered in steps to the selected value, before injecting the sample.73 This method depends
on the concentration of the target analyte; therefore, the current peak indicates the analyte
concentration, as it has a linear relationship with the analyte concentration.86, 87 The Clark
Page | 13
oxygen electrode, which comprises Pt and Ag/AgCl as the working electrode and
reference electrode, respectively, is a simple example of a amperometric biosensor in
which the current is measured at constant potential and different concentrations of
oxygen.88 Recently, this sensor has been adapted to monitor various analytes such as H2S,
glucose and H2O2.87 The amperometry method has many advantages such as short
operating time, high selectivity, high sensitivity and low detection limit.73 Moreover, it
may be further improved by using more than one working electrode or a modified
electrode.89 Furthermore, this kind of electrochemical analysis may be used with flow
systems, making them more applicable to environmental and industrial applications than
steady-state set systems.73
1.2.3.3 Potentiometric method
The potentiometric technique involves plotting the potential at the reaction equilibrium
against the logarithm of the target analyte concentration while the current is kept
constant.72 The potentiometric technique is an ideal method to monitor samples that have
a small volume and low concentration.86 The relationship can be defined using the Nernst
equation below because all the reactions in this technique are at equilibrium.
ECell = ECell0 −
RTnF lnQ
In this equation, ECell is the obtained cell potential, ECell0 is the standard cell potential, R
is the universal gas constant and T is temperature. In addition, n is the number of charges
or moles, F is the Faraday constant and lnQ is the natural logarithm of the reaction
quotient.90 This technique uses two electrodes: a working electrode and a reference
electrode and the data is obtained by altering the potential between these electrodes.91
Recent improvements in the selectivity and sensitivity of these electrodes, as well as their
stability and low cost, have led to the development of ion-selective electrodes for use as
working electrodes in potentiometric techniques.92 In addition, the sensitivity and
selectivity of ion-selective electrodes to anions, cations and neutral target analytes has
been enhanced using membranes composed of materials such as polyvinylchloride and
carbon-based materials.93
Page | 14
1.2.4 Materials used for electrocatalytic H2O2 sensing
1.2.4.1 Enzymatic H2O2 biosensors
Amperometric biosensors based on redox reactions of proteins have been shown to be
sensitive, selective and stable in biosensing applications such as environmental and
clinical detection.94
1.2.4.1.1 Heme proteins
Heme proteins are a class of metalloproteins which include cytochrome c (Cyt c), catalase
(CAT), horseradish peroxidase (HRP),95, 96 myoglobin (MB),97 hemoglobin (Hb) 98 and
micro peroxidase (MP) containing an iron porphyrin.23 Iron in heme has the ability to
oxidise or reduce over a broad range of potentials that depend on the kind of heme
surrounding the iron.23 Commonly, two approaches are used to achieve effective
electrical communication between the active centre in the heme and the electrodes in
H2O2 biosensors: mediator biosensors and mediator-free biosensor.99 The immobilisation
of nanomaterials especially metal nanoparticles, in the mediator and mediator-free
biosensors for H2O2 detection, has been investigated for the advantages they imparted,
compared to other materials.
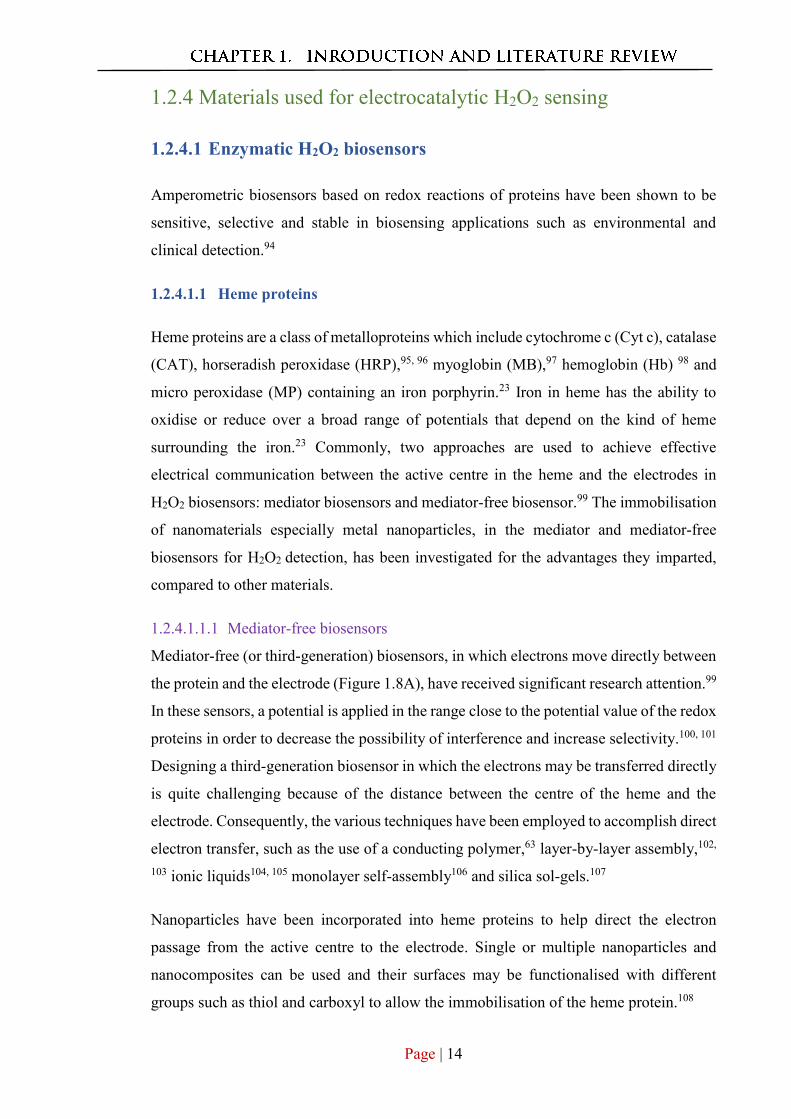
1.2.4.1.1.1 Mediator-free biosensors
Mediator-free (or third-generation) biosensors, in which electrons move directly between
the protein and the electrode (Figure 1.8A), have received significant research attention.99
In these sensors, a potential is applied in the range close to the potential value of the redox
proteins in order to decrease the possibility of interference and increase selectivity.100, 101
Designing a third-generation biosensor in which the electrons may be transferred directly
is quite challenging because of the distance between the centre of the heme and the
electrode. Consequently, the various techniques have been employed to accomplish direct
electron transfer, such as the use of a conducting polymer,63 layer-by-layer assembly,102,
103 ionic liquids104, 105 monolayer self-assembly106 and silica sol-gels.107
Nanoparticles have been incorporated into heme proteins to help direct the electron
passage from the active centre to the electrode. Single or multiple nanoparticles and
nanocomposites can be used and their surfaces may be functionalised with different
groups such as thiol and carboxyl to allow the immobilisation of the heme protein.108
Page | 15
Among the various nanomaterials, Au nanostructures have been most commonly used
because of their unique properties, such as large surface area, high conductivity and their
ability to immobilise the protein and improve electron transfer.109-111 Therefore, different
structures of Au nanoparticles (AuNPs) have been employed to enhance biosensor
performance including CaCO3-AuNPs,112 Fe3O4-Au,113, 114AuNPs-C@SiO2,115 chitosan-
Au,116, 117 graphene-Au,118, 119 MWNT-Au,120 polyaniline (PANI)/AgCl-Au121 and
[email protected] As well as AuNPs, several other nanomaterials have been used in biosensors
toward H2O2, such as Ag nanostructures,123-126 core/shell Fe3O4/chitosan structures,127
MWCNTs,128 single wall carbon nanotubes (SWCNTs), Pd nanoparticles (PdNPs),129, 130
Co nanoparticles,131graphene,132 Pt nanoparticles (PtNPs),133 TiO2 nanostructures,134
CdTe nanoparticles,135 Fe3O4@Al2O3 core/shell nanostructures136 and ZrO2
nanoparticles.137, 138
The enhancement of H2O2 biosensors using nanocomposite Au-Pt nanoparticles on a
hybrid film comprising chitosan, HRP and PANI nanotubes has also been reported.139
The researchers have investigated the activity of Mb, HRP, Hb and CAT with different
nanoparticle integration for the reduction of H2O2.97, 136, 140-142 The results of these studies
demonstrate that HRP electrodes modified with various immobilised nanomaterials have
the highest performance and best sensitivity of those prepared using heme proteins.
Page | 16
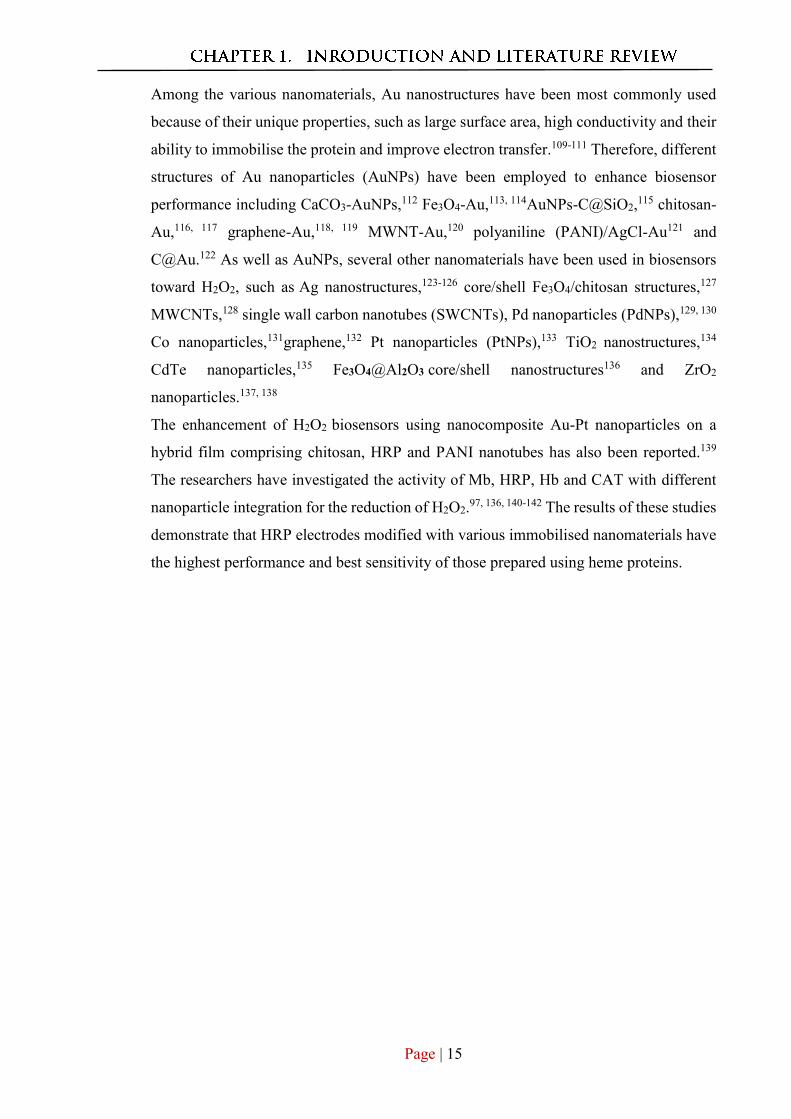
Figure 1.8 Immobilisation of enzymes on Au thin film electrodes: (A) cyt c and (B) HRP with a
hydroquinone mediator.99
1.2.4.1.1.2 Mediator-based biosensors
Mediators have been used in biosensors in order to overcome the distance between the
active centre of the heme and the electrode because a large distance reduces the electron
transfer.99 Many different mediators have been used to promote electron transfer between
Page | 17
the electrode and the protein, including methylene blue,143 methylene green,144
catechol,145 ferrocene,146 thionine,147 hydroquinone148 and hexacyanoferrates.149
Furthermore, different approaches have been used for the immobilisation of the mediator
in biosensors, such as layer-by-layer assembly (LBL),150 monolayer self-assembly,151, 152
adsorptions,153 crosslinking,154 electropolymerizations155 and covalent linking.4, 150
Nanomaterials have also been widely used in mediated heme-based H2O2 biosensors.
AuNPs are the most commonly used nanomaterials for H2O2 detection, as they may be
firmly attached to the protein and encourage direct electron transfer.23, 156 Figure 1.8B
illustrates the immobilisation of HRP on Au thin-film electrode modified with Au
nanostructures using covalent techniques to attach a hydroquinone mediator and shows
the electron transfer from the electrode through the mediator to the active site of the
enzyme.99 In this work, the activities of three Au nanostructures, citrate-stabilised AuNPs,
oleylamine-stabilised AuNPs and oleylamine-stabilised Au nanowires, toward H2O2,
have been investigated and a linear detection range was observed between 20 μM and
500 μM, with detection limits of 14 μM, 8 μM and 5 μM.99 Accordingly, various
nanomaterials such as magnetite nanoparticles (Fe3O4),153 carbon nanotubes (CNTs) 157-
159 and chitosan have been attached to different nanoparticles such as AuNPs, Al2O3
nanoparticles,160 NiFe2O4 nanoparticles,161 MgO nanoparticles,162 TiO2 nanotubes,163
SiO2 nanostructures164 and ZnO nanostructures165 for use in mediator biosensors.
However, mediator biosensors have several disadvantages that limit their application. For
example, adding a mediator directly to the test solution can contaminate the sample
solution and the reference electrode. Moreover, small-molecular-weight mediators can
easily leach from the electrode into the sample solution and reduce the performance of
the biosensor.4
Although heme protein-based biosensors have high sensitivity and selectivity, these
biosensors also have many drawbacks that restrict biosensor applications. The main
problem is the complicated preparation procedures required to immobilise the enzyme on
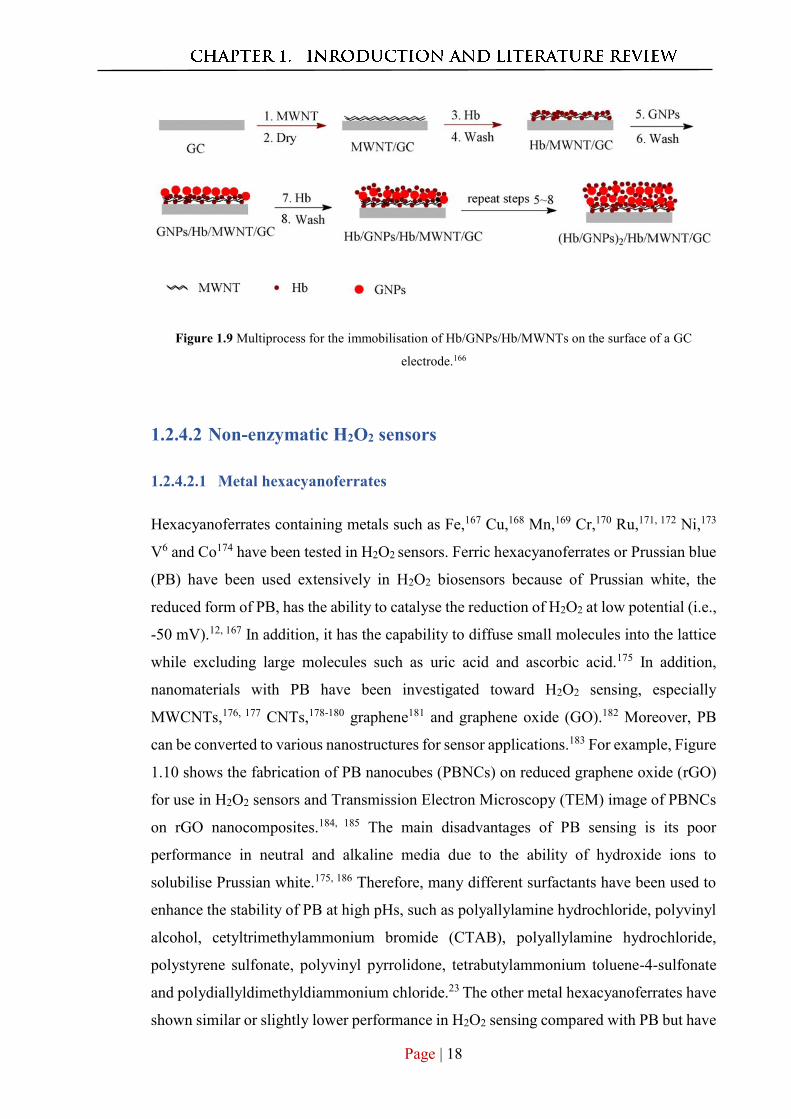
the surface of the electrode, as illustrated in Figure 1.9.166 Furthermore, the use of
enzyme-based biosensors is costly and the biosensors often suffer from low stability and
poor reducibility because of their sensitivity to pH, humidity, temperature, toxic
chemicals and the ionic strength of the test solutions. Therefore, there is an increased
demand for the development of non-enzymatic H2O2 sensors to overcome these issues.4
Page | 18
Figure 1.9 Multiprocess for the immobilisation of Hb/GNPs/Hb/MWNTs on the surface of a GC
electrode.166
1.2.4.2 Non-enzymatic H2O2 sensors
1.2.4.2.1 Metal hexacyanoferrates
Hexacyanoferrates containing metals such as Fe,167 Cu,168 Mn,169 Cr,170 Ru,171, 172 Ni,173
V6 and Co174 have been tested in H2O2 sensors. Ferric hexacyanoferrates or Prussian blue
(PB) have been used extensively in H2O2 biosensors because of Prussian white, the
reduced form of PB, has the ability to catalyse the reduction of H2O2 at low potential (i.e.,
-50 mV).12, 167 In addition, it has the capability to diffuse small molecules into the lattice
while excluding large molecules such as uric acid and ascorbic acid.175 In addition,
nanomaterials with PB have been investigated toward H2O2 sensing, especially
MWCNTs,176, 177 CNTs,178-180 graphene181 and graphene oxide (GO).182 Moreover, PB
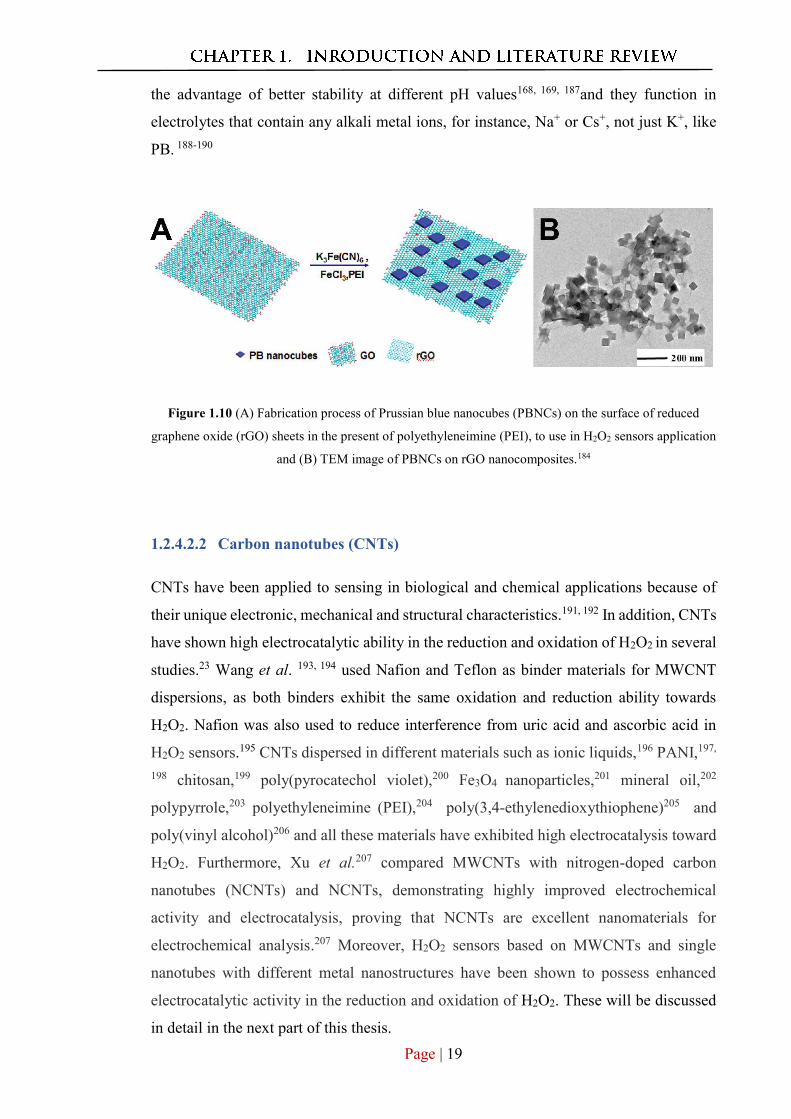
can be converted to various nanostructures for sensor applications.183 For example, Figure
1.10 shows the fabrication of PB nanocubes (PBNCs) on reduced graphene oxide (rGO)
for use in H2O2 sensors and Transmission Electron Microscopy (TEM) image of PBNCs
on rGO nanocomposites.184, 185 The main disadvantages of PB sensing is its poor
performance in neutral and alkaline media due to the ability of hydroxide ions to
solubilise Prussian white.175, 186 Therefore, many different surfactants have been used to
enhance the stability of PB at high pHs, such as polyallylamine hydrochloride, polyvinyl
alcohol, cetyltrimethylammonium bromide (CTAB), polyallylamine hydrochloride,
polystyrene sulfonate, polyvinyl pyrrolidone, tetrabutylammonium toluene-4-sulfonate
and polydiallyldimethyldiammonium chloride.23 The other metal hexacyanoferrates have
shown similar or slightly lower performance in H2O2 sensing compared with PB but have
Page | 19
the advantage of better stability at different pH values168, 169, 187and they function in
electrolytes that contain any alkali metal ions, for instance, Na+ or Cs+, not just K+, like
PB. 188-190
Figure 1.10 (A) Fabrication process of Prussian blue nanocubes (PBNCs) on the surface of reduced
graphene oxide (rGO) sheets in the present of polyethyleneimine (PEI), to use in H2O2 sensors application
and (B) TEM image of PBNCs on rGO nanocomposites.184
1.2.4.2.2 Carbon nanotubes (CNTs)
CNTs have been applied to sensing in biological and chemical applications because of
their unique electronic, mechanical and structural characteristics.191, 192 In addition, CNTs
have shown high electrocatalytic ability in the reduction and oxidation of H2O2 in several
studies.23 Wang et al. 193, 194 used Nafion and Teflon as binder materials for MWCNT
dispersions, as both binders exhibit the same oxidation and reduction ability towards
H2O2. Nafion was also used to reduce interference from uric acid and ascorbic acid in
H2O2 sensors.195 CNTs dispersed in different materials such as ionic liquids,196 PANI,197,
198 chitosan,199 poly(pyrocatechol violet),200 Fe3O4 nanoparticles,201 mineral oil,202
polypyrrole,203 polyethyleneimine (PEI),204 poly(3,4-ethylenedioxythiophene)205 and
poly(vinyl alcohol)206 and all these materials have exhibited high electrocatalysis toward
H2O2. Furthermore, Xu et al.207 compared MWCNTs with nitrogen-doped carbon
nanotubes (NCNTs) and NCNTs, demonstrating highly improved electrochemical
activity and electrocatalysis, proving that NCNTs are excellent nanomaterials for
electrochemical analysis.207 Moreover, H2O2 sensors based on MWCNTs and single
nanotubes with different metal nanostructures have been shown to possess enhanced
electrocatalytic activity in the reduction and oxidation of H2O2. These will be discussed
in detail in the next part of this thesis.
Page | 20
1.2.4.2.3 Graphene
In recent years, researchers in technological and scientific fields have paid increasing
attention to the unique physicochemical properties of graphene, a 2D carbon material,
such as its large surface area and high conductivity.208 Compared to CNTs, graphene is
more widely used because of its advantages, such as facile fabrication, structural stability
and better safety.209 Additionally, the theoretical surface area of graphene is 2630 m2 g−1
which is two times larger than SWCNTs.210 The merits of graphene in the reduction or
oxidation of H2O2 have been demonstrated in several studies that used rGO211 or graphene
dispersed in chitosan as a support for functional materials such as metal
nanostructures,212, 213 metal oxides and several other nanostructure materials.214, 215 The
electrocatalytic activity of graphene is related to the high density of edge-plane-like
defective sites in the material that introduce numerous active sites for electro-catalysed
reactions.208, 216, 217 Woo et al.218 fabricated a graphene-MWCNT composite modified
electrode for H2O2 electrochemical sensing and demonstrated that it provided a linear
relationship between current and H2O2 concentration with a 9.4 μM detection limit.
1.2.4.2.4 Metal-based H2O2 sensors
Transition metals, especially in nanosized forms, have many excellent properties for
biosensing applications, such as large surface area and excellent catalytic activity in
various chemical reactions, including the oxidation and reduction of H2O2. Moreover,
their chemical, electrical and optical characteristics can be tailored by adjusting their size
and composition.219, 220 Different transition metals such as Cu,221 Pd,222 Ag,223 Au,224 Pt225
and Ir226 have been utilised as electrocatalysts in H2O2 sensors and Au nanostructures
have been extensively used in H2O2 sensing. Furthermore, different Au nanostructure and
shapes including nanorods,227 nanowires,228 nanoparticles,224 nanocages229 and
nanopores230 have been applied to H2O2 detection. Both Au nanopores230 and Au
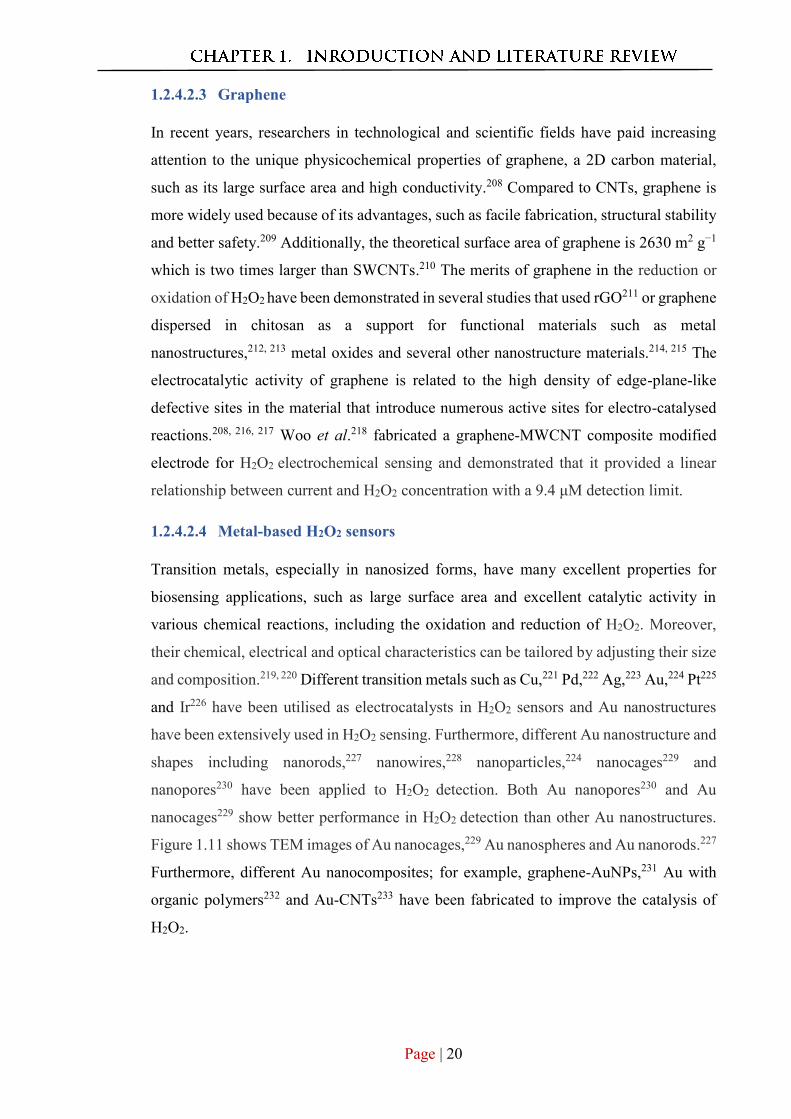
nanocages229 show better performance in H2O2 detection than other Au nanostructures.
Figure 1.11 shows TEM images of Au nanocages,229 Au nanospheres and Au nanorods.227
Furthermore, different Au nanocomposites; for example, graphene-AuNPs,231 Au with
organic polymers232 and Au-CNTs233 have been fabricated to improve the catalysis of
H2O2.
Page | 21
Figure 1.11 TEM images of different Au nanostructures have been used in the electrochemical sensing of
H2O2 (A) Au nanocages; 229 (B) Au nanospheres227 and (C) Au nanorods.227
Ag nanoparticles (AgNPs) also show high performance in non-enzymatic H2O2 detection
because of their high catalytic activity.4 Different methods have been used to prepare
AgNPs for the electrochemical sensing of H2O2. The electrodeposition method has been
reported for the preparation of AgNP/SWCNT composites234 as well as for the
preparation of AgNPs on poly(o-phenylenediamine),235 chitosan-graphene
nanocomposites cysteamine236 and ZnO.237 Chemical reduction is another method that
has been utilised to prepare AgNP-based H2O2 sensors comprising materials such as
graphene-AgNPs,238 MWCNT-AgNPs,239 polypyrrole-AgNPs240 and SWCNT-
AgNPs.241 Moreover, UV irradiation,242 chemical plating,243 microwave-assisted
reductions244 and green fabrication245 have been used to synthesise AgNPs.
PtNPs have been widely used for non-enzymatic sensing of H2O2 due to their high
sensitivity and selectivity for H2O2. PtNP-graphene composites exhibit the best
sensitivity, around 0.5 nM, according to reports in which they were synthesised using
chemical reduction of H2PtCl6.246 This method has also been used to prepare different Pt
nanostructures for H2O2 sensing, such as poly(diallyldimethylammonium
chloride)/PtNPs8, Pt/carbon nanofibers247 and polypyrrole/Pt hollow sphere
nanocomposites.248
Electrodeposition has also been used to prepare Pt nanocomposites via the
electrodeposition of PtNPs onto an MWNT-PANI composite,249 Pt nanoporous250 and
poly(vinyl alcohol)-MWCNTs251 for use in H2O2 sensing and these materials have
demonstrated high sensitivity and stability in the presence of H2O2. Furthermore,
Page | 22
microwave-assisted techniques,252 RF sputtering techniques253 and photochemical
reduction techniques254 have been used to modify H2O2 sensing PtNP electrodes.
Significant research attention has also been paid to bimetallic nanoparticles. In these
species, the presence of another metal promotes critical differences in properties such as
size, shape and surface morphology.255 In addition, bimetallic nanoparticles show
excellent catalytic activity, high sensitivity, good detection ability and selectivity
compared to the mono-metal.256 Alloys, mixed mono-metallic structures and core/shell
structures are the usual forms of bimetallic nanostructures.257
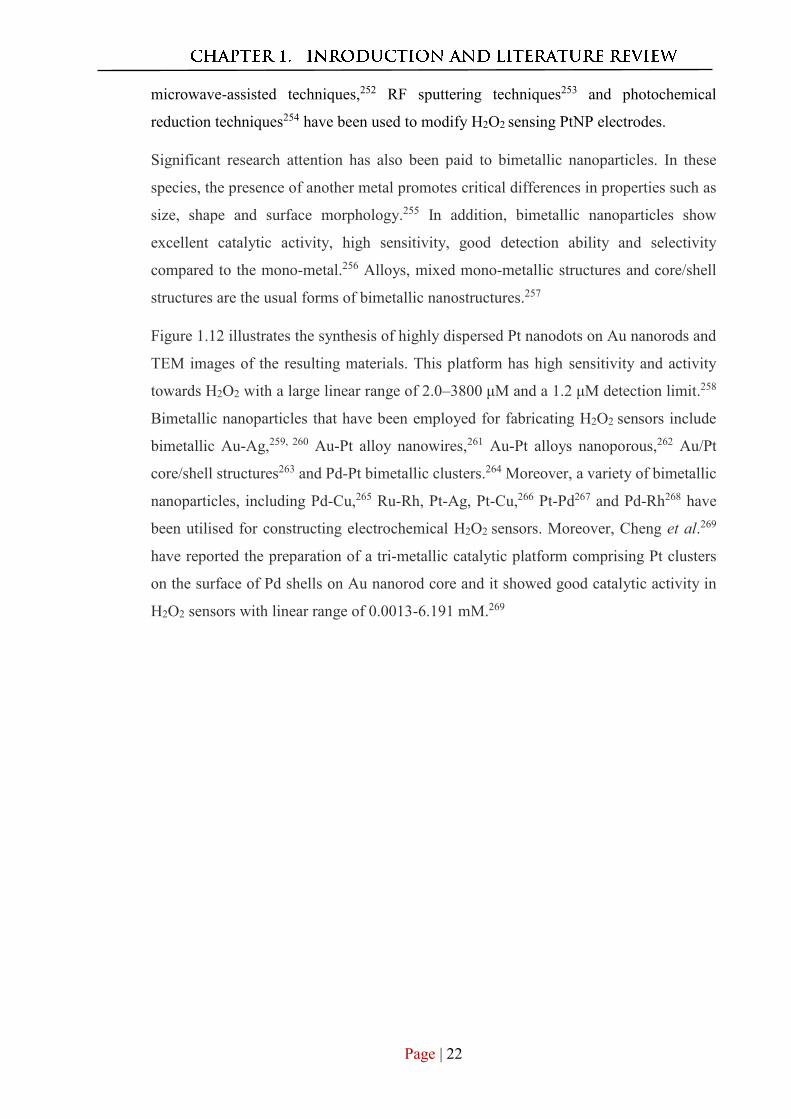
Figure 1.12 illustrates the synthesis of highly dispersed Pt nanodots on Au nanorods and
TEM images of the resulting materials. This platform has high sensitivity and activity
towards H2O2 with a large linear range of 2.0–3800 μM and a 1.2 μM detection limit.258
Bimetallic nanoparticles that have been employed for fabricating H2O2 sensors include
bimetallic Au-Ag,259, 260 Au-Pt alloy nanowires,261 Au-Pt alloys nanoporous,262 Au/Pt
core/shell structures263 and Pd-Pt bimetallic clusters.264 Moreover, a variety of bimetallic
nanoparticles, including Pd-Cu,265 Ru-Rh, Pt-Ag, Pt-Cu,266 Pt-Pd267 and Pd-Rh268 have
been utilised for constructing electrochemical H2O2 sensors. Moreover, Cheng et al.269
have reported the preparation of a tri-metallic catalytic platform comprising Pt clusters
on the surface of Pd shells on Au nanorod core and it showed good catalytic activity in
H2O2 sensors with linear range of 0.0013-6.191 mM.269
Page | 23
Figure 1.12 The highly dispersed Pt nanodots on Au nanorods (HD-PtNDs@AuNRs) (A) the seed-
mediated growth preparation process used to prepare AuNRs; then H2PtCl6 reduced on AuNRs surface
with ascorbic acid (AA) to form PtNDs, (B) TEM image and (C) high-resolution TEM image.258
1.2.4.2.5 Metal oxide-based H2O2 sensors
Transition metal oxides such as manganese dioxide (MnO2),215 iridium dioxide (IrO2),270
cobalt oxide (CoO),271 copper oxide (CuO),272 ferric oxide (Fe2O3) nanoparticles273 and
titanium dioxide (TiO2)274 also exhibit good performance in H2O2 sensing. However,
most of them catalyse the oxidation of H2O2 under high potential. In addition, Fe3O4
nanoparticles275, 276 have shown high electrocatalytic performance in H2O2 sensors at low
potential and display reduced interference, low background current, low detection limits
and high stability.277
Page | 24
1.3 Three-component coupling reaction
1.3.1 Introduction to the three-component coupling reaction (A3-
coupling reaction)
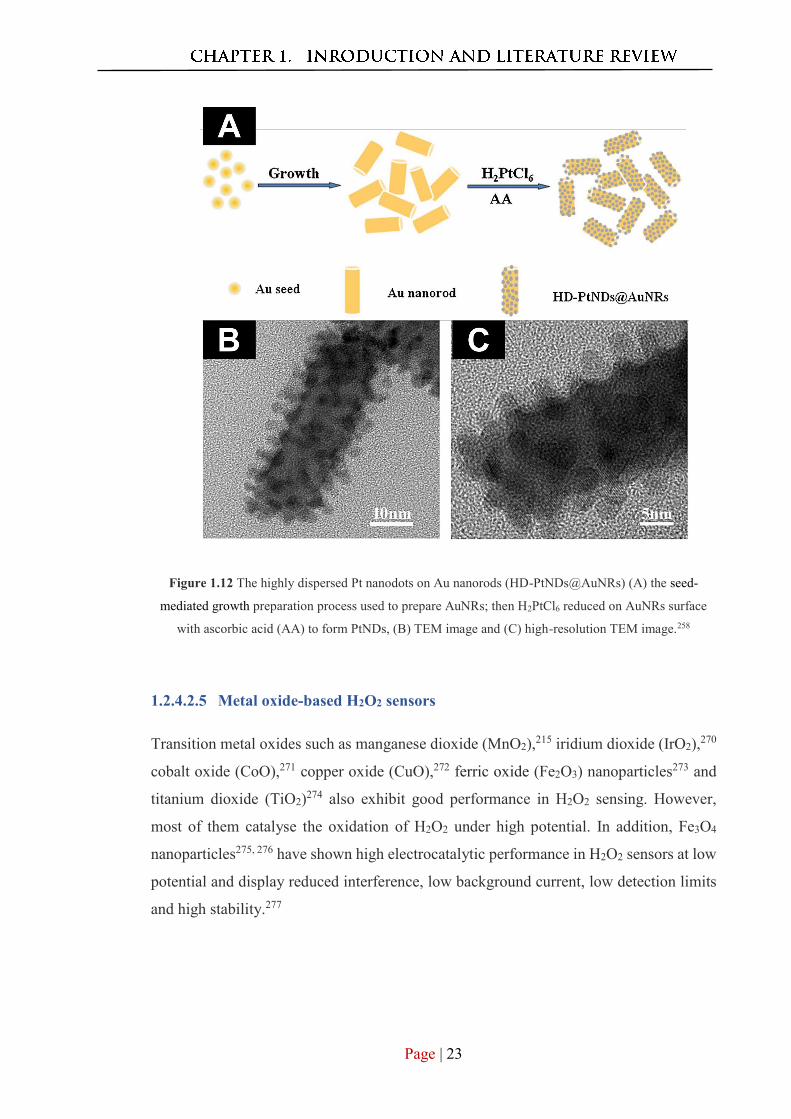
One-pot three-component coupling reactions to generate new carbon-carbon bonds have
attracted considerable attention during the last decade. This reaction employs an
aldehyde, an alkyne and an amine in an ionic liquid, water, or organic solvent and
produces water as a by-product. Li et al. contributed significantly to the development of
this reaction and have termed it A3-coupling reaction.278, 279
Propargylamines, the major products of the A3-coupling reaction, are important synthetic
intermediates for the preparation of active compounds in pharmaceutical research,
biology and natural product synthesis.280, 281 In the past, propargylamines have been
produced by nucleophilic attack on amines or their derivatives by lithium acetylides and
Grignard reagents.282 All these techniques require stoichiometric amounts of reagents and
they are highly sensitive to moisture, producing a large number of side products.283
Different transition metals such as Au, Ag, Cu, Ir, In and Fe have been reported to be
highly efficient catalysts for the synthesis of various propargylamines.284, 285 In 1953,
Guermont reported the first A3-coupling reaction with aldehydes, amines and alkynes and
used alkynes, formaldehyde and secondary amines to produce propargylic amino
ethers.284, 285
Figure 1.12 Scheme of the A3-coupling reaction between an aldehyde, alkyne and amine.286
Page | 25
Moreover, various homogeneous transition metal catalysts such as Ag salts,287 Au salts,288
Cu salts289 and Fe salts290 have been utilised to synthesise propargylamine via the A3-
coupling reaction. Though these homogenous catalysts provide a high product yield, they
are difficult to recover and reuse. Consequently, heterogeneous catalysts are often
employed in this reaction as they have similar catalytic activity and are easy to separate
and recycle. Nano-catalysts which mimic both homogeneous and heterogeneous catalysts
have been developed.291
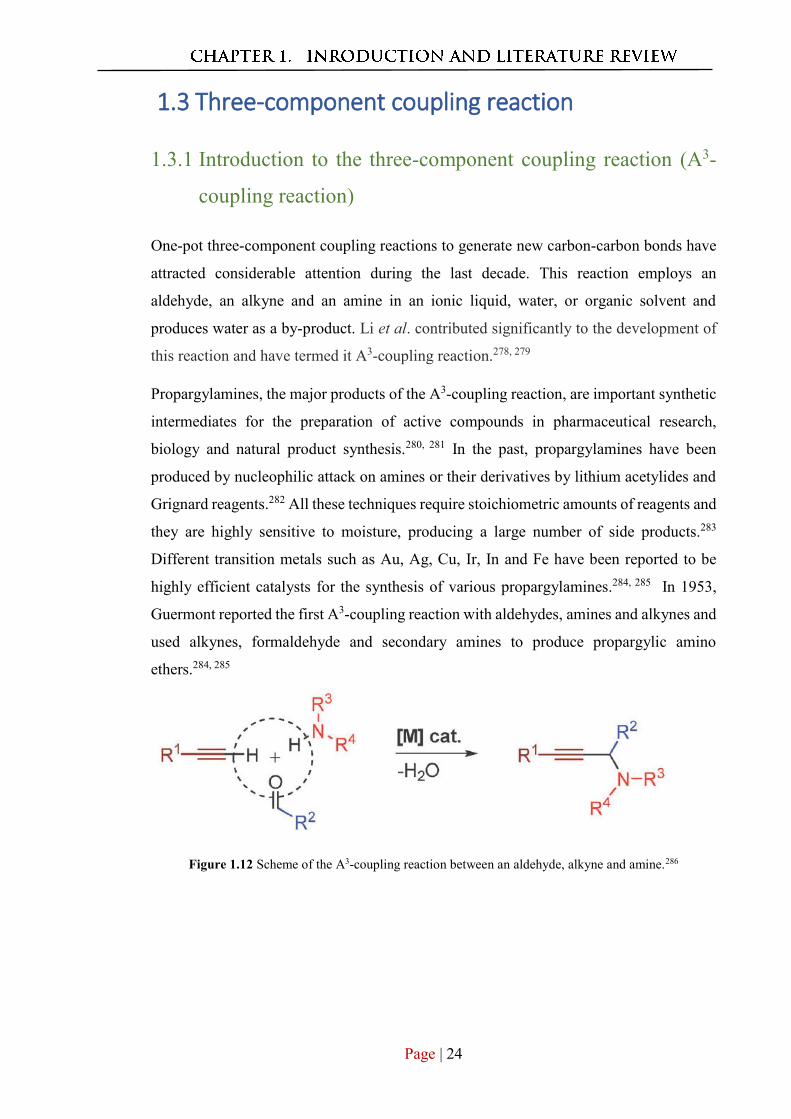
1.3.2 Proposed mechanism of A3-coupling reaction
The suggested mechanism of the A3-coupling reaction involves the activation of the C–
H bond in the alkyne compound (I) by the metal catalyst to form a metal acetylide
intermediate (II). An immonium ion (III) is produced in situ from the aldehyde and the
secondary amine.286 Nucleophilic addition occurs between the metal acetylide
intermediate and an immonium ion (IV) to generate the corresponding propargylamine
product. Furthermore, the metal catalyst is regenerated and water is produced as a side
product of the reaction. Figure 1.13 illustrates a proposed mechanism for the A3-coupling
reaction. However, the actual mechanism steps are still not fully understood.286
Figure 1.13 Proposed mechanism of the A3-coupling reaction.286
Page | 26
1.3.3 A3-coupling reaction
The A3-coupling reaction is usually used with a secondary amine and aniline to form
tertiary propargylamines and secondary N-aryl propargylamines, respectively.286 Primary
amines are considered to be challenging substrates, which limit the production of
secondary N-alkyl propargylamines with this reaction. Accordingly, several
modifications have been used to promote the 1,2-addition of alkynes to the immonium
ion.286 Firstly, aldehydes with strong electron-withdrawing groups are used to increase its
electrophilicity. For example, the use of a phosphonate292 or an ester293 group allows the
A3-coupling reaction to occur under milder conditions. Secondly, using co-catalysts can
promote the 1,2-addition of alkynes to immonium. For instance, using CuBr as a catalyst
and RuCl3 as a co-catalyst under aqueous or neat conditions in the A3-coupling reaction
has been shown to improve the yield of the desired propargylamines significantly.294
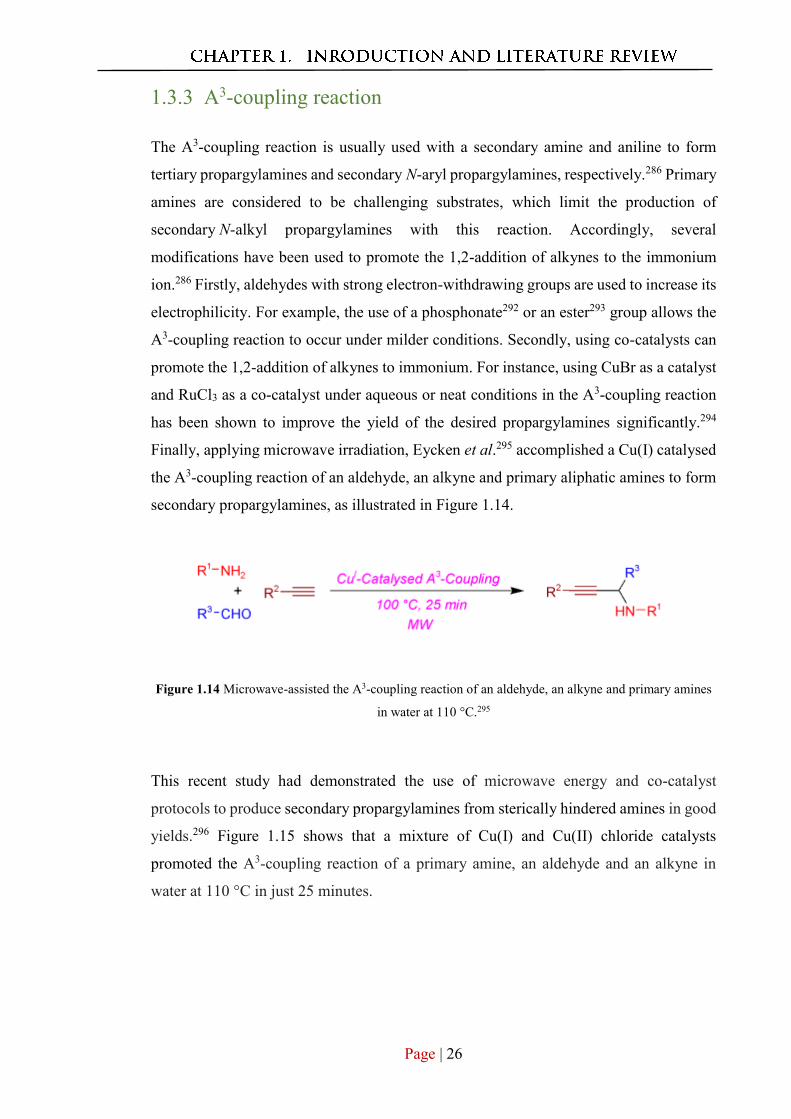
Finally, applying microwave irradiation, Eycken et al.295 accomplished a Cu(I) catalysed
the A3-coupling reaction of an aldehyde, an alkyne and primary aliphatic amines to form
secondary propargylamines, as illustrated in Figure 1.14.
Figure 1.14 Microwave-assisted the A3-coupling reaction of an aldehyde, an alkyne and primary amines
in water at 110 °C.295
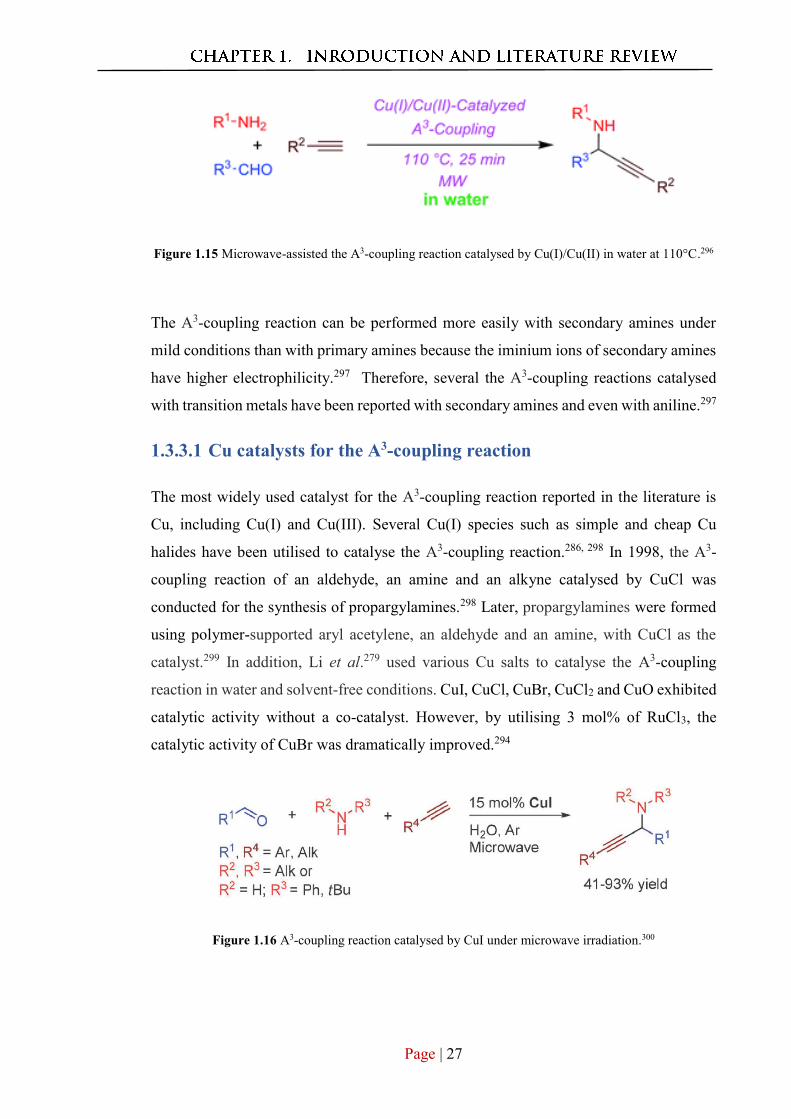
This recent study had demonstrated the use of microwave energy and co-catalyst
protocols to produce secondary propargylamines from sterically hindered amines in good
yields.296 Figure 1.15 shows that a mixture of Cu(I) and Cu(II) chloride catalysts
promoted the A3-coupling reaction of a primary amine, an aldehyde and an alkyne in
water at 110 °C in just 25 minutes.
Page | 27
Figure 1.15 Microwave-assisted the A3-coupling reaction catalysed by Cu(I)/Cu(II) in water at 110°C.296
The A3-coupling reaction can be performed more easily with secondary amines under
mild conditions than with primary amines because the iminium ions of secondary amines
have higher electrophilicity.297 Therefore, several the A3-coupling reactions catalysed
with transition metals have been reported with secondary amines and even with aniline.297
1.3.3.1 Cu catalysts for the A3-coupling reaction
The most widely used catalyst for the A3-coupling reaction reported in the literature is
Cu, including Cu(I) and Cu(III). Several Cu(I) species such as simple and cheap Cu
halides have been utilised to catalyse the A3-coupling reaction.286, 298 In 1998, the A3-
coupling reaction of an aldehyde, an amine and an alkyne catalysed by CuCl was
conducted for the synthesis of propargylamines.298 Later, propargylamines were formed
using polymer-supported aryl acetylene, an aldehyde and an amine, with CuCl as the
catalyst.299 In addition, Li et al.279 used various Cu salts to catalyse the A3-coupling
reaction in water and solvent-free conditions. CuI, CuCl, CuBr, CuCl2 and CuO exhibited
catalytic activity without a co-catalyst. However, by utilising 3 mol% of RuCl3, the
catalytic activity of CuBr was dramatically improved.294
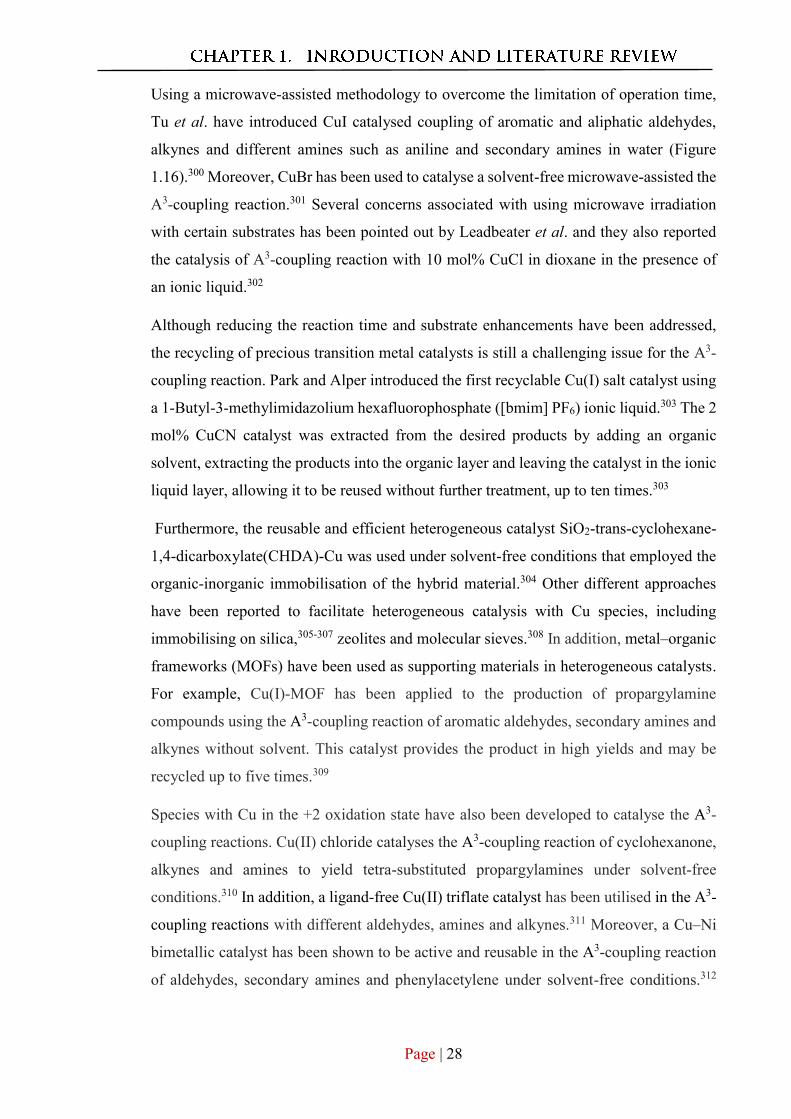
Figure 1.16 A3-coupling reaction catalysed by CuI under microwave irradiation.300
Page | 28
Using a microwave-assisted methodology to overcome the limitation of operation time,
Tu et al. have introduced CuI catalysed coupling of aromatic and aliphatic aldehydes,
alkynes and different amines such as aniline and secondary amines in water (Figure
1.16).300 Moreover, CuBr has been used to catalyse a solvent-free microwave-assisted the
A3-coupling reaction.301 Several concerns associated with using microwave irradiation
with certain substrates has been pointed out by Leadbeater et al. and they also reported
the catalysis of A3-coupling reaction with 10 mol% CuCl in dioxane in the presence of
an ionic liquid.302
Although reducing the reaction time and substrate enhancements have been addressed,
the recycling of precious transition metal catalysts is still a challenging issue for the A3-
coupling reaction. Park and Alper introduced the first recyclable Cu(I) salt catalyst using
a 1-Butyl-3-methylimidazolium hexafluorophosphate ([bmim] PF6) ionic liquid.303 The 2
mol% CuCN catalyst was extracted from the desired products by adding an organic
solvent, extracting the products into the organic layer and leaving the catalyst in the ionic
liquid layer, allowing it to be reused without further treatment, up to ten times.303
Furthermore, the reusable and efficient heterogeneous catalyst SiO2-trans-cyclohexane-
1,4-dicarboxylate(CHDA)-Cu was used under solvent-free conditions that employed the
organic-inorganic immobilisation of the hybrid material.304 Other different approaches
have been reported to facilitate heterogeneous catalysis with Cu species, including
immobilising on silica,305-307 zeolites and molecular sieves.308 In addition, metal–organic
frameworks (MOFs) have been used as supporting materials in heterogeneous catalysts.
For example, Cu(I)-MOF has been applied to the production of propargylamine
compounds using the A3-coupling reaction of aromatic aldehydes, secondary amines and
alkynes without solvent. This catalyst provides the product in high yields and may be
recycled up to five times.309
Species with Cu in the +2 oxidation state have also been developed to catalyse the A3-
coupling reactions. Cu(II) chloride catalyses the A3-coupling reaction of cyclohexanone,
alkynes and amines to yield tetra-substituted propargylamines under solvent-free
conditions.310 In addition, a ligand-free Cu(II) triflate catalyst has been utilised in the A3-
coupling reactions with different aldehydes, amines and alkynes.311 Moreover, a Cu–Ni
bimetallic catalyst has been shown to be active and reusable in the A3-coupling reaction
of aldehydes, secondary amines and phenylacetylene under solvent-free conditions.312
Page | 29
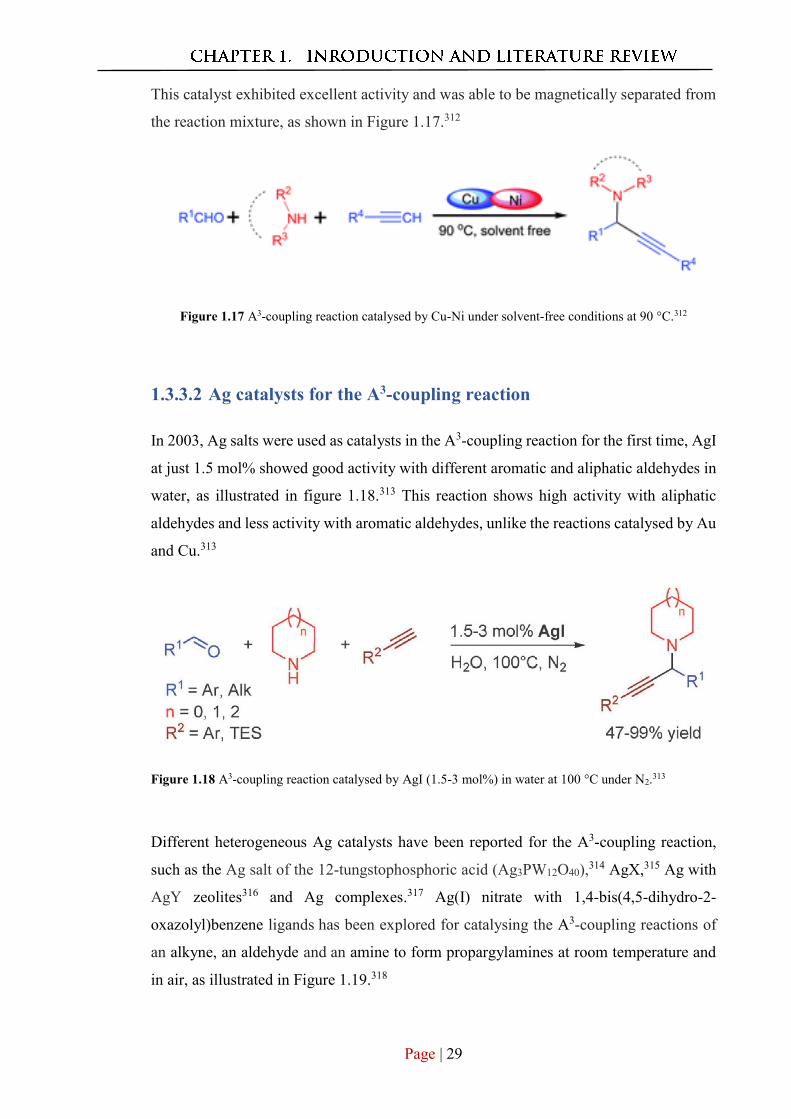
This catalyst exhibited excellent activity and was able to be magnetically separated from
the reaction mixture, as shown in Figure 1.17.312
Figure 1.17 A3-coupling reaction catalysed by Cu-Ni under solvent-free conditions at 90 °C.312
1.3.3.2 Ag catalysts for the A3-coupling reaction
In 2003, Ag salts were used as catalysts in the A3-coupling reaction for the first time, AgI
at just 1.5 mol% showed good activity with different aromatic and aliphatic aldehydes in
water, as illustrated in figure 1.18.313 This reaction shows high activity with aliphatic
aldehydes and less activity with aromatic aldehydes, unlike the reactions catalysed by Au
and Cu.313
Figure 1.18 A3-coupling reaction catalysed by AgI (1.5-3 mol%) in water at 100 °C under N2.313
Different heterogeneous Ag catalysts have been reported for the A3-coupling reaction,
such as the Ag salt of the 12-tungstophosphoric acid (Ag3PW12O40),314 AgX,315 Ag with
AgY zeolites316 and Ag complexes.317 Ag(I) nitrate with 1,4-bis(4,5-dihydro-2-
oxazolyl)benzene ligands has been explored for catalysing the A3-coupling reactions of
an alkyne, an aldehyde and an amine to form propargylamines at room temperature and
in air, as illustrated in Figure 1.19.318
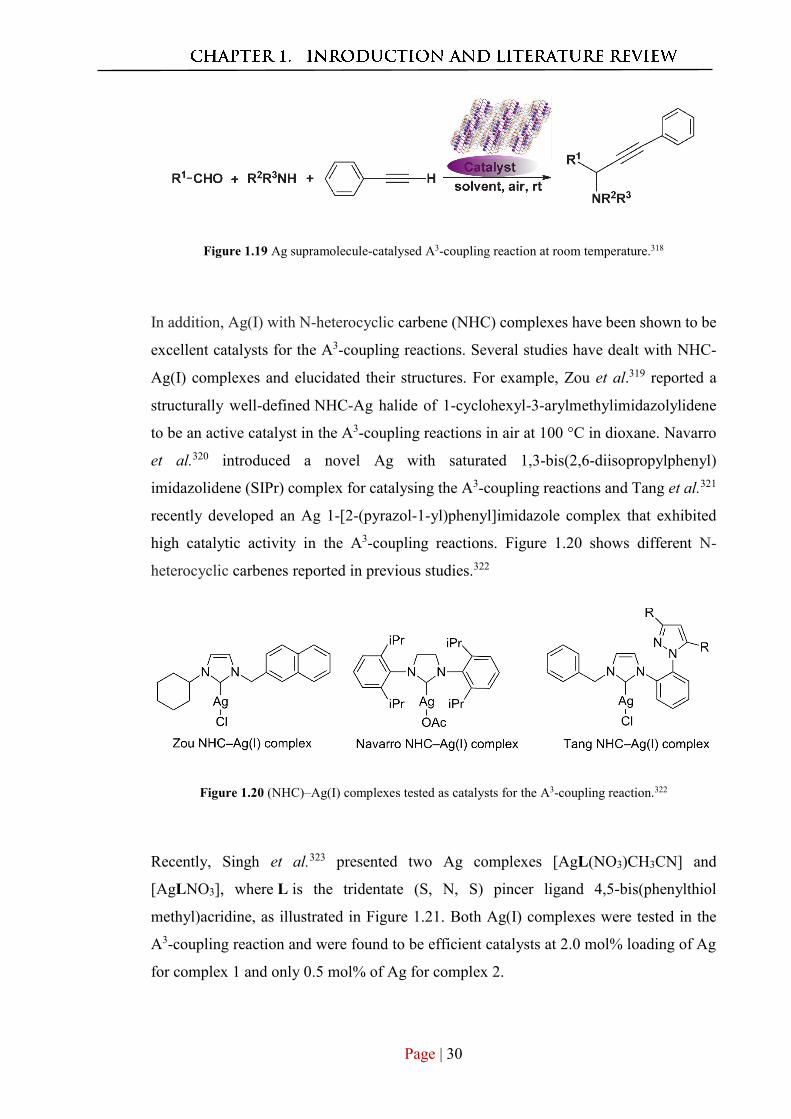
Page | 30
Figure 1.19 Ag supramolecule-catalysed A3-coupling reaction at room temperature.318
In addition, Ag(I) with N-heterocyclic carbene (NHC) complexes have been shown to be
excellent catalysts for the A3-coupling reactions. Several studies have dealt with NHC-
Ag(I) complexes and elucidated their structures. For example, Zou et al.319 reported a
structurally well-defined NHC-Ag halide of 1-cyclohexyl-3-arylmethylimidazolylidene
to be an active catalyst in the A3-coupling reactions in air at 100 °C in dioxane. Navarro
et al.320 introduced a novel Ag with saturated 1,3-bis(2,6-diisopropylphenyl)
imidazolidene (SIPr) complex for catalysing the A3-coupling reactions and Tang et al.321
recently developed an Ag 1-[2-(pyrazol-1-yl)phenyl]imidazole complex that exhibited
high catalytic activity in the A3-coupling reactions. Figure 1.20 shows different N-
heterocyclic carbenes reported in previous studies.322
Figure 1.20 (NHC)–Ag(I) complexes tested as catalysts for the A3-coupling reaction.322
Recently, Singh et al.323 presented two Ag complexes [AgL(NO3)CH3CN] and
[AgLNO3], where L is the tridentate (S, N, S) pincer ligand 4,5-bis(phenylthiol
methyl)acridine, as illustrated in Figure 1.21. Both Ag(I) complexes were tested in the
A3-coupling reaction and were found to be efficient catalysts at 2.0 mol% loading of Ag
for complex 1 and only 0.5 mol% of Ag for complex 2.
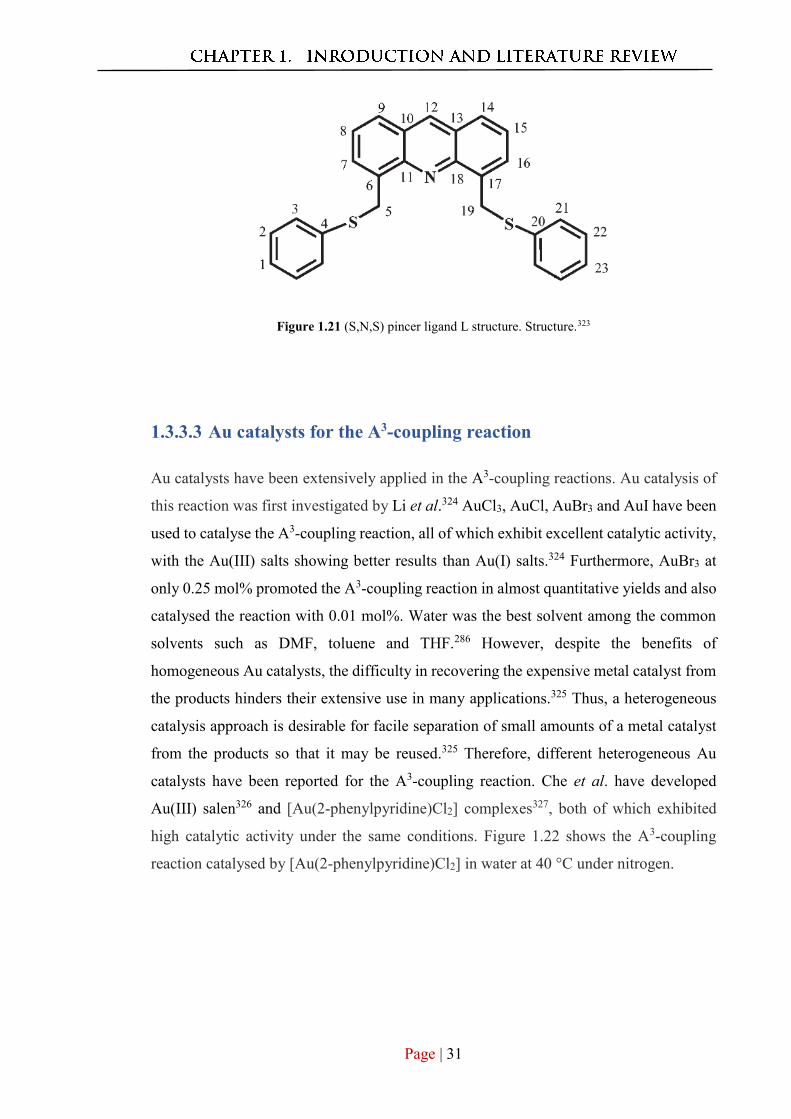
Page | 31
Figure 1.21 (S,N,S) pincer ligand L structure. Structure.323
1.3.3.3 Au catalysts for the A3-coupling reaction
Au catalysts have been extensively applied in the A3-coupling reactions. Au catalysis of
this reaction was first investigated by Li et al.324 AuCl3, AuCl, AuBr3 and AuI have been
used to catalyse the A3-coupling reaction, all of which exhibit excellent catalytic activity,
with the Au(III) salts showing better results than Au(I) salts.324 Furthermore, AuBr3 at
only 0.25 mol% promoted the A3-coupling reaction in almost quantitative yields and also
catalysed the reaction with 0.01 mol%. Water was the best solvent among the common
solvents such as DMF, toluene and THF.286 However, despite the benefits of
homogeneous Au catalysts, the difficulty in recovering the expensive metal catalyst from
the products hinders their extensive use in many applications.325 Thus, a heterogeneous
catalysis approach is desirable for facile separation of small amounts of a metal catalyst
from the products so that it may be reused.325 Therefore, different heterogeneous Au
catalysts have been reported for the A3-coupling reaction. Che et al. have developed
Au(III) salen326 and [Au(2-phenylpyridine)Cl2] complexes327, both of which exhibited
high catalytic activity under the same conditions. Figure 1.22 shows the A3-coupling
reaction catalysed by [Au(2-phenylpyridine)Cl2] in water at 40 °C under nitrogen.
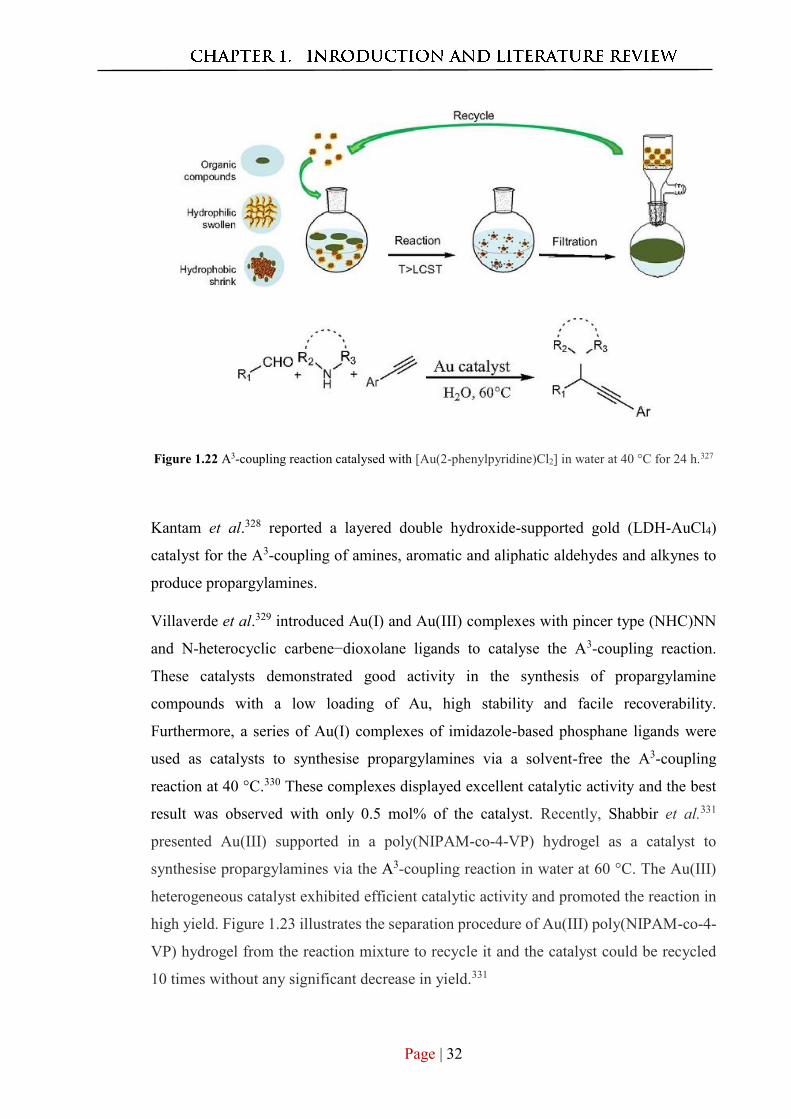
Page | 32
Figure 1.22 A3-coupling reaction catalysed with [Au(2-phenylpyridine)Cl2] in water at 40 °C for 24 h.327
Kantam et al.328 reported a layered double hydroxide-supported gold (LDH-AuCl4)
catalyst for the A3-coupling of amines, aromatic and aliphatic aldehydes and alkynes to
produce propargylamines.
Villaverde et al.329 introduced Au(I) and Au(III) complexes with pincer type (NHC)NN
and N-heterocyclic carbene−dioxolane ligands to catalyse the A3-coupling reaction.
These catalysts demonstrated good activity in the synthesis of propargylamine
compounds with a low loading of Au, high stability and facile recoverability.
Furthermore, a series of Au(I) complexes of imidazole-based phosphane ligands were
used as catalysts to synthesise propargylamines via a solvent-free the A3-coupling
reaction at 40 °C.330 These complexes displayed excellent catalytic activity and the best
result was observed with only 0.5 mol% of the catalyst. Recently, Shabbir et al.331
presented Au(III) supported in a poly(NIPAM-co-4-VP) hydrogel as a catalyst to
synthesise propargylamines via the A3-coupling reaction in water at 60 °C. The Au(III)
heterogeneous catalyst exhibited efficient catalytic activity and promoted the reaction in
high yield. Figure 1.23 illustrates the separation procedure of Au(III) poly(NIPAM-co-4-
VP) hydrogel from the reaction mixture to recycle it and the catalyst could be recycled
10 times without any significant decrease in yield.331
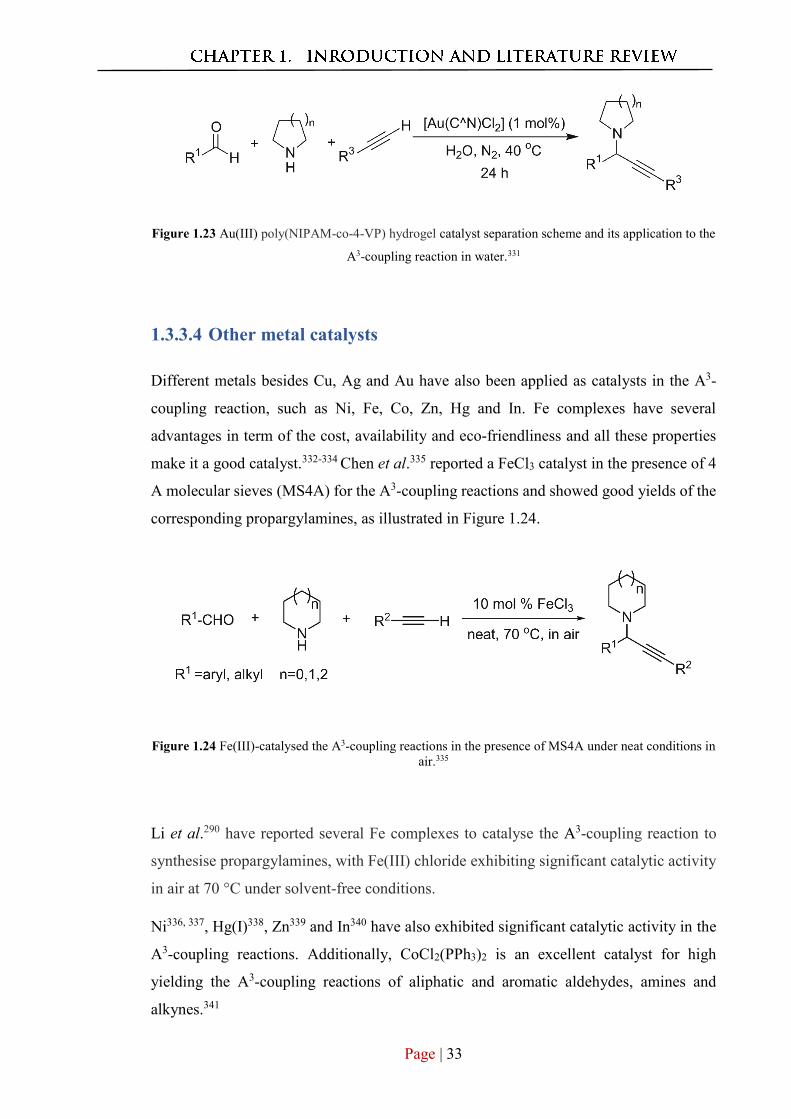
Page | 33
Figure 1.23 Au(III) poly(NIPAM-co-4-VP) hydrogel catalyst separation scheme and its application to the
A3-coupling reaction in water.331
1.3.3.4 Other metal catalysts
Different metals besides Cu, Ag and Au have also been applied as catalysts in the A3-
coupling reaction, such as Ni, Fe, Co, Zn, Hg and In. Fe complexes have several
advantages in term of the cost, availability and eco-friendliness and all these properties
make it a good catalyst.332-334 Chen et al.335 reported a FeCl3 catalyst in the presence of 4
A molecular sieves (MS4A) for the A3-coupling reactions and showed good yields of the
corresponding propargylamines, as illustrated in Figure 1.24.
Figure 1.24 Fe(III)-catalysed the A3-coupling reactions in the presence of MS4A under neat conditions in
air.335
Li et al.290 have reported several Fe complexes to catalyse the A3-coupling reaction to
synthesise propargylamines, with Fe(III) chloride exhibiting significant catalytic activity
in air at 70 °C under solvent-free conditions.
Ni336, 337, Hg(I)338, Zn339 and In340 have also exhibited significant catalytic activity in the
A3-coupling reactions. Additionally, CoCl2(PPh3)2 is an excellent catalyst for high
yielding the A3-coupling reactions of aliphatic and aromatic aldehydes, amines and
alkynes.341
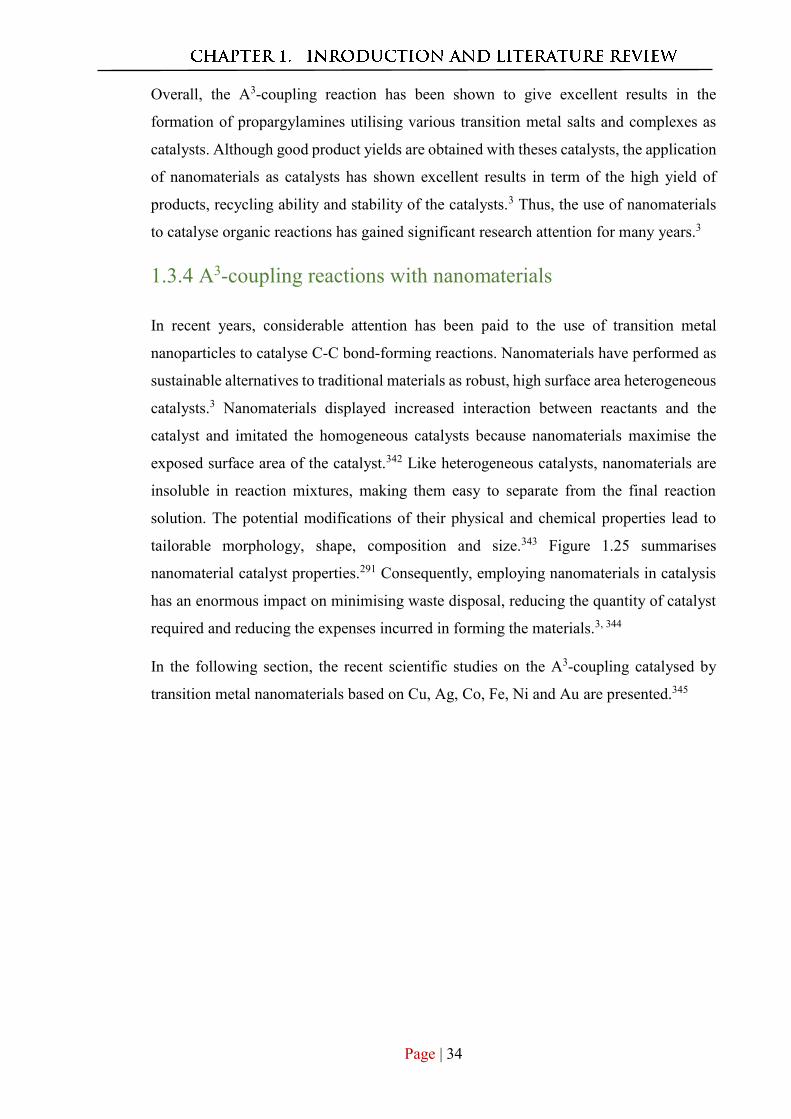
Page | 34
Overall, the A3-coupling reaction has been shown to give excellent results in the
formation of propargylamines utilising various transition metal salts and complexes as
catalysts. Although good product yields are obtained with theses catalysts, the application
of nanomaterials as catalysts has shown excellent results in term of the high yield of
products, recycling ability and stability of the catalysts.3 Thus, the use of nanomaterials
to catalyse organic reactions has gained significant research attention for many years.3
1.3.4 A3-coupling reactions with nanomaterials
In recent years, considerable attention has been paid to the use of transition metal
nanoparticles to catalyse C-C bond-forming reactions. Nanomaterials have performed as
sustainable alternatives to traditional materials as robust, high surface area heterogeneous
catalysts.3 Nanomaterials displayed increased interaction between reactants and the
catalyst and imitated the homogeneous catalysts because nanomaterials maximise the
exposed surface area of the catalyst.342 Like heterogeneous catalysts, nanomaterials are
insoluble in reaction mixtures, making them easy to separate from the final reaction
solution. The potential modifications of their physical and chemical properties lead to
tailorable morphology, shape, composition and size.343 Figure 1.25 summarises
nanomaterial catalyst properties.291 Consequently, employing nanomaterials in catalysis
has an enormous impact on minimising waste disposal, reducing the quantity of catalyst
required and reducing the expenses incurred in forming the materials.3, 344
In the following section, the recent scientific studies on the A3-coupling catalysed by
transition metal nanomaterials based on Cu, Ag, Co, Fe, Ni and Au are presented.345
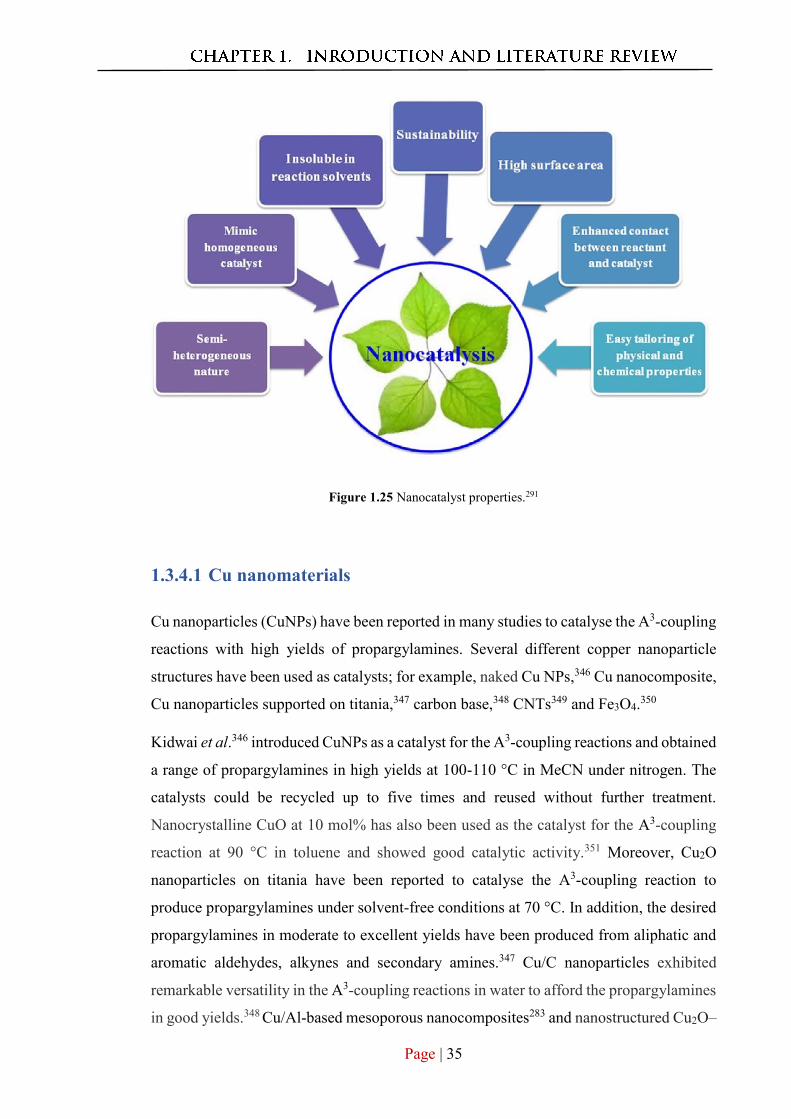
Page | 35
Figure 1.25 Nanocatalyst properties.291
1.3.4.1 Cu nanomaterials
Cu nanoparticles (CuNPs) have been reported in many studies to catalyse the A3-coupling
reactions with high yields of propargylamines. Several different copper nanoparticle
structures have been used as catalysts; for example, naked Cu NPs,346 Cu nanocomposite,
Cu nanoparticles supported on titania,347 carbon base,348 CNTs349 and Fe3O4.350
Kidwai et al.346 introduced CuNPs as a catalyst for the A3-coupling reactions and obtained
a range of propargylamines in high yields at 100-110 °C in MeCN under nitrogen. The
catalysts could be recycled up to five times and reused without further treatment.
Nanocrystalline CuO at 10 mol% has also been used as the catalyst for the A3-coupling
reaction at 90 °C in toluene and showed good catalytic activity.351 Moreover, Cu2O
nanoparticles on titania have been reported to catalyse the A3-coupling reaction to
produce propargylamines under solvent-free conditions at 70 °C. In addition, the desired
propargylamines in moderate to excellent yields have been produced from aliphatic and
aromatic aldehydes, alkynes and secondary amines.347 Cu/C nanoparticles exhibited
remarkable versatility in the A3-coupling reactions in water to afford the propargylamines
in good yields.348 Cu/Al-based mesoporous nanocomposites283 and nanostructured Cu2O–
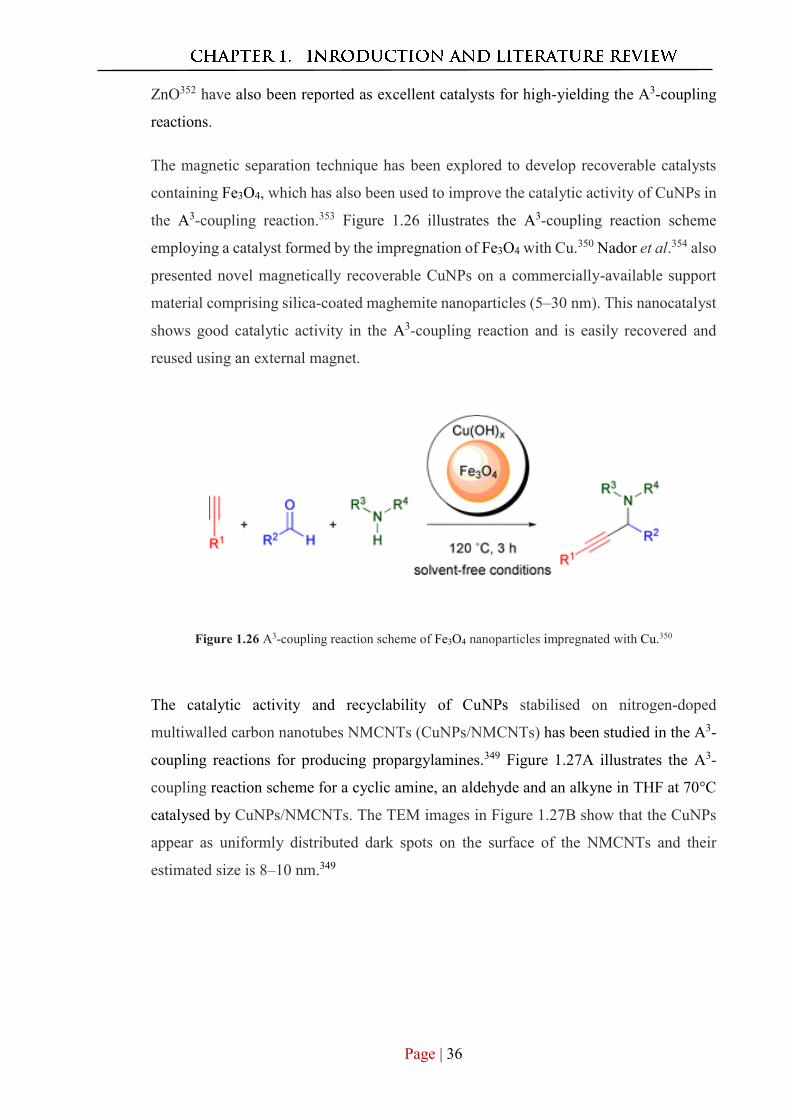
Page | 36
ZnO352 have also been reported as excellent catalysts for high-yielding the A3-coupling
reactions.
The magnetic separation technique has been explored to develop recoverable catalysts
containing Fe3O4, which has also been used to improve the catalytic activity of CuNPs in
the A3-coupling reaction.353 Figure 1.26 illustrates the A3-coupling reaction scheme
employing a catalyst formed by the impregnation of Fe3O4 with Cu.350 Nador et al.354 also
presented novel magnetically recoverable CuNPs on a commercially-available support
material comprising silica-coated maghemite nanoparticles (5–30 nm). This nanocatalyst
shows good catalytic activity in the A3-coupling reaction and is easily recovered and
reused using an external magnet.
Figure 1.26 A3-coupling reaction scheme of Fe3O4 nanoparticles impregnated with Cu.350
The catalytic activity and recyclability of CuNPs stabilised on nitrogen-doped
multiwalled carbon nanotubes NMCNTs (CuNPs/NMCNTs) has been studied in the A3-
coupling reactions for producing propargylamines.349 Figure 1.27A illustrates the A3-
coupling reaction scheme for a cyclic amine, an aldehyde and an alkyne in THF at 70°C
catalysed by CuNPs/NMCNTs. The TEM images in Figure 1.27B show that the CuNPs
appear as uniformly distributed dark spots on the surface of the NMCNTs and their
estimated size is 8–10 nm.349
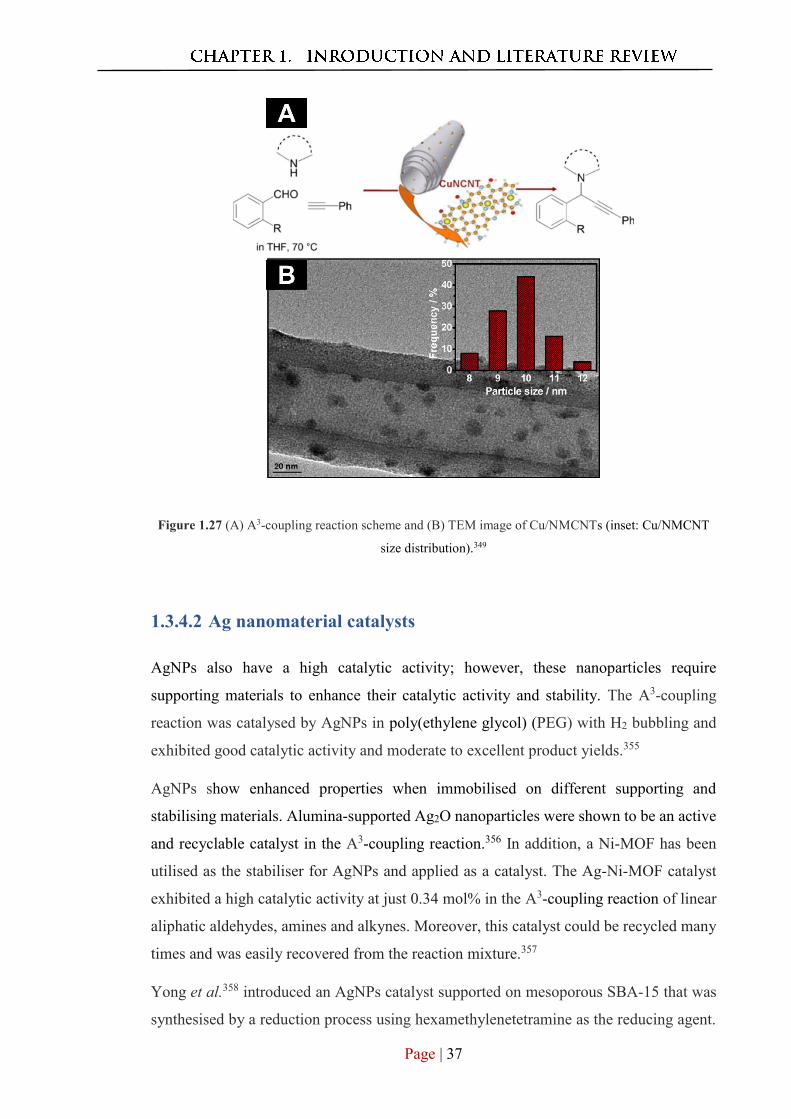
Page | 37
Figure 1.27 (A) A3-coupling reaction scheme and (B) TEM image of Cu/NMCNTs (inset: Cu/NMCNT
size distribution).349
1.3.4.2 Ag nanomaterial catalysts
AgNPs also have a high catalytic activity; however, these nanoparticles require
supporting materials to enhance their catalytic activity and stability. The A3-coupling
reaction was catalysed by AgNPs in poly(ethylene glycol) (PEG) with H2 bubbling and
exhibited good catalytic activity and moderate to excellent product yields.355
AgNPs show enhanced properties when immobilised on different supporting and
stabilising materials. Alumina-supported Ag2O nanoparticles were shown to be an active
and recyclable catalyst in the A3-coupling reaction.356 In addition, a Ni-MOF has been
utilised as the stabiliser for AgNPs and applied as a catalyst. The Ag-Ni-MOF catalyst
exhibited a high catalytic activity at just 0.34 mol% in the A3-coupling reaction of linear
aliphatic aldehydes, amines and alkynes. Moreover, this catalyst could be recycled many
times and was easily recovered from the reaction mixture.357
Yong et al.358 introduced an AgNPs catalyst supported on mesoporous SBA-15 that was
synthesised by a reduction process using hexamethylenetetramine as the reducing agent.
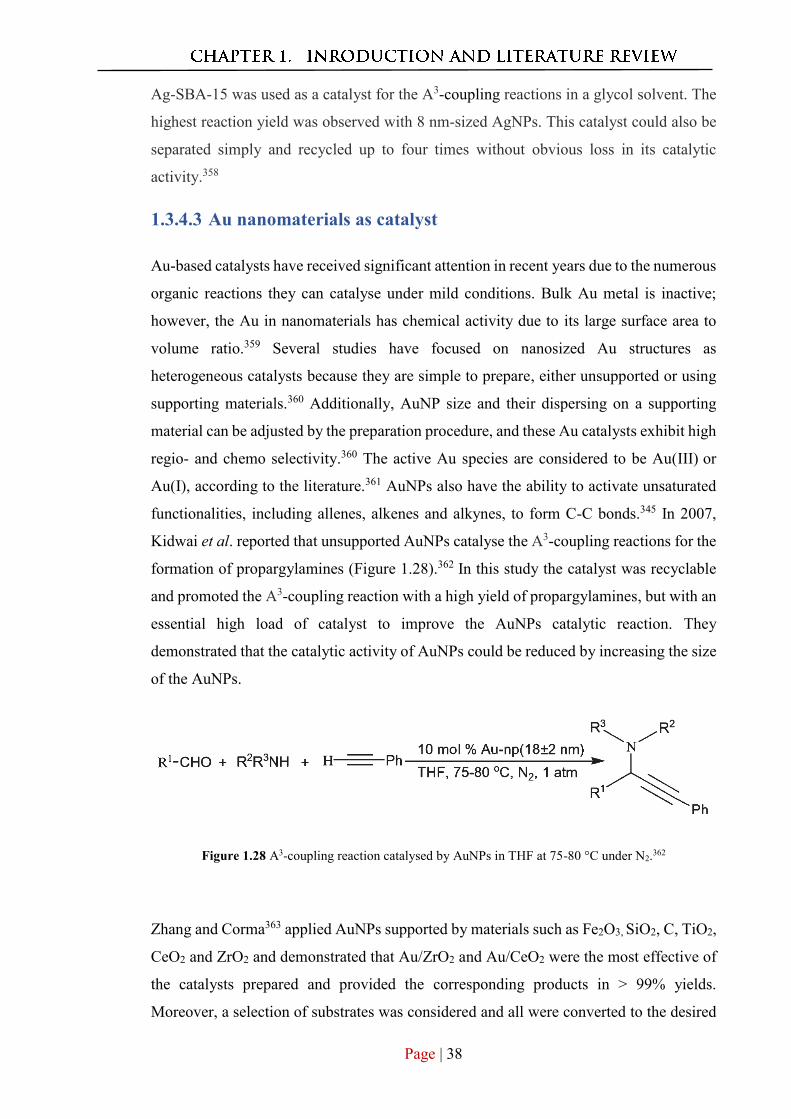
Page | 38
Ag-SBA-15 was used as a catalyst for the A3-coupling reactions in a glycol solvent. The
highest reaction yield was observed with 8 nm-sized AgNPs. This catalyst could also be
separated simply and recycled up to four times without obvious loss in its catalytic
activity.358
1.3.4.3 Au nanomaterials as catalyst
Au-based catalysts have received significant attention in recent years due to the numerous
organic reactions they can catalyse under mild conditions. Bulk Au metal is inactive;
however, the Au in nanomaterials has chemical activity due to its large surface area to
volume ratio.359 Several studies have focused on nanosized Au structures as
heterogeneous catalysts because they are simple to prepare, either unsupported or using
supporting materials.360 Additionally, AuNP size and their dispersing on a supporting
material can be adjusted by the preparation procedure, and these Au catalysts exhibit high
regio- and chemo selectivity.360 The active Au species are considered to be Au(III) or Au(I), according to the literature.361 AuNPs also have the ability to activate unsaturated
functionalities, including allenes, alkenes and alkynes, to form C-C bonds.345 In 2007,
Kidwai et al. reported that unsupported AuNPs catalyse the A3-coupling reactions for the
formation of propargylamines (Figure 1.28).362 In this study the catalyst was recyclable
and promoted the A3-coupling reaction with a high yield of propargylamines, but with an
essential high load of catalyst to improve the AuNPs catalytic reaction. They
demonstrated that the catalytic activity of AuNPs could be reduced by increasing the size
of the AuNPs.
Figure 1.28 A3-coupling reaction catalysed by AuNPs in THF at 75-80 °C under N2.362
Zhang and Corma363 applied AuNPs supported by materials such as Fe2O3, SiO2, C, TiO2,
CeO2 and ZrO2 and demonstrated that Au/ZrO2 and Au/CeO2 were the most effective of
the catalysts prepared and provided the corresponding products in > 99% yields.
Moreover, a selection of substrates was considered and all were converted to the desired
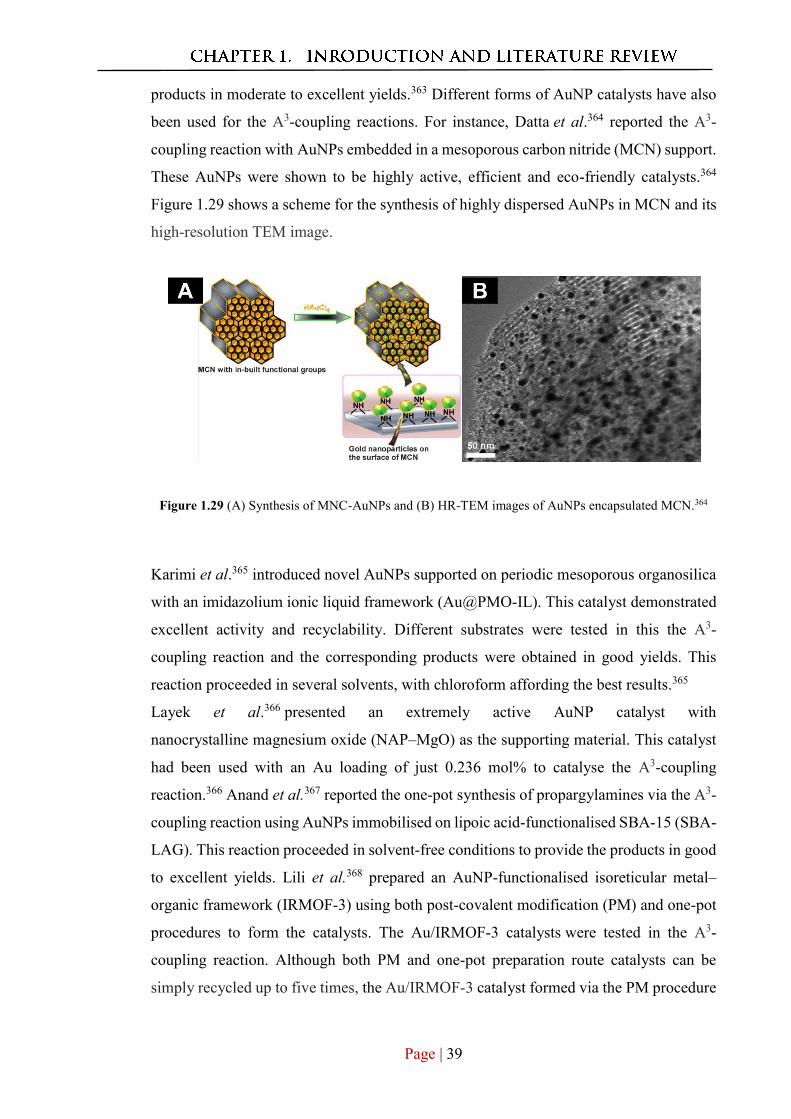
Page | 39
products in moderate to excellent yields.363 Different forms of AuNP catalysts have also
been used for the A3-coupling reactions. For instance, Datta et al.364 reported the A3-
coupling reaction with AuNPs embedded in a mesoporous carbon nitride (MCN) support.
These AuNPs were shown to be highly active, efficient and eco-friendly catalysts.364
Figure 1.29 shows a scheme for the synthesis of highly dispersed AuNPs in MCN and its
high-resolution TEM image.
Figure 1.29 (A) Synthesis of MNC-AuNPs and (B) HR-TEM images of AuNPs encapsulated MCN.364
Karimi et al.365 introduced novel AuNPs supported on periodic mesoporous organosilica
with an imidazolium ionic liquid framework (Au@PMO-IL). This catalyst demonstrated
excellent activity and recyclability. Different substrates were tested in this the A3-
coupling reaction and the corresponding products were obtained in good yields. This
reaction proceeded in several solvents, with chloroform affording the best results.365
Layek et al.366 presented an extremely active AuNP catalyst with
nanocrystalline magnesium oxide (NAP–MgO) as the supporting material. This catalyst
had been used with an Au loading of just 0.236 mol% to catalyse the A3-coupling
reaction.366 Anand et al.367 reported the one-pot synthesis of propargylamines via the A3-
coupling reaction using AuNPs immobilised on lipoic acid-functionalised SBA-15 (SBA-
LAG). This reaction proceeded in solvent-free conditions to provide the products in good
to excellent yields. Lili et al.368 prepared an AuNP-functionalised isoreticular metal–
organic framework (IRMOF-3) using both post-covalent modification (PM) and one-pot
procedures to form the catalysts. The Au/IRMOF-3 catalysts were tested in the A3-
coupling reaction. Although both PM and one-pot preparation route catalysts can be
simply recycled up to five times, the Au/IRMOF-3 catalyst formed via the PM procedure
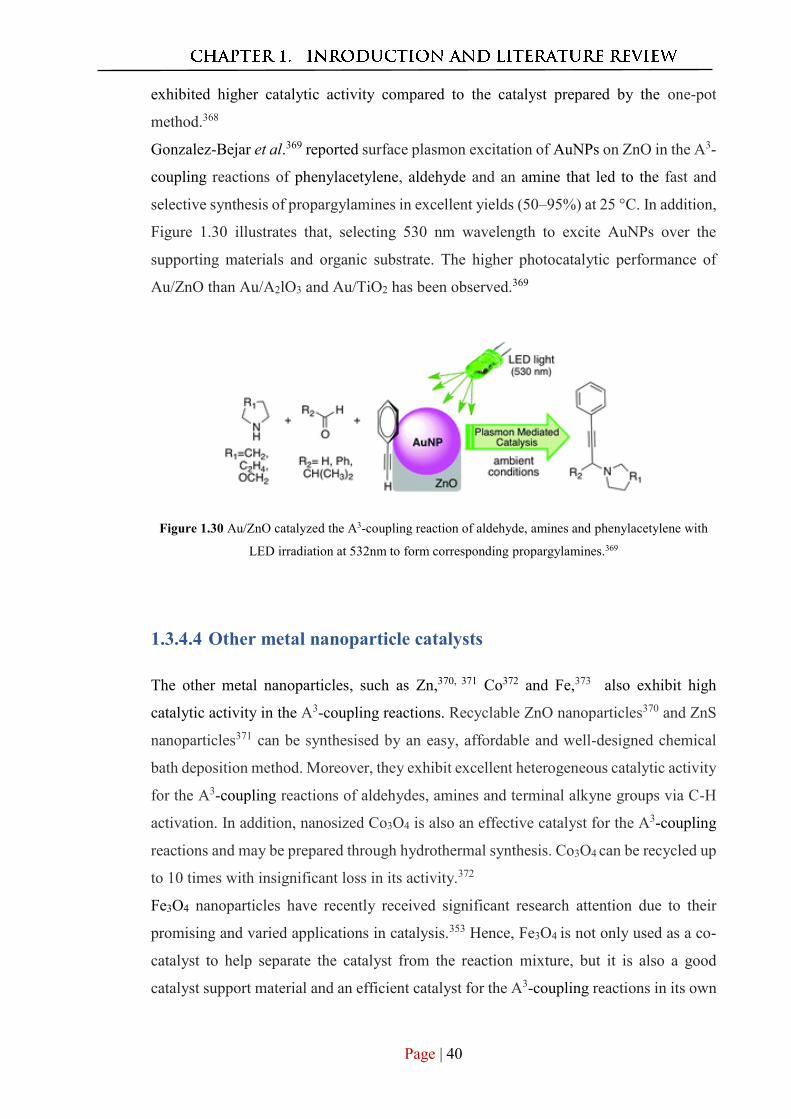
Page | 40
exhibited higher catalytic activity compared to the catalyst prepared by the one-pot
method.368
Gonzalez-Bejar et al.369 reported surface plasmon excitation of AuNPs on ZnO in the A3-
coupling reactions of phenylacetylene, aldehyde and an amine that led to the fast and
selective synthesis of propargylamines in excellent yields (50–95%) at 25 °C. In addition,
Figure 1.30 illustrates that, selecting 530 nm wavelength to excite AuNPs over the
supporting materials and organic substrate. The higher photocatalytic performance of
Au/ZnO than Au/A2lO3 and Au/TiO2 has been observed.369
Figure 1.30 Au/ZnO catalyzed the A3-coupling reaction of aldehyde, amines and phenylacetylene with
LED irradiation at 532nm to form corresponding propargylamines.369
1.3.4.4 Other metal nanoparticle catalysts
The other metal nanoparticles, such as Zn,370, 371 Co372 and Fe,373 also exhibit high
catalytic activity in the A3-coupling reactions. Recyclable ZnO nanoparticles370 and ZnS
nanoparticles371 can be synthesised by an easy, affordable and well-designed chemical
bath deposition method. Moreover, they exhibit excellent heterogeneous catalytic activity
for the A3-coupling reactions of aldehydes, amines and terminal alkyne groups via C-H
activation. In addition, nanosized Co3O4 is also an effective catalyst for the A3-coupling
reactions and may be prepared through hydrothermal synthesis. Co3O4 can be recycled up
to 10 times with insignificant loss in its activity.372
Fe3O4 nanoparticles have recently received significant research attention due to their
promising and varied applications in catalysis.353 Hence, Fe3O4 is not only used as a co-
catalyst to help separate the catalyst from the reaction mixture, but it is also a good
catalyst support material and an efficient catalyst for the A3-coupling reactions in its own
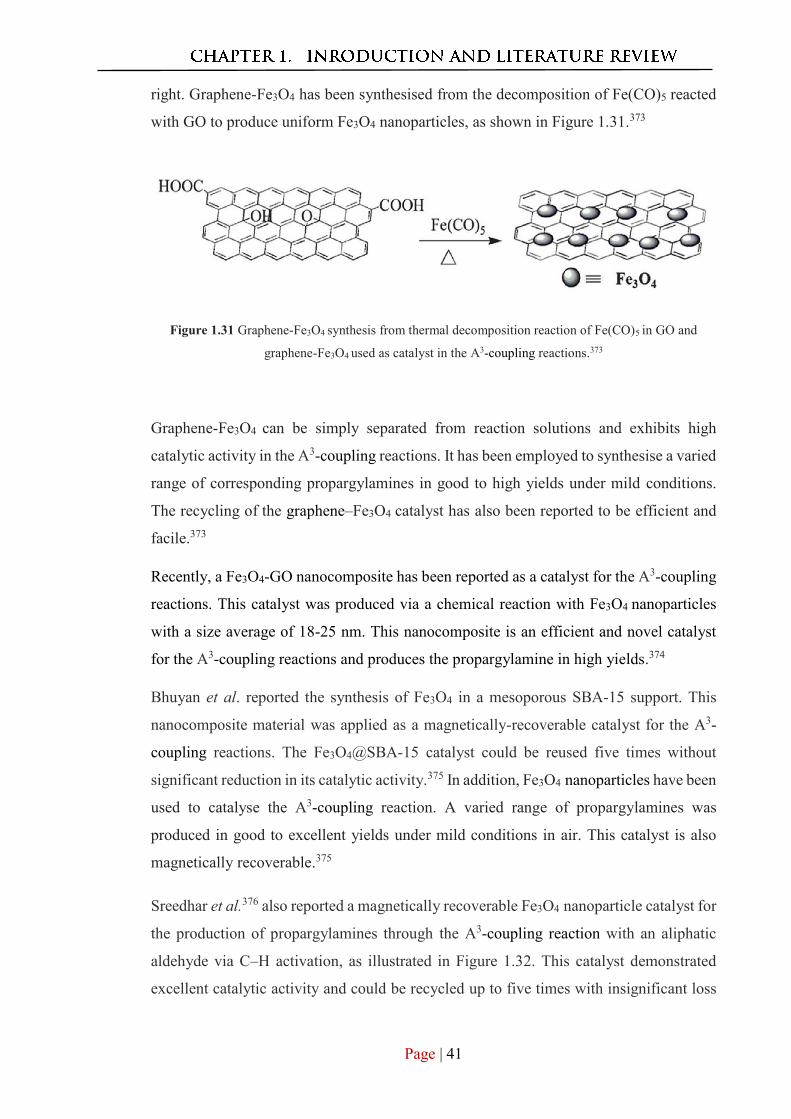
Page | 41
right. Graphene-Fe3O4 has been synthesised from the decomposition of Fe(CO)5 reacted
with GO to produce uniform Fe3O4 nanoparticles, as shown in Figure 1.31.373
Figure 1.31 Graphene-Fe3O4 synthesis from thermal decomposition reaction of Fe(CO)5 in GO and
graphene-Fe3O4 used as catalyst in the A3-coupling reactions.373
Graphene-Fe3O4 can be simply separated from reaction solutions and exhibits high
catalytic activity in the A3-coupling reactions. It has been employed to synthesise a varied
range of corresponding propargylamines in good to high yields under mild conditions.
The recycling of the graphene–Fe3O4 catalyst has also been reported to be efficient and
facile.373
Recently, a Fe3O4-GO nanocomposite has been reported as a catalyst for the A3-coupling
reactions. This catalyst was produced via a chemical reaction with Fe3O4 nanoparticles
with a size average of 18-25 nm. This nanocomposite is an efficient and novel catalyst
for the A3-coupling reactions and produces the propargylamine in high yields.374
Bhuyan et al. reported the synthesis of Fe3O4 in a mesoporous SBA-15 support. This
nanocomposite material was applied as a magnetically-recoverable catalyst for the A3-
coupling reactions. The Fe3O4@SBA-15 catalyst could be reused five times without
significant reduction in its catalytic activity.375 In addition, Fe3O4 nanoparticles have been
used to catalyse the A3-coupling reaction. A varied range of propargylamines was
produced in good to excellent yields under mild conditions in air. This catalyst is also
magnetically recoverable.375
Sreedhar et al.376 also reported a magnetically recoverable Fe3O4 nanoparticle catalyst for
the production of propargylamines through the A3-coupling reaction with an aliphatic
aldehyde via C–H activation, as illustrated in Figure 1.32. This catalyst demonstrated
excellent catalytic activity and could be recycled up to five times with insignificant loss
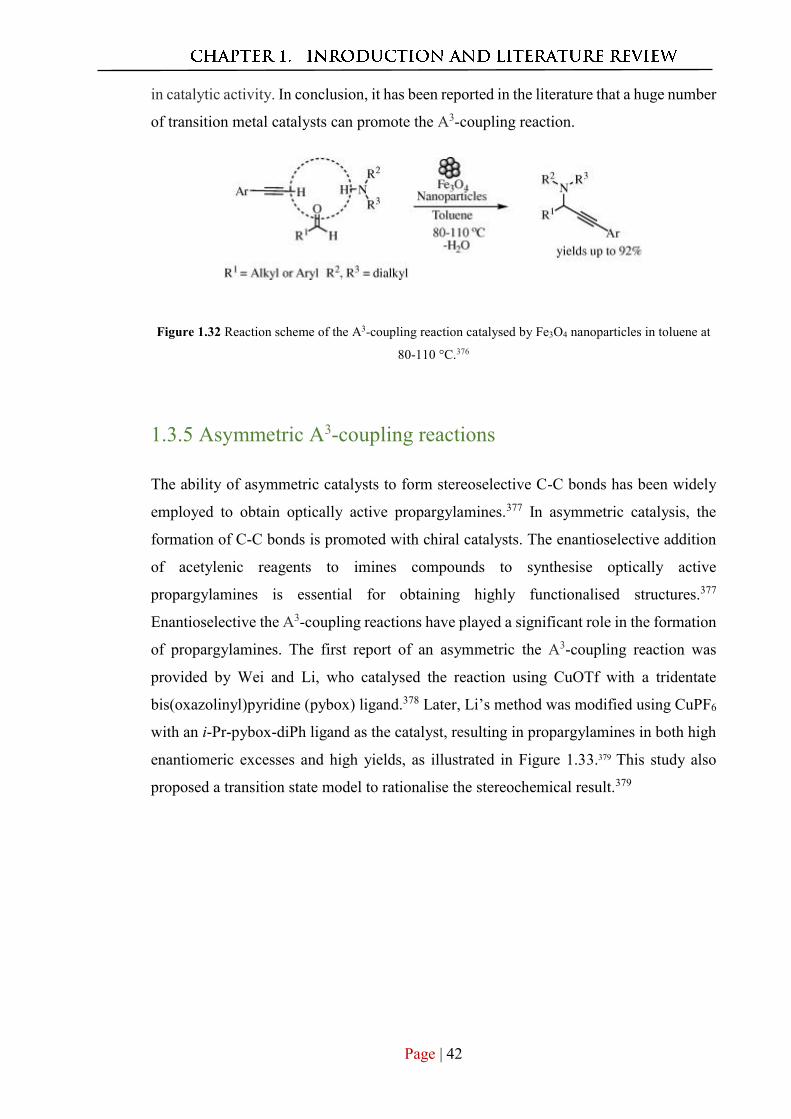
Page | 42
in catalytic activity. In conclusion, it has been reported in the literature that a huge number
of transition metal catalysts can promote the A3-coupling reaction.
Figure 1.32 Reaction scheme of the A3-coupling reaction catalysed by Fe3O4 nanoparticles in toluene at
80-110 °C.376
1.3.5 Asymmetric A3-coupling reactions
The ability of asymmetric catalysts to form stereoselective C-C bonds has been widely
employed to obtain optically active propargylamines.377 In asymmetric catalysis, the
formation of C-C bonds is promoted with chiral catalysts. The enantioselective addition
of acetylenic reagents to imines compounds to synthesise optically active
propargylamines is essential for obtaining highly functionalised structures.377
Enantioselective the A3-coupling reactions have played a significant role in the formation
of propargylamines. The first report of an asymmetric the A3-coupling reaction was
provided by Wei and Li, who catalysed the reaction using CuOTf with a tridentate
bis(oxazolinyl)pyridine (pybox) ligand.378 Later, Li’s method was modified using CuPF6
with an i-Pr-pybox-diPh ligand as the catalyst, resulting in propargylamines in both high
enantiomeric excesses and high yields, as illustrated in Figure 1.33.379 This study also
proposed a transition state model to rationalise the stereochemical result.379
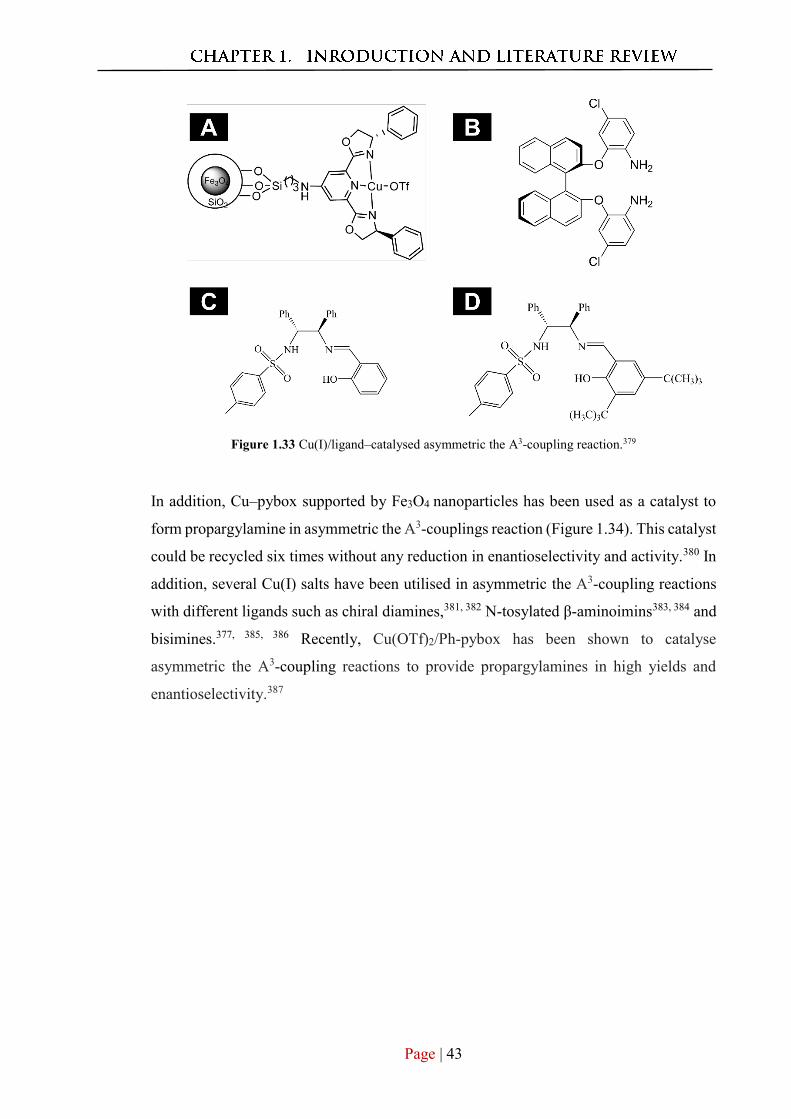
Page | 43
Figure 1.33 Cu(I)/ligand–catalysed asymmetric the A3-coupling reaction.379
In addition, Cu–pybox supported by Fe3O4 nanoparticles has been used as a catalyst to
form propargylamine in asymmetric the A3-couplings reaction (Figure 1.34). This catalyst
could be recycled six times without any reduction in enantioselectivity and activity.380 In
addition, several Cu(I) salts have been utilised in asymmetric the A3-coupling reactions
with different ligands such as chiral diamines,381, 382 N-tosylated β-aminoimins383, 384 and
bisimines.377, 385, 386 Recently, Cu(OTf)2/Ph-pybox has been shown to catalyse
asymmetric the A3-coupling reactions to provide propargylamines in high yields and
enantioselectivity.387
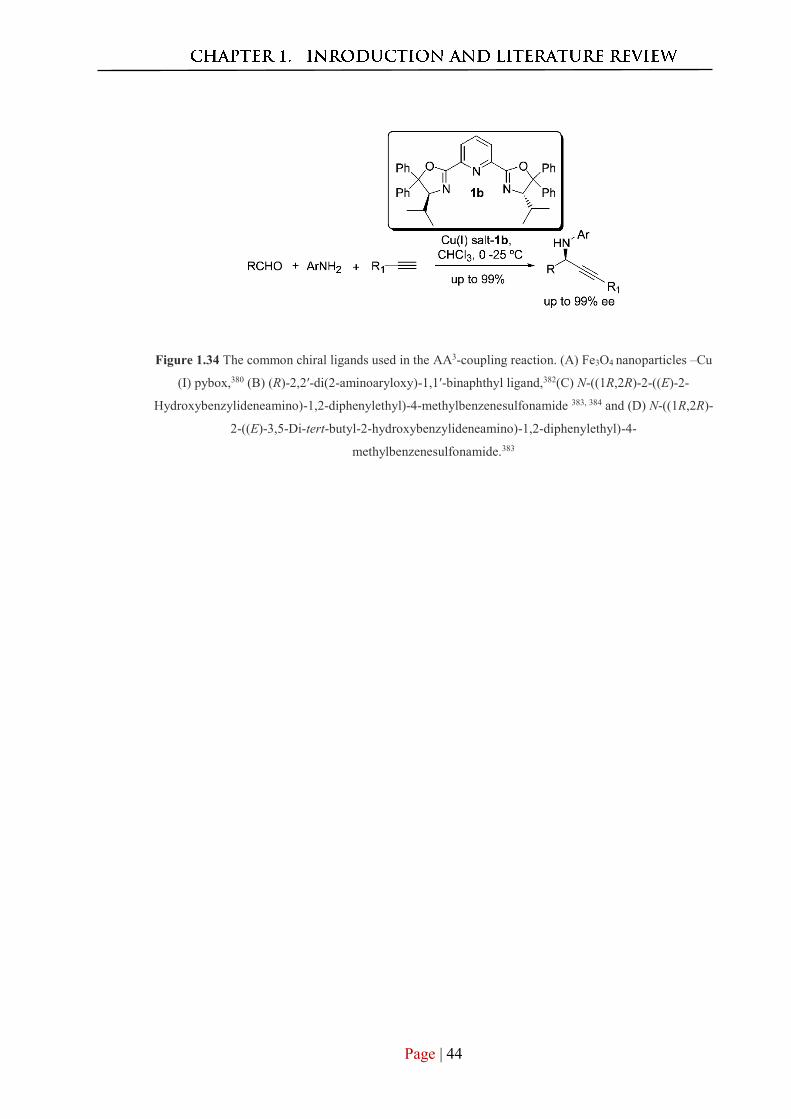
Page | 44
Figure 1.34 The common chiral ligands used in the AA3-coupling reaction. (A) Fe3O4 nanoparticles –Cu
(I) pybox,380 (B) (R)-2,2′-di(2-aminoaryloxy)-1,1′-binaphthyl ligand,382(C) N-((1R,2R)-2-((E)-2-
Hydroxybenzylideneamino)-1,2-diphenylethyl)-4-methylbenzenesulfonamide 383, 384 and (D) N-((1R,2R)-
2-((E)-3,5-Di-tert-butyl-2-hydroxybenzylideneamino)-1,2-diphenylethyl)-4-
methylbenzenesulfonamide.383
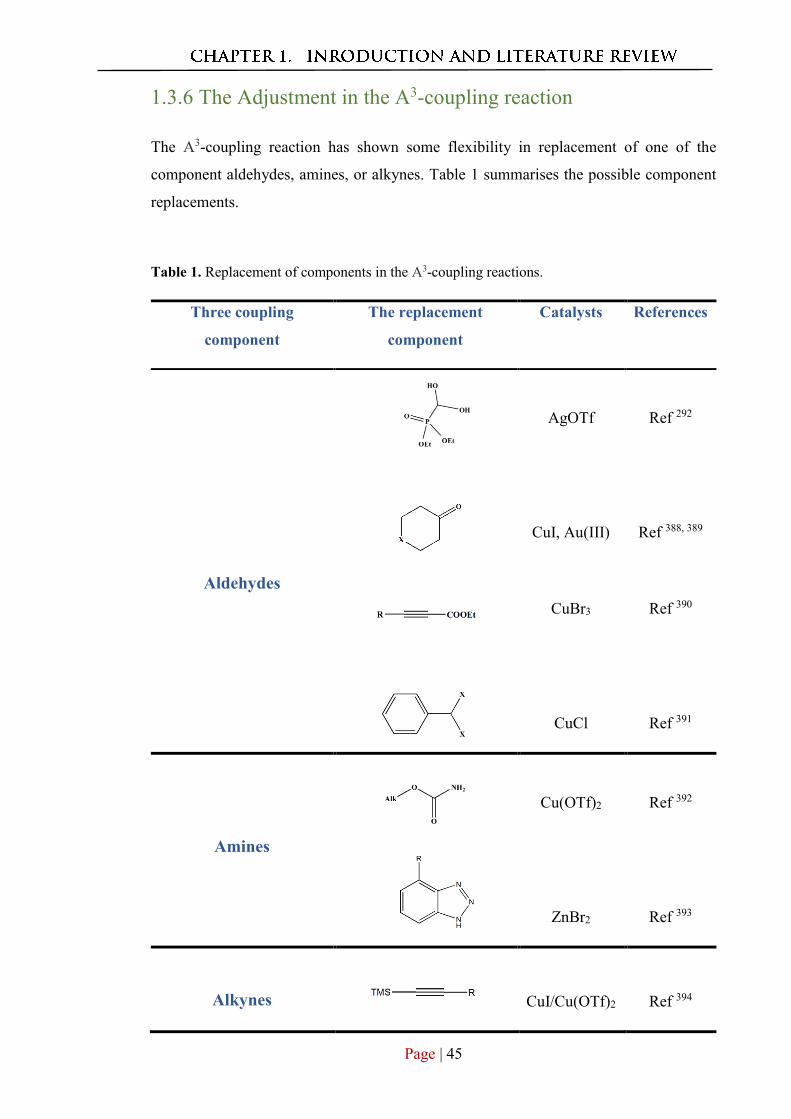
Page | 45
1.3.6 The Adjustment in the A3-coupling reaction
The A3-coupling reaction has shown some flexibility in replacement of one of the
component aldehydes, amines, or alkynes. Table 1 summarises the possible component
replacements.
Table 1. Replacement of components in the A3-coupling reactions.
Three coupling
component
The replacement
component
Catalysts References
Aldehydes
AgOTf
CuI, Au(III)
CuBr3
CuCl
Ref 292
Ref 388, 389
Ref 390
Ref 391
Amines
Cu(OTf)2
ZnBr2
Ref 392
Ref 393
Alkynes
CuI/Cu(OTf)2
Ref 394
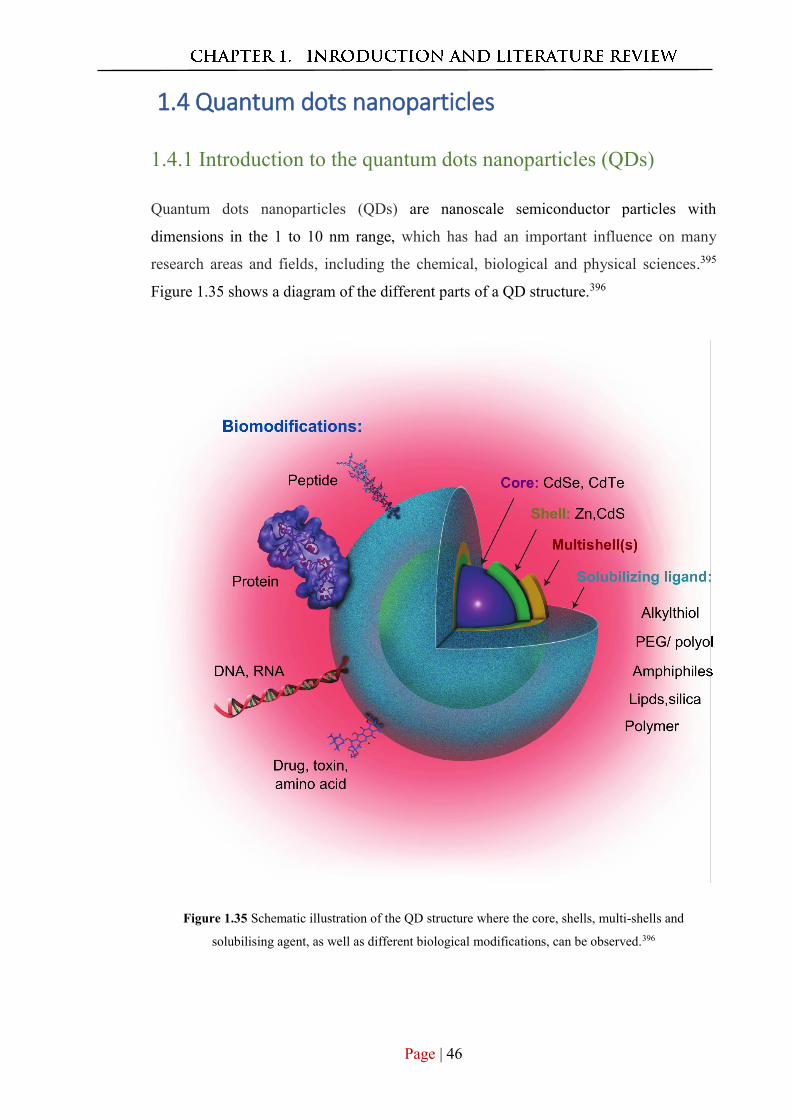
Page | 46
1.4 Quantum dots nanoparticles
1.4.1 Introduction to the quantum dots nanoparticles (QDs)
Quantum dots nanoparticles (QDs) are nanoscale semiconductor particles with
dimensions in the 1 to 10 nm range, which has had an important influence on many
research areas and fields, including the chemical, biological and physical sciences.395
Figure 1.35 shows a diagram of the different parts of a QD structure.396
Figure 1.35 Schematic illustration of the QD structure where the core, shells, multi-shells and
solubilising agent, as well as different biological modifications, can be observed.396
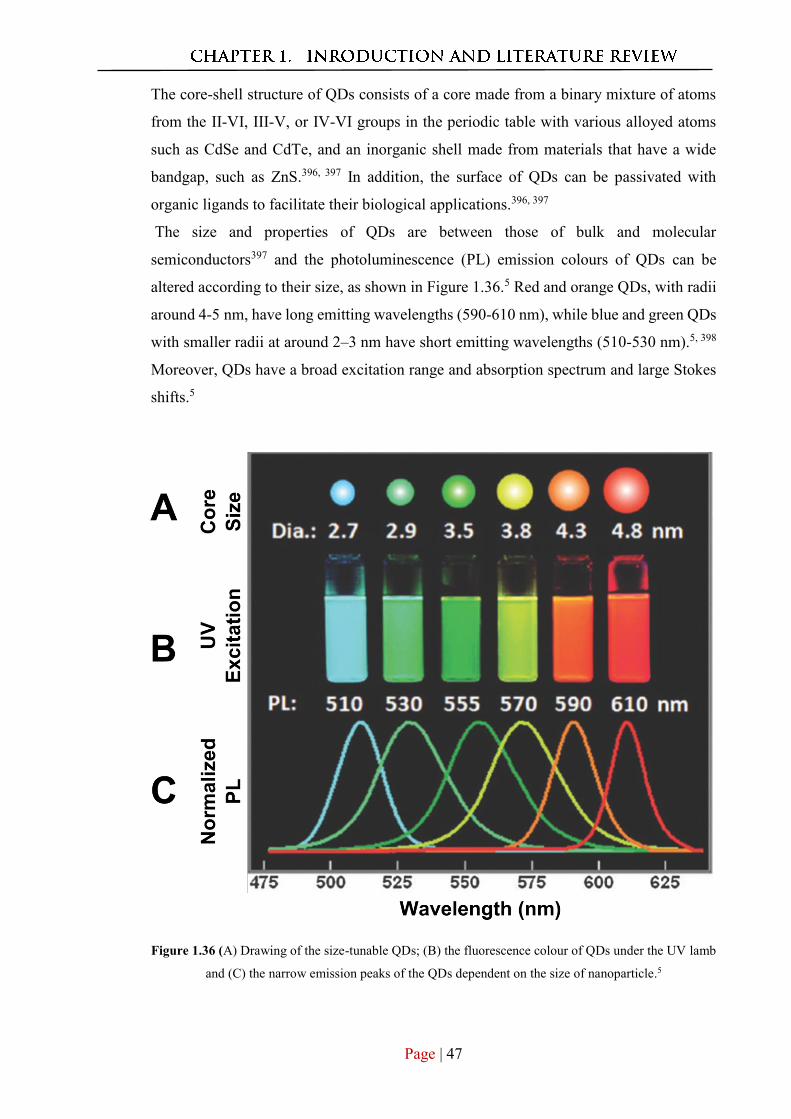
Page | 47
The core-shell structure of QDs consists of a core made from a binary mixture of atoms
from the II-VI, III-V, or IV-VI groups in the periodic table with various alloyed atoms
such as CdSe and CdTe, and an inorganic shell made from materials that have a wide
bandgap, such as ZnS.396, 397 In addition, the surface of QDs can be passivated with
organic ligands to facilitate their biological applications.396, 397 The size and properties of QDs are between those of bulk and molecular
semiconductors397 and the photoluminescence (PL) emission colours of QDs can be
altered according to their size, as shown in Figure 1.36.5 Red and orange QDs, with radii
around 4-5 nm, have long emitting wavelengths (590-610 nm), while blue and green QDs
with smaller radii at around 2–3 nm have short emitting wavelengths (510-530 nm).5, 398
Moreover, QDs have a broad excitation range and absorption spectrum and large Stokes
shifts.5
Figure 1.36 (A) Drawing of the size-tunable QDs; (B) the fluorescence colour of QDs under the UV lamb
and (C) the narrow emission peaks of the QDs dependent on the size of nanoparticle.5
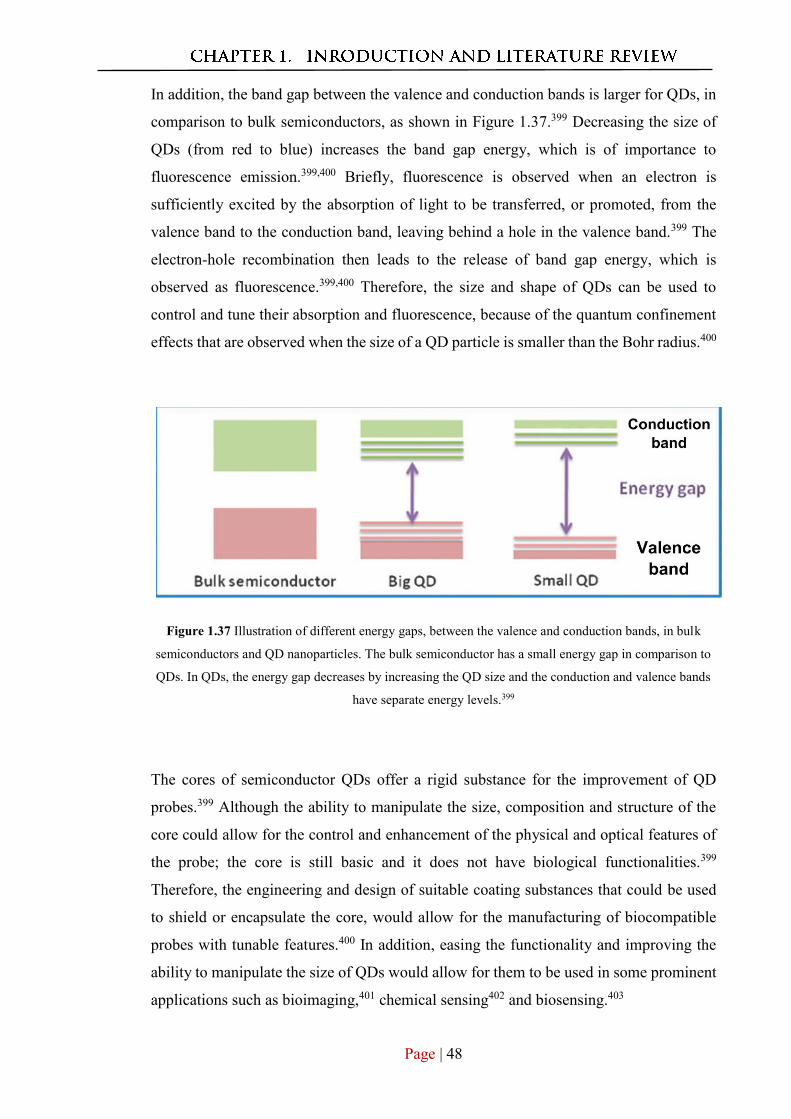
Page | 48
In addition, the band gap between the valence and conduction bands is larger for QDs, in
comparison to bulk semiconductors, as shown in Figure 1.37.399 Decreasing the size of
QDs (from red to blue) increases the band gap energy, which is of importance to
fluorescence emission.399,400 Briefly, fluorescence is observed when an electron is
sufficiently excited by the absorption of light to be transferred, or promoted, from the
valence band to the conduction band, leaving behind a hole in the valence band.399 The
electron-hole recombination then leads to the release of band gap energy, which is
observed as fluorescence.399,400 Therefore, the size and shape of QDs can be used to
control and tune their absorption and fluorescence, because of the quantum confinement
effects that are observed when the size of a QD particle is smaller than the Bohr radius.400
Figure 1.37 Illustration of different energy gaps, between the valence and conduction bands, in bulk
semiconductors and QD nanoparticles. The bulk semiconductor has a small energy gap in comparison to
QDs. In QDs, the energy gap decreases by increasing the QD size and the conduction and valence bands
have separate energy levels.399
The cores of semiconductor QDs offer a rigid substance for the improvement of QD
probes.399 Although the ability to manipulate the size, composition and structure of the
core could allow for the control and enhancement of the physical and optical features of
the probe; the core is still basic and it does not have biological functionalities.399
Therefore, the engineering and design of suitable coating substances that could be used
to shield or encapsulate the core, would allow for the manufacturing of biocompatible
probes with tunable features.400 In addition, easing the functionality and improving the
ability to manipulate the size of QDs would allow for them to be used in some prominent
applications such as bioimaging,401 chemical sensing402 and biosensing.403
Page | 49
As the nature of the core and shells is important for the synthesis of QDs, in the next
section we will review and summarise the newest developments in the design and
engineering of QDs, including the synthesis of their core, shells and multiple shells.
Furthermore, the next section will also dwell on the surface modification of QDs through
their amalgamation with appropriate materials, so as to emulate the desired properties
needed for several applications.
1.4.2 Synthesis of fluorescent QDs
As previously mentioned, the core of QDs consists of binary semiconductor elements
made from the II-VI, III-V, or IV-VI groups in the periodic table.397 QDs that contain Cd
along with Te, Se, or S show superior physical and optical properties compared to other
QDs and hence have been explored the most.404 The most common method for
synthesising QDs, which was first introduced by Murray et al.,405 is a colloidal synthesis
achieved through the high-temperature controlled nucleation and growth of nanocrystals
in a solution that contains organometallic precursors and a surfactant.405 The surfactants
typically used include trioctylphosphine (TOP), trioctylphosphine oxide (TOPO), or a
mixture of both and they work as a capping layer to offer stabilisation during the reaction
and to help avoid the formation of aggregates.405 Nucleation commences when the
mixture is heated and the surfactant begins to absorb into the surface of the
nanocrystals.405 However, these high-temperature procedures tend to produce
hydrophobic QDs, making it difficult to modify their properties for biological
applications.405 The use of dimethyl cadmium was later substituted by less toxic and more
stable precursors like cadmium acetylacetonate406 and cadmium oxide.407
Although the employment of colloidal QDs fabricated by the aforementioned method has
been widely exerted, the direct preparation of QDs in an aqueous solvent has been shown
to have several advantages such as a low cost, high reproducibility, simple synthesis and
an enhanced biocompatibility.5 In aqueous systems, cadmium or zinc salts and sodium
hydrogen telluride or sodium hydrogen selenide, which are soluble in water, have been
used with several capping agents. In addition, thiol ligands, such as cysteine,408
thioglycolic acids (TGA),408 3-mercaptopropionic acid (MPA)409 and
mercaptoundecanoic acid (MUA)410 have been widely applied as stabilisers and capping
agents during the growth of QDs.
Water-soluble QDs are obtained through the use of the aforementioned thiol ligands via
a process where the thiol group stabilises the formation of the QDs by coating onto their
Page | 50
entire surface in such a way that the hydrophilic end of the thiol faces the polar solvent.411
A summary of the common strategies to synthesise colloidal (hydrophobic) and aqueous
(hydrophilic) QDs is shown in Table 2.
Furthermore, the broad use and development of transition-metal ion-doped QDs resulted
from their demonstrated advantages, which include a large Stokes shift, high thermal
stability and long excited state lifetimes.412, 413 Specifically, QDs doped with Mn and Cu
ions can be synthesised using a nucleation–doping method, for example, Mn-doped
ZnSe,412, 413 Cu-doped CdSe,414 Mn-doped CdTe415 and Mn-doped ZnS.416
1.4.3 Core-shell QDs
Many reports have shown that the passivation of QDs with inorganic shells, such as CdS
and ZnS, enhances their fluorescence properties.417, 418 For example, it has been found
that an increase in the band gap energy of QDs can lead to an improvement in their
fluorescence quantum yield (QY), which also helps to protect their core from oxidising
and leaching Cd2+ and facilitates their further biological modification.419, 420 Hence,
because of this outcome, the passivation of QD cores with inorganic shells has been used
intensively. Some examples of core passivation from the literature include CdSe/ZnS,417
CdSe/CdS418 and CdSe/CdTe systems.421 The passivation of QDs has been further
developed through the formation of multi-shells such as CdTe/CdS/ZnS,422, 423 CdSe/CdS/ZnS424, 425 and CdSe/ZnSe/ZnS.425 According to the literature, the best results
have been reported with ZnS shells, as the photoluminescence of QDs is significantly
enhanced.411 However, although it is important to choose the best performing materials
for the fabrication of the core and shells of QDs, other crucial parameters should also be
studied. For example, the thickness of the shell should be optimised because it has been
shown to have an obvious effect on the stability of the QDs against degradation and
oxidation and to also improve the optical properties of QDs.420
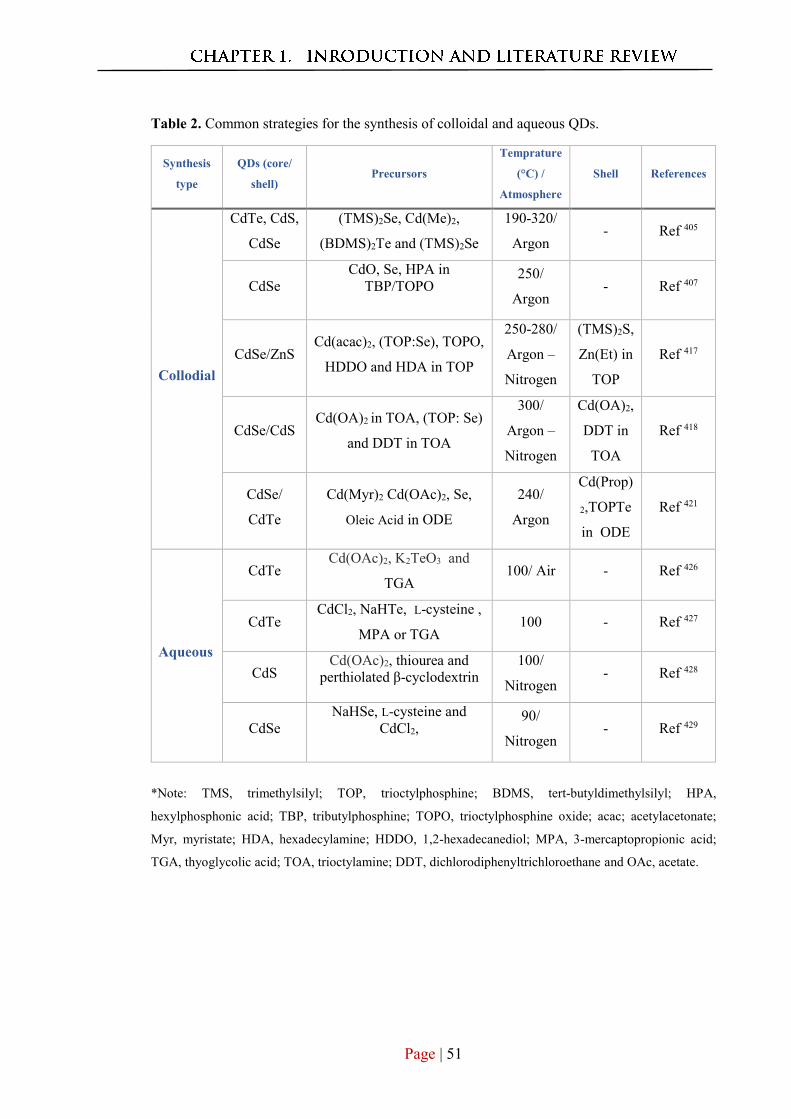
Page | 51
Table 2. Common strategies for the synthesis of colloidal and aqueous QDs.
Synthesis
type
QDs (core/
shell) Precursors
Temprature
(°C) /
Atmosphere
Shell References
Collodial
CdTe, CdS,
CdSe
(TMS)2Se, Cd(Me)2,
(BDMS)2Te and (TMS)2Se
190-320/
Argon - Ref 405
CdSe CdO, Se, HPA in
TBP/TOPO
250/
Argon - Ref 407
CdSe/ZnS Cd(acac)2, (TOP:Se), TOPO,
HDDO and HDA in TOP
250-280/
Argon –
Nitrogen
(TMS)2S,
Zn(Et) in
TOP
Ref 417
CdSe/CdS Cd(OA)2 in TOA, (TOP: Se)
and DDT in TOA
300/
Argon –
Nitrogen
Cd(OA)2,
DDT in
TOA
Ref 418
CdSe/
CdTe
Cd(Myr)2 Cd(OAc)2, Se,
Oleic Acid in ODE
240/
Argon
Cd(Prop)
2,TOPTe
in ODE
Ref 421
Aqueous
CdTe Cd(OAc)2, K2TeO3 and
TGA 100/ Air - Ref 426
CdTe CdCl2, NaHTe, L-cysteine ,
MPA or TGA 100 - Ref 427
CdS Cd(OAc)2, thiourea and
perthiolated β-cyclodextrin
100/
Nitrogen - Ref 428
CdSe NaHSe, L-cysteine and
CdCl2,
90/
Nitrogen - Ref 429
*Note: TMS, trimethylsilyl; TOP, trioctylphosphine; BDMS, tert-butyldimethylsilyl; HPA,
hexylphosphonic acid; TBP, tributylphosphine; TOPO, trioctylphosphine oxide; acac; acetylacetonate;
Myr, myristate; HDA, hexadecylamine; HDDO, 1,2-hexadecanediol; MPA, 3-mercaptopropionic acid;
TGA, thyoglycolic acid; TOA, trioctylamine; DDT, dichlorodiphenyltrichloroethane and OAc, acetate.
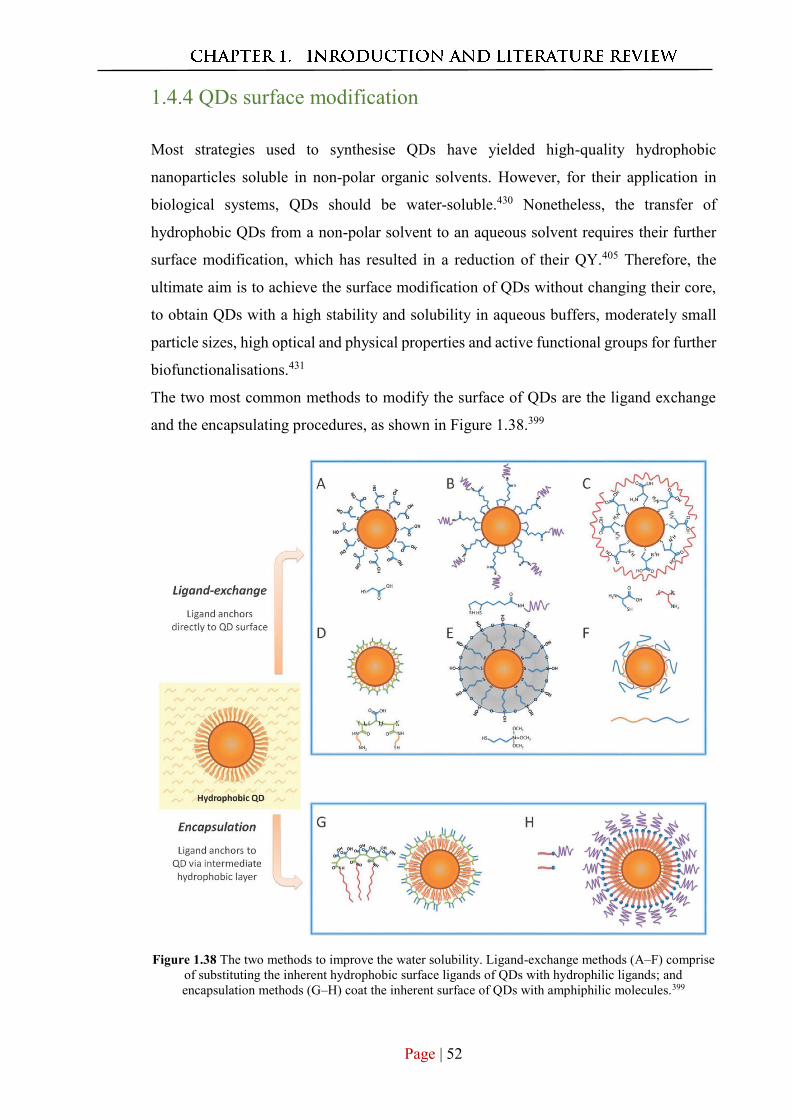
Page | 52
1.4.4 QDs surface modification
Most strategies used to synthesise QDs have yielded high-quality hydrophobic
nanoparticles soluble in non-polar organic solvents. However, for their application in
biological systems, QDs should be water-soluble.430 Nonetheless, the transfer of
hydrophobic QDs from a non-polar solvent to an aqueous solvent requires their further
surface modification, which has resulted in a reduction of their QY.405 Therefore, the
ultimate aim is to achieve the surface modification of QDs without changing their core,
to obtain QDs with a high stability and solubility in aqueous buffers, moderately small
particle sizes, high optical and physical properties and active functional groups for further
biofunctionalisations.431
The two most common methods to modify the surface of QDs are the ligand exchange
and the encapsulating procedures, as shown in Figure 1.38.399
Figure 1.38 The two methods to improve the water solubility. Ligand-exchange methods (A–F) comprise
of substituting the inherent hydrophobic surface ligands of QDs with hydrophilic ligands; and encapsulation methods (G–H) coat the inherent surface of QDs with amphiphilic molecules.399
Page | 53
The first procedure, the ligand exchange, is attained by replacing the natural ligands
(hydrophobic) on the surface of QD nanoparticle with ligands that have a thiol group. The
polar functional groups (hydrophilic) of the thiol group, such as amines and carboxylates,
end up facing the solvent and thus facilitate the water solubility of the QDs.399, 432 There
are many examples of thiol ligands, as illustrated in Figure 1.38 and monodentate thiol
groups, such as MPA (Figure 1.38 A).399, 433 In addition, bidentate thiol groups attached
to PEG, to form amine- terminated PEG-dihydrolipoamide or carboxylic acid-terminated
PEG-dihydrolipoamide, have been reported by Liu et al. (Figure 1.38 B).434 Commonly,
in comparison to monodentate thiol groups, bidentate thiol group ligands have been
shown to have a superior ability not only to attach onto the surface of QDs but also to
improve their stability.417 Sukhanova et al. introduced an alternative ligand exchange
procedure that initially involves the use of DL-cysteine and then further functionalisation
of the nanoparticles with poly(allylamine) to yield CdSe/ZnS QDs with an increased QY
from 40 to 65% (Figure 1.38 C).435 Furthermore, the use of multidentate polymer ligands
that consist of thiol and amine anchor groups with a poly(acrylic acid) backbone to coat
CdTe QDs have been reported and the results have shown that the obtained CdTe QDs
have a good biocompatibility and stable water-solubility (Figure 1.38 D).436, 437 Coating
the surface of QDs with a silica shell (Figure 1.38 E) involves another simple ligand
exchange procedure, where the natural TOPO surface of the QDs is replaced with 3-
(mercaptopropyl) trimethoxysilane (MPS).438 Lastly, the use of biomolecules, such as
peptides, to coat the surface of QDs (Figure 1.38 F) was reported by Pinaud et al.439 who
obtained biocompatible QDs with stable and high photophysical properties. The latter
procedure, encapsulation, preserves the inherent hydrophobic surface coating of QDs by
encapsulates the QDs with amphiphilic molecules, for instance, polymers440 or
phospholipids441 (Figure 1.38 G and H, respectively).
Finding appropriate capping or passivation agents is critical for introducing functional
groups onto the QDs to endow them with an efficient biocompatibility and high optical
properties. For example, small organic ligands cannot provide QDs with a high-stability,
especially in complex environments, because they cause the aggregation of QD
nanoparticles as a result of desorption, which leads to the degradation of their surface
functionality.442 Moreover, the surface of QDs is hard to coat uniformly with small
organic ligands and thus the heavy metal ions used (e.g. Cd2+) can be easily released,
causing unwanted toxicity in biological systems.443 Although the inorganic shells in the
Page | 54
previously introduced QD core/shell nanoparticles have shown good biocompatibility and
high photophysical properties, their surface is difficult to functionalise further.444, 445
On the other hand, coating the surface of QDs with polymers (linear) or dendrimers
(hyperbranched polymers), which are rich in chemical functionalities, has been shown to
give the QDs a high biocompatibility and enhanced optical and physical properties.446, 447
Remarkably, polymer-coated QDs have proved to be less toxic in biological applications,
in comparison to QDs coated with small organic ligands.420 Thus, dendrimers have
attracted enormous research attention due to their distinctive structures and easy-to-
functionalise terminal groups.448, 449 In general, linear or hyperbranched polymers are
suitable substitutes for the small organic ligands and inorganic shells in the coating of
QDs.447 However, the thickness of polymer coatings on the surface of QDs may restrict
their application in fluorescence resonance energy transfer (FRET).431
1.5 Summary
In summary, various nanomaterials have been utilised in sensing, catalysis and
biomedical applications. In H2O2 sensing applications, nanomaterials have been utilised
because of their high surface area, quick mass transport, excellent catalytic activity and
improved electron transfer. In addition, the performance of H2O2 sensors has been
enhanced by using nanomaterials with novel conformations. For example, bimetals and
carbon nanomaterials having surfaces modified with various metallic nanoparticles.
These approaches enhance the sensitivity and selectivity of H2O2 sensors and open up
many possibilities for their improvement.
The role of catalysts is to help improve reaction rates and product yields. In this regard,
nanocatalysts have shown similar and often much better properties than their bulk
homogeneous and heterogeneous counterparts. In addition, the use of hybrid materials
can highly improve the application of nanometals in catalysis by enhancing their
recyclability and stability. Based on the literature reports discussed previously, it can be
concluded that the use of bimetallic or multimetallic nanomaterials significantly improves
catalysis. Noble metal alloys have been used in different catalytic reactions where they
have shown excellent selectivity and activity.325 Moreover, such catalysts can exhibit
unique surface features and electronic effects between the alloy metals.325 Nanocatalysts
with hybrid or supporting materials such as titania, polymers, carbon, alumina, porous
silica, mesoporous materials and metal oxides can be separated by traditional separation
Page | 55
methods such as centrifugation and filtration. Furthermore, Fe3O4 nanoparticles, which
are robust and extremely efficient catalysts for the A3-coupling reactions, have garnered
significant research attention as catalyst stabilisers, partly due to their ability to be
separated from the reaction mixture under an external magnetic field.
Moreover, the use of QD nanoparticles in several applications involves controlling their
processability with appropriate synthesis, functionalisation and modification procedures.
The unique physical, optical and chemical properties of QD nanoparticles have promoted
the improvement of their applications in imaging probes, drug delivery vehicles and
multifunctional nanodevices. Although different QD core mixtures and shell structures
have been introduced in the literature, polymer-coated QDs have been shown to have
superior properties in comparison to QDs modified with small organic ligands and
inorganic shells.
1.6 The challenges
A review of the existing literature shows that nanomaterials have been used for H2O2
sensing and the A3-coupling reactions for decades. However, there are still a number of
problems associated with the use of nanomaterials in these applications. Furthermore, the
synthesis of multifunctional QDs remains a challenge.
Although nanomaterials have been shown to be highly durable and hence suitable for use
in H2O2 sensors, there are limitations to the detection capabilities of nanomaterials-based
H2O2 sensors. For instance, the reliability, response time, sensitivity and selectivity of
such sensors in the presence of interference need to be improved. Enzymatic H2O2 sensors
exhibit several disadvantages, including high costs and immobilisation-related
complications. Therefore, significant efforts are being made to design and develop new
platforms for nonenzymatic H2O2 sensing that will exhibit good sensing performance,
fast electrode kinetics and low overpotentials.
Au nanocatalysts are increasingly being used in the A3-coupling reaction, owing to their
high efficiency in activating the alkyne C–H bond. However, despite the high activity of
homogeneous Au catalysts, difficulties have been reported on catalyst separation and
reuse. Driven by the need to exploit the A3-coupling reaction in biological and
pharmaceutical applications, numerous efforts are being made to develop highly effective
and recyclable Au nanocatalysts. Therefore, the synthesis of controllable catalysts that
Page | 56
are decorated with or supported by different nanomaterials and can be reused and
recovered is desirable. However, the issue of catalytic recovery has not been resolved
completely. The main challenge is to produce highly efficient, recoverable and recyclable
Au nanocatalysts for the A3-coupling reaction.
With regard to the synthesis of QD-polymer nanoparticles, most procedures available
involve the use of toxic organic solvents, which limits their suitability for use in biological
applications. Further, the reaction conditions involved, which include high temperatures,
make the processes complicated. Thus, there have been only a few studies on the synthesis
of QD-polymer nanoparticles in an aqueous system. Additionally, these procedures often
require multiple steps to passivate the QDs with the polymer, resulting in the quenching
of the fluorescence properties of the QDs. Therefore, it is crucial to design and develop a
facile and efficient method for producing multifunctional QD-polymer nanoparticles.
1.7 The objectives
In this thesis, I will seek to introduce different multifunctional nanosystems and develop
their applications in catalysis and sensing in an attempt to overcome all of the problems
above. Therefore, the specific objectives of the proposed research are as follows:
1. To produce and develop a high surface area of electrochemical sensors
based on magnetite-coated gold nanorod (GNR-Fe3O4) hybrids tending
towards H2O2 with high sensitivity and selectivity in the presence of
common interference compounds.
2. To explore the effect of the field-directed self-assembly gold-coated
magnetite (Fe3O4@Au) nanoparticles in the rate of the A3-coupling
reaction.
3. To develop magnetically recoverable gold nanomaterials as catalysts in
the A3-coupling reaction.
4. To design and engineer multifunctional QDs nanoparticles to combine the
fluorescence and biocompatible properties.
The results for these objectives are introduced in published articles that form the basis of
the following chapter
Page | 57
. CHAPTER 2
INTRODUCTION TO SERIES OF PAPERS
The synthesis of magnetite-coated gold nanorod (GNR-Fe3O4) hybrids with two different
aspect ratios and the application of these two nanohybrids in H2O2 sensing will be
introduced in paper 1. Considering the high costs associated with the use of Au in
catalysis, we developed Au-coated superparamagnetic Fe3O4 (Fe3O4@Au) nanoparticles
to achieve high catalyst recovery and ease of separation using an external magnet for
catalyst recycling. In paper 2, these Fe3O4@Au nanoparticles were used to investigate the
effects of the external magnetic field on the rate of conversion of benzaldehyde to
propargylamine in the A3-coupling reaction. In paper 3, the Fe3O4@Au nanoparticles
were used as the catalyst in the A3-coupling reaction to achieve high catalyst recovery and
ease of separation with an external magnet to promoting recycling. Finally, CdTe QD-
polymer nanocomposites were synthesised and characterised in paper 4. In the next
chapter (3), these papers will be introduced independently.
2.1 Development of GNR-Fe3O4 hybrids for H2O2
sensing
The first paper introduced in this thesis focuses on using two types of GNR-Fe3O4 hybrids
with different aspect ratios for H2O2 sensing.
There is significant research interest in the development of nonenzymatic H2O2 sensors
that can replace enzymatic H2O2 sensors with the purpose of enhancing the detection
limit, stability, reproducibility, selectivity and sensitivity.4, 24 Therefore, different
materials, such as those described in the literature review, have been used to fabricate
nonenzymatic H2O2 sensors. These include nanomaterials such as Au-based ones. Though
nanomaterial-based H2O2 sensors exhibit good performance, the various issues related to
electrochemical nonenzymatic H2O2 sensors have not been resolved completely.
In this paper, we proposed electrochemical H2O2 sensing based on two types of GNR-
Fe3O4 hybrids with different aspect ratios attached to the surface of GC electrode. First,
the two GNRs were synthesised using a previously reported multistep process.450, 451 Next,
the two GNRs, which were coated with CTAB, were decorated with citric-acid-coated
Page | 58
Fe3O4 nanoparticles through electrostatic interactions. The two GNRs, the Fe3O4
nanoparticles and the GNR-Fe3O4 hybrids were characterised using zeta potential
measurements, TEM, energy-dispersive X-ray spectroscopy (EDS) and ultraviolet-visible
(UV–Vis) spectroscopy.
The two GNR-Fe3O4 hybrids were then attached to the surface of a GC electrode and used
as electrochemical sensors for the reduction of H2O2. The results of this paper addressed
Objective 1 whereby these two GNR-Fe3O4 hybrids exhibited high activity and sensitivity
for the detection of H2O2 at low concentrations, as determined using different methods,
including CV and amperometric measurement.
The electrocatalytic activities of the modified electrodes were measured using CV for
different H2O2 concentrations (0–5 mM) and different scan rates (50–500 mV s−1) in N2-
saturated phosphate buffer (0.1 M, pH 7.4). The activities of the short and long GNR-
Fe3O4 hybrids towards H2O2 reduction were also determined using amperometric
measurements at H2O2 concentrations of 0.5–7.45 mM. In addition, the electrocatalytic
activities of the GC electrodes modified with the short and long GNR-Fe3O4 hybrids were
compared to that of a bare GC electrode as well as that of an electrode modified only with
Fe3O4 nanoparticles for 2 mM H2O2. A redox reaction was not detected in the case of the
bare electrode, while the Fe3O4-modified electrode showed a smaller electrochemical
response towards the reduction of H2O2 than the electrodes modified with the short and
long GNR-Fe3O4 hybrids.
The results of the CV and amperometric measurements showed that the GC electrode
modified with the short GNR-Fe3O4 hybrid displayed superior catalytic performance
towards H2O2 reduction compared with the GC electrode modified with the long GNR-
Fe3O4 hybrid.
Accordingly, the amperometric responses of both GNR-Fe3O4 hybrids confirmed that
they exhibited high H2O2 sensing performance in N2-saturated phosphate buffer (0.1 M,
pH 7.4) for H2O2 concentrations of 0.5 μM–7.45 mM, with correlation coefficients of
0.995 and 0.979 for the short and long GNR-Fe3O4 hybrids, respectively. Furthermore,
the sensitivities and detection limits of the short and long GNR-Fe3O4-modified GC
electrodes were 20 nA mM−1, 3.2 μM and 18 nA mM−1, 13 μM, respectively. The short-
GNR-Fe3O4 hybrid-modified GC electrode showed high long-term stability, with its
performance not deteriorating even after storage for 1 month at room temperature. This
Page | 59
electrode also showed high reproducibility. Moreover, the electrode displayed a
negligible response to common interfering compounds, such as glucose, ethanol and citric
acid. However, the electrode showed a small response to ascorbic acid owing to the strong
reducing ability of ascorbic acid. This issue could be resolved with utilising the SIRE
method. The performance of this sensor was compared to those of other enzymatic and
nonenzymatic sensors reported recently and its performance was comparable to those of
the other sensors.
Next, we demonstrated that the sensing response of the GNR-Fe3O4 hybrid system is
determined by two factors, namely, the uniformity of the coating of the
Fe3O4 nanoparticles on the GNRs and the total surface areas of the GNRs. In this study,
the total surface area of the short GNR-Fe3O4 hybrid (~12000 nm2) was significantly
greater than that of the long GNR-Fe3O4 hybrid (~4000 nm2), owing to which the sensing
response of the former sensor was better. The short GNRs could be coated uniformly with
Fe3O4 nanoparticles, which resulted in a high electrocatalytic response towards H2O2.
This result suggested that the H2O2 sensing response of the GNR-Fe3O4 hybrids can be
optimised by changing their aspect ratio and by ensuring that the surfaces of the GNRs
are coated uniformly. Further, the short and long GNR-Fe3O4 hybrids exhibited
significantly better H2O2 sensing performances than the Fe3O4 nanoparticles alone. This
result confirmed that the synergistic effect of the GNR-Fe3O4 hybrids was responsible for
the enhanced H2O2 sensing performance. Thus, we confirmed the effectiveness of the
GNR-Fe3O4 hybrids in H2O2 sensing, with the hybrids exhibiting response times,
selectivities, sensitivities and reproducibilities comparable to those of previously reported
enzymatic and nonenzymatic sensors.
Results presented in.” A. M. Munshi, D. Ho, M. Saunders, V. Agarwal, C. L. Raston and
K. S. Iyer, Sens. Actuator B-Chem., 2016, 235, 492-497, DOI:
http://dx.doi.org/10.1016/j.snb.2016.05.090.
Page | 60
2.2 Magnetically Controlled A3-Coupling Reaction
The second paper presented in this thesis focused on the preparation of a suspension of
Fe3O4@Au nanocrystals for use as a catalyst for the A3-coupling reaction. This
nanocrystal suspension can be used to control the rate of conversion during the A3-
coupling reaction in the presence of an external magnetic field.
The A3-coupling reactions involving aldehydes, amines and alkynes that are used for
producing propargylamine derivatives are considered essential for synthesising different
drugs and natural products.280, 452, 453 Metal nanocatalysts show high catalytic efficiency
in catalysing the A3-coupling reactions, as they have a high surface area and can activate
the C–H bonds in the alkyne.343, 344 Different metal nanoparticles, such as Au,329 Ag,454
Cu455 and Fe456 nanoparticles, have been reported to be highly efficient catalysts for
producing various propargylamines. However, AuNPs show a higher catalytic activity
than the other metal nanoparticles.364, 457 Catalysts with magnetic properties, such as
magnetic nanoparticles, can also be used as catalysts or as supporting materials for
catalysts and are being explored for use as green catalysts.353, 458 However, there have
been no previous studies on the use of a hybrid of Au and Fe3O4 nanoparticles as a catalyst
for the A3-coupling reactions.
In the presence of a magnetic field, assemblies of anisotropic magnetic colloidal
nanoparticles form magnetic nanowires along the direction of the magnetic field.459, 460
Owing to the dominance of isotropic van der Waals forces, the assemblies of the colloidal
nanoparticles remain stable under quiescent conditions. Further, the nanoparticles exhibit
natural electrostatic repulsion because they are separated from each other and undergo
fewer interparticle interactions.461 In the presence of a magnetic field, the space between
the magnetic nanoparticles decreases and the nanoparticles do not exhibit random
movement.459, 460 Moreover, a number of chain-like structures are formed as a result of
the strong dipole–dipole interactions between the anisotropic magnetic particles. These
strong interactions can be exploited to control the arrangement of the chain-like structures
formed by the magnetic nanoparticles.459, 460 Conventionally, the size, shape and surface
area of colloidal nanoparticles are the primary parameters that determine their catalytic
activity. However, these parameters cannot be controlled readily during chemical
reactions.462-465 In this study, we examined the catalytic efficacy of Fe3O4@Au
nanocrystals in the A3-coupling reaction and showed that these magnetic nanocrystals
Page | 61
could be manipulated in situ by applying an external magnetic field. This result suggested
that the conversion rate of the model the A3-coupling reaction for benzaldehyde,
piperidine and phenylacetylene can be varied by applying an external magnetic field.
The Fe3O4@Au nanocrystals were synthesised using a multistep process.466 In brief,
synthesised Fe3O4 nanoparticles were coated with PEI. Then, Au seeds (2 nm) were
attached to their surfaces. This was followed by coating the nanoparticles with another
layer of PEI. Finally, four layers of Au were deposited on the nanoparticles, yielding
Fe3O4@Au nanoparticles (130 ± 2 nm). The Fe3O4@Au nanocrystals were aligned by
applying an external magnetic field. The formation of chain-like structures of the
nanoparticles was confirmed using different methods, such as TEM, EDS and X-ray
diffraction (XRD) analysis. The dimensions of the different nanowires formed were also
determined.Linear assemblies of the Fe3O4@Au nanocrystals were formed in toluene by
placing the nanoparticles in a magnetic field for one hour at room temperature and then
increasing the temperature to 100 °C. The conversion of benzaldehyde into
propargylamine through the A3-coupling reaction with the nanoparticles as the catalyst (4
mol%) was studied in the presence and absence of an external magnetic field for different
durations over a period of 48 h using 1H NMR spectroscopy.
The results of this paper addressed objective 2, which was to explore the effect of the
field-directed self-assembly of Fe3O4@Au nanoparticles by applying an external magnet
during the A3-coupling reaction.
The rate of conversion of aldehyde into propargylamine via the A3-coupling reaction in
the presence of an external magnetic field was lower than that in the absence of a magnetic
field. This was because the nanoparticles formed chain-like structures in the presence of
the magnetic field, resulting in a decrease in the catalytic surface area available for C–H
alkyne-activation. Therefore, we exploited the ability of suspensions of the Fe3O4@Au
nanocrystals to form linear chains in the presence of an external magnetic field to control
the rate of the reaction, in addition to using the magnetic nanoparticles as a catalyst
support material. The results obtained showed that it is possible to regulate the conversion
rate of the A3-coupling reaction in situ remotely by manipulating the colloidal assembly
of the Fe3O4@Au nanocrystals in the presence of a magnetic field. Therefore, in
subsequent experiments, the amount of catalyst used for the A3-coupling reaction was
increased and the fabrication process was improved to ensure that the Fe3O4 nanoparticles
were coated uniformly with Au nanoparticles. This allowed the A3-coupling reaction to
Page | 62
be used to produce different propargylamine derivatives. Thus, by developing the
Fe3O4@Au nanocatalysts for the A3-coupling reaction, objective 3 was achieved
successfully.
Results presented in “A. M. Munshi, V. Agarwal, D. Ho, C. L. Raston, M. Saunders, N.
M. Smith and K. S. Iyer, Cryst. Growth Des., 2016, 16, 4773-4776. DOI:
10.1021/acs.cgd.6b00582.
2.3 Fe3O4@Au nanocatalyst for the A3-coupling
reaction
The third paper presented in this thesis reported the development of magnetically
recoverable Fe3O4@Au nanoparticles as nanocatalysts. These nanocrystals exhibited high
catalytic efficiency for the A3-coupling reaction. Furthermore, the Fe3O4@Au
nanocatalysts could be separated readily from the reaction mixture simply by using an
external magnet and recycled five times without a significant decrease in the catalytic
activity (objective 3).
As stated in the literature review, Au NPs show high catalytic activity for the A3-coupling
reaction. However, as Au is a valuable and limited resource, increasing the catalytic
activity of Au NPs and thus decreasing the amounts that need to be used is critical for
increasing their practical applicability.467 The conventional catalyst supports used to
synthesise Au NP catalysts, such as silica, titania and mesoporous carbon nitride, show
high catalytic activities.364, 468 However, it is difficult to use separation techniques such as
centrifugation and filtration with small particles, which hinders the complete recovery and
recyclability of nanocatalysts.458 Among the various conventional catalyst supports
available, magnetic nanomaterials are a superior and practical choice, as they allow the
catalyst to be readily separated from the reaction mixture simply by using an external
magnet, which eliminates waste and reduces expenses.469
Hence, the development of green and economic Au nanocatalysts for the A3-coupling
reaction is desirable. This study described the synthesis of Fe3O4@Au nanoparticles that
have a large specific surface area and can be separated magnetically for catalysis of the
Page | 63
A3-coupling reaction of aldehydes, amines and alkynes. We used the Fe3O4@Au
nanoparticles in the A3-coupling reactions of formaldehyde and different aromatic
aldehydes to produce the corresponding propargylamines. Moreover, the recyclability of
the nanocatalysts was investigated. Further, a possible mechanism for the A3-coupling
reaction involving the Fe3O4@Au nanoparticles was proposed. The experimentally
observed conversions of the various aldehydes were also fully studied with computational
analysis based on the electrostatic potential (ESP) properties and Lowest Unoccupied
Molecular Orbital (LUMO) density.
The Fe3O4@Au nanoparticles were synthesised using the multistep process introduced
previously. The morphology of the Fe3O4@Au nanoparticles was characterised using
TEM and EDS techniques. The results described in this paper addressed objective 3,
which was to develop magnetically recoverable Fe3O4@Au nanoparticles with a high
surface area for use as catalysts for the A3-coupling reaction.
The synthesised Fe3O4@Au nanoparticles (10 mol%) acted as highly efficient catalysts
for the A3-coupling reaction of aldehydes, alkynes and amines in toluene at 100 °C. The
best benzaldehyde conversion was obtained when using toluene as the solvent in the A3-
coupling reaction of benzaldehyde, piperidine and phenylacetylene with Fe3O4@Au
nanoparticles (10 mol%), compared with different solvents such as water, methanol,
chloroform and acetonitrile.
Under optimised conditions, the scope of the A3-coupling reaction was studied for both
aromatic and aliphatic aldehydes (1mmol), with piperidine (1mmol) and phenylacetylene
(1mmol) with Fe3O4@Au nanoparticles (10 mol%) in toluene used to generate a variety
of propargylamines with high to moderate conversions. The experimental conversions
observed that the aldehyde with strong electron withdrawing nitro group (m-
nitrobenzaldehyde) had the lowest conversion among the aldehydes (7%). Additionally,
the aldehydes with bulky substituents groups had significantly influenced the aldehyde
conversions. For example, 4-methoxybenzaldehyde had low conversion (25%) with the
bulky methoxy group (–OCH3) in comparison to 4-methylbenzaldehyde (63%) with a
smaller group (–CH3) substituent at the para position. 4-chlorobenzaldehyde had lower
conversion (29%) in comparison to 4-flourobenzaldehyde (67%) which owing to the
greater radius of Cl atom and its lower electronegativity. Furthermore,
pyridinecarboxaldehydes with different substitutions at the ortho, para and meta positions
showed different conversions 63%, 53% and 20%, respectively. This difference is
Page | 64
attributed to the role of nitrogen as an ortho/para-directing group on the pyridine ring, as
the electron density is higher in the meta position than in the ortho and para positions
because of resonance effects in the pyridinecarboxaldehyde rings.
The proposed mechanism of the one-pot A3-coupling reaction is as follows: the Au-
phenylacetylene intermediate is generated on the surface of a Fe3O4@Au nanoparticles
because of the activation of the C–H bond in phenylacetylene. At the same time, the
reaction of the aldehyde and piperidine produces an iminium ion in situ. The iminium ion
reacts with the Au-phenylacetylene intermediate, resulting in the corresponding
propargylamine product. Based on the proposed mechanism, we hypothesised that the
reaction step during which the iminium ion is generated in situ from the aldehyde and
piperidine through nucleophilic addition has an effect on the conversion rate. Therefore,
we used different aldehydes with the same amine (piperidine) and alkyne
(phenylacetylene). Nucleophilic addition owing to piperidine (the nucleophile) occurs at
the carbonyl carbon of the aldehyde (the electrophile). Therefore, it is important to study
the localisation of the LUMO in the electrophile.470, 471 In addition, ESP data helps to
determine the way of the aldehyde molecule can be interacted with piperidine because
ESP elucidates the charge distributions of the aldehyde molecules.472, 473 Therefore, DFT
calculations using CrystalExplorer software474 were performed at the B3LYP/6-311++G
(d, p) level to calculate the ESP property and LUMO density on the molecular iso-
electron-density surfaces of the carbonyl carbon for different aldehydes.
ESP values have changed with various substituents groups in the aldehyde. According to
the computational analysis, the attached group with more electron-donating had lower
ESP at the carbonyl carbon while the more electron-withdrawing group had higher ESP
at the carbonyl carbon. For example, the aldehyde with the most electron withdrawing
substituent group (m-nitrobenzaldehyde) had the highest ESP value (+0.122 au), while
the most electron donating group (4-methoxybenzaldehyde) had the lowest ESP value
(+0.094 au).Moreover, the interactive element among different aldehydes was that most
of them having the highest LUMO density at carbonyl carbon. This rank value of LUMO
density demonstrates that carbonyl carbon in the aldehyde is the ideal site for nucleophilic
(piperidine) attack. However, the carbonyl carbons in m-nitrobenzaldehyde and 1-
naphthaldehyde have the seventh and second highest LUMO density respectively. In
addition, we observed no correlation between conversion and both LUMO density and
ESP.
Page | 65
Accordingly, we could not explain the experimentally observed conversions of the
aldehydes in terms of the LUMO density as well as the ESP. We hypothesised modelling
the Fe3O4@Au catalysts by considering the size and shape of the catalyst. This is a crucial
in future studies to create a reasonable relation between experimental conversions, ESP
and LUMO densities as the A3-coupling reaction cannot be started without the activation
of the C–H bond in phenylacetylene with the catalyst. However, it cannot be easily
included the catalyst in this computational analysis because of the limitation of DFT
calculation. The synthesised Fe3O4@Au nanoparticles as catalysts were environmentally
friendly, as they could be simply recovered from the reaction mixture by applying an
external magnet and can be reused up to five times without a significant decrease in their
catalytic activity. The slight reduction in the conversion after the fifth round is due to the
catalyst leaching. This issue will be addressed in a future study.
The results presented in “A. M. Munshi, M. Shi, S. P. Thomas, M. Saunders, M. A.
Spackman, K. S. Iyer and N. M. Smith, Magnetically recoverable Fe3O4@Au-coated
nanoscale catalysts for the A3 coupling reaction, Dalton Trans. 2017, 46 (16), 5133-5137.
2.4 Synthesis of multifunctional CdTe QD-polymer
nanocomposites
In the fourth paper, we developed an alternative strategy for synthesising CdTe QD-
polymer nanocomposites, which could be used as luminescent multifunctional
nanohybrid materials (objective 4).
Luminescent CdTe QDs in an aqueous system were synthesised using the polymer as the
capping and stabilising agent as its stability and biocompatibility are higher than those of
inorganic shells and small organic ligands.442, 447 We used poly(HEMA-ran-GMA)
polymer bearing thiolated fourth-generation PAMAM dendrons (poly(HEMA-ran-GMA)
G4-SH as a stabiliser to synthesise the QDs. This polymer has been used in previous
studies and exhibits a number of distinctive properties.475 For instance, it can be utilised
as a highly efficient transfection agent and it is nontoxic and highly biocompatible.475 We
produced luminescent CdTe QD-polymer nanocomposites of two different sizes.
Furthermore, the CdTe QD-polymer nanocomposites, which exhibited green and yellow
Page | 66
fluorescence, showed both the luminescence properties of the QDs and the
biocompatibility of the dendritic polymer. This fact makes these nanocomposites highly
suited for use in biological applications.476 We employed a simple protocol to synthesise
the CdTe QD-polymer nanocomposites. First, the poly(HEMA-ran-GMA) 4G dendrimer
was synthesised through a multistep process. Next, the periphery of the polymer was
partially thiolated utilising 3-mercaptopropanyl N-hydroxysuccinimide ester.477 Next, the
CdTe QD-polymer nanocomposites were synthesised using Cd(NO3)2 and NaHTe as the
precursors and the thiolated poly(HEMA-ran-GMA) 4G dendrimer as the capping and
stabilising agent, as well as the sulfur source. By increasing the reaction time, the colour
of the fluorescence and the size of the CdTe QDs were varied and we obtained green and
yellow QDs.
The morphology of the CdTe QD-polymer nanocomposites was characterised using TEM
and EDS, while the luminescence properties were examined using UV–Vis spectroscopy
and photoluminescence measurements. Both spectra showed a red shift as the colour of
the QDs changed from green to yellow.
In addition, empirical calculations were performed using the Peng formula based on the
absorption spectra.478 The calculations indicated that the green and yellow CdTe QDs
were 2.3 and 2.7 nm in diameter, respectively.
Furthermore, QY values of the green and yellow CdTe QD-polymer nanocomposites were
determined and found to be 2.3 and 7.6, respectively. This decrease of the QY was
probably a result of the following two reasons: (i) the high concentration of the polymer
had a significant effect on the QY, leading to a decrease in the fluorescence efficiency
and (ii) the passivation of the surfaces of the QDs with the polymer was incomplete,
resulting in trapped electrons or holes, which retarded electron-hole recombination.
Moreover, long decay times were detected for both the green and yellow CdTe QD-
polymer nanocomposites.
To summarise, we demonstrated a green and effective approach for synthesising green
and yellow CdTe QD-polymer nanocomposites that exhibited both fluorescence and
biocompatibility.
The results presented in “A. M. Munshi, J. A. Kretzmann, C.W. Evans, A.M. Ranieri, M.
Saunders, M. Massi, M. Norret and K. S. Iyer, Dendronised polymers as templates for in-
situ one-pot quantum dot synthesis, J. Mater. Chem. C. (Submitted)
Page | 67
CHAPTER 3
SERIES OF PAPERS The results of this thesis are introduced in this chapter as published articles or submitted
manuscripts, which are presented below. The supporting information of these articles are
introduced in Appendix A.
1. Munshi, A. M.; Ho, D.; Saunders, M.; Agarwal, V.; Raston, C. L.; Iyer, K. S.,
Influence of aspect ratio of magnetite coated gold nanorods in hydrogen peroxide
sensing. Sens. Actuator B-Chem. 2016, 235, 492-497. (Published)
2. Munshi, A. M.; Agarwal, V.; Ho, D.; Raston, C. L.; Saunders, M.; Smith, N. M.;
Iyer, K. S., Magnetically Directed Assembly of Nanocrystals for Catalytic Control
of a Three-Component Coupling Reaction. Cryst. Growth Des. 2016, 16, 4773-
4776. (Published)
3. Munshi, A. M.; Shi, S.; Thomas, S. P.; Saunders, M.; Spackman, M. A.; Iyer, K.
S.; Smith, N. M., Magnetically recoverable Fe3O4@Au-coated nanoscale catalysts
for the A3 coupling reaction. Dalton Trans. 2017, 46, 5133-5137. (Published)
4. Munshi, A. M.; Kretzmann, J. A.; Evans, C. W.; Ranieri, A. M.; Schildkraut, Z.;
Massi, M.; Norret, M; Saunders, M.; Iyer, K. S., Dendronised polymers as
templates for in-situ one-pot quantum dot synthesis. J. Mater. Chem. C.
(Submitted)
Sensors and Actuators B 235 (2016) 492–497
Contents lists available at ScienceDirect
Sensors and Actuators B: Chemical
journa l homepage: www.e lsev ier .com/ locate /snb
Influence of aspect ratio of magnetite coated gold nanorods inhydrogen peroxide sensing
Alaa M. Munshi a, Diwei Ho a, Martin Saunders b, Vipul Agarwal a, Colin L. Raston c,∗∗,K. Swaminathan Iyer a,∗
a School of Chemistry and Biochemistry, The University of Western Australia, Crawley, Western Australia, Australiab Centre for Microscopy, Characterization & Analysis, The University of Western Australia, M010, Perth WA 6009 Australiac Centre for Nanoscale Science and Technology, School of Chemical and Physical Sciences, Flinders University, Bedford Park, South Australia, Australia
a r t i c l e i n f o
Article history:Received 21 February 2016Received in revised form 11 May 2016Accepted 17 May 2016Available online 18 May 2016
Keywords:Hydrogen peroxide (H2O2) sensingMagnetite (Fe3O4)Gold nanorods (GNRs)Glassy carbon electrodeCyclic voltammetry (CV)
a b s t r a c t
Hydrogen peroxide (H2O2) sensing has many biomedical, healthcare and industrial applications. How-ever, H2O2 sensors are limited in sensitivity and selectivity. Here, we investigate the application ofmagnetite (Fe3O4) coated gold nanorods (GNRs) of two aspect ratios as active glassy carbon electrodemodifiers for the fabrication of H2O2 electrochemical sensors. We show that the GNR-Fe3O4 nanohybridsof a smaller aspect ratio (1.6) outperform the longer GNRs (aspect ratio 7.5) in the electrochemical detec-tion of H2O2, as measured using cyclic voltammetry (CV) and amperometric techniques. The synthesizedGNR-Fe3O4 in this study also demonstrated high sensitivity and selectivity, with performance surpassingpreviously reported H2O2 sensors.
© 2016 Elsevier B.V. All rights reserved.
1. Introduction
Hydrogen peroxide (H2O2) is a naturally occurring molecule andhas diverse applications in many industries, such as pharmaceuti-cals, textile, mining and food manufacturing. It plays an importantrole in many biological processes including apoptosis, immune cellactivation, intracellular cell signaling, and is one of the major riskfactors in the progression of diseases such as atherosclerosis, renaldisease and cancer [1–4]. H2O2 is a common by-product of var-ious enzyme catalyzed biochemical reactions and also acts as asubstrate for horseradish peroxidase which is used in biosensingapplications [5]. Additionally, H2O2 is a common oxidizing agentused in organic synthesis, as a disinfectant for water pools, and inpackaging food and beverages [6]. The broad range of applicationsthat H2O2 can be applied to has led to the continual develop-ment of such sensors. Several physical and analytical techniqueshave been developed including chromatography, spectrophotom-etry, titrimetric and fluorescence based approaches to detect and
∗ Corresponding author at: M310, 35 Stirling Highway, Crawley, WA 6009,Australia.∗∗ Corresponding author at: GPO Box 2100, Adelaide, South Australia 5001,
Australia.E-mail addresses: [email protected] (C.L. Raston),
[email protected] (K.S. Iyer).
quantify the amount of H2O2 albeit with limited success [7–10]. Themajor limitations include low sensitivity and selectivity as a con-sequence of chemical interference and high cost due to the use ofexpensive sophisticated instrumentation. In contrast, electrochem-ical H2O2 sensors are cheap, easy to use, with rapid high sensitivityand selectivity [5,11]. Such sensors can be based either on oxida-tion or reduction at the electrode but their sensitivity is limitedby slow electrode kinetics and high overpotential thereby reduc-ing sensitivity as a result of molecular interference from speciessuch as ascorbate, glucose and urate [12]. Various approaches havebeen adopted to address these issues, mostly involving electrodemodifications including the use of redox dyes, proteins, polymers,enzymes, transition metals, metal oxides and carbon nanotubes[13–19].
The use of nanomaterials with desirable chemical, physical andelectronic properties is a more efficient strategy over the use ofbulk materials for a myriad of applications. Indeed the use of nano-materials offers scope for sensing applications in being able toreadily modify their size and structure, and thus fine tune the sen-sor response to analytes [20]. Among the various nanomaterialsexplored, superparamagnetic iron oxide (Fe3O4) nanoparticles pos-sess intrinsic enzyme mimetic properties which can be exploitedfor H2O2 sensing applications [21]. Moreover, Fe3O4 nanoparticlesintroduce additional advantages including higher stability of theparticles, their inertness to reaction conditions and low produc-
http://dx.doi.org/10.1016/j.snb.2016.05.0900925-4005/© 2016 Elsevier B.V. All rights reserved.
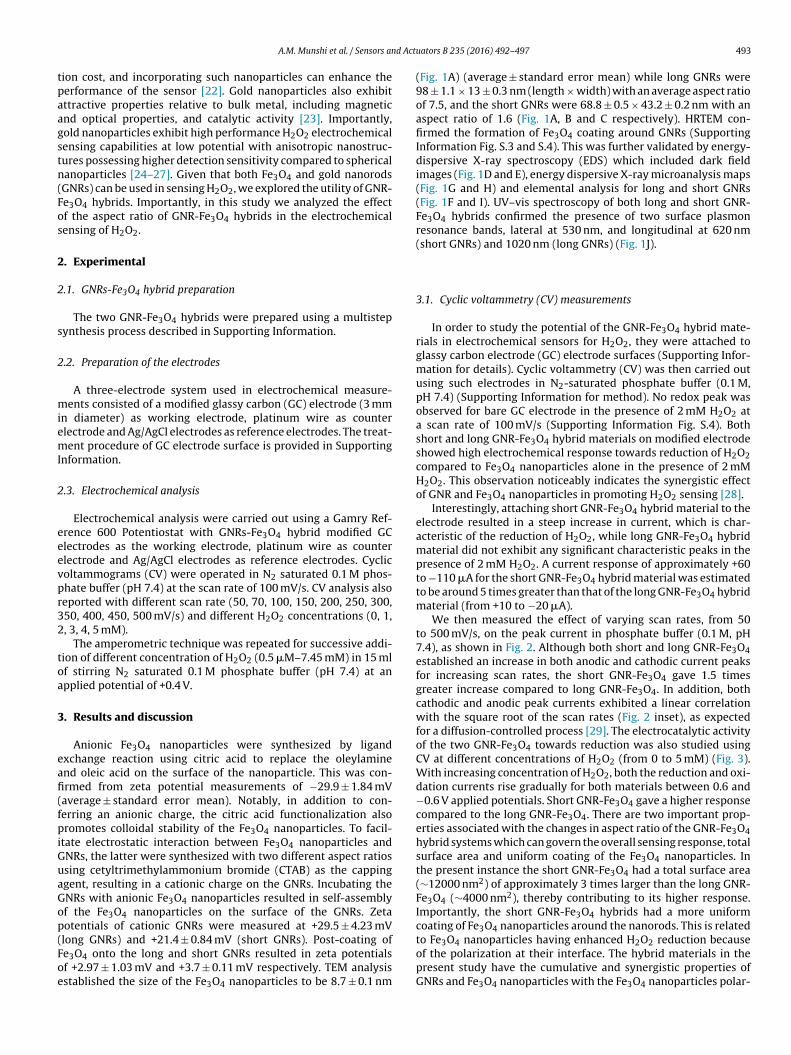
A.M. Munshi et al. / Sensors and Actuators B 235 (2016) 492–497 493
tion cost, and incorporating such nanoparticles can enhance theperformance of the sensor [22]. Gold nanoparticles also exhibitattractive properties relative to bulk metal, including magneticand optical properties, and catalytic activity [23]. Importantly,gold nanoparticles exhibit high performance H2O2 electrochemicalsensing capabilities at low potential with anisotropic nanostruc-tures possessing higher detection sensitivity compared to sphericalnanoparticles [24–27]. Given that both Fe3O4 and gold nanorods(GNRs) can be used in sensing H2O2, we explored the utility of GNR-Fe3O4 hybrids. Importantly, in this study we analyzed the effectof the aspect ratio of GNR-Fe3O4 hybrids in the electrochemicalsensing of H2O2.
2. Experimental
2.1. GNRs-Fe3O4 hybrid preparation
The two GNR-Fe3O4 hybrids were prepared using a multistepsynthesis process described in Supporting Information.
2.2. Preparation of the electrodes
A three-electrode system used in electrochemical measure-ments consisted of a modified glassy carbon (GC) electrode (3 mmin diameter) as working electrode, platinum wire as counterelectrode and Ag/AgCl electrodes as reference electrodes. The treat-ment procedure of GC electrode surface is provided in SupportingInformation.
2.3. Electrochemical analysis
Electrochemical analysis were carried out using a Gamry Ref-erence 600 Potentiostat with GNRs-Fe3O4 hybrid modified GCelectrodes as the working electrode, platinum wire as counterelectrode and Ag/AgCl electrodes as reference electrodes. Cyclicvoltammograms (CV) were operated in N2 saturated 0.1 M phos-phate buffer (pH 7.4) at the scan rate of 100 mV/s. CV analysis alsoreported with different scan rate (50, 70, 100, 150, 200, 250, 300,350, 400, 450, 500 mV/s) and different H2O2 concentrations (0, 1,2, 3, 4, 5 mM).
The amperometric technique was repeated for successive addi-tion of different concentration of H2O2 (0.5 !M–7.45 mM) in 15 mlof stirring N2 saturated 0.1 M phosphate buffer (pH 7.4) at anapplied potential of +0.4 V.
3. Results and discussion
Anionic Fe3O4 nanoparticles were synthesized by ligandexchange reaction using citric acid to replace the oleylamineand oleic acid on the surface of the nanoparticle. This was con-firmed from zeta potential measurements of −29.9 ± 1.84 mV(average ± standard error mean). Notably, in addition to con-ferring an anionic charge, the citric acid functionalization alsopromotes colloidal stability of the Fe3O4 nanoparticles. To facil-itate electrostatic interaction between Fe3O4 nanoparticles andGNRs, the latter were synthesized with two different aspect ratiosusing cetyltrimethylammonium bromide (CTAB) as the cappingagent, resulting in a cationic charge on the GNRs. Incubating theGNRs with anionic Fe3O4 nanoparticles resulted in self-assemblyof the Fe3O4 nanoparticles on the surface of the GNRs. Zetapotentials of cationic GNRs were measured at +29.5 ± 4.23 mV(long GNRs) and +21.4 ± 0.84 mV (short GNRs). Post-coating ofFe3O4 onto the long and short GNRs resulted in zeta potentialsof +2.97 ± 1.03 mV and +3.7 ± 0.11 mV respectively. TEM analysisestablished the size of the Fe3O4 nanoparticles to be 8.7 ± 0.1 nm
(Fig. 1A) (average ± standard error mean) while long GNRs were98 ± 1.1 × 13 ± 0.3 nm (length × width) with an average aspect ratioof 7.5, and the short GNRs were 68.8 ± 0.5 × 43.2 ± 0.2 nm with anaspect ratio of 1.6 (Fig. 1A, B and C respectively). HRTEM con-firmed the formation of Fe3O4 coating around GNRs (SupportingInformation Fig. S.3 and S.4). This was further validated by energy-dispersive X-ray spectroscopy (EDS) which included dark fieldimages (Fig. 1D and E), energy dispersive X-ray microanalysis maps(Fig. 1G and H) and elemental analysis for long and short GNRs(Fig. 1F and I). UV–vis spectroscopy of both long and short GNR-Fe3O4 hybrids confirmed the presence of two surface plasmonresonance bands, lateral at 530 nm, and longitudinal at 620 nm(short GNRs) and 1020 nm (long GNRs) (Fig. 1J).
3.1. Cyclic voltammetry (CV) measurements
In order to study the potential of the GNR-Fe3O4 hybrid mate-rials in electrochemical sensors for H2O2, they were attached toglassy carbon electrode (GC) electrode surfaces (Supporting Infor-mation for details). Cyclic voltammetry (CV) was then carried outusing such electrodes in N2-saturated phosphate buffer (0.1 M,pH 7.4) (Supporting Information for method). No redox peak wasobserved for bare GC electrode in the presence of 2 mM H2O2 ata scan rate of 100 mV/s (Supporting Information Fig. S.4). Bothshort and long GNR-Fe3O4 hybrid materials on modified electrodeshowed high electrochemical response towards reduction of H2O2compared to Fe3O4 nanoparticles alone in the presence of 2 mMH2O2. This observation noticeably indicates the synergistic effectof GNR and Fe3O4 nanoparticles in promoting H2O2 sensing [28].
Interestingly, attaching short GNR-Fe3O4 hybrid material to theelectrode resulted in a steep increase in current, which is char-acteristic of the reduction of H2O2, while long GNR-Fe3O4 hybridmaterial did not exhibit any significant characteristic peaks in thepresence of 2 mM H2O2. A current response of approximately +60to −110 !A for the short GNR-Fe3O4 hybrid material was estimatedto be around 5 times greater than that of the long GNR-Fe3O4 hybridmaterial (from +10 to −20 !A).
We then measured the effect of varying scan rates, from 50to 500 mV/s, on the peak current in phosphate buffer (0.1 M, pH7.4), as shown in Fig. 2. Although both short and long GNR-Fe3O4established an increase in both anodic and cathodic current peaksfor increasing scan rates, the short GNR-Fe3O4 gave 1.5 timesgreater increase compared to long GNR-Fe3O4. In addition, bothcathodic and anodic peak currents exhibited a linear correlationwith the square root of the scan rates (Fig. 2 inset), as expectedfor a diffusion-controlled process [29]. The electrocatalytic activityof the two GNR-Fe3O4 towards reduction was also studied usingCV at different concentrations of H2O2 (from 0 to 5 mM) (Fig. 3).With increasing concentration of H2O2, both the reduction and oxi-dation currents rise gradually for both materials between 0.6 and−0.6 V applied potentials. Short GNR-Fe3O4 gave a higher responsecompared to the long GNR-Fe3O4. There are two important prop-erties associated with the changes in aspect ratio of the GNR-Fe3O4hybrid systems which can govern the overall sensing response, totalsurface area and uniform coating of the Fe3O4 nanoparticles. Inthe present instance the short GNR-Fe3O4 had a total surface area(∼12000 nm2) of approximately 3 times larger than the long GNR-Fe3O4 (∼4000 nm2), thereby contributing to its higher response.Importantly, the short GNR-Fe3O4 hybrids had a more uniformcoating of Fe3O4 nanoparticles around the nanorods. This is relatedto Fe3O4 nanoparticles having enhanced H2O2 reduction becauseof the polarization at their interface. The hybrid materials in thepresent study have the cumulative and synergistic properties ofGNRs and Fe3O4 nanoparticles with the Fe3O4 nanoparticles polar-
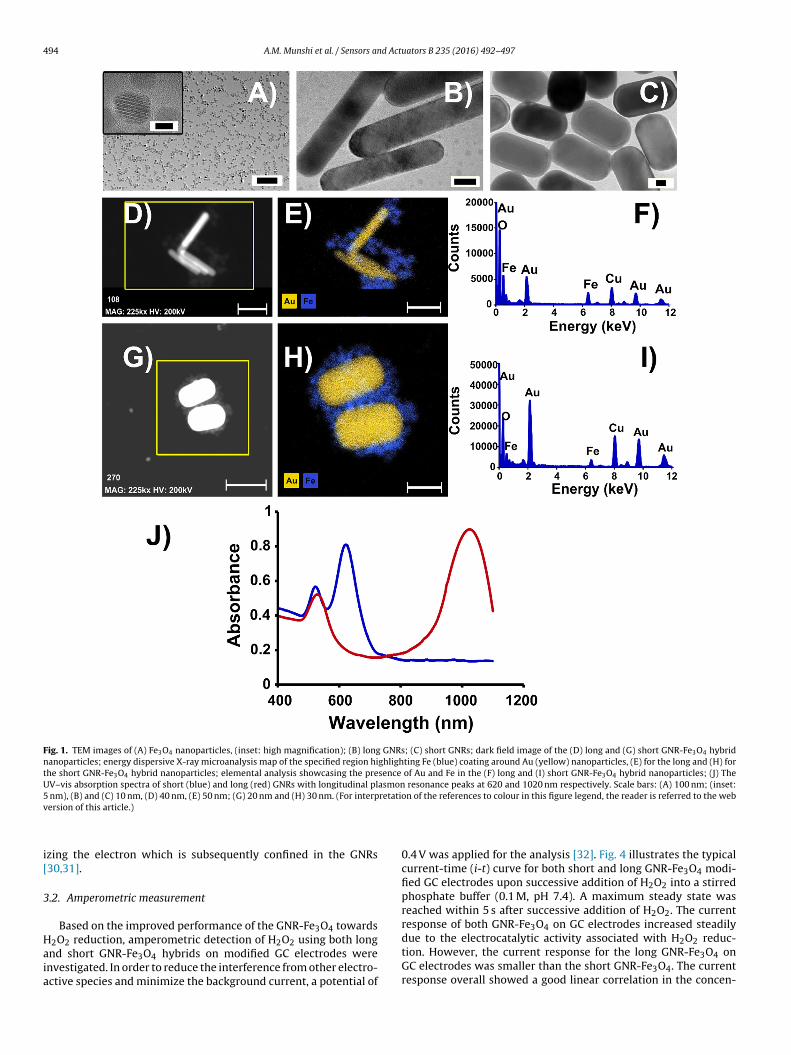
494 A.M. Munshi et al. / Sensors and Actuators B 235 (2016) 492–497
Fig. 1. TEM images of (A) Fe3O4 nanoparticles, (inset: high magnification); (B) long GNRs; (C) short GNRs; dark field image of the (D) long and (G) short GNR-Fe3O4 hybridnanoparticles; energy dispersive X-ray microanalysis map of the specified region highlighting Fe (blue) coating around Au (yellow) nanoparticles, (E) for the long and (H) forthe short GNR-Fe3O4 hybrid nanoparticles; elemental analysis showcasing the presence of Au and Fe in the (F) long and (I) short GNR-Fe3O4 hybrid nanoparticles; (J) TheUV–vis absorption spectra of short (blue) and long (red) GNRs with longitudinal plasmon resonance peaks at 620 and 1020 nm respectively. Scale bars: (A) 100 nm; (inset:5 nm), (B) and (C) 10 nm, (D) 40 nm, (E) 50 nm; (G) 20 nm and (H) 30 nm. (For interpretation of the references to colour in this figure legend, the reader is referred to the webversion of this article.)
izing the electron which is subsequently confined in the GNRs[30,31].
3.2. Amperometric measurement
Based on the improved performance of the GNR-Fe3O4 towardsH2O2 reduction, amperometric detection of H2O2 using both longand short GNR-Fe3O4 hybrids on modified GC electrodes wereinvestigated. In order to reduce the interference from other electro-active species and minimize the background current, a potential of
0.4 V was applied for the analysis [32]. Fig. 4 illustrates the typicalcurrent-time (i-t) curve for both short and long GNR-Fe3O4 modi-fied GC electrodes upon successive addition of H2O2 into a stirredphosphate buffer (0.1 M, pH 7.4). A maximum steady state wasreached within 5 s after successive addition of H2O2. The currentresponse of both GNR-Fe3O4 on GC electrodes increased steadilydue to the electrocatalytic activity associated with H2O2 reduc-tion. However, the current response for the long GNR-Fe3O4 onGC electrodes was smaller than the short GNR-Fe3O4. The currentresponse overall showed a good linear correlation in the concen-
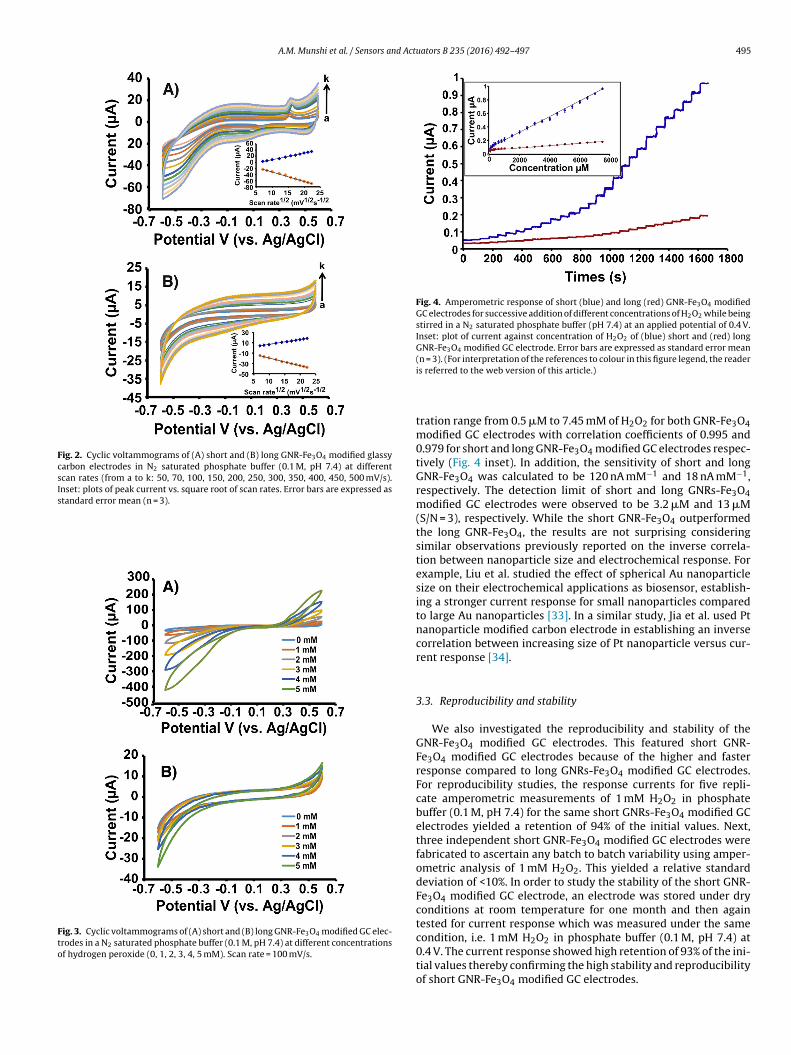
A.M. Munshi et al. / Sensors and Actuators B 235 (2016) 492–497 495
Fig. 2. Cyclic voltammograms of (A) short and (B) long GNR-Fe3O4 modified glassycarbon electrodes in N2 saturated phosphate buffer (0.1 M, pH 7.4) at differentscan rates (from a to k: 50, 70, 100, 150, 200, 250, 300, 350, 400, 450, 500 mV/s).Inset: plots of peak current vs. square root of scan rates. Error bars are expressed asstandard error mean (n = 3).
Fig. 3. Cyclic voltammograms of (A) short and (B) long GNR-Fe3O4 modified GC elec-trodes in a N2 saturated phosphate buffer (0.1 M, pH 7.4) at different concentrationsof hydrogen peroxide (0, 1, 2, 3, 4, 5 mM). Scan rate = 100 mV/s.
Fig. 4. Amperometric response of short (blue) and long (red) GNR-Fe3O4 modifiedGC electrodes for successive addition of different concentrations of H2O2 while beingstirred in a N2 saturated phosphate buffer (pH 7.4) at an applied potential of 0.4 V.Inset: plot of current against concentration of H2O2 of (blue) short and (red) longGNR-Fe3O4 modified GC electrode. Error bars are expressed as standard error mean(n = 3). (For interpretation of the references to colour in this figure legend, the readeris referred to the web version of this article.)
tration range from 0.5 !M to 7.45 mM of H2O2 for both GNR-Fe3O4modified GC electrodes with correlation coefficients of 0.995 and0.979 for short and long GNR-Fe3O4 modified GC electrodes respec-tively (Fig. 4 inset). In addition, the sensitivity of short and longGNR-Fe3O4 was calculated to be 120 nA mM−1 and 18 nA mM−1,respectively. The detection limit of short and long GNRs-Fe3O4modified GC electrodes were observed to be 3.2 !M and 13 !M(S/N = 3), respectively. While the short GNR-Fe3O4 outperformedthe long GNR-Fe3O4, the results are not surprising consideringsimilar observations previously reported on the inverse correla-tion between nanoparticle size and electrochemical response. Forexample, Liu et al. studied the effect of spherical Au nanoparticlesize on their electrochemical applications as biosensor, establish-ing a stronger current response for small nanoparticles comparedto large Au nanoparticles [33]. In a similar study, Jia et al. used Ptnanoparticle modified carbon electrode in establishing an inversecorrelation between increasing size of Pt nanoparticle versus cur-rent response [34].
3.3. Reproducibility and stability
We also investigated the reproducibility and stability of theGNR-Fe3O4 modified GC electrodes. This featured short GNR-Fe3O4 modified GC electrodes because of the higher and fasterresponse compared to long GNRs-Fe3O4 modified GC electrodes.For reproducibility studies, the response currents for five repli-cate amperometric measurements of 1 mM H2O2 in phosphatebuffer (0.1 M, pH 7.4) for the same short GNRs-Fe3O4 modified GCelectrodes yielded a retention of 94% of the initial values. Next,three independent short GNR-Fe3O4 modified GC electrodes werefabricated to ascertain any batch to batch variability using amper-ometric analysis of 1 mM H2O2. This yielded a relative standarddeviation of <10%. In order to study the stability of the short GNR-Fe3O4 modified GC electrode, an electrode was stored under dryconditions at room temperature for one month and then againtested for current response which was measured under the samecondition, i.e. 1 mM H2O2 in phosphate buffer (0.1 M, pH 7.4) at0.4 V. The current response showed high retention of 93% of the ini-tial values thereby confirming the high stability and reproducibilityof short GNR-Fe3O4 modified GC electrodes.
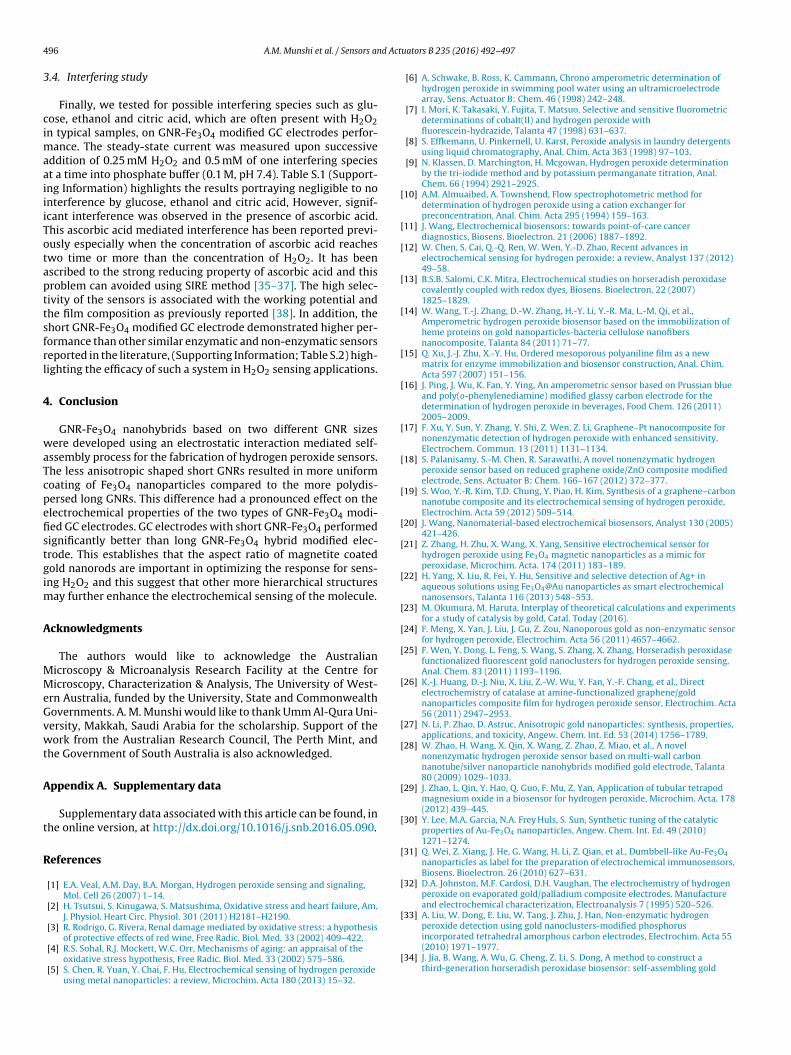
496 A.M. Munshi et al. / Sensors and Actuators B 235 (2016) 492–497
3.4. Interfering study
Finally, we tested for possible interfering species such as glu-cose, ethanol and citric acid, which are often present with H2O2in typical samples, on GNR-Fe3O4 modified GC electrodes perfor-mance. The steady-state current was measured upon successiveaddition of 0.25 mM H2O2 and 0.5 mM of one interfering speciesat a time into phosphate buffer (0.1 M, pH 7.4). Table S.1 (Support-ing Information) highlights the results portraying negligible to nointerference by glucose, ethanol and citric acid, However, signif-icant interference was observed in the presence of ascorbic acid.This ascorbic acid mediated interference has been reported previ-ously especially when the concentration of ascorbic acid reachestwo time or more than the concentration of H2O2. It has beenascribed to the strong reducing property of ascorbic acid and thisproblem can avoided using SIRE method [35–37]. The high selec-tivity of the sensors is associated with the working potential andthe film composition as previously reported [38]. In addition, theshort GNR-Fe3O4 modified GC electrode demonstrated higher per-formance than other similar enzymatic and non-enzymatic sensorsreported in the literature, (Supporting Information; Table S.2) high-lighting the efficacy of such a system in H2O2 sensing applications.
4. Conclusion
GNR-Fe3O4 nanohybrids based on two different GNR sizeswere developed using an electrostatic interaction mediated self-assembly process for the fabrication of hydrogen peroxide sensors.The less anisotropic shaped short GNRs resulted in more uniformcoating of Fe3O4 nanoparticles compared to the more polydis-persed long GNRs. This difference had a pronounced effect on theelectrochemical properties of the two types of GNR-Fe3O4 modi-fied GC electrodes. GC electrodes with short GNR-Fe3O4 performedsignificantly better than long GNR-Fe3O4 hybrid modified elec-trode. This establishes that the aspect ratio of magnetite coatedgold nanorods are important in optimizing the response for sens-ing H2O2 and this suggest that other more hierarchical structuresmay further enhance the electrochemical sensing of the molecule.
Acknowledgments
The authors would like to acknowledge the AustralianMicroscopy & Microanalysis Research Facility at the Centre forMicroscopy, Characterization & Analysis, The University of West-ern Australia, funded by the University, State and CommonwealthGovernments. A. M. Munshi would like to thank Umm Al-Qura Uni-versity, Makkah, Saudi Arabia for the scholarship. Support of thework from the Australian Research Council, The Perth Mint, andthe Government of South Australia is also acknowledged.
Appendix A. Supplementary data
Supplementary data associated with this article can be found, inthe online version, at http://dx.doi.org/10.1016/j.snb.2016.05.090.
References
[1] E.A. Veal, A.M. Day, B.A. Morgan, Hydrogen peroxide sensing and signaling,Mol. Cell 26 (2007) 1–14.
[2] H. Tsutsui, S. Kinugawa, S. Matsushima, Oxidative stress and heart failure, Am.J. Physiol. Heart Circ. Physiol. 301 (2011) H2181–H2190.
[3] R. Rodrigo, G. Rivera, Renal damage mediated by oxidative stress: a hypothesisof protective effects of red wine, Free Radic. Biol. Med. 33 (2002) 409–422.
[4] R.S. Sohal, R.J. Mockett, W.C. Orr, Mechanisms of aging: an appraisal of theoxidative stress hypothesis, Free Radic. Biol. Med. 33 (2002) 575–586.
[5] S. Chen, R. Yuan, Y. Chai, F. Hu, Electrochemical sensing of hydrogen peroxideusing metal nanoparticles: a review, Microchim. Acta 180 (2013) 15–32.
[6] A. Schwake, B. Ross, K. Cammann, Chrono amperometric determination ofhydrogen peroxide in swimming pool water using an ultramicroelectrodearray, Sens. Actuator B: Chem. 46 (1998) 242–248.
[7] I. Mori, K. Takasaki, Y. Fujita, T. Matsuo, Selective and sensitive fluorometricdeterminations of cobalt(II) and hydrogen peroxide withfluorescein-hydrazide, Talanta 47 (1998) 631–637.
[8] S. Effkemann, U. Pinkernell, U. Karst, Peroxide analysis in laundry detergentsusing liquid chromatography, Anal. Chim. Acta 363 (1998) 97–103.
[9] N. Klassen, D. Marchington, H. Mcgowan, Hydrogen peroxide determinationby the tri-iodide method and by potassium permanganate titration, Anal.Chem. 66 (1994) 2921–2925.
[10] A.M. Almuaibed, A. Townshend, Flow spectrophotometric method fordetermination of hydrogen peroxide using a cation exchanger forpreconcentration, Anal. Chim. Acta 295 (1994) 159–163.
[11] J. Wang, Electrochemical biosensors: towards point-of-care cancerdiagnostics, Biosens. Bioelectron. 21 (2006) 1887–1892.
[12] W. Chen, S. Cai, Q.-Q. Ren, W. Wen, Y.-D. Zhao, Recent advances inelectrochemical sensing for hydrogen peroxide: a review, Analyst 137 (2012)49–58.
[13] B.S.B. Salomi, C.K. Mitra, Electrochemical studies on horseradish peroxidasecovalently coupled with redox dyes, Biosens. Bioelectron. 22 (2007)1825–1829.
[14] W. Wang, T.-J. Zhang, D.-W. Zhang, H.-Y. Li, Y.-R. Ma, L.-M. Qi, et al.,Amperometric hydrogen peroxide biosensor based on the immobilization ofheme proteins on gold nanoparticles-bacteria cellulose nanofibersnanocomposite, Talanta 84 (2011) 71–77.
[15] Q. Xu, J.-J. Zhu, X.-Y. Hu, Ordered mesoporous polyaniline film as a newmatrix for enzyme immobilization and biosensor construction, Anal. Chim.Acta 597 (2007) 151–156.
[16] J. Ping, J. Wu, K. Fan, Y. Ying, An amperometric sensor based on Prussian blueand poly(o-phenylenediamine) modified glassy carbon electrode for thedetermination of hydrogen peroxide in beverages, Food Chem. 126 (2011)2005–2009.
[17] F. Xu, Y. Sun, Y. Zhang, Y. Shi, Z. Wen, Z. Li, Graphene–Pt nanocomposite fornonenzymatic detection of hydrogen peroxide with enhanced sensitivity,Electrochem. Commun. 13 (2011) 1131–1134.
[18] S. Palanisamy, S.-M. Chen, R. Sarawathi, A novel nonenzymatic hydrogenperoxide sensor based on reduced graphene oxide/ZnO composite modifiedelectrode, Sens. Actuator B: Chem. 166–167 (2012) 372–377.
[19] S. Woo, Y.-R. Kim, T.D. Chung, Y. Piao, H. Kim, Synthesis of a graphene–carbonnanotube composite and its electrochemical sensing of hydrogen peroxide,Electrochim. Acta 59 (2012) 509–514.
[20] J. Wang, Nanomaterial-based electrochemical biosensors, Analyst 130 (2005)421–426.
[21] Z. Zhang, H. Zhu, X. Wang, X. Yang, Sensitive electrochemical sensor forhydrogen peroxide using Fe3O4 magnetic nanoparticles as a mimic forperoxidase, Microchim. Acta. 174 (2011) 183–189.
[22] H. Yang, X. Liu, R. Fei, Y. Hu, Sensitive and selective detection of Ag+ inaqueous solutions using Fe3O4@Au nanoparticles as smart electrochemicalnanosensors, Talanta 116 (2013) 548–553.
[23] M. Okumura, M. Haruta, Interplay of theoretical calculations and experimentsfor a study of catalysis by gold, Catal. Today (2016).
[24] F. Meng, X. Yan, J. Liu, J. Gu, Z. Zou, Nanoporous gold as non-enzymatic sensorfor hydrogen peroxide, Electrochim. Acta 56 (2011) 4657–4662.
[25] F. Wen, Y. Dong, L. Feng, S. Wang, S. Zhang, X. Zhang, Horseradish peroxidasefunctionalized fluorescent gold nanoclusters for hydrogen peroxide sensing,Anal. Chem. 83 (2011) 1193–1196.
[26] K.-J. Huang, D.-J. Niu, X. Liu, Z.-W. Wu, Y. Fan, Y.-F. Chang, et al., Directelectrochemistry of catalase at amine-functionalized graphene/goldnanoparticles composite film for hydrogen peroxide sensor, Electrochim. Acta56 (2011) 2947–2953.
[27] N. Li, P. Zhao, D. Astruc, Anisotropic gold nanoparticles: synthesis, properties,applications, and toxicity, Angew. Chem. Int. Ed. 53 (2014) 1756–1789.
[28] W. Zhao, H. Wang, X. Qin, X. Wang, Z. Zhao, Z. Miao, et al., A novelnonenzymatic hydrogen peroxide sensor based on multi-wall carbonnanotube/silver nanoparticle nanohybrids modified gold electrode, Talanta80 (2009) 1029–1033.
[29] J. Zhao, L. Qin, Y. Hao, Q. Guo, F. Mu, Z. Yan, Application of tubular tetrapodmagnesium oxide in a biosensor for hydrogen peroxide, Microchim. Acta. 178(2012) 439–445.
[30] Y. Lee, M.A. Garcia, N.A. Frey Huls, S. Sun, Synthetic tuning of the catalyticproperties of Au-Fe3O4 nanoparticles, Angew. Chem. Int. Ed. 49 (2010)1271–1274.
[31] Q. Wei, Z. Xiang, J. He, G. Wang, H. Li, Z. Qian, et al., Dumbbell-like Au-Fe3O4nanoparticles as label for the preparation of electrochemical immunosensors,Biosens. Bioelectron. 26 (2010) 627–631.
[32] D.A. Johnston, M.F. Cardosi, D.H. Vaughan, The electrochemistry of hydrogenperoxide on evaporated gold/palladium composite electrodes. Manufactureand electrochemical characterization, Electroanalysis 7 (1995) 520–526.
[33] A. Liu, W. Dong, E. Liu, W. Tang, J. Zhu, J. Han, Non-enzymatic hydrogenperoxide detection using gold nanoclusters-modified phosphorusincorporated tetrahedral amorphous carbon electrodes, Electrochim. Acta 55(2010) 1971–1977.
[34] J. Jia, B. Wang, A. Wu, G. Cheng, Z. Li, S. Dong, A method to construct athird-generation horseradish peroxidase biosensor: self-assembling gold
A.M. Munshi et al. / Sensors and Actuators B 235 (2016) 492–497 497
nanoparticles to three-dimensional sol-gel network, Anal. Chem. 74 (2002)2217–2223.
[35] S. Yao, J. Xu, Y. Wang, X. Chen, Y. Xu, S. Hu, A highly sensitive hydrogenperoxide amperometric sensor based on MnO2 nanoparticles and dihexadecylhydrogen phosphate composite film, Anal. Chim. Acta 557 (2006) 78–84.
[36] A.-J. Wang, P.-P. Zhang, Y.-F. Li, J.-J. Feng, W.-J. Dong, X.-Y. Liu, Hydrogenperoxide sensor based on glassy carbon electrode modified with"-manganese dioxide nanorods, Microchim. Acta. 175 (2011) 31–37.
[37] S. Yao, S. Yuan, J. Xu, Y. wang, J. Luo, S. Hu, A hydrogen peroxide sensor basedon colloidal MnO2/Na-montmorillonite, Appl. Clay Sci. 33 (2006) 35–42.
[38] F. Xiao, F. Zhao, Y. Zhang, G. Guo, B. Zeng, Ultrasonic electrodeposition ofgold-platinum alloy nanoparticles on ionic liquid-chitosan composite filmand their application in fabricating nonenzyme hydrogen peroxide sensors, J.Phys. Chem. C 113 (2009) 849–855.
Biographies
Alaa M. Munshi is a PhD candidate in Bionano research group at the University ofWestern Australia. She graduated with a Master in Chemistry under the guidance ofProfessor Trever Brown from New England University, NSW, Australia. Her researchinterest includes the fabrication of nanomaterials for applications in sensing andcatalysis.
Diwei Ho is a Ph.D. candidate at the University of Western Australia (UWA) underthe supervision of Prof. K. Swaminathan Iyer. He received his BSc (Hons) at UWA in
2011. His research interests include the therapeutic and diagnostic applications ofnanomaterials in a biological setting.
Dr. Martin Saunders is Associate Professor and leader of the electron microscopygroup in the Centre for Microscopy, Characterisation and Analysis at The Univer-sity of Western Australia. He obtained his PhD from the University of Bath in 1994.His research interests involve the development and application of advanced elec-tron microscopy techniques for structural and chemical analysis at the nano- andatomic scales in the physical and biological sciences. He is currently President of theAustralian Microscopy and Microanalysis Society.
Dr. Vipul Agarwal has completed his PhD in Chemistry from the University of West-ern Australia in 2015. Prior to this he completed his MApplSc from the University ofTasmania in 2010. His current research interests lies in polymer chemistry, tissueengineering and material science.
Dr. Colin L. Raston is currently Professor in Clean Technology, Flinders University, asa South Australian Premier’s Professorial Research Fellow. He obtained a Ph.D. fromThe University of Western Australia in 1976 and a D.Sc. from Griffith University in1993. Current research interests include thin film microfluidics, flow chemistry, andthe application of nano-materials.
Dr. K. Swaminathan Iyer is an Australian Research Council Future Fellow and thehead of the BioNano research group at the University of Western Australia. Heobtained his PhD. (2004), in Materials Science, from Clemson University, South Car-olina, USA. His current research interests include polymer chemistry, multimodalnanosystems and drug delivery.
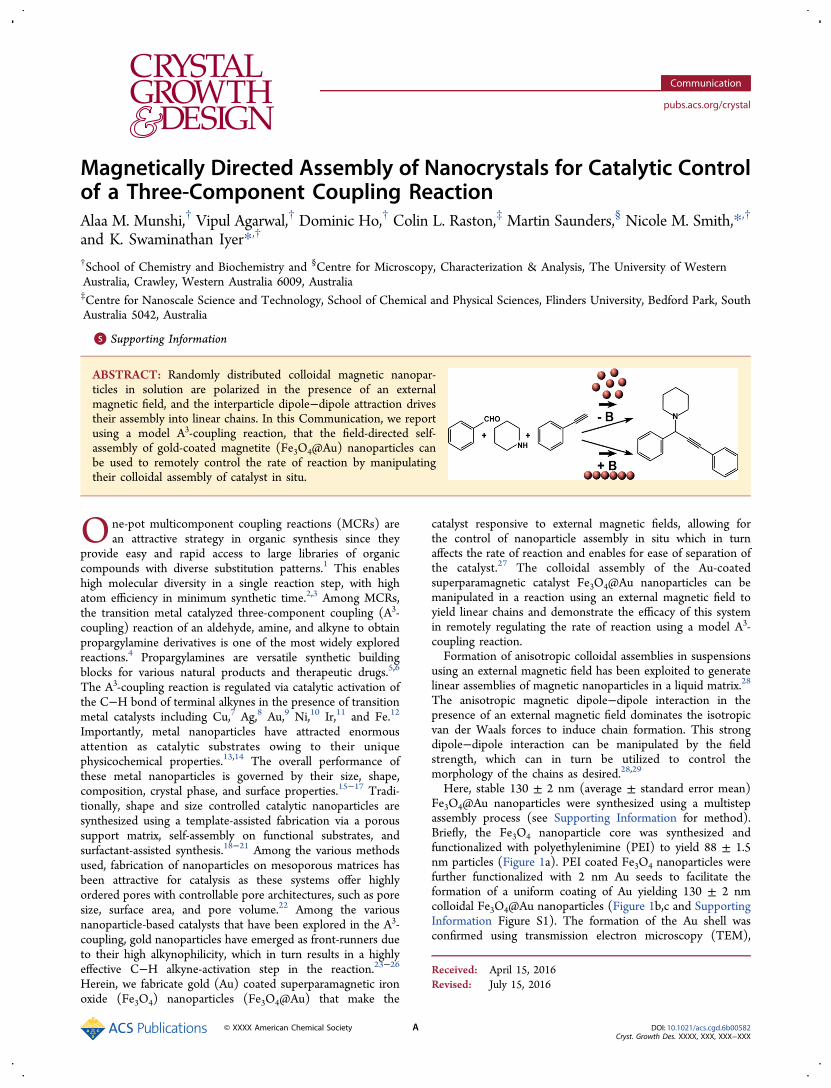
Magnetically Directed Assembly of Nanocrystals for Catalytic Controlof a Three-Component Coupling ReactionAlaa M. Munshi,† Vipul Agarwal,† Dominic Ho,† Colin L. Raston,‡ Martin Saunders,§ Nicole M. Smith,*,†and K. Swaminathan Iyer*,†
†School of Chemistry and Biochemistry and §Centre for Microscopy, Characterization & Analysis, The University of WesternAustralia, Crawley, Western Australia 6009, Australia‡Centre for Nanoscale Science and Technology, School of Chemical and Physical Sciences, Flinders University, Bedford Park, SouthAustralia 5042, Australia
*S Supporting Information
ABSTRACT: Randomly distributed colloidal magnetic nanopar-ticles in solution are polarized in the presence of an externalmagnetic field, and the interparticle dipole−dipole attraction drivestheir assembly into linear chains. In this Communication, we reportusing a model A3-coupling reaction, that the field-directed self-assembly of gold-coated magnetite (Fe3O4@Au) nanoparticles canbe used to remotely control the rate of reaction by manipulatingtheir colloidal assembly of catalyst in situ.
One-pot multicomponent coupling reactions (MCRs) arean attractive strategy in organic synthesis since they
provide easy and rapid access to large libraries of organiccompounds with diverse substitution patterns.1 This enableshigh molecular diversity in a single reaction step, with highatom efficiency in minimum synthetic time.2,3 Among MCRs,the transition metal catalyzed three-component coupling (A3-coupling) reaction of an aldehyde, amine, and alkyne to obtainpropargylamine derivatives is one of the most widely exploredreactions.4 Propargylamines are versatile synthetic buildingblocks for various natural products and therapeutic drugs.5,6
The A3-coupling reaction is regulated via catalytic activation ofthe C−H bond of terminal alkynes in the presence of transitionmetal catalysts including Cu,7 Ag,8 Au,9 Ni,10 Ir,11 and Fe.12
Importantly, metal nanoparticles have attracted enormousattention as catalytic substrates owing to their uniquephysicochemical properties.13,14 The overall performance ofthese metal nanoparticles is governed by their size, shape,composition, crystal phase, and surface properties.15−17 Tradi-tionally, shape and size controlled catalytic nanoparticles aresynthesized using a template-assisted fabrication via a poroussupport matrix, self-assembly on functional substrates, andsurfactant-assisted synthesis.18−21 Among the various methodsused, fabrication of nanoparticles on mesoporous matrices hasbeen attractive for catalysis as these systems offer highlyordered pores with controllable pore architectures, such as poresize, surface area, and pore volume.22 Among the variousnanoparticle-based catalysts that have been explored in the A3-coupling, gold nanoparticles have emerged as front-runners dueto their high alkynophilicity, which in turn results in a highlyeffective C−H alkyne-activation step in the reaction.23−26
Herein, we fabricate gold (Au) coated superparamagnetic ironoxide (Fe3O4) nanoparticles (Fe3O4@Au) that make the
catalyst responsive to external magnetic fields, allowing forthe control of nanoparticle assembly in situ which in turnaffects the rate of reaction and enables for ease of separation ofthe catalyst.27 The colloidal assembly of the Au-coatedsuperparamagnetic catalyst Fe3O4@Au nanoparticles can bemanipulated in a reaction using an external magnetic field toyield linear chains and demonstrate the efficacy of this systemin remotely regulating the rate of reaction using a model A3-coupling reaction.Formation of anisotropic colloidal assemblies in suspensions
using an external magnetic field has been exploited to generatelinear assemblies of magnetic nanoparticles in a liquid matrix.28
The anisotropic magnetic dipole−dipole interaction in thepresence of an external magnetic field dominates the isotropicvan der Waals forces to induce chain formation. This strongdipole−dipole interaction can be manipulated by the fieldstrength, which can in turn be utilized to control themorphology of the chains as desired.28,29
Here, stable 130 ± 2 nm (average ± standard error mean)Fe3O4@Au nanoparticles were synthesized using a multistepassembly process (see Supporting Information for method).Briefly, the Fe3O4 nanoparticle core was synthesized andfunctionalized with polyethylenimine (PEI) to yield 88 ± 1.5nm particles (Figure 1a). PEI coated Fe3O4 nanoparticles werefurther functionalized with 2 nm Au seeds to facilitate theformation of a uniform coating of Au yielding 130 ± 2 nmcolloidal Fe3O4@Au nanoparticles (Figure 1b,c and SupportingInformation Figure S1). The formation of the Au shell wasconfirmed using transmission electron microscopy (TEM),
Received: April 15, 2016Revised: July 15, 2016
Communication
pubs.acs.org/crystal
© XXXX American Chemical Society A DOI: 10.1021/acs.cgd.6b00582Cryst. Growth Des. XXXX, XXX, XXX−XXX
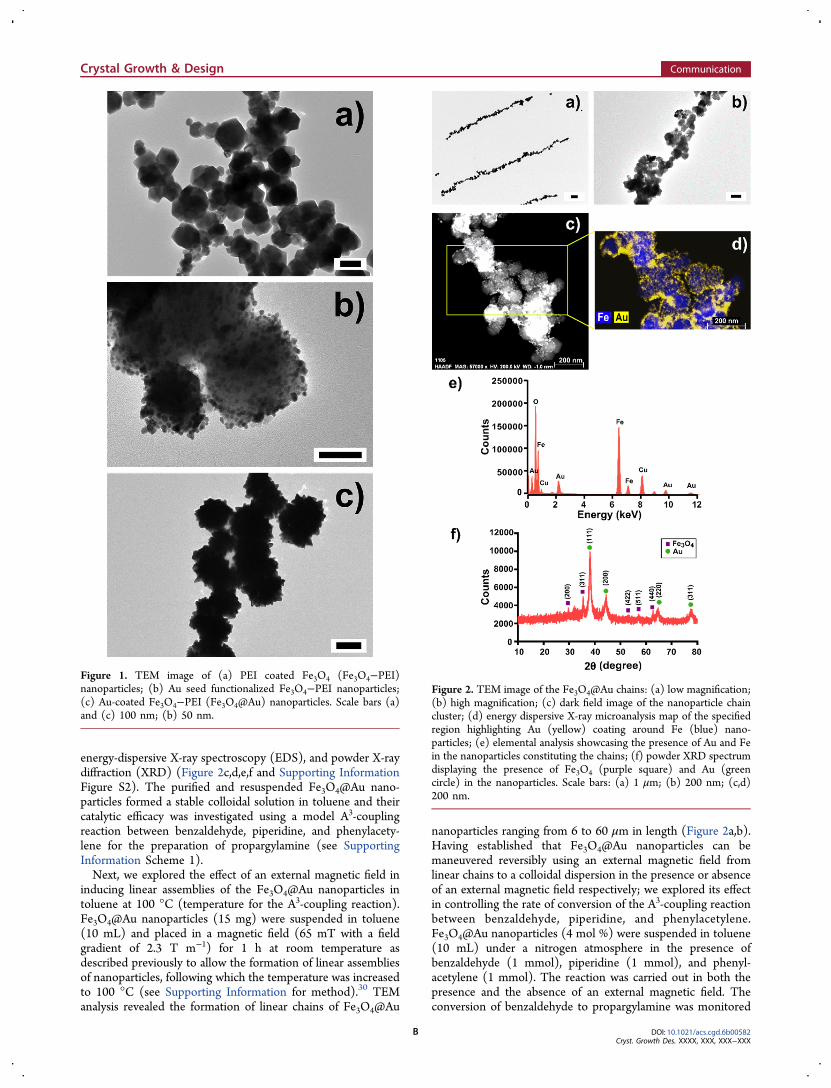
energy-dispersive X-ray spectroscopy (EDS), and powder X-raydiffraction (XRD) (Figure 2c,d,e,f and Supporting InformationFigure S2). The purified and resuspended Fe3O4@Au nano-particles formed a stable colloidal solution in toluene and theircatalytic efficacy was investigated using a model A3-couplingreaction between benzaldehyde, piperidine, and phenylacety-lene for the preparation of propargylamine (see SupportingInformation Scheme 1).Next, we explored the effect of an external magnetic field in
inducing linear assemblies of the Fe3O4@Au nanoparticles intoluene at 100 °C (temperature for the A3-coupling reaction).Fe3O4@Au nanoparticles (15 mg) were suspended in toluene(10 mL) and placed in a magnetic field (65 mT with a fieldgradient of 2.3 T m−1) for 1 h at room temperature asdescribed previously to allow the formation of linear assembliesof nanoparticles, following which the temperature was increasedto 100 °C (see Supporting Information for method).30 TEManalysis revealed the formation of linear chains of Fe3O4@Au
nanoparticles ranging from 6 to 60 μm in length (Figure 2a,b).Having established that Fe3O4@Au nanoparticles can bemaneuvered reversibly using an external magnetic field fromlinear chains to a colloidal dispersion in the presence or absenceof an external magnetic field respectively; we explored its effectin controlling the rate of conversion of the A3-coupling reactionbetween benzaldehyde, piperidine, and phenylacetylene.Fe3O4@Au nanoparticles (4 mol %) were suspended in toluene(10 mL) under a nitrogen atmosphere in the presence ofbenzaldehyde (1 mmol), piperidine (1 mmol), and phenyl-acetylene (1 mmol). The reaction was carried out in both thepresence and the absence of an external magnetic field. Theconversion of benzaldehyde to propargylamine was monitored
Figure 1. TEM image of (a) PEI coated Fe3O4 (Fe3O4−PEI)nanoparticles; (b) Au seed functionalized Fe3O4−PEI nanoparticles;(c) Au-coated Fe3O4−PEI (Fe3O4@Au) nanoparticles. Scale bars (a)and (c) 100 nm; (b) 50 nm.
Figure 2. TEM image of the Fe3O4@Au chains: (a) low magnification;(b) high magnification; (c) dark field image of the nanoparticle chaincluster; (d) energy dispersive X-ray microanalysis map of the specifiedregion highlighting Au (yellow) coating around Fe (blue) nano-particles; (e) elemental analysis showcasing the presence of Au and Fein the nanoparticles constituting the chains; (f) powder XRD spectrumdisplaying the presence of Fe3O4 (purple square) and Au (greencircle) in the nanoparticles. Scale bars: (a) 1 μm; (b) 200 nm; (c,d)200 nm.
Crystal Growth & Design Communication
DOI: 10.1021/acs.cgd.6b00582Cryst. Growth Des. XXXX, XXX, XXX−XXX
B
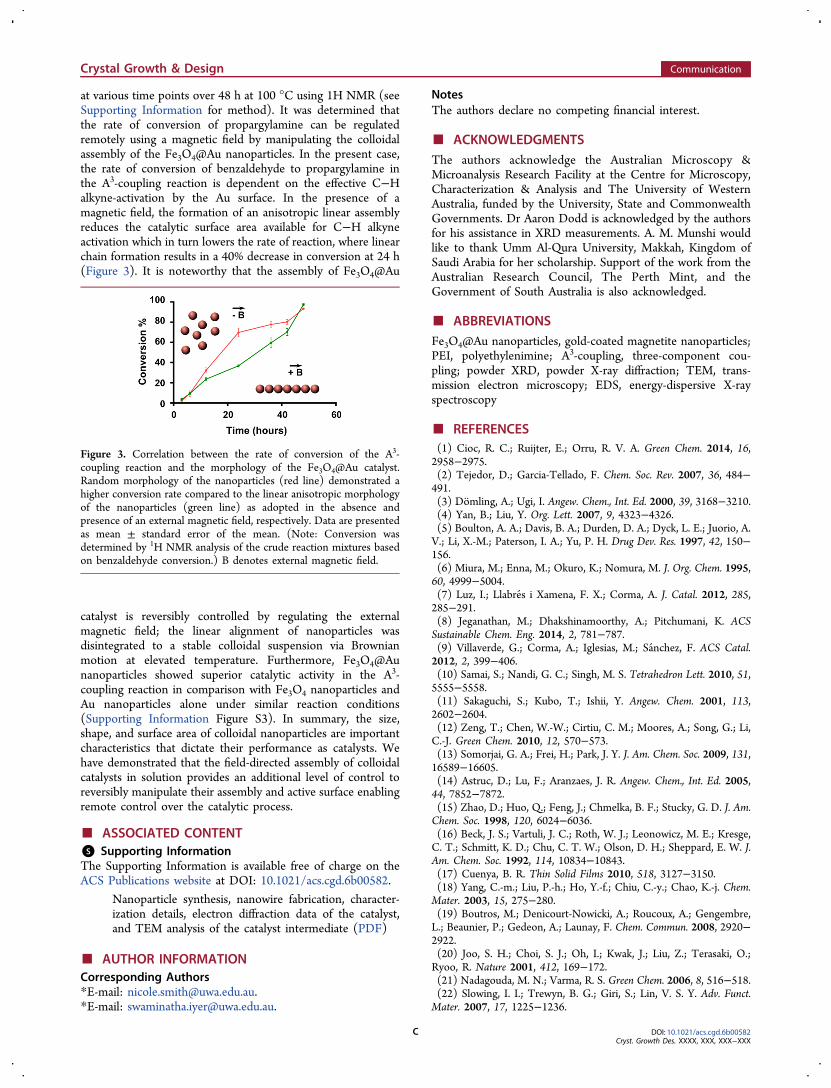
at various time points over 48 h at 100 °C using 1H NMR (seeSupporting Information for method). It was determined thatthe rate of conversion of propargylamine can be regulatedremotely using a magnetic field by manipulating the colloidalassembly of the Fe3O4@Au nanoparticles. In the present case,the rate of conversion of benzaldehyde to propargylamine inthe A3-coupling reaction is dependent on the effective C−Halkyne-activation by the Au surface. In the presence of amagnetic field, the formation of an anisotropic linear assemblyreduces the catalytic surface area available for C−H alkyneactivation which in turn lowers the rate of reaction, where linearchain formation results in a 40% decrease in conversion at 24 h(Figure 3). It is noteworthy that the assembly of Fe3O4@Au
catalyst is reversibly controlled by regulating the externalmagnetic field; the linear alignment of nanoparticles wasdisintegrated to a stable colloidal suspension via Brownianmotion at elevated temperature. Furthermore, Fe3O4@Aunanoparticles showed superior catalytic activity in the A3-coupling reaction in comparison with Fe3O4 nanoparticles andAu nanoparticles alone under similar reaction conditions(Supporting Information Figure S3). In summary, the size,shape, and surface area of colloidal nanoparticles are importantcharacteristics that dictate their performance as catalysts. Wehave demonstrated that the field-directed assembly of colloidalcatalysts in solution provides an additional level of control toreversibly manipulate their assembly and active surface enablingremote control over the catalytic process.
■ ASSOCIATED CONTENT*S Supporting InformationThe Supporting Information is available free of charge on theACS Publications website at DOI: 10.1021/acs.cgd.6b00582.
Nanoparticle synthesis, nanowire fabrication, character-ization details, electron diffraction data of the catalyst,and TEM analysis of the catalyst intermediate (PDF)
■ AUTHOR INFORMATIONCorresponding Authors*E-mail: [email protected].*E-mail: [email protected].
NotesThe authors declare no competing financial interest.
■ ACKNOWLEDGMENTSThe authors acknowledge the Australian Microscopy &Microanalysis Research Facility at the Centre for Microscopy,Characterization & Analysis and The University of WesternAustralia, funded by the University, State and CommonwealthGovernments. Dr Aaron Dodd is acknowledged by the authorsfor his assistance in XRD measurements. A. M. Munshi wouldlike to thank Umm Al-Qura University, Makkah, Kingdom ofSaudi Arabia for her scholarship. Support of the work from theAustralian Research Council, The Perth Mint, and theGovernment of South Australia is also acknowledged.
■ ABBREVIATIONSFe3O4@Au nanoparticles, gold-coated magnetite nanoparticles;PEI, polyethylenimine; A3-coupling, three-component cou-pling; powder XRD, powder X-ray diffraction; TEM, trans-mission electron microscopy; EDS, energy-dispersive X-rayspectroscopy
■ REFERENCES(1) Cioc, R. C.; Ruijter, E.; Orru, R. V. A. Green Chem. 2014, 16,2958−2975.(2) Tejedor, D.; Garcia-Tellado, F. Chem. Soc. Rev. 2007, 36, 484−491.(3) Domling, A.; Ugi, I. Angew. Chem., Int. Ed. 2000, 39, 3168−3210.(4) Yan, B.; Liu, Y. Org. Lett. 2007, 9, 4323−4326.(5) Boulton, A. A.; Davis, B. A.; Durden, D. A.; Dyck, L. E.; Juorio, A.V.; Li, X.-M.; Paterson, I. A.; Yu, P. H. Drug Dev. Res. 1997, 42, 150−156.(6) Miura, M.; Enna, M.; Okuro, K.; Nomura, M. J. Org. Chem. 1995,60, 4999−5004.(7) Luz, I.; Llabres i Xamena, F. X.; Corma, A. J. Catal. 2012, 285,285−291.(8) Jeganathan, M.; Dhakshinamoorthy, A.; Pitchumani, K. ACSSustainable Chem. Eng. 2014, 2, 781−787.(9) Villaverde, G.; Corma, A.; Iglesias, M.; Sanchez, F. ACS Catal.2012, 2, 399−406.(10) Samai, S.; Nandi, G. C.; Singh, M. S. Tetrahedron Lett. 2010, 51,5555−5558.(11) Sakaguchi, S.; Kubo, T.; Ishii, Y. Angew. Chem. 2001, 113,2602−2604.(12) Zeng, T.; Chen, W.-W.; Cirtiu, C. M.; Moores, A.; Song, G.; Li,C.-J. Green Chem. 2010, 12, 570−573.(13) Somorjai, G. A.; Frei, H.; Park, J. Y. J. Am. Chem. Soc. 2009, 131,16589−16605.(14) Astruc, D.; Lu, F.; Aranzaes, J. R. Angew. Chem., Int. Ed. 2005,44, 7852−7872.(15) Zhao, D.; Huo, Q.; Feng, J.; Chmelka, B. F.; Stucky, G. D. J. Am.Chem. Soc. 1998, 120, 6024−6036.(16) Beck, J. S.; Vartuli, J. C.; Roth, W. J.; Leonowicz, M. E.; Kresge,C. T.; Schmitt, K. D.; Chu, C. T. W.; Olson, D. H.; Sheppard, E. W. J.Am. Chem. Soc. 1992, 114, 10834−10843.(17) Cuenya, B. R. Thin Solid Films 2010, 518, 3127−3150.(18) Yang, C.-m.; Liu, P.-h.; Ho, Y.-f.; Chiu, C.-y.; Chao, K.-j. Chem.Mater. 2003, 15, 275−280.(19) Boutros, M.; Denicourt-Nowicki, A.; Roucoux, A.; Gengembre,L.; Beaunier, P.; Gedeon, A.; Launay, F. Chem. Commun. 2008, 2920−2922.(20) Joo, S. H.; Choi, S. J.; Oh, I.; Kwak, J.; Liu, Z.; Terasaki, O.;Ryoo, R. Nature 2001, 412, 169−172.(21) Nadagouda, M. N.; Varma, R. S. Green Chem. 2006, 8, 516−518.(22) Slowing, I. I.; Trewyn, B. G.; Giri, S.; Lin, V. S. Y. Adv. Funct.Mater. 2007, 17, 1225−1236.
Figure 3. Correlation between the rate of conversion of the A3-coupling reaction and the morphology of the Fe3O4@Au catalyst.Random morphology of the nanoparticles (red line) demonstrated ahigher conversion rate compared to the linear anisotropic morphologyof the nanoparticles (green line) as adopted in the absence andpresence of an external magnetic field, respectively. Data are presentedas mean ± standard error of the mean. (Note: Conversion wasdetermined by 1H NMR analysis of the crude reaction mixtures basedon benzaldehyde conversion.) B denotes external magnetic field.
Crystal Growth & Design Communication
DOI: 10.1021/acs.cgd.6b00582Cryst. Growth Des. XXXX, XXX, XXX−XXX
C
(23) Hashmi, A. S. K.; Hutchings, G. J. Angew. Chem., Int. Ed. 2006,45, 7896−7936.(24) Datta, K. K. R.; Reddy, B. V. S.; Ariga, K.; Vinu, A. Angew.Chem., Int. Ed. 2010, 49, 5961−5965.(25) Zhang, X.; Corma, A. Angew. Chem., Int. Ed. 2008, 47, 4358−4361.(26) Skouta, R.; Li, C.-J. Tetrahedron 2008, 64, 4917−4938.(27) Guin, D.; Baruwati, B.; Manorama, S. V. Org. Lett. 2007, 9,1419−1421.(28) Motornov, M.; Malynych, S. Z.; Pippalla, D. S.; Zdyrko, B.;Royter, H.; Roiter, Y.; Kahabka, M.; Tokarev, A.; Tokarev, I.; Zhulina,E.; Kornev, K. G.; Luzinov, I.; Minko, S. Nano Lett. 2012, 12, 3814−3820.(29) Safran, S. A. Nat. Mater. 2003, 2, 71−72.(30) Ho, D.; Peerzade, S. A. M. A.; Becker, T.; Hodgetts, S. I.;Harvey, A. R.; Plant, G. W.; Woodward, R. C.; Luzinov, I.; St. Pierre,T. G.; Iyer, K. S. Chem. Commun. 2013, 49, 7138−7140.
Crystal Growth & Design Communication
DOI: 10.1021/acs.cgd.6b00582Cryst. Growth Des. XXXX, XXX, XXX−XXX
D
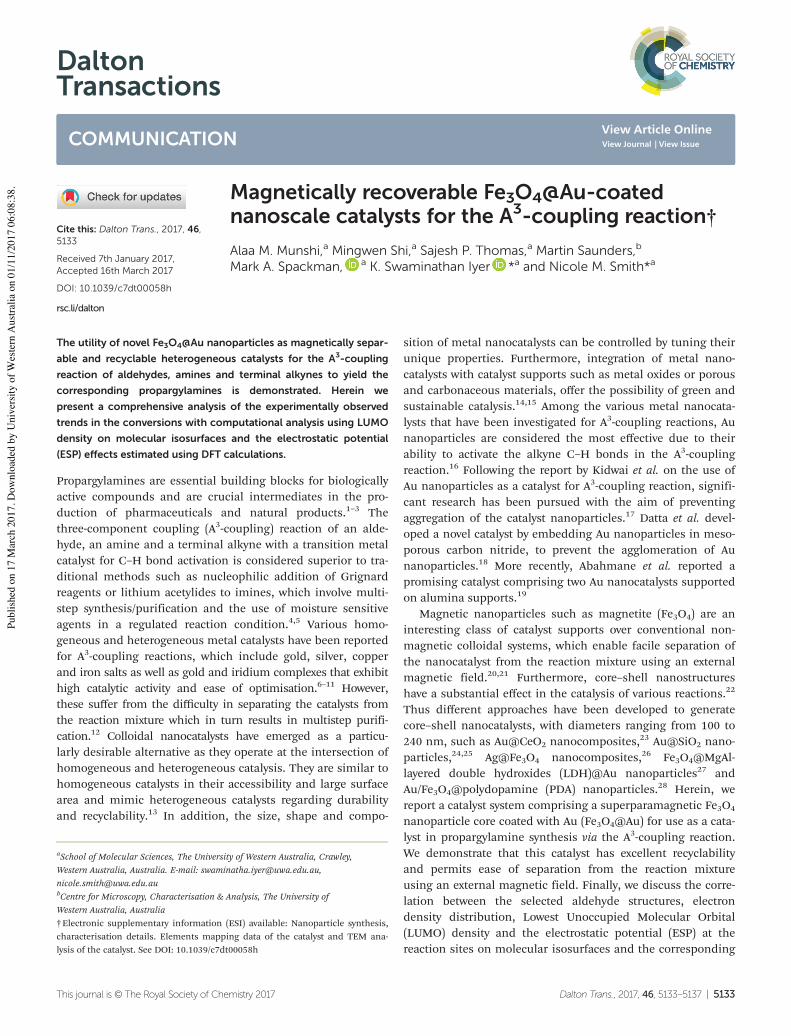
DaltonTransactions
COMMUNICATION
Cite this: Dalton Trans., 2017, 46,5133
Received 7th January 2017,Accepted 16th March 2017
DOI: 10.1039/c7dt00058h
rsc.li/dalton
Magnetically recoverable Fe3O4@Au-coatednanoscale catalysts for the A3-coupling reaction†
Alaa M. Munshi,a Mingwen Shi,a Sajesh P. Thomas,a Martin Saunders,b
Mark A. Spackman, a K. Swaminathan Iyer *a and Nicole M. Smith*a
The utility of novel Fe3O4@Au nanoparticles as magnetically separ-
able and recyclable heterogeneous catalysts for the A3-coupling
reaction of aldehydes, amines and terminal alkynes to yield the
corresponding propargylamines is demonstrated. Herein we
present a comprehensive analysis of the experimentally observed
trends in the conversions with computational analysis using LUMO
density on molecular isosurfaces and the electrostatic potential
(ESP) effects estimated using DFT calculations.
Propargylamines are essential building blocks for biologicallyactive compounds and are crucial intermediates in the pro-duction of pharmaceuticals and natural products.1–3 Thethree-component coupling (A3-coupling) reaction of an alde-hyde, an amine and a terminal alkyne with a transition metalcatalyst for C–H bond activation is considered superior to tra-ditional methods such as nucleophilic addition of Grignardreagents or lithium acetylides to imines, which involve multi-step synthesis/purification and the use of moisture sensitiveagents in a regulated reaction condition.4,5 Various homo-geneous and heterogeneous metal catalysts have been reportedfor A3-coupling reactions, which include gold, silver, copperand iron salts as well as gold and iridium complexes that exhibithigh catalytic activity and ease of optimisation.6–11 However,these suffer from the difficulty in separating the catalysts fromthe reaction mixture which in turn results in multistep purifi-cation.12 Colloidal nanocatalysts have emerged as a particu-larly desirable alternative as they operate at the intersection ofhomogeneous and heterogeneous catalysis. They are similar tohomogeneous catalysts in their accessibility and large surfacearea and mimic heterogeneous catalysts regarding durabilityand recyclability.13 In addition, the size, shape and compo-
sition of metal nanocatalysts can be controlled by tuning theirunique properties. Furthermore, integration of metal nano-catalysts with catalyst supports such as metal oxides or porousand carbonaceous materials, offer the possibility of green andsustainable catalysis.14,15 Among the various metal nanocata-lysts that have been investigated for A3-coupling reactions, Aunanoparticles are considered the most effective due to theirability to activate the alkyne C–H bonds in the A3-couplingreaction.16 Following the report by Kidwai et al. on the use ofAu nanoparticles as a catalyst for A3-coupling reaction, signifi-cant research has been pursued with the aim of preventingaggregation of the catalyst nanoparticles.17 Datta et al. devel-oped a novel catalyst by embedding Au nanoparticles in meso-porous carbon nitride, to prevent the agglomeration of Aunanoparticles.18 More recently, Abahmane et al. reported apromising catalyst comprising two Au nanocatalysts supportedon alumina supports.19
Magnetic nanoparticles such as magnetite (Fe3O4) are aninteresting class of catalyst supports over conventional non-magnetic colloidal systems, which enable facile separation ofthe nanocatalyst from the reaction mixture using an externalmagnetic field.20,21 Furthermore, core–shell nanostructureshave a substantial effect in the catalysis of various reactions.22
Thus different approaches have been developed to generatecore–shell nanocatalysts, with diameters ranging from 100 to240 nm, such as Au@CeO2 nanocomposites,23 Au@SiO2 nano-particles,24,25 Ag@Fe3O4 nanocomposites,26 Fe3O4@MgAl-layered double hydroxides (LDH)@Au nanoparticles27 andAu/Fe3O4@polydopamine (PDA) nanoparticles.28 Herein, wereport a catalyst system comprising a superparamagnetic Fe3O4
nanoparticle core coated with Au (Fe3O4@Au) for use as a cata-lyst in propargylamine synthesis via the A3-coupling reaction.We demonstrate that this catalyst has excellent recyclabilityand permits ease of separation from the reaction mixtureusing an external magnetic field. Finally, we discuss the corre-lation between the selected aldehyde structures, electrondensity distribution, Lowest Unoccupied Molecular Orbital(LUMO) density and the electrostatic potential (ESP) at thereaction sites on molecular isosurfaces and the corresponding
†Electronic supplementary information (ESI) available: Nanoparticle synthesis,characterisation details. Elements mapping data of the catalyst and TEM ana-lysis of the catalyst. See DOI: 10.1039/c7dt00058h
aSchool of Molecular Sciences, The University of Western Australia, Crawley,Western Australia, Australia. E-mail: [email protected],[email protected] for Microscopy, Characterisation & Analysis, The University ofWestern Australia, Australia
This journal is © The Royal Society of Chemistry 2017 Dalton Trans., 2017, 46, 5133–5137 | 5133
Publ
ished
on
17 M
arch
201
7. D
ownl
oade
d by
Uni
vers
ity o
f Wes
tern
Aus
tralia
on
01/1
1/20
17 0
6:08
:38.
View Article OnlineView Journal | View Issue
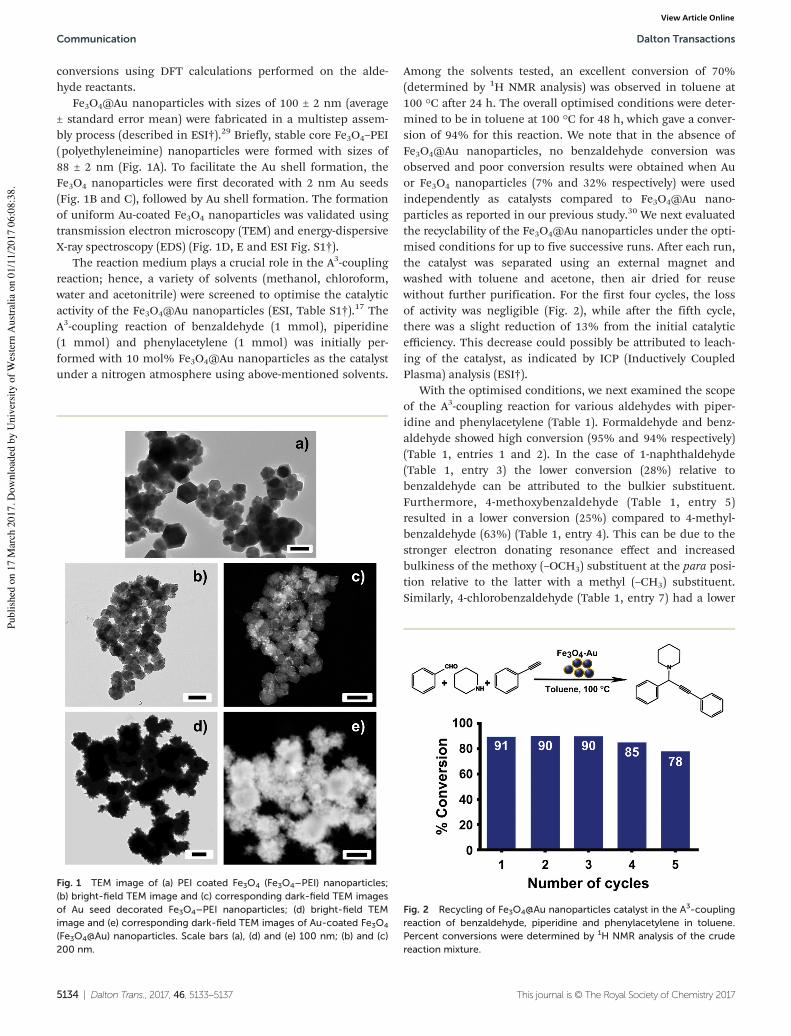
conversions using DFT calculations performed on the alde-hyde reactants.
Fe3O4@Au nanoparticles with sizes of 100 ± 2 nm (average± standard error mean) were fabricated in a multistep assem-bly process (described in ESI†).29 Briefly, stable core Fe3O4–PEI(polyethyleneimine) nanoparticles were formed with sizes of88 ± 2 nm (Fig. 1A). To facilitate the Au shell formation, theFe3O4 nanoparticles were first decorated with 2 nm Au seeds(Fig. 1B and C), followed by Au shell formation. The formationof uniform Au-coated Fe3O4 nanoparticles was validated usingtransmission electron microscopy (TEM) and energy-dispersiveX-ray spectroscopy (EDS) (Fig. 1D, E and ESI Fig. S1†).
The reaction medium plays a crucial role in the A3-couplingreaction; hence, a variety of solvents (methanol, chloroform,water and acetonitrile) were screened to optimise the catalyticactivity of the Fe3O4@Au nanoparticles (ESI, Table S1†).17 TheA3-coupling reaction of benzaldehyde (1 mmol), piperidine(1 mmol) and phenylacetylene (1 mmol) was initially per-formed with 10 mol% Fe3O4@Au nanoparticles as the catalystunder a nitrogen atmosphere using above-mentioned solvents.
Among the solvents tested, an excellent conversion of 70%(determined by 1H NMR analysis) was observed in toluene at100 °C after 24 h. The overall optimised conditions were deter-mined to be in toluene at 100 °C for 48 h, which gave a conver-sion of 94% for this reaction. We note that in the absence ofFe3O4@Au nanoparticles, no benzaldehyde conversion wasobserved and poor conversion results were obtained when Auor Fe3O4 nanoparticles (7% and 32% respectively) were usedindependently as catalysts compared to Fe3O4@Au nano-particles as reported in our previous study.30 We next evaluatedthe recyclability of the Fe3O4@Au nanoparticles under the opti-mised conditions for up to five successive runs. After each run,the catalyst was separated using an external magnet andwashed with toluene and acetone, then air dried for reusewithout further purification. For the first four cycles, the lossof activity was negligible (Fig. 2), while after the fifth cycle,there was a slight reduction of 13% from the initial catalyticefficiency. This decrease could possibly be attributed to leach-ing of the catalyst, as indicated by ICP (Inductively CoupledPlasma) analysis (ESI†).
With the optimised conditions, we next examined the scopeof the A3-coupling reaction for various aldehydes with piper-idine and phenylacetylene (Table 1). Formaldehyde and benz-aldehyde showed high conversion (95% and 94% respectively)(Table 1, entries 1 and 2). In the case of 1-naphthaldehyde(Table 1, entry 3) the lower conversion (28%) relative tobenzaldehyde can be attributed to the bulkier substituent.Furthermore, 4-methoxybenzaldehyde (Table 1, entry 5)resulted in a lower conversion (25%) compared to 4-methyl-benzaldehyde (63%) (Table 1, entry 4). This can be due to thestronger electron donating resonance effect and increasedbulkiness of the methoxy (–OCH3) substituent at the para posi-tion relative to the latter with a methyl (–CH3) substituent.Similarly, 4-chlorobenzaldehyde (Table 1, entry 7) had a lower
Fig. 1 TEM image of (a) PEI coated Fe3O4 (Fe3O4–PEI) nanoparticles;(b) bright-field TEM image and (c) corresponding dark-field TEM imagesof Au seed decorated Fe3O4–PEI nanoparticles; (d) bright-field TEMimage and (e) corresponding dark-field TEM images of Au-coated Fe3O4
(Fe3O4@Au) nanoparticles. Scale bars (a), (d) and (e) 100 nm; (b) and (c)200 nm.
Fig. 2 Recycling of Fe3O4@Au nanoparticles catalyst in the A3-couplingreaction of benzaldehyde, piperidine and phenylacetylene in toluene.Percent conversions were determined by 1H NMR analysis of the crudereaction mixture.
Communication Dalton Transactions
5134 | Dalton Trans., 2017, 46, 5133–5137 This journal is © The Royal Society of Chemistry 2017
Publ
ished
on
17 M
arch
201
7. D
ownl
oade
d by
Uni
vers
ity o
f Wes
tern
Aus
tralia
on
01/1
1/20
17 0
6:08
:38.
View Article Online
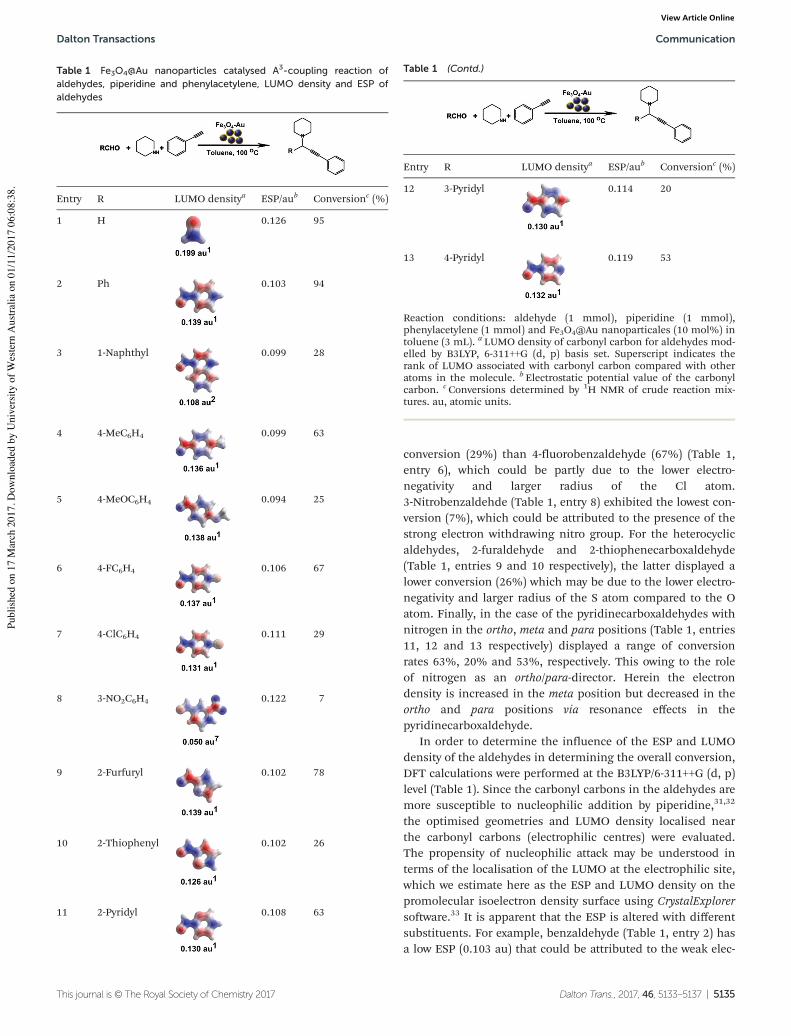
conversion (29%) than 4-fluorobenzaldehyde (67%) (Table 1,entry 6), which could be partly due to the lower electro-negativity and larger radius of the Cl atom.3-Nitrobenzaldehde (Table 1, entry 8) exhibited the lowest con-version (7%), which could be attributed to the presence of thestrong electron withdrawing nitro group. For the heterocyclicaldehydes, 2-furaldehyde and 2-thiophenecarboxaldehyde(Table 1, entries 9 and 10 respectively), the latter displayed alower conversion (26%) which may be due to the lower electro-negativity and larger radius of the S atom compared to the Oatom. Finally, in the case of the pyridinecarboxaldehydes withnitrogen in the ortho, meta and para positions (Table 1, entries11, 12 and 13 respectively) displayed a range of conversionrates 63%, 20% and 53%, respectively. This owing to the roleof nitrogen as an ortho/para-director. Herein the electrondensity is increased in the meta position but decreased in theortho and para positions via resonance effects in thepyridinecarboxaldehyde.
In order to determine the influence of the ESP and LUMOdensity of the aldehydes in determining the overall conversion,DFT calculations were performed at the B3LYP/6-311++G (d, p)level (Table 1). Since the carbonyl carbons in the aldehydes aremore susceptible to nucleophilic addition by piperidine,31,32
the optimised geometries and LUMO density localised nearthe carbonyl carbons (electrophilic centres) were evaluated.The propensity of nucleophilic attack may be understood interms of the localisation of the LUMO at the electrophilic site,which we estimate here as the ESP and LUMO density on thepromolecular isoelectron density surface using CrystalExplorersoftware.33 It is apparent that the ESP is altered with differentsubstituents. For example, benzaldehyde (Table 1, entry 2) hasa low ESP (0.103 au) that could be attributed to the weak elec-
Table 1 Fe3O4@Au nanoparticles catalysed A3-coupling reaction ofaldehydes, piperidine and phenylacetylene, LUMO density and ESP ofaldehydes
Entry R LUMO densitya ESP/aub Conversionc (%)
1 H 0.126 95
2 Ph 0.103 94
3 1-Naphthyl 0.099 28
4 4-MeC6H4 0.099 63
5 4-MeOC6H4 0.094 25
6 4-FC6H4 0.106 67
7 4-ClC6H4 0.111 29
8 3-NO2C6H4 0.122 7
9 2-Furfuryl 0.102 78
10 2-Thiophenyl 0.102 26
11 2-Pyridyl 0.108 63
Table 1 (Contd.)
Entry R LUMO densitya ESP/aub Conversionc (%)
12 3-Pyridyl 0.114 20
13 4-Pyridyl 0.119 53
Reaction conditions: aldehyde (1 mmol), piperidine (1 mmol),phenylacetylene (1 mmol) and Fe3O4@Au nanoparticales (10 mol%) intoluene (3 mL). a LUMO density of carbonyl carbon for aldehydes mod-elled by B3LYP, 6-311++G (d, p) basis set. Superscript indicates therank of LUMO associated with carbonyl carbon compared with otheratoms in the molecule. b Electrostatic potential value of the carbonylcarbon. c Conversions determined by 1H NMR of crude reaction mix-tures. au, atomic units.
Dalton Transactions Communication
This journal is © The Royal Society of Chemistry 2017 Dalton Trans., 2017, 46, 5133–5137 | 5135
Publ
ished
on
17 M
arch
201
7. D
ownl
oade
d by
Uni
vers
ity o
f Wes
tern
Aus
tralia
on
01/1
1/20
17 0
6:08
:38.
View Article Online
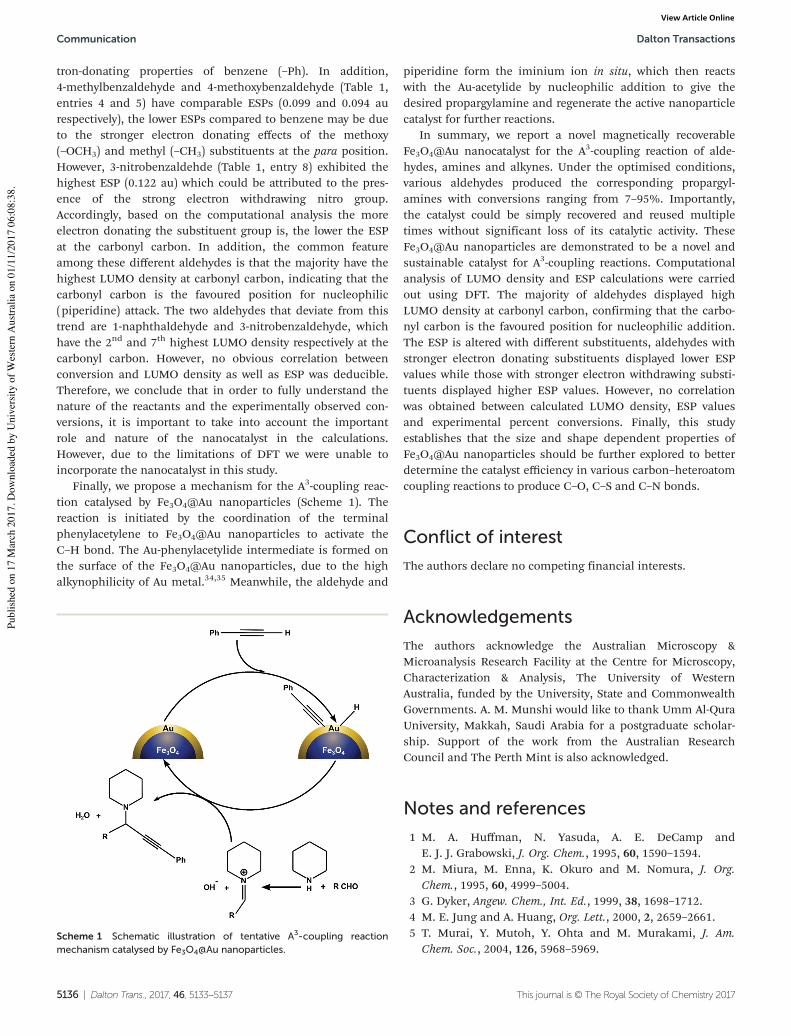
tron-donating properties of benzene (–Ph). In addition,4-methylbenzaldehyde and 4-methoxybenzaldehyde (Table 1,entries 4 and 5) have comparable ESPs (0.099 and 0.094 aurespectively), the lower ESPs compared to benzene may be dueto the stronger electron donating effects of the methoxy(–OCH3) and methyl (–CH3) substituents at the para position.However, 3-nitrobenzaldehde (Table 1, entry 8) exhibited thehighest ESP (0.122 au) which could be attributed to the pres-ence of the strong electron withdrawing nitro group.Accordingly, based on the computational analysis the moreelectron donating the substituent group is, the lower the ESPat the carbonyl carbon. In addition, the common featureamong these different aldehydes is that the majority have thehighest LUMO density at carbonyl carbon, indicating that thecarbonyl carbon is the favoured position for nucleophilic(piperidine) attack. The two aldehydes that deviate from thistrend are 1-naphthaldehyde and 3-nitrobenzaldehyde, whichhave the 2nd and 7th highest LUMO density respectively at thecarbonyl carbon. However, no obvious correlation betweenconversion and LUMO density as well as ESP was deducible.Therefore, we conclude that in order to fully understand thenature of the reactants and the experimentally observed con-versions, it is important to take into account the importantrole and nature of the nanocatalyst in the calculations.However, due to the limitations of DFT we were unable toincorporate the nanocatalyst in this study.
Finally, we propose a mechanism for the A3-coupling reac-tion catalysed by Fe3O4@Au nanoparticles (Scheme 1). Thereaction is initiated by the coordination of the terminalphenylacetylene to Fe3O4@Au nanoparticles to activate theC–H bond. The Au-phenylacetylide intermediate is formed onthe surface of the Fe3O4@Au nanoparticles, due to the highalkynophilicity of Au metal.34,35 Meanwhile, the aldehyde and
piperidine form the iminium ion in situ, which then reactswith the Au-acetylide by nucleophilic addition to give thedesired propargylamine and regenerate the active nanoparticlecatalyst for further reactions.
In summary, we report a novel magnetically recoverableFe3O4@Au nanocatalyst for the A3-coupling reaction of alde-hydes, amines and alkynes. Under the optimised conditions,various aldehydes produced the corresponding propargyl-amines with conversions ranging from 7–95%. Importantly,the catalyst could be simply recovered and reused multipletimes without significant loss of its catalytic activity. TheseFe3O4@Au nanoparticles are demonstrated to be a novel andsustainable catalyst for A3-coupling reactions. Computationalanalysis of LUMO density and ESP calculations were carriedout using DFT. The majority of aldehydes displayed highLUMO density at carbonyl carbon, confirming that the carbo-nyl carbon is the favoured position for nucleophilic addition.The ESP is altered with different substituents, aldehydes withstronger electron donating substituents displayed lower ESPvalues while those with stronger electron withdrawing substi-tuents displayed higher ESP values. However, no correlationwas obtained between calculated LUMO density, ESP valuesand experimental percent conversions. Finally, this studyestablishes that the size and shape dependent properties ofFe3O4@Au nanoparticles should be further explored to betterdetermine the catalyst efficiency in various carbon–heteroatomcoupling reactions to produce C–O, C–S and C–N bonds.
Conflict of interestThe authors declare no competing financial interests.
AcknowledgementsThe authors acknowledge the Australian Microscopy &Microanalysis Research Facility at the Centre for Microscopy,Characterization & Analysis, The University of WesternAustralia, funded by the University, State and CommonwealthGovernments. A. M. Munshi would like to thank Umm Al-QuraUniversity, Makkah, Saudi Arabia for a postgraduate scholar-ship. Support of the work from the Australian ResearchCouncil and The Perth Mint is also acknowledged.
Notes and references1 M. A. Huffman, N. Yasuda, A. E. DeCamp and
E. J. J. Grabowski, J. Org. Chem., 1995, 60, 1590–1594.2 M. Miura, M. Enna, K. Okuro and M. Nomura, J. Org.
Chem., 1995, 60, 4999–5004.3 G. Dyker, Angew. Chem., Int. Ed., 1999, 38, 1698–1712.4 M. E. Jung and A. Huang, Org. Lett., 2000, 2, 2659–2661.5 T. Murai, Y. Mutoh, Y. Ohta and M. Murakami, J. Am.
Chem. Soc., 2004, 126, 5968–5969.Scheme 1 Schematic illustration of tentative A3-coupling reactionmechanism catalysed by Fe3O4@Au nanoparticles.
Communication Dalton Transactions
5136 | Dalton Trans., 2017, 46, 5133–5137 This journal is © The Royal Society of Chemistry 2017
Publ
ished
on
17 M
arch
201
7. D
ownl
oade
d by
Uni
vers
ity o
f Wes
tern
Aus
tralia
on
01/1
1/20
17 0
6:08
:38.
View Article Online
6 V. K.-Y. Lo, Y. Liu, M.-K. Wong and C.-M. Che, Org. Lett.,2006, 8, 1529–1532.
7 C. Wei and C.-J. Li, J. Am. Chem. Soc., 2003, 125, 9584–9585.8 L. Shi, Y.-Q. Tu, M. Wang, F.-M. Zhang and C.-A. Fan, Org.
Lett., 2004, 6, 1001–1003.9 C. Fischer and E. M. Carreira, Org. Lett., 2001, 3, 4319–4321.
10 C. Wei, Z. Li and C.-J. Li, Org. Lett., 2003, 5, 4473–4475.11 W.-W. Chen, R. V. Nguyen and C.-J. Li, Tetrahedron Lett.,
2009, 50, 2895–2898.12 V. Polshettiwar and R. S. Varma, Green Chem., 2010, 12,
743–754.13 V. Polshettiwar, T. Asefa and G. Hutchings, Nanocatalysis:
Synthesis and Applications, Wiley, 2013.14 R. J. White, R. Luque, V. L. Budarin, J. H. Clark and
D. J. Macquarrie, Chem. Soc. Rev., 2009, 38, 481–494.15 J. M. Campelo, D. Luna, R. Luque, J. M. Marinas and
A. A. Romero, ChemSusChem, 2009, 2, 18–45.16 B. Karimi, M. Gholinejad and M. Khorasani, Chem.
Commun., 2012, 48, 8961–8963.17 M. Kidwai, V. Bansal, A. Kumar and S. Mozumdar, Green
Chem., 2007, 9, 742–745.18 K. K. R. Datta, B. V. S. Reddy, K. Ariga and A. Vinu, Angew.
Chem., Int. Ed., 2010, 49, 5961–5965.19 L. Abahmane, J. M. Köhler and G. A. Groß, Chem. – Eur. J.,
2011, 17, 3005–3010.20 T. Zeng, W.-W. Chen, C. M. Cirtiu, A. Moores, G. Song and
C.-J. Li, Green Chem., 2010, 12, 570–573.21 S. Shylesh, V. Schünemann and W. R. Thiel, Angew. Chem.,
Int. Ed., 2010, 49, 3428–3459.
22 S. H. Joo, J. Y. Park, C.-K. Tsung, Y. Yamada, P. Yang andG. A. Somorjai, Nat. Mater., 2009, 8, 126–131.
23 J. Qi, J. Chen, G. Li, S. Li, Y. Gao and Z. Tang, EnergyEnviron. Sci., 2012, 5, 8937–8941.
24 J. C. Park and H. Song, Nano Res., 2011, 4, 33–49.25 J. Lee, J. C. Park and H. Song, Adv. Mater., 2008, 20, 1523–
1528.26 W. Jiang, Y. Zhou, Y. Zhang, S. Xuan and X. Gong, Dalton
Trans., 2012, 41, 4594–4601.27 F. Mi, X. Chen, Y. Ma, S. Yin, F. Yuan and H. Zhang, Chem.
Commun., 2011, 47, 12804–12806.28 Y. Zhao, Y. Yeh, R. Liu, J. You and F. Qu, Solid State Sci.,
2015, 45, 9–14.29 I. Y. Goon, L. M. H. Lai, M. Lim, P. Munroe, J. J. Gooding
and R. Amal, Chem. Mater., 2009, 21, 673–681.30 A. M. Munshi, V. Agarwal, D. Ho, C. L. Raston,
M. Saunders, N. M. Smith and K. S. Iyer, Cryst. Growth Des.,2016, 16, 4773–4776.
31 R. Krishnan, J. S. Binkley, R. Seeger and J. A. Pople,J. Chem. Phys., 1980, 72, 650–654.
32 M. J. Frisch, J. A. Pople and J. S. Binkley, J. Chem. Phys.,1984, 80, 3265–3269.
33 M. J. Turner, J. J. McKinnon, S. K. Wolff, D. J. Grimwood,P. R. Spackman, D. Jayatilaka and M. A. Spackman, CrystalExplorer17, University of Western Australia, 2017, http://hirshfeldsurface.net.
34 C.-J. Li, Acc. Chem. Res., 2010, 43, 581–590.35 X. Zhang and A. Corma, Angew. Chem., Int. Ed., 2008, 47,
4358–4361.
Dalton Transactions Communication
This journal is © The Royal Society of Chemistry 2017 Dalton Trans., 2017, 46, 5133–5137 | 5137
Publ
ished
on
17 M
arch
201
7. D
ownl
oade
d by
Uni
vers
ity o
f Wes
tern
Aus
tralia
on
01/1
1/20
17 0
6:08
:38.
View Article Online
Journal Name
COMMUNICATION
This journal is © The Royal Society of Chemistry 20xx J. Name., 2013, 00, 1-3 | 1
Please do not adjust margins
Please do not adjust margins
Received 00th January 20xx, Accepted 00th January 20xx
DOI: 10.1039/x0xx00000x
www.rsc.org/
Dendronised polymers as templates for in-situ one-pot quantum dot synthesis Alaa M. Munshia, Jessica A. Kretzmanna , Cameron W. Evansa, Anna M. Ranierib, Zibeon Schildkrauta, Massimiliano Massib, Marck Norreta , Martin Saundersc, and K. Swaminathan Iyera,*
The high degree of molecular uniformity, narrow molecular weight distribution, tunable size and shape characteristics, coupled with the multivalency have resulted in the utility of dendrimers as effective carriers for targeted drug delivery and imaging. In particular, nanocomposites of dendrimers with inorganic nanoparticles, such as gold and quantum dots, have been successfully developed to enable multimodal imaging and delivery. Dendrimer-QD nanocomposites have traditionally been synthesised by electrostatic self-assembly of preformed dendrimers and QDs. Using this approach high loading efficiency of QDs is usually attained with higher generation dendrimers. However, due to the inherent design of dendrimers, increasing generations are associated with limited flexibility and increased cytotoxicity. In this paper, we report a novel approach for fabrication of CdTe QD nanoparticles using a dendronised linear copolymer (poly(HEMA-ran-GMA)) bearing thiolated fourth-generation PAMAM dendrons as the capping and stabilising agent. We demonstrate that this approach enables synthesis of nanocomposites with aqueous and photophysical stability.
Fluorescent semiconductor nanocrystals, or quantum dots (QDs), have dominated nanoscience research over the past few decades. QDs have shown superior luminescent properties compared to those achieved by conventional organic fluorophores. More specifically, QDs can exhibit high fluorescence quantum yield (QY), wide spectral absorption, narrow spectral emission bands, large Stokes shifts, and high photostability.1-5 In addition, their electronic and optical properties can be enhanced by controlling their size, composition and surface characteristics.6 Therefore, QDs are promising materials
for applications such as biosensing, drug delivery, bioimaging and labelling.7, 8 In particular, these attractive properties are exhibited by QDs composed of a binary combination of Cd or Zn with Se, Te, or S (II–VI semiconductor compounds) having a diameter in the range 2–20 nm.8 For biological applications, multifunctional QD nanomaterials that possess a combination of fluorescent, non-toxic, and biocompatible properties are desirable and so several strategies have been developed to synthesise hydrophobic QDs in aqueous solutions. Generally, the QD surface is passivated with either organic or inorganic layers to create water-soluble QDs. The simplest and most effective strategy is arrested precipitation, in which the QD surface is coated with an amine, phosphine, or thiol ligand. Thiols such as cysteamine, 2-mercaptoethylamine (MEA), and glutathione (GSH) are the most robust ligands owing to the high chelating effect of the thiol group.9 Such coatings are used to introduce free functional groups such as -COOH, -NH2, and -OH to facilitate aqueous stability and solubility.10-12 These small organic ligands only offer limited stability in complex environments because of desorption, in which surface functionality is lost, causing nanocrystal aggregation.13 Furthermore, since the QD surface is hard to coat uniformly with small organic ligands, the heavy metal ions used (e.g., Cd2+) can be easily released, causing unwanted toxicity in biological systems.14 Suitable passivating and capping agents are crucial for introducing functional groups for optimal biocompatibility as well as fluorescent properties, such as high QY. The inorganic shells in core/shell nanocomposites such as CdTe/CdSe and CdSe/ZnTe impart biocompatibility and high QY; however, their surfaces are not readily modified.15, 16 Polymeric ligands can provide high stability and biocompatibility, thus avoiding ligand exchange steps that may negatively affect the luminescent properties, and introduce an abundance of chemical functionalities to QD nanoparticles. Therefore, using linear or hyperbranched polymers is an attractive alternative to small organic ligands and inorganic shells.17 Dendrimers are well-ordered spherical polymeric materials.18 These polymers have attracted immense research interest owing to their unique structures.19, 20 Dendrimers offer a high level of structural control and their terminal groups can
a. School of Molecular Sciences, The University of Western Australia, Crawley, Western Australia, Australia
b. Department of Chemistry and Nanochemistry Research Institute, Curtin University, Australia.
c. Centre for Microscopy, Characterisation & Analysis, The University of Western Australia, Australia
* E-mail: [email protected] Electronic Supplementary Information (ESI) available: materials, synthesis and characterisation of polymers and CdTe QDs and Photophysics evaluation. See DOI: 10.1039/x0xx00000x
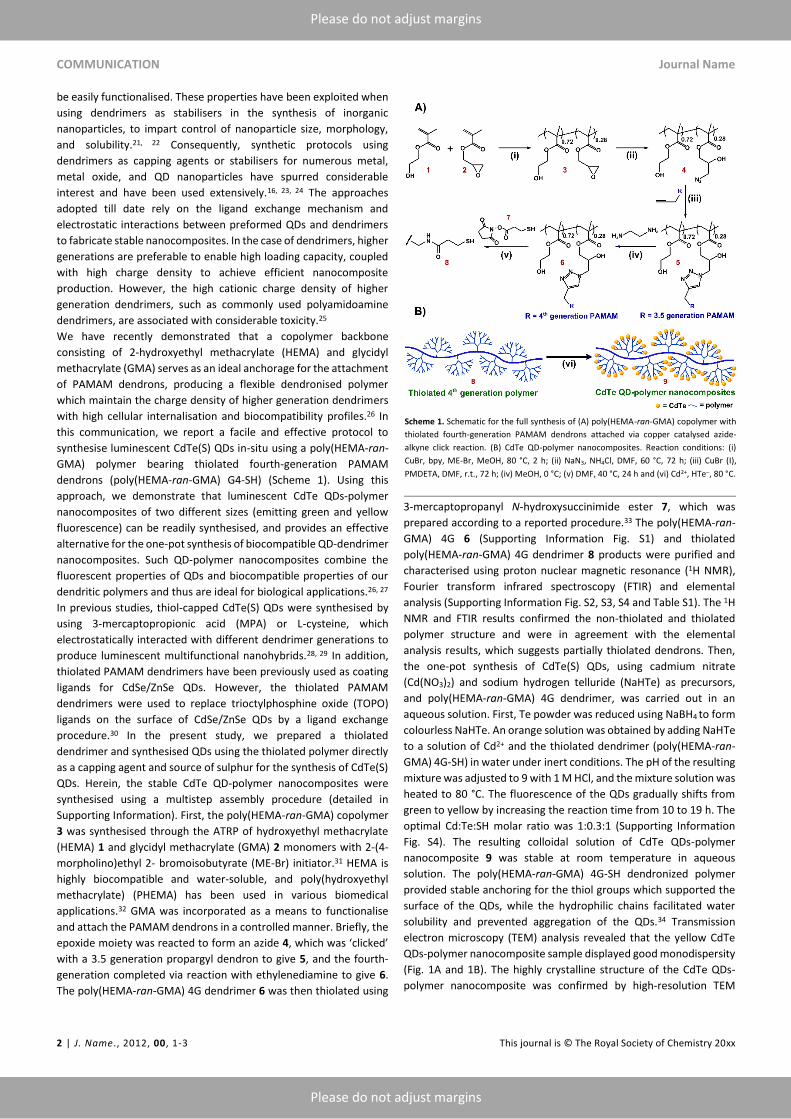
COMMUNICATION Journal Name
2 | J. Name., 2012, 00, 1-3 This journal is © The Royal Society of Chemistry 20xx
Please do not adjust margins
Please do not adjust margins
be easily functionalised. These properties have been exploited when using dendrimers as stabilisers in the synthesis of inorganic nanoparticles, to impart control of nanoparticle size, morphology, and solubility.21, 22 Consequently, synthetic protocols using dendrimers as capping agents or stabilisers for numerous metal, metal oxide, and QD nanoparticles have spurred considerable interest and have been used extensively.16, 23, 24 The approaches adopted till date rely on the ligand exchange mechanism and electrostatic interactions between preformed QDs and dendrimers to fabricate stable nanocomposites. In the case of dendrimers, higher generations are preferable to enable high loading capacity, coupled with high charge density to achieve efficient nanocomposite production. However, the high cationic charge density of higher generation dendrimers, such as commonly used polyamidoamine dendrimers, are associated with considerable toxicity.25 We have recently demonstrated that a copolymer backbone consisting of 2-hydroxyethyl methacrylate (HEMA) and glycidyl methacrylate (GMA) serves as an ideal anchorage for the attachment of PAMAM dendrons, producing a flexible dendronised polymer which maintain the charge density of higher generation dendrimers with high cellular internalisation and biocompatibility profiles.26 In this communication, we report a facile and effective protocol to synthesise luminescent CdTe(S) QDs in-situ using a poly(HEMA-ran-GMA) polymer bearing thiolated fourth-generation PAMAM dendrons (poly(HEMA-ran-GMA) G4-SH) (Scheme 1). Using this approach, we demonstrate that luminescent CdTe QDs-polymer nanocomposites of two different sizes (emitting green and yellow fluorescence) can be readily synthesised, and provides an effective alternative for the one-pot synthesis of biocompatible QD-dendrimer nanocomposites. Such QD-polymer nanocomposites combine the fluorescent properties of QDs and biocompatible properties of our dendritic polymers and thus are ideal for biological applications.26, 27 In previous studies, thiol-capped CdTe(S) QDs were synthesised by using 3-mercaptopropionic acid (MPA) or L-cysteine, which electrostatically interacted with different dendrimer generations to produce luminescent multifunctional nanohybrids.28, 29 In addition, thiolated PAMAM dendrimers have been previously used as coating ligands for CdSe/ZnSe QDs. However, the thiolated PAMAM dendrimers were used to replace trioctylphosphine oxide (TOPO) ligands on the surface of CdSe/ZnSe QDs by a ligand exchange procedure.30 In the present study, we prepared a thiolated dendrimer and synthesised QDs using the thiolated polymer directly as a capping agent and source of sulphur for the synthesis of CdTe(S) QDs. Herein, the stable CdTe QD-polymer nanocomposites were synthesised using a multistep assembly procedure (detailed in Supporting Information). First, the poly(HEMA-ran-GMA) copolymer 3 was synthesised through the ATRP of hydroxyethyl methacrylate (HEMA) 1 and glycidyl methacrylate (GMA) 2 monomers with 2-(4-morpholino)ethyl 2- bromoisobutyrate (ME-Br) initiator.31 HEMA is highly biocompatible and water-soluble, and poly(hydroxyethyl methacrylate) (PHEMA) has been used in various biomedical applications.32 GMA was incorporated as a means to functionalise and attach the PAMAM dendrons in a controlled manner. Briefly, the epoxide moiety was reacted to form an azide 4, which was ‘clicked’ with a 3.5 generation propargyl dendron to give 5, and the fourth-generation completed via reaction with ethylenediamine to give 6. The poly(HEMA-ran-GMA) 4G dendrimer 6 was then thiolated using
3-mercaptopropanyl N-hydroxysuccinimide ester 7, which was prepared according to a reported procedure.33 The poly(HEMA-ran-GMA) 4G 6 (Supporting Information Fig. S1) and thiolated poly(HEMA-ran-GMA) 4G dendrimer 8 products were purified and characterised using proton nuclear magnetic resonance (1H NMR), Fourier transform infrared spectroscopy (FTIR) and elemental analysis (Supporting Information Fig. S2, S3, S4 and Table S1). The 1H NMR and FTIR results confirmed the non-thiolated and thiolated polymer structure and were in agreement with the elemental analysis results, which suggests partially thiolated dendrons. Then, the one-pot synthesis of CdTe(S) QDs, using cadmium nitrate (Cd(NO3)2) and sodium hydrogen telluride (NaHTe) as precursors, and poly(HEMA-ran-GMA) 4G dendrimer, was carried out in an aqueous solution. First, Te powder was reduced using NaBH4 to form colourless NaHTe. An orange solution was obtained by adding NaHTe to a solution of Cd2+ and the thiolated dendrimer (poly(HEMA-ran-GMA) 4G-SH) in water under inert conditions. The pH of the resulting mixture was adjusted to 9 with 1 M HCl, and the mixture solution was heated to 80 °C. The fluorescence of the QDs gradually shifts from green to yellow by increasing the reaction time from 10 to 19 h. The optimal Cd:Te:SH molar ratio was 1:0.3:1 (Supporting Information Fig. S4). The resulting colloidal solution of CdTe QDs-polymer nanocomposite 9 was stable at room temperature in aqueous solution. The poly(HEMA-ran-GMA) 4G-SH dendronized polymer provided stable anchoring for the thiol groups which supported the surface of the QDs, while the hydrophilic chains facilitated water solubility and prevented aggregation of the QDs.34 Transmission electron microscopy (TEM) analysis revealed that the yellow CdTe QDs-polymer nanocomposite sample displayed good monodispersity (Fig. 1A and 1B). The highly crystalline structure of the CdTe QDs-polymer nanocomposite was confirmed by high-resolution TEM
Scheme 1. Schematic for the full synthesis of (A) poly(HEMA-ran-GMA) copolymer with thiolated fourth-generation PAMAM dendrons attached via copper catalysed azide-alkyne click reaction. (B) CdTe QD-polymer nanocomposites. Reaction conditions: (i) CuBr, bpy, ME-Br, MeOH, 80 °C, 2 h; (ii) NaN3, NH4Cl, DMF, 60 °C, 72 h; (iii) CuBr (I), PMDETA, DMF, r.t., 72 h; (iv) MeOH, 0 °C; (v) DMF, 40 °C, 24 h and (vi) Cd2+, HTe–, 80 °C.
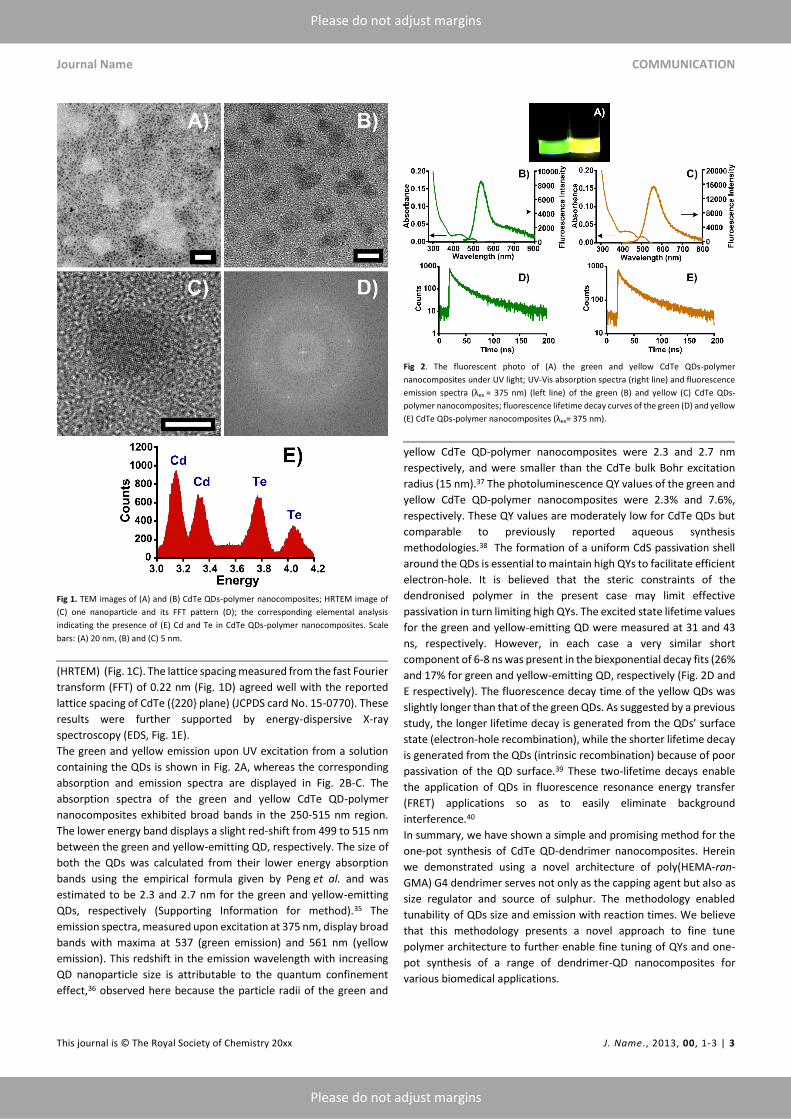
Journal Name COMMUNICATION
This journal is © The Royal Society of Chemistry 20xx J. Name., 2013, 00, 1-3 | 3
Please do not adjust margins
Please do not adjust margins
(HRTEM) (Fig. 1C). The lattice spacing measured from the fast Fourier transform (FFT) of 0.22 nm (Fig. 1D) agreed well with the reported lattice spacing of CdTe ({220} plane) (JCPDS card No. 15-0770). These results were further supported by energy-dispersive X-ray spectroscopy (EDS, Fig. 1E). The green and yellow emission upon UV excitation from a solution containing the QDs is shown in Fig. 2A, whereas the corresponding absorption and emission spectra are displayed in Fig. 2B-C. The absorption spectra of the green and yellow CdTe QD-polymer nanocomposites exhibited broad bands in the 250-515 nm region. The lower energy band displays a slight red-shift from 499 to 515 nm between the green and yellow-emitting QD, respectively. The size of both the QDs was calculated from their lower energy absorption bands using the empirical formula given by Peng et al. and was estimated to be 2.3 and 2.7 nm for the green and yellow-emitting QDs, respectively (Supporting Information for method).35 The emission spectra, measured upon excitation at 375 nm, display broad bands with maxima at 537 (green emission) and 561 nm (yellow emission). This redshift in the emission wavelength with increasing QD nanoparticle size is attributable to the quantum confinement effect,36 observed here because the particle radii of the green and
yellow CdTe QD-polymer nanocomposites were 2.3 and 2.7 nm respectively, and were smaller than the CdTe bulk Bohr excitation radius (15 nm).37 The photoluminescence QY values of the green and yellow CdTe QD-polymer nanocomposites were 2.3% and 7.6%, respectively. These QY values are moderately low for CdTe QDs but comparable to previously reported aqueous synthesis methodologies.38 The formation of a uniform CdS passivation shell around the QDs is essential to maintain high QYs to facilitate efficient electron-hole. It is believed that the steric constraints of the dendronised polymer in the present case may limit effective passivation in turn limiting high QYs. The excited state lifetime values for the green and yellow-emitting QD were measured at 31 and 43 ns, respectively. However, in each case a very similar short component of 6-8 ns was present in the biexponential decay fits (26% and 17% for green and yellow-emitting QD, respectively (Fig. 2D and E respectively). The fluorescence decay time of the yellow QDs was slightly longer than that of the green QDs. As suggested by a previous study, the longer lifetime decay is generated from the QDs’ surface state (electron-hole recombination), while the shorter lifetime decay is generated from the QDs (intrinsic recombination) because of poor passivation of the QD surface.39 These two-lifetime decays enable the application of QDs in fluorescence resonance energy transfer (FRET) applications so as to easily eliminate background interference.40 In summary, we have shown a simple and promising method for the one-pot synthesis of CdTe QD-dendrimer nanocomposites. Herein we demonstrated using a novel architecture of poly(HEMA-ran-GMA) G4 dendrimer serves not only as the capping agent but also as size regulator and source of sulphur. The methodology enabled tunability of QDs size and emission with reaction times. We believe that this methodology presents a novel approach to fine tune polymer architecture to further enable fine tuning of QYs and one-pot synthesis of a range of dendrimer-QD nanocomposites for various biomedical applications.
Fig 1. TEM images of (A) and (B) CdTe QDs-polymer nanocomposites; HRTEM image of (C) one nanoparticle and its FFT pattern (D); the corresponding elemental analysis indicating the presence of (E) Cd and Te in CdTe QDs-polymer nanocomposites. Scale bars: (A) 20 nm, (B) and (C) 5 nm.
Fig 2. The fluorescent photo of (A) the green and yellow CdTe QDs-polymer nanocomposites under UV light; UV-Vis absorption spectra (right line) and fluorescence emission spectra (λex = 375 nm) (left line) of the green (B) and yellow (C) CdTe QDs-polymer nanocomposites; fluorescence lifetime decay curves of the green (D) and yellow (E) CdTe QDs-polymer nanocomposites (λex= 375 nm).
COMMUNICATION Journal Name
4 | J. Name., 2012, 00, 1-3 This journal is © The Royal Society of Chemistry 20xx
Please do not adjust margins
Please do not adjust margins
Notes and references The authors kindly acknowledge the valuable support by the Australian Research Council (ARC).The authors also acknowledge the Australian Microscopy & Microanalysis Research Facility at the Centre for Microscopy, Characterization & Analysis, The University of Western Australia, funded by the University, State and Commonwealth Governments. A.M. Munshi would like to thank Umm Al-Qura University, Makkah, Saudi Arabia for a postgraduate scholarship. 1. W. C. W. Chan and S. Nie, Science, 1998, 281, 2016-2018. 2. M. Bruchez, M. Moronne, P. Gin, S. Weiss and A. P.
Alivisatos, Science, 1998, 281, 2013-2016. 3. X. Wu, H. Liu, J. Liu, K. N. Haley, J. A. Treadway, J. P.
Larson, N. Ge, F. Peale and M. P. Bruchez, Nat. Biotechnol., 2003, 21, 41-46.
4. W. R. Algar, A. J. Tavares and U. J. Krull, Anal. Chim. Acta, 2010, 673, 1-25.
5. S. J. Rosenthal, J. C. Chang, O. Kovtun, J. R. McBride and I. D. Tomlinson, Chemistry & Biology, 2011, 18, 10-24.
6. K. Grieve, P. Mulvaney and F. Grieser, Curr. Opin. Colloid Interface Sci., 2000, 5, 168-172.
7. I. L. Medintz, H. T. Uyeda, E. R. Goldman and H. Mattoussi, Nat. Mater., 2005, 4, 435-446.
8. P. Zrazhevskiy, M. Sena and X. Gao, Chem. Soc. Rev., 2010, 39, 4326-4354.
9. R. Freeman and I. Willner, Chem. Soc. Rev., 2012, 41, 4067-4085.
10. N. Gaponik, D. V. Talapin, A. L. Rogach, K. Hoppe, E. V. Shevchenko, A. Kornowski, A. Eychmüller and H. Weller, J. Phys. Chem. B, 2002, 106, 7177-7185.
11. H. Qian, C. Dong, J. Weng and J. Ren, Small, 2006, 2, 747-751.
12. S. F. Wuister, I. Swart, F. van Driel, S. G. Hickey and C. de Mello Donegá, Nano. Lett., 2003, 3, 503-507.
13. N. Tomczak, D. Jańczewski, M. Han and G. J. Vancso, Prog. Polym. Sci., 2009, 34, 393-430.
14. A. M. Derfus, W. C. W. Chan and S. N. Bhatia, Nano. Lett., 2004, 4, 11-18.
15. S. Kim, B. Fisher, H.-J. Eisler and M. Bawendi, J. Am.Chem. Soc., 2003, 125, 11466-11467.
16. L. Zhou, C. Gao, W. Xu, X. Wang and Y. Xu, Biomacromolecules, 2009, 10, 1865-1874.
17. S.-W. Kim, S. Kim, J. B. Tracy, A. Jasanoff and M. G. Bawendi, J. Am.Chem. Soc., 2005, 127, 4556-4557.
18. D. A. Tomalia, A. M. Naylor and W. A. Goddard, Angew. Chem. Int. Ed. Engl., 1990, 29, 138-175.
19. B. Klajnert and M. Bryszewska, Acta Biochim. Pol., 2000, 48, 199-208.
20. N. J. Wells, A. Basso and M. Bradley, J. Pept. Sci., 1998, 47, 381-396.
21. Y. Zeng, C. Tang, G. Tian, P. Yi, H. Huang, N. Hu, S. Li, H. Huang, C. Li, B. Lin, X. Yu, Y. Ling and X. Xia, Chem. Eng. J., 2010, 156, 524-527.
22. D. Astruc, E. Boisselier and C. Ornelas, Chem. Rev., 2010, 110, 1857-1959.
23. K. Esumi, H. Houdatsu and T. Yoshimura, Langmuir, 2004, 20, 2536-2538.
24. S. H. Wang, X. Shi, M. Van Antwerp, Z. Cao, S. D. Swanson, X. Bi and J. R. Baker, Adv. Funct. Mater., 2007, 17, 3043-3050.
25. N. Malik, R. Wiwattanapatapee, R. Klopsch, K. Lorenz, H. Frey, J. W. Weener, E. W. Meijer, W. Paulus and R. Duncan, J. Controlled Release, 2000, 65, 133-148.
26. J. Kretzmann, D. Ho, C. W. Evans, J. Plani-Lam, B. Garcia-Bloj, E. Mohamed, M. O'Mara, E. Ford, D. Tan, R. Lister, P. Blancafort, M. Norret and S. Iyer, Chem. Sci., 2017, DOI: 10.1039/C7SC00097A.
27. S. Ghosh and A. Saha, Nanoscale Res. Lett., 2009, 4, 937-941.
28. Y. Shi, J. Wang, S. Li, Z. Wang, X. Zang, X. Zu, X. Zhang, F. Guo and G. Tong, J. Mater. Res., 2013, 28, 1940-1946.
29. A. Priyam, S. Ghosh, S. C. Bhattacharya and A. Saha, J. Colloid Interface Sci., 2009, 333, 195-201.
30. A. C. Wisher, I. Bronstein and V. Chechik, Chem. Commun., 2006, DOI: 10.1039/B518115A, 1637-1639.
31. J. V. M. Weaver, I. Bannister, K. L. Robinson, X. Bories-Azeau, S. P. Armes, M. Smallridge and P. McKenna, Macromolecules, 2004, 37, 2395-2403.
32. S. Abraham, S. Brahim, K. Ishihara and A. Guiseppi-Elie, Biomaterials, 2005, 26, 4767-4778.
33. S. Connolly, S. N. Rao and D. Fitzmaurice, J. Phys. Chem. B, 2000, 104, 4765-4776.
34. S. F. Wuister, C. de Mello Donegá and A. Meijerink, J. Am.Chem. Soc., 2004, 126, 10397-10402.
35. W. W. Yu, L. Qu, W. Guo and X. Peng, Chem. Mat., 2003, 15, 2854-2860.
36. N. F. Borrelli, D. Hall, H. Holland and D. Smith, J. Appl. Phys., 1987, 61, 5399-5409.
37. Y. Masumoto and K. Sonobe, Phys. Rev. B, 1997, 56, 9734-9737.
38. M. Algarra, B. B. Campos, M. S. Miranda and J. C. G. E. da Silva, Talanta, 2011, 83, 1335-1340.
39. X. Wang, L. Qu, J. Zhang, X. Peng and M. Xiao, Nano. Lett., 2003, 3, 1103-1106.
40. R. M. Clegg, Curr. Opin. Chem. Biol., 1995, 6, 103-110.
Page | 87
CHAPTER 4
CONCLUSIONS AND FUTURE WORK
In this thesis, three different multifunctional nanosystems were developed to address
certain deficiencies associated with some of the current approaches. The first part of this
work was focused on the fabrication of GNR-Fe3O4 nanohybrids and their applications in
H2O2 sensing. The second part examined the effect of self-assembled Fe3O4@Au
nanoparticle chains, as formed in the presence of a magnetic field, on the conversion rate
of the A3-coupling reaction. The catalytic efficiency of Fe3O4@Au nanoparticles in the
A3-coupling reaction was also investigated. Finally, novel CdTe QD-polymer
nanocomposites were fabricated and characterised. In this chapter, a summary of these
studies, as detailed in prior publications, will be presented.
4.1 GNR-Fe3O4 hybrids in H2O2 sensing
Toward the first goal of this thesis, a nonenzymatic H2O2 sensor was developed based
on GNR-Fe3O4 nanohybrids that were fabricated according to a simple and practical
procedure. Briefly, Fe3O4 nanoparticles were synthesised via magnetic self-assembly
followed by the electrostatic coating of the surfaces of GNRs with two different aspect
ratios coated with Fe3O4 nanoparticles. The two GNR-Fe3O4 nanohybrids were
characterised by UV-vis spectrometry, TEM and EDS analyses. The electrochemical
properties of the two GNR-Fe3O4 nanohybrid GC electrodes were examined by CV
and amperometric measurement. The short GNR-Fe3O4 nanohybrids performed well
with a low detection limit, high sensitivity and good electrocatalytic activity as
compared to the long GNR-Fe3O4 nanohybrids, which was presumably attributable to
the increased surface area of the short GNR-Fe3O4 nanohybrids.
The most important conclusion from this work was that the performance of the H2O2
sensor for electrochemical detection could be controlled and enhanced by altering the
aspect ratio of the GNR and by optimising the coating of the GNR with Fe3O4
nanoparticles. This was demonstrated by the fact that monodispersed short GNR-
Fe3O4 nanohybrids with higher aspect ratios had superior electroactivity towards H2O2
Page | 88
in comparison with long polydispersed GNR-Fe3O4 nanohybrids with smaller aspect
ratios.
The possible interference by different active species – including glucose, ascorbic
acid, citric acid and ethanol – was also examined. Ascorbic acid was shown to cause
significant interference due to its high reducing ability. However, using the SIRE
method can solve this issue. Short GNR-Fe3O4 nanohybrids were found to function
with durability, stability and reproducibility for H2O2 sensing with comparable
performances to enzymatic and non-enzymatic sensors published in the literature.
Future work should include the investigation of GNR-Fe3O4 nanohybrid GC electrodes
with real samples. From this study, a new family of diverse nanohybrids of structural
hierarchy with high electrocatalytic activity and large surface area can be developed for
the highly selective, sensitive and recoverable sensing of H2O2. These improvements will
allow for vast advancements in H2O2 sensing different fields such as in pharmaceutical,
medical, environmental and food safety.
4.2 Magnetically Controlled A3-Coupling Reaction
For our second paper, we synthesised Fe3O4@Au nanocrystals and examined the effect
of self-assembled chains on the rate of the A3-coupling reaction. These nanoparticles
consisted of a Fe3O4-PEI nanoparticle core, which was decorated with Au seeds and
surface-coated with five layers of Au.
In a kinetic study with the Fe3O4@Au nanocatalysts in the absence and presence of a
magnetic field, it was found that the magnetic field directed the assembly of colloidal
Fe3O4@Au nanocatalysts in solution. This phenomenon was driven by dipole-dipole
attractions and could be used to remotely control the rate of conversion in an A3-coupling
reaction model in situ.
Two parallel A3-coupling reactions using the Fe3O4@Au (4 mol%) nanocatalysts were
studied and the presence or absence of the magnetic field during the reaction was the only
variable. In the presence of a magnetic field, linear chains of nanocatalyst were formed
and the rate of conversion of benzaldehyde to the corresponding propargylamine was
Page | 89
lowered due to the decrease in the Fe3O4@Au nanocatalyst surface area that was
accessible to the C−H alkyne. Therefore, the self-assembled Fe3O4@Au nanoparticles
chains may have a significant influence on the rate of the A3-coupling reaction and can
be applied to control the rate of the reaction remotely. Traditional parameters utilised to
slow reaction rates include reducing the reaction temperature and changing the
concentration of reactants.479 This study elucidated a new parameter that could be used to
control the rate of this heterogeneous reaction in situ.
4.3 Catalytic activity of Fe3O4@Au in A3-Coupling
Reaction
In our third paper, the catalytic activity of Fe3O4@Au nanoparticles was further studied
in the A3-coupling reaction of several aldehydes with piperidine and phenylacetylene in
toluene to produce the corresponding propargylamines. This represented the first reported
study that used Fe3O4@Au nanoparticles as a catalyst for the A3-coupling reaction and
propargylamines were formed with excellent to good conversions. Though Fe3O4@Au
nanoparticles provided a magnetically recoverable nanocatalyst that could be recycled
several times without a significant decrease in catalytic activity, a slight reduction in
catalytic activity was noticed after the fifth round due to nanocatalyst leaching.
Computational analysis with the B3LYP/6-311++G (d,p) basis set was applied to
illustrate the impact of ESP and LUMO density of the carbonyl carbon in the observed
experimental conversions of different aldehydes. However, these results indicated that
conversions of aldehydes to propargylamines have no clear correlation with ESP and
LUMO densities of carbonyl carbon in the aldehyde.
In future, such stable Fe3O4@Au nanocatalysts could be crucial for use in continuous
procedures such as the synthesis of biological and pharmaceutical intermediates.480, 481
Additionally, consideration of the shape and the size of the Fe3O4@Au nanocatalysts will
be required in future studies to establish a reasonable relation between experimental
conversions and ESP and LUMO densities. Moreover, this nanocatalyst may not just be
applied in coupling reactions that produce C-C bond but it could also be applied in carbon-
heteroatom coupling reactions to produce C-O, C-S and C-N bonds.
Page | 90
The Fe3O4 support works as an active component and stabiliser for the Au, playing an
important role in providing a practically leach-free system.3, 458 Further studies will be
necessary to optimise the catalyst synthesis and thereby completely prevent the Au from
leaching from the catalyst system. The design of a highly-functionalised surface of the
Fe3O4 support may increase the interference between Au and the Fe3O4 support catalyst.
The design and development of green, multifunctional and recyclable nanohybrid capable
to catalyse multiple reactions with high yields and efficacy would be an important step
toward advancing sustainable chemical reactions.
4.4 Synthesis of CdTe QD-polymer nanocomposites
In our fourth paper, we detailed the development of a simple approach for fabricating
CdTe QD-polymer nanocomposites in an aqueous system. Briefly, a thiolated
poly(HEMA-ran-GMA) G4 dendrimer was applied as a stabiliser, source of sulfur and a
size regulator in the QD synthesis. Green and yellow CdTe QD-polymer nanocomposites
were obtained at pH 9 by increasing the time from 10 to 19 h. The CdTe QD-polymer
nanocomposites were characterised by EDS, TEM, and UV-vis spectroscopy.
Peng’s empirical formula478 was used to determine the size of both the green (2.3 nm)
and yellow (2.7 nm) QD-polymer nanocomposites from the UV-vis absorption. Their
fluorescence properties and lifetimes were also measured. The QYs of the green and
yellow CdTe QD-polymer nanocomposites were relatively low at 2.3% and 7.6%,
respectively, which may be due to the high concentration of polymer (non-fluorescent
material) and the synthesis strategy.482
The aqueous nature of the QD-polymer nanocomposite fabrication process facilitates
their biofunctionality. Similar polymers have been shown to be non-toxic, biocompatible
and highly efficient as transfection agents.475 As such, these QD-polymer nanocomposites
have great potential to be applied as multifunctional platforms for biomedical applications
and sensing devices. However, the low QY of the CdTe QD-polymer nanocomposites
should be addressed in future optimisation.
Page | 91
Although much research has been employed to improve QD-polymer nanocomposite
fabrication, growing QDs directly on a polymer surface still poses many challenges.399
The engineering and design of QDs using dense polymers should be carefully considered
as this has a huge impact on the properties of the final product.442 More research is
necessary to develop novel, multifunctional and biocompatible QD-polymer
nanocomposites with high QY and long lifetime. This would most likely be achieved by
improving some key aspects of the QD preparation: (i) develop QD synthesis methods
with mild conditions that are inherently hydrophilic; (ii) improve the polymer coating or
passivation approaches to achieve photostability and water-solubility, and to produce
highly functional QDs; (iii) determine a simple and efficient bioconjugation method to
produce small particle sizes.
In addition, further investigation into the potential application of our CdTe QD-polymer
nanocomposites in bioimaging is required. As the poly(HEMA-ran-GMA) G4 dendrimer
has been applied in gene transfections,475 QD-polymer nanocomposites could be easily
internalised into cells which could then be observed by fluorescence.
Page | 92
4.5 Final remarks
The four objectives of the work compiled in this thesis are listed below:
1. To develop and produce electrochemical sensors with large surface areas
based on GNR-Fe3O4 hybrids tending towards H2O2 with high sensitivity
and selectivity in the presence of common interference compounds.
2. To explore the effect of the magnetic field directed self-assembly of gold-
Fe3O4@Au nanoparticles on the rate of the A3-coupling reaction.
3. To develop magnetically recoverable Au nanomaterials for use as catalysts
in the A3-coupling reaction.
4. To design and engineer multifunctional CdTe QD nanoparticles that
combine fluorescence and biocompatible properties.
The results presented in this thesis deliver evidence of having successfully achieved all
of the stated aims, represent a significant contribution towards the development of three
multifunctional nanomaterials and address some of the problems and limitations
associated with these different applications.
Most importantly, GNR-Fe3O4 nanohybrids have provided a promising platform for the
detection of H2O2 and have demonstrated excellent sensitivity, stability, selectivity and
reproducibility.
This body of work has demonstrated for the first time that self-assembled Fe3O4@Au
nanoparticle chains could be used to control the rate of the A3-coupling reaction in situ
remotely. These nanoparticles were also used for the first time as a catalyst in the A3-
coupling reaction and changes in the experimental rates of conversion among different
aldehydes were investigated with computational analysis. Furthermore, a new and facile
strategy for fabricating biocompatible and fluorescent CdTe QD-polymer
nanocomposites using thiolated poly(HEMA-ran-GMA) G4 dendrimer as the stabiliser
and sulfur source in an aqueous system has been reported.

Page | 93
The findings presented in this thesis provide a robust and essential foundation and
motivation for researchers to fabricate and enhance a variety of multifunctional
nanomaterials for use in such applications.
Page | 94
References
LIST OF REFERENCES 1. J. Lee, S. Mahendra and P. J. J. Alvarez, ACS Nano., 2010, 4, 3580-3590.
2. L. L. Chng, N. Erathodiyil and J. Y. Ying, Acc. Chem. Res, 2013, 46, 1825-1837.
3. V. Polshettiwar and R. S. Varma, Green. Chem., 2010, 12, 743-754.
4. S. Chen, R. Yuan, Y. Chai and F. Hu, Microchim. Acta., 2013, 180, 15-32.
5. K. D. Wegner and N. Hildebrandt, Chem. Soc. Rev., 2015, 44, 4792-4834.
6. C. G. Tsiafoulis, P. N. Trikalitis and M. I. Prodromidis, Electrochem. commun.,
2005, 7, 1398-1404.
7. N. A. Sitnikova, A. V. Borisova, M. A. Komkova and A. A. Karyakin, Anal.
Chem., 2011, 83, 2359-2363.
8. P. Karam and L. I. Halaoui, Anal. Chem., 2008, 80, 5441-5448.
9. N. SMIRNOFF, Ann. Bot., 1996, 78, 661-669.
10. M. I. Prodromidis and M. I. Karayannis, Electroanalysis, 2002, 14, 241-261.
11. A. G. Smith and C. J. W. Brooks, J. Steroid Biochem., 1976, 7, 705-713.
12. A. A. Karyakin, Electroanalysis, 2001, 13, 813-819.
13. B. Halliwell, M. V. Clement and L. H. Long, FEBS Letters, 2000, 486, 10-13.
14. B. Halliwell, Annu. Rev. Nutr., 1996, 16, 33-50.
15. Y. Sang, L. Zhang, Y. F. Li, L. Q. Chen, J. L. Xu and C. Z. Huang, Anal. Chim.
Acta, 2010, 659, 224-228.
16. W. Dröge and H. M. Schipper, Aging Cell, 2007, 6, 361-370.
17. I. Mori, K. Takasaki, Y. Fujita and T. Matsuo, Talanta, 1998, 47, 631-637.
18. N. Klassen, D. Marchington and H. Mcgowan, Anal. Chem., 1994, 66, 2921-2925.
19. A. M. Almuaibed and A. Townshend, Anal. Chim. Acta, 1994, 295, 159-163.
20. S. Effkemann, U. Pinkernell and U. Karst, Anal. Chim. Acta, 1998, 363, 97-103.
21. J. Wang, Biosens. Bioelectron., 2006, 21, 1887-1892.
22. H. Razmi, R. Mohammad-Rezaei and H. Heidari, Electroanalysis, 2009, 21,
2355-2362.
23. W. Chen, S. Cai, Q.-Q. Ren, W. Wen and Y.-D. Zhao, Analyst., 2012, 137, 49-58.
24. C. Batchelor-McAuley, Y. Du, G. G. Wildgoose and R. G. Compton, Sens.
Actuator B-Chem., 2008, 135, 230-235.
25. Y. Xiao, H.-X. Ju and H.-Y. Chen, Anal. Chim. Acta, 1999, 391, 73-82.
26. C. Lei and J. Deng, Anal. Chem., 1996, 68, 3344-3349.
Page | 95
27. C. Welch and R. Compton, Anal. Bioanal. Chem, 2006, 384, 601-619.
28. J. Huang, D. Wang, H. Hou and T. You, Adv. Funct. Mater., 2008, 18, 441-448.
29. H. Yin, C. Wang, H. Zhu, S. H. Overbury, S. Sun and S. Dai, Chem. Commun.,
2008, DOI: 10.1039/B807591C, 4357-4359.
30. A. Álvarez-Lueje, M. Pérez and C. Zapata, in Topics on Drug Metabolism, 2012,
DOI: 29248.
31. A. Pozio, M. De Francesco, A. Cemmi, F. Cardellini and L. Giorgi, J. Power
Sources, 2002, 105, 13-19.
32. S. Mathur, M. Singh, J. A. Salem, D. Zhu and A. C. Society, Nanostructured
Materials and Nanotechnology: Ceramic Engineering and Science Proceedings,
John Wiley & Sons, 2011, 2007.
33. C. Justin Raj, K. Prabakar, A. Dennyson Savariraj and H.-J. Kim, Electrochim.
Acta., 2013, 103, 231-236.
34. V. V. Pavlishchuk and A. W. Addison, Inorg. Chim. Acta., 2000, 298, 97-102.
35. G. A. Snook, A. S. Best, A. G. Pandolfo and A. F. Hollenkamp, Electrochem.
commun., 2006, 8, 1405-1411.
36. A. W. Hassel, K. Fushimi and M. Seo, Electrochem. commun., 1999, 1, 180-183.
37. J. Wang, Talanta, 2002, 56, 223-231.
38. C. Gao and X.-J. Huang, TrAC-Trend Analyt Chem., 2013, 51, 1-12.
39. J. Wang, Electroanalysis, 2005, 17, 1133-1140.
40. V. Vyskočil and J. Barek, Crit. Rev. Anal. Chem., 2009, 39, 173-188.
41. J. A. Rodrigues, C. M. Rodrigues, P. J. Almeida, I. M. Valente, L. M. Gonçalves,
R. G. Compton and A. A. Barros, Anal. Chim. Acta, 2011, 701, 152-156.
42. J. Stradins and I. Kravis, J. electroanal. chem. interfacial electrochem, 1975, 65,
635-649.
43. A. Economou and P. R. Fielden, Analyst., 2003, 128, 205-213.
44. P. Kissinger and W. R. Heineman, Laboratory Techniques in Electroanalytical
Chemistry, Second Edition, Revised and Expanded, Taylor & Francis, 1996.
45. I. Švancara and K. Kalcher, in Environmental Analysis by Electrochemical
Sensors and Biosensors, eds. L. M. Moretto and K. Kalcher, Springer New York,
2014, DOI: 10.1007/978-1-4939-0676-5_1, ch. 1, pp. 3-21.
46. J. Wang, Electroanalysis, 2005, 17, 1341-1346.
47. J. Wang, J. Lu, S. B. Hocevar, P. A. M. Farias and B. Ogorevc, Anal. Chem., 2000,
72, 3218-3222.
Page | 96
48. M. C. Arévalo, A. M. C. Luna, A. Arévalo and A. J. Arvia, J. Electroanal. Chem.,
1992, 330, 595-614.
49. Y. Bonfil, M. Brand and E. Kirowa-Eisner, Anal. Chim. Acta, 2000, 424, 65-76.
50. M. Brand, I. Eshkenazi and E. Kirowa-Eisner, Anal. Chem., 1997, 69, 4660-4664.
51. S. Bose, T. Kuila, A. K. Mishra, R. Rajasekar, N. H. Kim and J. H. Lee, J. Mater.
Chem., 2012, 22, 767-784.
52. K. Ravichandran and R. P. Baldwin, Anal. Chem., 1984, 56, 1744-1747.
53. F. G. Gonon, C. M. Fombarlet, M. J. Buda and J. F. Pujol, Anal. Chem., 1981, 53,
1386-1389.
54. C. G. Zoski, Handbook of Electrochemistry, Elsevier Science, Burlington, 2006.
55. G. Wang, L. Zhang and J. Zhang, Chem. Soc. Rev., 2012, 41, 797-828.
56. Y. Zhang, H. Feng, X. Wu, L. Wang, A. Zhang, T. Xia, H. Dong, X. Li and L.
Zhang, Int. J. Hydrogen Energy, 2009, 34, 4889-4899.
57. J. Wang, Anal. Chem., 1981, 53, 2280-2283.
58. C. Urbaniczky and K. Lundström, J. electroanal. chem. interfacial electrochem,
1984, 176, 169-182.
59. J. Wang, X. Cai, J. R. Fernandes, M. Ozsoz and D. H. Grant, Talanta, 1997, 45,
273-278.
60. T. E. Edmonds, E. M. Palshis and P. Rushton, Analyst., 1988, 113, 705-707.
61. R. F. Lane and A. T. Hubbard, J. Phys. Chem., 1973, 77, 1411-1421.
62. R. F. Lane and A. T. Hubbard, J. Phys. Chem., 1973, 77, 1401-1410.
63. Y.-T. Kong, M. Boopathi and Y.-B. Shim, Biosens. Bioelectron., 2003, 19, 227-
232.
64. R. N. Goyal, M. Oyama, V. K. Gupta, S. P. Singh and R. A. Sharma, Sens.
Actuator B-Chem., 2008, 134, 816-821.
65. A. R. Guadalupe and H. D. Abruna, Anal. Chem., 1985, 57, 142-149.
66. B. P. Corgier, C. A. Marquette and L. J. Blum, J. Am.Chem. Soc., 2005, 127,
18328-18332.
67. P. N. Bartlett, Bioelectrochemistry: Fundamentals, Experimental Techniques and
Applications, Wiley, 2008.
68. O. Niwa, M. Morita and H. Tabei, Anal. Chem., 1990, 62, 447-452.
69. N. J. Ronkainen-Matsuno, J. H. Thomas, H. B. Halsall and W. R. Heineman,
TrAC-Trend Analyt Chem., 2002, 21, 213-225.
Page | 97
70. M. M. Khan, S. A. Ansari, J. Lee and M. H. Cho, Mater. Sci. Eng., C, 2013, 33,
4692-4699.
71. C. H. Bamford, C. F. H. Tipper† and R. G. Compton, Electrode Kinetics:
Principles and Methodology: Principles and Methodology, Elsevier Science,
1986.
72. J. W. Gardner, P. K. Guha, F. Udrea and J. A. Covington, IEEE Sensors Journal,
2010, 10, 1833-1848.
73. N. J. Ronkainen, H. B. Halsall and W. R. Heineman, Chem. Soc. Rev., 2010, 39,
1747-1763.
74. E. A. M. F. Dahmen, Electroanalysis: Theory and Applications in Aqueous and
Non-Aqueous Media and in Automated Chemical Control, Elsevier Science, 1986.
75. D. L. Piron, H. Kohler and N. Massé, J. Electrochem. Soc, 1991, 138, 445-449.
76. P. Rameshkumar and R. Ramaraj, J. Appl. Electrochem, 2013, 43, 1005-1010.
77. F. Zhao, R. C. T. Slade and J. R. Varcoe, Chem. Soc. Rev., 2009, 38, 1926-1939.
78. D. H. Evans, K. M. O'Connell, R. A. Petersen and M. J. Kelly, J. Chem. Educ.,
1983, 60, 290.
79. Y. Han, J. Zheng and S. Dong, Electrochim. Acta., 2013, 90, 35-43.
80. L. Ramaley and M. S. Krause, Anal. Chem., 1969, 41, 1362-1365.
81. V. Mirceski, D. Guziejewski and K. Lisichkov, Electrochim. Acta., 2013, 114,
667-673.
82. J. G. Osteryoung and R. A. Osteryoung, Anal. Chem., 1985, 57, 101A-110A.
83. J. Wang, Analytical Electrochemistry, Wiley, 2006.
84. Anal. Chem., 1982, 54, 698A-705A.
85. H. Song, Y. Ni and S. Kokot, Colloids Surf., A, 2015, 465, 153-158.
86. D. Grieshaber, R. MacKenzie, J. Voeroes and E. Reimhult, Sensors, 2008, 8,
1400-1458.
87. J. R. Stetter, W. R. Penrose and S. Yao, J. Electrochem. Soc, 2003, 150, S11-S16.
88. A. Chaubey and B. D. Malhotra, Biosens. Bioelectron., 2002, 17, 441-456.
89. N. R. Stradiotto, H. Yamanaka and M. V. B. Zanoni, J. Braz. Chem. Soc., 2003,
14, 159-173.
90. D. G. Buerk, Biosensors: Theory and Applications, Taylor & Francis, 1995.
91. G. Hanrahan, D. G. Patil and J. Wang, J. Environ. Monit., 2004, 6, 657-664.
92. O. Farghaly, R. A. Hameed and A.-A. H. Abu-Nawwas, Int. J. Electrochem. Sci,
2014, 9, 3287-3318.
Page | 98
93. C. M. Domínguez, A. Quintanilla, P. Ocón, J. A. Casas and J. J. Rodriguez,
Carbon, 2013, 60, 76-83.
94. Q. Lu and C. M. Li, Biosens. Bioelectron., 2008, 24, 767-772.
95. C. Xiang, Y. Zou, L.-X. Sun and F. Xu, Sens. Actuator B-Chem., 2009, 136, 158-
162.
96. X. Xu, J. Zhao, D. Jiang, J. Kong, B. Liu and J. Deng, Anal. Bioanal. Chem., 2002,
374, 1261-1266.
97. W. Wang, T.-J. Zhang, D.-W. Zhang, H.-Y. Li, Y.-R. Ma, L.-M. Qi, Y.-L. Zhou
and X.-X. Zhang, Talanta, 2011, 84, 71-77.
98. S. Tan, X. Tan, J. Xu, D. Zhao, J. Zhang and L. Liu, Anal. Methods., 2011, 3, 110-
115.
99. E. Koposova, G. Shumilova, Y. Ermolenko, A. Kisner, A. Offenhäusser and Y.
Mourzina, Sens. Actuator B-Chem., 2015, 207, Part B, 1045-1052.
100. L. Gorton, A. Lindgren, T. Larsson, F. D. Munteanu, T. Ruzgas and I. Gazaryan,
Anal. Chim. Acta, 1999, 400, 91-108.
101. L. Gorton, Electroanalysis, 1995, 7, 23-45.
102. J.-J. Feng, J.-J. Xu and H.-Y. Chen, Biosens. Bioelectron., 2007, 22, 1618-1624.
103. A. Zhu, Y. Tian, H. Liu and Y. Luo, Biomaterials, 2009, 30, 3183-3188.
104. R. Yan, F. Zhao, J. Li, F. Xiao, S. Fan and B. Zeng, Electrochim. Acta., 2007, 52,
7425-7431.
105. X. Shangguan, J. Zheng and Q. Sheng, Electroanalysis, 2009, 21, 1469-1474.
106. J. Xu, F. Shang, J. H. T. Luong, K. M. Razeeb and J. D. Glennon, Biosens.
Bioelectron., 2010, 25, 1313-1318.
107. J. Di, M. Zhang, K. Yao and S. Bi, Biosens. Bioelectron., 2006, 22, 247-252.
108. J. Wang, Microchim. Acta., 2012, 177, 245-270.
109. J. Xuan, X.-d. Jia, L.-P. Jiang, E. S. Abdel-Halim and J.-J. Zhu,
Bioelectrochemistry, 2012, 84, 32-37.
110. Y. Wang, X. Ma, Y. Wen, Y. Xing, Z. Zhang and H. Yang, Biosens. Bioelectron.,
2010, 25, 2442-2446.
111. M. Mathew and N. Sandhyarani, Biosens. Bioelectron., 2011, 28, 210-215.
112. F. Li, Y. Feng, Z. Wang, L. Yang, L. Zhuo and B. Tang, Biosens. Bioelectron.,
2010, 25, 2244-2248.
113. J.-D. Qiu, H.-P. Peng, R.-P. Liang and X.-H. Xia, Biosens. Bioelectron., 2010, 25,
1447-1453.
Page | 99
114. C.-M. Yu, J.-W. Guo and H.-Y. Gu, Microchim. Acta., 2009, 166, 215-220.
115. Y. Wang, X. Chen and J.-J. Zhu, Electrochem. commun., 2009, 11, 323-326.
116. A. Yarman, T. Nagel, N. Gajovic‐Eichelmann, A. Fischer, U. Wollenberger and
F. W. Scheller, Electroanalysis, 2011, 23, 611-618.
117. X. Zhao, Z. Mai, X. Kang and X. Zou, Biosens. Bioelectron., 2008, 23, 1032-
1038.
118. K.-J. Huang, D.-J. Niu, X. Liu, Z.-W. Wu, Y. Fan, Y.-F. Chang and Y.-Y. Wu,
Electrochim. Acta., 2011, 56, 2947-2953.
119. M.-Q. Xu, J.-F. Wu and G.-C. Zhao, Sensors, 2013, 13, 7492-7504.
120. H. Qi, C. Zhang and X. Li, Sens. Actuator B-Chem., 2006, 114, 364-370.
121. W. Yan, X. Feng, X. Chen, W. Hou and J.-J. Zhu, Biosens. Bioelectron., 2008,
23, 925-931.
122. W.-L. Zhu, Y. Wang, J. Xuan and J.-R. Zhang, J. Nanosci. Nanotechnol., 2011,
11, 138-142.
123. X. Feng, Y. Cheng, C. Ye, J. Ye, J. Peng and J. Hu, Mater Lett., 2012, 79, 205-
208.
124. Y. Li, Y. Li and Y. Yang, Bioelectrochemistry, 2011, 82, 112-116.
125. M. ElKaoutit, A. H. Naggar, I. Naranjo-Rodríguez and J. L. H.-H. de
Cisneros, Colloids Surf., B, 2012, 92, 42-49.
126. Y. Wang, M. Tang, X. Lin, F. Gao and M. Li, Microchim. Acta., 2012, 176, 405-
410.
127. X.-C. Tan, J.-L. Zhang, S.-W. Tan, D.-D. Zhao, Z.-W. Huang, Y. Mi and Z.-Y.
Huang, Sensors, 2009, 9, 6185-6199.
128. L. Qian and X. Yang, Talanta, 2006, 68, 721-727.
129. Y. Liu, J. Zhang, W. Hou and J.-J. Zhu, Nanotechnology, 2008, 19, 135707.
130. A. Sun, Q. Sheng and J. Zheng, Appl. Biochem. Biotechnol., 2012, 166, 764-773.
131. C. Wei, M. Yang, J. Hu and Q. Li, Anal. Lett., 2007, 40, 3182-3194.
132. Q. Lu, X. Dong, L.-J. Li and X. Hu, Talanta, 2010, 82, 1344-1348.
133. Y. Zhang, R. Yuan, Y. Chai, Y. Xiang, C. Hong and X. Ran, Biochem. Eng. J.,
2010, 51, 102-109.
134. C. Guo, F. Hu, C. M. Li and P. K. Shen, Biosensors & bioelectronics, 2008, 24,
825-830.
135. Q. Xu, J.-H. Wang, Z. Wang, H.-Q. Wang, Q. Yang and Y.-D. Zhao, Anal. Lett.,
2009, 42, 2496-2508.
Page | 100
136. H.-P. Peng, R.-P. Liang and J.-D. Qiu, Biosens. Bioelectron., 2011, 26, 3005-
3011.
137. J. Xu, C. Liu and Y. Teng, Microchim. Acta., 2010, 169, 181-186.
138. S. Zong, Y. Cao, Y. Zhou and H. Ju, Anal. Chim. Acta., 2007, 582, 361-366.
139. X. Wang, T. Yang, Y. Feng, K. Jiao and G. Li, Electroanalysis, 2009, 21, 819-
825.
140. Y.-M. Li, X.-T. Chen, J. Li and H.-H. Liu, Electrochim. Acta., 2004, 49, 3195-
3200.
141. Y. Wu, Q. Shen and S. Hu, Anal. Chim. Acta, 2006, 558, 179-186.
142. S.-F. Wang, T. Chen, Z.-L. Zhang, D.-W. Pang and K.-Y. Wong, Electrochem.
commun., 2007, 9, 1709-1714.
143. X.-Q. Lin, J. Chen and Z.-H. Chen, Electroanalysis, 2000, 12, 306-310.
144. B. Wang and S. Dong, Talanta, 2000, 51, 565-572.
145. G. Wang, J.-J. Xu, H.-Y. Chen and Z.-H. Lu, Biosens. Bioelectron., 2003, 18, 335-
343.
146. Y. Nakabayashi and H. Yoshikawa, Anal. Sci., 2000, 16, 609-613.
147. Q. Gao, F. Yang, Y. Ma and X. Yang, Electroanalysis, 2004, 16, 730-735.
148. H. L. Zhang, G. S. Lai, D. Y. Han and A. M. Yu, Anal. Bioanal. Chem., 2008,
390, 971-977.
149. B. Wang, J. Zhang, G. Cheng and S. Dong, Anal. Chim. Acta, 2000, 407, 111-
118.
150. S. Chen, R. Yuan, Y. Chai, L. Xu, N. Wang, X. Li and L. Zhang, Electroanalysis,
2006, 18, 471-477.
151. C. X. Li, K. Q. Deng, G. L. Shen and R. Q. Yu, Anal. Sci., 2004, 20, 1277-1281.
152. C. X. Lei, S. Q. Hu, N. Gao, G. L. Shen and R. Q. Yu, Bioelectrochemistry, 2004,
65, 33-39.
153. X. Tan, J. Zhang, S. Tan, D. Zhao, Z. Huang, Y. Mi and Z. Huang,
Electroanalysis, 2009, 21, 1514-1520.
154. G.-S. Lai, H.-L. Zhang and D.-Y. Han, Sens. Actuator B-Chem., 2008, 129, 497-
503.
155. S. Li, X. Zhu, W. Zhang, G. Xie and W. Feng, Appl. Surf. Sci., 2012, 258, 2802-
2807.
156. A. Saleh Ahammad, J. Biosens. Bioelectron., 2013, 9, 2.
Page | 101
157. V. S. Tripathi, V. B. Kandimalla and H. Ju, Biosens. Bioelectron., 2006, 21, 1529-
1535.
158. J.-Z. Xu, J.-J. Zhu, Q. Wu, Z. Hu and H.-Y. Chen, Electroanalysis, 2003, 15, 219-
224.
159. Y. Liu, J. Lei and H. Ju, Talanta, 2008, 74, 965-970.
160. X. Liu, L. Luo, Y. Ding, Y. Xu and F. Li, J. Solid State Electrochem., 2011, 15,
447-453.
161. L. Luo, L. Zhu, Y. Xu, L. Shen, X. Wang, Y. Ding, Q. Li and D. Deng, Microchim.
Acta., 2011, 174, 55-61.
162. L. Lu, L. Zhang, X. Zhang, Z. Wu, S. Huan, G. Shen and R. Yu, Electroanalysis,
2010, 22, 471-477.
163. A. K. M. Kafi, G. Wu and A. Chen, Biosens. Bioelectron., 2008, 24, 566-571.
164. H. Yao, N. Li, S. Xu, J.-Z. Xu, J.-J. Zhu and H.-Y. Chen, Biosens. Bioelectron.,
2005, 21, 372-377.
165. Z. Yang, X. Zong, Z. Ye, B. Zhao, Q. Wang and P. Wang, Biomaterials, 2010,
31, 7534-7541.
166. S. Chen, R. Yuan, Y. Chai, L. Zhang, N. Wang and X. Li, Biosens. Bioelectron.,
2007, 22, 1268-1274.
167. A. A. Karyakin, E. E. Karyakina and L. Gorton, Anal. Chem., 2000, 72, 1720-
1723.
168. R. Garjonyte and A. Malinauskas, Sens. Actuator B-Chem., 1999, 56, 93-97.
169. A. Eftekhari, Talanta, 2001, 55, 395-402.
170. M. Shan Lin and T. Feng Tseng, Analyst., 1998, 123, 159-163.
171. F. Tian, E. Llaudet and N. Dale, Anal. Chem., 2007, 79, 6760-6766.
172. J.-M. Zen, A. S. Kumar and C.-R. Chung, Anal. Chem., 2003, 75, 2703-2709.
173. C.-X. Cai, K.-H. Xue, Y.-M. Zhou and H. Yang, Talanta, 1997, 44, 339-347.
174. M. S. Lin, Y. C. Wu and B. I. Jan, Biotechnology and bioengineering, 1999, 62,
56-61.
175. A. A. Karyakin, E. E. Karyakina and L. Gorton, Talanta, 1996, 43, 1597-1606.
176. Z. Li, J. Chen, W. Li, K. Chen, L. Nie and S. Yao, J. Electroanal. Chem., 2007,
603, 59-66.
177. D. Du, M. Wang, Y. Qin and Y. Lin, J. Mater. Chem., 2010, 20, 1532-1537.
178. J. Li, J. D. Qiu, J. J. Xu, H. Y. Chen and X. H. Xia, Adv. Funct. Mater., 2007, 17,
1574-1580.
Page | 102
179. W. Zhang, L. Wang, N. Zhang, G. Wang and B. Fang, Electroanalysis, 2009, 21,
2325-2330.
180. J. Zhai, Y. Zhai, D. Wen and S. Dong, Electroanalysis, 2009, 21, 2207-2212.
181. G. P. Keeley, A. O'Neill, M. Holzinger, S. Cosnier, J. N. Coleman and G. S.
Duesberg, TECHNOLOGY, 2013, 01, 58-62.
182. Y. Zhang, X. Sun, L. Zhu, H. Shen and N. Jia, Electrochim. Acta., 2011, 56, 1239-
1245.
183. S.-Q. Liu, J.-J. Xu and H.-Y. Chen, Electrochem. commun., 2002, 4, 421-425.
184. L. Cao, Y. Liu, B. Zhang and L. Lu, ACS Appl. Mater. Interfaces, 2010, 2, 2339-
2346.
185. W. Zhao, J.-J. Xu, C.-G. Shi and H.-Y. Chen, Langmuir, 2005, 21, 9630-9634.
186. U. Scharf and E. W. Grabner, Electrochim. Acta., 1996, 41, 233-239.
187. R. Koncki, Crit. Rev. Anal. Chem., 2002, 32, 79-96.
188. J. Bácskai, K. Martinusz, E. Czirók, G. Inzelt, P. J. Kulesza and M. A. Malik, J.
Electroanal. Chem., 1995, 385, 241-248.
189. M. A. Malik, K. Miecznikowski and P. J. Kulesza, Electrochim. Acta., 2000, 45,
3777-3784.
190. S. Sinha, B. D. Humphrey and A. B. Bocarsly, Inorg. Chem., 1984, 23, 203-212.
191. J. Wang, G. Liu and M. R. Jan, J. Am.Chem. Soc., 2004, 126, 3010-3011.
192. F. Patolsky, Y. Weizmann and I. Willner, Angew. Chem. Int. Ed., 2004, 43, 2113-
2117.
193. J. Wang, M. Musameh and Y. Lin, J. Am.Chem. Soc., 2003, 125, 2408-2409.
194. J. Wang and M. Musameh, Anal. Chem., 2003, 75, 2075-2079.
195. K. M. Manesh, H. T. Kim, P. Santhosh, A. I. Gopalan and K.-P. Lee, Biosens.
Bioelectron., 2008, 23, 771-779.
196. R. T. Kachoosangi, M. M. Musameh, I. Abu-Yousef, J. M. Yousef, S. M. Kanan,
L. Xiao, S. G. Davies, A. Russell and R. G. Compton, Anal. Chem., 2009, 81, 435-
442.
197. P. Santhosh, K. M. Manesh, A. Gopalan and K.-P. Lee, Anal. Chim. Acta, 2006,
575, 32-38.
198. F. Qu, M. Yang, J. Jiang, G. Shen and R. Yu, Anal. Biochem., 2005, 344, 108-
114.
199. J. Tkac and T. Ruzgas, Electrochem. commun., 2006, 8, 899-903.
Page | 103
200. B. Fang, N. Zhang, W. Zhang, A. Gu and G. Wang, J. Appl. Polym. Sci., 2009,
112, 3488-3493.
201. S. Qu, J. Wang, J. Kong, P. Yang and G. Chen, Talanta, 2007, 71, 1096-1102.
202. M. a. D. Rubianes and G. A. Rivas, Electrochem. commun., 2003, 5, 689-694.
203. Y.-C. Tsai, S.-C. Li and S.-W. Liao, Biosens. Bioelectron., 2006, 22, 495-500.
204. M. D. Rubianes and G. A. Rivas, Electrochem. commun., 2007, 9, 480-484.
205. K.-C. Lin, T.-H. Tsai and S.-M. Chen, Biosens. Bioelectron., 2010, 26, 608-614.
206. Y.-C. Tsai and J.-D. Huang, J. Nanosci. Nanotechnol., 2007, 7, 3227-3232.
207. X. Xu, S. Jiang, Z. Hu and S. Liu, ACS Nano., 2010, 4, 4292-4298.
208. Y. Shao, J. Wang, H. Wu, J. Liu, I. A. Aksay and Y. Lin, Electroanalysis, 2010,
22, 1027-1036.
209. M. Segal, Nat Nano, 2009, 4, 612-614.
210. X.-m. Chen, G.-h. Wu, Y.-q. Jiang, Y.-r. Wang and X. Chen, Analyst., 2011, 136,
4631-4640.
211. M. Zhou, Y. Zhai and S. Dong, Anal. Chem., 2009, 81, 5603-5613.
212. X.-m. Chen, Z.-x. Cai, Z.-y. Huang, M. Oyama, Y.-q. Jiang and X. Chen,
Electrochim. Acta., 2013, 97, 398-403.
213. L. Zhong, S. Gan, X. Fu, F. Li, D. Han, L. Guo and L. Niu, Electrochim. Acta.,
2013, 89, 222-228.
214. F. Xiao, Y. Li, X. Zan, K. Liao, R. Xu and H. Duan, Adv. Funct. Mater., 2012,
22, 2487-2494.
215. K. J. Babu, A. Zahoor, K. S. Nahm, R. Ramachandran and M. J. Rajan, J.
Nanopart. Res., 2014, 16, 1-10.
216. C. E. Banks, T. J. Davies, G. G. Wildgoose and R. G. Compton, Chem. Commun.,
2005, DOI: 10.1039/B413177K, 829-841.
217. C. E. Banks and R. G. Compton, Analyst., 2005, 130, 1232-1239.
218. S. Woo, Y.-R. Kim, T. D. Chung, Y. Piao and H. Kim, Electrochim. Acta., 2012,
59, 509-514.
219. J. Lu, I. Do, L. T. Drzal, R. M. Worden and I. Lee, ACS Nano., 2008, 2, 1825-
1832.
220. S. Hrapovic, Y. Liu, K. B. Male and J. H. T. Luong, Anal. Chem., 2004, 76, 1083-
1088.
221. M. C. Rodriguez and G. A. Rivas, Anal. Lett., 2000, 33, 2373-2389.
Page | 104
222. J.-M. You, D. Kim, S. K. Kim, M.-S. Kim, H. S. Han and S. Jeon, Sens. Actuator
B-Chem., 2013, 178, 450-457.
223. L. Wang, S. Ma, B. Yang, W. Cao and X. Han, Chem. Eng. J., 2015.
224. G. Maduraiveeran and R. Ramaraj, J. Electroanal. Chem., 2007, 608, 52-58.
225. X. Li, X. Liu, W. Wang, L. Li and X. Lu, Biosens. Bioelectron., 2014, 59, 221-
226.
226. G. A. Rivas and B. Maestroni, Anal. Lett., 1997, 30, 489-501.
227. Y.-H. Won, K. Huh and L. A. Stanciu, Biosens. Bioelectron., 2011, 26, 4514-
4519.
228. S. Guo, D. Wen, S. Dong and E. Wang, Talanta, 2009, 77, 1510-1517.
229. Y. Zhang, Y. Sun, Z. Liu, F. Xu, K. Cui, Y. Shi, Z. Wen and Z. Li, J. Electroanal.
Chem., 2011, 656, 23-28.
230. F. Meng, X. Yan, J. Liu, J. Gu and Z. Zou, Electrochim. Acta., 2011, 56, 4657-
4662.
231. X. Wang and X. Zhang, Electrochim. Acta., 2013, 112, 774-782.
232. Z.-M. Liu, Y. Yang, H. Wang, Y.-L. Liu, G.-L. Shen and R.-Q. Yu, Sens. Actuator
B-Chem., 2005, 106, 394-400.
233. H. Rajabzade, P. Daneshgar, E. Tazikeh and R. Z. Mehrabian, J. Chem., 2012, 9,
2540-2549.
234. M.-P. N. Bui, X.-H. Pham, K. N. Han, C. A. Li, Y. S. Kim and G. H. Seong, Sens.
Actuator B-Chem., 2010, 150, 436-441.
235. L. Wang, H. Zhu, Y. Song, L. Liu, Z. He, L. Wan, S. Chen, Y. Xiang, S. Chen
and J. Chen, Electrochim. Acta., 2012, 60, 314-320.
236. L. Wang, H. Zhu, H. Hou, Z. Zhang, X. Xiao and Y. Song, J. Solid State
Electrochem., 2012, 16, 1693-1700.
237. Q. Wang and J. Zheng, Microchim. Acta., 2010, 169, 361-365.
238. S. Liu, J. Tian, L. Wang, H. Li, Y. Zhang and X. Sun, Macromolecules, 2010, 43,
10078-10083.
239. W. Zhao, H. Wang, X. Qin, X. Wang, Z. Zhao, Z. Miao, L. Chen, M. Shan, Y.
Fang and Q. Chen, Talanta, 2009, 80, 1029-1033.
240. X. Qin, W. Lu, Y. Luo, G. Chang and X. Sun, Electrochem. commun., 2011, 13,
785-787.
241. B. Habibi, M. Jahanbakhshi and M. Pournaghi-Azar, Microchim. Acta., 2012,
177, 185-193.
Page | 105
242. C.-Y. Lin, Y.-H. Lai, A. Balamurugan, R. Vittal, C.-W. Lin and K.-C. Ho,
Talanta, 2010, 82, 340-347.
243. X. Zhai and Z. Gao, Anal. Sci., 2010, 26, 343-347.
244. S. Liu, J. Tian, L. Wang and X. Sun, J. Nanopart. Res., 2011, 13, 4539-4548.
245. V. K. Shukla, R. S. Yadav, P. Yadav and A. C. Pandey, J. Hazard. Mater., 2012,
213–214, 161-166.
246. R. S. Dey and C. R. Raj, J. Phys. Chem. C, 2010, 114, 21427-21433.
247. Y. Liu, D. Wang, L. Xu, H. Hou and T. You, Biosens. Bioelectron., 2011, 26,
4585-4590.
248. J. Li, R. Yuan, Y. Chai, T. Zhang and X. Che, Microchim. Acta., 2010, 171, 125-
131.
249. H. Zhong, R. Yuan, Y. Chai, Y. Zhang, C. Wang and F. Jia, Microchim. Acta.,
2012, 176, 389-395.
250. J.-H. Han, H. Boo, S. Park and T. D. Chung, Electrochim. Acta., 2006, 52, 1788-
1791.
251. Y. Fang, D. Zhang, X. Qin, Z. Miao, S. Takahashi, J.-i. Anzai and Q. Chen,
Electrochim. Acta., 2012, 70, 266-271.
252. S. Guo, D. Wen, Y. Zhai, S. Dong and E. Wang, ACS Nano., 2010, 4, 3959-3968.
253. T. You, O. Niwa, M. Tomita and S. Hirono, Anal. Chem., 2003, 75, 2080-2085.
254. F. Xu, Y. Sun, Y. Zhang, Y. Shi, Z. Wen and Z. Li, Electrochem. commun., 2011,
13, 1131-1134.
255. K.-J. Chen, K. C. Pillai, J. Rick, C.-J. Pan, S.-H. Wang, C.-C. Liu and B.-J.
Hwang, Biosens. Bioelectron., 2012, 33, 120-127.
256. Y. Yu, Q. Sun, X. Liu, H. Wu, T. Zhou and G. Shi, Chem. Eur. J., 2011, 17,
11314-11323.
257. K.-J. Chen, C.-F. Lee, J. Rick, S.-H. Wang, C.-C. Liu and B.-J. Hwang, Biosens.
Bioelectron., 2012, 33, 75-81.
258. X. Feng, X. Li, H. Shi, H. Huang, X. Wu and W. Song, Anal. Chim. Acta, 2014,
852, 37-44.
259. T.-H. Tsai, S. Thiagarajan and S.-M. Chen, J. Appl. Electrochem, 2010, 40, 2071-
2076.
260. L. Wang, F. Wang, L. Shang, C. Zhu, W. Ren and S. Dong, Talanta, 2010, 82,
113-117.
Page | 106
261. Y. Zhou, G. Yu, F. Chang, B. Hu and C.-J. Zhong, Anal. Chim. Acta, 2012, 757,
56-62.
262. J. Wang, H. Gao, F. Sun and C. Xu, Sens. Actuator B-Chem., 2014, 191, 612-618.
263. Y. Li, Q. Lu, S. Wu, L. Wang and X. Shi, Biosens. Bioelectron., 2013, 41, 576-
581.
264. X. Niu, C. Chen, H. Zhao, Y. Chai and M. Lan, Biosens. Bioelectron., 2012, 36,
262-266.
265. A. Liu, H. Geng, C. Xu and H. Qiu, Anal. Chim. Acta, 2011, 703, 172-178.
266. C. Xu, Y. Liu, F. Su, A. Liu and H. Qiu, Biosens. Bioelectron., 2011, 27, 160-166.
267. H. Wang, X. Bo, J. Bai, L. Wang and L. Guo, J. Electroanal. Chem., 2011, 662,
281-287.
268. M. Rajkumar, S. Thiagarajan and S.-M. Chen, J. Appl. Electrochem, 2011, 41,
663-668.
269. S.-I. Cheng, J. Rick, C.-J. Pan, H.-L. Chou, W.-N. Su, K.-J. Chen, C.-C. Liu, Y.-
W. Yang, C.-H. Wang and B.-J. Hwang, Biosensors, 2014, 4, 461-471.
270. J. H. Shim, Y. Lee, M. Kang, J. Lee, J. M. Baik, Y. Lee, C. Lee and M. H. Kim,
Anal. Chem., 2012, 84, 3827-3832.
271. C. Karuppiah, S. Palanisamy, S.-M. Chen, V. Veeramani and P. Periakaruppan,
Sens. Actuator B-Chem., 2014, 196, 450-456.
272. B.-B. Jiang, X.-W. Wei, F.-H. Wu, K.-L. Wu, L. Chen, G.-Z. Yuan, C. Dong and
Y. Ye, Microchim. Acta., 2014, 181, 1463-1470.
273. M.-Y. Wang, T. Shen, M. Wang, D.-E. Zhang, Z.-w. Tong and J. Chen, Sens.
Actuator B-Chem., 2014, 190, 645-650.
274. W. Wang, Y. Xie, C. Xia, H. Du and F. Tian, Microchim. Acta., 2014, 181, 1325-
1331.
275. X. Liu, H. Zhu and X. Yang, Talanta, 2011, 87, 243-248.
276. M. S. Lin and H. J. Leu, Electroanalysis, 2005, 17, 2068-2073.
277. H. Fang, Y. Pan, W. Shan, M. Guo, Z. Nie, Y. Huang and S. Yao, Anal. Methods.,
2014, 6, 6073-6081.
278. J. Li, in Name Reactions, Springer International Publishing, 2014, DOI:
10.1007/978-3-319-03979-4_157, ch. 157, pp. 364-366.
279. L. Chen and C.-J. Li, Adv. Synth. Catal., 2006, 348, 1459-1484.
280. A. A. Boulton, B. A. Davis, D. A. Durden, L. E. Dyck, A. V. Juorio, X.-M. Li, I.
A. Paterson and P. H. Yu, Drug Dev. Res., 1997, 42, 150-156.
Page | 107
281. L. Zani and C. Bolm, Chem. Commun., 2006, DOI: 10.1039/B607986P, 4263-
4275.
282. T. Murai, Y. Mutoh, Y. Ohta and M. Murakami, J. Am.Chem. Soc., 2004, 126,
5968-5969.
283. J. Dulle, K. Thirunavukkarasu, M. C. Mittelmeijer-Hazeleger, D. V. Andreeva, N.
R. Shiju and G. Rothenberg, Green. Chem., 2013, 15, 1238-1243.
284. J. Guermont, Bull. Soc. Chim. Fr., 1953, 20, 386-390.
285. Y. Liu, Arkivoc, 2014, 1, 1-20.
286. V. A. Peshkov, O. P. Pereshivko and E. V. Van der Eycken, Chem. Soc. Rev.,
2012, 41, 3790-3807.
287. X. Yao and C.-J. Li, Org. Lett., 2005, 7, 4395-4398.
288. V. K.-Y. Lo, Y. Liu, M.-K. Wong and C.-M. Che, Org. Lett., 2006, 8, 1529-1532.
289. N. Gommermann and P. Knochel, Chem. Eur. J., 2006, 12, 4380-4392.
290. P. Li, Y. Zhang and L. Wang, Chem. Eur. J., 2009, 15, 2045-2049.
291. M. B. Gawande, Y. Monga, R. Zboril and R. K. Sharma, Coord. Chem. Rev.,
2015, 288, 118-143.
292. R. Dodda and C.-G. Zhao, Org. Lett., 2007, 9, 165-167.
293. J.-X. Ji, T. T. L. Au-Yeung, J. Wu, C. W. Yip and A. S. C. Chan, Adv. Synth.
Catal., 2004, 346, 42-44.
294. C.-J. Li and C. Wei, Chem. Commun., 2002, DOI: 10.1039/B108851N, 268-269.
295. J. B. Bariwal, D. S. Ermolat'ev and E. V. Van der Eycken, Chem. Eur. J., 2010,
16, 3281-3284.
296. T. T. T. Trang, D. S. Ermolat'ev and E. V. Van der Eycken, RSC Advances, 2015,
5, 28921-28924.
297. W. J. Yoo, L. Zhao and C. J. Li, ChemInform, 2012, 43.
298. J. J. McNally, M. A. Youngman and S. L. Dax, Tetrahedron Lett., 1998, 39, 967-
970.
299. A. B. Dyatkin and R. A. Rivero, Tetrahedron Lett., 1998, 39, 3647-3650.
300. L. Shi, Y.-Q. Tu, M. Wang, F.-M. Zhang and C.-A. Fan, Org. Lett., 2004, 6, 1001-
1003.
301. Y. Ju, C.-J. Li and R. S. Varma, QSAR.Comb. Sci., 2004, 23, 891-894.
302. N. Leadbeater, H. Torenius and H. Tye, Mol. Divers., 2003, 7, 135-144.
303. S. B. Park and H. Alper, Chem. Commun., 2005, DOI: 10.1039/B416268D, 1315-
1317.
Page | 108
304. P. Li and L. Wang, Tetrahedron, 2007, 63, 5455-5459.
305. B. Sreedhar, P. Surendra Reddy, C. S. Vamsi Krishna and P. Vijaya Babu,
Tetrahedron Lett., 2007, 48, 7882-7886.
306. M. Wang, P. Li and L. Wang, Eur. J. Org. Chem., 2008, 2008, 2255-2261.
307. M. Srinivas, P. Srinivasu, S. K. Bhargava and M. L. Kantam, Catal. Today., 2013,
208, 66-71.
308. A. Fodor, A. Kiss, N. Debreczeni, Z. Hell and I. Gresits, Org. Biomol. Chem.,
2010, 8, 4575-4581.
309. P. Li, S. Regati, H.-C. Huang, H. D. Arman, B.-L. Chen and J. C. G. Zhao, Chin.
Chem. Lett., 2015, 26, 6-10.
310. Z. L. Palchak, D. J. Lussier, C. J. Pierce and C. H. Larsen, Green. Chem., 2015,
17, 1802-1810.
311. C. E. Meyet, C. J. Pierce and C. H. Larsen, Org. Lett., 2012, 14, 964-967.
312. S. V. Katkar and R. V. Jayaram, RSC Advances, 2014, 4, 47958-47964.
313. C. Wei, Z. Li and C.-J. Li, Org. Lett., 2003, 5, 4473-4475.
314. K. Mohan Reddy, N. Seshu Babu, I. Suryanarayana, P. S. Sai Prasad and N.
Lingaiah, Tetrahedron Lett., 2006, 47, 7563-7566.
315. B. Huang, X. Yao and C.-J. Li, Adv. Synth. Catal., 2006, 348, 1528-1532.
316. R. Maggi, A. Bello, C. Oro, G. Sartori and L. Soldi, Tetrahedron, 2008, 64, 1435-
1439.
317. Y. Zhang, A. M. Santos, E. Herdtweck, J. Mink and F. E. Kuhn, New J. Chem.,
2005, 29, 366-370.
318. Y. Zhao, X. Zhou, T.-a. Okamura, M. Chen, Y. Lu, W.-Y. Sun and J.-Q. Yu,
Dalton. Trans., 2012, 41, 5889-5896.
319. Y. Li, X. Chen, Y. Song, L. Fang and G. Zou, Dalton Trans, 2011, 40, 2046-2052.
320. M.-T. Chen, B. Landers and O. Navarro, Org. Biomol. Chem., 2012, 10, 2206-
2208.
321. C.-H. Cheng, D.-F. Chen, H.-B. Song and L.-F. Tang, J. Organomet. Chem., 2013,
726, 1-8.
322. G. Abbiati and E. Rossi, Beilstein J. Org. Chem., 2014, 10, 481-513.
323. O. Prakash, H. Joshi, U. Kumar, A. K. Sharma and A. K. Singh, Dalton. Trans.,
2015, 44, 1962-1968.
324. C. Wei and C.-J. Li, J. Am.Chem. Soc., 2003, 125, 9584-9585.
325. S. Freakley, Q. He, C. Kiely and G. Hutchings, Catal. Lett., 2015, 145, 71-79.
Page | 109
326. V. K. Lo, Y. Liu, M. K. Wong and C. M. Che, Org. Lett., 2006, 8, 1529-1532.
327. V. K.-Y. Lo, K. K.-Y. Kung, M.-K. Wong and C.-M. Che, J. Organomet. Chem.,
2009, 694, 583-591.
328. M. L. Kantam, B. V. Prakash, C. R. V. Reddy and B. Sreedhar, Synlett, 2005,
2005, 2329-2332.
329. G. Villaverde, A. Corma, M. Iglesias and F. Sánchez, ACS Catal., 2012, 2, 399-
406.
330. C. Wetzel, P. C. Kunz, I. Thiel and B. Spingler, Inorg. Chem., 2011, 50, 7863-
7870.
331. S. Shabbir, Y. Lee and H. Rhee, J. Catal., 2015, 322, 104-108.
332. B. D. Sherry and A. Fürstner, Acc. Chem. Res, 2008, 41, 1500-1511.
333. C. Bolm, J. Legros, J. Le Paih and L. Zani, Chem. Rev., 2004, 104, 6217-6254.
334. A. Correa, O. Garcia Mancheno and C. Bolm, Chem. Soc. Rev., 2008, 37, 1108-
1117.
335. W.-W. Chen, R. V. Nguyen and C.-J. Li, Tetrahedron Lett., 2009, 50, 2895-2898.
336. K. Namitharan and K. Pitchumani, Eur. J. Org. Chem., 2010, 2010, 411-415.
337. S. Samai, G. C. Nandi and M. S. Singh, Tetrahedron Lett., 2010, 51, 5555-5558.
338. L. Pin-Hua and W. Lei, Chin. J. Chem., 2005, 23, 1076-1080.
339. E. Ramu, R. Varala, N. Sreelatha and S. R. Adapa, Tetrahedron Lett., 2007, 48,
7184-7190.
340. Y. Zhang, P. Li, M. Wang and L. Wang, J. Org. Chem., 2009, 74, 4364-4367.
341. W.-W. Chen, H.-P. Bi and C.-J. Li, Synlett, 2010, 2010, 475-479.
342. A. T. Bell, Science, 2003, 299, 1688-1691.
343. G. A. Somorjai, H. Frei and J. Y. Park, J. Am.Chem. Soc., 2009, 131, 16589-
16605.
344. D. Astruc, F. Lu and J. R. Aranzaes, Angew. Chem. Int. Ed., 2005, 44, 7852-7872.
345. R. Skouta and C.-J. Li, Tetrahedron, 2008, 64, 4917-4938.
346. M. Kidwai, V. Bansal, N. Kumar Mishra, A. Kumar and S. Mozumdar, Synlett,
2007, 2007, 1581-1584.
347. M. J. Albaladejo, F. Alonso, Y. Moglie and M. Yus, Eur. J. Org. Chem., 2012,
2012, 3093-3104.
348. H. Sharghi, R. Khalifeh, F. Moeini, M. H. Beyzavi, A. S. Beni and M. M.
Doroodmand, J. Iran. Chem. Soc., 2011, 8, S89-S103.
Page | 110
349. V. G. Ramu, A. Bordoloi, T. C. Nagaiah, W. Schuhmann, M. Muhler and C.
Cabrele, Appl. Catal., A., 2012, 431–432, 88-94.
350. M. J. Aliaga, D. J. Ramon and M. Yus, Org. Biomol. Chem., 2010, 8, 43-46.
351. M. Lakshmi Kantam, S. Laha, J. Yadav and S. Bhargava, Tetrahedron Lett., 2008,
49, 3083-3086.
352. M. Hosseini-Sarvari and F. Moeini, New J. Chem., 2014, 38, 624-635.
353. M. B. Gawande, P. S. Branco and R. S. Varma, Chem. Soc. Rev., 2013, 42, 3371-
3393.
354. F. Nador, M. A. Volpe, F. Alonso, A. Feldhoff, A. Kirschning and G. Radivoy,
Appl. Catal., A., 2013, 455, 39-45.
355. W. Yan, R. Wang, Z. Xu, J. Xu, L. Lin, Z. Shen and Y. Zhou, J. Mol. Catal. A:
Chem., 2006, 255, 81-85.
356. Y. Zhou, T. He and Z. Wang, Arkivoc, 2008, 13, 80-90.
357. S. Wang, X. He, L. Song and Z. Wang, Synlett, 2009, 2009, 447-450.
358. G.-P. Yong, D. Tian, H.-W. Tong and S.-M. Liu, J. Mol. Catal. A: Chem., 2010,
323, 40-44.
359. M. Okumura and M. Haruta, Catal. Today., DOI:
http://dx.doi.org/10.1016/j.cattod.2015.05.006.
360. A. Corma and H. Garcia, Chem. Soc. Rev., 2008, 37, 2096-2126.
361. B. S. Takale, M. Bao and Y. Yamamoto, Org. Biomol. Chem., 2014, 12, 2005-
2027.
362. M. Kidwai, V. Bansal, A. Kumar and S. Mozumdar, Green. Chem., 2007, 9, 742-
745.
363. X. Zhang and A. Corma, Angew. Chem., 2008, 120, 4430-4433.
364. K. K. R. Datta, B. V. S. Reddy, K. Ariga and A. Vinu, Angew. Chem. Int. Ed.,
2010, 49, 5961-5965.
365. B. Karimi, M. Gholinejad and M. Khorasani, Chem. Commun., 2012, 48, 8961-
8963.
366. K. Layek, R. Chakravarti, M. Lakshmi Kantam, H. Maheswaran and A. Vinu,
Green. Chem., 2011, 13, 2878-2887.
367. N. Anand, P. Ramudu, K. H. P. Reddy, K. S. R. Rao, B. Jagadeesh, V. S. P. Babu
and D. R. Burri, Appl. Catal., A., 2013, 454, 119-126.
368. L. Lili, Z. Xin, G. Jinsen and X. Chunming, Green. Chem., 2012, 14, 1710-1720.
Page | 111
369. M. Gonzalez-Bejar, K. Peters, G. L. Hallett-Tapley, M. Grenier and J. C. Scaiano,
Chem. Commun., 2013, 49, 1732-1734.
370. K. V. V. Satyanarayana, P. A. Ramaiah, Y. L. N. Murty, M. R. Chandra and S. V.
N. Pammi, Catal. Commun., 2012, 25, 50-53.
371. N. P. Eagalapati, A. Rajack and Y. L. N. Murthy, J. Mol. Catal. A: Chem., 2014,
381, 126-131.
372. K. D. Bhatte, D. N. Sawant, K. M. Deshmukh and B. M. Bhanage, Catal.
Commun., 2011, 16, 114-119.
373. X. Huo, J. Liu, B. Wang, H. Zhang, Z. Yang, X. She and P. Xi, J. Mater. Chem.
A., 2013, 1, 651-656.
374. A. P. Chattopadhyay and P. Mandal, Dalton. Trans., 2015, DOI:
10.1039/C5DT01260K.
375. D. Bhuyan, M. Saikia and L. Saikia, Catal. Commun., 2015, 58, 158-163.
376. B. Sreedhar, A. S. Kumar and P. S. Reddy, Tetrahedron Lett., 2010, 51, 1891-
1895.
377. M. Benaglia, D. Negri and G. Dell’Anna, Tetrahedron Lett., 2004, 45, 8705-8708.
378. C. Wei and C.-J. Li, J. Am.Chem. Soc., 2002, 124, 5638-5639.
379. A. Bisai and V. K. Singh, Org. Lett., 2006, 8, 2405-2408.
380. T. Zeng, L. Yang, R. Hudson, G. Song, A. R. Moores and C.-J. Li, Org. Lett.,
2011, 13, 442-445.
381. S. Orlandi, F. Colombo and M. Benaglia, Synthesis, 2005, 2005, 1689-1692.
382. M. Hatano, T. Asai and K. Ishihara, Tetrahedron Lett., 2008, 49, 379-382.
383. B. Liu, J. Liu, X. Jia, L. Huang, X. Li and A. S. C. Chan, Tetrahedron Asymmetry.,
2007, 18, 1124-1128.
384. B. Liu, L. Huang, J. Liu, Y. Zhong, X. Li and A. S. C. Chan, Tetrahedron
Asymmetry., 2007, 18, 2901-2904.
385. F. Colombo, M. Benaglia, S. Orlandi, F. Usuelli and G. Celentano, J. Org. Chem.,
2006, 71, 2064-2070.
386. F. Colombo, M. Benaglia, S. Orlandi and F. Usuelli, J. Mol. Catal. A: Chem.,
2006, 260, 128-134.
387. Z. Li, Z. Jiang and W. Su, Green. Chem., 2015, 17, 2330-2334.
388. O. P. Pereshivko, V. A. Peshkov and E. V. Van der Eycken, Org. Lett., 2010, 12,
2638-2641.
Page | 112
389. M. Cheng, Q. Zhang, X.-Y. Hu, B.-G. Li, J.-X. Ji and A. S. C. Chan, Adv. Synth.
Catal., 2011, 353, 1274-1278.
390. L. Zhou, Q. Shuai, H.-f. Jiang and C.-J. Li, Chem. Eur. J., 2009, 15, 11668-11674.
391. Z. Lin, D. Yu and Y. Zhang, Tetrahedron Lett., 2011, 52, 4967-4970.
392. X.-Y. Dou, Q. Shuai, L.-N. He and C.-J. Li, Adv. Synth. Catal., 2010, 352, 2437-
2440.
393. B. Das, N. Bhunia, M. Lingaiah and P. R. Reddy, Synthesis, 2011, 2011, 2625-
2628.
394. N. Sakai, N. Uchida and T. Konakahara, Synlett, 2008, 2008, 1515-1519.
395. W. R. Algar, A. J. Tavares and U. J. Krull, Anal. Chim. Acta, 2010, 673, 1-25.
396. E. Oh, R. Liu, A. Nel, K. B. Gemill, M. Bilal, Y. Cohen and I. L. Medintz, Nat.
Nanotechnol., 2016, 11, 479-486.
397. C. B. M. and, C. R. Kagan and M. G. Bawendi, Annu. Rev. Mater. Sci., 2000, 30,
545-610.
398. E. Petryayeva, W. R. Algar and I. L. Medintz, Appl. Spectrosc., 2013, 67, 215-
252.
399. P. Zrazhevskiy, M. Sena and X. Gao, Chem. Soc. Rev., 2010, 39, 4326-4354.
400. R. Freeman and I. Willner, Chem. Soc. Rev., 2012, 41, 4067-4085.
401. S. Santra, H. Yang, P. H. Holloway, J. T. Stanley and R. A. Mericle, J. Am.Chem.
Soc., 2005, 127, 1656-1657.
402. M. F. Frasco and N. Chaniotakis, Sensors, 2009, 9, 7266-7286.
403. K. E. Sapsford, T. Pons, I. L. Medintz and H. Mattoussi, Sensors, 2006, 6, 925-
953.
404. A. P. Alivisatos, Science, 1996, 271, 933-937.
405. C. B. Murray, D. J. Norris and M. G. Bawendi, J. Am.Chem. Soc., 1993, 115,
8706-8715.
406. A. R. Clapp, I. L. Medintz and H. Mattoussi, Chemphyschem, 2006, 7, 47-57.
407. Z. A. Peng and X. Peng, J. Am.Chem. Soc., 2001, 123, 183-184.
408. M. Idowu, E. Lamprecht and T. Nyokong, J. Photochem. Photobiol. A., 2008,
198, 7-12.
409. S. F. Wuister, I. Swart, F. van Driel, S. G. Hickey and C. de Mello Donegá, Nano.
Lett., 2003, 3, 503-507.
410. C. Dong and J. Ren, Luminescence, 2012, 27, 199-203.
Page | 113
411. F. A. Esteve-Turrillas and A. Abad-Fuentes, Biosens. Bioelectron., 2013, 41, 12-
29.
412. D. J. Norris, N. Yao, F. T. Charnock and T. A. Kennedy, Nano. Lett., 2001, 1, 3-
7.
413. C. Wang, X. Gao, Q. Ma and X. Su, J. Mater. Chem., 2009, 19, 7016-7022.
414. R. W. Meulenberg, T. van Buuren, K. M. Hanif, T. M. Willey, G. F. Strouse and
L. J. Terminello, Nano. Lett., 2004, 4, 2277-2285.
415. L. Li, X. Cai, Y. Ding, S. Gu and Q. Zhang, Anal. Methods., 2013, 5, 6748-6754.
416. H.-F. Wang, Y. He, T.-R. Ji and X.-P. Yan, Anal. Chem., 2009, 81, 1615-1621.
417. A. R. Clapp, E. R. Goldman and H. Mattoussi, Nat. Protocols, 2006, 1, 1258-
1266.
418. W. K. Bae, L. A. Padilha, Y.-S. Park, H. McDaniel, I. Robel, J. M. Pietryga and
V. I. Klimov, ACS Nano., 2013, 7, 3411-3419.
419. W. C. W. Chan and S. Nie, Science, 1998, 281, 2016-2018.
420. I. L. Medintz, H. T. Uyeda, E. R. Goldman and H. Mattoussi, Nat. Mater., 2005,
4, 435-446.
421. S. Pedetti, S. Ithurria, H. Heuclin, G. Patriarche and B. Dubertret, J. Am.Chem.
Soc., 2014, 136, 16430-16438.
422. T. Jianniao, L. Rongjun, Z. Yanchun, P. Yan, H. Xue, X. Qing and Z. Shulin,
Nanotechnology, 2010, 21, 305101.
423. Y. He, H.-T. Lu, L.-M. Sai, Y.-Y. Su, M. Hu, C.-H. Fan, W. Huang and L.-H.
Wang, Adv. Mater., 2008, 20, 3416-3421.
424. A. O. Yalcin, B. Goris, R. J. A. van Dijk-Moes, Z. Fan, A. K. Erdamar, F. D.
Tichelaar, T. J. H. Vlugt, G. Van Tendeloo, S. Bals, D. Vanmaekelbergh, H. W.
Zandbergen and M. A. van Huis, Chem. Commun., 2015, 51, 3320-3323.
425. D. V. Talapin, I. Mekis, S. Götzinger, A. Kornowski, O. Benson and H. Weller,
J. Phys. Chem. B, 2004, 108, 18826-18831.
426. T. Gong, J. Liu, X. Liu, J. Liu, J. Xiang and Y. Wu, Food. Chem., 2016, 213, 306-
312.
427. D. Deng, L. Qu, Y. Li and Y. Gu, Langmuir, 2013, 29, 10907-10914.
428. K. Palaniappan, S. A. Hackney and J. Liu, Chem. Commun., 2004, DOI:
10.1039/B409075F, 2704-2705.
429. P. Liu, Q. Wang and X. Li, J. Phys. Chem. C, 2009, 113, 7670-7676.
Page | 114
430. W.-C. Law, K.-T. Yong, I. Roy, H. Ding, R. Hu, W. Zhao and P. N. Prasad, Small,
2009, 5, 1302-1310.
431. F. Pinaud, X. Michalet, L. A. Bentolila, J. M. Tsay, S. Doose, J. J. Li, G. Iyer and
S. Weiss, Biomaterials, 2006, 27, 1679-1687.
432. E. Zillner, S. Fengler, P. Niyamakom, F. Rauscher, K. Köhler and T. Dittrich, J.
Phys. Chem. C, 2012, 116, 16747-16754.
433. H. Soo Choi, W. Liu, P. Misra, E. Tanaka, J. P. Zimmer, B. Itty Ipe, M. G.
Bawendi and J. V. Frangioni, Nat. Biotechnol., 2007, 25, 1165-1170.
434. W. Liu, M. Howarth, A. B. Greytak, Y. Zheng, D. G. Nocera, A. Y. Ting and M.
G. Bawendi, J. Am.Chem. Soc., 2008, 130, 1274-1284.
435. A. Sukhanova, J. Devy, L. Venteo, H. Kaplan, M. Artemyev, V. Oleinikov, D.
Klinov, M. Pluot, J. H. Cohen and I. Nabiev, Anal. Biochem., 2004, 324, 60-67.
436. A. M. Smith and S. Nie, J. Am.Chem. Soc., 2008, 130, 11278-11279.
437. A. C. Wisher, I. Bronstein and V. Chechik, Chem. Commun., 2006, DOI:
10.1039/B518115A, 1637-1639.
438. D. Gerion, F. Pinaud, S. C. Williams, W. J. Parak, D. Zanchet, S. Weiss and A. P.
Alivisatos, J. Phys. Chem. B, 2001, 105, 8861-8871.
439. F. Pinaud, D. King, H.-P. Moore and S. Weiss, J. Am.Chem. Soc., 2004, 126,
6115-6123.
440. X. Gao, Y. Cui, R. M. Levenson, L. W. K. Chung and S. Nie, Nat. Biotechnol.,
2004, 22, 969-976.
441. B. Dubertret, P. Skourides, D. J. Norris, V. Noireaux, A. H. Brivanlou and A.
Libchaber, Science, 2002, 298, 1759-1762.
442. N. Tomczak, D. Jańczewski, M. Han and G. J. Vancso, Prog. Polym. Sci., 2009,
34, 393-430.
443. A. M. Derfus, W. C. W. Chan and S. N. Bhatia, Nano. Lett., 2004, 4, 11-18.
444. S. Kim, B. Fisher, H.-J. Eisler and M. Bawendi, J. Am.Chem. Soc., 2003, 125,
11466-11467.
445. L. Zhou, C. Gao, W. Xu, X. Wang and Y. Xu, Biomacromolecules, 2009, 10,
1865-1874.
446. D. A. Tomalia, A. M. Naylor and W. A. Goddard, Angew. Chem. Int. Ed. Engl.,
1990, 29, 138-175.
447. S.-W. Kim, S. Kim, J. B. Tracy, A. Jasanoff and M. G. Bawendi, J. Am.Chem.
Soc., 2005, 127, 4556-4557.
Page | 115
448. B. Klajnert and M. Bryszewska, Acta Biochim. Pol., 2000, 48, 199-208.
449. N. J. Wells, A. Basso and M. Bradley, J. Pept. Sci., 1998, 47, 381-396.
450. C. Xue, C.-C. Kung, M. Gao, C.-C. Liu, L. Dai, A. Urbas and Q. Li, Sens.
Biosensing. Res., 2015, 3, 7-11.
451. P. Pang, Z. Yang, S. Xiao, J. Xie, Y. Zhang and Y. Gao, J. Electroanal. Chem.,
2014, 727, 27-33.
452. M. Miura, M. Enna, K. Okuro and M. Nomura, J. Org. Chem., 1995, 60, 4999-
5004.
453. B. Yan and Y. Liu, Org. Lett., 2007, 9, 4323-4326.
454. M. Jeganathan, A. Dhakshinamoorthy and K. Pitchumani, ACS Sustain. Chem.
Eng, 2014, 2, 781-787.
455. I. Luz, F. X. Llabrés i Xamena and A. Corma, J. Catal., 2012, 285, 285-291.
456. T. Zeng, W.-W. Chen, C. M. Cirtiu, A. Moores, G. Song and C.-J. Li, Green.
Chem., 2010, 12, 570-573.
457. A. S. K. Hashmi and G. J. Hutchings, Angew. Chem. Int. Ed., 2006, 45, 7896-
7936.
458. R. Varma, Sustain. Chem. process., 2014, 2, 1-8.
459. M. Motornov, S. Z. Malynych, D. S. Pippalla, B. Zdyrko, H. Royter, Y. Roiter,
M. Kahabka, A. Tokarev, I. Tokarev, E. Zhulina, K. G. Kornev, I. Luzinov and S.
Minko, Nano. Lett., 2012, 12, 3814-3820.
460. S. A. Safran, Nat. Mater., 2003, 2, 71-72.
461. A. Sinha, J. Chakraborty, P. A. Joy and P. Ramachandrarao, J. Mater. Res., 2004,
19, 1676-1681.
462. C.-m. Yang, P.-h. Liu, Y.-f. Ho, C.-y. Chiu and K.-j. Chao, Chem. Mat., 2003, 15,
275-280.
463. M. Boutros, A. Denicourt-Nowicki, A. Roucoux, L. Gengembre, P. Beaunier, A.
Gedeon and F. Launay, Chem. Commun., 2008, DOI: 10.1039/B802548G, 2920-
2922.
464. S. H. Joo, S. J. Choi, I. Oh, J. Kwak, Z. Liu, O. Terasaki and R. Ryoo, Nature,
2001, 412, 169-172.
465. M. N. Nadagouda and R. S. Varma, Green. Chem., 2006, 8, 516-518.
466. I. Y. Goon, L. M. H. Lai, M. Lim, P. Munroe, J. J. Gooding and R. Amal, Chem.
Mat., 2009, 21, 673-681.
467. Y. Zhang, X. Cui, F. Shi and Y. Deng, Chem. Rev., 2012, 112, 2467-2505.
Page | 116
468. L. Abahmane, J. M. Köhler and G. A. Groß, Chem. Eur. J., 2011, 17, 3005-3010.
469. S. Shylesh, V. Schünemann and W. R. Thiel, Angew. Chem. Int. Ed., 2010, 49,
3428-3459.
470. R. Krishnan, J. S. Binkley, R. Seeger and J. A. Pople, J. Chem. Phys., 1980, 72,
650-654.
471. M. J. Frisch, J. A. Pople and J. S. Binkley, J. Chem. Phys., 1984, 80, 3265-3269.
472. B. H. Besler, K. M. Merz and P. A. Kollman, J. Comput. Chem., 1990, 11, 431-
439.
473. C. I. Bayly, P. Cieplak, W. Cornell and P. A. Kollman, J. Phys. Chem., 1993, 97,
10269-10280.
474. M. J. Turner, J. J. McKinnon, S. K. Wolff, D. J. Grimwood, P. R. Spackman, D.
Jayatilaka and M. A. Spackman, Crystal Explorer17, University of Western
Australia. http://hirshfeldsurface.net, 2017.
475. J. Kretzmann, D. Ho, C. W. Evans, J. Plani-Lam, B. Garcia-Bloj, E. Mohamed,
M. O'Mara, E. Ford, D. Tan, R. Lister, P. Blancafort, M. Norret and S. Iyer, Chem.
Sci., 2017, DOI: 10.1039/C7SC00097A.
476. S. Ghosh and A. Saha, Nanoscale Res. Lett., 2009, 4, 937-941.
477. S. Connolly, S. N. Rao and D. Fitzmaurice, J. Phys. Chem. B, 2000, 104, 4765-
4776.
478. W. W. Yu, L. Qu, W. Guo and X. Peng, Chem. Mat., 2003, 15, 2854-2860.
479. J. I. Steinfeld, J. S. Francisco and W. L. Hase, Chemical kinetics and dynamics,
Prentice Hall Englewood Cliffs (New Jersey), 1989.
480. G. Dyker, Angew. Chem. Int. Ed., 1999, 38, 1698-1712.
481. T. Naota, H. Takaya and S. I. Murahashi, Chem. Rev., 1998, 98, 2599-2660.
482. J. R. Lakowicz, I. Gryczynski, Z. Gryczynski and C. J. Murphy, J. Phys. Chem.
B, 1999, 103, 7613-7620.
Page | 117
Appendix A
SUPPORTING INFORMATION FOR PAPERS
1. Munshi, A. M.; Ho, D.; Saunders, M.; Agarwal, V.; Raston, C. L.; Iyer, K. S.,
Influence of aspect ratio of magnetite coated gold nanorods in hydrogen peroxide
sensing. Sens. Actuator B-Chem. 2016, 235, 492-497. (Published)
2. Munshi, A. M.; Agarwal, V.; Ho, D.; Raston, C. L.; Saunders, M.; Smith, N. M.;
Iyer, K. S., Magnetically Directed Assembly of Nanocrystals for Catalytic Control
of a Three-Component Coupling Reaction. Cryst. Growth Des. 2016, 16, 4773-
4776. (Published)
3. Munshi, A. M.; Shi, S.; Thomas, S. P.; Saunders, M.; Spackman, M. A.; Iyer, K.
S.; Smith, N. M., Magnetically recoverable Fe3O4@Au-coated nanoscale catalysts
for the A3 coupling reaction. Dalton Trans. 2017, 46 (16), 5133-5137. (Published)
4. Munshi, A. M.; Kretzmann, J. A.; Evans, C. W.; Ranieri, A. M.; Schildkraut, Z.;
Massi, M.; Norret, M; Saunders, M.; Iyer, K. S., Dendronised polymers as
templates for in-situ one-pot quantum dot synthesis. J. Mater. Chem. C.
(Submitted)
S1
Influence of aspect ratio of magnetite coated gold nanorods in hydrogen
peroxide sensing
Alaa M. Munshia, Diwei Hoa, Martin Saundersb, Vipul Agarwala, Colin L. Rastonc,* and K.
Swaminathan Iyera,*
a School of Chemistry and Biochemistry, The University of Western Australia, Crawley, Western Australia, Australia
b Centre for Microscopy, Characterization & Analysis, The University of Western Australia, M010, Perth WA 6009 Australia
c Centre for Nanoscale Science and Technology, School of Chemical and Physical Sciences, Flinders University, Bedford Park, South Australia, Australia
* Corresponding author at: M310, 35 Stirling Highway, Crawley, WA 6009, Australia.
**Corresponding author at: GPO Box 2100, Adelaide, South Australia 5001, Australia.
Email: CLR ([email protected]); KSI ([email protected])
Supporting Information
Materials and Methods
Iron (III) acetylacetonate, 1,2-hexadecanediol, oleylamine, oleic acid, benzyl ether, silver nitrate,
sodium oleate and hydrogen tetrachloroaurate trihydrate (HAuCl4.3H2O) were purchased from
Sigma-Aldrich, Australia. 1,2-Dichlorobenzene was purchased from Fluka, Australia. N, N’-
dimethyl formamide and hydrochloric acid (HCl, 32 wt. %) from Merck, Australia.
cetyltrimethylammonium bromide (CTAB, >98.0 %) and sodium borohydride (NaBH4, 99 %)
was purchased from Alfa Aesar, Australia. L-ascorbic acid and citric acid were purchased from
Ajax Finechem, Australia. Glucose and hydrogen peroxide (30 %) were supplied from Chem
S2
Supply, Australia. Hydrogen peroxide (H2O2) solutions were prepared fresh before use. 0.1 M
phosphate buffer solutions (PBS, pH 7.4) were prepared by using Na2HPO4.12H2O and
NaH2PO4.2H2O. Milli-Ǫ water was used to prepare all aqueous solutions. All chemicals were
used as received without any purification.
Characterization of GNRs
Morphologies of gold nanorods and iron oxide nanoparticles were studied using transmission
electron microscopy (TEM). Nanoparticles (including gold nanorods) were dropped on carbon-
coated copper grids and imaged using JEOL 3000F TEM. The size of the nanoparticles was
determined using ImageJ software. A minimum of 200 particles were measured, and the data
reported as the average ± standard error mean.
Zeta potential measurements were performed using Malvern instrument (Nano ZS), all the
samples were diluted prior to the experiments. HAADF (high-angle annular dark-field) STEM
images, Energy-dispersive X-ray spectroscopy (EDX) - point mode (elemental analysis) and
mapping mode (elemental maps) were obtained on the FEI Titan G2 80–200 TEM/STEM
operating at an accelerating voltage of 200 kV. UV-vis absorption spectroscopy was recorded on
Cary 5000 UV/vis spectrophotometer (Varian, Australia). The electrochemical experiments were
performed using a Garmy Reference 600 Potentiostat.
Synthesis of Citric Acid Coated Magnetite Nanoparticles
The method for synthesizing citric acid stabilized anionic magnetite nanoparticles were
previously reported by Sun et al[1] and Lattuada et al.[2] Briefly, iron (III) acetylacetonate (2
S3
mmol), 1,2-hexadecanediol (10 mmol), oleylamine (6 mmol), oleic acid (6 mmol) and benzyl
ether (20 ml) were mixed and reacted under a nitrogen atmosphere at 100 oC for 45 minutes, 200
°C for 2 hours and ~300 °C for further 1 hour. The mixture was then cooled to 25 °C and ethanol
was added to the reaction mixture. The resulting black color magnetite nanoparticles were
collected via centrifugation (3220 g, 10 minutes) and stored in hexane. Next, hexane was
evaporated and 1, 2-dichlorobenzene (7.5 ml) and N,N’- dimethyl formamide (7.5 ml) (total
volume 15 ml) was added to the dried magnetite (120 mg), followed by the addition of citric acid
(100 mg) and the mixture was heated at 100 °C for 24 hours under constant stirring. After 24
hours, this solution was cooled at room temperature and citric acid coated magnetite
nanoparticles were precipitated in diethyl ether (40 mL). Then magnetite particles were
redispersed in acetone and collected by centrifugation (3220 g, 10 minutes). The magnetite
particles were then stored in water at room temperature until further use.
Synthesis of gold nanorods (GNRs)
Gold seeds: To the mixture of HAuCl4 (5 mL, 0.5 mM) and CTAB (5 ml, 0.2 M), fresh NaBH4
(0.6 mL, 0.01 M in 1 mL water) was injected under vigorous stirring. The color of the seed
solution turned brownish yellow suggesting the formation of gold nanoparticles, which was
further stirred for 2 minutes. The resulting gold seed solution was incubated at room temperature
for another 30 minutes. The gold seed solution was stored for 30 minutes at room temperature
before use.[3]
The GNRs were synthesized as per the published method.[4]
S4
Short GNRs: CTAB (3.5 g) and sodium oleate (617 mg) were dissolved in warm water (50 oC,
125 mL) following which the reaction mixture was allowed to cool down to 30 oC and 4 mM
AgNO3 (9 mL) was added and reacted for 15 minutes at 30 oC without stirring. Next, HAuCl4
(125 mL, 1 mM) was added and reacted for 90 minutes to yield colorless solution followed by
conc. HCl (0.89 mL, 32 %) to adjust the pH (1.51) of the reaction mixture and reacted for
another 15 minutes. Next, 0.064 M ascorbic acid (1.25 mL) was added and the mixture was
vigorous stirred for 30 seconds, followed by the addition of the gold seed solution (0.2 mL) with
moderate stirring for an additional 30 seconds. To facilitate GNR growth the mixture was left
undisturbed at 30 oC for next 12 hours. The solution was then centrifuged at 3220 g for 30
minutes to collect the GNRs which were dispersed and stored in water.
Long GNRs: In the case of long GNRs, similar method was followed as short GNRs synthesis.
However, increased amounts of 4 mM AgNO3 (12 mL), conc. HCl (14.2 mL) and gold seed
solution (0.4 mL) were used for this procedure.
Preparation of GNRs-Fe3O4 hybrid
Citric acid coated Fe3O4 (1 mg/mL in water) was added drop wise to the GNRs suspension (2
mg/mL in water) with vigorous stirring for 2 minutes. The opposite charges of the citric acid
coated Fe3O4 nanoparticles and the CTAB coated GNRs undergo electrostatic interactions
resulting in the color change of the reaction mixture which became darker. The resulting GNR-
Fe3O4 hybrid product was washed five times with acetone to remove excess Fe3O4 nanoparticles
and was participated by centrifugation (3220 g, 2 minute) followed by resuspension in water.
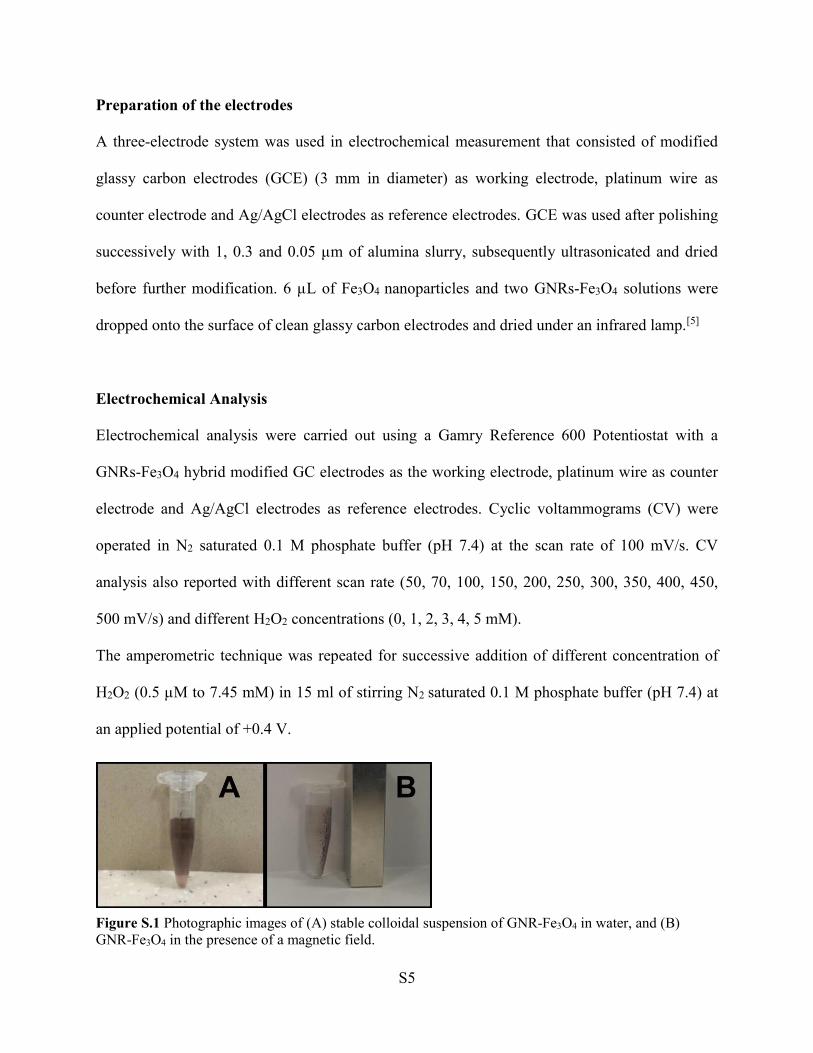
S5
Preparation of the electrodes
A three-electrode system was used in electrochemical measurement that consisted of modified
glassy carbon electrodes (GCE) (3 mm in diameter) as working electrode, platinum wire as
counter electrode and Ag/AgCl electrodes as reference electrodes. GCE was used after polishing
successively with 1, 0.3 and 0.05 µm of alumina slurry, subsequently ultrasonicated and dried
before further modification. 6 µL of Fe3O4 nanoparticles and two GNRs-Fe3O4 solutions were
dropped onto the surface of clean glassy carbon electrodes and dried under an infrared lamp.[5]
Electrochemical Analysis
Electrochemical analysis were carried out using a Gamry Reference 600 Potentiostat with a
GNRs-Fe3O4 hybrid modified GC electrodes as the working electrode, platinum wire as counter
electrode and Ag/AgCl electrodes as reference electrodes. Cyclic voltammograms (CV) were
operated in N2 saturated 0.1 M phosphate buffer (pH 7.4) at the scan rate of 100 mV/s. CV
analysis also reported with different scan rate (50, 70, 100, 150, 200, 250, 300, 350, 400, 450,
500 mV/s) and different H2O2 concentrations (0, 1, 2, 3, 4, 5 mM).
The amperometric technique was repeated for successive addition of different concentration of
H2O2 (0.5 µM to 7.45 mM) in 15 ml of stirring N2 saturated 0.1 M phosphate buffer (pH 7.4) at
an applied potential of +0.4 V.
Figure S.1 Photographic images of (A) stable colloidal suspension of GNR-Fe3O4 in water, and (B) GNR-Fe3O4 in the presence of a magnetic field.
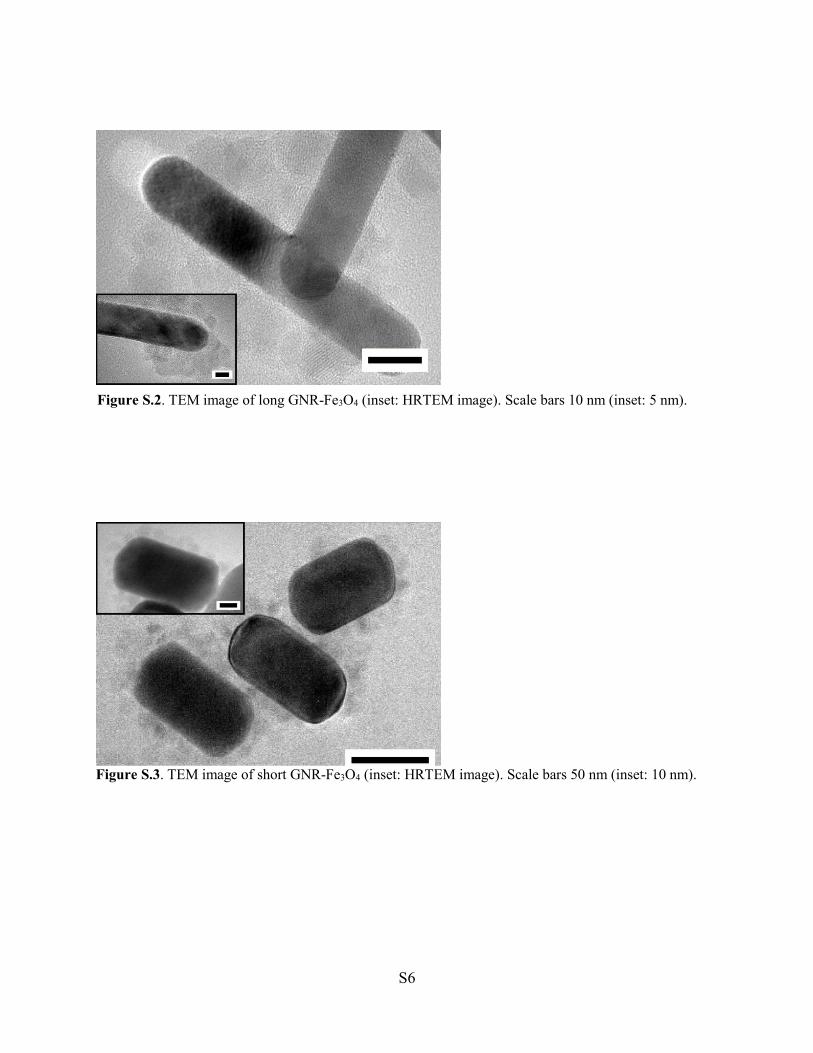
S6
Figure S.2. TEM image of long GNR-Fe3O4 (inset: HRTEM image). Scale bars 10 nm (inset: 5 nm).
Figure S.3. TEM image of short GNR-Fe3O4 (inset: HRTEM image). Scale bars 50 nm (inset: 10 nm).
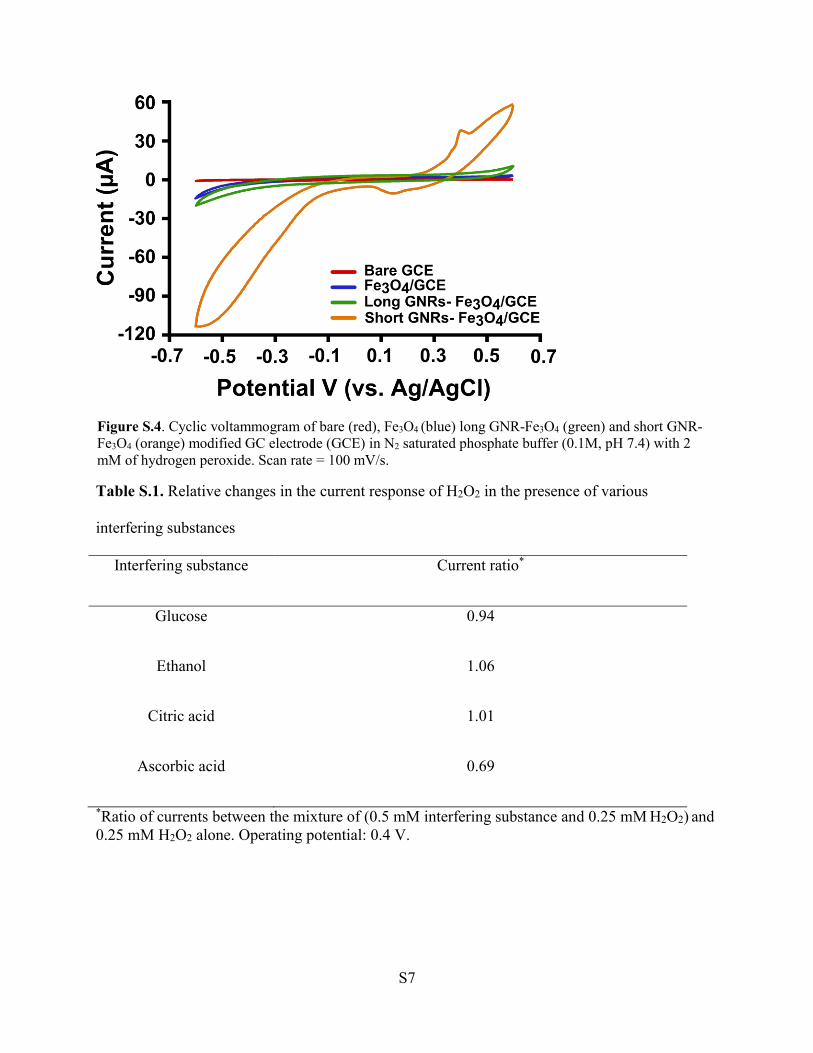
S7
Table S.1. Relative changes in the current response of H2O2 in the presence of various
interfering substances
Interfering substance Current ratio*
Glucose 0.94
Ethanol 1.06
Citric acid
Ascorbic acid
1.01
0.69
*Ratio of currents between the mixture of (0.5 mM interfering substance and 0.25 mM H2O2) and 0.25 mM H2O2 alone. Operating potential: 0.4 V.
Figure S.4. Cyclic voltammogram of bare (red), Fe3O4 (blue) long GNR-Fe3O4 (green) and short GNR-Fe3O4 (orange) modified GC electrode (GCE) in N2 saturated phosphate buffer (0.1M, pH 7.4) with 2 mM of hydrogen peroxide. Scan rate = 100 mV/s.
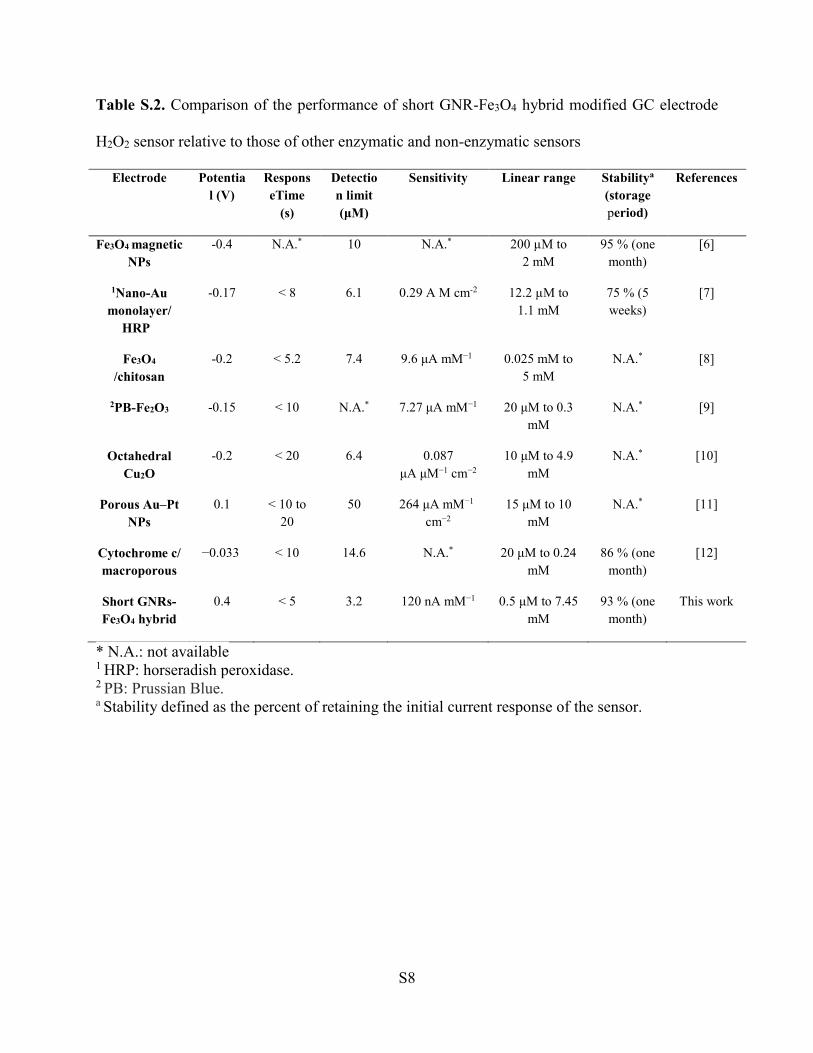
S8
Table S.2. Comparison of the performance of short GNR-Fe3O4 hybrid modified GC electrode
H2O2 sensor relative to those of other enzymatic and non-enzymatic sensors
Electrode Potential (V)
ResponseTime
(s)
Detection limit (µM)
Sensitivity Linear range Stabilitya
(storage period)
References
Fe3O4 magnetic NPs
-0.4 N.A.* 10 N.A.* 200 µM to 2 mM
95 % (one month)
[6]
1Nano-Au monolayer/
HRP
-0.17 < 8 6.1 0.29 A M cm-2 12.2 µM to 1.1 mM
75 % (5 weeks)
[7]
Fe3O4 /chitosan
-0.2 < 5.2 7.4 9.6 μA mM−1 0.025 mM to 5 mM
N.A.* [8]
2PB-Fe2O3 -0.15 < 10 N.A.* 7.27 μA mM−1 20 μM to 0.3 mM
N.A.* [9]
Octahedral Cu2O
-0.2 < 20 6.4 0.087 μA μM−1 cm−2
10 μM to 4.9 mM
N.A.* [10]
Porous Au–Pt NPs
0.1 < 10 to 20
50 264 μA mM−1 cm−2
15 μM to 10 mM
N.A.* [11]
Cytochrome c/ macroporous
−0.033 < 10 14.6 N.A.* 20 μM to 0.24 mM
86 % (one month)
[12]
Short GNRs-Fe3O4 hybrid
0.4 < 5 3.2 120 nA mM−1 0.5 μM to 7.45 mM
93 % (one month)
This work
* N.A.: not available 1 HRP: horseradish peroxidase. 2 PB: Prussian Blue. a Stability defined as the percent of retaining the initial current response of the sensor.
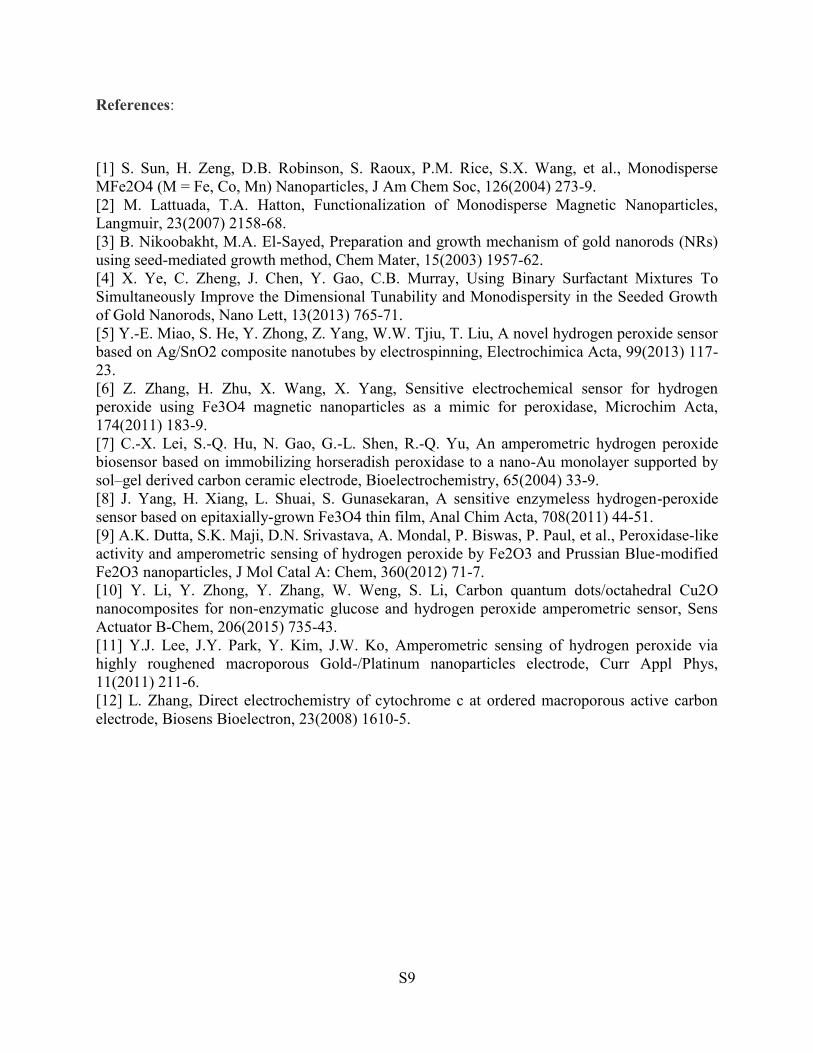
S9
References: [1] S. Sun, H. Zeng, D.B. Robinson, S. Raoux, P.M. Rice, S.X. Wang, et al., Monodisperse MFe2O4 (M = Fe, Co, Mn) Nanoparticles, J Am Chem Soc, 126(2004) 273-9. [2] M. Lattuada, T.A. Hatton, Functionalization of Monodisperse Magnetic Nanoparticles, Langmuir, 23(2007) 2158-68. [3] B. Nikoobakht, M.A. El-Sayed, Preparation and growth mechanism of gold nanorods (NRs) using seed-mediated growth method, Chem Mater, 15(2003) 1957-62. [4] X. Ye, C. Zheng, J. Chen, Y. Gao, C.B. Murray, Using Binary Surfactant Mixtures To Simultaneously Improve the Dimensional Tunability and Monodispersity in the Seeded Growth of Gold Nanorods, Nano Lett, 13(2013) 765-71. [5] Y.-E. Miao, S. He, Y. Zhong, Z. Yang, W.W. Tjiu, T. Liu, A novel hydrogen peroxide sensor based on Ag/SnO2 composite nanotubes by electrospinning, Electrochimica Acta, 99(2013) 117-23. [6] Z. Zhang, H. Zhu, X. Wang, X. Yang, Sensitive electrochemical sensor for hydrogen peroxide using Fe3O4 magnetic nanoparticles as a mimic for peroxidase, Microchim Acta, 174(2011) 183-9. [7] C.-X. Lei, S.-Q. Hu, N. Gao, G.-L. Shen, R.-Q. Yu, An amperometric hydrogen peroxide biosensor based on immobilizing horseradish peroxidase to a nano-Au monolayer supported by sol–gel derived carbon ceramic electrode, Bioelectrochemistry, 65(2004) 33-9. [8] J. Yang, H. Xiang, L. Shuai, S. Gunasekaran, A sensitive enzymeless hydrogen-peroxide sensor based on epitaxially-grown Fe3O4 thin film, Anal Chim Acta, 708(2011) 44-51. [9] A.K. Dutta, S.K. Maji, D.N. Srivastava, A. Mondal, P. Biswas, P. Paul, et al., Peroxidase-like activity and amperometric sensing of hydrogen peroxide by Fe2O3 and Prussian Blue-modified Fe2O3 nanoparticles, J Mol Catal A: Chem, 360(2012) 71-7. [10] Y. Li, Y. Zhong, Y. Zhang, W. Weng, S. Li, Carbon quantum dots/octahedral Cu2O nanocomposites for non-enzymatic glucose and hydrogen peroxide amperometric sensor, Sens Actuator B-Chem, 206(2015) 735-43. [11] Y.J. Lee, J.Y. Park, Y. Kim, J.W. Ko, Amperometric sensing of hydrogen peroxide via highly roughened macroporous Gold-/Platinum nanoparticles electrode, Curr Appl Phys, 11(2011) 211-6. [12] L. Zhang, Direct electrochemistry of cytochrome c at ordered macroporous active carbon electrode, Biosens Bioelectron, 23(2008) 1610-5.
S1
Magnetically Directed Assembly of Nanocrystals for Catalytic Control of a Three-Component Coupling Reaction
Alaa M. Munshi,a Vipul Agarwal,a Dominic Ho,a Colin L. Raston,b Martin Saunders,c Nicole
M. Smith,a* and K. Swaminathan Iyera,*
Supporting Information
Materials:
Chloroauric acid (HAuCl4), sodium borohydride (NaBH4), Iron(II) sulfate heptahydrate
(FeSO4.7H2O), piperidine, phenylacetylene and polyethyleneimine (PEI, branched, Mw ≈
25,000 g mol-1) were obtained from Sigma-Aldrich, Australia. Potassium nitrate (KNO3),
sodium citrate (C6H5Na3O7.H2O) and benzaldehyde were obtained from Ajax Finechem,
Australia. Sodium hydroxide (NaOH) was obtained Fluka, Australia. Hydroxylamine
hydrochloride (NH2OH.HCl) was obtained from VWR, Australia. All chemicals were used as
received with no further purification.
The Au-coated Fe3O4 nanoparticles (Fe3O4@Au) catalyst was prepared using a previously
reported multistep process.1
Synthesis of PEI-coated Fe3O4 nanoparticles (Fe3O4-PEI):
Briefly, Fe3O4 nanoparticles were synthesized by dissolving FeSO4.7H2O (1.3 g) in Milli-Q
water (80 mL) under a nitrogen atmosphere, followed by the addition of NaOH (10 mL, 1.0
M) and KNO3 (10 mL, 2.0 M). The resulting Fe(OH)2 was subsequently heated at 90 °C for 2
hours with the simultaneous addition of different concentrations of PEI solution (0 to 4 g/L)
in order to get PEI coated Fe3O4 nanoparticles. The nanoparticles were cooled to room
temperature and magnetically separated using an external magnet followed by multiple
washing steps to remove excess PEI. The resulting purified nanoparticles were dispersed in
Milli-Q water (80 mL) and stored until further use.
S2
Preparation of Au-Seed:
A colloidal solution of Au seeds was prepared by adopting a previously reported procedure
by Brown et al.2 Briefly, HAuCl4 (1 mL, 1% v/v in 90 mL H2O) was stirred with sodium
citrate (2 mL, 38.8 mM), followed by the addition of NaBH4 (1 mL, 0.075% w/v) and the
resulting mixture was left at room temperature with stirring for an additional five minutes.
Synthesis of Au seed functionalised Fe3O4-PEI nanoparticles:
PEI-coated Fe3O4 nanoparticles (2 mL in water) were stirred with a freshly synthesized Au
seed solution (90 mL) for 2 hours. The resulting Au seed functionalised Fe3O4-PEI
nanoparticles were separated using an external magnet and washed multiple times with Milli-
Q water. The nanoparticle surface was further functionalized with PEI (5 g/L) by heating the
reaction mixture at 60 °C for 1 hour. Subsequently, the particles were further washed with
Milli-Q water (5×) and were then redispersed in Milli-Q water (20 mL).
Synthesis of Au-coated Fe3O4 Nanoparticles (Fe3O4@Au):
Au seed functionalised Fe3O4-PEI nanoparticles (20 mL) were added to a NaOH solution
(110 mL, 0.01 M) with constant stirring. Following which NH2OH.HCl (0.75 mL, 0.2 M) and
HAuCl4 (1% v/v, 0.5 mL) were added to the reaction mixture. This was then followed by
multiple (4×) additions of NH2OH.HCl (0.25 mL, 0.2 M) and HAuCl4 (1% v/v, 0.5mL) in 10
minute intervals and the resulting mixture was left to react for 1 hour. The Au-coated Fe3O4
nanoparticles were then separated magnetically from the mixture, washed water (5×),
dispersed in Milli-Q water (20 mL) and stored at room temperature until further use.
Inductively coupled plasma (ICP) analysis confirmed the concentration of Au (0.57 mg/L)
and Fe (1600 mg/L) in the synthesized catalyst.
Fabrication of Fe3O4@Au nanowires:
Fe3O4@Au nanowires were fabricated using a previously reported method developed in our
lab.3 Briefly, 2 NdFeB magnets (5 × 5 × 2 cm and 4.5 × 3 × 1 cm) with their field directions
aligned were placed on two sides of the parallel reactor with the reaction test tube equidistant
from both magnets. The resulting nanowires were characterized and quantified using
transmission electron microscopy (TEM).
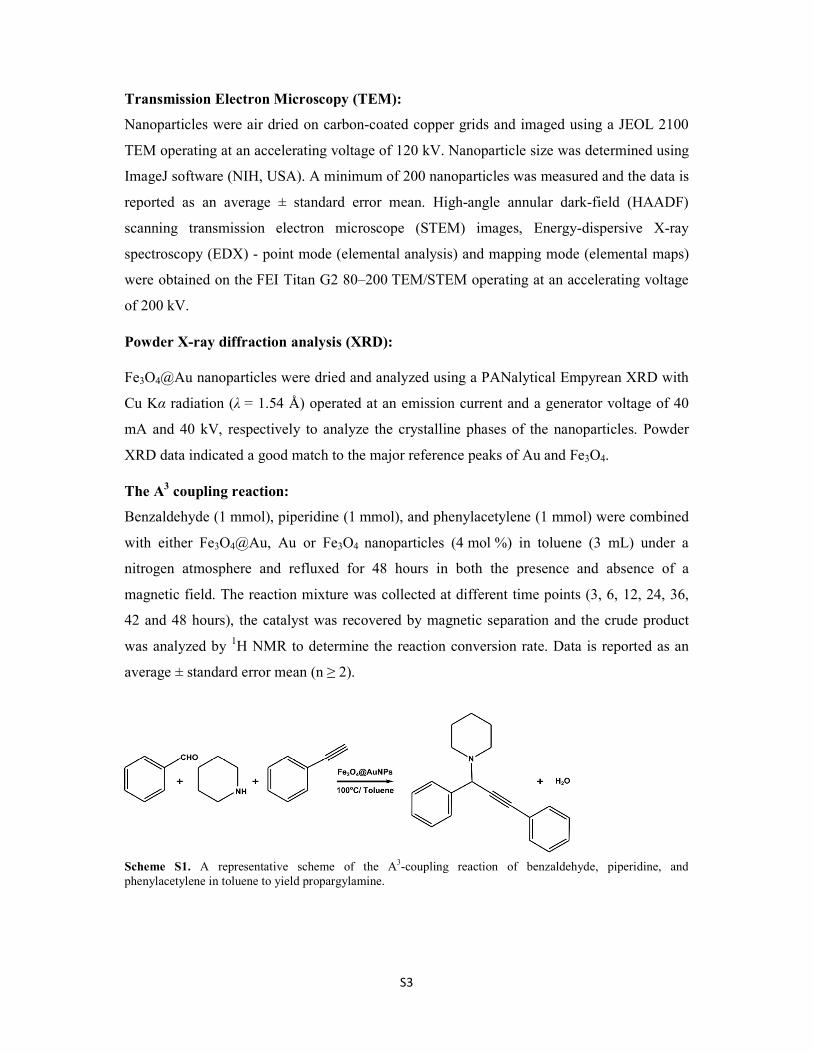
S3
Transmission Electron Microscopy (TEM):
Nanoparticles were air dried on carbon-coated copper grids and imaged using a JEOL 2100
TEM operating at an accelerating voltage of 120 kV. Nanoparticle size was determined using
ImageJ software (NIH, USA). A minimum of 200 nanoparticles was measured and the data is
reported as an average ± standard error mean. High-angle annular dark-field (HAADF)
scanning transmission electron microscope (STEM) images, Energy-dispersive X-ray
spectroscopy (EDX) - point mode (elemental analysis) and mapping mode (elemental maps)
were obtained on the FEI Titan G2 80–200 TEM/STEM operating at an accelerating voltage
of 200 kV.
Powder X-ray diffraction analysis (XRD):
Fe3O4@Au nanoparticles were dried and analyzed using a PANalytical Empyrean XRD with
Cu Kα radiation (λ = 1.54 Å) operated at an emission current and a generator voltage of 40
mA and 40 kV, respectively to analyze the crystalline phases of the nanoparticles. Powder
XRD data indicated a good match to the major reference peaks of Au and Fe3O4.
The A3 coupling reaction:
Benzaldehyde (1 mmol), piperidine (1 mmol), and phenylacetylene (1 mmol) were combined
with either Fe3O4@Au, Au or Fe3O4 nanoparticles (4 mol %) in toluene (3 mL) under a
nitrogen atmosphere and refluxed for 48 hours in both the presence and absence of a
magnetic field. The reaction mixture was collected at different time points (3, 6, 12, 24, 36,
42 and 48 hours), the catalyst was recovered by magnetic separation and the crude product
was analyzed by 1H NMR to determine the reaction conversion rate. Data is reported as an
average ± standard error mean (n ≥ 2).
Scheme S1. A representative scheme of the A3-coupling reaction of benzaldehyde, piperidine, and phenylacetylene in toluene to yield propargylamine.
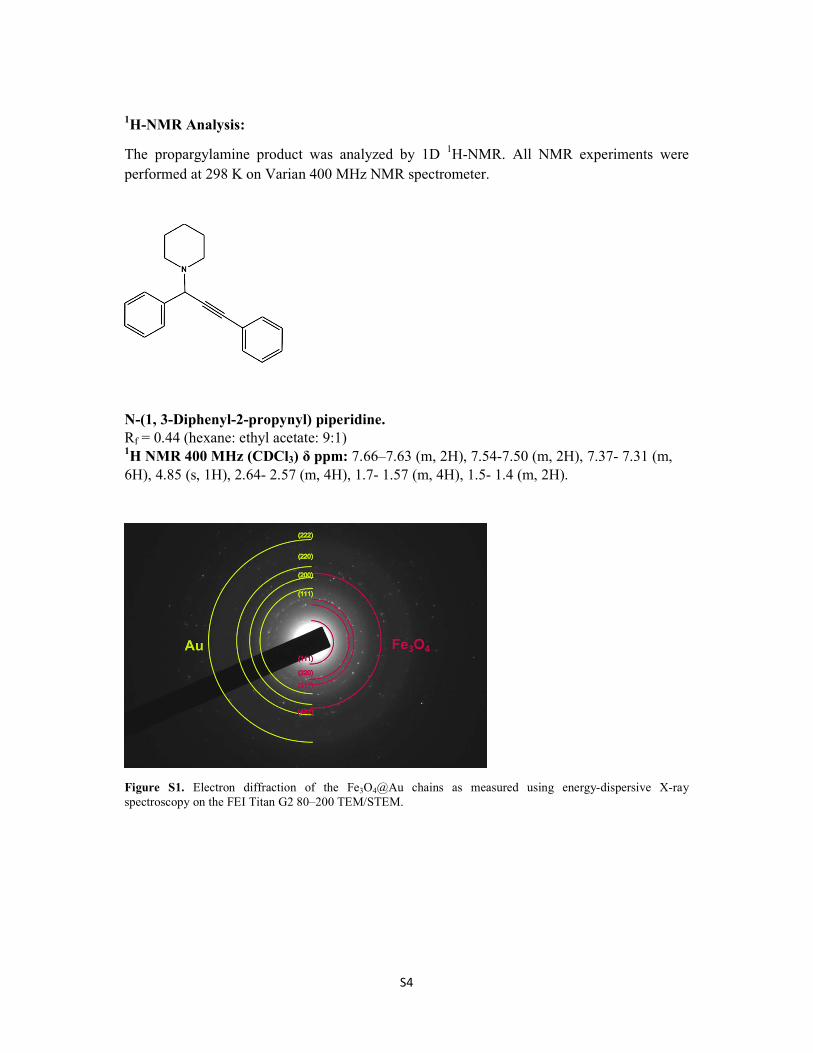
S4
1H-NMR Analysis:
The propargylamine product was analyzed by 1D 1H-NMR. All NMR experiments were performed at 298 K on Varian 400 MHz NMR spectrometer.
N-(1, 3-Diphenyl-2-propynyl) piperidine. Rf = 0.44 (hexane: ethyl acetate: 9:1) 1H NMR 400 MHz (CDCl3) δ ppm: 7.66–7.63 (m, 2H), 7.54-7.50 (m, 2H), 7.37- 7.31 (m, 6H), 4.85 (s, 1H), 2.64- 2.57 (m, 4H), 1.7- 1.57 (m, 4H), 1.5- 1.4 (m, 2H).
Figure S1. Electron diffraction of the Fe3O4@Au chains as measured using energy-dispersive X-ray spectroscopy on the FEI Titan G2 80–200 TEM/STEM.
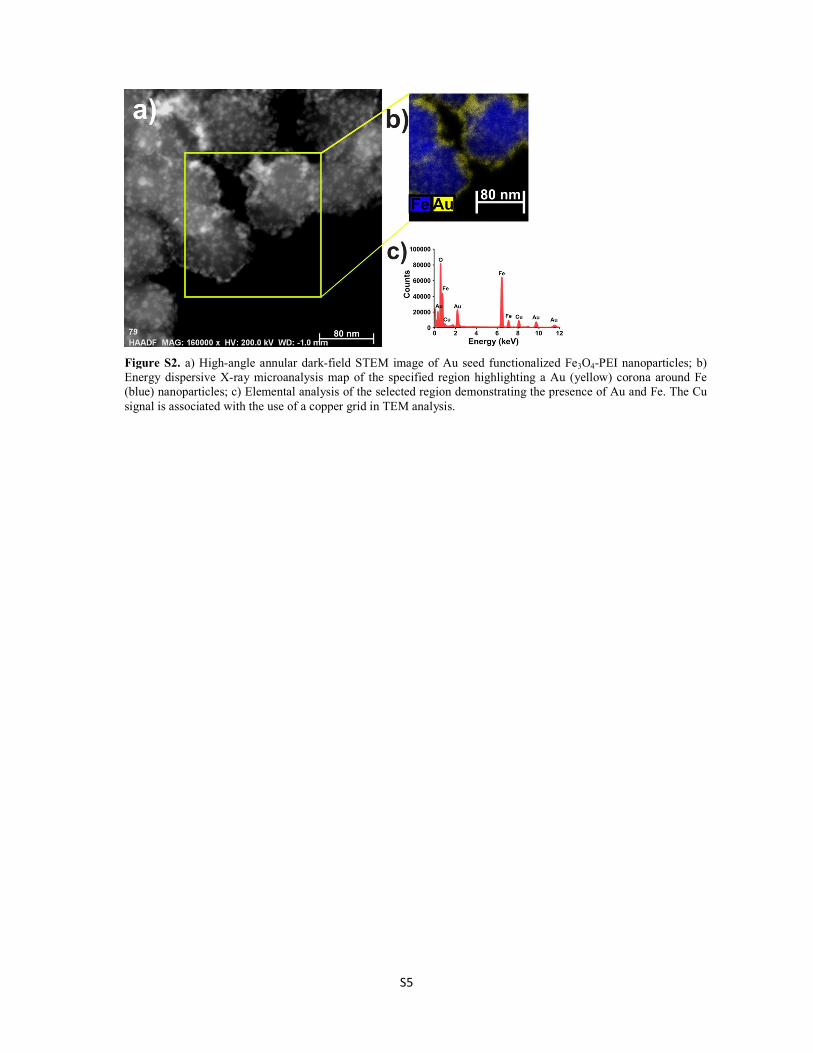
S5
Figure S2. a) High-angle annular dark-field STEM image of Au seed functionalized Fe3O4-PEI nanoparticles; b) Energy dispersive X-ray microanalysis map of the specified region highlighting a Au (yellow) corona around Fe (blue) nanoparticles; c) Elemental analysis of the selected region demonstrating the presence of Au and Fe. The Cu signal is associated with the use of a copper grid in TEM analysis.
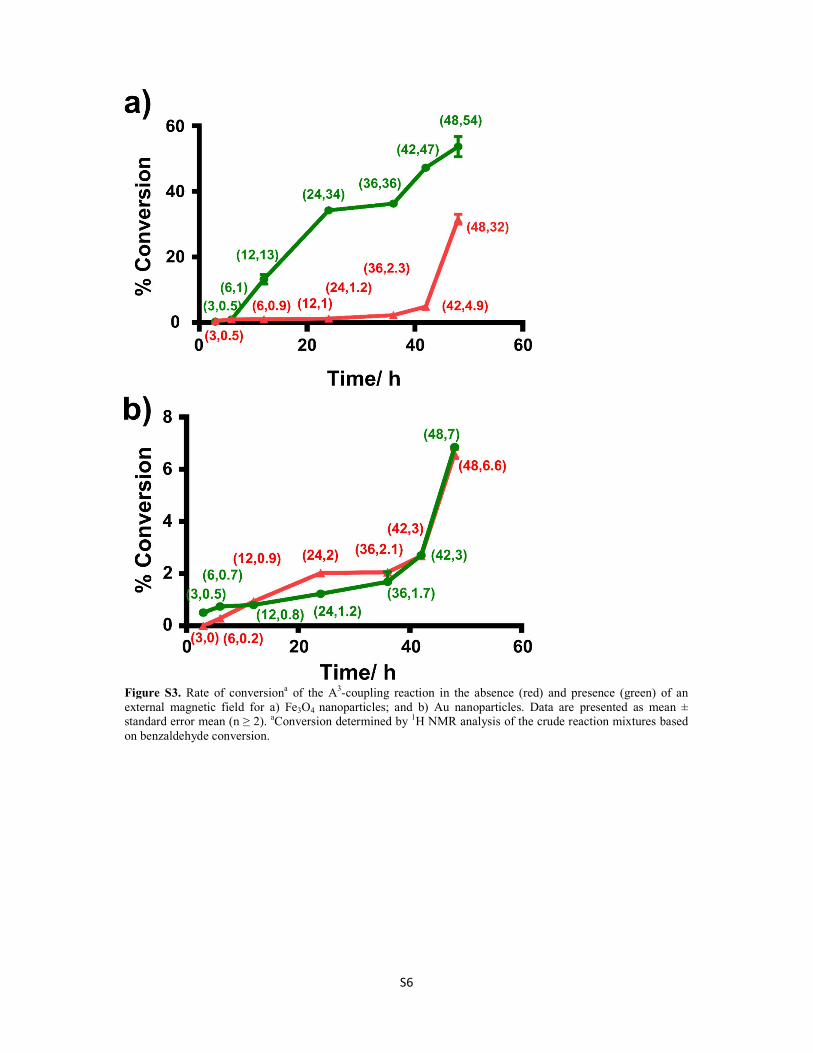
S6
Figure S3. Rate of conversiona of the A3-coupling reaction in the absence (red) and presence (green) of an external magnetic field for a) Fe3O4 nanoparticles; and b) Au nanoparticles. Data are presented as mean ± standard error mean (n ≥ 2). aConversion determined by 1H NMR analysis of the crude reaction mixtures based on benzaldehyde conversion.
S7
References:
(1) Goon, I. Y.; Lai, L. M. H.; Lim, M.; Munroe, P.; Gooding, J. J.; Amal, R. Chem. Mat. 2009, 21, (4), 673-681. (2) Brown, K. R.; Walter, D. G.; Natan, M. J. Chem. Mat. 2000, 12, (2), 306-313. (3) Ho, D.; Peerzade, S. A. M. A.; Becker, T.; Hodgetts, S. I.; Harvey, A. R.; Plant, G. W.; Woodward, R. C.; Luzinov, I.; St. Pierre, T. G.; Iyer, K. S. Chem. Commun. 2013, 49, (64), 7138-7140.
S1
Magnetically recoverable Fe3O4@Au-coated nanoscale catalysts for A3-coupling reaction
Alaa M. Munshi,a Mingwen Shi,a Sajesh Thomas,a Martin Saunders,b Mark Spackman,a K. Swaminathan Iyer a,* and Nicole M. Smith,a,*
Supporting Information
Materials:
Chloroauric acid (HAuCl4), sodium borohydride (NaBH4), Iron(II) sulfate heptahydrate
(FeSO4.7H2O), piperidine, chloroform, methanol, acetonitrile, phenylacetylene and
polyethyleneimine (PEI, branched, Mw ≈ 25,000 g mol-1) were obtained from Sigma-Aldrich,
Australia. 2-pyridinecarboxaldehyde, 3-pyridinecarboxaldehyde, 4-pyridinecarboxaldehyde,
p-chlorobenzaldehyde, 2-thiophenecarboxaldehyde and 2-furaldehyde were obtained from
Sigma-Aldrich, Australia. Potassium nitrate (KNO3), sodium citrate (C6H5Na3O7.H2O) and
benzaldehyde were obtained from Ajax Finechem, Australia. Sodium hydroxide (NaOH), p-
tolualdehyde and 3-nitrobenzaldehyde were obtained Fluka, Australia. Hydroxylamine
hydrochloride (NH2OH.HCl) was obtained from VWR, Australia. 4-methoxybenzaldehyde
was obtained from Acros Organics, Australia. 4-fluorobenzaldehyde and 1-naphthaldehyde
were obtained from Alfa Aesar, Australia. Formaldehyde, 37% w/w was obtained from Chem
Supply, Australia. All chemicals were used as received with no further purification.
The preparation of Fe3O4@Au nanoparticle catalyst was prepared following the Goon et al1
multiple-stage procedure.
PEI-functionalised Fe3O4 cores synthesis
To synthesise 88 ± 1.5 nm cores of Fe3O4 nanoparticles, 1.3 g of FeSO4.7H2O were dissolved
in 80 mL of Mili-Q water then KNO3 (10 mL, 2.0 M) was added followed by NaOH (10 mL,
1.0 M) under a nitrogen atmosphere. The Fe(OH)2 precipitate was heated at 90 °C in the
Electronic Supplementary Material (ESI) for Dalton Transactions.This journal is © The Royal Society of Chemistry 2017
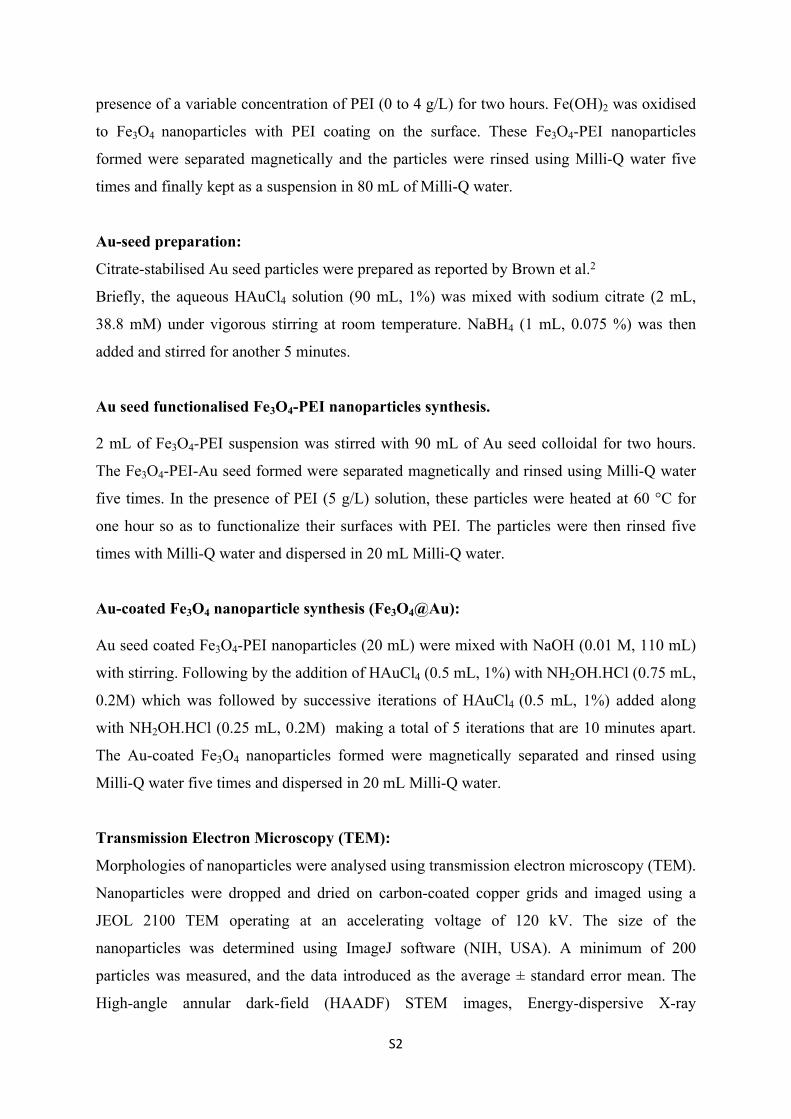
S2
presence of a variable concentration of PEI (0 to 4 g/L) for two hours. Fe(OH)2 was oxidised
to Fe3O4 nanoparticles with PEI coating on the surface. These Fe3O4-PEI nanoparticles
formed were separated magnetically and the particles were rinsed using Milli-Q water five
times and finally kept as a suspension in 80 mL of Milli-Q water.
Au-seed preparation:
Citrate-stabilised Au seed particles were prepared as reported by Brown et al.2
Briefly, the aqueous HAuCl4 solution (90 mL, 1%) was mixed with sodium citrate (2 mL,
38.8 mM) under vigorous stirring at room temperature. NaBH4 (1 mL, 0.075 %) was then
added and stirred for another 5 minutes.
Au seed functionalised Fe3O4-PEI nanoparticles synthesis.
2 mL of Fe3O4-PEI suspension was stirred with 90 mL of Au seed colloidal for two hours.
The Fe3O4-PEI-Au seed formed were separated magnetically and rinsed using Milli-Q water
five times. In the presence of PEI (5 g/L) solution, these particles were heated at 60 °C for
one hour so as to functionalize their surfaces with PEI. The particles were then rinsed five
times with Milli-Q water and dispersed in 20 mL Milli-Q water.
Au-coated Fe3O4 nanoparticle synthesis (Fe3O4@Au):
Au seed coated Fe3O4-PEI nanoparticles (20 mL) were mixed with NaOH (0.01 M, 110 mL)
with stirring. Following by the addition of HAuCl4 (0.5 mL, 1%) with NH2OH.HCl (0.75 mL,
0.2M) which was followed by successive iterations of HAuCl4 (0.5 mL, 1%) added along
with NH2OH.HCl (0.25 mL, 0.2M) making a total of 5 iterations that are 10 minutes apart.
The Au-coated Fe3O4 nanoparticles formed were magnetically separated and rinsed using
Milli-Q water five times and dispersed in 20 mL Milli-Q water.
Transmission Electron Microscopy (TEM):
Morphologies of nanoparticles were analysed using transmission electron microscopy (TEM).
Nanoparticles were dropped and dried on carbon-coated copper grids and imaged using a
JEOL 2100 TEM operating at an accelerating voltage of 120 kV. The size of the
nanoparticles was determined using ImageJ software (NIH, USA). A minimum of 200
particles was measured, and the data introduced as the average ± standard error mean. The
High-angle annular dark-field (HAADF) STEM images, Energy-dispersive X-ray
S3
spectroscopy (EDX) - point mode (elemental analysis) and mapping mode (elemental maps)
were obtained on the FEI Titan G2 80–200 TEM/STEM operating at an accelerating voltage
of 200 kV.
A3-coupling reaction:
In a test tube, Fe3O4@Au (10 mol %), benzaldehyde (1 mmol), piperidine (1 mmol), and
phenylacetylene (1 mmol) were added in 3 mL of toluene and stirred under a nitrogen
atmosphere for 48 hours at 100 °C with reflex. The reaction mixture was cooled to room
temperature and catalyst was recovered magnetically. The catalyst then was washed with
toluene and acetone for three times and air dried for recycling study. Induced couple plasma
(ICP) analysis of the recycling reaction mixture after recovered the catalyst for Au and Fe
concentrations as followed Au (0.06, 0.12, 0.13, 0.30 and 0.41 mg/L) and Fe (0.18, 1.3, 1.8,
0.94 and 3 mg/L) from the first to fifth recycle respectively.
The crude product was analysed using 1H NMR. All the products are known compounds.
The computational studies
The geometries of 13 starting compounds were optimised at B3LYP/6-311G(d,p) level of
theory. The Cartesian coordinates (.xyz) from the optimised geometries were extracted to
generate an input (.cif) for CrystalExplorer 3.2. Promolecular density surface was generated
for each molecule. The lowest unoccupied molecular orbital (LUMO) and electrostatic
potential (ESP) properties of each molecule were mapped on the corresponding promolecular
density surface. Both LUMO and ESP were calculated at B3LYP/6-311G (d,p) level.
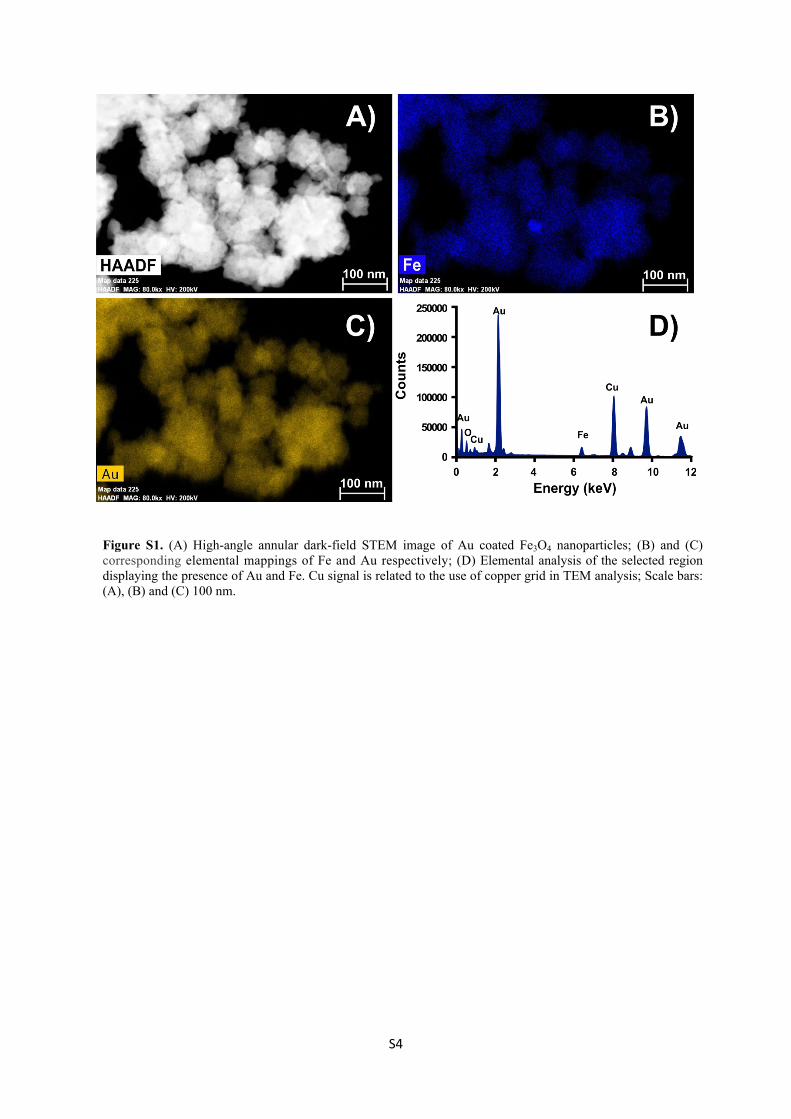
S4
Figure S1. (A) High-angle annular dark-field STEM image of Au coated Fe3O4 nanoparticles; (B) and (C) corresponding elemental mappings of Fe and Au respectively; (D) Elemental analysis of the selected region displaying the presence of Au and Fe. Cu signal is related to the use of copper grid in TEM analysis; Scale bars: (A), (B) and (C) 100 nm.
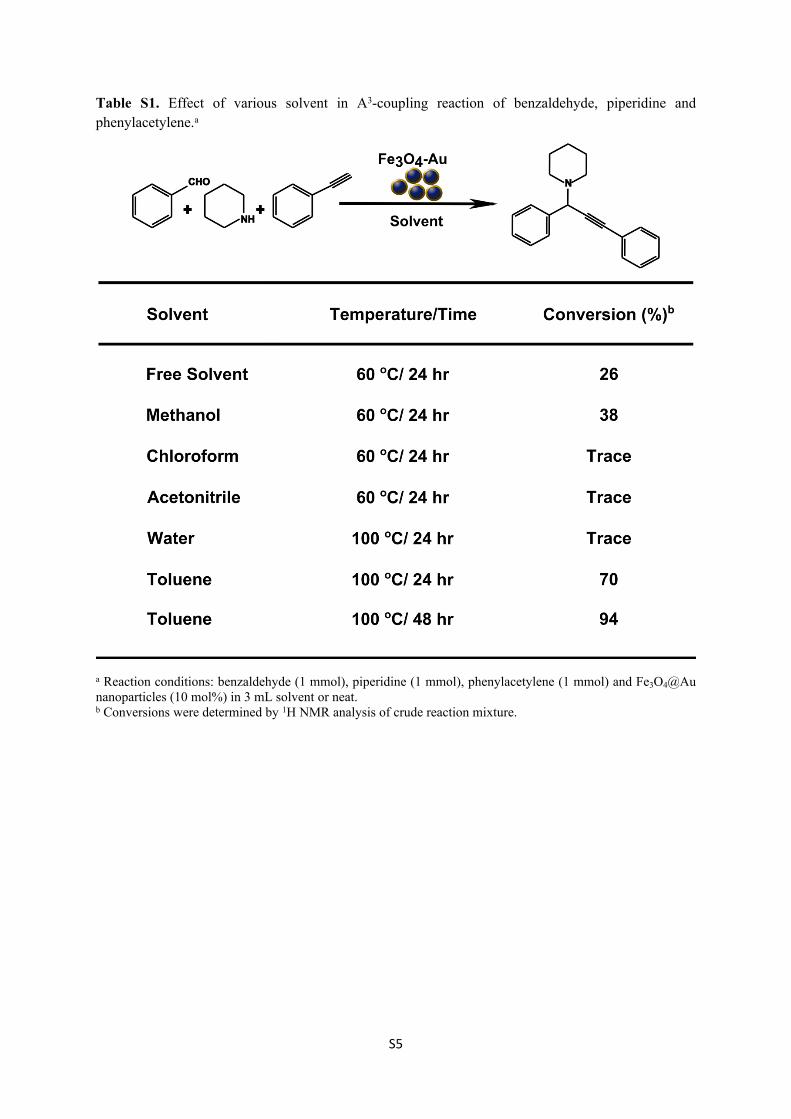
S5
Table S1. Effect of various solvent in A3-coupling reaction of benzaldehyde, piperidine and phenylacetylene.a
a Reaction conditions: benzaldehyde (1 mmol), piperidine (1 mmol), phenylacetylene (1 mmol) and Fe3O4@Au nanoparticles (10 mol%) in 3 mL solvent or neat. b Conversions were determined by 1H NMR analysis of crude reaction mixture.
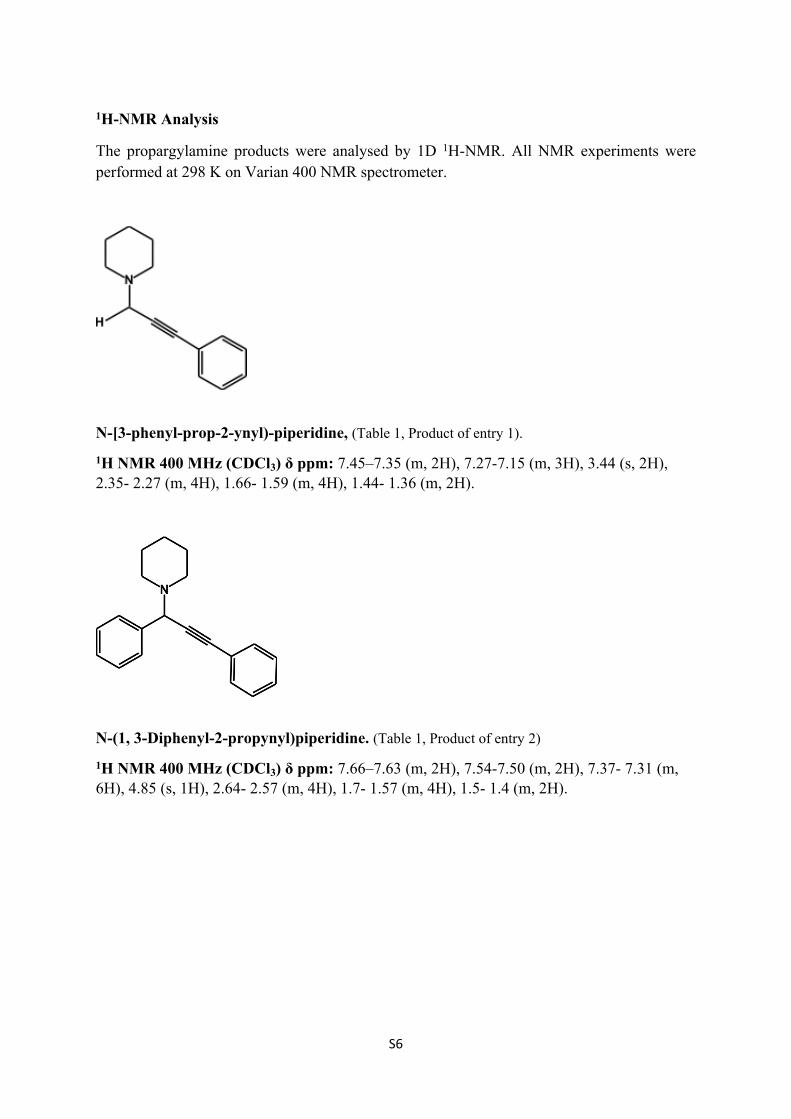
S6
1H-NMR Analysis
The propargylamine products were analysed by 1D 1H-NMR. All NMR experiments were performed at 298 K on Varian 400 NMR spectrometer.
N-[3-phenyl-prop-2-ynyl)-piperidine, (Table 1, Product of entry 1). 1H NMR 400 MHz (CDCl3) δ ppm: 7.45–7.35 (m, 2H), 7.27-7.15 (m, 3H), 3.44 (s, 2H), 2.35- 2.27 (m, 4H), 1.66- 1.59 (m, 4H), 1.44- 1.36 (m, 2H).
N-(1, 3-Diphenyl-2-propynyl)piperidine. (Table 1, Product of entry 2)
1H NMR 400 MHz (CDCl3) δ ppm: 7.66–7.63 (m, 2H), 7.54-7.50 (m, 2H), 7.37- 7.31 (m, 6H), 4.85 (s, 1H), 2.64- 2.57 (m, 4H), 1.7- 1.57 (m, 4H), 1.5- 1.4 (m, 2H).
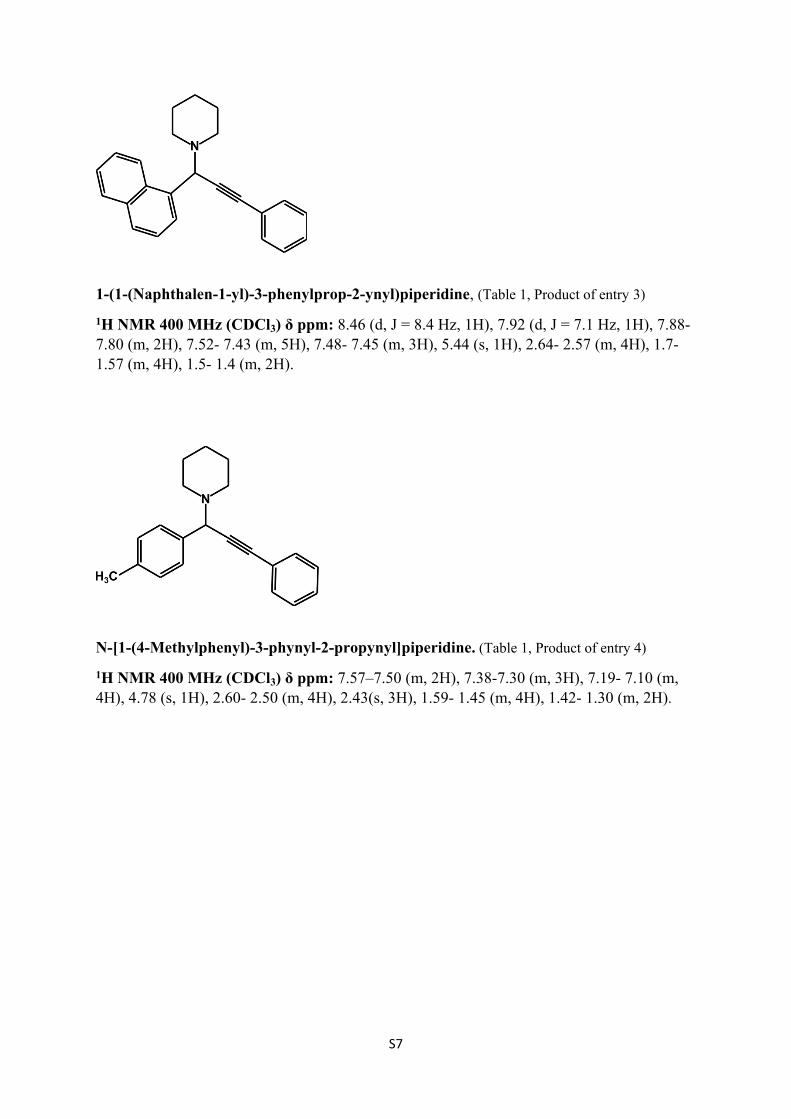
S7
1-(1-(Naphthalen-1-yl)-3-phenylprop-2-ynyl)piperidine, (Table 1, Product of entry 3)
1H NMR 400 MHz (CDCl3) δ ppm: 8.46 (d, J = 8.4 Hz, 1H), 7.92 (d, J = 7.1 Hz, 1H), 7.88- 7.80 (m, 2H), 7.52- 7.43 (m, 5H), 7.48- 7.45 (m, 3H), 5.44 (s, 1H), 2.64- 2.57 (m, 4H), 1.7- 1.57 (m, 4H), 1.5- 1.4 (m, 2H).
N-[1-(4-Methylphenyl)-3-phynyl-2-propynyl]piperidine. (Table 1, Product of entry 4)
1H NMR 400 MHz (CDCl3) δ ppm: 7.57–7.50 (m, 2H), 7.38-7.30 (m, 3H), 7.19- 7.10 (m, 4H), 4.78 (s, 1H), 2.60- 2.50 (m, 4H), 2.43(s, 3H), 1.59- 1.45 (m, 4H), 1.42- 1.30 (m, 2H).
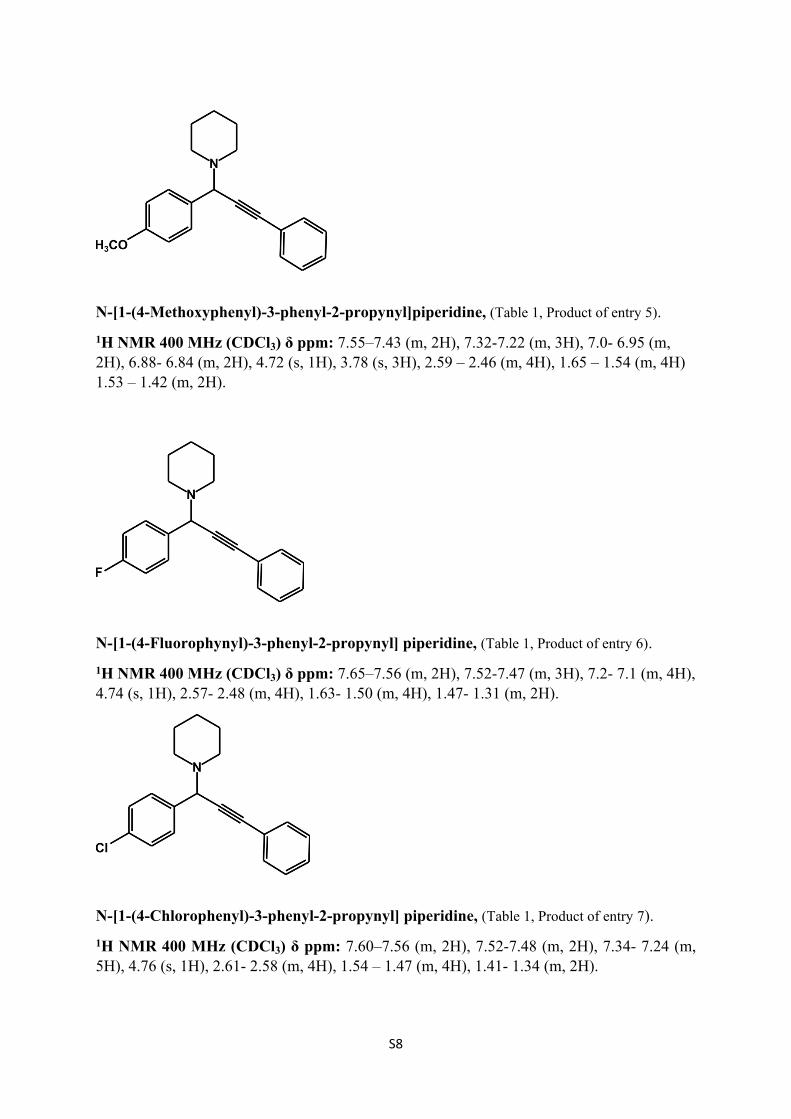
S8
N-[1-(4-Methoxyphenyl)-3-phenyl-2-propynyl]piperidine, (Table 1, Product of entry 5). 1H NMR 400 MHz (CDCl3) δ ppm: 7.55–7.43 (m, 2H), 7.32-7.22 (m, 3H), 7.0- 6.95 (m, 2H), 6.88- 6.84 (m, 2H), 4.72 (s, 1H), 3.78 (s, 3H), 2.59 – 2.46 (m, 4H), 1.65 – 1.54 (m, 4H) 1.53 – 1.42 (m, 2H).
N-[1-(4-Fluorophynyl)-3-phenyl-2-propynyl] piperidine, (Table 1, Product of entry 6).1H NMR 400 MHz (CDCl3) δ ppm: 7.65–7.56 (m, 2H), 7.52-7.47 (m, 3H), 7.2- 7.1 (m, 4H), 4.74 (s, 1H), 2.57- 2.48 (m, 4H), 1.63- 1.50 (m, 4H), 1.47- 1.31 (m, 2H).
N-[1-(4-Chlorophenyl)-3-phenyl-2-propynyl] piperidine, (Table 1, Product of entry 7). 1H NMR 400 MHz (CDCl3) δ ppm: 7.60–7.56 (m, 2H), 7.52-7.48 (m, 2H), 7.34- 7.24 (m, 5H), 4.76 (s, 1H), 2.61- 2.58 (m, 4H), 1.54 – 1.47 (m, 4H), 1.41- 1.34 (m, 2H).
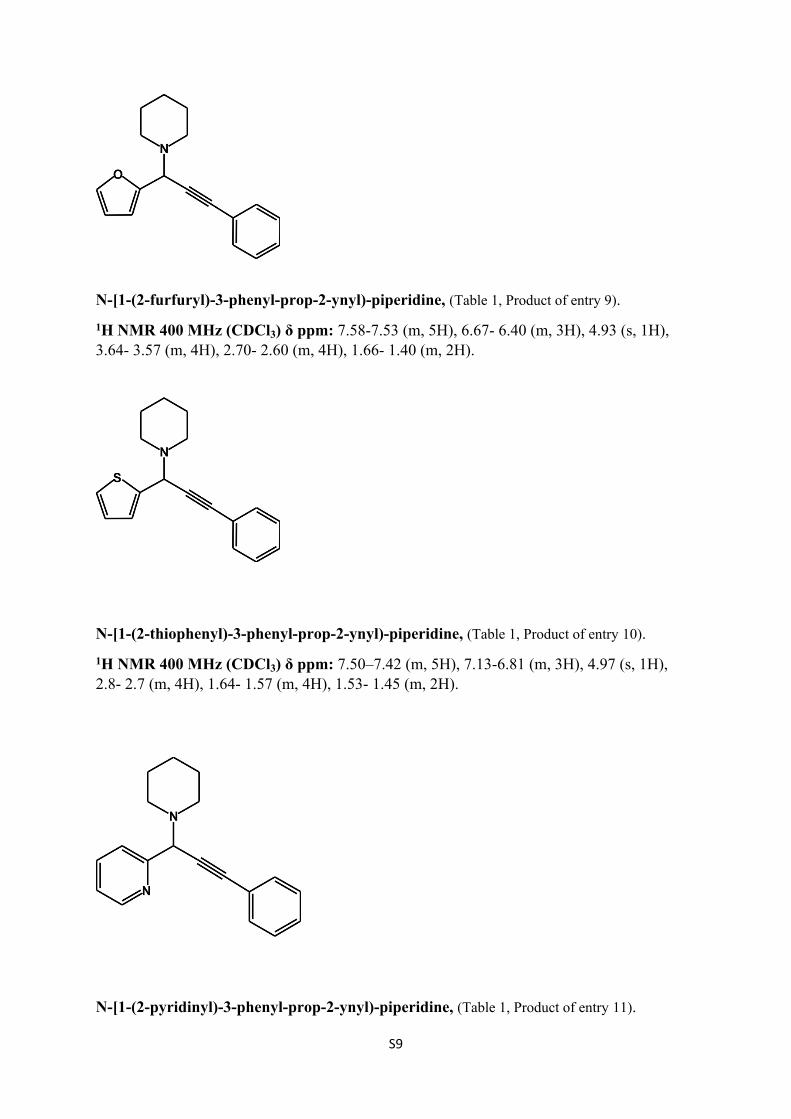
S9
N-[1-(2-furfuryl)-3-phenyl-prop-2-ynyl)-piperidine, (Table 1, Product of entry 9). 1H NMR 400 MHz (CDCl3) δ ppm: 7.58-7.53 (m, 5H), 6.67- 6.40 (m, 3H), 4.93 (s, 1H), 3.64- 3.57 (m, 4H), 2.70- 2.60 (m, 4H), 1.66- 1.40 (m, 2H).
N-[1-(2-thiophenyl)-3-phenyl-prop-2-ynyl)-piperidine, (Table 1, Product of entry 10). 1H NMR 400 MHz (CDCl3) δ ppm: 7.50–7.42 (m, 5H), 7.13-6.81 (m, 3H), 4.97 (s, 1H), 2.8- 2.7 (m, 4H), 1.64- 1.57 (m, 4H), 1.53- 1.45 (m, 2H).
N-[1-(2-pyridinyl)-3-phenyl-prop-2-ynyl)-piperidine, (Table 1, Product of entry 11).
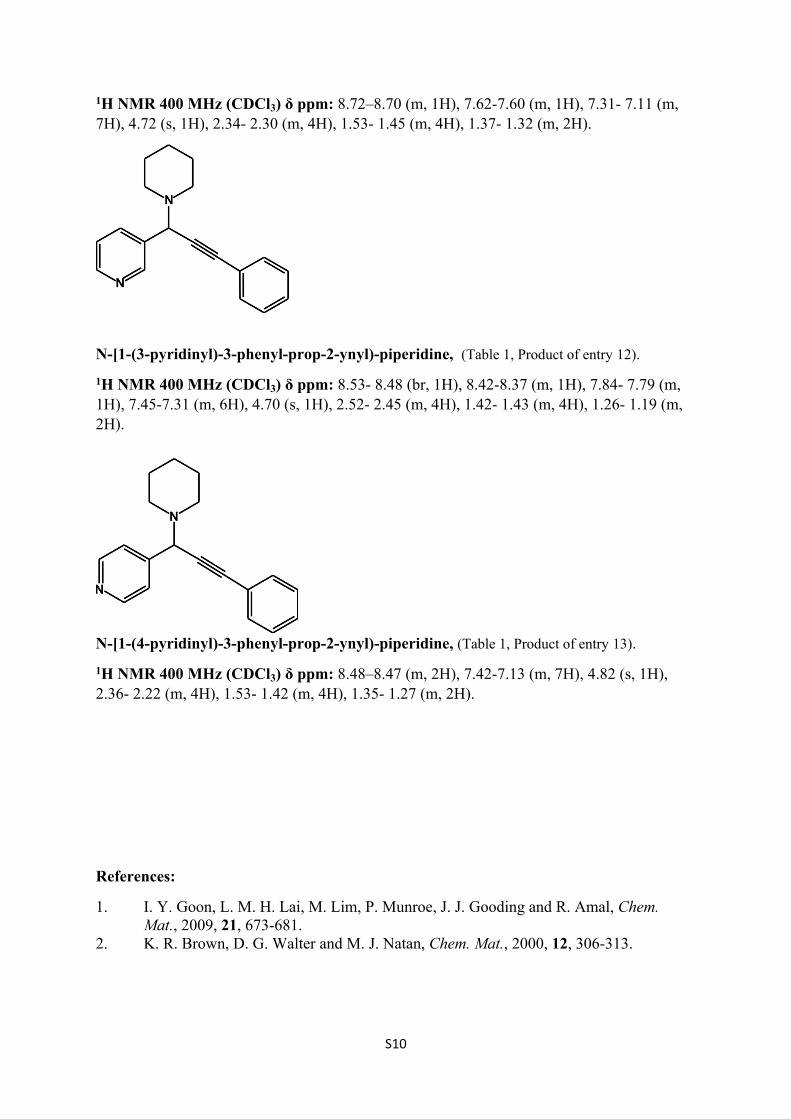
S10
1H NMR 400 MHz (CDCl3) δ ppm: 8.72–8.70 (m, 1H), 7.62-7.60 (m, 1H), 7.31- 7.11 (m, 7H), 4.72 (s, 1H), 2.34- 2.30 (m, 4H), 1.53- 1.45 (m, 4H), 1.37- 1.32 (m, 2H).
N-[1-(3-pyridinyl)-3-phenyl-prop-2-ynyl)-piperidine, (Table 1, Product of entry 12). 1H NMR 400 MHz (CDCl3) δ ppm: 8.53- 8.48 (br, 1H), 8.42-8.37 (m, 1H), 7.84- 7.79 (m, 1H), 7.45-7.31 (m, 6H), 4.70 (s, 1H), 2.52- 2.45 (m, 4H), 1.42- 1.43 (m, 4H), 1.26- 1.19 (m, 2H).
N-[1-(4-pyridinyl)-3-phenyl-prop-2-ynyl)-piperidine, (Table 1, Product of entry 13).1H NMR 400 MHz (CDCl3) δ ppm: 8.48–8.47 (m, 2H), 7.42-7.13 (m, 7H), 4.82 (s, 1H), 2.36- 2.22 (m, 4H), 1.53- 1.42 (m, 4H), 1.35- 1.27 (m, 2H).
References:
1. I. Y. Goon, L. M. H. Lai, M. Lim, P. Munroe, J. J. Gooding and R. Amal, Chem. Mat., 2009, 21, 673-681.
2. K. R. Brown, D. G. Walter and M. J. Natan, Chem. Mat., 2000, 12, 306-313.
1
Supporting Information
Dendronised polymers as templates for in-situ one-pot quantum dot synthesis
Alaa M. Munshi, Jessica A. Kretzmann, Cameron W. Evans, Anna M. Ranieri, Zibeon Schildkraut,
Massimiliano Massi, Marck Norret, Martin Saunders, and K. Swaminathan Iyer*
Materials and Methods
Copper (I) bromide (CuBr), 2-hydroxyethyl methacrylate (HEMA), glycidyl methacrylate (GMA), 2,2′-
bipyridine (bpy), dimethylformamide (DMF), sodium azide, ammonium chloride, pentamethyldiethylene
triamine, N-hydroxysuccinimide, dichloromethane, 3-mercaptopropionic acid, 1,3-dicyclohexylcarbodi-
imide, methanol (MeOH), diethyl ether, and sodium borohydride (NaBH4) were purchased from Sigma-
Aldrich. Cadmium nitrate tetrahydrate was obtained from Analar, Australia. Sodium hydroxide (NaOH)
was obtained from Fluka, Australia. Hydrochloric acid (HCl, 32%) was purchased from Merck, Australia.
2-(4-Morpholino)ethyl 2-bromoisobutyrate was prepared as reported by Weaver et al.1 Milli-Q water was
used to prepare all aqueous solutions. All chemicals were used as received without any purification.
Instrumental characterisation of polymer 1H NMR spectra were measured using a Bruker 500 MHz spectrometer, with CD3OD as the solvent for
copolymers, azido-functionalised copolymers and dendronised polymers. CDCl3 was used for 3-
mercaptopropanyl-N-hydroxysuccinimide ester. The chemical shifts were referred to the solvent peak, δ =
3.31 ppm for CD3OD and 7.26 ppm for CDCl3. IR spectra were obtained using PerkinElmer Spectrum One
FT-IR spectrometer. Gel permeation chromatography (GPC) was used to determine the molecular weight
and polydispersity index of polymers (Waters Styragel HR 4 DMF 4.6 × 300 mm column, 5 µm). Agilent
Technologies 1100 Series GPC and Agilent GPC software were utilised for measurements and data analysis
respectively. Measurements were taken using DMF as the eluent at a flow rate of 0.3 mL/min at 50 °C, and
calibrated against poly(methyl methacrylate) (PMMA) standard. Elemental analysis was conducted at the
Campbell Microanalytical Laboratory, University of Otago. The carbon, hydrogen and nitrogen content of
each sample was determined via the ‘flash combustion’ method using a Carlo Erba Elemental Analyser EA
1108.
Characterisation of CdTe QD–polymer nanocomposites
Morphologies of CdTe QDs-polymer nanocomposites were studied using transmission electron microscopy
(TEM). A drop of colloidal QDs-polymer nanocomposites was placed and dried on carbon-coated copper
2
grids and imaged using JEOL 2100F TEM with an accelerating voltage of 120 kV. Energy-dispersive X-
ray spectroscopy (EDX), elemental maps, and high-resolution transmission electron image, were acquired
using an FEI Titan G2 80–200 TEM/STEM at an accelerating voltage of 200 kV.
Photophysics of CdTe QDs-polymer nanocomposites
Absorption spectra were recorded at room temperature using a Perkin-Elmer Lambda 35 UV-Vis
spectrometer. Uncorrected steady-state emission and excitation spectra were recorded on an Edinburgh
FLSP980 spectrometer equipped with a 450 W Xenon arc lamp, double excitation and single emission
monochromators, and a Peltier-cooled Hamamatsu R928P photomultiplier tube (185–850 nm). Emission
and excitation spectra were corrected for the source intensity (lamp and grating) and emission spectral
response (detector and grating) by using a calibration curve supplied with the instrument. Quantum yields
(Φ) were determined using the optically dilute method of Demas et al.2 at excitation wavelengths obtained
from absorption spectra on a wavelength scale (nm) and compared to the reference emitter by using the
following equation:
Φ = ΦA (λ )A (λ )
I (λ )I (λ )
nn
DD
Where A is the absorbance at the excitation wavelength (λ), I is the intensity of the excitation light at the
excitation wavelength (λ), n is the refractive index of the solvent, D is the integrated intensity of the
luminescence, and Φ is the quantum yield. The subscripts r and s refer to the reference and the sample,
respectively. An air-equilibrated water solution of quinine sulphate in 0.1 M H2SO4 (Φr = 0.546) was used
as the reference.3 The quantum yield determinations were performed at identical excitation wavelengths for
the sample and the reference, therefore deleting the I(λr)/I(λs) term in the equation. Emission lifetimes (τ)
were determined by the single photon counting technique (TCSPC) with the same Edinburgh FLSP980
spectrometer using a pulsed picosecond LED (EPLED 295 or EPLED 360, fhwm <800 ps) as the excitation
source, at repetition rates between 1 kHz and 1 MHz, and the above-mentioned R928P PMT as the detector.
The best fit was assessed by minimising the reduced χ2 function and by visual inspection of the weighted
residuals. Experimental uncertainties were estimated to be ±8% for lifetime determinations, ±20% for
quantum yields, and ±2 nm and ±5 nm for absorption and emission peaks, respectively.
Synthesis of CdTe QDs-polymer nanocomposite
The CdTe QDs-polymer nanocomposite was synthesised following a multistep method as reported below:
3
Synthesis of P(HEMA0.72-ran-GMA0.28) copolymer
Synthesis of poly(hydroxyethyl methacrylate-ran-glycidyl methacrylate) was adapted from Weaver et al.1
A random statistical copolymer consisting of 72 mol% hydroxyethyl methacrylate and 28 mol% glycidyl
methacrylate was synthesised using an atom transfer radical polymerisation method. Briefly, inhibitors for
hydroxyethyl methacrylate (HEMA) and glycidyl methacrylate (GMA) were removed using a basic
alumina column. Each monomer was dissolved in methanol (MeOH) at a volume ratio of 1:3 (monomer:
MeOH). Prior to use, each monomer solution was degassed using standard ‘freeze-pump-thaw’ method and
backfilled with argon gas. Copper (I) bromide (CuBr, 100 mg, 0.70 mmol) was added to the flask, followed
by 2,2′-bipyridine (bpy, 392 mg, 2.5 mmol) before monomer solutions were added. Feed ratios of each of
the monomer solutions were as follows: HEMA (9.6 mL, 19.7 mmol) and GMA (6.4 mL, 12.0 mmol). 2-
(4-Morpholino)ethyl 2-bromoisobutyrate initiator (ME-Br, 210 µL, 1 mmol) was added, and the reaction
was completed at 80 °C in standard Schlenk conditions for 2 h. The reaction was opened to air and MeOH
(15 mL) added. The product was collected under reduced pressure and redissolved in minimal MeOH, then
collected and purified by repeated precipitation in excess diethyl ether and centrifugation (3000 rpm, 10
min). The solid product was dried overnight under vacuum and collected at ~70% yield with Mw of 17.5
kDa and PDI of 1.30. Resulting copolymer was identified via 1H NMR (500 MHz, CD3OD), where the
appearance of peaks δH 2.70 (1H, br) and 2.87 (1H, br) correspond to the epoxide moiety, confirming the
presence of GMA.
Azido functionalisation
The copolymer (1.0 g, 2.1 mmol epoxide) was dissolved in dimethylformamide (DMF, 20 mL). Sodium
azide (1.2 g, 18.4 mmol) followed by ammonium chloride (1.0 g, 18.6 mmol) were added to the stirring
solution. The reaction proceeded at 60 °C for 72 h before the solution was cooled and centrifuged to remove
solid. The azide-functionalised polymer was collected at ~80% yield by repetitive precipitation in ether,
and dried under vacuum.
Synthesis of dendron
3.5 generation propargyl-functionalised poly(amidoamine) (PAMAM) dendrons were synthesised via a
method adapted from J.W. Lee et al. and Y.-J. Lin et al.4, 5
Click reaction
3.5 generation propargyl-PAMAM dendron (1.6 g, 0.53 mmol) was dissolved in DMF (15 mL) before the
addition of azido-functionalised copolymer (100 mg, 211.4 µmol epoxide). Pentamethyldiethylene triamine
(PMDETA, 112 µL, 0.55mmol) was added to the reaction solution and then the solution was degassed via
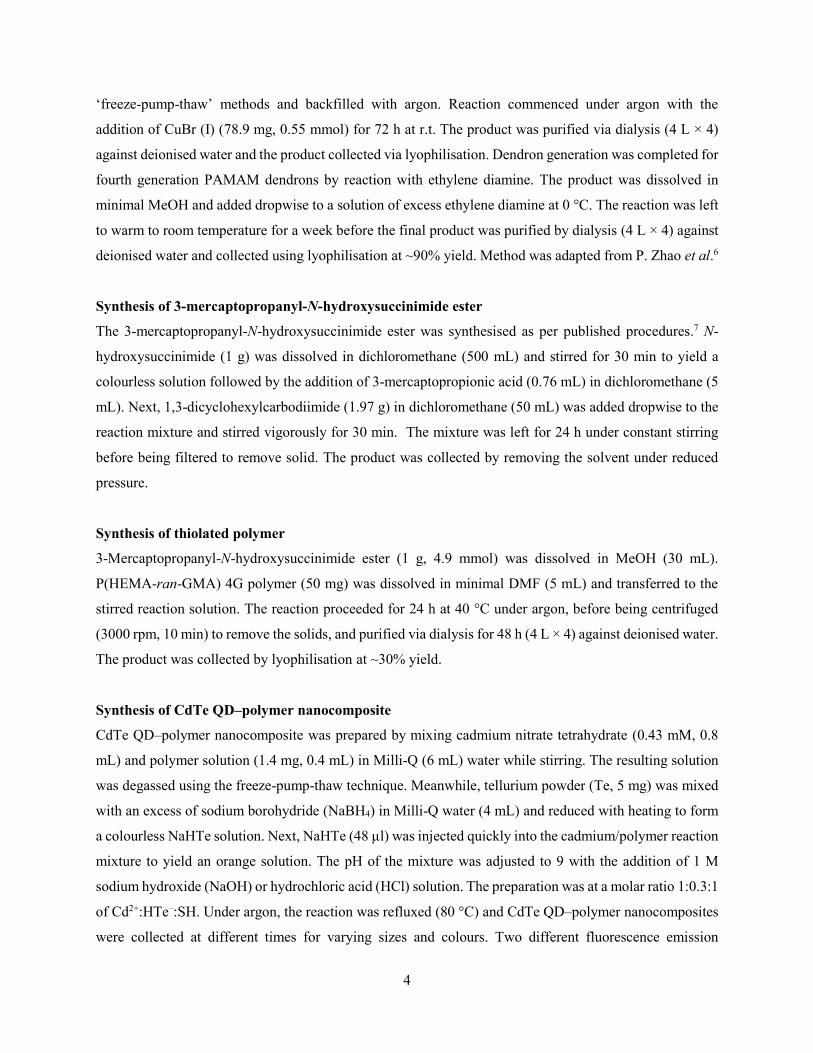
4
‘freeze-pump-thaw’ methods and backfilled with argon. Reaction commenced under argon with the
addition of CuBr (I) (78.9 mg, 0.55 mmol) for 72 h at r.t. The product was purified via dialysis (4 L × 4)
against deionised water and the product collected via lyophilisation. Dendron generation was completed for
fourth generation PAMAM dendrons by reaction with ethylene diamine. The product was dissolved in
minimal MeOH and added dropwise to a solution of excess ethylene diamine at 0 °C. The reaction was left
to warm to room temperature for a week before the final product was purified by dialysis (4 L × 4) against
deionised water and collected using lyophilisation at ~90% yield. Method was adapted from P. Zhao et al.6
Synthesis of 3-mercaptopropanyl-N-hydroxysuccinimide ester
The 3-mercaptopropanyl-N-hydroxysuccinimide ester was synthesised as per published procedures.7 N-
hydroxysuccinimide (1 g) was dissolved in dichloromethane (500 mL) and stirred for 30 min to yield a
colourless solution followed by the addition of 3-mercaptopropionic acid (0.76 mL) in dichloromethane (5
mL). Next, 1,3-dicyclohexylcarbodiimide (1.97 g) in dichloromethane (50 mL) was added dropwise to the
reaction mixture and stirred vigorously for 30 min. The mixture was left for 24 h under constant stirring
before being filtered to remove solid. The product was collected by removing the solvent under reduced
pressure.
Synthesis of thiolated polymer
3-Mercaptopropanyl-N-hydroxysuccinimide ester (1 g, 4.9 mmol) was dissolved in MeOH (30 mL).
P(HEMA-ran-GMA) 4G polymer (50 mg) was dissolved in minimal DMF (5 mL) and transferred to the
stirred reaction solution. The reaction proceeded for 24 h at 40 °C under argon, before being centrifuged
(3000 rpm, 10 min) to remove the solids, and purified via dialysis for 48 h (4 L × 4) against deionised water.
The product was collected by lyophilisation at ~30% yield.
Synthesis of CdTe QD–polymer nanocomposite
CdTe QD–polymer nanocomposite was prepared by mixing cadmium nitrate tetrahydrate (0.43 mM, 0.8
mL) and polymer solution (1.4 mg, 0.4 mL) in Milli-Q (6 mL) water while stirring. The resulting solution
was degassed using the freeze-pump-thaw technique. Meanwhile, tellurium powder (Te, 5 mg) was mixed
with an excess of sodium borohydride (NaBH4) in Milli-Q water (4 mL) and reduced with heating to form
a colourless NaHTe solution. Next, NaHTe (48 µl) was injected quickly into the cadmium/polymer reaction
mixture to yield an orange solution. The pH of the mixture was adjusted to 9 with the addition of 1 M
sodium hydroxide (NaOH) or hydrochloric acid (HCl) solution. The preparation was at a molar ratio 1:0.3:1
of Cd2+:HTe–:SH. Under argon, the reaction was refluxed (80 °C) and CdTe QD–polymer nanocomposites
were collected at different times for varying sizes and colours. Two different fluorescence emission

5
wavelengths CdTe QD-polymer nanocomposites were achieved: green (537 nm) and yellow (561 nm), by
changing the refluxing time to 10 h and 19 h respectively.
Determination of the size of CdTe QDs–polymer nanocomposite
Using the empirical relationship given by Peng et al.,8 the size of the green and yellow CdTe QD–polymer
nanocomposite were calculated using the following:
D (CdTe) = (9.8127 × 10 )λ − (1.7147 × 10 )λ + (1.0064)λ − (194.84)
Where D is the diameter of CdTe QDs (nm) and λ is the wavelength of the first absorption peak (nm).
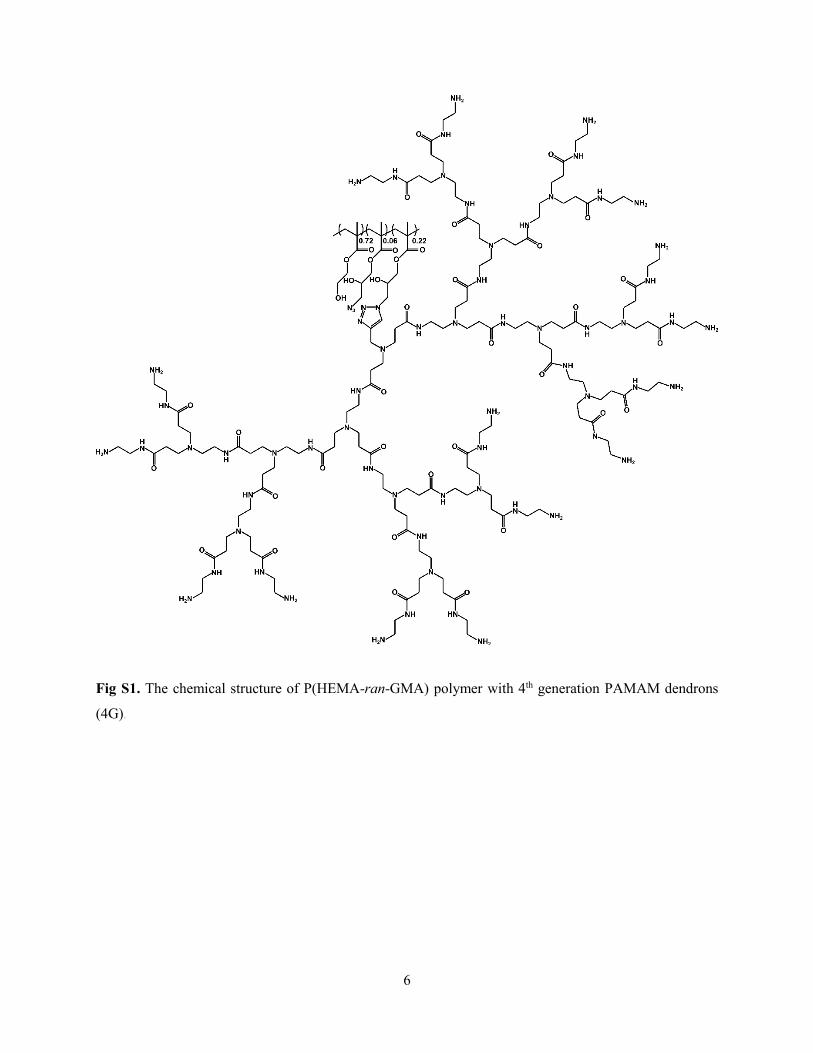
6
Fig S1. The chemical structure of P(HEMA-ran-GMA) polymer with 4th generation PAMAM dendrons
(4G).
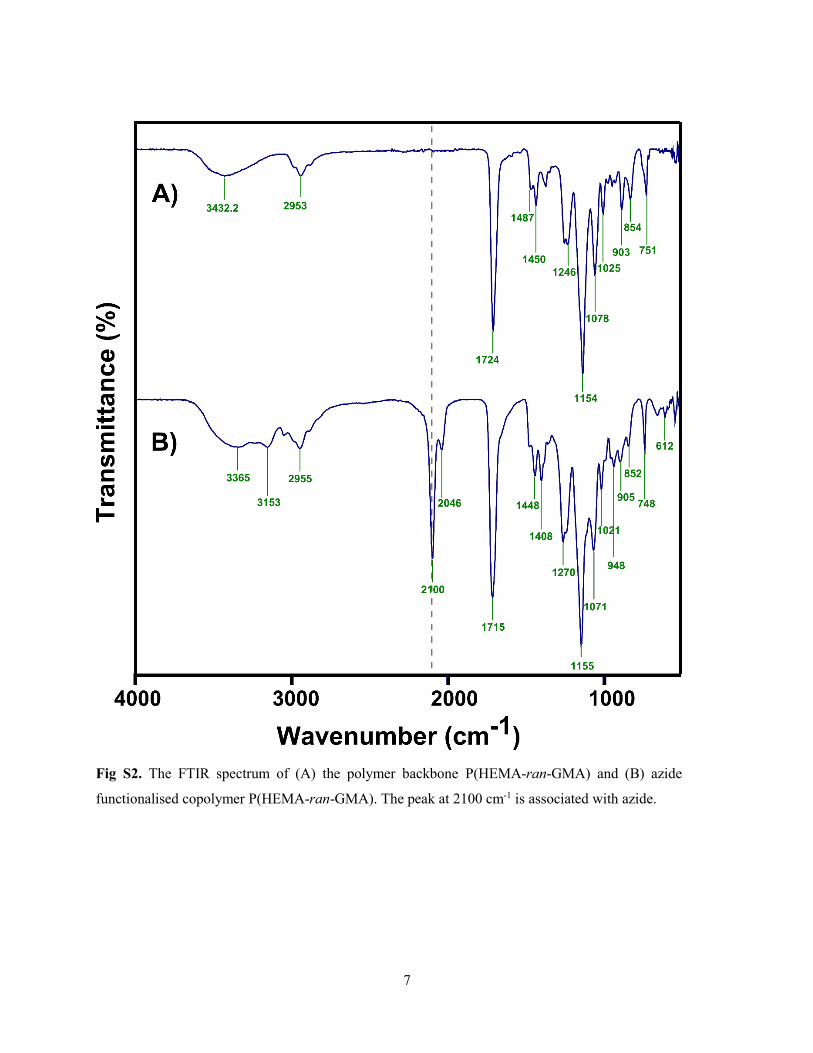
7
Fig S2. The FTIR spectrum of (A) the polymer backbone P(HEMA-ran-GMA) and (B) azide
functionalised copolymer P(HEMA-ran-GMA). The peak at 2100 cm-1 is associated with azide.
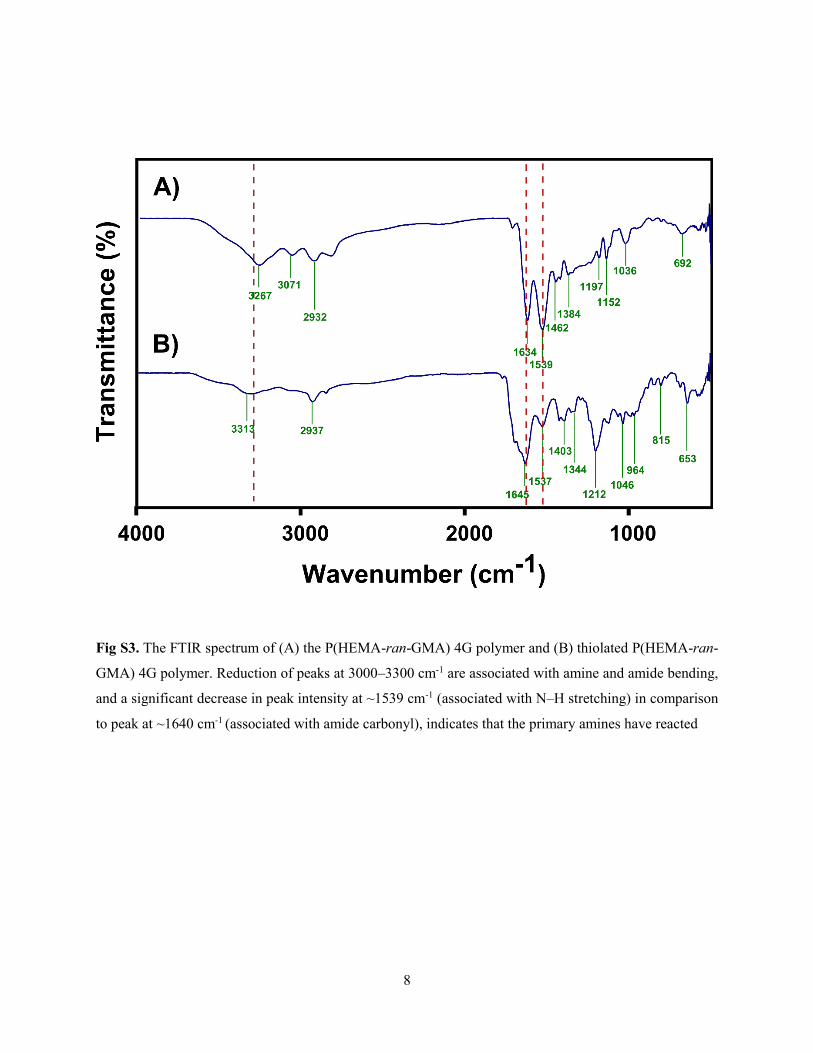
8
Fig S3. The FTIR spectrum of (A) the P(HEMA-ran-GMA) 4G polymer and (B) thiolated P(HEMA-ran-
GMA) 4G polymer. Reduction of peaks at 3000–3300 cm-1 are associated with amine and amide bending,
and a significant decrease in peak intensity at ~1539 cm-1 (associated with N–H stretching) in comparison
to peak at ~1640 cm-1 (associated with amide carbonyl), indicates that the primary amines have reacted
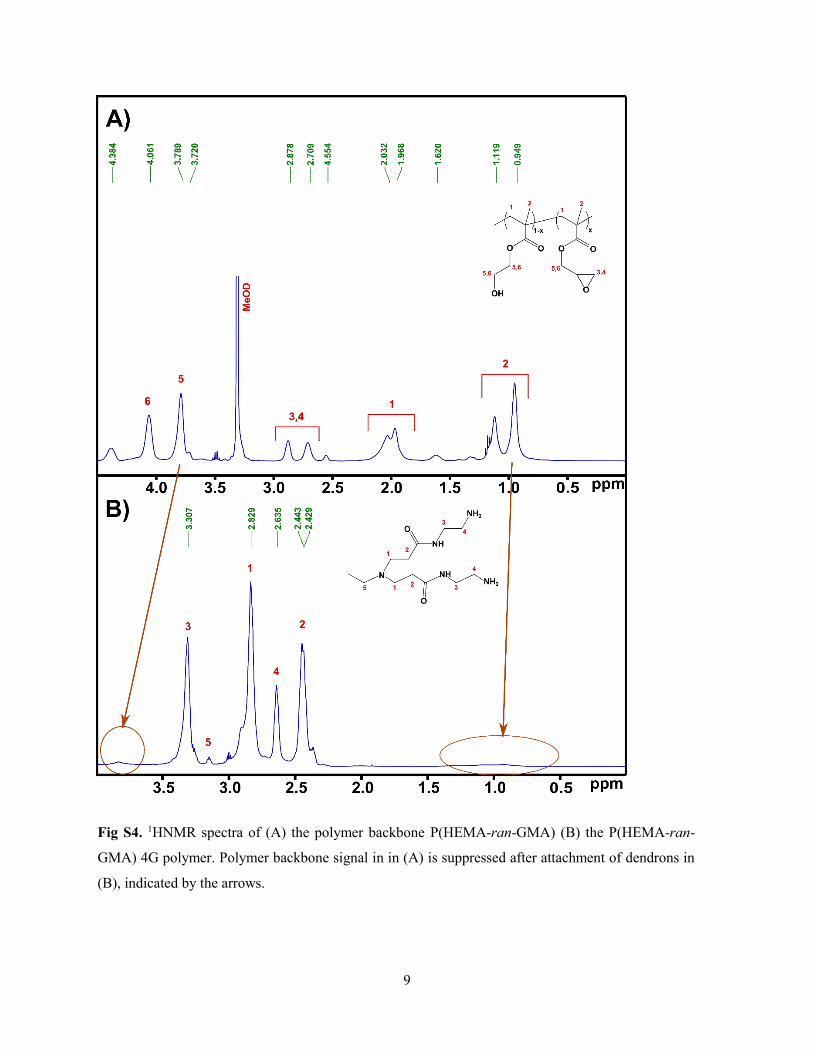
9
Fig S4. 1HNMR spectra of (A) the polymer backbone P(HEMA-ran-GMA) (B) the P(HEMA-ran-
GMA) 4G polymer. Polymer backbone signal in in (A) is suppressed after attachment of dendrons in
(B), indicated by the arrows.
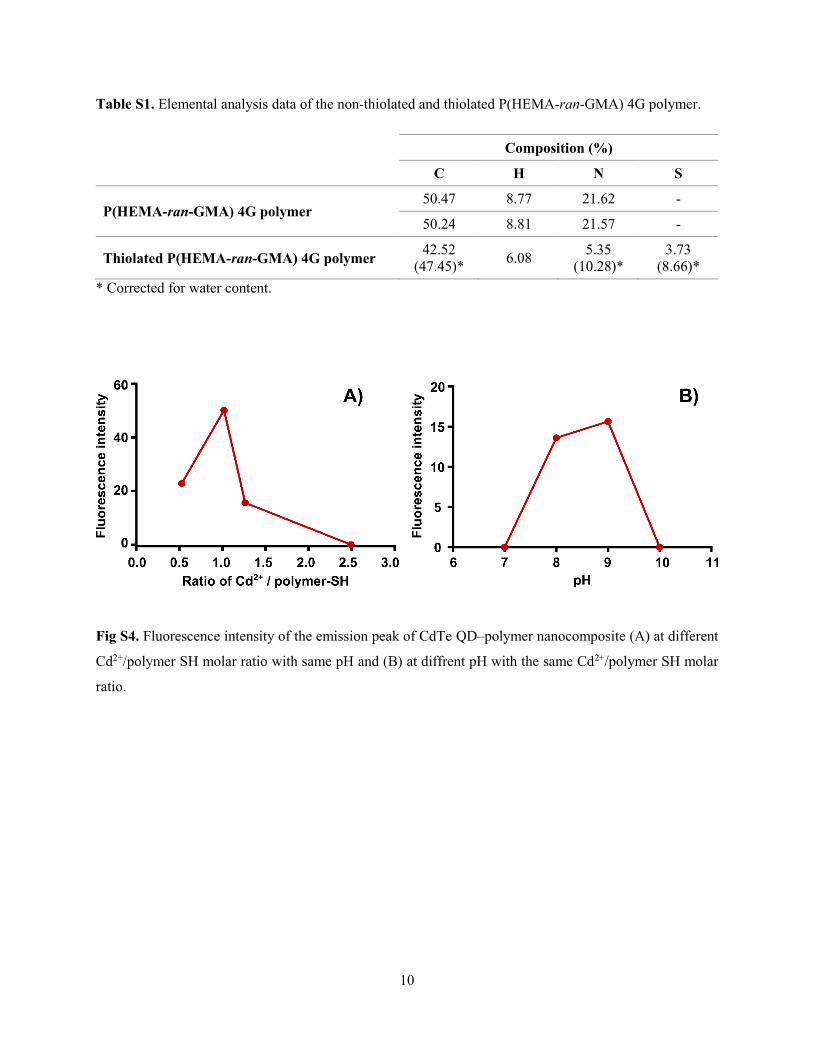
10
Table S1. Elemental analysis data of the non-thiolated and thiolated P(HEMA-ran-GMA) 4G polymer.
Composition (%)
C H N S
P(HEMA-ran-GMA) 4G polymer 50.47 8.77 21.62 -
50.24 8.81 21.57 -
Thiolated P(HEMA-ran-GMA) 4G polymer 42.52 (47.45)* 6.08 5.35
(10.28)* 3.73
(8.66)* * Corrected for water content.
Fig S4. Fluorescence intensity of the emission peak of CdTe QD–polymer nanocomposite (A) at different
Cd2+/polymer SH molar ratio with same pH and (B) at diffrent pH with the same Cd2+/polymer SH molar
ratio.
11
References:
1. J. V. M. Weaver, I. Bannister, K. L. Robinson, X. Bories-Azeau, S. P. Armes, M.
Smallridge and P. McKenna, Macromolecules, 2004, 37, 2395-2403.
2. G. A. Crosby and J. N. Demas, J. Phys. Chem., 1971, 75, 991-1024.
3. D. F. Eaton, Pure and Applied Chemistry, 1988, 60, 1107.
4. J. W. Lee, B.-K. Kim, H. J. Kim, S. C. Han, W. S. Shin and S.-H. Jin, Macromolecules,
2006, 39, 2418-2422.
5. Y.-J. Lin, B.-K. Tsai, C.-J. Tu, J. Jeng and C.-C. Chu, Tetrahedron, 2013, 69, 1801-1807.
6. P. Zhao, Y. Yan, X. Feng, L. Liu, C. Wang and Y. Chen, Polymer, 2012, 53, 1992-2000.
7. S. Connolly, S. N. Rao and D. Fitzmaurice, J. Phys. Chem. B, 2000, 104, 4765-4776.
8. W. W. Yu, L. Qu, W. Guo and X. Peng, Chem. Mat., 2003, 15, 2854-2860.
Page | 155
Appendix B
PUBLISHED PAPERS NOT INCLUDED IN THE THESIS 1. Ho, D.; Zou, J.; Chen, X.; Munshi, A.; Smith, N. M.; Agarwal, V.; Hodgetts, S. I.;
Plant, G. W.; Bakker, A. J.; Harvey, A. R.; Luzinov, I.; Iyer, K. S., Hierarchical
Patterning of Multifunctional Conducting Polymer Nanoparticles as a Bionic
Platform for Topographic Contact Guidance. ACS Nano 2015, 9 (2), 1767-1774.
(Published)
2. Agarwal, V., Ho, D., Ho, D., Galabura, Y., Yasin, F. M.D., Gong, P., Ye, W., Singh,
R., Munshi, A., Saunders, M., Woodward, R. C., St. Pierre, T., Wood, F.M., Fear, M.,
Lorenser, D., Sampson, D. D., Zdyrko, B., Smith, N.M., Luzinov, I., Iyer, K.S., A
Functional Reactive Polymer Electrospun Matrix, ACS Applied Materials &
Interfaces 2016 8 (7), 4934-4939. (Published)
3. Smith, N. M.; Ho, D.; Munshi. A. M.; House, M. J.; Dunlop, S. A.; Fitzgerald,
M.; Iyer, K. S., Poly(glycidyl methacrylate) coated dual mode upconverting
nanoparticles for neuronal cell imaging. New Journal of Chemistry 2016, 40 (8),
6692-6696. (Published).
HO ET AL . VOL. 9 ’ NO. 2 ’ 1767–1774 ’ 2015
www.acsnano.org
1767
January 26, 2015
C 2015 American Chemical Society
Hierarchical Patterning ofMultifunctional Conducting PolymerNanoparticles as a Bionic Platform forTopographic Contact GuidanceDominic Ho,†,‡ Jianli Zou,§ Xianjue Chen,†,0 Alaa Munshi,† Nicole M. Smith,†, ) Vipul Agarwal,†
Stuart I.Hodgetts,‡GilesW.Plant,^Anthony J.Bakker,‡AlanR.Harvey,‡ Igor Luzinov,# andK.Swaminathan Iyer*,†
†School of Chemistry and Biochemistry, The University of Western Australia, Crawley, Western Australia 6009, Australia, ‡School of Anatomy, Physiology and HumanBiology, The University of Western Australia, Crawley, Western Australia 6009, Australia, §Institute for Integrated Cell-Material Sciences (iCeMS), iCeMS Complex 2,Kyoto University, Yoshida-Honmachi, Sakyo-ku, Kyoto, 606-8501, Japan, )Experimental and Regenerative Neurosciences, School of Animal Biology, The University ofWestern Australia, Crawley, Western Australia 6009, Australia, ^Stanford Partnership for Spinal Cord Injury and Repair, Department of Neurosurgery,Stanford University School of Medicine, Stanford, California 94305, United States, and #School of Materials Science and Engineering, Clemson University, Clemson,South Carolina 29634, United States. 0Present address: Centre for NanoScale Science and Technology, School of Chemical and Physical Sciences, Flinders University,Bedford Park, Adelaide, SA 5042, Australia.
Exogenous electrical stimulation hasbeen effectively used both in clinicalpractice and in laboratory research
to regulate cell-type-dependent adhesion,differentiation, and growth.1 This phenom-enon of introducing programmed electricalsignals locally to influence biological eventshas resulted in the pursuit of sophisticatedmedical bionic devices.2 An important prop-erty that dictates the performance of mostbionic electrodes is the electrode/cellularinterface and its ability to transmit chargeacross the biointerface.3 Traditionally metal-lic electrodesmadeofplatinum, gold, iridiumoxide, tungsten, their alloys, and morerecently carbon fibers have been effectively
employed in bionic devices.4 They havebeen employed for deep brain stimulation,as cochlear implants, for vagus nerve stimu-lation to treat epilepsy, and for stimulatingregeneration in the central nervous sys-tem.2 However, stiff metal electrodes sufferamajor drawback of eliciting tissue damageover long-term implantation.2 Importantly,it is now recognized that nanoscale patternsprovide topographic guidance cues forcells. This has been widely exploited toengineer sophisticated regenerative plat-forms for nerves, muscles, skin, and bones.5
The need to incorporate large-area nano-scale patterns for bionic applications coupledwith the demand toward miniaturization of
* Address correspondence [email protected].
Received for review November 20, 2014and accepted January 26, 2015.
Published online10.1021/nn506607x
ABSTRACT The use of programmed electrical signals to influence
biological events has been a widely accepted clinical methodology for
neurostimulation. An optimal biocompatible platform for neural
activation efficiently transfers electrical signals across the electrode!cell interface and also incorporates large-area neural guidance
conduits. Inherently conducting polymers (ICPs) have emerged as
frontrunners as soft biocompatible alternatives to traditionally used
metal electrodes, which are highly invasive and elicit tissue damage
over long-term implantation. However, fabrication techniques for the
ICPs suffer a major bottleneck, which limits their usability and medical translation. Herein, we report that these limitations can be overcome using colloidal
chemistry to fabricate multimodal conducting polymer nanoparticles. Furthermore, we demonstrate that these polymer nanoparticles can be precisely
assembled into large-area linear conduits using surface chemistry. Finally, we validate that this platform can act as guidance conduits for neurostimulation,
whereby the presence of electrical current induces remarkable dendritic axonal sprouting of cells.
KEYWORDS: multimodal nanoparticles . conducting polymers . capillary force lithography . neurostimulation
ARTIC
LE
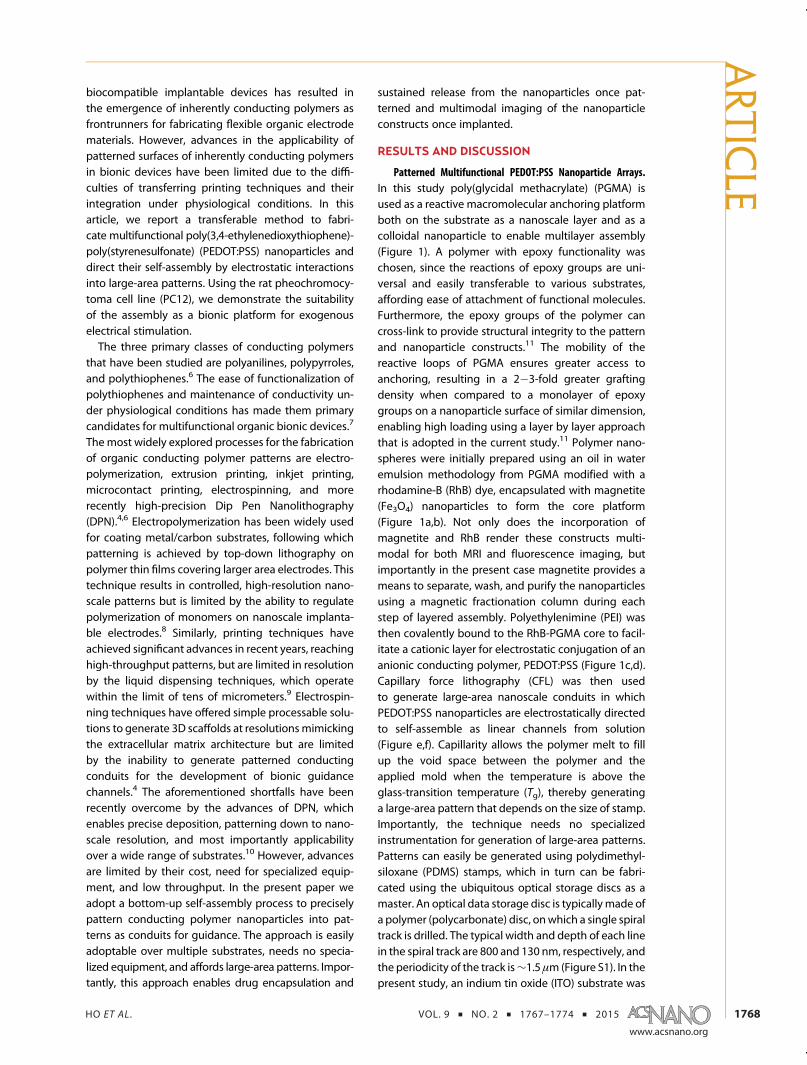
HO ET AL . VOL. 9 ’ NO. 2 ’ 1767–1774 ’ 2015
www.acsnano.org
1768
biocompatible implantable devices has resulted inthe emergence of inherently conducting polymers asfrontrunners for fabricating flexible organic electrodematerials. However, advances in the applicability ofpatterned surfaces of inherently conducting polymersin bionic devices have been limited due to the diffi-culties of transferring printing techniques and theirintegration under physiological conditions. In thisarticle, we report a transferable method to fabri-cate multifunctional poly(3,4-ethylenedioxythiophene)-poly(styrenesulfonate) (PEDOT:PSS) nanoparticles anddirect their self-assembly by electrostatic interactionsinto large-area patterns. Using the rat pheochromocy-toma cell line (PC12), we demonstrate the suitabilityof the assembly as a bionic platform for exogenouselectrical stimulation.The three primary classes of conducting polymers
that have been studied are polyanilines, polypyrroles,and polythiophenes.6 The ease of functionalization ofpolythiophenes and maintenance of conductivity un-der physiological conditions has made them primarycandidates for multifunctional organic bionic devices.7
Themost widely explored processes for the fabricationof organic conducting polymer patterns are electro-polymerization, extrusion printing, inkjet printing,microcontact printing, electrospinning, and morerecently high-precision Dip Pen Nanolithography(DPN).4,6 Electropolymerization has been widely usedfor coating metal/carbon substrates, following whichpatterning is achieved by top-down lithography onpolymer thin films covering larger area electrodes. Thistechnique results in controlled, high-resolution nano-scale patterns but is limited by the ability to regulatepolymerization of monomers on nanoscale implanta-ble electrodes.8 Similarly, printing techniques haveachieved significant advances in recent years, reachinghigh-throughput patterns, but are limited in resolutionby the liquid dispensing techniques, which operatewithin the limit of tens of micrometers.9 Electrospin-ning techniques have offered simple processable solu-tions to generate 3D scaffolds at resolutionsmimickingthe extracellular matrix architecture but are limitedby the inability to generate patterned conductingconduits for the development of bionic guidancechannels.4 The aforementioned shortfalls have beenrecently overcome by the advances of DPN, whichenables precise deposition, patterning down to nano-scale resolution, and most importantly applicabilityover a wide range of substrates.10 However, advancesare limited by their cost, need for specialized equip-ment, and low throughput. In the present paper weadopt a bottom-up self-assembly process to preciselypattern conducting polymer nanoparticles into pat-terns as conduits for guidance. The approach is easilyadoptable over multiple substrates, needs no specia-lized equipment, and affords large-area patterns. Impor-tantly, this approach enables drug encapsulation and
sustained release from the nanoparticles once pat-terned and multimodal imaging of the nanoparticleconstructs once implanted.
RESULTS AND DISCUSSION
Patterned Multifunctional PEDOT:PSS Nanoparticle Arrays.In this study poly(glycidal methacrylate) (PGMA) isused as a reactive macromolecular anchoring platformboth on the substrate as a nanoscale layer and as acolloidal nanoparticle to enable multilayer assembly(Figure 1). A polymer with epoxy functionality waschosen, since the reactions of epoxy groups are uni-versal and easily transferable to various substrates,affording ease of attachment of functional molecules.Furthermore, the epoxy groups of the polymer cancross-link to provide structural integrity to the patternand nanoparticle constructs.11 The mobility of thereactive loops of PGMA ensures greater access toanchoring, resulting in a 2!3-fold greater graftingdensity when compared to a monolayer of epoxygroups on a nanoparticle surface of similar dimension,enabling high loading using a layer by layer approachthat is adopted in the current study.11 Polymer nano-spheres were initially prepared using an oil in wateremulsion methodology from PGMA modified with arhodamine-B (RhB) dye, encapsulated with magnetite(Fe3O4) nanoparticles to form the core platform(Figure 1a,b). Not only does the incorporation ofmagnetite and RhB render these constructs multi-modal for both MRI and fluorescence imaging, butimportantly in the present case magnetite provides ameans to separate, wash, and purify the nanoparticlesusing a magnetic fractionation column during eachstep of layered assembly. Polyethylenimine (PEI) wasthen covalently bound to the RhB-PGMA core to facil-itate a cationic layer for electrostatic conjugation of ananionic conducting polymer, PEDOT:PSS (Figure 1c,d).Capillary force lithography (CFL) was then usedto generate large-area nanoscale conduits in whichPEDOT:PSS nanoparticles are electrostatically directedto self-assemble as linear channels from solution(Figure e,f). Capillarity allows the polymer melt to fillup the void space between the polymer and theapplied mold when the temperature is above theglass-transition temperature (Tg), thereby generatinga large-area pattern that depends on the size of stamp.Importantly, the technique needs no specializedinstrumentation for generation of large-area patterns.Patterns can easily be generated using polydimethyl-siloxane (PDMS) stamps, which in turn can be fabri-cated using the ubiquitous optical storage discs as amaster. An optical data storage disc is typicallymade ofa polymer (polycarbonate) disc, onwhich a single spiraltrack is drilled. The typical width and depth of each linein the spiral track are 800 and 130 nm, respectively, andthe periodicity of the track is∼1.5 μm (Figure S1). In thepresent study, an indium tin oxide (ITO) substrate was
ARTIC
LE
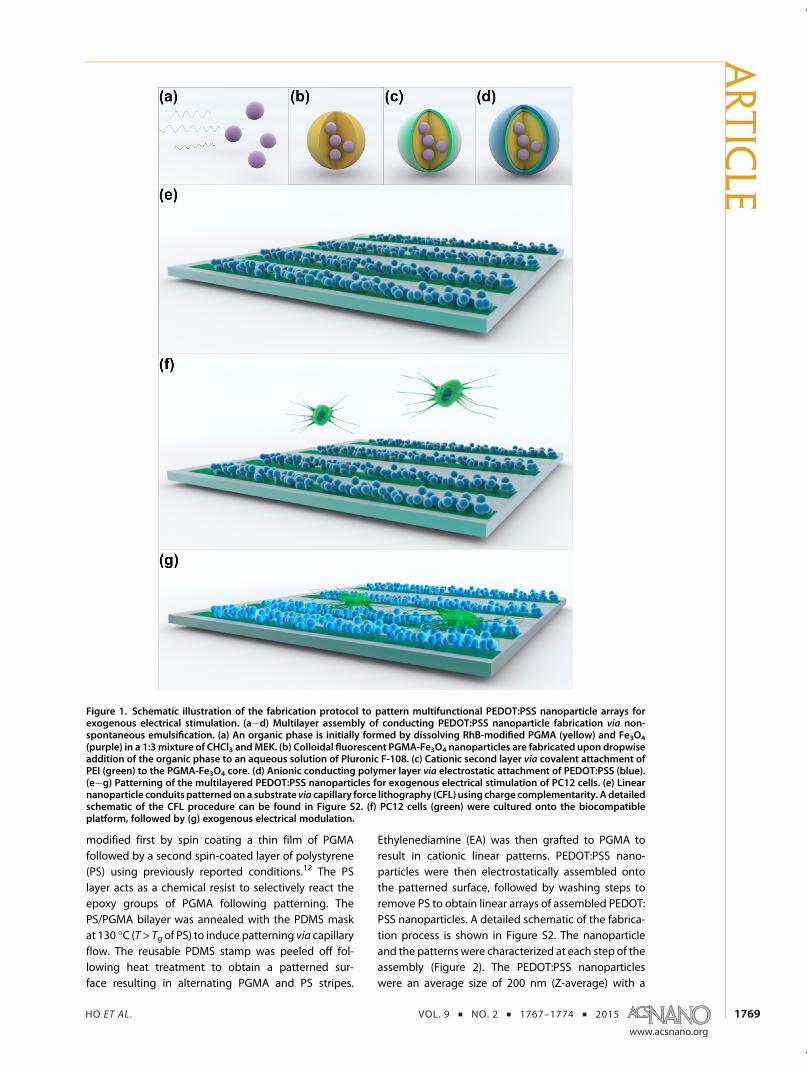
HO ET AL . VOL. 9 ’ NO. 2 ’ 1767–1774 ’ 2015
www.acsnano.org
1769
modified first by spin coating a thin film of PGMAfollowed by a second spin-coated layer of polystyrene(PS) using previously reported conditions.12 The PSlayer acts as a chemical resist to selectively react theepoxy groups of PGMA following patterning. ThePS/PGMA bilayer was annealed with the PDMS maskat 130 !C (T> Tg of PS) to induce patterning via capillaryflow. The reusable PDMS stamp was peeled off fol-lowing heat treatment to obtain a patterned sur-face resulting in alternating PGMA and PS stripes.
Ethylenediamine (EA) was then grafted to PGMA toresult in cationic linear patterns. PEDOT:PSS nano-particles were then electrostatically assembled ontothe patterned surface, followed by washing steps toremove PS to obtain linear arrays of assembled PEDOT:PSS nanoparticles. A detailed schematic of the fabrica-tion process is shown in Figure S2. The nanoparticleand the patterns were characterized at each step of theassembly (Figure 2). The PEDOT:PSS nanoparticleswere an average size of 200 nm (Z-average) with a
Figure 1. Schematic illustration of the fabrication protocol to pattern multifunctional PEDOT:PSS nanoparticle arrays forexogenous electrical stimulation. (a!d) Multilayer assembly of conducting PEDOT:PSS nanoparticle fabrication via non-spontaneous emulsification. (a) An organic phase is initially formed by dissolving RhB-modified PGMA (yellow) and Fe3O4(purple) in a 1:3mixture of CHCl3 andMEK. (b) Colloidal fluorescent PGMA-Fe3O4 nanoparticles are fabricated upon dropwiseaddition of the organic phase to an aqueous solution of Pluronic F-108. (c) Cationic second layer via covalent attachment ofPEI (green) to the PGMA-Fe3O4 core. (d) Anionic conducting polymer layer via electrostatic attachment of PEDOT:PSS (blue).(e!g) Patterning of the multilayered PEDOT:PSS nanoparticles for exogenous electrical stimulation of PC12 cells. (e) Linearnanoparticle conduits patternedon a substrate via capillary force lithography (CFL) using charge complementarity. A detailedschematic of the CFL procedure can be found in Figure S2. (f) PC12 cells (green) were cultured onto the biocompatibleplatform, followed by (g) exogenous electrical modulation.
ARTIC
LE
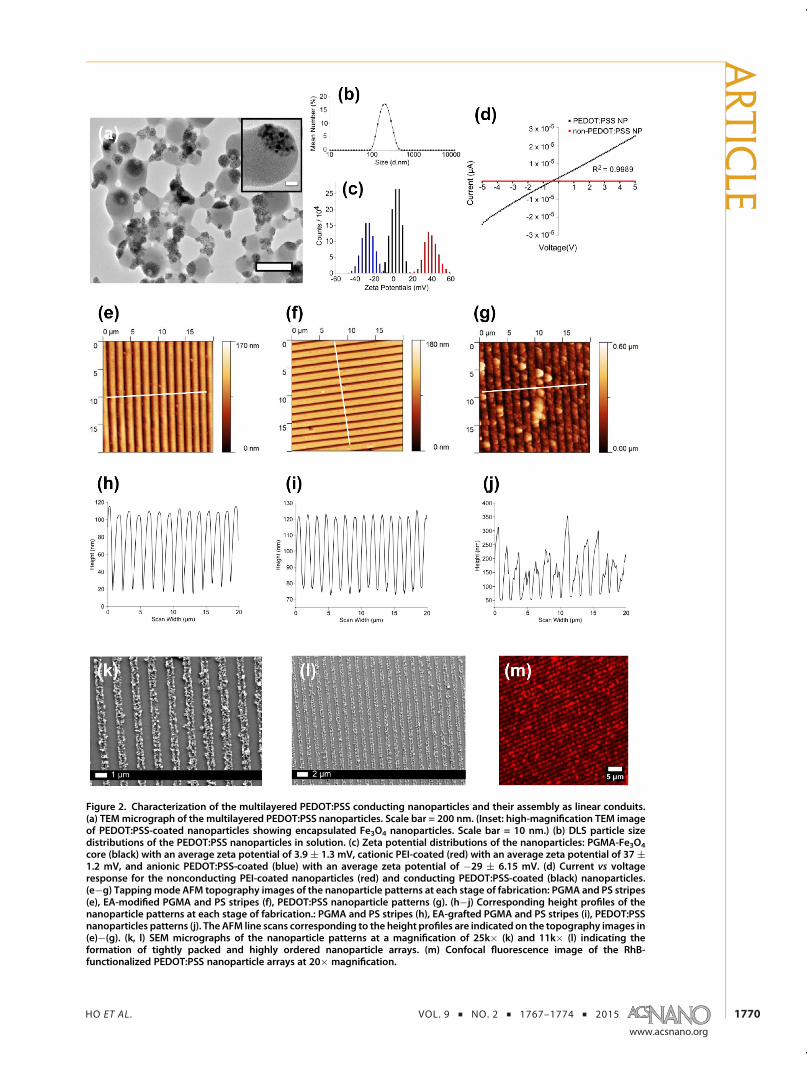
HO ET AL . VOL. 9 ’ NO. 2 ’ 1767–1774 ’ 2015
www.acsnano.org
1770
Figure 2. Characterization of the multilayered PEDOT:PSS conducting nanoparticles and their assembly as linear conduits.(a) TEMmicrograph of the multilayered PEDOT:PSS nanoparticles. Scale bar = 200 nm. (Inset: high-magnification TEM imageof PEDOT:PSS-coated nanoparticles showing encapsulated Fe3O4 nanoparticles. Scale bar = 10 nm.) (b) DLS particle sizedistributions of the PEDOT:PSS nanoparticles in solution. (c) Zeta potential distributions of the nanoparticles: PGMA-Fe3O4core (black) with an average zeta potential of 3.9 ( 1.3 mV, cationic PEI-coated (red) with an average zeta potential of 37 (1.2 mV, and anionic PEDOT:PSS-coated (blue) with an average zeta potential of !29 ( 6.15 mV. (d) Current vs voltageresponse for the nonconducting PEI-coated nanoparticles (red) and conducting PEDOT:PSS-coated (black) nanoparticles.(e!g) Tappingmode AFM topography images of the nanoparticle patterns at each stage of fabrication: PGMA and PS stripes(e), EA-modified PGMA and PS stripes (f), PEDOT:PSS nanoparticle patterns (g). (h!j) Corresponding height profiles of thenanoparticle patterns at each stage of fabrication.: PGMA and PS stripes (h), EA-grafted PGMA and PS stripes (i), PEDOT:PSSnanoparticles patterns (j). The AFM line scans corresponding to the height profiles are indicated on the topography images in(e)!(g). (k, l) SEM micrographs of the nanoparticle patterns at a magnification of 25k" (k) and 11k" (l) indicating theformation of tightly packed and highly ordered nanoparticle arrays. (m) Confocal fluorescence image of the RhB-functionalized PEDOT:PSS nanoparticle arrays at 20" magnification.
ARTIC
LE
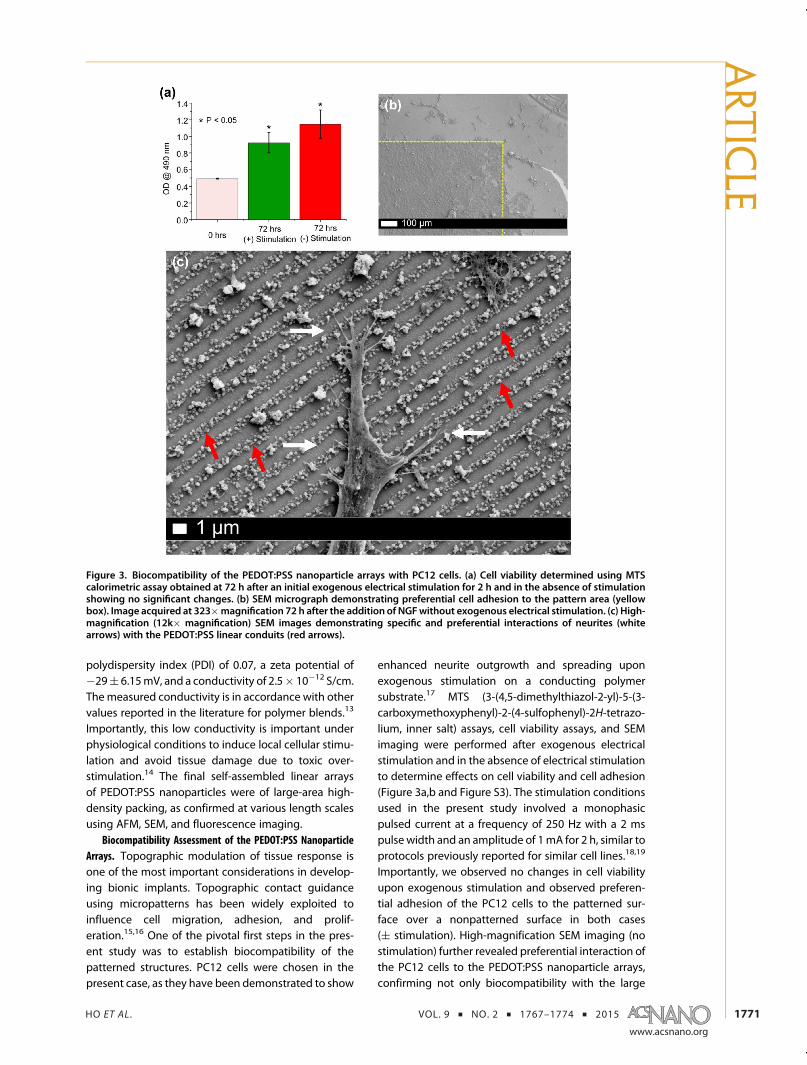
HO ET AL . VOL. 9 ’ NO. 2 ’ 1767–1774 ’ 2015
www.acsnano.org
1771
polydispersity index (PDI) of 0.07, a zeta potential of!29( 6.15mV, and a conductivity of 2.5" 10!12 S/cm.Themeasured conductivity is in accordance with othervalues reported in the literature for polymer blends.13
Importantly, this low conductivity is important underphysiological conditions to induce local cellular stimu-lation and avoid tissue damage due to toxic over-stimulation.14 The final self-assembled linear arraysof PEDOT:PSS nanoparticles were of large-area high-density packing, as confirmed at various length scalesusing AFM, SEM, and fluorescence imaging.
Biocompatibility Assessment of the PEDOT:PSS NanoparticleArrays. Topographic modulation of tissue response isone of the most important considerations in develop-ing bionic implants. Topographic contact guidanceusing micropatterns has been widely exploited toinfluence cell migration, adhesion, and prolif-eration.15,16 One of the pivotal first steps in the pres-ent study was to establish biocompatibility of thepatterned structures. PC12 cells were chosen in thepresent case, as they have been demonstrated to show
enhanced neurite outgrowth and spreading uponexogenous stimulation on a conducting polymersubstrate.17 MTS (3-(4,5-dimethylthiazol-2-yl)-5-(3-carboxymethoxyphenyl)-2-(4-sulfophenyl)-2H-tetrazo-lium, inner salt) assays, cell viability assays, and SEMimaging were performed after exogenous electricalstimulation and in the absence of electrical stimulationto determine effects on cell viability and cell adhesion(Figure 3a,b and Figure S3). The stimulation conditionsused in the present study involved a monophasicpulsed current at a frequency of 250 Hz with a 2 mspulse width and an amplitude of 1mA for 2 h, similar toprotocols previously reported for similar cell lines.18,19
Importantly, we observed no changes in cell viabilityupon exogenous stimulation and observed preferen-tial adhesion of the PC12 cells to the patterned sur-face over a nonpatterned surface in both cases(( stimulation). High-magnification SEM imaging (nostimulation) further revealed preferential interaction ofthe PC12 cells to the PEDOT:PSS nanoparticle arrays,confirming not only biocompatibility with the large
Figure 3. Biocompatibility of the PEDOT:PSS nanoparticle arrays with PC12 cells. (a) Cell viability determined using MTScalorimetric assay obtained at 72 h after an initial exogenous electrical stimulation for 2 h and in the absence of stimulationshowing no significant changes. (b) SEM micrograph demonstrating preferential cell adhesion to the pattern area (yellowbox). Image acquired at 323"magnification 72 h after the addition of NGFwithout exogenous electrical stimulation. (c) High-magnification (12k" magnification) SEM images demonstrating specific and preferential interactions of neurites (whitearrows) with the PEDOT:PSS linear conduits (red arrows).
ARTIC
LE
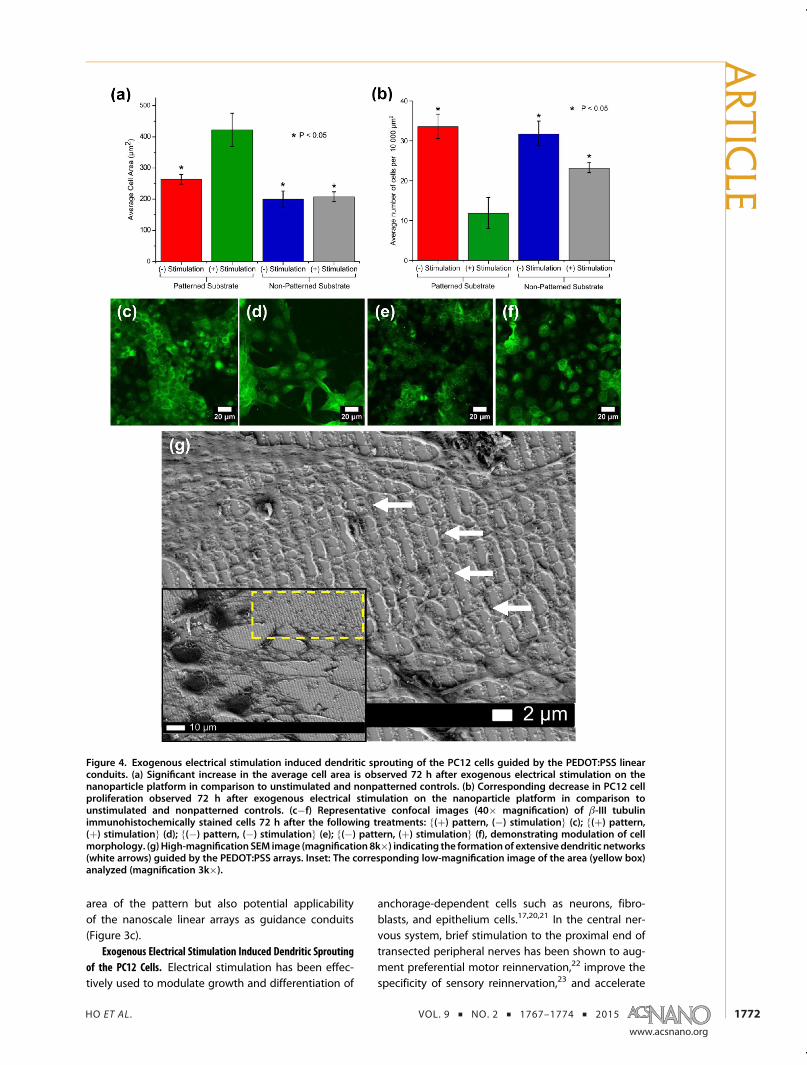
HO ET AL . VOL. 9 ’ NO. 2 ’ 1767–1774 ’ 2015
www.acsnano.org
1772
area of the pattern but also potential applicabilityof the nanoscale linear arrays as guidance conduits(Figure 3c).
Exogenous Electrical Stimulation Induced Dendritic Sproutingof the PC12 Cells. Electrical stimulation has been effec-tively used to modulate growth and differentiation of
anchorage-dependent cells such as neurons, fibro-blasts, and epithelium cells.17,20,21 In the central ner-vous system, brief stimulation to the proximal end oftransected peripheral nerves has been shown to aug-ment preferential motor reinnervation,22 improve thespecificity of sensory reinnervation,23 and accelerate
Figure 4. Exogenous electrical stimulation induced dendritic sprouting of the PC12 cells guided by the PEDOT:PSS linearconduits. (a) Significant increase in the average cell area is observed 72 h after exogenous electrical stimulation on thenanoparticle platform in comparison to unstimulated and nonpatterned controls. (b) Corresponding decrease in PC12 cellproliferation observed 72 h after exogenous electrical stimulation on the nanoparticle platform in comparison tounstimulated and nonpatterned controls. (c!f) Representative confocal images (40" magnification) of β-III tubulinimmunohistochemically stained cells 72 h after the following treatments: {(þ) pattern, (!) stimulation} (c); {(þ) pattern,(þ) stimulation} (d); {(!) pattern, (!) stimulation} (e); {(!) pattern, (þ) stimulation} (f), demonstrating modulation of cellmorphology. (g) High-magnification SEM image (magnification 8k") indicating the formationof extensive dendritic networks(white arrows) guided by the PEDOT:PSS arrays. Inset: The corresponding low-magnification image of the area (yellow box)analyzed (magnification 3k").
ARTIC
LE
HO ET AL . VOL. 9 ’ NO. 2 ’ 1767–1774 ’ 2015
www.acsnano.org
1773
the reinnervation of distal target tissues.24 These havebeen reported to depend on depolarization of theneuronal soma and its axon, involvement of axonguidance factors such as polysilylated neural celladhesion molecule,25 the L2/HNK-1 carbohydrate,26
and brain-derived neurotrophic factor.27 Finally elec-trical stimulation induced neurite outgrowth wasrecently reported to be dependent on calcium influxthrough L- and N-type voltage-dependent calciumchannels and calcium mobilization from IP3R andRYR-sensitive calcium stores.28 In the present case,we analyzed the morphological modulation of PC12cells following electrical stimulation having deter-mined no change in cell viability using the MTS assay.Nerve growth factor (NGF) induces PC12 cells tochange their phenotype and acquire a number ofproperties that are similar to sympathetic neurons.Importantly, although they can acquire propertiessimilar to sympathetic neurons upon NGF treatment,they do not develop definitive dendritic axons or formtrue synapses with each other in the absence ofexogenous stimulation.29 This change in phenotypeupon NGF treatment is associated with a retardation inproliferation, the extension of neurites making themelectrically excitable. Monitoring the cell numbers andcell area can assess this change from the proliferationstate to a differentiation state. Furthermore, micro-tubule levels correlate precisely with the neurite
extension during NGF-induced PC12 cell differ-entiation.29,30 Using immunohistochemical stainingfor β-III tubulin it was determined that stimulation onthe patterned surface resulted in a significant increasein the cell area and lower number of cells per unit area,indicating exogenous electrical stimulation induceddifferentiation of PC12 cells (Figure 4a!f, Figure S4).High-magnification SEM (Figure 4g) also revealedthat stimulation resulted in an extensive dendriticnetwork guided by the linear conduits of PEDOT:PSSnanoparticles.
CONCLUSION
In summary, we have demonstrated a practical andtransferable protocol to fabricate self-assembled large-area patterns of conducting polymers from solution.This overcomes some of the shortfalls in the currentfabrication techniques in developing patterned organicbionic devices. The patterns generated have demon-strated excellent biocompatibility. At the same time,they have been shown to induce exogenous electricalstimulation under physiological conditions to elicit ameasurable and consistent cellular response. Impor-tantly the methodology permits the design of bionicdevices capable of inducing local electrical stimulationfor in vivo applications while integrating multimodalimaging and simultaneous drug delivery capabilities ofnanoparticles.
METHODS SUMMARY
Nanoparticle Synthesis. The conducting nanoparticles wereprepared via a nonspontaneous emulsification route. Briefly,rhodamine Bwas attached to PGMA inMEK at 80 !Cunder N2 for5 h. The modified PGMA was then precipitated in diethyl etherand dried under N2. This was dispersed in a 1:3 mixture of CHCl3and MEK along with 25 mg of Fe3O4 to form the organic phase.This organic phase was added dropwise into a rapidly stirringaqueous solution of Pluronic F-108. The emulsion was homo-genized with a probe-type ultrasonic wand for 1 min. Theorganic solvents were then evaporated off under N2. Largeaggregates of Fe3O4 and excess polymer were separated viacentrifugation. The nanoparticles in the supernatant were thenmixed with PEI and heated to 80 !C for 16 h to facilitateattachment. The PEI-coated nanoparticles were isolated andwashed on a magnetic separation column. Next, a dilutedsolution of PEDOT:PSS was added dropwise under rapid stirringto nanoparticles at a concentration of 0.5 mg/mL to facilitateelectrostatic attachment. This was followed by sonication for10min and stirring for 18 h. The nanoparticles were thenwashedmultiple times inwater before being stored at 4 !C for further use.
Platform Fabrication. To direct the self-assembly of the nano-particles, a template was fabricated by CFL. A 0.2%w/v PGMA inCHCl3 solution was spin coated on ITO coverslips and annealedat 120 !C for 20 min. Next, 1.3% w/v PS in toluene was spincoated onto the PGMA surface. A PDMS stamp was then placedonto the PS layer, followed by heat treatment in an oven at130 !C for 1 h. Once cooled, the stamp was peeled off. This wasfollowed by exposure to EA at room temperature for 5 h.The pattern was next washed multiple times with water toremove unreacted EA. A 50 μL amount of 4mg/mL nanoparticlesuspension was drop casted onto the patterned area of thecoverslip. The setup was then placed in a sealed vial, facilitating
controlled evaporation, which allowed for electrostatic nano-particle attachment onto the EA surface. The PS mask was thenremoved by washing with toluene. The resulting patternedPEDOT:PSS nanoparticle array was then used for furtherexperimentation.
Electrical Stimulation Protocol. For electrical stimulation experi-ments, two silver epoxy electrodes were painted onto the endsof the patterned nanoparticle arrays. Prior to cell culture, thewhole platform was UV and ethanol sterilized. Wells werecoated with poly(L-lysine) and 15 μg/mL of laminin followedby cell seeding at a density of 50 000 cells/well. Cells were left toadhere for 18 h. Immediately prior to stimulation, the prolifera-tion media was replaced with low-serum nerve growth factorcontaining differentiation media. For stimulation, the cells weresubjected to a monophasic pulsed current at a frequency of250 Hzwith a 2ms pulsewidth and an amplitude of 1mA for 2 h,after which they were left for an additional 72 h before analysis.
Cell Viability Assessment. Cell viability was measured using theMTS assay as per the manufacturer protocols (Invitrogen, UK).For measurements, 80 μL from each well was transferred into anew 96-well plate and read under a plate reader at 490 nmexcitation wavelength. To analyze cell morphology, cells wereimmunohistochemically stained for β-III tubulin.
Material Characterization. AFMwas performed on a Dimension3100 AFM systemwith a Nanoscope IV controller used to obtainthe AFM images in tapping mode, using Pt/Ir-coated contactmode probes with a spring constant of 0.2 N/m (type SCM-PIC,Bruker). TEM was performed on a JEOL 2100 transmissionelectron microscope at an accelerating voltage of 80 kV. SEMwas performed on a Zeiss 1555 VP-FESEM, and all samples werecoated with 5 nm of Pt. Biological samples were initially fixed in2.5% glutaraldehyde and dehydrated in increasing concen-trations of ethanol followed by critical point drying prior toPt coating. Immunohistochemically stained samples were
ARTIC
LE
HO ET AL . VOL. 9 ’ NO. 2 ’ 1767–1774 ’ 2015
www.acsnano.org
1774
analyzed using a Leica TCS SP2 AOBS multiphoton confocalmicroscope.
Conflict of Interest: The authors declare no competingfinancial interest.
Supporting Information Available: Detailed materials andmethods: synthesis, characterization (TEM, SEM, AFM), cellculture, and electrical stimulation experiments. This material isavailable free of charge via the Internet at http://pubs.acs.org.
Acknowledgment. D.H., I.L., and K.S.I. designed the experi-ments, developed the concept, and analyzed the data. D.H., J.Z.,and N.M.S. optimized the capillary force lithography experi-ments. D.H., X.C., V.A., and A.M. performed image acquisitionusing confocal microscopy, transmission electron microscopy,scanning electron microscopy, and atomic force microscopy.D.H., A.R.H., G.W.P., S.I.H., and A.B. optimized and designed theelectrical stimulation experiments. This work was funded bythe Australian Research Council (ARC), the National Health &Medical Research Council (NHMRC) of Australia, and the NationalScience Foundation (CBET-0756457). The authors acknowledgetheAustralianMicroscopy&Microanalysis Research Facility at theCentre for Microscopy, Characterization & Analysis, and TheUniversity of Western Australia, funded by the University, Stateand Commonwealth Governments. The authors also wish tothank Margaret Pollett and Chrisna LeVaillant for their invaluablecontribution in assisting with the PC12 cell cultures and immu-nohistochemistry, and Ella Marushchenko (www.scientific-illustrations.com) for assistance with Figure 1.
REFERENCES AND NOTES1. Ciofani, G.; Danti, S.; D'Alessandro, D.; Ricotti, L.; Moscato,
S.; Bertoni, G.; Falqui, A.; Berrettini, S.; Petrini, M.; Mattoli, V.;et al. Enhancement of Neurite Outgrowth in Neuronal-LikeCells Following Boron Nitride Nanotube-Mediated Stimu-lation. ACS Nano 2010, 4, 6267–6277.
2. Moulton, S. E.; Higgins, M. J.; Kapsa, R. M. I.; Wallace, G. G.Organic Bionics: A New Dimension in Neural Communica-tions. Adv. Funct. Mater. 2012, 22, 2003–2014.
3. Wallace, G. G.; Moulton, S. E.; Clark, G. M. Electrode-CellularInterface. Science 2009, 324, 185–186.
4. Wallace, G. G.; Higgins, M. J.; Moulton, S. E.; Wang, C.Nanobionics: The Impact of Nanotechnology on Implan-table Medical Bionic Devices. Nanoscale 2012, 4, 4327–4347.
5. Khademhosseini, A.; Langer, R.; Borenstein, J.; Vacanti, J. P.Microscale Technologies for Tissue Engineering andBiology. Proc. Natl. Acad. Sci. U.S.A. 2006, 103, 2480–2487.
6. Guimard, N. K.; Gomez, N.; Schmidt, C. E. ConductingPolymers in Biomedical Engineering. Prog. Polym. Sci.2007, 32, 876–921.
7. Kim, D. H.; Richardson-Burns, S. M.; Hendricks, J. L.;Sequera, C.; Martin, D. C. Effect of Immobilized NerveGrowth Factor on Conductive Polymers: Electrical Prop-erties and Cellular Response. Adv. Funct. Mater. 2007, 17,79–86.
8. Lee, J. I.; Cho, S. H.; Park, S.-M.; Kim, J. K.; Kim, J. K.; Yu, J.-W.;Kim, Y. C.; Russell, T. P. Highly Aligned Ultrahigh DensityArrays of Conducting Polymer Nanorods Using BlockCopolymer Templates. Nano Lett. 2008, 8, 2315–2320.
9. Wang, J.; Zheng, Z.; Li, H.; Huck, W.; Sirringhaus, H. Dewet-ting of Conducting Polymer Inkjet Droplets on PatternedSurfaces. Nat. Mater. 2004, 3, 171–176.
10. Nakashima, H.; Higgins, M. J.; O'Connell, C.; Torimitsu, K.;Wallace, G. G. Liquid Deposition Patterning of ConductingPolymer Ink onto Hard and Soft Flexible Substrates viaDip-Pen Nanolithography. Langmuir 2011, 28, 804–811.
11. Iyer, K. S.; Zdyrko, B.; Malz, H.; Pionteck, J.; Luzinov, I.Polystyrene Layers Grafted to Macromolecular AnchoringLayer. Macromolecules 2003, 36, 6519–6526.
12. Zou, J.; Zdyrko, B.; Luzinov, I.; Raston, C. L.; SwaminathanIyer, K. Regiospecific Linear Assembly of Pd Nanocubesfor Hydrogen Gas Sensing. Chem. Commun. 2012, 48,1033–1035.
13. Choi, J.; Lee, J.; Jung, D.; Shim, S. E. Electrospun PEDOT:PSS/PVP Nanofibers as the Chemiresistor in ChemicalVapour Sensing. Synth. Met. 2010, 160, 1415–1421.
14. Merrill, D. R.; Bikson, M.; Jefferys, J. G. R. Electrical Stimula-tion of Excitable Tissue: Design of Efficacious and SafeProtocols. J. Neurosci. Methods 2005, 141, 171–198.
15. Chen, C. S.; Mrksich, M.; Huang, S.; Whitesides, G. M.;Ingber, D. E. Micropatterned Surfaces for Control of CellShape, Position, and Function. Biotechnol. Prog. 1998, 14,356–363.
16. Ito, Y. Surface Micropatterning to Regulate Cell Functions.Biomaterials 1999, 20, 2333–2342.
17. Schmidt, C. E.; Shastri, V. R.; Vacanti, J. P.; Langer, R.Stimulation of Neurite Outgrowth Using an ElectricallyConducting Polymer. Proc. Natl. Acad. Sci. U.S.A. 1997, 94,8948–8953.
18. Richardson, R. T.; Thompson, B.; Moulton, S.; Newbold, C.;Lum, M. G.; Cameron, A.; Wallace, G.; Kapsa, R.; Clark, G.;O'Leary, S. The Effect of Polypyrrole with IncorporatedNeurotrophin-3 on the Promotion of Neurite Outgrowthfrom Auditory Neurons. Biomaterials 2007, 28, 513–523.
19. Weng, B.; Liu, X.; Shepherd, R.; Wallace, G. G. Inkjet PrintedPolypyrrole/Collagen Scaffold: A Combination of SpatialControl and Electrical Stimulation of PC12 Cells. Synth.Met.2012, 162, 1375–1380.
20. Wong, J. Y.; Langer, R.; Ingber, D. E. Electrically ConductingPolymers Can Noninvasively Control the Shape andGrowth of Mammalian Cells. Proc. Natl. Acad. Sci. U.S.A.1994, 91, 3201–3204.
21. Bourguignon, G.; Bourguignon, L. Electric Stimulation ofProtein and DNA Synthesis in Human Fibroblasts. FASEB J.1987, 1, 398–402.
22. Al-Majed, A. A.; Neumann, C. M.; Brushart, T. M.; Gordon, T.Brief Electrical Stimulation Promotes the Speed andAccuracy of Motor Axonal Regeneration. J. Neurosci.2000, 20, 2602–2608.
23. Brushart, T. M.; Jari, R.; Verge, V.; Rohde, C.; Gordon, T.Electrical Stimulation Restores the Specificity of SensoryAxon Regeneration. Exp. Neurol. 2005, 194, 221–229.
24. Brushart, T. M.; Hoffman, P. N.; Royall, R. M.; Murinson, B. B.;Witzel, C.; Gordon, T. Electrical Stimulation PromotesMotoneuron Regeneration without Increasing Its Speedor Conditioning the Neuron. J. Neurosci. 2002, 22, 6631–6638.
25. Franz, C. K.; Rutishauser, U.; Rafuse, V. F. Intrinsic NeuronalProperties Control Selective Targeting of RegeneratingMotoneurons. Brain 2008, 131, 1492–1505.
26. Eberhardt, K. A.; Irintchev, A.; Al-Majed, A. A.; Simova, O.;Brushart, T. M.; Gordon, T.; Schachner, M. BDNF/TrkBSignaling Regulates HNK-1 Carbohydrate Expression inRegenerating Motor Nerves and Promotes FunctionalRecovery after Peripheral Nerve Repair. Exp. Neurol.2006, 198, 500–510.
27. Geremia, N. M.; Gordon, T.; Brushart, T. M.; Al-Majed, A. A.;Verge, V. M. Electrical Stimulation Promotes SensoryNeuron Regeneration and Growth-Associated GeneExpression. Exp. Neurol. 2007, 205, 347–359.
28. Yan, X.; Liu, J.; Huang, J.; Huang, M.; He, F.; Ye, Z.; Xiao, W.;Hu, X.; Luo, Z. Electrical Stimulation Induces Calcium-Dependent Neurite Outgrowth and Immediate EarlyGenes Expressions of Dorsal Root Ganglion Neurons.Neurochem. Res. 2014, 39, 129–141.
29. Das, K. P.; Freudenrich, T. M.; Mundy, W. R. Assessment ofPC12 Cell Differentiation and Neurite Growth: A Com-parison of Morphological and Neurochemical Measures.Neurotoxicol. Teratol. 2004, 26, 397–406.
30. Drubin, D. G.; Feinstein, S. C.; Shooter, E. M.; Kirschner,M. W. Nerve Growth Factor-Induced Neurite Outgrowth inPC12 Cells Involves the Coordinate Induction of Micro-tubule Assembly and Assembly-Promoting Factors. J. CellBiol. 1985, 101, 1799–1807.
ARTIC
LE
S1
Hierarchical Patterning of Multifunctional Conducting Polymer Nanoparticles as a Bionic
Platform for Topographic Contact Guidance
Dominic Ho,1,2 Jianli Zou,3 Xianjue Chen,1,‡, Alaa Munshi,1 Nicole M. Smith,1,4 Vipul Agarwal,1
Stuart I. Hodgetts,2 Giles W. Plant,5 Anthony J. Bakker,2 Alan R. Harvey,2 Igor Luzinov6 & K.
Swaminathan Iyer1*
1School of Chemistry and Biochemistry, The University of Western Australia, Crawley, WA
6009, Australia;
2School of Anatomy, Physiology and Human Biology, The University of Western Australia,
Crawley, WA 6009, Australia;
3Institute for Integrated Cell-Material Sciences (iCeMS), iCeMS Complex 2, Kyoto University,
Yoshida-Honmachi, Sakyo-ku, Kyoto, 606-8501, Japan;
4Experimental and Regenerative Neurosciences, School of Animal Biology, The University of
Western Australia, Crawley, WA 6009, Australia;
5Stanford Partnership for Spinal Cord Injury and Repair, Department of Neurosurgery, Stanford
University School of Medicine, Stanford, CA 94305, USA;
6School of Materials Science and Engineering, Clemson University, Clemson, South Carolina,
29634-0971, USA.
‡Present Address: Centre for NanoScale Science and Technology, School of Chemical and
Physical Sciences, Flinders University, Bedford Park, Adelaide, SA 5042, Australia.
* Correspondance: [email protected]
S2
Supplementary Information
Materials. All chemicals were purchased from Sigma-Aldrich unless otherwise stated: iron(III)
acetylacetonate (97 %), benzyl ether (98 %), oleic acid (90 %), oleyl amine (70 %), 1,2-
tetradecanediol (90 %), rhodamine B (Fluka), methyl ethyl ketone (99 %, Fisher), chloroform
(99 %, merck), toluene (99 %, Fisher), diethyl ether (90 %, Asia Pacific Speciality Chemicals),
polyethylenimine (50 % solution, Mn 1200, Mw 1300), Poly(3,4-ethylenedioxythiophene)
Polystyrene sulfonate (1.3% solution, Mw 10355), ethylenediamine (99.5 %, Fluka) and Pluronic
F-108. All tissue culture reagents were purchased from Gibco unless otherwise stated.
Dulbecco's Modified Eagle's medium (DMEM), PBS, foetal calf serum (Sigma), horse serum
(Sigma), penicillin/streptomycin, L-glutamine, non-essential amino acids (NEAA),
trypsin/EDTA (Sigma), laminin (#L2020, Sigma) and nerve growth factor (β-NGF, PeproTech).
Magnetite Synthesis. Fe3O4 was synthesized by the organic decomposition of Fe(acac)3 in
benzyl ether at 300 oC, in the presence of oleic acid, oleyl amine, and 1,2- tetradecanediol, as
previously described by Sun et al.1 The method to synthesise 6 nm Fe3O4 nanoparticles was
followed.
Synthesis of RhB-Modified PGMA: PGMA was synthesized by radical polymerization
according to a published procedure.2 Briefly, glycidyl methacrylate was polymerized in methyl
ethyl ketone (MEK) to give PGMA (Mn = 220515, Mw = 433730), using azobisisobutyronitrile
as initiator. The polymer was purified by multiple precipitations from MEK solution using
diethyl ether. To attach the dye to the polymer, a solution of rhodamine B (RhB, 20 mg) and
PGMA (100 mg) in MEK (20 mL) was heated to reflux under N2 for 18 h. The solution was
reduced in vacuo before the modified polymer was precipitated with diethyl ether (20 mL). The
S3
polymer was redissolved in MEK and precipitated with ether twice to remove ungrafted RhB.
PEDOT:PSS Multilayer Nanoparticle (NP) Synthesis. To prepare the organic phase of the
emulsion, the dried RhB-PGMA polymer was initially dissolved in 2 mL of CHCl3 and dried
under N2, leaving a sticky residue. This was redissolved in a 1:3 mixture of CHCl3 (2 mL) and
MEK (6 mL) along with 25 mg of Fe3O4. This organic phase was added drop wise to a rapidly
stirring aqueous solution of Pluronic F-108 (12.5 mg/mL, 30 mL). The emulsion was
homogenised with a probe-type ultrasonic wand at the lowest setting for 1 min. The organic
solvents were evaporated off overnight under a slow flow of N2. The suspension was purified via
centrifugation at 3000 g for 45 mins. The supernatant was transferred to a 50 mL flask
containing PEI (50 wt % solution, 100 mg) and heated to 80 oC for 16 h. The magnetic polymer
nanoparticles were collected on a magnetic separation column (LS, Miltenyi Biotec) in 3 mL
batches, washed with water (5 mL) and then flushed with water until the filtrate ran clear. This
purified product produced 10 mL of nanoparticle suspension at a concentration of 1 mg/mL.
Next, PEDOT:PSS was electrostatically attached to the nanoparticles. 60 µL of PEDOT:PSS (1.3
wt % dispersion in H2O) was diluted in 2 mL of water and added drop wise under rapid stirring
to NPs at a concentration of 0.5 mg/mL. The PEDOT:PSS was further dispersed under sonication
for 10 mins to ensure complete dispersion and then left to stir for 18 h. After 18 h, the mixture
was again sonicated for 2 mins. Excess PEDOT:PSS was then removed via centrifugation 16800
g for 20 mins). NPs were then washed twice in water before being stored at 4 oC at a
concentration of 4 mg/mL for further use.
Nanoparticle Conductivity Measurement. The nanoparticle conductivity was determined using
4-point probe measurements. 80 µL of nanoparticle solution with a concentration of 1 mg/mL
S4
was selectively dried on a square area 0.5 cm x 0.5 cm. Electrodes were placed at the 4 corners
of the square and subject to current-voltage sweeps.
Fabrication of PDMS Stamp. The metal layer of a blank compact disc (CD) was peeled off and
the CD washed with ethanol. The remaining polycarbonate structure was used as a master for the
PDMS stamp. The polymer base and curing agent from a Sylgard® 184 (Dow Corning) silicone
elastomer kit were mixed at a 10:1 ratio by weight in a glass vial. The glass vial was placed in a
vacuum desiccator to remove trapped bubbles from the mixture. Following vacuum treatment,
the elastomer was restored to atmospheric pressure slowly several times until it was free of
bubbles. The PDMS mixture was then cast onto the surface of the grooved side of CD and cured
at 80 ºC for 2 hours.
CFL Procedure. Prior to the CFL procedure, the indium tin oxide (ITO) coverslips were first
clean in acetone and isopopanol under sonication. 0.2 % w/v PGMA in CHCl3 was spin coated
onto the conducting surface of the ITO coverslips. Coverslips were then placed in an oven at 120
ºC for 20 mins to anneal the PGMA. Unreacted PGMA on the coverslip surface was removed by
washing in CHCl3. Next, 1.3 % w/v PS in toluene was spin coated onto the PGMA surface. A
PDMS stamp was then placed onto the PS layer, followed by heat treatment in an oven at 130 ºC
for 1 hr. The assembly was then cooled down at room temperature for another hour before the
PDMS stamp was peeled off. Next, the substrate was exposed to ethylenediamine (EA) and left
at room temperature for 5 h. The substrate was then wasted with water to remove unreacted EA.
Next, 50 µL of 4 mg/mL nanoparticle solution was drop casted onto the patterned area of the
coverslip. The setup was then placed in a sealed vial, facilitating controlled evaporation which
allowed for electrostatic nanoparticle attachment onto the EA surface. The PS mask was then
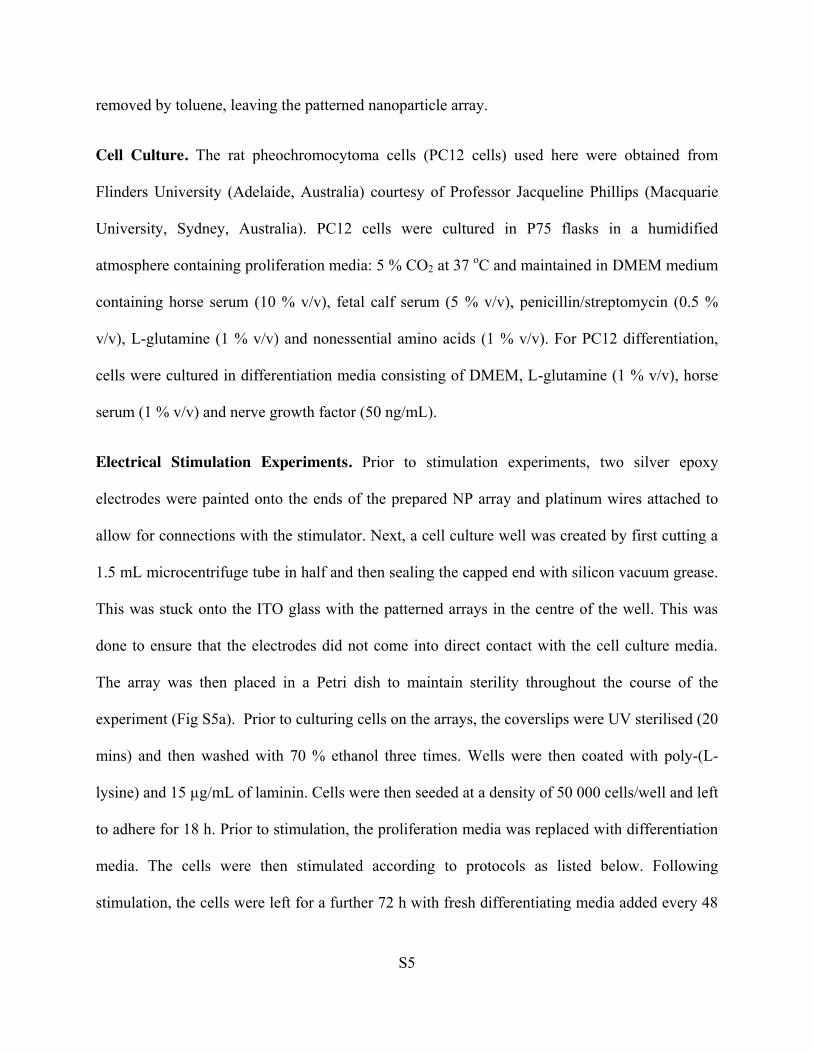
S5
removed by toluene, leaving the patterned nanoparticle array.
Cell Culture. The rat pheochromocytoma cells (PC12 cells) used here were obtained from
Flinders University (Adelaide, Australia) courtesy of Professor Jacqueline Phillips (Macquarie
University, Sydney, Australia). PC12 cells were cultured in P75 flasks in a humidified
atmosphere containing proliferation media: 5 % CO2 at 37 oC and maintained in DMEM medium
containing horse serum (10 % v/v), fetal calf serum (5 % v/v), penicillin/streptomycin (0.5 %
v/v), L-glutamine (1 % v/v) and nonessential amino acids (1 % v/v). For PC12 differentiation,
cells were cultured in differentiation media consisting of DMEM, L-glutamine (1 % v/v), horse
serum (1 % v/v) and nerve growth factor (50 ng/mL).
Electrical Stimulation Experiments. Prior to stimulation experiments, two silver epoxy
electrodes were painted onto the ends of the prepared NP array and platinum wires attached to
allow for connections with the stimulator. Next, a cell culture well was created by first cutting a
1.5 mL microcentrifuge tube in half and then sealing the capped end with silicon vacuum grease.
This was stuck onto the ITO glass with the patterned arrays in the centre of the well. This was
done to ensure that the electrodes did not come into direct contact with the cell culture media.
The array was then placed in a Petri dish to maintain sterility throughout the course of the
experiment (Fig S5a). Prior to culturing cells on the arrays, the coverslips were UV sterilised (20
mins) and then washed with 70 % ethanol three times. Wells were then coated with poly-(L-
lysine) and 15 µg/mL of laminin. Cells were then seeded at a density of 50 000 cells/well and left
to adhere for 18 h. Prior to stimulation, the proliferation media was replaced with differentiation
media. The cells were then stimulated according to protocols as listed below. Following
stimulation, the cells were left for a further 72 h with fresh differentiating media added every 48
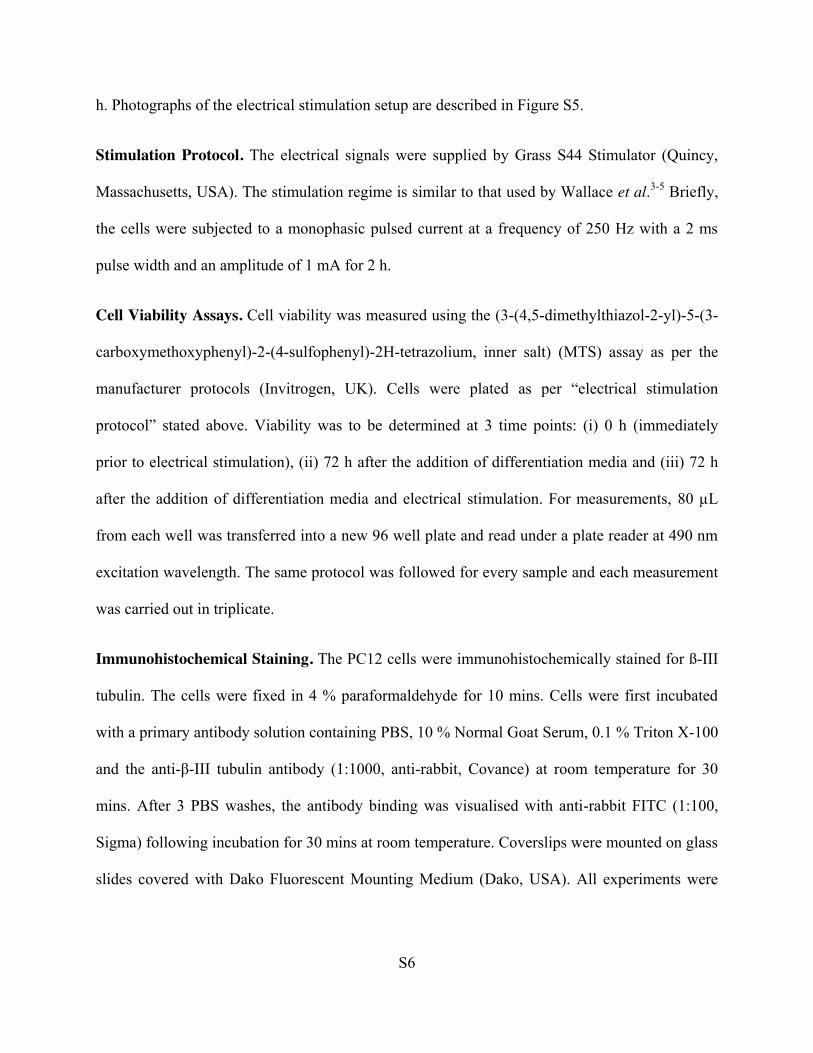
S6
h. Photographs of the electrical stimulation setup are described in Figure S5.
Stimulation Protocol. The electrical signals were supplied by Grass S44 Stimulator (Quincy,
Massachusetts, USA). The stimulation regime is similar to that used by Wallace et al.3-5 Briefly,
the cells were subjected to a monophasic pulsed current at a frequency of 250 Hz with a 2 ms
pulse width and an amplitude of 1 mA for 2 h.
Cell Viability Assays. Cell viability was measured using the (3-(4,5-dimethylthiazol-2-yl)-5-(3-
carboxymethoxyphenyl)-2-(4-sulfophenyl)-2H-tetrazolium, inner salt) (MTS) assay as per the
manufacturer protocols (Invitrogen, UK). Cells were plated as per “electrical stimulation
protocol” stated above. Viability was to be determined at 3 time points: (i) 0 h (immediately
prior to electrical stimulation), (ii) 72 h after the addition of differentiation media and (iii) 72 h
after the addition of differentiation media and electrical stimulation. For measurements, 80 µL
from each well was transferred into a new 96 well plate and read under a plate reader at 490 nm
excitation wavelength. The same protocol was followed for every sample and each measurement
was carried out in triplicate.
Immunohistochemical Staining. The PC12 cells were immunohistochemically stained for ß-III
tubulin. The cells were fixed in 4 % paraformaldehyde for 10 mins. Cells were first incubated
with a primary antibody solution containing PBS, 10 % Normal Goat Serum, 0.1 % Triton X-100
and the anti-β-III tubulin antibody (1:1000, anti-rabbit, Covance) at room temperature for 30
mins. After 3 PBS washes, the antibody binding was visualised with anti-rabbit FITC (1:100,
Sigma) following incubation for 30 mins at room temperature. Coverslips were mounted on glass
slides covered with Dako Fluorescent Mounting Medium (Dako, USA). All experiments were
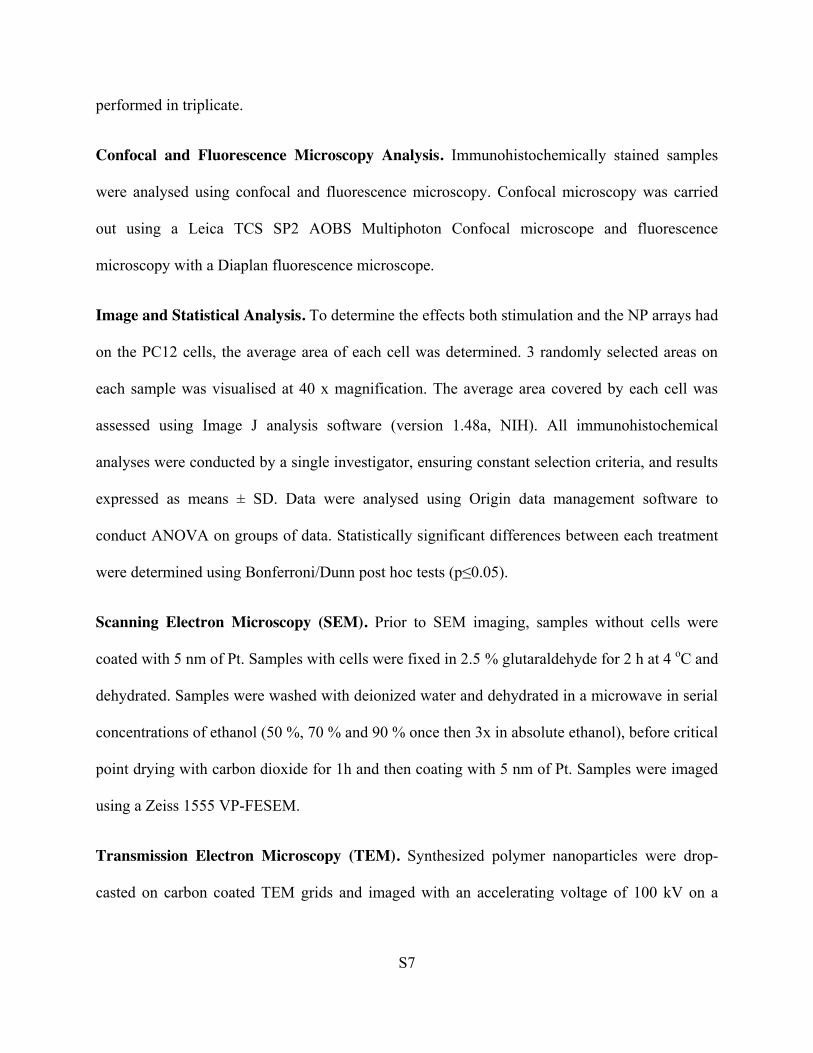
S7
performed in triplicate.
Confocal and Fluorescence Microscopy Analysis. Immunohistochemically stained samples
were analysed using confocal and fluorescence microscopy. Confocal microscopy was carried
out using a Leica TCS SP2 AOBS Multiphoton Confocal microscope and fluorescence
microscopy with a Diaplan fluorescence microscope.
Image and Statistical Analysis. To determine the effects both stimulation and the NP arrays had
on the PC12 cells, the average area of each cell was determined. 3 randomly selected areas on
each sample was visualised at 40 x magnification. The average area covered by each cell was
assessed using Image J analysis software (version 1.48a, NIH). All immunohistochemical
analyses were conducted by a single investigator, ensuring constant selection criteria, and results
expressed as means ± SD. Data were analysed using Origin data management software to
conduct ANOVA on groups of data. Statistically significant differences between each treatment
were determined using Bonferroni/Dunn post hoc tests (p≤0.05).
Scanning Electron Microscopy (SEM). Prior to SEM imaging, samples without cells were
coated with 5 nm of Pt. Samples with cells were fixed in 2.5 % glutaraldehyde for 2 h at 4 oC and
dehydrated. Samples were washed with deionized water and dehydrated in a microwave in serial
concentrations of ethanol (50 %, 70 % and 90 % once then 3x in absolute ethanol), before critical
point drying with carbon dioxide for 1h and then coating with 5 nm of Pt. Samples were imaged
using a Zeiss 1555 VP-FESEM.
Transmission Electron Microscopy (TEM). Synthesized polymer nanoparticles were drop-
casted on carbon coated TEM grids and imaged with an accelerating voltage of 100 kV on a
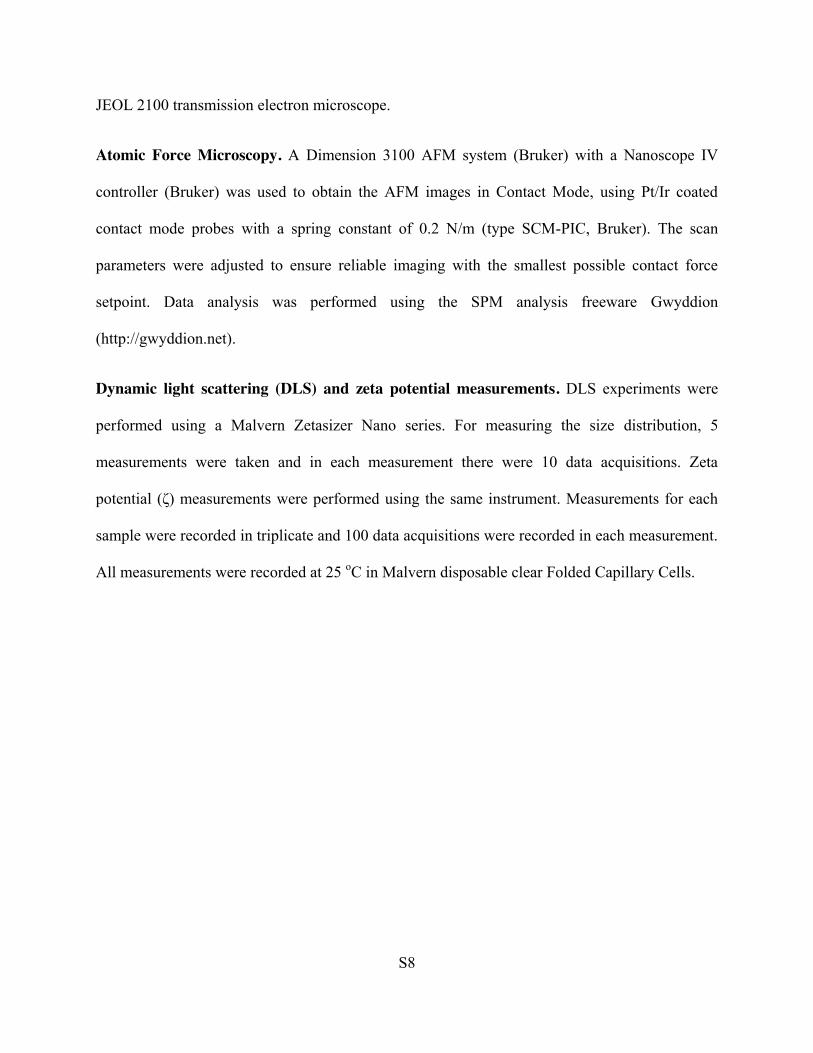
S8
JEOL 2100 transmission electron microscope.
Atomic Force Microscopy. A Dimension 3100 AFM system (Bruker) with a Nanoscope IV
controller (Bruker) was used to obtain the AFM images in Contact Mode, using Pt/Ir coated
contact mode probes with a spring constant of 0.2 N/m (type SCM-PIC, Bruker). The scan
parameters were adjusted to ensure reliable imaging with the smallest possible contact force
setpoint. Data analysis was performed using the SPM analysis freeware Gwyddion
(http://gwyddion.net).
Dynamic light scattering (DLS) and zeta potential measurements. DLS experiments were
performed using a Malvern Zetasizer Nano series. For measuring the size distribution, 5
measurements were taken and in each measurement there were 10 data acquisitions. Zeta
potential (ζ) measurements were performed using the same instrument. Measurements for each
sample were recorded in triplicate and 100 data acquisitions were recorded in each measurement.
All measurements were recorded at 25 oC in Malvern disposable clear Folded Capillary Cells.
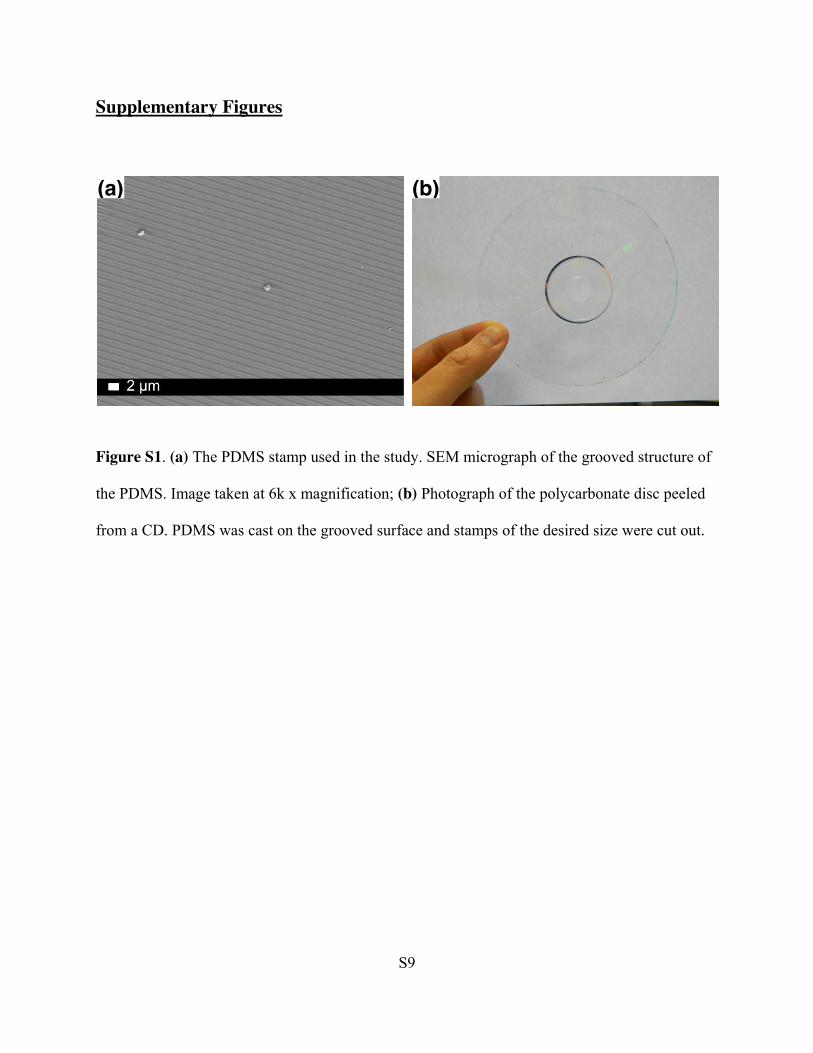
S9
Supplementary Figures
Figure S1. (a) The PDMS stamp used in the study. SEM micrograph of the grooved structure of
the PDMS. Image taken at 6k x magnification; (b) Photograph of the polycarbonate disc peeled
from a CD. PDMS was cast on the grooved surface and stamps of the desired size were cut out.
(a) (b)
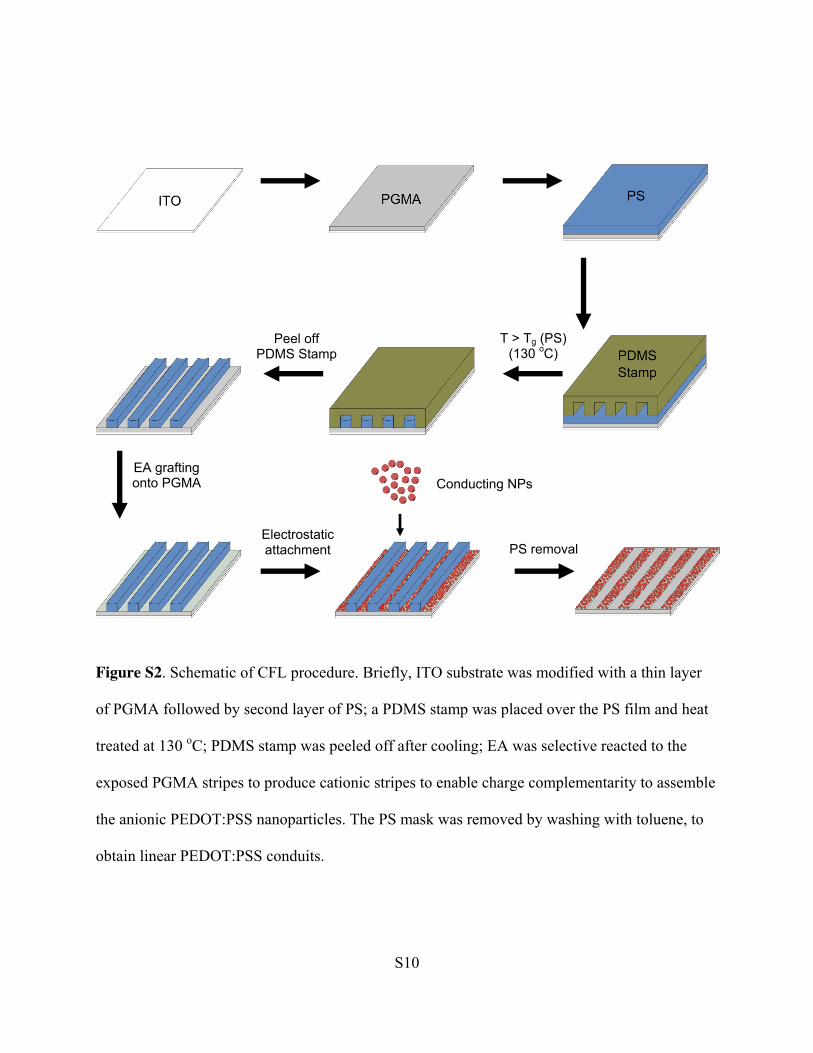
S10
Figure S2. Schematic of CFL procedure. Briefly, ITO substrate was modified with a thin layer
of PGMA followed by second layer of PS; a PDMS stamp was placed over the PS film and heat
treated at 130 oC; PDMS stamp was peeled off after cooling; EA was selective reacted to the
exposed PGMA stripes to produce cationic stripes to enable charge complementarity to assemble
the anionic PEDOT:PSS nanoparticles. The PS mask was removed by washing with toluene, to
obtain linear PEDOT:PSS conduits.
T > Tg (PS) (130 oC)
EA grafting onto PGMA Conducting NPs
PS removal
Peel off PDMS Stamp
Electrostatic attachment
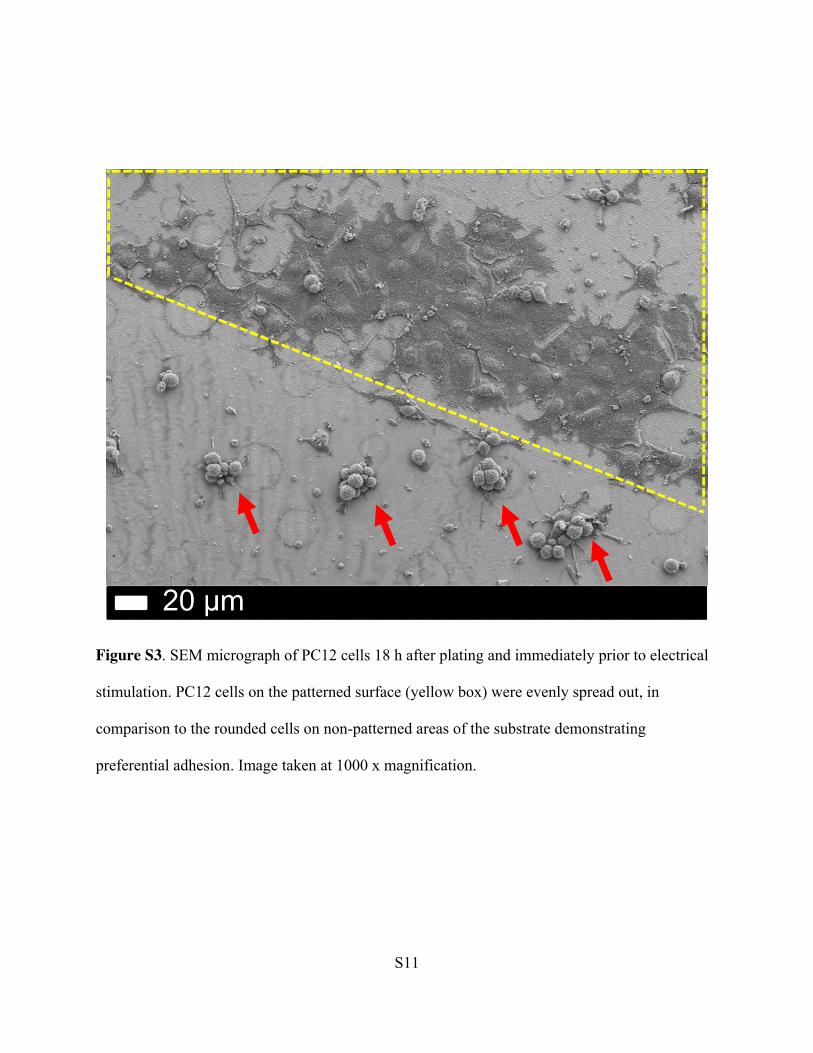
S11
Figure S3. SEM micrograph of PC12 cells 18 h after plating and immediately prior to electrical
stimulation. PC12 cells on the patterned surface (yellow box) were evenly spread out, in
comparison to the rounded cells on non-patterned areas of the substrate demonstrating
preferential adhesion. Image taken at 1000 x magnification.
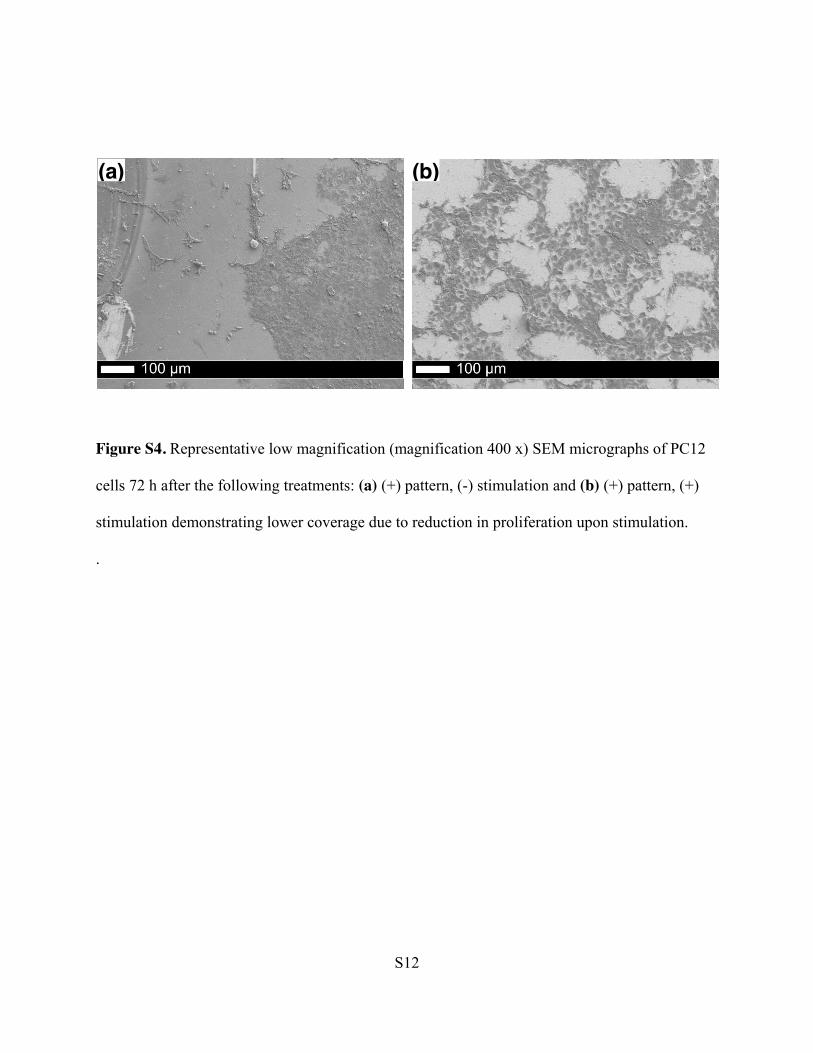
S12
Figure S4. Representative low magnification (magnification 400 x) SEM micrographs of PC12
cells 72 h after the following treatments: (a) (+) pattern, (-) stimulation and (b) (+) pattern, (+)
stimulation demonstrating lower coverage due to reduction in proliferation upon stimulation.
.
(b) (a)
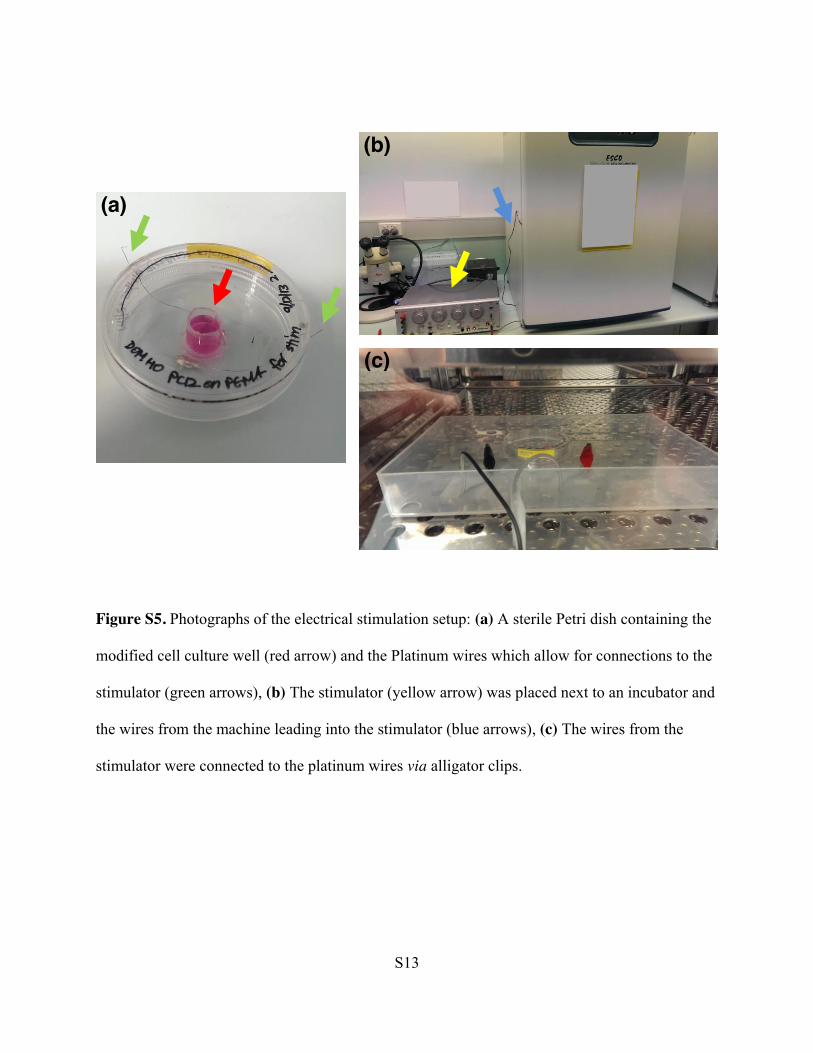
S13
Figure S5. Photographs of the electrical stimulation setup: (a) A sterile Petri dish containing the
modified cell culture well (red arrow) and the Platinum wires which allow for connections to the
stimulator (green arrows), (b) The stimulator (yellow arrow) was placed next to an incubator and
the wires from the machine leading into the stimulator (blue arrows), (c) The wires from the
stimulator were connected to the platinum wires via alligator clips.
(a)
(c)
(b)
S14
References 1. Sun, S.; Zeng, H.; Robinson, D. B.; Raoux, S.; Rice, P. M.; Wang, S. X.; Li, G. Monodisperse MFe2O4 (M = Fe, Co, Mn) Nanoparticles. J. Am. Chem. Soc. 2004, 126, 273-279.
2. Tsyalkovsky, V.; Klep, V.; Ramaratnam, K.; Lupitskyy, R.; Minko, S.; Luzinov, I. Fluorescent Reactive Core–Shell Composite Nanoparticles With a High Surface Concentration of Epoxy Functionalities. Chem. Mat. 2007, 20, 317-325.
3. Liu, X.; Gilmore, K. J.; Moulton, S. E.; Wallace, G. G. Electrical Stimulation Promotes Nerve Cell Differentiation on Polypyrrole/Poly (2-Methoxy-5 Aniline Sulfonic Acid) Composites. J. Neural Eng. 2009, 6, 065002.
4. Weng, B.; Liu, X.; Shepherd, R.; Wallace, G. G. Inkjet Printed Polypyrrole/Collagen Scaffold: A Combination of Spatial Control and Electrical Stimulation of PC12 Cells. Synt. Met. 2012, 162, 1375-1380.
5. Richardson, R. T.; Thompson, B.; Moulton, S.; Newbold, C.; Lum, M. G.; Cameron, A.; Wallace, G.; Kapsa, R.; Clark, G.; O’Leary, S. The Effect of Polypyrrole with Incorporated Neurotrophin-3 on the Promotion of Neurite Outgrowth from Auditory Neurons. Biomaterials 2007, 28, 513-523.
Functional Reactive Polymer Electrospun MatrixVipul Agarwal,*,† Dominic Ho,† Diwei Ho,† Yuriy Galabura,‡ Faizah Yasin,† Peijun Gong,§ Weike Ye,∥
Ruhani Singh,† Alaa Munshi,† Martin Saunders,⊥ Robert C. Woodward,# Timothy St. Pierre,#
Fiona M. Wood,∇ Mark Fear,∇ Dirk Lorenser,§ David D. Sampson,§,⊥ Bogdan Zdyrko,‡ Igor Luzinov,*,‡Nicole M. Smith,*,† and K. Swaminathan Iyer*,†
†School of Chemistry and Biochemistry, The University of Western Australia, Crawley, Western Australia 6009, Australia‡Department of Materials Science and Engineering, Clemson University, Clemson, South Carolina 29634, United States§Optical+Biomedical Engineering Laboratory, School of Electrical, Electronic and Computer Engineering, The University of WesternAustralia, Crawley, Western Australia 6009, Australia∥School of Chemistry and Chemical Engineering, Nanjing University, Nanjing, Jiangsu 210093, People’s Republic of China⊥Centre for Microscopy, Characterisation and Analysis, The University of Western Australia, Crawley, Western Australia 6009,Australia#School of Physics, The University of Western Australia, Crawley, Western Australia 6009, Australia∇Burn Injury Research Unit, School of Surgery, The University of Western Australia, Crawley, Western Australia 6009, Australia
ABSTRACT: Synthetic multifunctional electrospun composites are a new class ofhybrid materials with many potential applications. However, the lack of an efficient,reactive large-area substrate has been one of the major limitations in the developmentof these materials as advanced functional platforms. Herein, we demonstrate the utilityof electrospun poly(glycidyl methacrylate) films as a highly versatile platform for thedevelopment of functional nanostructured materials anchored to a surface. The utilityof this platform as a reactive substrate is demonstrated by grafting poly(N-isopropylacrylamide) to incorporate stimuli−responsive properties. Additionally, wedemonstrate that functional nanocomposites can be fabricated using this platform withproperties for sensing, fluorescence imaging, and magneto-responsiveness.
KEYWORDS: PGMA, electrospinning, multifunctional electrospun scaffold, functional materials, surface grafting,thermoresponsive scaffold, gas sensing, magneto-responsive scaffold
■ INTRODUCTIONThe development of nanostructured polymeric matrices toobtain organic−inorganic nanocomposites has been activelyresearched to produce hybrid materials for applications inelectronics, optics, medical devices, sensors, and catalysis.1−3 Ofthe various techniques developed to produce large-areananoscale polymeric matrices, one of the most researched,cost-effective, and facile methods is electrospinning. It has beenadapted for a wide range of polymers and optimized to regulatefiber diameter, alignment, and shape.4−6 There have beennumerous reports on using this technique to develop matriceswith enhanced mechanical strength,7 with selective filtration/permeability,8 fire-retarding material, optoelectronic devices,9
and substrates for catalysis.10 A key step in the development oforganic−inorganic nanocomposites is grafting to achieveintegration by minimizing interfacial tension of the nano-particles in the organic nanofiber matrix. Additionally, theability to modify the surface of the nanofiber to alter theadhesion, lubrication, wettability, and biocompatibility is pivotalin its customization for end-use applications.11 Polymers
containing epoxy groups are examples of functional polymersthat are able to react with a wide range of substrates through“‘grafting to”’ interactions mediated by the epoxy groups.12 Theversatile chemistry of epoxy groups renders a polymer that isexceptionally suitable as a universal electrospun nanofibermatrix to provide reactive groups for further grafting reactions.To this end, poly(glycidyl methacrylate) (PGMA), whichcontains an epoxy group in every repeating unit, has been usedextensively as a macromolecular anchoring layer for grafting ofpolymers to the surfaces.13−15 After electrospinning, epoxygroups in the polymer will undergo self-crosslinking uponheating, providing mechanical integrity to the matrix.16
Approximately 40% of the epoxy groups are still available forsurface modification following a 12 h treatment at 120 °C.The main advantage of using PGMA as a three-dimensional
(3D) electrospun matrix, as opposed to modifying the surface
Received: November 25, 2015Accepted: January 18, 2016Published: January 18, 2016
Research Article
www.acsami.org
© 2016 American Chemical Society 4934 DOI: 10.1021/acsami.5b11447ACS Appl. Mater. Interfaces 2016, 8, 4934−4939
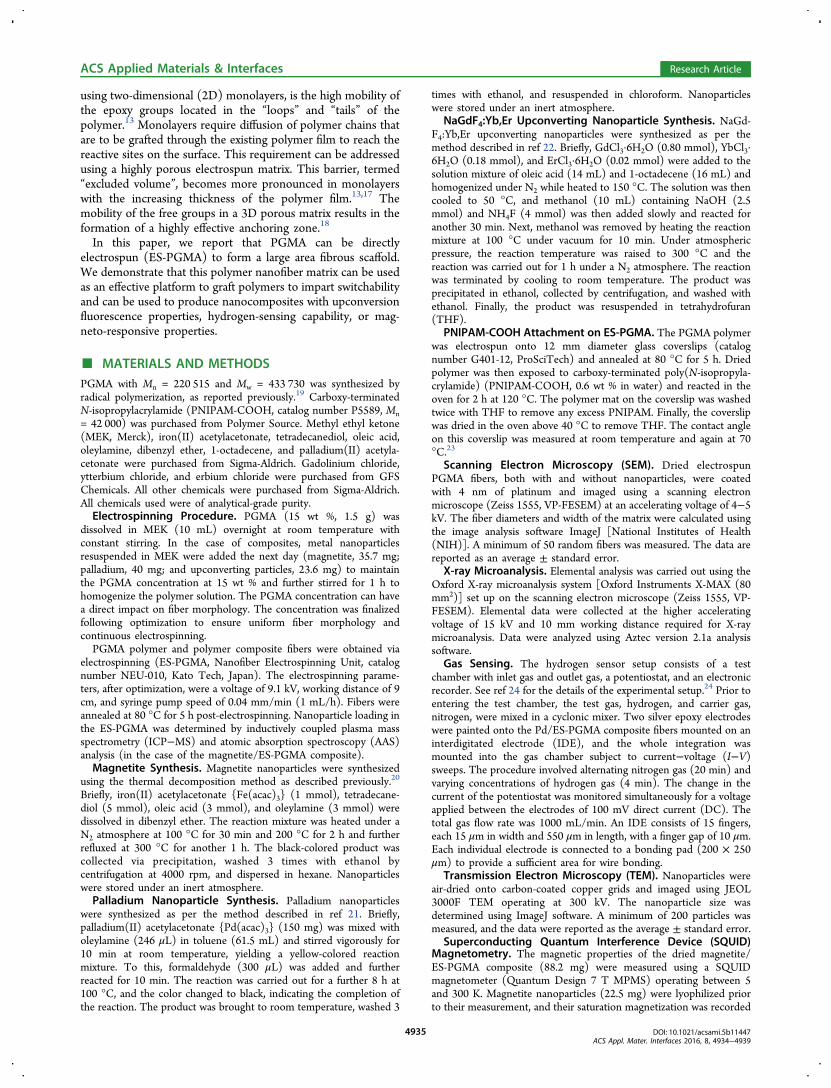
using two-dimensional (2D) monolayers, is the high mobility ofthe epoxy groups located in the “loops” and “tails” of thepolymer.13 Monolayers require diffusion of polymer chains thatare to be grafted through the existing polymer film to reach thereactive sites on the surface. This requirement can be addressedusing a highly porous electrospun matrix. This barrier, termed“excluded volume”, becomes more pronounced in monolayerswith the increasing thickness of the polymer film.13,17 Themobility of the free groups in a 3D porous matrix results in theformation of a highly effective anchoring zone.18
In this paper, we report that PGMA can be directlyelectrospun (ES-PGMA) to form a large area fibrous scaffold.We demonstrate that this polymer nanofiber matrix can be usedas an effective platform to graft polymers to impart switchabilityand can be used to produce nanocomposites with upconversionfluorescence properties, hydrogen-sensing capability, or mag-neto-responsive properties.
■ MATERIALS AND METHODSPGMA with Mn = 220 515 and Mw = 433 730 was synthesized byradical polymerization, as reported previously.19 Carboxy-terminatedN-isopropylacrylamide (PNIPAM-COOH, catalog number P5589, Mn= 42 000) was purchased from Polymer Source. Methyl ethyl ketone(MEK, Merck), iron(II) acetylacetonate, tetradecanediol, oleic acid,oleylamine, dibenzyl ether, 1-octadecene, and palladium(II) acetyla-cetonate were purchased from Sigma-Aldrich. Gadolinium chloride,ytterbium chloride, and erbium chloride were purchased from GFSChemicals. All other chemicals were purchased from Sigma-Aldrich.All chemicals used were of analytical-grade purity.Electrospinning Procedure. PGMA (15 wt %, 1.5 g) was
dissolved in MEK (10 mL) overnight at room temperature withconstant stirring. In the case of composites, metal nanoparticlesresuspended in MEK were added the next day (magnetite, 35.7 mg;palladium, 40 mg; and upconverting particles, 23.6 mg) to maintainthe PGMA concentration at 15 wt % and further stirred for 1 h tohomogenize the polymer solution. The PGMA concentration can havea direct impact on fiber morphology. The concentration was finalizedfollowing optimization to ensure uniform fiber morphology andcontinuous electrospinning.PGMA polymer and polymer composite fibers were obtained via
electrospinning (ES-PGMA, Nanofiber Electrospinning Unit, catalognumber NEU-010, Kato Tech, Japan). The electrospinning parame-ters, after optimization, were a voltage of 9.1 kV, working distance of 9cm, and syringe pump speed of 0.04 mm/min (1 mL/h). Fibers wereannealed at 80 °C for 5 h post-electrospinning. Nanoparticle loading inthe ES-PGMA was determined by inductively coupled plasma massspectrometry (ICP−MS) and atomic absorption spectroscopy (AAS)analysis (in the case of the magnetite/ES-PGMA composite).Magnetite Synthesis. Magnetite nanoparticles were synthesized
using the thermal decomposition method as described previously.20
Briefly, iron(II) acetylacetonate {Fe(acac)3} (1 mmol), tetradecane-diol (5 mmol), oleic acid (3 mmol), and oleylamine (3 mmol) weredissolved in dibenzyl ether. The reaction mixture was heated under aN2 atmosphere at 100 °C for 30 min and 200 °C for 2 h and furtherrefluxed at 300 °C for another 1 h. The black-colored product wascollected via precipitation, washed 3 times with ethanol bycentrifugation at 4000 rpm, and dispersed in hexane. Nanoparticleswere stored under an inert atmosphere.Palladium Nanoparticle Synthesis. Palladium nanoparticles
were synthesized as per the method described in ref 21. Briefly,palladium(II) acetylacetonate {Pd(acac)3} (150 mg) was mixed witholeylamine (246 μL) in toluene (61.5 mL) and stirred vigorously for10 min at room temperature, yielding a yellow-colored reactionmixture. To this, formaldehyde (300 μL) was added and furtherreacted for 10 min. The reaction was carried out for a further 8 h at100 °C, and the color changed to black, indicating the completion ofthe reaction. The product was brought to room temperature, washed 3
times with ethanol, and resuspended in chloroform. Nanoparticleswere stored under an inert atmosphere.
NaGdF4:Yb,Er Upconverting Nanoparticle Synthesis. NaGd-F4:Yb,Er upconverting nanoparticles were synthesized as per themethod described in ref 22. Briefly, GdCl3·6H2O (0.80 mmol), YbCl3·6H2O (0.18 mmol), and ErCl3·6H2O (0.02 mmol) were added to thesolution mixture of oleic acid (14 mL) and 1-octadecene (16 mL) andhomogenized under N2 while heated to 150 °C. The solution was thencooled to 50 °C, and methanol (10 mL) containing NaOH (2.5mmol) and NH4F (4 mmol) was then added slowly and reacted foranother 30 min. Next, methanol was removed by heating the reactionmixture at 100 °C under vacuum for 10 min. Under atmosphericpressure, the reaction temperature was raised to 300 °C and thereaction was carried out for 1 h under a N2 atmosphere. The reactionwas terminated by cooling to room temperature. The product wasprecipitated in ethanol, collected by centrifugation, and washed withethanol. Finally, the product was resuspended in tetrahydrofuran(THF).
PNIPAM-COOH Attachment on ES-PGMA. The PGMA polymerwas electrospun onto 12 mm diameter glass coverslips (catalognumber G401-12, ProSciTech) and annealed at 80 °C for 5 h. Driedpolymer was then exposed to carboxy-terminated poly(N-isopropyla-crylamide) (PNIPAM-COOH, 0.6 wt % in water) and reacted in theoven for 2 h at 120 °C. The polymer mat on the coverslip was washedtwice with THF to remove any excess PNIPAM. Finally, the coverslipwas dried in the oven above 40 °C to remove THF. The contact angleon this coverslip was measured at room temperature and again at 70°C.23
Scanning Electron Microscopy (SEM). Dried electrospunPGMA fibers, both with and without nanoparticles, were coatedwith 4 nm of platinum and imaged using a scanning electronmicroscope (Zeiss 1555, VP-FESEM) at an accelerating voltage of 4−5kV. The fiber diameters and width of the matrix were calculated usingthe image analysis software ImageJ [National Institutes of Health(NIH)]. A minimum of 50 random fibers was measured. The data arereported as an average ± standard error.
X-ray Microanalysis. Elemental analysis was carried out using theOxford X-ray microanalysis system [Oxford Instruments X-MAX (80mm2)] set up on the scanning electron microscope (Zeiss 1555, VP-FESEM). Elemental data were collected at the higher acceleratingvoltage of 15 kV and 10 mm working distance required for X-raymicroanalysis. Data were analyzed using Aztec version 2.1a analysissoftware.
Gas Sensing. The hydrogen sensor setup consists of a testchamber with inlet gas and outlet gas, a potentiostat, and an electronicrecorder. See ref 24 for the details of the experimental setup.24 Prior toentering the test chamber, the test gas, hydrogen, and carrier gas,nitrogen, were mixed in a cyclonic mixer. Two silver epoxy electrodeswere painted onto the Pd/ES-PGMA composite fibers mounted on aninterdigitated electrode (IDE), and the whole integration wasmounted into the gas chamber subject to current−voltage (I−V)sweeps. The procedure involved alternating nitrogen gas (20 min) andvarying concentrations of hydrogen gas (4 min). The change in thecurrent of the potentiostat was monitored simultaneously for a voltageapplied between the electrodes of 100 mV direct current (DC). Thetotal gas flow rate was 1000 mL/min. An IDE consists of 15 fingers,each 15 μm in width and 550 μm in length, with a finger gap of 10 μm.Each individual electrode is connected to a bonding pad (200 × 250μm) to provide a sufficient area for wire bonding.
Transmission Electron Microscopy (TEM). Nanoparticles wereair-dried onto carbon-coated copper grids and imaged using JEOL3000F TEM operating at 300 kV. The nanoparticle size wasdetermined using ImageJ software. A minimum of 200 particles wasmeasured, and the data were reported as the average ± standard error.
Superconducting Quantum Interference Device (SQUID)Magnetometry. The magnetic properties of the dried magnetite/ES-PGMA composite (88.2 mg) were measured using a SQUIDmagnetometer (Quantum Design 7 T MPMS) operating between 5and 300 K. Magnetite nanoparticles (22.5 mg) were lyophilized priorto their measurement, and their saturation magnetization was recorded
ACS Applied Materials & Interfaces Research Article
DOI: 10.1021/acsami.5b11447ACS Appl. Mater. Interfaces 2016, 8, 4934−4939
4935
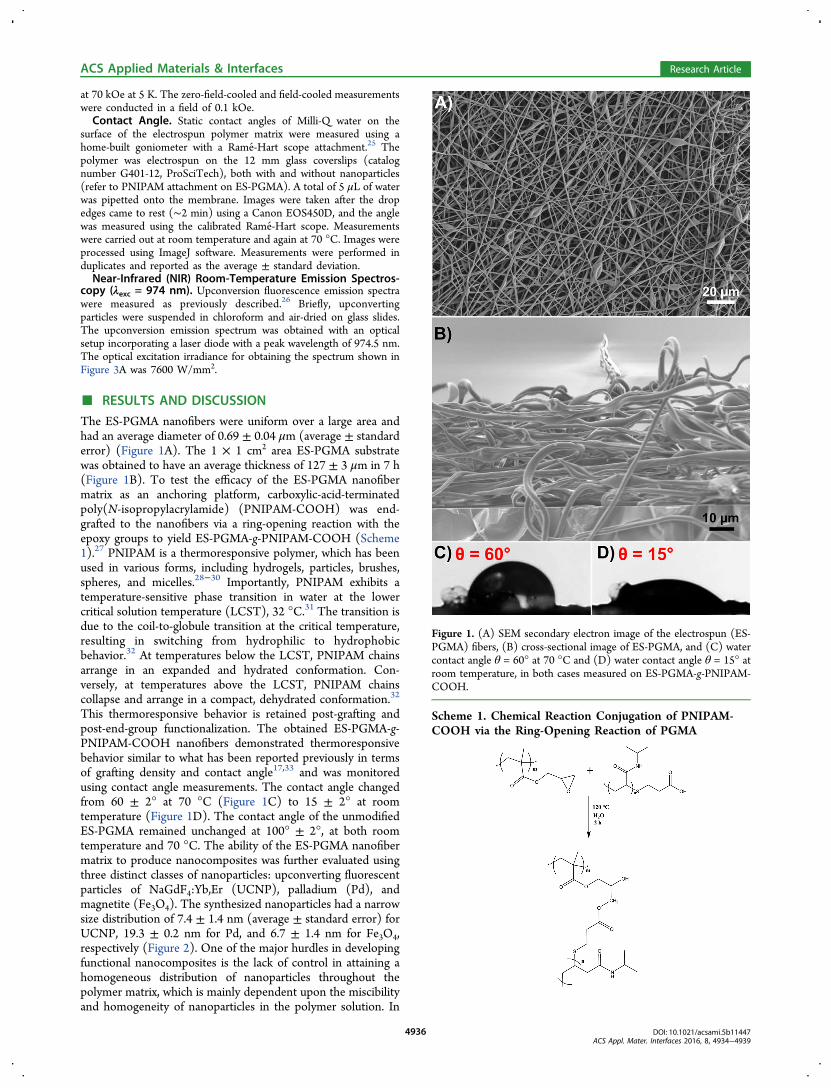
at 70 kOe at 5 K. The zero-field-cooled and field-cooled measurementswere conducted in a field of 0.1 kOe.Contact Angle. Static contact angles of Milli-Q water on the
surface of the electrospun polymer matrix were measured using ahome-built goniometer with a Rame-Hart scope attachment.25 Thepolymer was electrospun on the 12 mm glass coverslips (catalognumber G401-12, ProSciTech), both with and without nanoparticles(refer to PNIPAM attachment on ES-PGMA). A total of 5 μL of waterwas pipetted onto the membrane. Images were taken after the dropedges came to rest (∼2 min) using a Canon EOS450D, and the anglewas measured using the calibrated Rame-Hart scope. Measurementswere carried out at room temperature and again at 70 °C. Images wereprocessed using ImageJ software. Measurements were performed induplicates and reported as the average ± standard deviation.Near-Infrared (NIR) Room-Temperature Emission Spectros-
copy (λexc = 974 nm). Upconversion fluorescence emission spectrawere measured as previously described.26 Briefly, upconvertingparticles were suspended in chloroform and air-dried on glass slides.The upconversion emission spectrum was obtained with an opticalsetup incorporating a laser diode with a peak wavelength of 974.5 nm.The optical excitation irradiance for obtaining the spectrum shown inFigure 3A was 7600 W/mm2.
■ RESULTS AND DISCUSSIONThe ES-PGMA nanofibers were uniform over a large area andhad an average diameter of 0.69 ± 0.04 μm (average ± standarderror) (Figure 1A). The 1 × 1 cm2 area ES-PGMA substratewas obtained to have an average thickness of 127 ± 3 μm in 7 h(Figure 1B). To test the efficacy of the ES-PGMA nanofibermatrix as an anchoring platform, carboxylic-acid-terminatedpoly(N-isopropylacrylamide) (PNIPAM-COOH) was end-grafted to the nanofibers via a ring-opening reaction with theepoxy groups to yield ES-PGMA-g-PNIPAM-COOH (Scheme1).27 PNIPAM is a thermoresponsive polymer, which has beenused in various forms, including hydrogels, particles, brushes,spheres, and micelles.28−30 Importantly, PNIPAM exhibits atemperature-sensitive phase transition in water at the lowercritical solution temperature (LCST), 32 °C.31 The transition isdue to the coil-to-globule transition at the critical temperature,resulting in switching from hydrophilic to hydrophobicbehavior.32 At temperatures below the LCST, PNIPAM chainsarrange in an expanded and hydrated conformation. Con-versely, at temperatures above the LCST, PNIPAM chainscollapse and arrange in a compact, dehydrated conformation.32
This thermoresponsive behavior is retained post-grafting andpost-end-group functionalization. The obtained ES-PGMA-g-PNIPAM-COOH nanofibers demonstrated thermoresponsivebehavior similar to what has been reported previously in termsof grafting density and contact angle17,33 and was monitoredusing contact angle measurements. The contact angle changedfrom 60 ± 2° at 70 °C (Figure 1C) to 15 ± 2° at roomtemperature (Figure 1D). The contact angle of the unmodifiedES-PGMA remained unchanged at 100° ± 2°, at both roomtemperature and 70 °C. The ability of the ES-PGMA nanofibermatrix to produce nanocomposites was further evaluated usingthree distinct classes of nanoparticles: upconverting fluorescentparticles of NaGdF4:Yb,Er (UCNP), palladium (Pd), andmagnetite (Fe3O4). The synthesized nanoparticles had a narrowsize distribution of 7.4 ± 1.4 nm (average ± standard error) forUCNP, 19.3 ± 0.2 nm for Pd, and 6.7 ± 1.4 nm for Fe3O4,respectively (Figure 2). One of the major hurdles in developingfunctional nanocomposites is the lack of control in attaining ahomogeneous distribution of nanoparticles throughout thepolymer matrix, which is mainly dependent upon the miscibilityand homogeneity of nanoparticles in the polymer solution. In
Figure 1. (A) SEM secondary electron image of the electrospun (ES-PGMA) fibers, (B) cross-sectional image of ES-PGMA, and (C) watercontact angle θ = 60° at 70 °C and (D) water contact angle θ = 15° atroom temperature, in both cases measured on ES-PGMA-g-PNIPAM-COOH.
Scheme 1. Chemical Reaction Conjugation of PNIPAM-COOH via the Ring-Opening Reaction of PGMA
ACS Applied Materials & Interfaces Research Article
DOI: 10.1021/acsami.5b11447ACS Appl. Mater. Interfaces 2016, 8, 4934−4939
4936
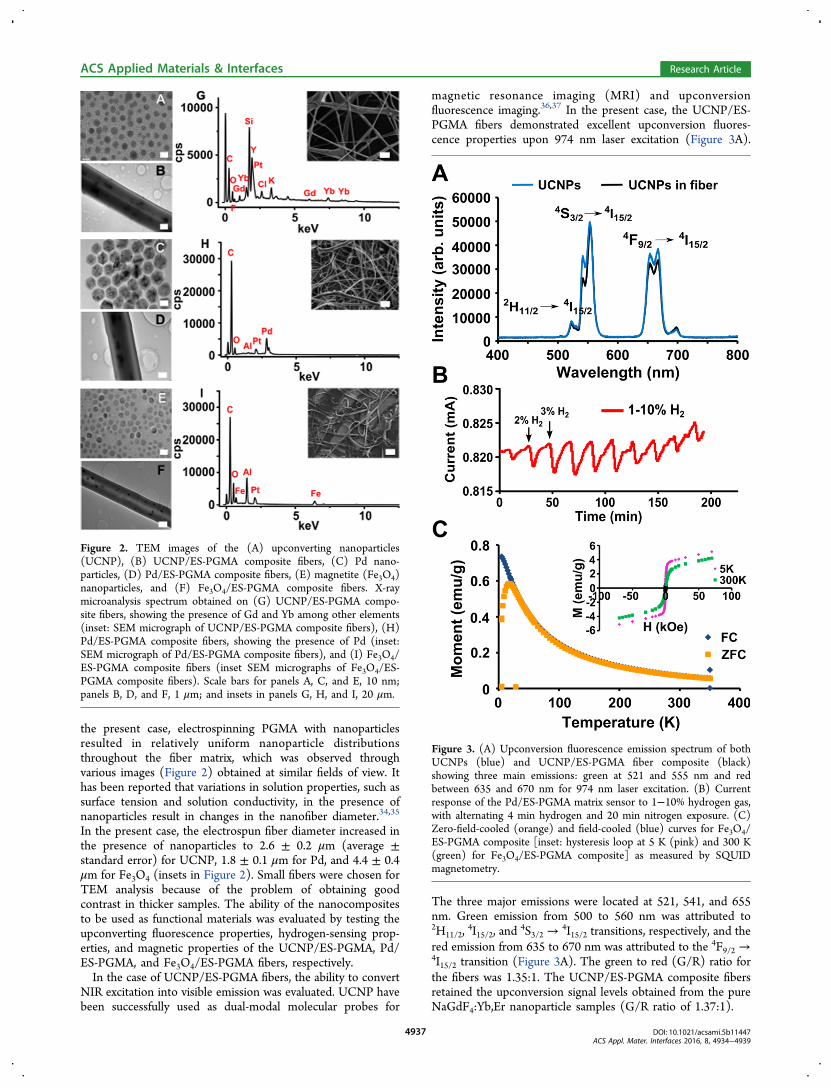
the present case, electrospinning PGMA with nanoparticlesresulted in relatively uniform nanoparticle distributionsthroughout the fiber matrix, which was observed throughvarious images (Figure 2) obtained at similar fields of view. Ithas been reported that variations in solution properties, such assurface tension and solution conductivity, in the presence ofnanoparticles result in changes in the nanofiber diameter.34,35
In the present case, the electrospun fiber diameter increased inthe presence of nanoparticles to 2.6 ± 0.2 μm (average ±standard error) for UCNP, 1.8 ± 0.1 μm for Pd, and 4.4 ± 0.4μm for Fe3O4 (insets in Figure 2). Small fibers were chosen forTEM analysis because of the problem of obtaining goodcontrast in thicker samples. The ability of the nanocompositesto be used as functional materials was evaluated by testing theupconverting fluorescence properties, hydrogen-sensing prop-erties, and magnetic properties of the UCNP/ES-PGMA, Pd/ES-PGMA, and Fe3O4/ES-PGMA fibers, respectively.In the case of UCNP/ES-PGMA fibers, the ability to convert
NIR excitation into visible emission was evaluated. UCNP havebeen successfully used as dual-modal molecular probes for
magnetic resonance imaging (MRI) and upconversionfluorescence imaging.36,37 In the present case, the UCNP/ES-PGMA fibers demonstrated excellent upconversion fluores-cence properties upon 974 nm laser excitation (Figure 3A).
The three major emissions were located at 521, 541, and 655nm. Green emission from 500 to 560 nm was attributed to2H11/2,
4I15/2, and4S3/2 →
4I15/2 transitions, respectively, and thered emission from 635 to 670 nm was attributed to the 4F9/2 →4I15/2 transition (Figure 3A). The green to red (G/R) ratio forthe fibers was 1.35:1. The UCNP/ES-PGMA composite fibersretained the upconversion signal levels obtained from the pureNaGdF4:Yb,Er nanoparticle samples (G/R ratio of 1.37:1).
Figure 2. TEM images of the (A) upconverting nanoparticles(UCNP), (B) UCNP/ES-PGMA composite fibers, (C) Pd nano-particles, (D) Pd/ES-PGMA composite fibers, (E) magnetite (Fe3O4)nanoparticles, and (F) Fe3O4/ES-PGMA composite fibers. X-raymicroanalysis spectrum obtained on (G) UCNP/ES-PGMA compo-site fibers, showing the presence of Gd and Yb among other elements(inset: SEM micrograph of UCNP/ES-PGMA composite fibers), (H)Pd/ES-PGMA composite fibers, showing the presence of Pd (inset:SEM micrograph of Pd/ES-PGMA composite fibers), and (I) Fe3O4/ES-PGMA composite fibers (inset SEM micrographs of Fe3O4/ES-PGMA composite fibers). Scale bars for panels A, C, and E, 10 nm;panels B, D, and F, 1 μm; and insets in panels G, H, and I, 20 μm.
Figure 3. (A) Upconversion fluorescence emission spectrum of bothUCNPs (blue) and UCNP/ES-PGMA fiber composite (black)showing three main emissions: green at 521 and 555 nm and redbetween 635 and 670 nm for 974 nm laser excitation. (B) Currentresponse of the Pd/ES-PGMA matrix sensor to 1−10% hydrogen gas,with alternating 4 min hydrogen and 20 min nitrogen exposure. (C)Zero-field-cooled (orange) and field-cooled (blue) curves for Fe3O4/ES-PGMA composite [inset: hysteresis loop at 5 K (pink) and 300 K(green) for Fe3O4/ES-PGMA composite] as measured by SQUIDmagnetometry.
ACS Applied Materials & Interfaces Research Article
DOI: 10.1021/acsami.5b11447ACS Appl. Mater. Interfaces 2016, 8, 4934−4939
4937
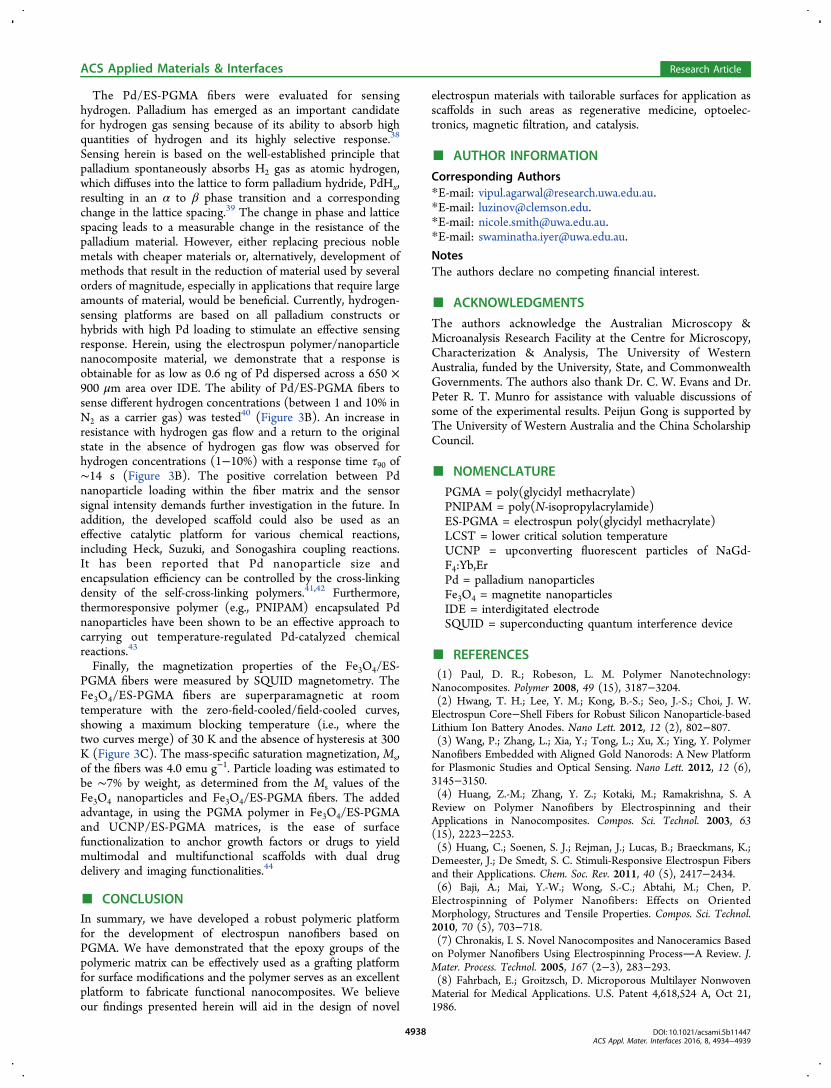
The Pd/ES-PGMA fibers were evaluated for sensinghydrogen. Palladium has emerged as an important candidatefor hydrogen gas sensing because of its ability to absorb highquantities of hydrogen and its highly selective response.38
Sensing herein is based on the well-established principle thatpalladium spontaneously absorbs H2 gas as atomic hydrogen,which diffuses into the lattice to form palladium hydride, PdHx,resulting in an α to β phase transition and a correspondingchange in the lattice spacing.39 The change in phase and latticespacing leads to a measurable change in the resistance of thepalladium material. However, either replacing precious noblemetals with cheaper materials or, alternatively, development ofmethods that result in the reduction of material used by severalorders of magnitude, especially in applications that require largeamounts of material, would be beneficial. Currently, hydrogen-sensing platforms are based on all palladium constructs orhybrids with high Pd loading to stimulate an effective sensingresponse. Herein, using the electrospun polymer/nanoparticlenanocomposite material, we demonstrate that a response isobtainable for as low as 0.6 ng of Pd dispersed across a 650 ×900 μm area over IDE. The ability of Pd/ES-PGMA fibers tosense different hydrogen concentrations (between 1 and 10% inN2 as a carrier gas) was tested40 (Figure 3B). An increase inresistance with hydrogen gas flow and a return to the originalstate in the absence of hydrogen gas flow was observed forhydrogen concentrations (1−10%) with a response time τ90 of∼14 s (Figure 3B). The positive correlation between Pdnanoparticle loading within the fiber matrix and the sensorsignal intensity demands further investigation in the future. Inaddition, the developed scaffold could also be used as aneffective catalytic platform for various chemical reactions,including Heck, Suzuki, and Sonogashira coupling reactions.It has been reported that Pd nanoparticle size andencapsulation efficiency can be controlled by the cross-linkingdensity of the self-cross-linking polymers.41,42 Furthermore,thermoresponsive polymer (e.g., PNIPAM) encapsulated Pdnanoparticles have been shown to be an effective approach tocarrying out temperature-regulated Pd-catalyzed chemicalreactions.43
Finally, the magnetization properties of the Fe3O4/ES-PGMA fibers were measured by SQUID magnetometry. TheFe3O4/ES-PGMA fibers are superparamagnetic at roomtemperature with the zero-field-cooled/field-cooled curves,showing a maximum blocking temperature (i.e., where thetwo curves merge) of 30 K and the absence of hysteresis at 300K (Figure 3C). The mass-specific saturation magnetization, Ms,of the fibers was 4.0 emu g−1. Particle loading was estimated tobe ∼7% by weight, as determined from the Ms values of theFe3O4 nanoparticles and Fe3O4/ES-PGMA fibers. The addedadvantage, in using the PGMA polymer in Fe3O4/ES-PGMAand UCNP/ES-PGMA matrices, is the ease of surfacefunctionalization to anchor growth factors or drugs to yieldmultimodal and multifunctional scaffolds with dual drugdelivery and imaging functionalities.44
■ CONCLUSIONIn summary, we have developed a robust polymeric platformfor the development of electrospun nanofibers based onPGMA. We have demonstrated that the epoxy groups of thepolymeric matrix can be effectively used as a grafting platformfor surface modifications and the polymer serves as an excellentplatform to fabricate functional nanocomposites. We believeour findings presented herein will aid in the design of novel
electrospun materials with tailorable surfaces for application asscaffolds in such areas as regenerative medicine, optoelec-tronics, magnetic filtration, and catalysis.
■ AUTHOR INFORMATIONCorresponding Authors*E-mail: [email protected].*E-mail: [email protected].*E-mail: [email protected].*E-mail: [email protected] authors declare no competing financial interest.
■ ACKNOWLEDGMENTSThe authors acknowledge the Australian Microscopy &Microanalysis Research Facility at the Centre for Microscopy,Characterization & Analysis, The University of WesternAustralia, funded by the University, State, and CommonwealthGovernments. The authors also thank Dr. C. W. Evans and Dr.Peter R. T. Munro for assistance with valuable discussions ofsome of the experimental results. Peijun Gong is supported byThe University of Western Australia and the China ScholarshipCouncil.
■ NOMENCLATUREPGMA = poly(glycidyl methacrylate)PNIPAM = poly(N-isopropylacrylamide)ES-PGMA = electrospun poly(glycidyl methacrylate)LCST = lower critical solution temperatureUCNP = upconverting fluorescent particles of NaGd-F4:Yb,ErPd = palladium nanoparticlesFe3O4 = magnetite nanoparticlesIDE = interdigitated electrodeSQUID = superconducting quantum interference device
■ REFERENCES(1) Paul, D. R.; Robeson, L. M. Polymer Nanotechnology:Nanocomposites. Polymer 2008, 49 (15), 3187−3204.(2) Hwang, T. H.; Lee, Y. M.; Kong, B.-S.; Seo, J.-S.; Choi, J. W.Electrospun Core−Shell Fibers for Robust Silicon Nanoparticle-basedLithium Ion Battery Anodes. Nano Lett. 2012, 12 (2), 802−807.(3) Wang, P.; Zhang, L.; Xia, Y.; Tong, L.; Xu, X.; Ying, Y. PolymerNanofibers Embedded with Aligned Gold Nanorods: A New Platformfor Plasmonic Studies and Optical Sensing. Nano Lett. 2012, 12 (6),3145−3150.(4) Huang, Z.-M.; Zhang, Y. Z.; Kotaki, M.; Ramakrishna, S. AReview on Polymer Nanofibers by Electrospinning and theirApplications in Nanocomposites. Compos. Sci. Technol. 2003, 63(15), 2223−2253.(5) Huang, C.; Soenen, S. J.; Rejman, J.; Lucas, B.; Braeckmans, K.;Demeester, J.; De Smedt, S. C. Stimuli-Responsive Electrospun Fibersand their Applications. Chem. Soc. Rev. 2011, 40 (5), 2417−2434.(6) Baji, A.; Mai, Y.-W.; Wong, S.-C.; Abtahi, M.; Chen, P.Electrospinning of Polymer Nanofibers: Effects on OrientedMorphology, Structures and Tensile Properties. Compos. Sci. Technol.2010, 70 (5), 703−718.(7) Chronakis, I. S. Novel Nanocomposites and Nanoceramics Basedon Polymer Nanofibers Using Electrospinning ProcessA Review. J.Mater. Process. Technol. 2005, 167 (2−3), 283−293.(8) Fahrbach, E.; Groitzsch, D. Microporous Multilayer NonwovenMaterial for Medical Applications. U.S. Patent 4,618,524 A, Oct 21,1986.
ACS Applied Materials & Interfaces Research Article
DOI: 10.1021/acsami.5b11447ACS Appl. Mater. Interfaces 2016, 8, 4934−4939
4938
(9) Wang, X.; Drew, C.; Lee, S.-H.; Senecal, K. J.; Kumar, J.;Samuelson, L. A. Electrospun Nanofibrous Membranes for HighlySensitive Optical Sensors. Nano Lett. 2002, 2 (11), 1273−1275.(10) Formo, E.; Lee, E.; Campbell, D.; Xia, Y. Functionalization ofElectrospun TiO2 Nanofibers with Pt Nanoparticles and Nanowiresfor Catalytic Applications. Nano Lett. 2008, 8 (2), 668−672.(11) Edmondson, S.; Osborne, V. L.; Huck, W. T. Polymer Brushesvia Surface-Initiated Polymerizations. Chem. Soc. Rev. 2004, 33 (1),14−22.(12) Zdyrko, B.; Luzinov, I. Polymer Brushes by the “Grafting to”Method. Macromol. Rapid Commun. 2011, 32 (12), 859−869.(13) Iyer, K. S.; Luzinov, I. Effect of Macromolecular AnchoringLayer Thickness and Molecular Weight on Polymer Grafting.Macromolecules 2004, 37 (25), 9538−9545.(14) Eckert, A. W.; Grobe, D.; Rothe, U. Surface-Modification ofPolystyrene-Microtitre Plates via Grafting of Glycidylmethacrylate andCoating of poly-Glycidyl Methacrylate. Biomaterials 2000, 21 (5),441−447.(15) Zdyrko, B.; Iyer, K. S.; Luzinov, I. Macromolecular AnchoringLayers for Polymer Grafting: Comparative Study. Polymer 2006, 47(1), 272−279.(16) Luzinov, I. A.; Iyer, K. S.; Klep, V. Z.; Zdyrko, B. V. SurfaceModification of Substrates. U.S. Patent 20040185260 A1, Sept 23,2004.(17) Seeber, M.; Zdyrko, B.; Burtovvy, R.; Andrukh, T.; Tsai, C.-C.;Owens, J. R.; Kornev, K. G.; Luzinov, I. Surface Grafting ofThermoresponsive Microgel Nanoparticles. Soft Matter 2011, 7 (21),9962−9971.(18) Luzinov, I.; Klep, V.; Minko, S.; Iyer, K. S.; Draper, J.; Zdyrko,B. Synthesis of Responsive Polymer Brushes via MacromolecularAnchoring Layer. PMSE Prepr. 2004, 90, 224−225.(19) Tsyalkovsky, V.; Burtovyy, R.; Klep, V.; Lupitskyy, R.;Motornov, M.; Minko, S.; Luzinov, I. Fluorescent NanoparticlesStabilized by Poly (Ethylene Glycol) Containing Shell for pH-Triggered Tunable Aggregation in Aqueous Environment. Langmuir2010, 26 (13), 10684−10692.(20) Sun, S.; Zeng, H.; Robinson, D. B.; Raoux, S.; Rice, P. M.;Wang, S. X.; Li, G. Monodisperse MFe2O4 (M = Fe, Co, Mn)Nanoparticles. J. Am. Chem. Soc. 2004, 126 (1), 273−279.(21) Niu, Z.; Peng, Q.; Gong, M.; Rong, H.; Li, Y. Oleylamine-Mediated Shape Evolution of Palladium Nanocrystals. Angew. Chem.,Int. Ed. 2011, 50 (28), 6315−6319.(22) Liu, C.; Gao, Z.; Zeng, J.; Hou, Y.; Fang, F.; Li, Y.; Qiao, R.;Shen, L.; Lei, H.; Yang, W.; Gao, M. Magnetic/UpconversionFluorescent NaGdF4:Yb,Er Nanoparticle-Based Dual-Modal MolecularProbes for Imaging Tiny Tumors in Vivo. ACS Nano 2013, 7 (8),7227−7240.(23) Fu, G. D.; Xu, L. Q.; Yao, F.; Zhang, K.; Wang, X. F.; Zhu, M.F.; Nie, S. Z. Smart Nanofibers from Combined Living RadicalPolymerization, “Click Chemistry”, and Electrospinning. ACS Appl.Mater. Interfaces 2009, 1 (2), 239−243.(24) Zou, J.; Hubble, L. J.; Iyer, K. S.; Raston, C. L. Bare PalladiumNano-Rosettes for Real-Time High-Performance and Facile HydrogenSensing. Sens. Actuators, B 2010, 150 (1), 291−295.(25) Baker, M. V.; Watling, J. D. Functionalization of AlkylsiloxaneMonolayers via Free-Radical Bromination. Langmuir 1997, 13 (7),2027−2032.(26) Challenor, M.; Gong, P.; Lorenser, D.; Fitzgerald, M.; Dunlop,S.; Sampson, D. D.; Iyer, K. S. Iron Oxide-Induced Thermal Effects onSolid-State Upconversion Emissions in NaYF4:Yb
+3, Er+3 Nanocrystals.ACS Appl. Mater. Interfaces 2013, 5 (16), 7875−7880.(27) Suzuki, D.; Kawaguchi, H. Gold Nanoparticle Localization at theCore Surface by Using Thermosensitive Core−Shell Particles as aTemplate. Langmuir 2005, 21 (25), 12016−12024.(28) Schmaljohann, D. Thermo- and pH-Responsive Polymers inDrug Delivery. Adv. Drug Delivery Rev. 2006, 58 (15), 1655−1670.(29) Kawaguchi, H. Functional Polymer Microspheres. Prog. Polym.Sci. 2000, 25 (8), 1171−1210.
(30) Li, Y.; Lokitz, B. S.; Armes, S. P.; McCormick, C. L. Synthesis ofReversible Shell Cross-Linked Micelles for Controlled Release ofBioactive Agents†. Macromolecules 2006, 39 (8), 2726−2728.(31) Wu, J.; Zhou, B.; Hu, Z. Phase Behavior of ThermallyResponsive Microgel Colloids. Phys. Rev. Lett. 2003, 90 (4), 048304.(32) Yoshida, R.; Uchida, K.; Kaneko, Y.; Sakai, K.; Kikuchi, A.;Sakurai, Y.; Okano, T. Comb-Type Grafted Hydrogels with RapidDeswelling Response to Temperature Changes. Nature 1995, 374(6519), 240−242.(33) Klep, V.; Zdyrko, B.; Luzinov, I. PNIPAAM Gradient PolymerBrushes. PMSE Prepr. 2005, 93, 462.(34) Kang, H.; Zhu, Y.; Yang, X.; Jing, Y.; Lengalova, A.; Li, C. ANovel Catalyst Based on Electrospun Silver-Doped Silica Fibers withRibbon Morphology. J. Colloid Interface Sci. 2010, 341 (2), 303−310.(35) Koombhongse, S.; Liu, W.; Reneker, D. H. Flat PolymerRibbons and Other Shapes by Electrospinning. J. Polym. Sci., Part B:Polym. Phys. 2001, 39 (21), 2598−2606.(36) Ryu, J.; Park, H.-Y.; Kim, K.; Kim, H.; Yoo, J. H.; Kang, M.; Im,K.; Grailhe, R.; Song, R. Facile Synthesis of Ultrasmall and HexagonalNaGdF4: Yb
3+, Er3+ Nanoparticles with Magnetic and UpconversionImaging Properties. J. Phys. Chem. C 2010, 114 (49), 21077−21082.(37) Boyer, J.-C.; Vetrone, F.; Cuccia, L. A.; Capobianco, J. A.Synthesis of Colloidal Upconverting NaYF4 Nanocrystals Doped withEr3+, Yb3+ and Tm3+, Yb3+ via Thermal Decomposition of LanthanideTrifluoroacetate Precursors. J. Am. Chem. Soc. 2006, 128 (23), 7444−7445.(38) Kolmakov, A.; Klenov, D.; Lilach, Y.; Stemmer, S.; Moskovits,M. Enhanced Gas Sensing by Individual SnO2 Nanowires andNanobelts Functionalized with Pd Catalyst Particles. Nano Lett.2005, 5 (4), 667−673.(39) Favier, F.; Walter, E. C.; Zach, M. P.; Benter, T.; Penner, R. M.Hydrogen Sensors and Switches from Electrodeposited PalladiumMesowire Arrays. Science 2001, 293 (5538), 2227−2231.(40) Zou, J.; Zdyrko, B.; Luzinov, I.; Raston, C. L.; Iyer, K. S.Regiospecific Linear Assembly of Pd Nanocubes for Hydrogen GasSensing. Chem. Commun. 2012, 48 (7), 1033−1035.(41) Biffis, A.; Sperotto, E. Microgel-Stabilized Metal Nanoclusters:Improved Solid-State Stability and Catalytic Activity in SuzukiCouplings. Langmuir 2003, 19 (22), 9548−9550.(42) Cho, J. K.; Najman, R.; Dean, T. W.; Ichihara, O.; Muller, C.;Bradley, M. Captured and Cross-Linked Palladium Nanoparticles. J.Am. Chem. Soc. 2006, 128 (19), 6276−6277.(43) Zhang, J.; Zhang, M.; Tang, K.; Verpoort, F.; Sun, T. Polymer-Based Stimuli-Responsive Recyclable Catalytic Systems for OrganicSynthesis. Small 2014, 10 (1), 32−46.(44) Evans, C. W.; Fitzgerald, M.; Clemons, T. D.; House, M. J.;Padman, B. S.; Shaw, J. A.; Saunders, M.; Harvey, A. R.; Zdyrko, B.;Luzinov, I.; Silva, G. A.; Dunlop, S. A.; Iyer, K. S. Multimodal Analysisof PEI-Mediated Endocytosis of Nanoparticles in Neural Cells. ACSNano 2011, 5 (11), 8640−8648.
ACS Applied Materials & Interfaces Research Article
DOI: 10.1021/acsami.5b11447ACS Appl. Mater. Interfaces 2016, 8, 4934−4939
4939
6692 | New J. Chem., 2016, 40, 6692--6696 This journal is©The Royal Society of Chemistry and the Centre National de la Recherche Scientifique 2016
Cite this: NewJ.Chem., 2016,40, 6692
Poly(glycidyl methacrylate) coated dual modeupconverting nanoparticles for neuronalcell imaging
Nicole M. Smith,†*ab Diwei Ho,†b Alaa M. Munshi,b Michael J. House,c
Sarah A. Dunlop,a Melinda Fitzgeralda and K. Swaminathan Iyerb
Lanthanide-doped upconversion nanoparticles are promising dual mode near-infrared (NIR) and magnetic
resonance imaging (MRI) bioimaging agents. In this communication we report the utility of NaGdF4:Yb,Er
nanoparticles with a functional poly(glycidyl methacrylate) (PGMA) coating, as a biocompatible multimodal
formulation for neuronal cell imaging.
IntroductionHigh resolution fluorescence imaging has been a tool of enormousimportance, increasing understanding of localization of proteins,the nature of cellular processes, and gene expression in live cells.1
Conventional fluorescence imaging probes commonly rely on lowwavelength including ultraviolet (UV) light as the excitation source.However, they suffer drawbacks from auto-fluorescence andscattering by various biological molecules. Importantly, prolongedexposure of the biological samples to UV radiation can causesample photodamage and mutation.2 This can be overcomeusing near-infrared (NIR) fluorescence imaging which permitshigh signal-to-noise ratio and deep tissue penetration.2,3 However,commonly used NIR chromophores suffer from poor photostabilityand biocompatability.2,3 Furthermore, these fluorescent probeshave broad emission spectra unsuitable for multiplex biolabeling.2
These drawbacks have prompted research in the development andapplication of lanthanide-doped upconversion (UC) nanoparticlesthat rely on their unusual non-linear optical properties to converttwo or more low-energy pump photons to a higher-energy outputphoton.4–13 Consequently, these UC nanoparticles exhibit anti-Stokes emission upon low levels of irradiation in the NIRspectral region, where biological molecules are optically trans-parent. Importantly, UC nanoparticles show a sharp emissionbandwidth, long lifetime, tunable emission and very high photo-stability.11–12 Additionally, the unusual magnetic and optical
properties associated with f-electrons of lanthanide elementsmake them highly suitable for the development of multimodalplatforms, which combine both magnetic and upconversionfluorescent properties in a single nanoparticle construct.14
These features can be integrated within single particles uponproper choices of particle matrix and dopants.15–22
Application of nanoparticles in neuroscience has garneredmuch attention in the recent past. Nanotechnologies haveenabled advanced imaging, development of nanoscale scaffoldsfor neural regeneration, neuroprotection, and delivery of drugsacross the blood–brain barrier.23 In this current communicationwe report the fabrication of poly(glycidyl methacrylate) (PGMA)coated magnetic/upconversion fluorescent NaGdF4:Yb,Er nano-particles and demonstrate their biocompatibility as multimodalagents using rat pheochromocytoma neural progenitor (PC12)cell lines. The developed formulation will enable tracking ofthe nanoparticles using a combination of imaging modalities;magnetic resonance imaging (MRI) due to the presence of Gd inthe nanoparticles, and NIR fluorescence microscopy by virtue ofthe upconversion capability of NaGdF4:Yb,Er. Our approach willcombine the radiation-free, whole-body, deep tissue imagingability of MRI with the sensitivity of fluorescence detection.Importantly, the PGMA polymer contains epoxide groups whichenable anchoring of a range of functional moieties by means ofa simple epoxide ring-opening reaction to tailor the surfaceproperties. This ease of tunability of surface is an importantfeature which allows tethering of a range of biological moietieslike antibodies, peptides and proteins to enable medical translationof the imaging agent. Importantly, the major difference betweenthe use of a functional polymer like PGMA as an anchoring moietyand the traditional method of direct functionalisation to thesurface of a nanoparticle lies in the mobility of the epoxidefunctional groups located in the loops and tails of the core macro-molecule. The mobility of the reactive loops of PGMA ensures
a Experimental and Regenerative Neurosciences, School of Animal Biology,The University of Western Australia, 35 Stirling Hwy, Crawley WA 6009, Australia.E-mail: [email protected]
b School of Chemistry and Biochemistry, The University of Western Australia,35 Stirling Hwy, Crawley WA 6009, Australia
c School of Physics, The University of Western Australia, 35 Stirling Hwy,Crawley WA 6009, Australia
† The authors contributed equally to the work.
Received (in Montpellier, France)28th November 2015,Accepted 25th May 2016
DOI: 10.1039/c5nj03368c
www.rsc.org/njc
NJC
PAPER
Publ
ished
on
26 M
ay 2
016.
Dow
nloa
ded
by U
nive
rsity
of W
este
rn A
ustra
lia o
n 22
/02/
2017
04:
27:0
8.
View Article OnlineView Journal | View Issue
This journal is©The Royal Society of Chemistry and the Centre National de la Recherche Scientifique 2016 New J. Chem., 2016, 40, 6692--6696 | 6693
greater access to anchoring, resulting in a 2–3 fold greater graftingdensity when compared to a monolayer of epoxy groups on ananoparticle surface of similar dimension.24 Most importantlyPGMA nanoformulations have been previously demonstrated todeliver drugs (small molecules, peptides, nucleic acids) and crossthe blood brain barrier with minimal toxicity.24–28 This makes thepolymer an ideal choice for the development of UC-polymeric drugdelivery vehicles for applications in the central nervous system.
ExperimentalNanoparticle synthesis and characterisation
The Yb/Er-doped NaGdF4 nanocrystals were prepared according toa previously reported method.16 Briefly, GdCl3!6H2O (0.80 mmol),YbCl3!6H2O (0.18 mmol) and ErCl3!6H2O (0.02 mmol) were mixedwith oleic acid (14 ml) and 1-octadecene (16 ml) and heated withstirring to 150 1C under nitrogen to form a homogeneous solution.The solution was then cooled to 50 1C, methanol (10 ml) containingNaOH (2.5 mmol) and NH4F (4 mmol) was slowly introduced andthe resulting reaction mixture was then kept under stirring at 50 1Cfor 30 min. Subsequently, methanol in the system was removed byheating at 100 1C for 10 min under vacuum followed by heating at300 1C for 1 hour. The reaction mixture was then cooled to roomtemperature and the resultant nanoparticles were precipitated withethanol, purified by several cycles of washing/centrifugation withethanol and finally re-dispersed in THF.
PGMA-UC nanoparticles were prepared using a nonspontaneousemulsification route. The organic phase was prepared by dispersingthe UC nanoparticles (20 mg) and dissolving PGMA (Mw =250 000 g mol"1, 75 mg) in a 1 : 1 : 2 mixture of CHCl3 : THF :MEK (1.5 ml : 1.5 ml : 3 ml). The organic phase was addeddropwise, with rapid stirring, to an aqueous solution of PluronicF-108 (1.25% w/v, 30 ml) and the emulsion was homogenizedwith a probe-type ultrasonicator at low power for 1 min. Theorganic solvents were allowed to evaporate overnight under aslow flow of N2(g). Centrifugation at 3000g for 45 min removedlarge aggregates and excess polymer. The supernatant wasdecanted into a 50 ml flask containing polyethyleneimine (PEI)(Mw 1300 g mol"1, 50% wt solution, 100 mg) and heated to 80 1Cfor 18 h. The nanoparticles were purified by multiple washeswith water. The resulting concentrated particle suspension wasaliquoted (ca. 10 # 500 ml) and stored at 4 1C for quantificationby lyophilization, analysis, and subsequent use. Nanosphereswere sterilized by UV irradiation prior to cell-culture. Dynamiclight scattering (DLS) measurements of size and zeta potential ofnanoparticle preparations were performed on a Malvern Zetasizerinstrument. Samples prepared for transmission electron micro-scopy (TEM) analysis were deposited onto carbon-coated grids andimaged at 120 kV on a JEOL JEM-2100 and selected area electrondiffraction patterns of the UC nanoparticles were obtained usingthe JEOL 3000F at 300 kV. Upconverting nanoparticles wereanalysed by drying solutions (100 mg ml"1) of nanoparticles ontoglass slides and measuring their upconversion spectra using acustom optical setup. Approximately 500 mg of nanoparticles wereadded to each slide. The 975 nm excitation light from a laser diode
was focused onto the nanoparticles using an objective lens with anumerical aperture (NA) of 0.4. The emitted upconversion fluores-cence was collected using the same objective lens and directed to aspectrometer via a dichroic beamsplitter (edge wavelength 900 nm)and a band-pass filter for blocking any returning excitationlight (transmission range: 315–710 nm). The peak wavelengthof the laser diode was 974.5 nm. The excitation power wasadjusted by altering the forward bias current supplied to thelaser diode (20–100 mA) and the temperature of the laser diodewas held at a constant value of 25 1C via the integratedthermoelectric cooler. Proton relaxometry measurements wereperformed on dilute aqueous suspensions of nanoparticles,using a Bruker minispec mq60 relaxometer, with a frequencyof 60 MHz and field strength of 1.4 T. A dilution series of nano-particle solutions in water was measured to assess concentration-dependent relaxation rates of the suspensions. Gd concentrationswere determined using ICP-MS following acid digestion.
Cell culture, viability assay and confocal imaging
All tissue culture reagents were purchased from Invitrogenunless otherwise stated. Rat pheochromocytoma (PC12) cellswere cultured in poly-(L-lysine)-coated (1 mg ml"1) polystyreneflasks in a humidified atmosphere containing 5% CO2 at 37 1C, andmaintained in RPMI1640 medium supplemented with horse serum(10% v/v), fetal bovine serum (5% v/v), L-glutamine (2 mM),penicillin–streptomycin (100 U ml"1, 100 mg ml"1), non-essentialamino acids (100 mM) and sodium pyruvate (1 mM).
All well plates were coated with a poly-L-lysine solution forone hour, and rinsed thoroughly with PBS before plating. Cellswere seeded at densities of 1 # 105 cells ml"1 in 96 well platesfor the 72 hour assay. The following day, the medium wasremoved and replaced with UV-sterilised medium containingnanospheres at concentrations of 0 mg ml"1, 0.1 mg ml"1, 1 mg ml"1,10 mg ml"1, 100 mg ml"1 and 250 mg ml"1, respectively (5 replicatewells per concentration). The toxicity of the synthesised nano-particles was assessed using a live-dead fluorescence assay, utilising1 mM calcein-AM (green, live cells) and 2 mM ethidium homodimer(red, dead cells) dissolved in PBS to stain the cells (Invitrogen).Viability was quantified by counting all viable cells in four fields ofview per well. Fields of view were randomly assigned and consistentfor all culture wells. An Olympus IX51 inverted fluorescencemicroscope was used for cell viability assessments. For statis-tical analyses on cell counts for all nanoparticle concentrations,one-way analysis of variance (ANOVA) tests and Bonferroni posthoc test for comparison of means were performed to determinestatistically significant concentration-dependent effects ofnanoparticles on cellular viability.
Samples for confocal microscopy were prepared by seedingcells onto glass cover slips, and exposing the cells to 250 mg ml"1
nanoparticle solutions in full growth media. After 24 hours, cellswere fixed with 4% paraformaldehyde in 0.1 M PBS pH 7.2,stained with Hoechst 33342 nuclear dye (Invitrogen) andmounted onto glass slides for confocal imaging. Confocal micro-scopy was performed using an inverted Leica TCS SP2 confocalmicroscope. The excitation source was a wavelength-tuneableTi:Sapphire laser which can be operated both in pulsed and in
Paper NJC
Publ
ished
on
26 M
ay 2
016.
Dow
nloa
ded
by U
nive
rsity
of W
este
rn A
ustra
lia o
n 22
/02/
2017
04:
27:0
8.
View Article Online
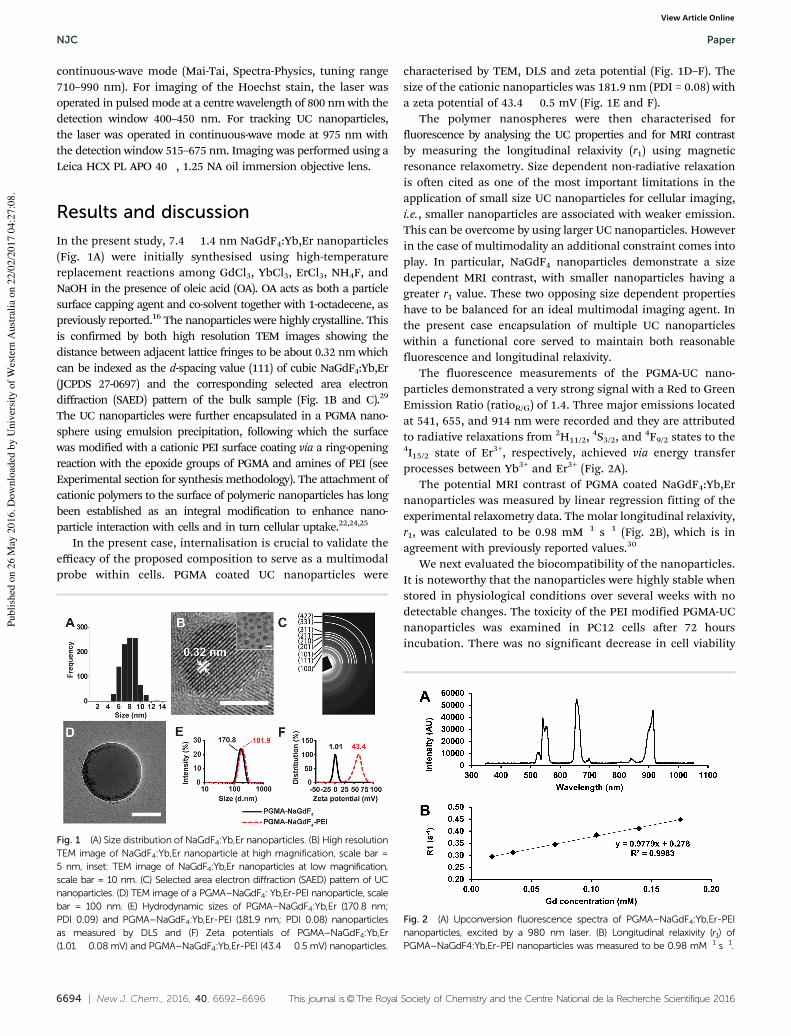
6694 | New J. Chem., 2016, 40, 6692--6696 This journal is©The Royal Society of Chemistry and the Centre National de la Recherche Scientifique 2016
continuous-wave mode (Mai-Tai, Spectra-Physics, tuning range710–990 nm). For imaging of the Hoechst stain, the laser wasoperated in pulsed mode at a centre wavelength of 800 nm with thedetection window 400–450 nm. For tracking UC nanoparticles,the laser was operated in continuous-wave mode at 975 nm withthe detection window 515–675 nm. Imaging was performed using aLeica HCX PL APO 40#, 1.25 NA oil immersion objective lens.
Results and discussionIn the present study, 7.4 $ 1.4 nm NaGdF4:Yb,Er nanoparticles(Fig. 1A) were initially synthesised using high-temperaturereplacement reactions among GdCl3, YbCl3, ErCl3, NH4F, andNaOH in the presence of oleic acid (OA). OA acts as both a particlesurface capping agent and co-solvent together with 1-octadecene, aspreviously reported.16 The nanoparticles were highly crystalline. Thisis confirmed by both high resolution TEM images showing thedistance between adjacent lattice fringes to be about 0.32 nm whichcan be indexed as the d-spacing value (111) of cubic NaGdF4:Yb,Er(JCPDS 27-0697) and the corresponding selected area electrondiffraction (SAED) pattern of the bulk sample (Fig. 1B and C).29
The UC nanoparticles were further encapsulated in a PGMA nano-sphere using emulsion precipitation, following which the surfacewas modified with a cationic PEI surface coating via a ring-openingreaction with the epoxide groups of PGMA and amines of PEI (seeExperimental section for synthesis methodology). The attachment ofcationic polymers to the surface of polymeric nanoparticles has longbeen established as an integral modification to enhance nano-particle interaction with cells and in turn cellular uptake.22,24,25
In the present case, internalisation is crucial to validate theefficacy of the proposed composition to serve as a multimodalprobe within cells. PGMA coated UC nanoparticles were
characterised by TEM, DLS and zeta potential (Fig. 1D–F). Thesize of the cationic nanoparticles was 181.9 nm (PDI = 0.08) witha zeta potential of 43.4 $ 0.5 mV (Fig. 1E and F).
The polymer nanospheres were then characterised forfluorescence by analysing the UC properties and for MRI contrastby measuring the longitudinal relaxivity (r1) using magneticresonance relaxometry. Size dependent non-radiative relaxationis often cited as one of the most important limitations in theapplication of small size UC nanoparticles for cellular imaging,i.e., smaller nanoparticles are associated with weaker emission.This can be overcome by using larger UC nanoparticles. Howeverin the case of multimodality an additional constraint comes intoplay. In particular, NaGdF4 nanoparticles demonstrate a sizedependent MRI contrast, with smaller nanoparticles having agreater r1 value. These two opposing size dependent propertieshave to be balanced for an ideal multimodal imaging agent. Inthe present case encapsulation of multiple UC nanoparticleswithin a functional core served to maintain both reasonablefluorescence and longitudinal relaxivity.
The fluorescence measurements of the PGMA-UC nano-particles demonstrated a very strong signal with a Red to GreenEmission Ratio (ratioR/G) of 1.4. Three major emissions locatedat 541, 655, and 914 nm were recorded and they are attributedto radiative relaxations from 2H11/2, 4S3/2, and 4F9/2 states to the4I15/2 state of Er3+, respectively, achieved via energy transferprocesses between Yb3+ and Er3+ (Fig. 2A).
The potential MRI contrast of PGMA coated NaGdF4:Yb,Ernanoparticles was measured by linear regression fitting of theexperimental relaxometry data. The molar longitudinal relaxivity,r1, was calculated to be 0.98 mM"1 s"1 (Fig. 2B), which is inagreement with previously reported values.30
We next evaluated the biocompatibility of the nanoparticles.It is noteworthy that the nanoparticles were highly stable whenstored in physiological conditions over several weeks with nodetectable changes. The toxicity of the PEI modified PGMA-UCnanoparticles was examined in PC12 cells after 72 hoursincubation. There was no significant decrease in cell viability
Fig. 1 (A) Size distribution of NaGdF4:Yb,Er nanoparticles. (B) High resolutionTEM image of NaGdF4:Yb,Er nanoparticle at high magnification, scale bar =5 nm, inset: TEM image of NaGdF4:Yb,Er nanoparticles at low magnification,scale bar = 10 nm. (C) Selected area electron diffraction (SAED) pattern of UCnanoparticles. (D) TEM image of a PGMA–NaGdF4: Yb,Er-PEI nanoparticle, scalebar = 100 nm. (E) Hydrodynamic sizes of PGMA–NaGdF4:Yb,Er (170.8 nm;PDI 0.09) and PGMA–NaGdF4:Yb,Er-PEI (181.9 nm; PDI 0.08) nanoparticlesas measured by DLS and (F) Zeta potentials of PGMA–NaGdF4:Yb,Er(1.01 $ 0.08 mV) and PGMA–NaGdF4:Yb,Er-PEI (43.4 $ 0.5 mV) nanoparticles.
Fig. 2 (A) Upconversion fluorescence spectra of PGMA–NaGdF4:Yb,Er-PEInanoparticles, excited by a 980 nm laser. (B) Longitudinal relaxivity (r1) ofPGMA–NaGdF4:Yb,Er-PEI nanoparticles was measured to be 0.98 mM"1 s"1.
NJC Paper
Publ
ished
on
26 M
ay 2
016.
Dow
nloa
ded
by U
nive
rsity
of W
este
rn A
ustra
lia o
n 22
/02/
2017
04:
27:0
8.
View Article Online
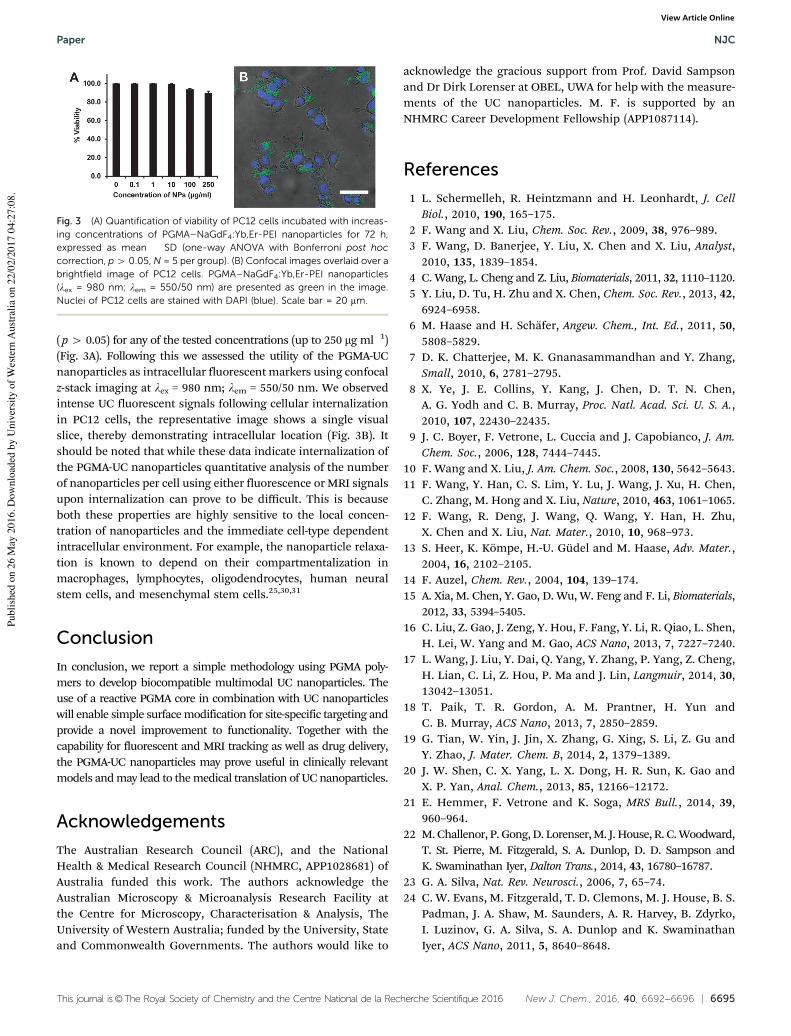
This journal is©The Royal Society of Chemistry and the Centre National de la Recherche Scientifique 2016 New J. Chem., 2016, 40, 6692--6696 | 6695
( p 4 0.05) for any of the tested concentrations (up to 250 mg ml"1)(Fig. 3A). Following this we assessed the utility of the PGMA-UCnanoparticles as intracellular fluorescent markers using confocalz-stack imaging at lex = 980 nm; lem = 550/50 nm. We observedintense UC fluorescent signals following cellular internalizationin PC12 cells, the representative image shows a single visualslice, thereby demonstrating intracellular location (Fig. 3B). Itshould be noted that while these data indicate internalization ofthe PGMA-UC nanoparticles quantitative analysis of the numberof nanoparticles per cell using either fluorescence or MRI signalsupon internalization can prove to be difficult. This is becauseboth these properties are highly sensitive to the local concen-tration of nanoparticles and the immediate cell-type dependentintracellular environment. For example, the nanoparticle relaxa-tion is known to depend on their compartmentalization inmacrophages, lymphocytes, oligodendrocytes, human neuralstem cells, and mesenchymal stem cells.25,30,31
ConclusionIn conclusion, we report a simple methodology using PGMA poly-mers to develop biocompatible multimodal UC nanoparticles. Theuse of a reactive PGMA core in combination with UC nanoparticleswill enable simple surface modification for site-specific targeting andprovide a novel improvement to functionality. Together with thecapability for fluorescent and MRI tracking as well as drug delivery,the PGMA-UC nanoparticles may prove useful in clinically relevantmodels and may lead to the medical translation of UC nanoparticles.
AcknowledgementsThe Australian Research Council (ARC), and the NationalHealth & Medical Research Council (NHMRC, APP1028681) ofAustralia funded this work. The authors acknowledge theAustralian Microscopy & Microanalysis Research Facility atthe Centre for Microscopy, Characterisation & Analysis, TheUniversity of Western Australia; funded by the University, Stateand Commonwealth Governments. The authors would like to
acknowledge the gracious support from Prof. David Sampsonand Dr Dirk Lorenser at OBEL, UWA for help with the measure-ments of the UC nanoparticles. M. F. is supported by anNHMRC Career Development Fellowship (APP1087114).
References1 L. Schermelleh, R. Heintzmann and H. Leonhardt, J. Cell
Biol., 2010, 190, 165–175.2 F. Wang and X. Liu, Chem. Soc. Rev., 2009, 38, 976–989.3 F. Wang, D. Banerjee, Y. Liu, X. Chen and X. Liu, Analyst,
2010, 135, 1839–1854.4 C. Wang, L. Cheng and Z. Liu, Biomaterials, 2011, 32, 1110–1120.5 Y. Liu, D. Tu, H. Zhu and X. Chen, Chem. Soc. Rev., 2013, 42,
6924–6958.6 M. Haase and H. Schafer, Angew. Chem., Int. Ed., 2011, 50,
5808–5829.7 D. K. Chatterjee, M. K. Gnanasammandhan and Y. Zhang,
Small, 2010, 6, 2781–2795.8 X. Ye, J. E. Collins, Y. Kang, J. Chen, D. T. N. Chen,
A. G. Yodh and C. B. Murray, Proc. Natl. Acad. Sci. U. S. A.,2010, 107, 22430–22435.
9 J. C. Boyer, F. Vetrone, L. Cuccia and J. Capobianco, J. Am.Chem. Soc., 2006, 128, 7444–7445.
10 F. Wang and X. Liu, J. Am. Chem. Soc., 2008, 130, 5642–5643.11 F. Wang, Y. Han, C. S. Lim, Y. Lu, J. Wang, J. Xu, H. Chen,
C. Zhang, M. Hong and X. Liu, Nature, 2010, 463, 1061–1065.12 F. Wang, R. Deng, J. Wang, Q. Wang, Y. Han, H. Zhu,
X. Chen and X. Liu, Nat. Mater., 2010, 10, 968–973.13 S. Heer, K. Kompe, H.-U. Gudel and M. Haase, Adv. Mater.,
2004, 16, 2102–2105.14 F. Auzel, Chem. Rev., 2004, 104, 139–174.15 A. Xia, M. Chen, Y. Gao, D. Wu, W. Feng and F. Li, Biomaterials,
2012, 33, 5394–5405.16 C. Liu, Z. Gao, J. Zeng, Y. Hou, F. Fang, Y. Li, R. Qiao, L. Shen,
H. Lei, W. Yang and M. Gao, ACS Nano, 2013, 7, 7227–7240.17 L. Wang, J. Liu, Y. Dai, Q. Yang, Y. Zhang, P. Yang, Z. Cheng,
H. Lian, C. Li, Z. Hou, P. Ma and J. Lin, Langmuir, 2014, 30,13042–13051.
18 T. Paik, T. R. Gordon, A. M. Prantner, H. Yun andC. B. Murray, ACS Nano, 2013, 7, 2850–2859.
19 G. Tian, W. Yin, J. Jin, X. Zhang, G. Xing, S. Li, Z. Gu andY. Zhao, J. Mater. Chem. B, 2014, 2, 1379–1389.
20 J. W. Shen, C. X. Yang, L. X. Dong, H. R. Sun, K. Gao andX. P. Yan, Anal. Chem., 2013, 85, 12166–12172.
21 E. Hemmer, F. Vetrone and K. Soga, MRS Bull., 2014, 39,960–964.
22 M. Challenor, P. Gong, D. Lorenser, M. J. House, R. C. Woodward,T. St. Pierre, M. Fitzgerald, S. A. Dunlop, D. D. Sampson andK. Swaminathan Iyer, Dalton Trans., 2014, 43, 16780–16787.
23 G. A. Silva, Nat. Rev. Neurosci., 2006, 7, 65–74.24 C. W. Evans, M. Fitzgerald, T. D. Clemons, M. J. House, B. S.
Padman, J. A. Shaw, M. Saunders, A. R. Harvey, B. Zdyrko,I. Luzinov, G. A. Silva, S. A. Dunlop and K. SwaminathanIyer, ACS Nano, 2011, 5, 8640–8648.
Fig. 3 (A) Quantification of viability of PC12 cells incubated with increas-ing concentrations of PGMA–NaGdF4:Yb,Er-PEI nanoparticles for 72 h,expressed as mean $ SD (one-way ANOVA with Bonferroni post hoccorrection, p 4 0.05, N = 5 per group). (B) Confocal images overlaid over abrightfield image of PC12 cells. PGMA–NaGdF4:Yb,Er-PEI nanoparticles(lex = 980 nm; lem = 550/50 nm) are presented as green in the image.Nuclei of PC12 cells are stained with DAPI (blue). Scale bar = 20 mm.
Paper NJC
Publ
ished
on
26 M
ay 2
016.
Dow
nloa
ded
by U
nive
rsity
of W
este
rn A
ustra
lia o
n 22
/02/
2017
04:
27:0
8.
View Article Online
6696 | New J. Chem., 2016, 40, 6692--6696 This journal is©The Royal Society of Chemistry and the Centre National de la Recherche Scientifique 2016
25 C. W. Evans, H. M. Viola, D. Ho, L. C. Hool, S. A. Dunlop,M. Fitzgerald and K. Swaminathan Iyer, RSC Adv., 2012, 2,8587–8590.
26 J. Harrison, C. A. Bartlett, G. Cowin, P. K. Nicholls, C. W.Evans, T. D. Clemons, B. Zdyrko, I. A. luzinov, A. R. Harvey,K. Swaminathan Iyer, S. A. Dunlop and M. Fitzgerald, Small,2012, 8, 1579–1589.
27 I. Lozic, R. V. Hartz, C. A. Bartlett, J. A. Shaw, M. Archer,P. S. R. Naidu, N. M. Smith, S. A. Dunlop, K. Swaminatha Iyer,M. R. Kilburn and M. Fitzgerald, Biomaterials, 2016, 74, 200–216.
28 N. M. Smith, I. Gachulincova, D. Ho, C. Bailey, C. A. Bartlett,M. Norret, J. Murphy, A. Buckley, P. J. Rigby, M. J. House, T. St.Pierre, M. Fitzgerald, K. Swaminathan Iyer and S. A. Dunlop,Sci. Rep., 2016, 6, 22595, DOI: 10.1038/srep22595.
29 J. C. Boyer, J. Gagnon, L. A. Cuccia and J. A. Capobianco,Chem. Mater., 2007, 19, 3358–3360.
30 N. J. J. Johnson, W. Oakden, G. J. Stanisz, R. S. Prosser andF. C. J. M. van Veggel, Chem. Mater., 2011, 23, 3714–3722.
31 C. Billotey, C. Wilhelm, M. Devaud, J. C. Bacri, J. Bittounand F. Gazeau, Magn. Reson. Med., 2003, 49, 646–654.
NJC Paper
Publ
ished
on
26 M
ay 2
016.
Dow
nloa
ded
by U
nive
rsity
of W
este
rn A
ustra
lia o
n 22
/02/
2017
04:
27:0
8.
View Article Online


![Some fundamental and applicative properties of [polymer/nano-SiC] hybrid nanocomposites](https://static.cupdf.com/doc/110x72/6344f9c6596bdb97a908b67e/some-fundamental-and-applicative-properties-of-polymernano-sic-hybrid-nanocomposites.jpg)
