Nonstandard work arrangements,
employment regulation and
inequalities
Agnieszka Piasna
ETUI
IBS Jobs Conference
Warsaw, 28 October 2015
Agnieszka Piasna © etui (2015)

Outline
1. Changes in the nature of employment relations
2. Impact on labour market and workers
1. Labour market inequality associated with the use of nonstandard work
arrangements
2. Job creation and labour market volatility
3. Role of employment regulation
1. EU policy responses
2. Regulation and inclusive labour markets
3. What direction for the future
Agnieszka Piasna © etui (2015)

1. Changes in the nature of employment
Agnieszka Piasna © etui (2015)

Overview of trends in non-standard employment
Agnieszka Piasna © etui (2015)
• In 2008(q2) -- 14.2% of EU28 employees worked on temporary contracts.
• In 2013 -- a decline to 13.7%, corresponding to a net loss of nearly 1.7 million temporary jobs;
driven mainly by huge job losses among temporary workers in countries hardest hit by the crisis
and characterised by a high share of temporary employment (e.g. Spain, Portugal, Greece).
• The majority of the EU member states recorded an increase in the number of temporary jobs
between 2008 and 2014.

No recovery for permanent employment
Agnieszka Piasna © etui (2015)
Permanent and temporary contracts in the EU New recruits per quarter, in thousands.
Source: DG EMPL

Standard employment offered only in well-paid jobs
Agnieszka Piasna © etui (2015)
Employment shifts By job-wage quintile, and temporary and permanent status, in thousands.
Q2 2011 – Q2 2014
Source: European Jobs Monitor 2015
Permanent but part-time
Permanent full-time
Permanent employees
have been replaced by
non-standard or atypical
workers, especially in
low-paid but also in
mid-paid jobs.
The traditional SER is
increasingly the privilege
of those in well-paid jobs.
-- European Jobs Monitor
2015
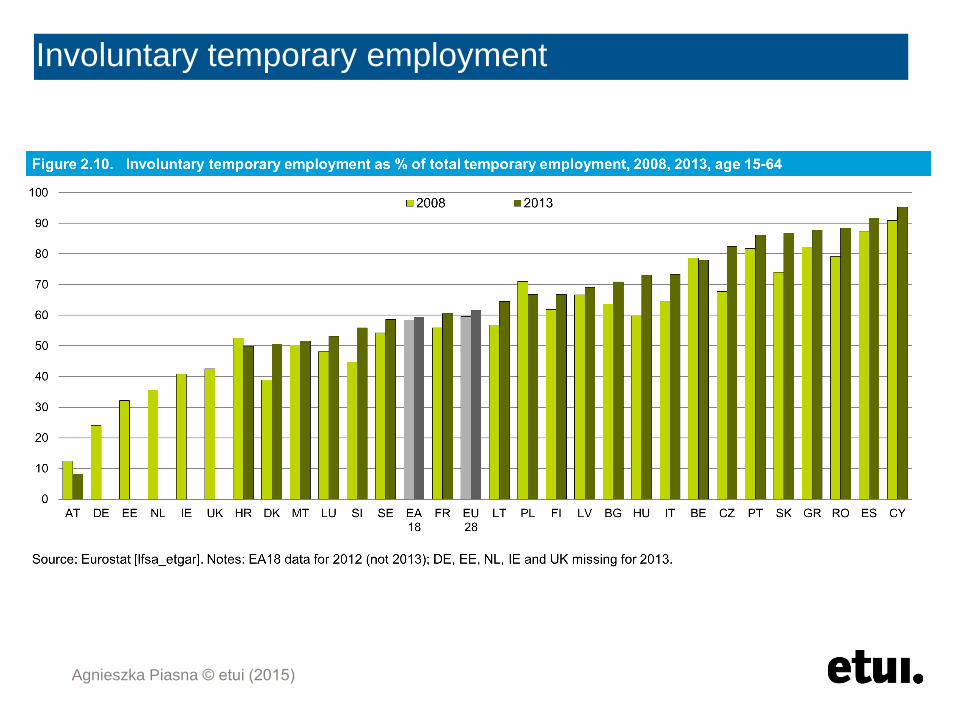
Involuntary temporary employment
Agnieszka Piasna © etui (2015)

2. Impact on labour market and workers
Agnieszka Piasna © etui (2015)

In-work risk of poverty, EU28
Agnieszka Piasna © etui (2015)
0
5
10
15
20
25
permanent temporary part-time full-time employees self-employed
2010 2013 change 2010-2013, %
Source: Eurostat (EU-SILC)
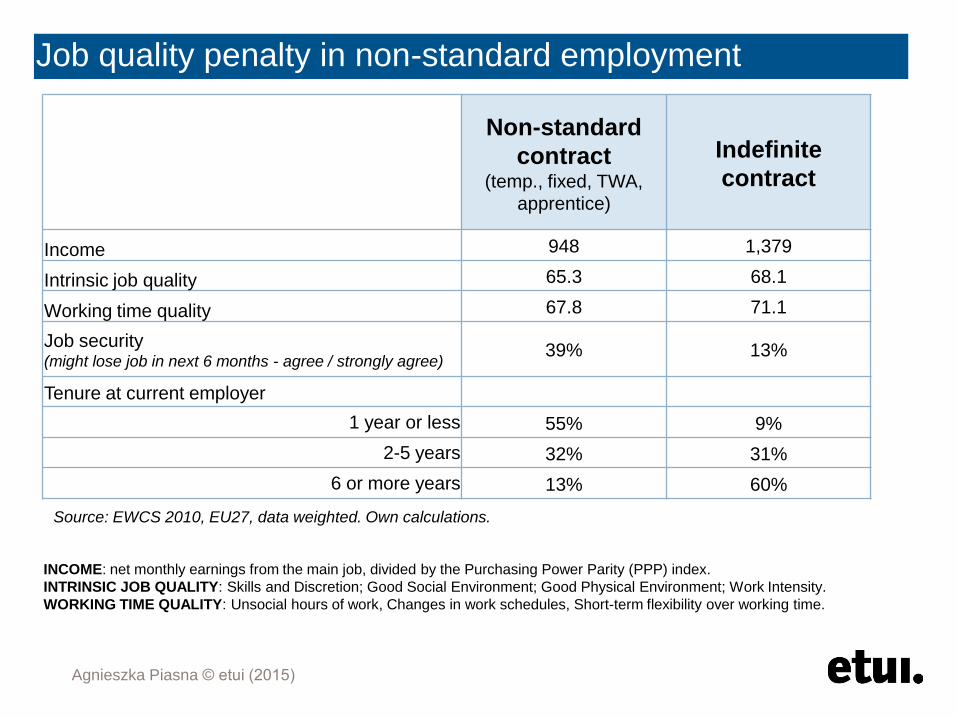
Job quality penalty in non-standard employment
Source: EWCS 2010, EU27, data weighted. Own calculations.
Agnieszka Piasna © etui (2015)
INCOME: net monthly earnings from the main job, divided by the Purchasing Power Parity (PPP) index.
INTRINSIC JOB QUALITY: Skills and Discretion; Good Social Environment; Good Physical Environment; Work Intensity.
WORKING TIME QUALITY: Unsocial hours of work, Changes in work schedules, Short-term flexibility over working time.
Non-standard
contract (temp., fixed, TWA,
apprentice)
Indefinite
contract
Income 948 1,379
Intrinsic job quality 65.3 68.1
Working time quality 67.8 71.1
Job security (might lose job in next 6 months - agree / strongly agree)
39% 13%
Tenure at current employer
1 year or less 55% 9%
2-5 years 32% 31%
6 or more years 13% 60%

Job quality penalty in non-standard employment
Agnieszka Piasna © etui (2015)
Regression results, estimates for non-standard contract (reference:
permanent contract), nested models. All p-values < 0.001
N = 35,372
Source: EWCS 2010, EU27.
• Persistent job quality penalty associated with nonstandard employment.
• Strong compositional effects suggest concentration of ‘bad jobs’ in certain segments of the
labour force (vulnerable workers) and labour market (sectors and occupations).
-400 -300 -200 -100 0
Main effect
countries
gender, education, age
occupation, sector
weekly working hours
With
con
trol
s
Income
-3 -2 -1 0
Intrinsic job quality
-3 -2 -1 0
Working time quality

Cross-country differences
Agnieszka Piasna © etui (2015)
*** p ≤ 0.001; ** p ≤ 0.01; * p ≤ 0.05
DE FR ES IT CZ HU PL SE UK
Income
baseline model -572 *** -437 *** -397 *** -396 *** -210 *** -194 *** -190 *** -501 *** -202
with controls -274 *** -225 *** -144 ** -256 *** -61 -95 ** -91 ** -242 ** -66
Intrinsic job
quality
baseline model -4.2 *** -3.1 *** -4.9 *** -1.2 -3.0 * -1.6 -3.2 *** .2 -1.4
with controls -4.8 *** -2.0 ** -2.8 ** -1.6 -2.7 * -1.4 -1.3 1.3 -1.2
Working time
quality
baseline model -2.7 * -2.3 * -8.5 *** -4.1 ** -0.7 1.7 -0.7 1.1 -1.5
with controls -2.3 * -1.0 -6.5 *** -2.9 * 0.0 -0.2 1.1 2.6 -1.7
Job quality penalty in non-standard employment, compared to permanent contracts.

Cross-country differences
Agnieszka Piasna © etui (2015)
-400
-300
-200
-100
0
100
Nordic Continental Anglo-Saxon Mediterranean Central and eastern
Income
Reference
-4
-3
-2
-1
0
1
2
Nordic Continental Anglo-Saxon Mediterranean Central and eastern
Intrinsic job quality
Reference
-6
-4
-2
0
2
Nordic Continental Anglo-Saxon Mediterranean Central and eastern
Working time quality
Reference Regression results. All control variables
included. Estimates and 95% confidence
intervals for interaction term: country cluster
and non-standard contract. Central and eastern
Europe and permanent contract is reference.
*** p ≤ 0.001

Volatility of non-standard employment
Source: Eurostat, ELFS. EU27, in ‘000s.
Permanent jobs
Agnieszka Piasna © etui (2015)
Temporary jobs
0
20 000
40 000
60 000
80 000
100 000
120 000
140 000
160 000
2008 2009 2010 2011 2012
Total number of temporary jobs
Temporary hirings per year (jobs created/vacated)
0
20 000
40 000
60 000
80 000
100 000
120 000
140 000
160 000
2008 2009 2010 2011 2012
Total number of permanent jobs
Permanent hirings per year (jobs created/vacated)
Hiring rates by type of contract EU27, 2008-2012
• In the EU27 (excl. France) in 2012, 58% of all hiring was through temporary contracts, while in
Spain and Poland nearly 90%.
• Despite most hiring through temporary contracts, their share declined.
• Compared against changes in the volume of jobs, the hiring rates seem to reflect high turnover
rates and high volatility of nonstandard employment, rather than any genuine employment
growth.

Prospects: out of temporary employment
Source: Eurostat
Agnieszka Piasna © etui (2015)
0%
20%
40%
60%
80%
100%
Employees with a permanent job
Employees with a temporary job
Transitions from the previous year situation
EU 28, 2012
Permanent job
Temporary job
Employed person except employee
Unemployment or inactivity
60
70
80
90
100
0 10 20 30 40 50 60 70 80
Emp
loye
es w
ith
a p
erm
anen
t jo
b
Employees with a temporary job
Transition rate to employee with a permanent job, t+1
By country and temporary empl. rate, 2013
Source: Eurostat

3. Role of employment regulation
Agnieszka Piasna © etui (2015)

Current EU employment policy direction
Agnieszka Piasna © etui (2015)
● Fostering employment (‘more jobs’) is the policy priority. Job creation through ‘structural
reforms’ (cf Annual Growth Survey, new IG 2015).
● Narrow definition of ‘structural reforms’ : deregulation of labour markets. Emphasis on
means to, among others, increase flexibility (defined as ease of dismissal/recruitment, in
practice largely focused on the former).
● Labour market rigidities -- at the root of unemployment in Europe and causes of labour
market segmentation.
● “In some Member States employment protection legislation creates labour market
rigidity, and prevents increased participation in the labour market. Such employment
protection legislation should be reformed to reduce over-protection of workers with
permanent contracts, and provide protection to those left outside or at the margins of the
job market.” (European Commission AGS, 2011)
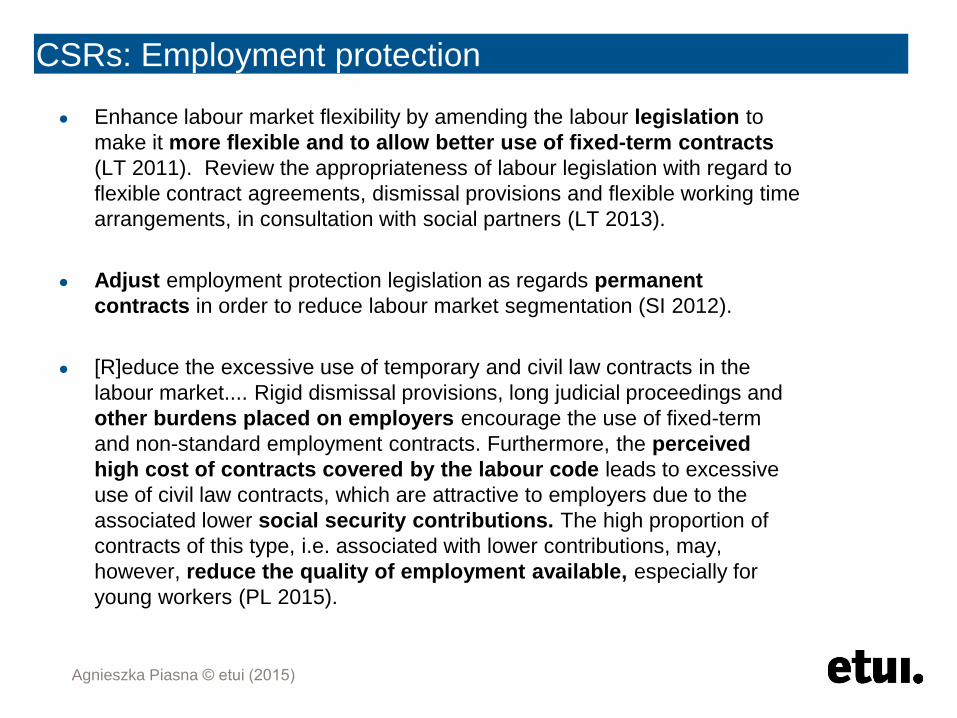
CSRs: Employment protection
● Enhance labour market flexibility by amending the labour legislation to
make it more flexible and to allow better use of fixed-term contracts
(LT 2011). Review the appropriateness of labour legislation with regard to
flexible contract agreements, dismissal provisions and flexible working time
arrangements, in consultation with social partners (LT 2013).
● Adjust employment protection legislation as regards permanent
contracts in order to reduce labour market segmentation (SI 2012).
● [R]educe the excessive use of temporary and civil law contracts in the
labour market.... Rigid dismissal provisions, long judicial proceedings and
other burdens placed on employers encourage the use of fixed-term
and non-standard employment contracts. Furthermore, the perceived
high cost of contracts covered by the labour code leads to excessive
use of civil law contracts, which are attractive to employers due to the
associated lower social security contributions. The high proportion of
contracts of this type, i.e. associated with lower contributions, may,
however, reduce the quality of employment available, especially for
young workers (PL 2015).
Agnieszka Piasna © etui (2015)

Labour market reforms
Distribution of employment protection (EPL) reforms By country groups and years, average per country.
Agnieszka Piasna © etui (2015)
Source: LABREF database, own calculations.
-20
-15
-10
-5
0
5
10
15
Anglo-S. Central and eastern Continental Nordic South
2000-2008 Increasing 2000-2008 Decreasing
2009-2013 Increasing 2009-2013 Decreasing

EP reforms: impact on employment in Spain
Source: Eurostat and OECD. Agnieszka Piasna © etui (2015)
-4
-3
-2
-1
0
1
2
3
4
-1 000
-800
-600
-400
-200
0
200
400
600
800
1 000
2006 2007 2008 2009 2010 2011 2012 2013 2014
Permanent employees Temporary employees
EPL reg (individual and collective) EPL temp
GDP, % chng
• Reforms expected to increase share of permanent contracts Declining share of temporary workers -- But not due to more
people being given permanent contracts, as no reduction in the issuing of temporary contracts following the reforms.
Rather, most of the dismissals were among temporary workers.
• After reforms a substantial increase in permanent employees being laid off -- a striking change from the previous pattern.
This could reflect greater ease of dismissal, or simply the reduced scope for dismissing temporary employees after so many
had already lost their jobs.

Consequences of de-regulation for non-standard workers
● Expected outcomes that alignment of protection across labour market
segments (so less protection for regular work), or reduced protection in
general, would bring to non-standard workers:
● No evidence this will create additional jobs or reduce unemployment, rather
substitution of temporary for permanent employment. Increase in temporary
work, with spread of negative socio-economic consequences normally
associated with nonstandard work. Having temporary contract increases risk of
unemployment or repeated spells of temporary employment. All this reinforces
segmentation.
● Conditions of regular employment (especially for more vulnerable groups)
would align with those for nonstandard employment, if stem solely from legal
provisions
● No reasons to expect employers would offer ‘good jobs’ more often to
secondary segment workers (women, low skilled, younger).
Agnieszka Piasna © etui (2015)

Challenges and direction for the future
● The rise in nonstandard employment, largely involuntary, can be expected to
have negative consequences for labour market attachment, job quality, and
career development, but also for productivity in the long run.
● The high volatility of temporary jobs points to an increasing risk of segmentation
of the labour force, with low transition rates into permanent jobs and weak
contribution to the net growth in employment.
● The findings point to the urgent need to redirect European-level policies and
strategies.
● The objective for the future -- for the revised Europe 2020 Strategy and
Integrated Employment Guidelines -- is to redefine employment
recommendations and targets so that not only the number of persons in
employment but also the quality of newly created jobs is monitored and
assessed.
Agnieszka Piasna © etui (2015)

Thank you
Agnieszka Piasna © etui (2015)