NMR Properties of Petroleum Reservoir Fluids
George J. Hirasaki, Rice University
Sho-Wei Lo, Shell International E&P Co.
Ying Zhang, Bechtel
Paper presented at the 6th International Conference on Magnetic Resonance in
Porous Media, Ulm, Germany, September 8-12, 2002.
ABSTRACT
NMR well logging of petroleum reservoir require the measurement of the
NMR response of water, oil, and gas in the pore space of rocks at elevated
temperatures and pressures. The viscosity of the oil may range from less than 1
cp to greater than 10,000 cp. Also, the oil and gas are not a single component
but rather a broad distribution of components. The log mean T1 and T2 relaxation
time of dead (gas free) crude oils are correlated with viscosity/temperature and
Larmor frequency. The relaxation time of live oils deviate from the correlation for
dead crude oils. This deviation can be correlated with the methane content of
the oil. Natural gas in the reservoir has components other than methane. Mixing
rules are developed to accommodate components such as ethane, propane,
carbon dioxide, and nitrogen.
Interpretation of NMR logs uses both relaxation and diffusion to distinguish
the different fluids present in the formation. Crude oils have a broad spectrum of
components but the relaxation time distribution and diffusion coefficient
distribution are correlated. This correlation is used to distinguish crude oil from
1
the response of water in the pores of the rock. This correlation can also be used
to estimate viscosity of the crude oil.
KEYWORDS: well logging, crude oil, natural gas, relaxation time, diffusivity
INTRODUCTION
NMR well logging has been commercially available since the early 1990s
[1,2]. More recently, NMR has been used for real-time analysis of bottom-hole
sampling of reservoir fluids [3,4]. Interpretation of these measurements require
an understanding of the relationship between NMR dependent parameters,
hydrogen index, T1 and T2 relaxation time, and diffusion coefficient with the
composition, density, pressure, temperature, and viscosity of the fluids. With this
understanding, it is possible to estimate from the well log, the formation porosity
and permeability, irreducible water saturation, saturation of water, oil, and gas,
and the oil viscosity.
RESULTS
Correlation of Relaxation Time with Viscosity/Temperature and Larmor
Frequency
The correlation of the T2 relaxation time with crude oil viscosity was
developed by Morriss et al. [5] from 31 Belridge oil samples, 35 samples from
international fields and viscosity standards. The crude oil samples had a broad
distribution of relaxation times and the correlation was based on the geometric-
mean or log-mean relaxation time, T2,LM.
2, 0.9
1200LMT
η= (1)
2
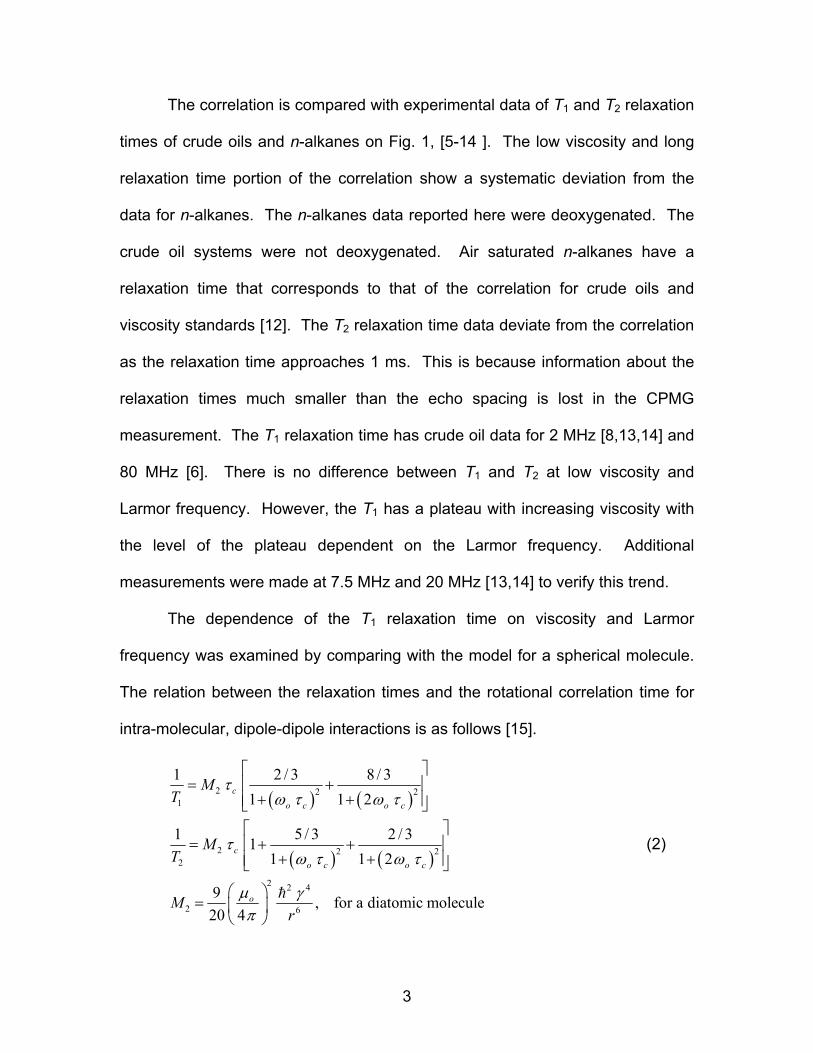
The correlation is compared with experimental data of T1 and T2 relaxation
times of crude oils and n-alkanes on Fig. 1, [5-14 ]. The low viscosity and long
relaxation time portion of the correlation show a systematic deviation from the
data for n-alkanes. The n-alkanes data reported here were deoxygenated. The
crude oil systems were not deoxygenated. Air saturated n-alkanes have a
relaxation time that corresponds to that of the correlation for crude oils and
viscosity standards [12]. The T2 relaxation time data deviate from the correlation
as the relaxation time approaches 1 ms. This is because information about the
relaxation times much smaller than the echo spacing is lost in the CPMG
measurement. The T1 relaxation time has crude oil data for 2 MHz [8,13,14] and
80 MHz [6]. There is no difference between T1 and T2 at low viscosity and
Larmor frequency. However, the T1 has a plateau with increasing viscosity with
the level of the plateau dependent on the Larmor frequency. Additional
measurements were made at 7.5 MHz and 20 MHz [13,14] to verify this trend.
The dependence of the T1 relaxation time on viscosity and Larmor
frequency was examined by comparing with the model for a spherical molecule.
The relation between the relaxation times and the rotational correlation time for
intra-molecular, dipole-dipole interactions is as follows [15].
( ) ( )
( ) ( )
2 2 21
2 2 22
2 2 4
2 6
1 2 / 3 8 / 31 1 2
1 5 / 3 2 / 311 1 2
9 , for a diatomic molecule20 4
co c o c
co c o c
o
MT
MT
Mr
τω τ ω τ
τω τ ω τ
µ γπ
= +
+ +
= + ++ +
=
(2)
3
where oω is the Larmor frequency, oµ is the magnetic permeability of free space,
is Planck's constant divided by 2π , γ is the gyromagnetic ratio for the 1H
proton, and r is the distance between the nearest protons in the molecule. Only
the nearest neighbors are considered because the coefficient, M2, is a function of
distance to the inverse sixth power.
It is helpful to express the rotational correlation time in terms of
measurable variables. This can be done by assuming that the molecule is a
sphere undergoing rotation by Brownian motion [15].
3
3
32
1 2
16
, spherical molecule84 , spherical molecule
31 1 40 , 1, spherical molecule
9
cr
r
c
o c
DkTDaak T
M aT T k T
τ
π η
π ητ
π η ω τ
=
=
=
= =
(3)
where a is the radius, η is the viscosity, k is the Boltzmann constant, and T is the
absolute temperature. The significant result here is that liquids of spherical
molecules in the fast motion limit ('motional narrowing') have T1 and T2 equal to
each other and inversely proportional to viscosity/temperature.
The dependence of the relaxation times on viscosity/temperature can be
visualized by expressing the equation for relaxation by intramolecular dipole-
dipole mechanisms in dimensionless variables.
4
21,2 1,2
34 , spherical molecule3
Do
oo c
MT T
ak T
ω
π ω ηω τ
=
= (4)
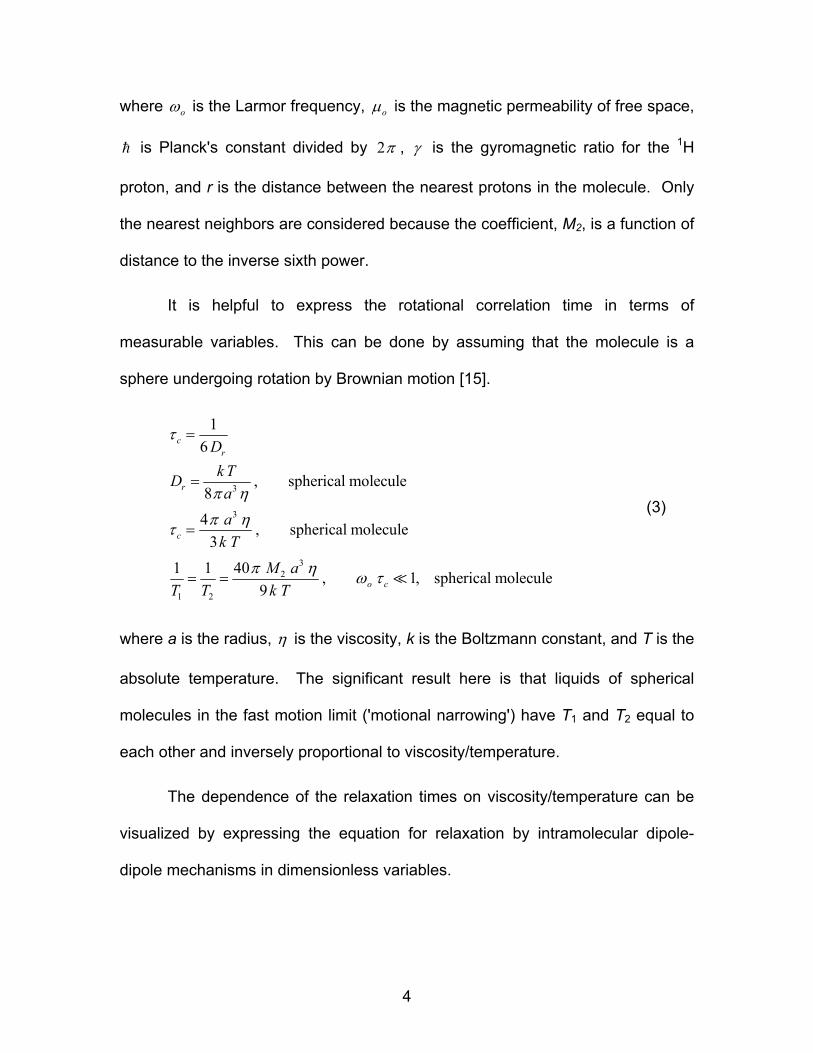
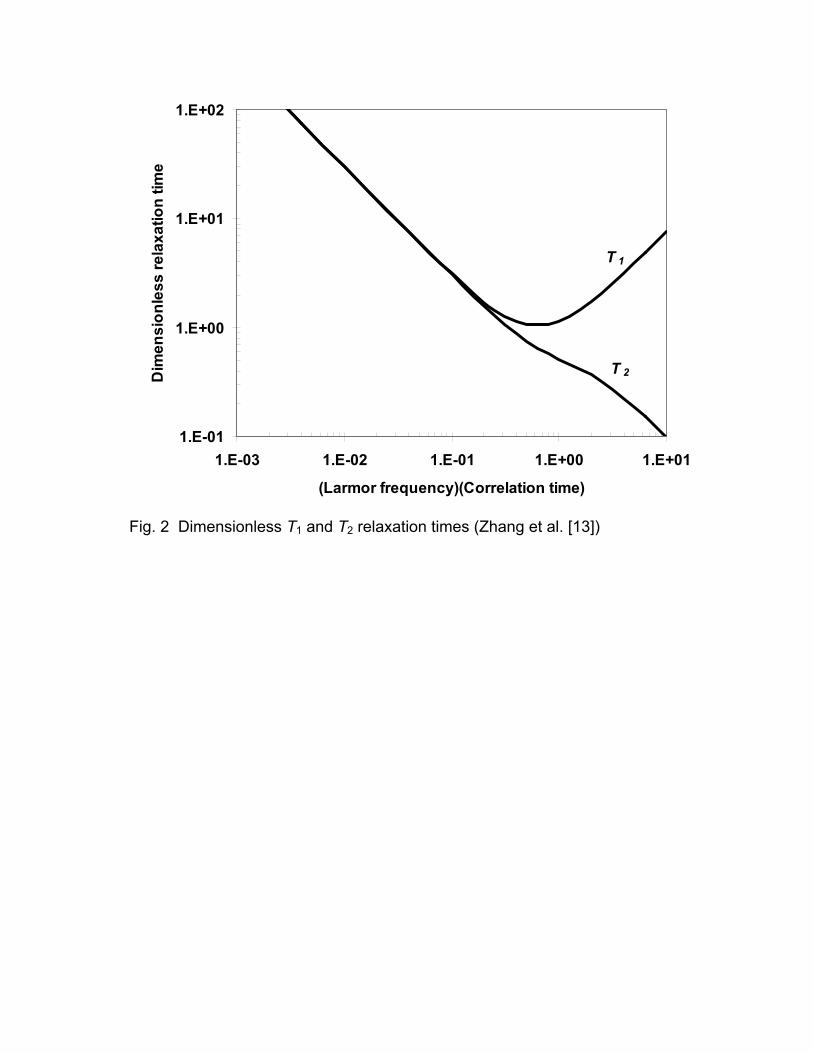
The results are shown in Fig. 2. The relaxation times, T1D and T2D are
equal to each other for short correlation times compared to the Larmor period,
e.g., for low viscosity/temperature. When the correlation time is long compared
to the Larmor period, e.g., for high viscosity fluids, T1D is larger than T2D.
The dependence of the T1 on Larmor frequency can be correlated by
normalizing the relaxation time and viscosity with the Larmor frequency in the
manner suggested by the section on intramolecular dipole-dipole interactions.
1,2N 1,20
0
N
2(MHz)
2(MHz)
T T
T T
ωωη η
=
=
(5)
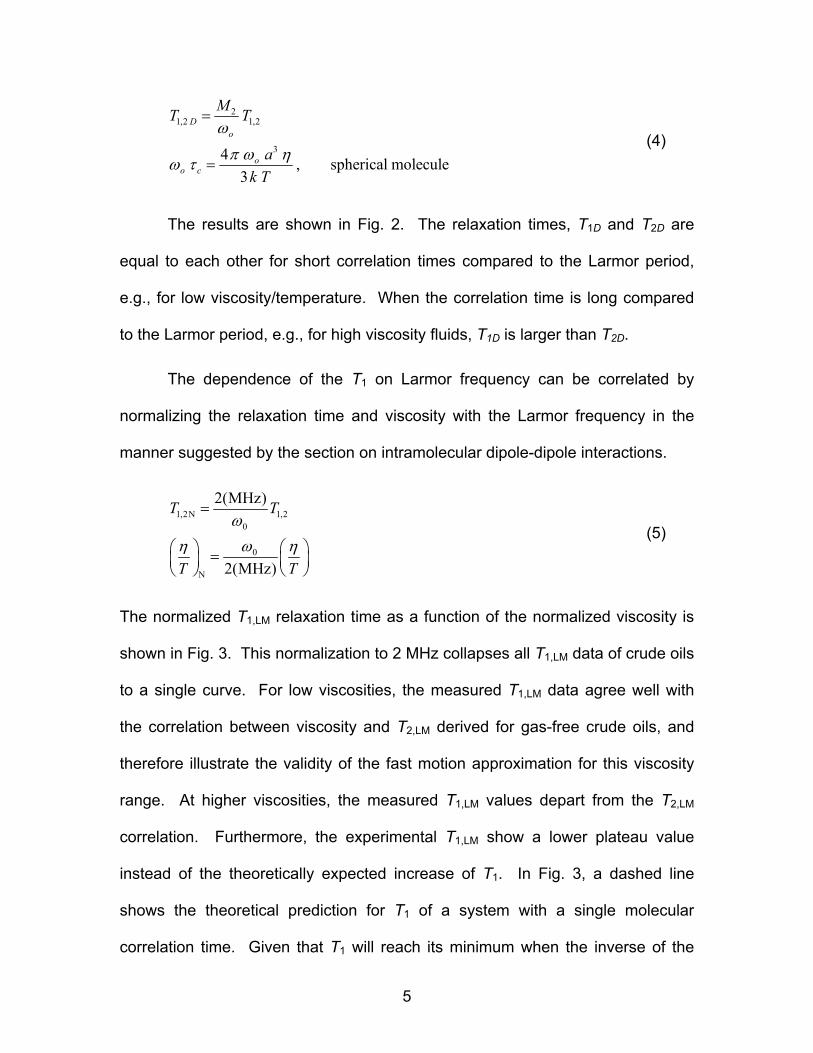
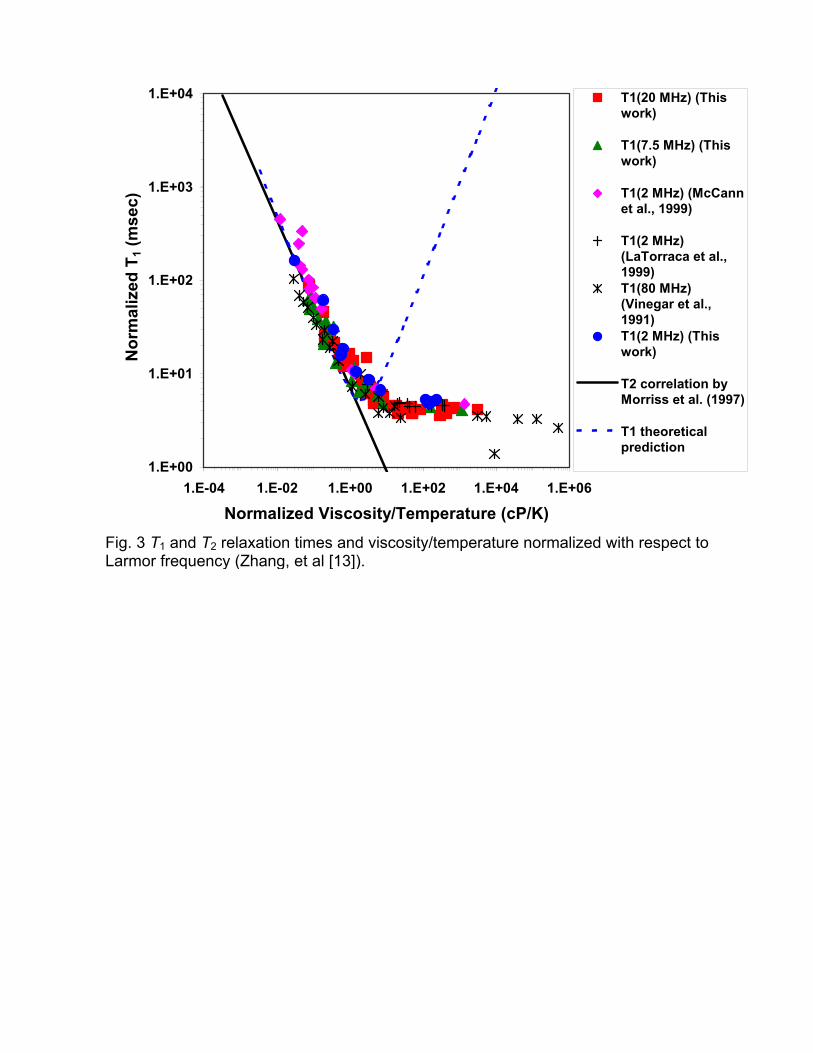
The normalized T1,LM relaxation time as a function of the normalized viscosity is
shown in Fig. 3. This normalization to 2 MHz collapses all T1,LM data of crude oils
to a single curve. For low viscosities, the measured T1,LM data agree well with
the correlation between viscosity and T2,LM derived for gas-free crude oils, and
therefore illustrate the validity of the fast motion approximation for this viscosity
range. At higher viscosities, the measured T1,LM values depart from the T2,LM
correlation. Furthermore, the experimental T1,LM show a lower plateau value
instead of the theoretically expected increase of T1. In Fig. 3, a dashed line
shows the theoretical prediction for T1 of a system with a single molecular
correlation time. Given that T1 will reach its minimum when the inverse of the
5
Larmor frequency is equal to the molecular correlation time, the observed lower
plateau of the T1 data suggests that crude oils need to be characterized by a
spectrum of molecular correlation times.
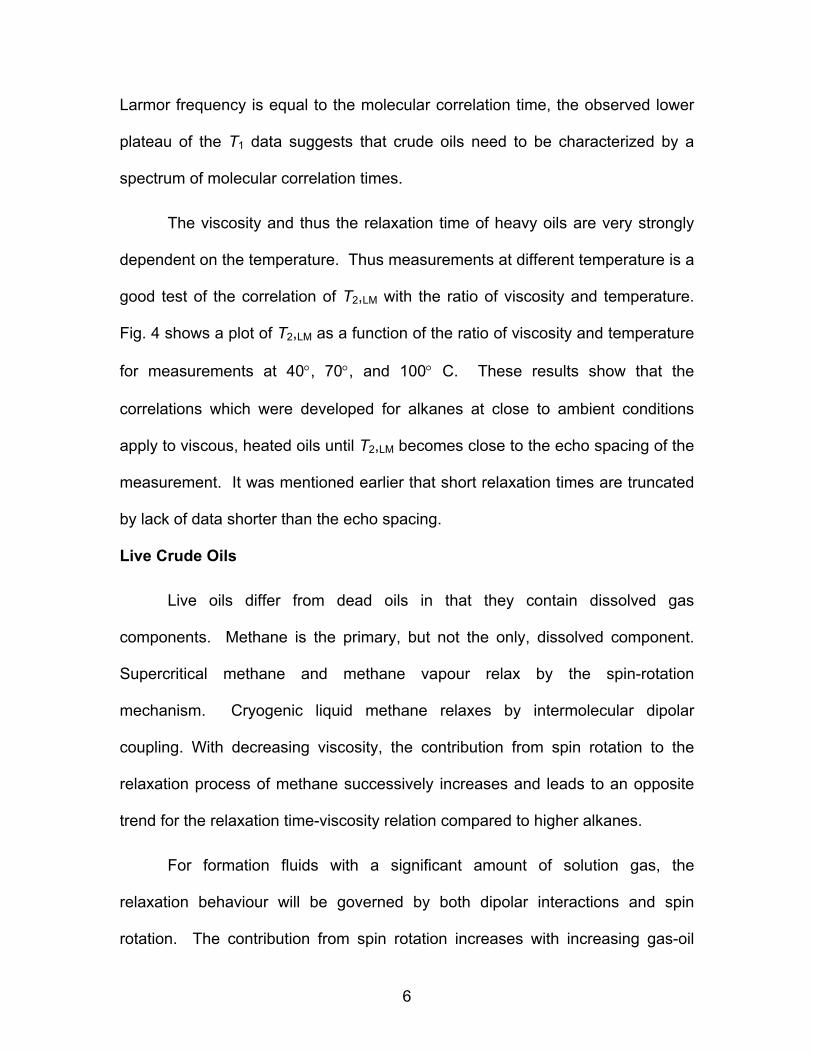
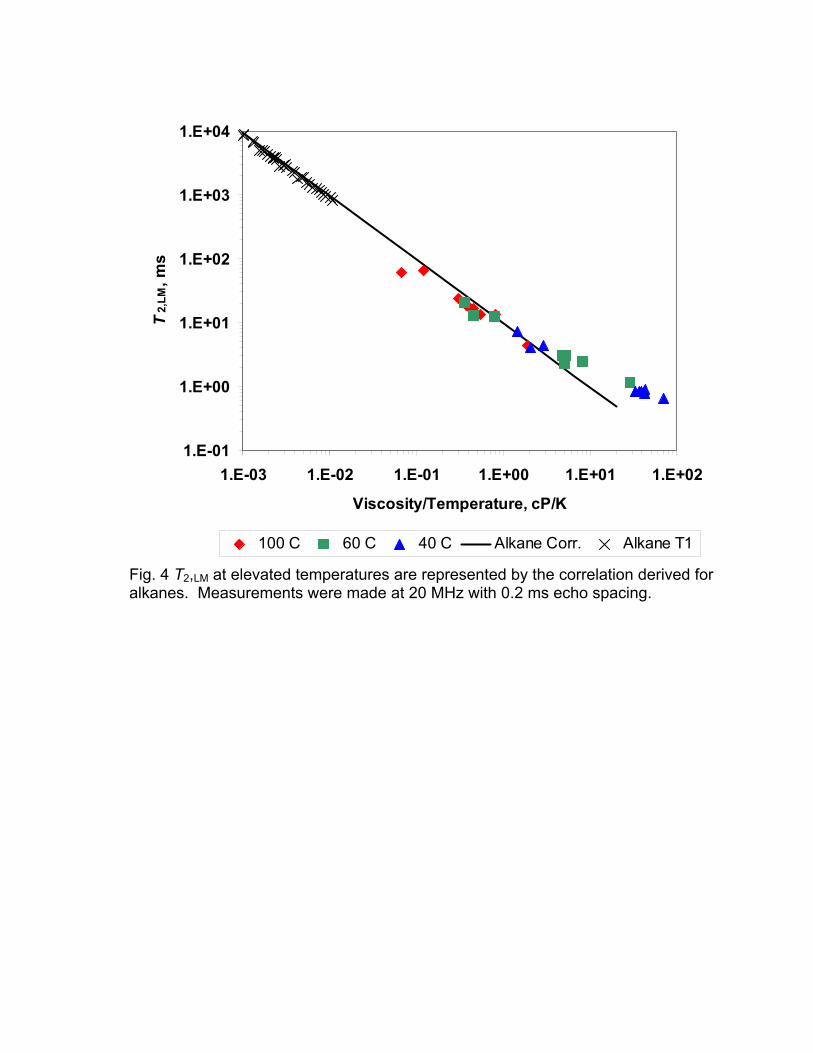
The viscosity and thus the relaxation time of heavy oils are very strongly
dependent on the temperature. Thus measurements at different temperature is a
good test of the correlation of T2,LM with the ratio of viscosity and temperature.
Fig. 4 shows a plot of T2,LM as a function of the ratio of viscosity and temperature
for measurements at 40°, 70°, and 100° C. These results show that the
correlations which were developed for alkanes at close to ambient conditions
apply to viscous, heated oils until T2,LM becomes close to the echo spacing of the
measurement. It was mentioned earlier that short relaxation times are truncated
by lack of data shorter than the echo spacing.
Live Crude Oils
Live oils differ from dead oils in that they contain dissolved gas
components. Methane is the primary, but not the only, dissolved component.
Supercritical methane and methane vapour relax by the spin-rotation
mechanism. Cryogenic liquid methane relaxes by intermolecular dipolar
coupling. With decreasing viscosity, the contribution from spin rotation to the
relaxation process of methane successively increases and leads to an opposite
trend for the relaxation time-viscosity relation compared to higher alkanes.
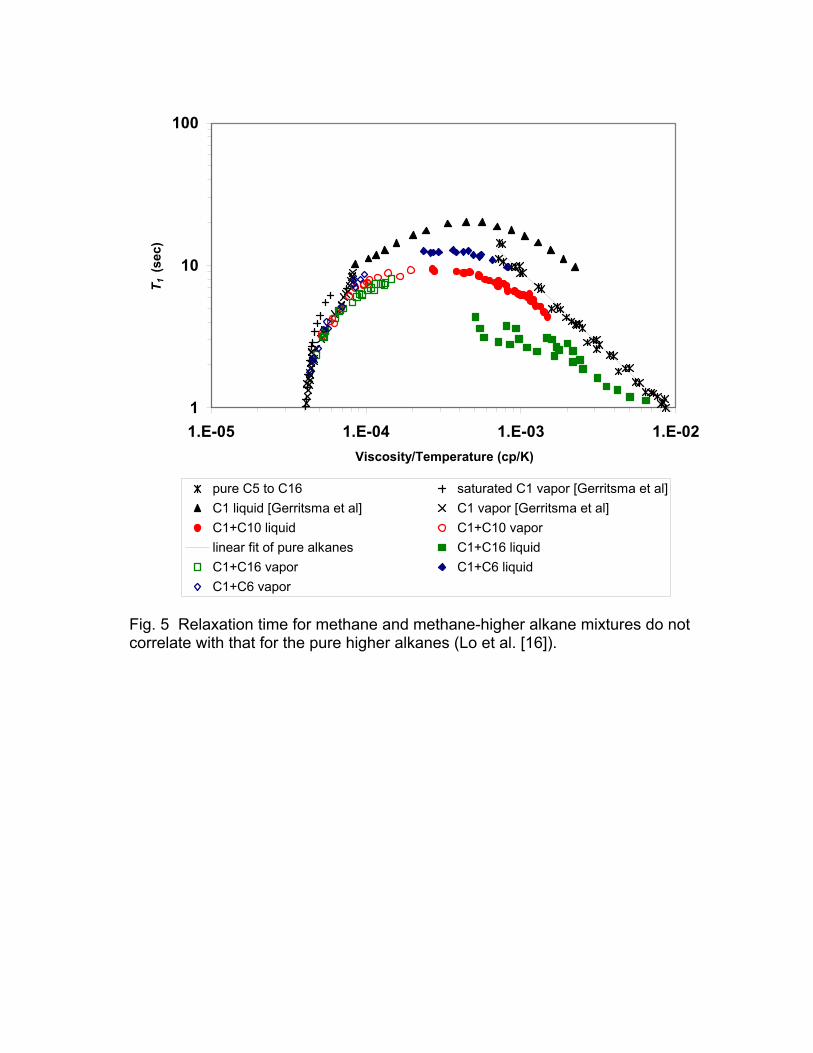
For formation fluids with a significant amount of solution gas, the
relaxation behaviour will be governed by both dipolar interactions and spin
rotation. The contribution from spin rotation increases with increasing gas-oil
6

ratio and increasing hydrogen index of the gas phase. This is illustrated in Fig. 5,
which includes methane-alkane mixtures, in addition to pure methane and pure
higher alkanes [16].
Because of the opposite dependencies on the ratio of
viscosity/temperature between dipolar interactions and spin rotation, prediction of
the NMR relaxation times from PVT data for live oils is complicated. Generally
speaking, live fluids will have shorter relaxation times than gas-free fluids of
similar viscosity because of the additional contributions to the relaxation from
spin rotation.
Lo et al. [16] have shown that the relaxation times of methane-alkane
mixtures show a significant deviation from the straight-line correlation for pure
liquid alkanes. This departure is not exclusively due to the system being a
mixture, since the log-mean relaxation of n-hexane and n-hexadecane mixtures
followed the correlation for pure liquid alkanes. The deviation of the methane-
alkane mixtures from the correlation for the liquid alkanes correlates with the
methane content of the mixture or the gas/oil ratio, GOR, (in m3/m3) [16]. The
correlation of the measurements resulted in the following expression:
( ) ( )( ) ( ){ }
( ) ( )
10 1, 1 10
10 10 10
210 10
=Log / Log )
Log Log Log
0.127 Log 1.25Log 2.80
lineardeviation T T f GOR
deviation f GOR
GOR GOR
=
=
= − + −
(6)
The relaxation of the live oil can thus be estimated from the correlation in
the absence of methane, denoted T1,linear, and the function of the GOR:
7
)(,1
1 GORfT
T linear= (7)
The correlation of the relaxation time as a function of
viscosity/temperature and GOR is shown in Fig. 6. The contour lines of constant
GOR are straight lines that are parallel to the line for dead oils.
Reservoir Gas
The primary component of natural gas is methane. Supercritical methane
relaxes by the spin rotation mechanism and the relaxation time can be correlated
with density and temperature. Although methane is usually the primary
component of natural gas, other light hydrocarbons and non-hydrocarbons are
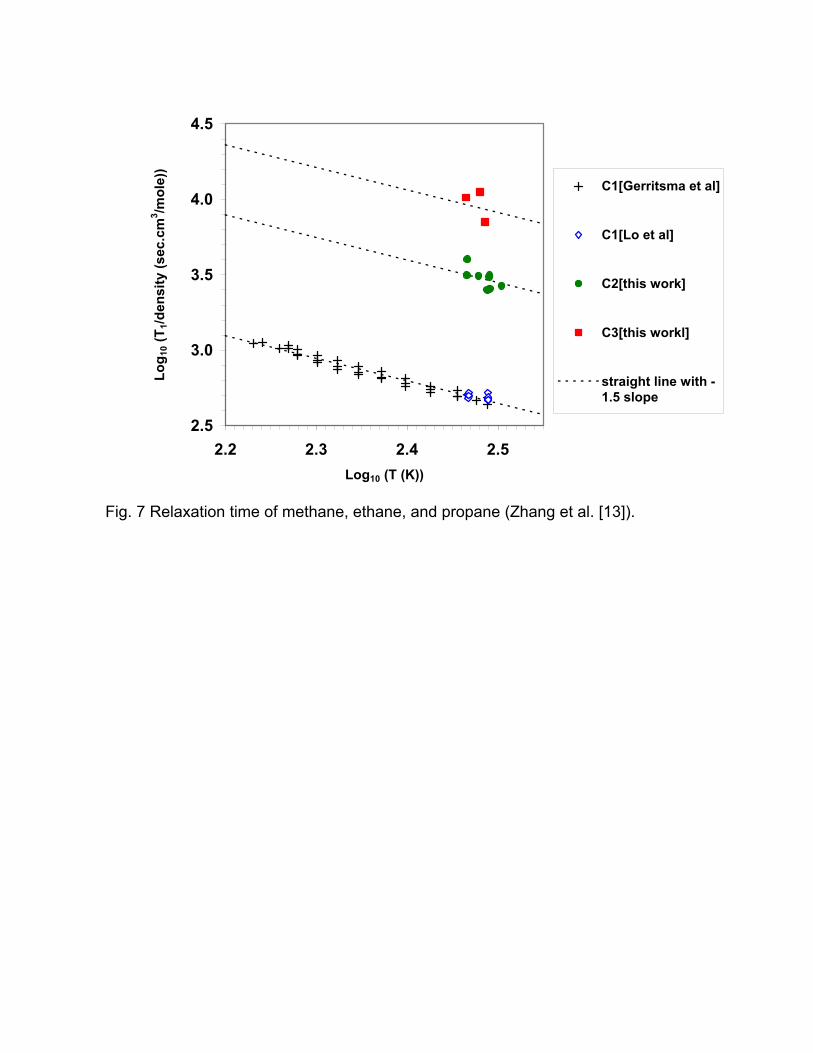
usually present. Pure ethane and propane gas have relaxation times that are
longer than that of methane [13], especially when correlated with molar density
(Fig. 7).
Carbon dioxide and nitrogen do not have protons but their presence in
mixtures with methane results in a reduction of the relaxation time of methane
compared to the correlation for pure methane based on mass density [17].
However, if the molar density rather than the mass density is used in the
correlation, the methane relaxation in mixtures with CO2 or nitrogen will
approximately correlate with that of pure methane. The symbols in Fig. 8 are the
relaxation times of methane in mixtures with either CO2 or nitrogen compared
with the correlation for pure methane. The departure is apparently due to the
collision cross-section of methane with these other gases being different from the
methane-methane collision cross-section.
8

Relationship between Relaxation Time and Diffusivity
NMR well logs need to distinguish between water, oil, and gas in
the pore space of the rock. Water usually has a broad relaxation time in rocks
because of surface relaxation on the pore wall of pores of different sizes. The
fluids are distinguished by the difference of the diffusivity. Crude oil is a mixture
of many components and thus usually has broad relaxation time and diffusivity
distributions. Crude oil has been distinguished from water and the viscosity of
the crude oil estimated through the use of the constituent viscosity model [18].
“In the CVM, each hydrocarbon molecule in the mixture is assumed to relax and
diffuse like it would in the pure-state liquid except the macroscopic pure-state
viscosity is replaced by the microscopic constituent viscosity.” This implies that
the relaxation time distribution and diffusivity distribution are coupled through a
common “constituent viscosity.” The expressions for the mixture’s and the
constituent’s relaxation time, diffusivity, and viscosity are as follows.
2, 2, 2, 2,1
1
2, 2,
1 2,
1
, ,
, ,
1
k
k
k
Nf
LM k LM kkk
Nf
LM k LM kkk
kLM
LM k
Nfk
k LM LM
N
kk
aT aTT T T
bT bTD D D
DD bT T a
aT bTT D
f
η η
η η
η η
=
=
=
=
= = =
= = =
= =
= = =
=
T
D
∏
∏
∏
∑
(8)
The parameter, kf , is the proton fraction of the k-th molecular constituent.
The parameters, , were determined from the measurements of the anda b
9
relaxation time and diffusivity of pure components and the mean value of the
mixture. It has been established that for the alkanes the ratio of is equal to
5.28×10
/b a
-6 (cm2/s2) while for dead crude oils b/a is approximately 1.26×10⁻⁵
(cm2/s2). This model assumes that relaxation time and diffusivity distributions are
coupled with each constituent having a common proportionality constant, . A
correction for the GOR should be made for live oils [18].
/b a
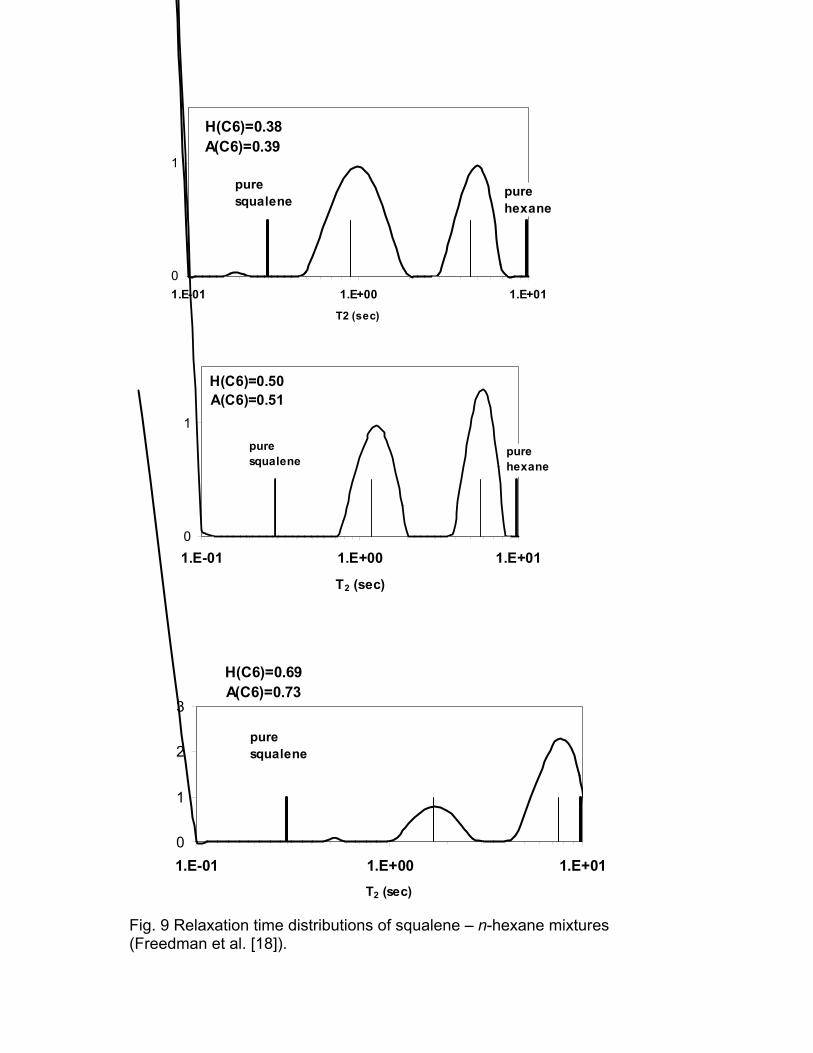
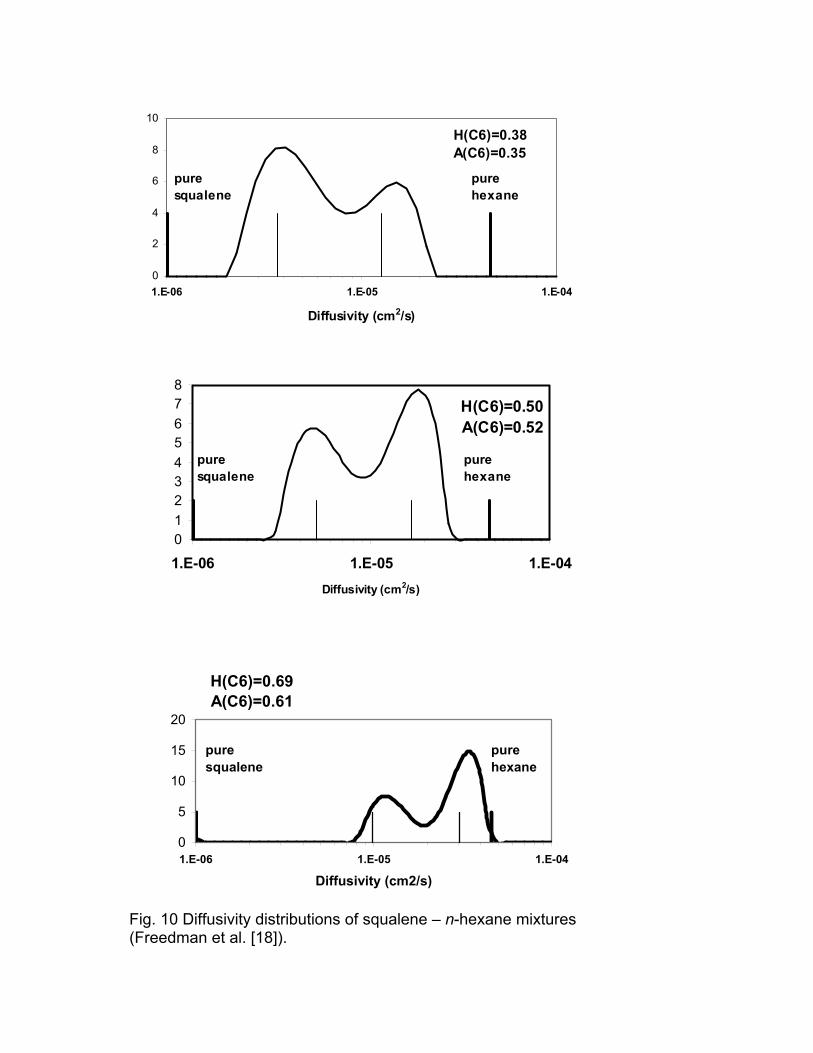
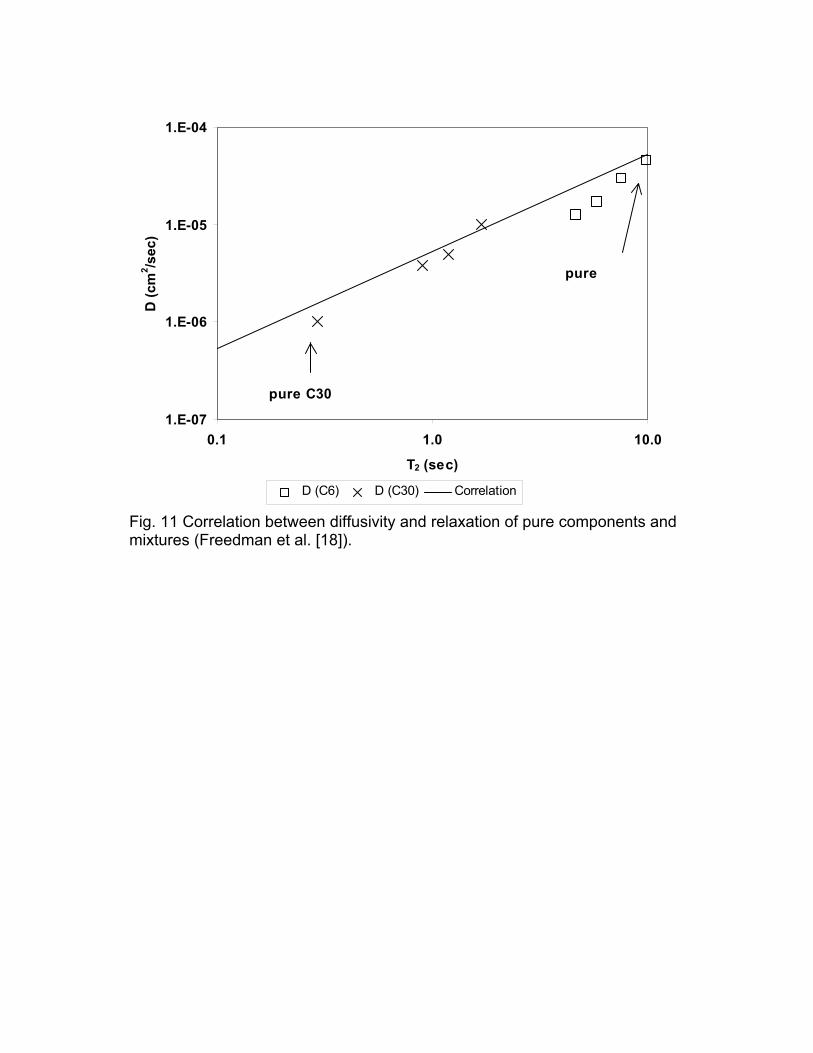
Freedman et al. [18] studied mixtures of n-hexane (C6H14) and squalene
(C30H50) and demonstrated the relation between the relaxation time and
diffusivity distributions for these mixtures. The relaxation time and diffusivity
distributions are shown in Figs. 9 and 10, respectively. The light vertical line on
each plot is the relaxation time estimated by fitting the CPMG response to a bi-
exponential model. H(C6) is the proton fraction of hexane in the mixture. A(C6)
is the fraction of the area attributed to hexane. There is good agreement
between H(C6) and A(C6). The peaks of the diffusivity distributions are broader
than those of the T2 distributions. This can be explained by the difference in
signal/noise for the two measurements. Figure 11 is the correlation between the
pure and constituent diffusivity and relaxation time for the n-hexane and
squalene systems. The measured points compare well with the correlation that
was independently developed from pure alkanes and mixture of alkanes.
CONCLUSIONS
1. Crude oils have equal T1 and T2 at low viscosity and can be correlated
with the ratio of viscosity /temperature. The T1 of high viscosity crude oils
approach a plateau valued that is a function of the Larmor frequency. The
10
measured T2 of high viscosity crude oils continue to follow the
viscosity/temperature correlation until the loss of information due to finite
echo spacing limits the accuracy of the measurements.
2. Methane saturated oils have a relaxation time that departs for the
correlation based on methane-free alkanes. These systems can be
correlated with the gas/oil ratio in addition to the ratio of
viscosity/temperature.
3. Natural gas often has in addition to methane, a significant amount of
ethane, propane, CO2 and nitrogen. Ethane and propane has significantly
higher relaxation time for the same molar density compared to methane.
Nitrogen and CO2 have only a small effect on the methane relaxation
when the relaxation time is correlated with the total molar density.
4. The relaxation time and diffusivity distributions in hydrocarbon mixtures
are correlated through the ‘constituent viscosity model.’
ACKNOWLEDGMENTS
The authors gratefully acknowledge the financial support of NSF, USDOE,
and the industrial consortium on Processes in Porous Media at Rice University.
Also, the contributions of Kelly McCann, Abby Vinegar, Waylon House and Riki
Kobayashi are acknowledged. The advice of Harold Vinegar is gratefully
acknowledged.
11
REFERENCES
[1] G.R. Coates, L. Xiao, and M.G. Prammer, NMR Well Logging, Principles &
Applications, Halliburton Energy Services, Houston (1999).
[2] K.-J. Dunn, D.J. Bergman, and G.A. Latorraca, Nuclear Magnetic Resonance
Petrophysical and Logging Applications, Pergamon, New York, (2002).
[3] J. Bouton, M.G. Prammer, P. Masak, and S. Menger, Assessment of Sample
Contamination by Down- Hole NMR Fluid Analysis, Paper SPE-71714, Society of
Petroleum Engineers, presented at the 76 th Annual Technical Conference and
Exhibition, New Orleans, LA, Sept. 30-Oct. 3, (2001).
[4] P.C. Masak, J. Bouton, M.G. Prammer, S. Menger, E. Drack, B. Sun, K-J.
Dunn, M. Sullivan, Field Test Results And Applications Of The Downhole
Magnetic Resonance Fluid Analyzer, SPWLA 43rd Annual Logging Symposium,
Oiso, Japan, June 2-5, (2002).
[5] C.E. Morriss, R. Freedman, C. Straley, M. Johnston, H.J. Vinegar, and P.N.
Tutunjian, Hydrocarbon Saturation and Viscosity Estimation from NMR Logging
in the Belridge Diatomite, The Log Analyst, March-April (1997), 44-59.
[6] H.J. Vinegar, P.N. Tutunjian, W.A. Edelstein, and P.B. Roemer, Whole-Core
Analysis by 13C NMR, SPE Formation Evaluation, June (1991), 183-189.
[7] C. Straley, D. Rossini, H. J. Vinegar, P. Tutunjian, C. Morriss, Core Analysis
by Low-Field NMR, The Log Analyst, March-April (1997), 84-94.
[8] G.A. LaTorraca, K.J. Dunn, P.R. Webber, and R.M. Carlson, Low-Field NMR
Determination of the Properties of Heavy Oils and Water-in-Oil Emulsions,
Magnetic Resonance Imaging, 16, Nos. 5/6 (1998), 659-662.
[9] S.Kh.G. Kashaev, B. Le, and M.Z. Zinyatov, Proton Spin-Lattice Relaxation,
Viscosity, and Vibration of Molecules in the Series of n- Paraffins, translated from
Doklady Akademii Nauk SSSR, 157.6, 1438-1440 (August, 1964) 846-848.
12
13
[10] J.A. Zaga, Spin-Lattice Relaxation in Pure and Mixed Alkanes and Their
Correlation with Thermodynamic and Macroscopic Transport Properties, M.S.
Thesis, Rice University, (1987).
[11] J.A. Zaga, Spin-Lattice Relaxation in Normal Alkanes at Elevated Pressures,
Ph. D. Thesis, Rice University, (1990).
[12] S.W. Lo, Correlations of NMR Relaxation Time with Viscosity/Temperature,
Diffusion Coefficient and Gas/Oil Ratio of Methane-Hydrocarbon Mixtures, Ph.D.
Thesis, Rice University (1999).
[13] Y. Zhang, G.J. Hirasaki, W.V. House, and R. Kobayashi, Oil and Gas NMR
Properties: The Light and Heavy Ends, paper HHH prepared for presentation at
the 43rd SPWLA Annual Logging Symposium, (June 2–5, 2002), Oiso, Japan.
[14] Y. Zhang, NMR Relaxation and Diffusion Characterization of Hydrocarbon
Gases and Liquids, Ph.D. Thesis, Rice University (2002).
[15] B. Cowan, Nuclear Magnetic Resonance and Relaxation, Cambridge, New
York (1997).
[16] S.-W. Lo, G.J. Hirasaki, W.V. House, and R. Kobayashi, Mixing Rules and
Correlations of NMR Relaxation Time with Viscosity, Diffusivity, and Gas/Oil
Ratio of Methane/Hydrocarbon Mixtures, SPEJ, (March, 2002), 24-34.
[17] S. Rajan, K. Lalita, and S.V. Babu, Intermolecular Potentials from NMR
Data: I. CH4-N2 and CH4-CO2, Can. J. Phys. (1975), 53, 1624-1634.
[18] R. Freedman, S.-W. Lo, M. Flaum, G.J. Hirasaki, A. Matteson, and A.
Sezginer, A New NMR Method of Fluid Characterization in Reservoir Rocks:
Experimental Confirmation and Simulation Results, SPEJ (December, 2001) 452-
464.

1.E-01
1.E+00
1.E+01
1.E+02
1.E+03
1.E+04
1.E+05
1.E-01 1.E+01 1.E+03 1.E+05 1.E+07
Viscosity(cP)
T1,
LM &
T2,
LM (m
sec)
T2[McCann et al](2MHz) T1[McCann et al](2 MHz)
T2[LaTorraca et al](2 MHz) T1[LaTorraca et al](2 MHz)
T2[Vinegar et al](2 MHz) T1[Vinegar et al](80 MHz)
T2, C5-C16[Zega et al(32 MHz), Lo et al(2 MHz)] correlation by Morriss et al
T 1, 80 MHz
T 1, 2 MHz
T 2, 2 MHz2,LM 0.9
1200Tη
=
Fig. 1 T1 and T2 relaxation times of alkanes, crude oils, and viscosity standards at a Larmor frequency of 2 and 80 MHz. (Zhang et al. [13])
1.E-01
1.E+00
1.E+01
1.E+02
1.E-03 1.E-02 1.E-01 1.E+00 1.E+01
(Larmor frequency)(Correlation time)
Dim
ensi
onle
ss re
laxa
tion
time
T 1
T 2
Fig. 2 Dimensionless T1 and T2 relaxation times (Zhang et al. [13])
1.E+00
1.E+01
1.E+02
1.E+03
1.E+04
1.E-04 1.E-02 1.E+00 1.E+02 1.E+04 1.E+06
Normalized Viscosity/Temperature (cP/K)
Nor
mal
ized
T1 (
mse
c)
T1(20 MHz) (Thiswork)
T1(7.5 MHz) (Thiswork)
T1(2 MHz) (McCannet al., 1999)
T1(2 MHz)(LaTorraca et al.,1999)T1(80 MHz)(Vinegar et al.,1991)T1(2 MHz) (Thiswork)
T2 correlation byMorriss et al. (1997)
T1 theoreticalprediction
Fig. 3 T1 and T2 relaxation times and viscosity/temperature normalized with respect to Larmor frequency (Zhang, et al [13]).
1.E-01
1.E+00
1.E+01
1.E+02
1.E+03
1.E+04
1.E-03 1.E-02 1.E-01 1.E+00 1.E+01 1.E+02
Viscosity/Temperature, cP/K
T2,
LM, m
s
100 C 60 C 40 C Alkane Corr. Alkane T1
Fig. 4 T2,LM at elevated temperatures are represented by the correlation derived for alkanes. Measurements were made at 20 MHz with 0.2 ms echo spacing.
1
10
100
1.E-05 1.E-04 1.E-03 1.E-02Viscosity/Temperature (cp/K)
T 1 (s
ec)
pure C5 to C16 saturated C1 vapor [Gerritsma et al]C1 liquid [Gerritsma et al] C1 vapor [Gerritsma et al]C1+C10 liquid C1+C10 vaporlinear fit of pure alkanes C1+C16 liquidC1+C16 vapor C1+C6 liquidC1+C6 vapor
Fig. 5 Relaxation time for methane and methane-higher alkane mixtures do not correlate with that for the pure higher alkanes (Lo et al. [16]).

1
10
100
1.0E-05 1.0E-04 1.0E-03 1.0E-02
Visc/T (cp/K)
T1 (s
ec)
pure C5 to C16 saturated C1 vapor [Gerritsma et al]C1 liquid [Gerritsma et al] C1 vapor [Gerritsma et al]C1+C10 liquid C1+C10 vaporlinear fit of pure alkanes C1+C16 liquidC1+C16 vapor C1+C6 liquidC1+C6 vapor
GOR= 1000 500 100
Fig. 6 Relaxation time of live oils correlate with the gas/oil ratio (Lo et al [16]).
2.5
3.0
3.5
4.0
4.5
2.2 2.3 2.4 2.5Log10 (T (K))
Log 1
0 (T 1
/den
sity
(sec
.cm
3 /mol
e))
C1[Gerritsma et al]
C1[Lo et al]
C2[this work]
C3[this workl]
straight line with -1.5 slope
Fig. 7 Relaxation time of methane, ethane, and propane (Zhang et al. [13]).

C1-CO2; Molar Density (Rajan, et al.)
100
1000
100 1000
T (K)
T 1/d
ensi
ty (s
ec c
m3 /m
ole)
C1 Correlation0% CO220% CO243% CO283% CO2
Fig. 8 Relaxation time of methane in the pral. [13])
C1- N2; Molar Density (Rajan, et al.)
100
1000
100 1000T (K)
T 1/d
ensi
ty (s
ec c
m3 /m
ole)
C1 Corr.0% N233% N258%N276% N2
esence of CO2 or nitrogen (Zhang et
0
1
1.E-01 1.E+00 1.E+01T2 (sec)
puresqualene
pure hexane
H(C6)=0.38A(C6)=0.39
H(C6)=0.50A(C6)=0.51
0
1
1.E-01 1.E+00 1.E+01
T2 (sec)
puresqualene
pure hexane
H(C6)=0.69A(C6)=0.73
0
1
2
3
1.E-01 1.E+00 1.E+01T2 (sec)
puresqualene
Fig. 9 Relaxation time distributions of squalene – n-hexane mixtures (Freedman et al. [18]).
0
2
4
6
8
10
1.E-06 1.E-05 1.E-04
Diffusivity (cm2/s)
puresqualene
pure hexane
H(C6)=0.38A(C6)=0.35
H(C6)=0.50A(C6)=0.52
012345678
1.E-06 1.E-05 1.E-04Diffusivity (cm2/s)
puresqualene
pure hexane
H(C6)=0.69A(C6)=0.61
0
5
10
15
20
1.E-06 1.E-05 1.E-04
Diffusivity (cm2/s)
puresqualene
pure hexane
Fig. 10 Diffusivity distributions of squalene – n-hexane mixtures (Freedman et al. [18]).
1.E-07
1.E-06
1.E-05
1.E-04
0.1 1.0 10.0
T2 (sec)
D (c
m2 /s
ec)
D (C6) D (C30) Correlation
pure C30
pure
Fig. 11 Correlation between diffusivity and relaxation of pure components and mixtures (Freedman et al. [18]).