


NMDA Receptor Hypofunction Leads to Generalized andPersistent Aberrant c Oscillations Independent ofHyperlocomotion and the State of ConsciousnessTahir Hakami1., Nigel C. Jones1., Elena A. Tolmacheva2., Julien Gaudias2¤, Joseph Chaumont2, Michael
Salzberg3, Terence J. O’Brien1, Didier Pinault2*
1 Department of Medicine, Royal Melbourne Hospital, University of Melbourne, Parkville, Australia, 2 INSERM U666, Physiopathologie et psychopathologie cognitive de la
schizophrenie, Universite de Strasbourg, Faculte de Medecine, Strasbourg, France, 3 Department of Psychiatry, St Vincent’s Hospital, University of Melbourne, Fitzroy,
Victoria, Australia
Abstract
Background: The psychotomimetics ketamine and MK-801, non-competitive NMDA receptor (NMDAr) antagonists, inducecognitive impairment and aggravate schizophrenia symptoms. In conscious rats, they produce an abnormal behaviorassociated with a peculiar brain state characterized by increased synchronization in ongoing c (30–80 Hz) oscillations in thefrontoparietal (sensorimotor) electrocorticogram (ECoG). This study investigated whether NMDAr antagonists-inducedaberrant c oscillations are correlated with locomotion and dependent on hyperlocomotion-related sensorimotor processing.This also implied to explore the contribution of intracortical and subcortical networks in the generation of thesepathophysiological ECoG c oscillations.
Methodology/Principal Findings: Quantitative locomotion data collected with a computer-assisted video tracking systemin combination with ECoG revealed that ketamine and MK-801 induce highly correlated hyperlocomotion and aberrant coscillations. This abnormal c hyperactivity was recorded over the frontal, parietal and occipital cortices. ECoG conductedunder diverse consciousness states (with diverse anesthetics) revealed that NMDAr antagonists dramatically increase thepower of basal c oscillations. Paired ECoG and intracortical local field potential recordings showed that the ECoG mainlyreflects c oscillations recorded in underlying intracortical networks. In addition, multisite recordings revealed that NMDArantagonists dramatically enhance the amount of ongoing c oscillations in multiple cortical and subcortical structures,including the prefrontal cortex, accumbens, amygdala, basalis, hippocampus, striatum and thalamus.
Conclusions/Significance: NMDAr antagonists acutely produces, in the rodent CNS, generalized aberrant c oscillations,which are not dependent on hyperlocomotion-related brain state or conscious sensorimotor processing. These findingssuggest that NMDAr hypofunction-related generalized c hypersynchronies represent an aberrant diffuse network noise, apotential electrophysiological correlate of a psychotic-like state. Such generalized noise might cause dysfunction of brainoperations, including the impairments in cognition and sensorimotor integration seen in schizophrenia.
Citation: Hakami T, Jones NC, Tolmacheva EA, Gaudias J, Chaumont J, et al. (2009) NMDA Receptor Hypofunction Leads to Generalized and Persistent Aberrant cOscillations Independent of Hyperlocomotion and the State of Consciousness. PLoS ONE 4(8): e6755. doi:10.1371/journal.pone.0006755
Editor: Kenji Hashimoto, Chiba University Center for Forensic Mental Health, Japan
Received June 2, 2009; Accepted July 23, 2009; Published August 25, 2009
Copyright: � 2009 Hakami et al. This is an open-access article distributed under the terms of the Creative Commons Attribution License, which permitsunrestricted use, distribution, and reproduction in any medium, provided the original author and source are credited.
Funding: This work was supported by the French Institute of Health and Medical research (INSERM) and by the Universite Louis Pasteur, Universite deStrasbourg, Faculte de medecine, Strasbourg, to DP. It was also supported in part by a Project grant from the NH&MRC (Australia) #400088 to TJO and MS. Thefunders had no role in study design, data collection and analysis, decision to publish, or preparation of the manuscript.
Competing Interests: The authors have declared that no competing interests exist.
* E-mail: [email protected]
¤ Current address: Neurobiology, Biozentrum, University of Basel, Basel, Switzerland
. These authors contributed equally to this work.
Introduction
The symptoms of schizophrenia are underlain by neuronal
mechanisms that are poorly understood. It is currently thought
that they result, to some extent, from functional disconnections in
cortical-related networks, which denote the disintegration of
psychic processes [1]. Several hypotheses regarding the underlying
pathophysiological mechanisms have been proposed [2,3]. Grow-
ing evidence for hypofunction of N-methyl d-aspartate-type
glutamate receptors (NMDAr) in schizophrenia has been accu-
mulating [4–7]. Consistent with this, a single non-anesthetic dose
of non-competitive NMDAr antagonists, such as ketamine and
phencyclidine, can induce psychotic symptoms (including halluci-
nations) and cognitive abnormalities reminiscent of those seen in
schizophrenia and exacerbate symptoms in schizophrenic patients
[8–11]. The neuronal mechanisms underlying hypofunction of
NMDAr, and how these are related to the psychotic symptom-
atology, remain to be determined. In the conscious rat, a single
non-anesthetic injection of ketamine or MK-801 significantly
increases the power and intrinsic frequency of wake-related,
spontaneously occurring, cortical c frequency (30–80 Hz) oscilla-
tions [12]. The NMDAr hypofunction-related pathophysiological
PLoS ONE | www.plosone.org 1 August 2009 | Volume 4 | Issue 8 | e6755

cortical c oscillations are accompanied by abnormal behavior,
including hyperlocomotion and ataxia. These may correspond to
some of the motor abnormalities observed in neuroleptic naıve
schizophrenic patients, although the latter tend to be much more
subtle [13–16]. Therefore, the aim of the present study was to
determine whether or not ketamine-induced aberrant cortical coscillations were 1) correlated with quantitative measures of
locomotion and 2) caused by conscious or unconscious premotor/
sensorimotor neuronal activity related to hyperlocomotion.
Answering these important questions allows the hypothesis that
‘‘NMDAr hypofunction-induced hyperlocomotion and/or aber-
rant ongoing c oscillations are associated to a psychotic-like state’’
to be tested. The first question was addressed by combining, in
freely moving rats, electrocorticographic (ECoG) recording and
computer-assisted video tracking to quantify simultaneously the
motor and ECoG changes in response to the administration of a
single non-anesthetic low dose of ketamine or MK-801, the latter
molecule being a more specific non-competitive NMDAr antag-
onist than the former one. The second question was addressed by
assessing, using multiple recordings, the psychotomimetic action of
these NMDAr antagonists on spontaneously occurring c oscilla-
tions in cortical and subcortical structures in diverse consciousness
states produced by sedative and anesthetic substances.
Another central issue was to relate the natural and NMDAr
antagonist-induced aberrant c oscillations recorded with surface
ECoG electrodes to the current sources or generators. Because of
volume conduction and network properties, we assume that the
cortical electrodes recorded integrated population activities,
directly from multiple cortical generators and, directly and
indirectly (e.g., via thalamocortical neurons), from subcortical
generators [17]. So, the possible contribution of intracortical and
subcortical networks in the recorded surface ECoG was addressed
using multisite recordings.
Results
1. Ketamine and MK-801 induce temporally correlatedhyperlocomotion and aberrant c oscillations
The current experiments were conducted in freely moving rats to
study the degree of correlation of changes in c power and
locomotion in conscious rats treated with a single non-anesthetic
dose of ketamine or MK-801 (Fig. 1). Administration of ketamine
produced a significant dose-dependent and immediate increase in
both c power and locomotor activity (Fig. 1A–B), which persisted
for 30 minutes before returning to baseline levels. The peak c power
response occurred 8 minutes after injection, and was significantly
Figure 1. Ketamine and MK-801 induce parallel and dose-dependent increases in c (30–80 Hz) power (A and C) and locomotoractivity (B and D) in freely moving rats. Ketamine (2.5 and 5 mg/kg) or MK-801 (0.08 and 0.16 mg/kg) were injected subcutaneously. Blackarrows indicate the injection time. Data are presented in 2-minute intervals, and represent the mean (6s.e.m.) percentage response compared to the30 minute habituation period. Gamma power measurements represent the means of those obtained from the left and right hemispheres.doi:10.1371/journal.pone.0006755.g001
Ketamine-Induced c Noise
PLoS ONE | www.plosone.org 2 August 2009 | Volume 4 | Issue 8 | e6755

increased compared to control levels at this time (F(2, 24) = 24.56,
p,0.0001), while the peak locomotor response occurred slightly
earlier at 6 minutes after injection and was also significantly higher
than vehicle-treated rats at this point (F(2, 24) = 5.981, p = 0.0133).
Furthermore, injection of ketamine produced a significant increase
in total response as measured via the AUC when assessing c power
(F(2, 24) = 18.91, p = 0.0001) and locomotor activity (F(2, 24) = 8.625,
p = 0.0036), during the drug-active period. From visual observa-
tions, the ketamine-treated rats had consistent short-term hyperac-
tive behavior (running, crawling, and irritability) and ataxic-like
behavior (unsteady gait, rearing then falling down on the back).
Administration of MK-801 also produced a significant and
dose-dependent increase in both c power and locomotor activity
(Fig. 1C–D), which followed a different time course to that induced
by ketamine. The drug response was initiated 10 minutes following
administration, and persisted for the duration of the recording
period (90 minutes post-injection). The peak c power response
occurred 41 minutes after injection and was significantly increased
compared to control levels at this time (F(2, 24) = 39.27, p,0.0001),
while the peak locomotor response occurred slightly later at 46
minutes following injection, and was also significantly higher than
control (F(2, 24) = 10.36, p = 0.0017). Furthermore, injection of
MK-801 produced a significant increase in total response as
measured via the AUC when assessing c power (F(2, 24) = 47.68,
p,0.0001) and locomotor activity (F(2, 24) = 14.82, p = 0.0003),
during the drug-active period. From visual observations, the MK-
801-treated rats had mainly long standing hyperactive running
type behavior.
The clear temporal correlations linking c power and locomotor
activity following drug administration are depicted in Figure 2,
with the strongest correlation (r = 0.96) observed between 0–30
minutes following ketamine (5 mg/kg) administration. Statistically
significant differences were observed at this time point between the
mean correlation coefficients obtained for the different treatments
(F(2, 8) = 6.43, p = 0.015), and post hoc analysis revealed this to be
evident when comparing ketamine treatment to vehicle (Fig. 2A,
left panel). At no other time point was significance observed when
comparing the mean correlation coefficients (p.0.05).
2. Ketamine produces generalized ongoing chyperactivity over the surface of the cerebral cortex
In an attempt to determine whether or not NMDAr-related chyperactivities are related only to the frontoparietal (sensorimotor)
cortex, paired ECoG recordings were performed over either the
frontal (motor) and parietal (somatosensory), or the frontal and
occipital (visual) cortices (Fig. 3A1, B1). A single subcutaneous
injection of ketamine (2.5 or 5.0 mg/kg) significantly increased the
power of c oscillations all over the recorded cortical areas
(Fig. 3A2,B2; N = 6 rats).
3. Ketamine- or MK-801-induced c hyperactivity is notcaused by conscious sensorimotor processing underlyingataxic behavior and hyperlocomotion
Ketamine and MK-801 led to an abnormal brain state
characterized by an increase in the power of baseline c oscillations
Figure 2. Group mean correlations comparing locomotor activity and c power following administration of ketamine 5 mg/kg sc (A),MK-801 0.16 mg/kg sc (B), and vehicle (saline sc; C) in freely moving rats. Data are depicted in three 30-minute time windows (running leftto right), and correlation coefficients calculated for these time frames for each drug. N = 8 for each group.doi:10.1371/journal.pone.0006755.g002
Ketamine-Induced c Noise
PLoS ONE | www.plosone.org 3 August 2009 | Volume 4 | Issue 8 | e6755

accompanied by abnormal motor activity, including hyperloco-
motion and ataxia. Therefore, it was important to know whether
this pharmacologically-induced c hyperactivity was the conse-
quence of conscious or unconscious sensorimotor processing
underlying abnormal motor behavior. The effects of non-
competitive NMDAr antagonists on neocortical c oscillations
were assessed in rats under four conditions that profoundly
modified the state of consciousness. In deeply urethane-anesthe-
tized rats, the sensorimotor ECoG (Fig. 4A) was characterized by
low-frequency (0.7760.06 Hz), medium- to high-voltage (0.2–
1.0 mV), monophasic positive waves of variable duration (at the
base: 439.29654.86 ms; see Fig. 4C1). The wave’s top had a
variable morphology: one to a few peaks, a dome-like or a plateau-
like waveform. It was often crowned with a long-lasting
(302.64622.30 ms) burst of c oscillations, which were more
persistent when compared to c bouts recorded in freely moving
rats (Table 1 and Fig. S1). A single non-anesthetic dose of
ketamine or MK-801 significantly increased the c power in such
bursts (Fig. 4C1–C3 and Table 2), increased by a factor of 2–3
their duration (872.50659.94 ms; t-test, p,0.0001) and slowed
down the frequency of occurrence of the positive waves (after MK-
801: 0.4760.05 Hz; t-test, p = 0.0008). Furthermore, these
NMDAr antagonists increased the frequency and duration of
periods of apparent ‘‘electrical silence’’ that occasionally occurred
in between positive waves (asterisks in Fig. 4C2,C3). It is worth
noting that previous studies have reported that the power of coscillations recorded under anesthesia is significantly greater than
that measured in the awaked basal state [18].
Under deep pentobarbital anesthesia, the ECoG of the
sensorimotor cortex was mainly characterized by complex
sequences of slow (,15 Hz)/high-amplitude (.0.4 mV) waves,
faster (.15 Hz)/low-amplitude (,0.2 mV) waves and of spike
components (Fig. 4D1–D3). Among the faster waves, short-lasting
(87.26610.30 ms; Table 1 and Fig. S1) c bouts were detectable
Figure 3. Ketamine increases the c (30–80 Hz) power in the motor (M), somatosensory (S) and visual (V) cortices in free-moving rats.A1-2 and B1-2 are from two experiments. (A1 and B1) 500-ms episodes of paired M–S and M–V ECoG, respectively, containing c bouts under controlconditions (vehicle), 15 min and .45 min after subcutaneous (sc) injection of ketamine (2.5 mg/kg). The dorsal view of the cranium shows thelocation of the recording electrodes (R, reference). (A2 and B2) Simultaneous changes in c power in the M and S cortices (A2) and in the M and Vcortices (B2) before and after ketamine injection. The histograms (means6s.e.m.) show a significant c increase in the M, S and V cortices about 15minutes after ketamine administration, with full and partial recoveries ,45 minutes later (comparison with the control condition; t-test with asteriskfor p,0.001).doi:10.1371/journal.pone.0006755.g003
Ketamine-Induced c Noise
PLoS ONE | www.plosone.org 4 August 2009 | Volume 4 | Issue 8 | e6755

and their amplitude was significantly increased following ketamine
or MK-801 injection (Fig. 4D1–D3). The persistent character of
background c oscillations induced by NMDAr antagonists in freely
moving rats could not consistently be reproduced under
pentobarbital anesthesia. An apparent inverse dose-effect of
pentobarbital on the amount of c oscillations was observed (not
shown).
The neurophysiological action of ketamine and MK-801 was
also tested under two sedative states, under fentanyl narcosis [19]
or fentanyl-haldol neuroleptanalgesia [19,20]. The ECoG of the
sensorimotor cortex usually alternated between medium-voltage
slow oscillations (,0.5 mV, ,15 Hz) and small-voltage faster
oscillations (,0.2 mV, .15 Hz), but slow and fast oscillations
could coexist. Under narcosis slow waves tended to be more
persistent than under neuroleptanalgesia (not shown). During
desynchronized states, the most prominent fast oscillations were
bursts of rhythmic c waves. They occurred at 0.2–3 Hz and were
at least 2–3 times more powerful than those recorded in freely
moving rats (Table 1 and Fig. S1). The intrinsic frequency in the cbouts was significantly lower by ,10 Hz than that measured in
freely moving rats. Under sedation, ketamine or MK-801
increased the amount of cortical c oscillations, at least during
the desynchronized states (Fig. 5A,B), and slightly increased by
,5 Hz on average the frequency at maximal c power (Table 3).
Under such experimental conditions, the NMDAr antagonist
effects were dose-dependent and qualitatively similar whatever the
Figure 4. Ketamine or MK-801 increases both the power and the duration of ongoing ECoG c oscillations under deep anesthesia.(A): Experimental design of the differential monopolar ECoG recording of the frontoparietal (FP) cortex relative to the reference (R) electrode, which isset to ground. The section of the silver wires (insulated with teflon) is put into the cranium (no contact with the meninges), whose contact is madeeasier with conductive paste. (B): Changes in c power during a typical 8-hour experiment under urethane-anesthesia, during which the vehicle (NaCl,0.9%, 1 ml/kg), ketamine (ket, 2.5 mg/kg) and MK-801 (MK, 0.04 and 0.08 mg/kg) were subcutaneously (sc) injected successively at different time(arrows). Note that this chart shows all the power values (resolution: 1.6 sec) of c oscillations, occurring during and in between the slow waves. (C1–C3, top row): 8-s episode of the frontoparietal ECoG under urethane-anesthesia and three successive conditions (after injection of vehicle [NaCl,0.9%], ketamine [7 min after injection of 2.5 mg/kg, sc] and MK-801 [18 min after injection of 0.08 mg/kg, sc]). (C1–C3, bottom row): thecorresponding 1-s episodes (indicated by the grey back) showing the positive slow waves. The ECoG was recorded with two bandpasses (0.1–800 Hzand 20–80 Hz). The asterisks in (C2) and (C3) indicate periods of ‘‘electrical silence’’. (D1–D3): A typical experiment done under deep pentobarbitalanesthesia. Top row: 8-s episode of the frontoparietal ECoG under three conditions (after subcutaneous injection of vehicle [control], ketamine[20 min after injection of 5 mg/kg, sc] and MK-801 [40 min after 0.08 mg/kg, sc]). Bottom row: the corresponding 1-s episodes (indicated by the greyback). The ECoG was recorded with two bandpasses (0.1–800 Hz and 20–80 Hz). Asterisks indicate c bursts.doi:10.1371/journal.pone.0006755.g004
Table 1. Properties (means6s.e.m., N.30) of spontaneously occurring c oscillations under different experimental conditions.
ECoG condition (see Fig. S1) FREE SEDATION URETHANE PENTO
duration (ms) 100.0864.06 146.1767.09 302.64622.30 87.26610.30
amplitude (mV) 44.4261.34 97.8363.21 78.0666.68 116.1160.01
c power (mV2/Hz) 52.8160.59 157.5562.67 99.7369.91 237.00613.80
FAMP (Hz) 45.5460.77 35.0560.52 41.0161.16 32.6360.44
The values for the freely moving condition are from a previous study (Pinault, 2008). ECoG, electrocorticogram; FAMP, frequency at maximal c power. FREE, drug-freeawaked rats; SEDATION, fentanyl-haldol neuroleptanalgesia; URETHANE, urethane anesthesia; PENTO, pentobarbital-fentanyl anesthesia. Regarding the experimentalconditions, details are available in Methods and in Fig. S1.doi:10.1371/journal.pone.0006755.t001
Ketamine-Induced c Noise
PLoS ONE | www.plosone.org 5 August 2009 | Volume 4 | Issue 8 | e6755
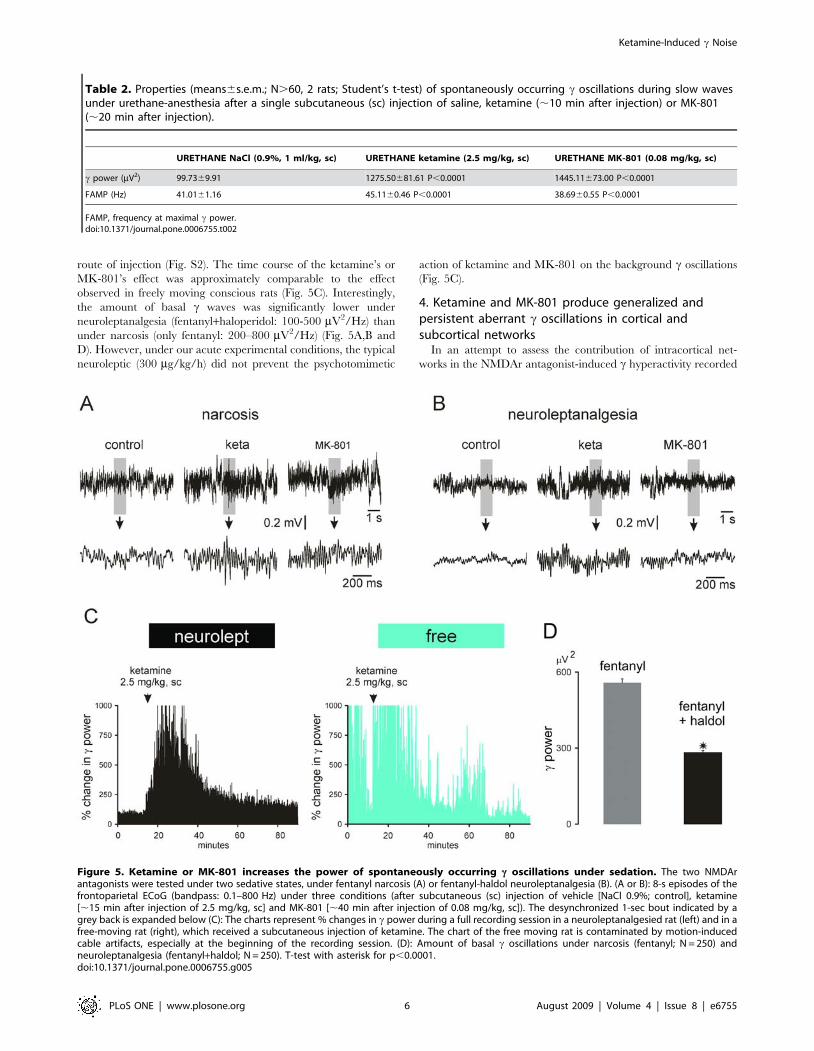
route of injection (Fig. S2). The time course of the ketamine’s or
MK-801’s effect was approximately comparable to the effect
observed in freely moving conscious rats (Fig. 5C). Interestingly,
the amount of basal c waves was significantly lower under
neuroleptanalgesia (fentanyl+haloperidol: 100-500 mV2/Hz) than
under narcosis (only fentanyl: 200–800 mV2/Hz) (Fig. 5A,B and
D). However, under our acute experimental conditions, the typical
neuroleptic (300 mg/kg/h) did not prevent the psychotomimetic
action of ketamine and MK-801 on the background c oscillations
(Fig. 5C).
4. Ketamine and MK-801 produce generalized andpersistent aberrant c oscillations in cortical andsubcortical networks
In an attempt to assess the contribution of intracortical net-
works in the NMDAr antagonist-induced c hyperactivity recorded
Table 2. Properties (means6s.e.m.; N.60, 2 rats; Student’s t-test) of spontaneously occurring c oscillations during slow wavesunder urethane-anesthesia after a single subcutaneous (sc) injection of saline, ketamine (,10 min after injection) or MK-801(,20 min after injection).
URETHANE NaCl (0.9%, 1 ml/kg, sc) URETHANE ketamine (2.5 mg/kg, sc) URETHANE MK-801 (0.08 mg/kg, sc)
c power (mV2) 99.7369.91 1275.50681.61 P,0.0001 1445.11673.00 P,0.0001
FAMP (Hz) 41.0161.16 45.1160.46 P,0.0001 38.6960.55 P,0.0001
FAMP, frequency at maximal c power.doi:10.1371/journal.pone.0006755.t002
Figure 5. Ketamine or MK-801 increases the power of spontaneously occurring c oscillations under sedation. The two NMDArantagonists were tested under two sedative states, under fentanyl narcosis (A) or fentanyl-haldol neuroleptanalgesia (B). (A or B): 8-s episodes of thefrontoparietal ECoG (bandpass: 0.1–800 Hz) under three conditions (after subcutaneous (sc) injection of vehicle [NaCl 0.9%; control], ketamine[,15 min after injection of 2.5 mg/kg, sc] and MK-801 [,40 min after injection of 0.08 mg/kg, sc]). The desynchronized 1-sec bout indicated by agrey back is expanded below (C): The charts represent % changes in c power during a full recording session in a neuroleptanalgesied rat (left) and in afree-moving rat (right), which received a subcutaneous injection of ketamine. The chart of the free moving rat is contaminated by motion-inducedcable artifacts, especially at the beginning of the recording session. (D): Amount of basal c oscillations under narcosis (fentanyl; N = 250) andneuroleptanalgesia (fentanyl+haldol; N = 250). T-test with asterisk for p,0.0001.doi:10.1371/journal.pone.0006755.g005
Ketamine-Induced c Noise
PLoS ONE | www.plosone.org 6 August 2009 | Volume 4 | Issue 8 | e6755

in the surface ECoG, it was recorded simultaneously with an
underlying intracortical extracellular LFP in layer V under
sedated state (Fig. 6A). The present study demonstrates that
baseline c oscillations recorded in behaving or sedated rats share
similar properties and are similarly affected by non-competitive
NMDAr antagonists. From the raw paired ECoG-LFP recordings
obtained under neuroleptanalgesia or narcosis, 3 cases were
noticeable: simultaneous, near-synchronized (phase lag: 66 ms)
bouts of c oscillations in both the ECoG and the LFP (Fig. 6B1);
bouts of c oscillations in either the ECoG, or the LFP
(Fig. 6B2,B3). The intrinsic frequency of c oscillations in the
LFP was not significantly different to that of the surface ECoG
(respectively: 32.360.9 Hz and 34.761.2 Hz; N = 25; p.0.05).
Ketamine and MK-801 significantly increased to the same
proportion the power of c oscillations in both the surface ECoG
and in the underlying intracortical LFP (Fig. 6D). Cross-
correlation histograms revealed a noticeable correlation increase
between the surface ECoG and the underlying intracortical LFP
after injection of ketamine or MK-801 (Fig. 6E), with an
oscillation strength about tenfold lower than the full scale ( = 1)
and with a variable time lag (0–10 ms). The Pearson’s correlation
indicated that the degree of linear relationship between ECoG
and associated LFP FFT values was relatively small (,0.2) and
was significantly increased (up to 0.2–0.6) after systemic injection
of ketamine or MK-801 (Fig. 6F,G). Similar correlation degrees
were observed with LFP recordings in parietal, frontal and
prefrontal cortical areas, that is, at different distances from the
surface ECoG (not shown). Furthermore, two adjacent sub-
networks (e.g., layer V and VI – 200 mm apart - in a putative
column) of the frontoparietal cortex individually had a similar
relationship with the related surface ECoG but, on the other
hand, they could generate highly correlated ongoing c oscillations
(not shown). These experiments suggest that the surface ECoG
reflects the integration of ongoing c oscillations generated either
from a large-scale cortical network, or from multiple cortical
networks. High-resolution studies are required to understand the
vertical and horizontal spatio-temporal dynamics of the genera-
tion of ongoing rhythmic c waves in a given part of the
neocortex. Also, ketamine and MK-801 dramatically increased
the amount of c oscillations in the prefrontal cortex with a
pattern similar to that recorded in the frontoparietal cortex
(Fig. 7). The average intrinsic frequency of c oscillations in the
frontoparietal and prefrontal cortices is closely similar (in the
same experiment: 38.460.8 Hz and 40.560.7 Hz, respectively;
p.0.05).
To examine the possible contribution of subcortical systems in
the generation of ketamine-induced aberrant c activity, 1 or 2
distant subcortical sites were recorded along with the frontopari-
etal surface ECoG (minimum 2–3 rats/recording site). We
recorded in structures that are known to generate, under normal
conditions, c oscillations like the accumbens [21], amygdala [22],
basalis [23], hippocampus [24] and thalamus [25,26]. The
striatum was also recorded since it receives projections from the
frontoparietal cortex [27] and generates c oscillations during
movement initiation [28]. In the striatum of sedated, narcotized or
neuroleptanalgesied rats, ketamine and MK-801 increased the
amount of c oscillations (Fig. 7). Nevertheless, the pattern of
striatal rhythmic c waves was not as stereotyped as that displayed
by the frontoparietal and prefrontal cortices, probably because of
the simultaneous occurrence of higher-frequency (81–160 Hz)
oscillations in the striatum (Fig. 7B).
Systemic injection of ketamine or MK-801 dramatically
increased the amount of background c oscillations in many other
regions, including the zona incerta (Fig. S3), the substantia
innominata and lateral hypothalamus (not shown). For instance,
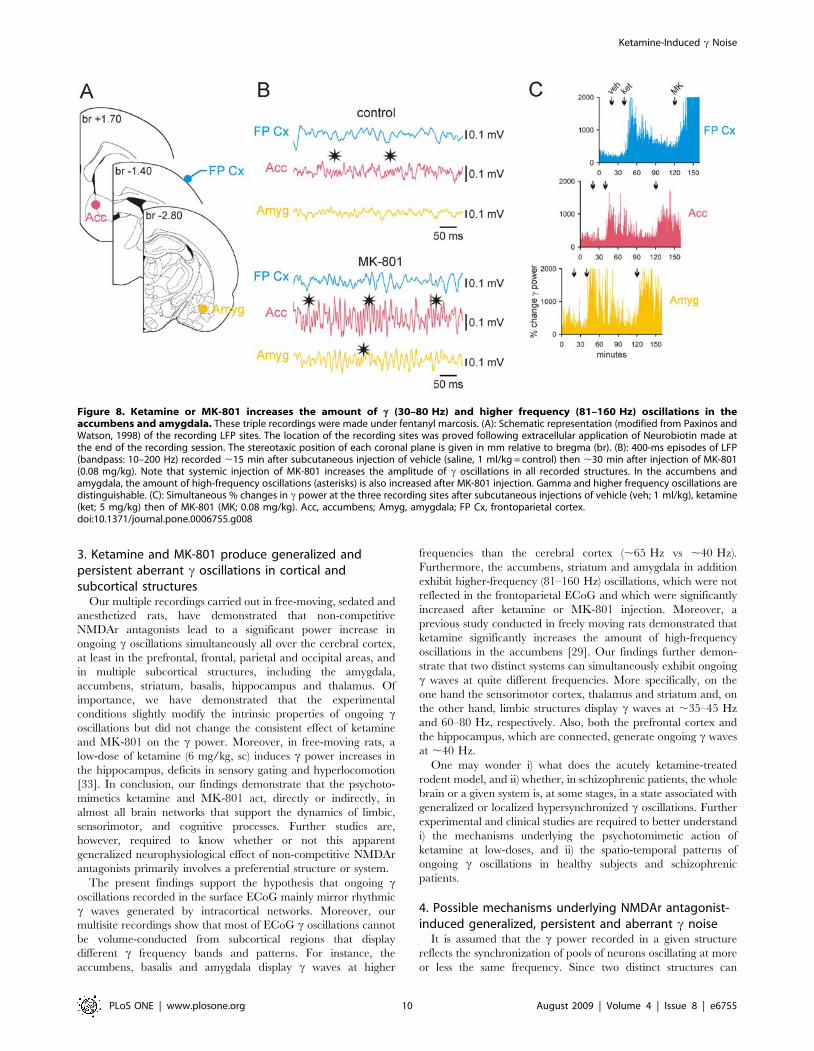
both the amygdala and the accumbens exhibited c oscillations
with similar properties (time of occurrence, duration and
amplitude) but dissimilar to those recorded simultaneously in the
frontoparietal ECoG (Fig. 8B). More specifically, the intrinsic
frequency of these two deep limbic structures (67.260.9 Hz and
65.561.5 Hz, respectively; these two values are not significantly
different: p.0.05) was significantly higher than that of the
associated cortical c oscillations (40.260.7 Hz; Student t test,
p,0.001) (Fig. 9). In addition, the accumbens and amygdala
simultaneously displayed episodes of high frequency (81–160 Hz)
oscillations, which were also increased in power after ketamine or
MK-801 injection (Fig. 8, Fig. 9). The observed differences in cproperties between the cortical and these two deep limbic
structures do not support the hypothesis that bursts of c oscillations
recorded in the cortex were volume conducted from the
accumbens and amygdala. On the other hand, these recordings
consistently demonstrated that these two structures roughly
displayed the same pattern of c and higher frequency oscillations,
especially after ketamine or MK-801 injection (Fig. 8B), probably
because of their anatomical connections. High-resolution ana-
tomo-functional studies are required to understand whether
ketamine-induced c hyperactivity first started in the accumbens,
amygdala, or simultaneously in both structures.
Most nuclei of the thalamus, including the associative (e.g.,
posterior group), limbic, motor and sensory nuclei that are related
to the frontoparietal cortex, increased their basal c activity after
injection of ketamine or MK-801 (Fig. S3). Ketamine-induced
increases in rhythmic c waves were also recorded in the thalamic
reticular nucleus (not shown). Further studies are however
required to know whether or not NMDAr antagonists have a
primary site (cortical or thalamic) of action in corticothalamic
systems.
Discussion
The present study demonstrates 1) that a single systemic injection
of a low-dose of ketamine produces temporally correlated
hyperlocomotion and generalized persistent aberrant c oscillations;
Table 3. Properties (means6s.e.m.; N.80, 4 rats; Student’s t-test) of spontaneously occurring c oscillations during desynchronizedstates under fentanyl-haldol neuroleptanalgesia (SEDATION) after a single subcutaneous (sc) injection of saline (,15 min),ketamine (,15 min) or MK-801 (,30 min).
SEDATION NaCl (0.9%, 1 ml/kg, sc) SEDATION ketamine (2.5 mg/kg, sc) SEDATION MK-801 (0.08 mg/kg, sc)
c power (mV2) 157.5562.67 417.5163.11 P,0.0001 491.2564.18 P,0.0001
FAMP (Hz) 35.0560.52 41.4861.83 P,0.0001 39.2761.03 P,0.0001
FAMP, frequency at maximal c power.doi:10.1371/journal.pone.0006755.t003
Ketamine-Induced c Noise
PLoS ONE | www.plosone.org 7 August 2009 | Volume 4 | Issue 8 | e6755

Figure 6. Ketamine or MK-801 increases the c power in intracortical networks. These paired recordings were made underneuroleptanalgesia. (A): Experimental design showing simultaneous recordings of the extracellular local field potential (LFP) in the depth (layer Vand VI) of the frontoparietal (or sensorimotor) cortex and of the related surface ECoG in sedated rats. The LFP is recorded with a glass micropipette(tip diameter: 7–15 um) containing ACSF and Neurobiotin (1%). At the end of the recording session, the neuronal tracer is applied using extracellulariontophoresis (+600 nA, 200 ms on, 200 ms off, for 10 min). The tracer is revealed using a standard ABC-DAB procedure [73]. The microphotograph,expanded in the inset, reveals the track of the micropipette and multiunit labeling at the recording site (black arrowhead). (B1–B3): Three 500-msepisodes of paired ECoG-LFP recordings showing either simultaneous c bouts (B1, gray area), a c bout only in the ECoG (B2, gray area), or a c boutonly in the LFP (B3, gray area). On the top, the numbers give the probability of occurrence of each pattern (semi-quantitative analysis with N.100from 3 experiments). (C): 500-ms episodes under control (vehicle), ketamine (,15 minutes after subcutaneous injection of 2.5 mg/kg), then MK-801(,30 minutes after subcutaneous injection of 0.1 mg/kg) conditions. The intracortical LFP and the surface ECoG are recorded with a bandpass of 10–100 Hz. (D): Each chart shows the evolution of the c power (FFT) in the ECoG (left) and intracortical LFP (right) during a 12-s period under control(saline; thick line) and ketamine (2.5 mg/kg; dotted line) conditions. Note that ketamine simultaneously increases the c power in both the intracorticalLFP and the surface ECoG. (E): Average cross-correlation histogram between the ECoG (reference) and the underlying LFP (means of 76200 ms). Notethat ketamine increases the c rhythmicity (arrowheads) simultaneously in the surface ECoG and the related intracortical LFP. (F): Pearson’s correlation(Pcc) of continuous FFT values (N.100) in c power. As indexed by degree of linear correlation, the coherence in c power between ECoG and LFPincreases after ketamine injection (t test of Bonferroni; p). (G) Pearson’s correlation coefficients (Pcc) under different conditions (control, ketamine[,15 min after 2.5 then 5 mg/kg subcutaneous injection], post-ketamine [.45 min], and MK-801 [,30 min after 0.1 mg/kg subcutaneous injection])from 6 experiments (asterisks when Bonferroni p,0.05; ns, non-significant). Ketamine exerts an apparent dose-effect on the c power coherence.doi:10.1371/journal.pone.0006755.g006
Ketamine-Induced c Noise
PLoS ONE | www.plosone.org 8 August 2009 | Volume 4 | Issue 8 | e6755

2) that these pathophysiological c waves are not caused by conscious
sensorimotor processing underlying hyperlocomotion-related brain
state; 3) that the ECoG mainly reflects c oscillations recorded in
intracortical networks; 4) that they occur all over the cerebral cortex
and in multiple subcortical structures, including sensory, motor,
limbic and associative/cognitive systems, and 5) that NMDAr
antagonist-induced ongoing c hyperactivities can be recorded under
diverse consciousness states.
1. NMDAr antagonist-induced c hyperactivities are notcaused by conscious sensorimotor processing underlyingabnormal motor behavior
Non-competitive NMDAr antagonist-induced persistent chyperactivity was recorded under diverse brain states: in conscious
freely moving rats and in deeply modified states of consciousness.
They were obtained during continuous administration of an
anesthetic (urethane or pentobarbital) or sedative substances
(fentanyl and haloperidol). Therefore our results demonstrate that
the frontoparietal (or sensorimotor) c hyperactivity and hyperlo-
comotion are two independent effects of administration of low-
dose (,5 mg/kg) of non-competitive NMDAr antagonists. Our
experiments made in anesthetized and sedated rats thus provide
strong evidence that the NMDAr antagonist-induced c hyperac-
tivity was not the consequence of conscious sensorimotor
processing, nor is it directly linked to the motor effects seen in
freely moving rats (i.e. ataxic-like behavior and hyperlocomotion),
which may not occur to the same extent in humans with ketamine-
induced psychosis. Furthermore, our multisite recordings have
demonstrated that the NMDAr antagonist-induced c hyperactivity
is a generalized phenomenon, not specific to sensorimotor systems.
2. Is hyperlocomotion-related brain state a psychoticstate?
The non-anesthetic low-doses of ketamine that were used here
to produce hyperlocomotion and aberrant c oscillations are an
order of magnitude lower and less toxic than those used in earlier
studies [29–32]. Also, the doses of ketamine used in the present
work (also see Pinault, 2008) are similar to those that induce
cognitive deficits in humans [8–11]. In rodents, such a dose
induces sensory gating impairment [33] and memory deficit
[34,35]. Of importance, the kinetics of the ketamine action on
behavior and basal c oscillations are quite consistent with plasma
and brain half-life measured following injection of ketamine [36].
These recent findings, and the present demonstration that
hyperlocomotion and c hyperactivity on EEG, are two indepen-
dent effects of low-dose ketamine administration leave open the
question about the nature of the ketamine-induced abnormal
brain state associated with c hyperactivity in rodents and their
possible relevance to psychotic symptoms in humans. Electro-
clinical data suggest that hypersynchronized c oscillations may be
associated with hallucinations (see below). Moreover, ketamine is
also used as a recreative substance causing psychological
dissociation [37]. However, further studies that investigate the
effect of anti-psychotic medications would be helpful to more
firmly establish the link between this electrophysiological finding
and psychosis.
Figure 7. Ketamine or MK-801 increases the amount of c oscillations in the prefrontal cortex and striatum. These triple recordings weremade under fentanyl marcosis. (A): Schematic representation (modified from Paxinos and Watson, 1998) of the recording LFP sites. The stereotaxicposition of each coronal plane is given in mm relative to bregma (br). The microphotographs show the location of the recording sites, which wasproved following extracellular application of Neurobiotin made at the end of the recording session. The upper-right inset shows, at highermagnification, the apical dendrites of pyramidal neurons of layer V, the location of the recording site (multiunit labeling). (B): 1-s episodes of LFP(bandpass: 10–200 Hz) recorded ,15 min after subcutaneous injection of vehicle (saline, 1 ml/kg = control) then ,20 min after injection of ketamine(5 mg/kg). Note that systemic injection of ketamine increases the amplitude of c oscillations in all recorded structures. High-frequency (81–160 Hz)oscillations are also increased in the striatum and prefrontal cortex (asterisks). (C): Simultaneous % changes in c power at the three recording sitesafter subcutaneous injections of vehicle (veh; 1 ml/kg), ketamine (ket; 5 mg/kg) then of MK-801 (MK; 0.08 mg/kg). CPu, caudate putamen; PrF Cx,prefrontal cortex; FP Cx, frontoparietal cortex.doi:10.1371/journal.pone.0006755.g007
Ketamine-Induced c Noise
PLoS ONE | www.plosone.org 9 August 2009 | Volume 4 | Issue 8 | e6755
3. Ketamine and MK-801 produce generalized andpersistent aberrant c oscillations in cortical andsubcortical structures
Our multiple recordings carried out in free-moving, sedated and
anesthetized rats, have demonstrated that non-competitive
NMDAr antagonists lead to a significant power increase in
ongoing c oscillations simultaneously all over the cerebral cortex,
at least in the prefrontal, frontal, parietal and occipital areas, and
in multiple subcortical structures, including the amygdala,
accumbens, striatum, basalis, hippocampus and thalamus. Of
importance, we have demonstrated that the experimental
conditions slightly modify the intrinsic properties of ongoing coscillations but did not change the consistent effect of ketamine
and MK-801 on the c power. Moreover, in free-moving rats, a
low-dose of ketamine (6 mg/kg, sc) induces c power increases in
the hippocampus, deficits in sensory gating and hyperlocomotion
[33]. In conclusion, our findings demonstrate that the psychoto-
mimetics ketamine and MK-801 act, directly or indirectly, in
almost all brain networks that support the dynamics of limbic,
sensorimotor, and cognitive processes. Further studies are,
however, required to know whether or not this apparent
generalized neurophysiological effect of non-competitive NMDAr
antagonists primarily involves a preferential structure or system.
The present findings support the hypothesis that ongoing coscillations recorded in the surface ECoG mainly mirror rhythmic
c waves generated by intracortical networks. Moreover, our
multisite recordings show that most of ECoG c oscillations cannot
be volume-conducted from subcortical regions that display
different c frequency bands and patterns. For instance, the
accumbens, basalis and amygdala display c waves at higher
frequencies than the cerebral cortex (,65 Hz vs ,40 Hz).
Furthermore, the accumbens, striatum and amygdala in addition
exhibit higher-frequency (81–160 Hz) oscillations, which were not
reflected in the frontoparietal ECoG and which were significantly
increased after ketamine or MK-801 injection. Moreover, a
previous study conducted in freely moving rats demonstrated that
ketamine significantly increases the amount of high-frequency
oscillations in the accumbens [29]. Our findings further demon-
strate that two distinct systems can simultaneously exhibit ongoing
c waves at quite different frequencies. More specifically, on the
one hand the sensorimotor cortex, thalamus and striatum and, on
the other hand, limbic structures display c waves at ,35–45 Hz
and 60–80 Hz, respectively. Also, both the prefrontal cortex and
the hippocampus, which are connected, generate ongoing c waves
at ,40 Hz.
One may wonder i) what does the acutely ketamine-treated
rodent model, and ii) whether, in schizophrenic patients, the whole
brain or a given system is, at some stages, in a state associated with
generalized or localized hypersynchronized c oscillations. Further
experimental and clinical studies are required to better understand
i) the mechanisms underlying the psychotomimetic action of
ketamine at low-doses, and ii) the spatio-temporal patterns of
ongoing c oscillations in healthy subjects and schizophrenic
patients.
4. Possible mechanisms underlying NMDAr antagonist-induced generalized, persistent and aberrant c noise
It is assumed that the c power recorded in a given structure
reflects the synchronization of pools of neurons oscillating at more
or less the same frequency. Since two distinct structures can
Figure 8. Ketamine or MK-801 increases the amount of c (30–80 Hz) and higher frequency (81–160 Hz) oscillations in theaccumbens and amygdala. These triple recordings were made under fentanyl marcosis. (A): Schematic representation (modified from Paxinos andWatson, 1998) of the recording LFP sites. The location of the recording sites was proved following extracellular application of Neurobiotin made atthe end of the recording session. The stereotaxic position of each coronal plane is given in mm relative to bregma (br). (B): 400-ms episodes of LFP(bandpass: 10–200 Hz) recorded ,15 min after subcutaneous injection of vehicle (saline, 1 ml/kg = control) then ,30 min after injection of MK-801(0.08 mg/kg). Note that systemic injection of MK-801 increases the amplitude of c oscillations in all recorded structures. In the accumbens andamygdala, the amount of high-frequency oscillations (asterisks) is also increased after MK-801 injection. Gamma and higher frequency oscillations aredistinguishable. (C): Simultaneous % changes in c power at the three recording sites after subcutaneous injections of vehicle (veh; 1 ml/kg), ketamine(ket; 5 mg/kg) then of MK-801 (MK; 0.08 mg/kg). Acc, accumbens; Amyg, amygdala; FP Cx, frontoparietal cortex.doi:10.1371/journal.pone.0006755.g008
Ketamine-Induced c Noise
PLoS ONE | www.plosone.org 10 August 2009 | Volume 4 | Issue 8 | e6755

Figure 9. Ketamine increases the amount of ongoing c oscillations in the prefrontal cortex and subcortical structures. Left panel:Schematic representation (modified from Paxinos and Watson, 1998) of the recording LFP sites. The location of the recording sites was proved followingextracellular application of Neurobiotin made at the end of the recording session. The stereotaxic position of each coronal plane is given in mm relativeto bregma (br). Right panel: 1-s episodes of LFP recorded (bandpass: 10–200 Hz) under fentanyl sedated state ,15 min after subcutaneous injection ofvehicle (saline, 1 ml/kg = control) then ,15 min after injection of ketamine (5 mg/kg). Note that systemic injection of ketamine increases the amplitudeof c (30–80 Hz) oscillations in all recorded structures (1–2 subcortical sites recorded simultaneously with the frontoparietal surface ECoG). In theaccumbens, basalis and striatum, the amount of high-frequency oscillations (81–160 Hz; asterisks) is also increased after ketamine injection. For eachrecording site, the average internal frequency of c oscillation (6sem) is determined from 25 100-ms episodes. This frequency is compared with thatmeasured in the corresponding frontoparietal ECoG (Student t test; ns, non-significant). The internal frequency of c oscillations recorded in thefrontoparietal cortex varies from 30 to 50 Hz (40.260.7 Hz). The measured average frequencies do not include high-frequency oscillations that wererecorded especially in the accumbens, basalis and striatum (asterisks). Cx, cortex; DG, dendate gyrus; VL, ventral lateral.doi:10.1371/journal.pone.0006755.g009
Ketamine-Induced c Noise
PLoS ONE | www.plosone.org 11 August 2009 | Volume 4 | Issue 8 | e6755
oscillate at different c frequencies, it is reasonable to say that the
generalized action of NMDAr antagonists induced c hypersyn-
chronies or aberrant c noise.
Ketamine-induced, persistent and aberrant c noise represents a
general phenomenon since it can be recorded in free-moving rats,
under narcosis, neuroleptanalgesia and urethane-anesthesia and,
to a lesser extent, under pentobarbital anesthesia. This strongly
indicates that ongoing c oscillations and their increase by NMDAr
antagonists are underlain by similar mechanisms. Interestingly,
under pentobarbital, the amount and persistent character of coscillations was significantly lower than those recorded under the
other conditions. This might be explained by the barbiturate-
induced prolongation of the decay time of GABA(A)r-mediated
IPSPs [38].
The present study further demonstrates that NMDAr antago-
nist-induced c hypersynchronies simultaneously occur in cortical
and subcortical structures, at least in those having cellular and
network properties to generate c oscillations under physiological
conditions (see references in results). The current literature
suggests that c oscillations may be a biomarker of the collective
activity of networks of GABAergic interneurons [39–41]. It is
worth mentioning that corticothalamic systems are composed of
neurons with pacemaker properties in the c frequency band
[25,26,42,43], which could interfere with oscillating cortical
networks.
The possible mechanisms underlying NMDAr antagonist-
induced c hypersynchronies are unknown [44]. Multi-unit
recordings in the prefrontal cortex of control and MK-801-treated
awaked rats revealed opposite effects on the firing of fast spiking
and regular spiking neurons [45]. These data suggest that
disinhibition of GABAergic interneurons that control the firing
of pyramidal neurons might be secondary to NMDAr hypofunc-
tion, leading to hyperexcitation of glutamatergic neurons. Such
disinhibition might be due to a direct blockade of NMDAr in
interneurons and/or to a blockade of presynaptic, NMDA-
dependent release of glutamate [46,47]. The action of ketamine
might also involve a-amino-3-hydroxy-5-methylisoxazole-4-pro-
pionic acid (AMPA) receptor throughput [48].
Further studies are required to determine whether the
pathophysiological c hypersynchronies result from a direct or
downstream effect of the non-competitive NMDAr antagonists.
Supposing that the effect is direct, it would be important to identify
the primary site of action of such antagonists in neural networks,
which are mainly composed of GABAergic, glutamatergic
neurons, and glial cells. Indeed, NMDA can activate not only
neurons but also glial cells [49]. The latter elements play a great
role in neuronal synchrony, for instance via extrasynaptic NMDAr
[50]. It is also tempting to put forward the hypothesis that
ketamine blocks astrocytic NMDAr and subsequently the
astrocytic release of D-serine, a potential target for a new
generation of antipsychotics [51].
We cannot exclude that the psychotomimetics ketamine and
MK-801 also bind at other receptors, especially on dopaminergic
and serotoninergic receptors [52,53]. In our previous study, the
slight but statistically significant c hyperactivity following activa-
tion of dopaminergic receptors in conscious rats does not explain
the transient important effect induced by these psychotomimetics
on the generalized c hypersynchronies [12]. The fact that the
power of ongoing c oscillations is higher under anesthesia (also see
Vanderwolf, 2000) suggests that the normal behavior and
consciousness exert a certain ‘‘inhibitory control’’ in the
generation of ongoing c oscillations.
It is worth noting that, in humans, ketamine also interacts with
GABA(A)a2 receptors, at least in the dorso-medial prefrontal
cortex [54]. Interestingly, GABA(A)a2 receptor agonists improve
cognition and increase the power of induced (not time-locked to
stimulus; also see below) c oscillations in the frontal cortex of
schizophrenic patients [55].
5. Functional impact of ongoing pathophysiological cnoise
Here it has been demonstrated that, in rodents, the psychoto-
mimetics ketamine and MK-801 acutely disturb the brain state
characterized by generalized ongoing c hypersynchronies in
cortical and subcortical, sensorimotor, limbic and cognitive
networks. All these systems are affected in patients with
schizophrenia [56]. In humans, non-competitive NMDAr antag-
onists induce cognitive impairments and schizophrenia-like
symptoms (see references in introduction). So the present findings
raise important issues relevant to the understanding of the link
between ketamine-induced generalized and persistent c hyperac-
tivity and the symptoms and abnormalities of c oscillations in
schizophrenia. One major issue is the type of c oscillations in
question. At least four types of c activity should be considered: 1)
Spontaneously-occurring or ongoing c oscillations (or normal cnoise), which is usually recorded during desynchronized state of
the electroencephalogram (the current study, [12,57,58]), 2) csteady-state response [59], 3) Evoked c response, which is phase-
locked to the stimulus onset [60], and 4) Cognition or perception-
related induced coherent synchronized c oscillations [61,62,58]. In
healthy subjects or patients with schizophrenia, it is the latter type
that is usually referred to, which represents high-order task-related
ephemeral and synchronized c oscillations. The c steady-state
response is also altered in schizophrenic patients [63]. One may
thus predict that ongoing c noise may, under certain circum-
stances, modulate steady state, evoked and/or induced rhythmic cwaves (see below).
The research conducted so far is conflicting regarding the
relation between c oscillations and schizophrenic symptoms.
Increases and decreases in c oscillations (power and frequency)
have been reported in schizophrenic patients during a given
mental task [64,65,66,67]. The human literature in particular is
confounded by technical difficulties, including the head regions of
the recordings, the nature of the symptoms, and on the effects of
anti-psychotic drug treatment. The purpose of this study was not
to address the relationship between abnormal c activity on the
EEG and psychotic symptoms, but rather to address the
relationship between the c hyperactivity and hyperlocomotion
induced by low dose ketamine. The relevance between these and
psychosis is inferential, in that equivalent doses of ketamine are
known to induce psychotic symptoms in humans.
In an attempt to make a link of these clinical data with our
findings, it is tempting to put forward a prediction. In the present
study, we have demonstrated that non-competitive NMDAr
antagonists lead to ongoing, generalized and persistent, aberrant
c oscillations. This indicates that the normal, low-amplitude cnoise is pharmacologically metamorphosed into an aberrant, high-
amplitude c noise. In humans, if such abnormal c noise does exist,
it would drown the transient (evoked and/or induced) c responses,
for instance the cognition-related coherent c synchrony. In other
words, such aberrant noise would decrease or annihilate the csignal-to- c noise ratio of task-related transient c synchronies. So if
the aberrant c noise disrupts ephemeral synchronized c oscilla-
tions, which are thought to contribute to high-order brain
operations, it would cause cognitive dysfunction. In other words,
in schizophrenic patients ongoing c hypersynchrony would disrupt
functional (e.g., sensorimotor) integration in highly distributed
systems and disintegrate psychic processes. This prediction may be
Ketamine-Induced c Noise
PLoS ONE | www.plosone.org 12 August 2009 | Volume 4 | Issue 8 | e6755

applied to perception- and working memory-related induced coscillations [68]. However, validation of this prediction in humans
requires specific clinical experiments to be performed. Our
prediction is indirectly supported by a clinical study showing that
GABA(A)a2 agonists improve cognition and increase the power of
induced c oscillations in schizophrenic patients [55].
Does abnormal c noise (ongoing hypersynchronized c oscilla-
tions) exist in schizophrenic patients? Is ongoing c hyperactivity
related to positive and/or negative symptoms? Although there is
no conclusive evidence that ongoing, generalized or localized,
aberrant c noise is a hallmark of schizophrenia, increased csynchrony has been recorded in patients during somatic and visual
hallucinations [69,70,71,66].
Materials and Methods
Forty-six adult male Wistar rats (250–350 g) were used in
accordance with Australian and European guidelines (directive
86/609/EEC) and were approved by the Animal Ethics
Committees of Medicine (RMH) University of Melbourne
(#0701821) and of University Louis Pasteur/University of
Strasbourg (CREMEAS, AL/03/15/12/05). All efforts were
made to avoid animal suffering and use the minimal number of
animals to produce reliable data. Rats were maintained in 12-h
light/dark cycle, illuminated from 07:00 to 19:00 h with food and
water available ad libitum. Experiments in freely moving rats were
performed during the light phase (09:00–17:00 h), and those in
anesthetized unconscious rats were carried out in 09:00–20:00 h.
DrugsKetamine was obtained from Merial (Lyon, France) and from
Troy Laboratories PTY Limited (NSW, Australia), MK-801 and
D-Tubocurarine chloride from Sigma-Aldrich (Saint-Quentin
Fallavier, France; NSW, Australia), pentobarbital from Sanofi
(Libourne, France), fentanyl and haldol from Janssen (Boulogne-
Billancourt, France). Xylazine was obtained from Sigma-Aldrich
PTY. LTD (NSW, Australia). All drugs were dissolved in
physiological saline (NaCl, 0.9%).
Surgery for chronic experimentsRats (N = 8) were anesthetized with xylazine (10 mg/kg, i.p.)
and ketamine (75 mg/kg, i.p.) and positioned in a stereotaxic
frame. A single midline incision was made over the scalp and six
holes were drilled through the skull for stereotaxic [72]
implantation of recording brass electrodes (2 mm anterior and
2 mm lateral to bregma bilaterally (active electrodes); 2 mm
posterior and 2 mm lateral to bregma bilaterally (ground
electrodes); and 2 mm posterior and 2 mm lateral to lambda
bilaterally (reference electrodes). The electrodes were screwed into
the skull without breaching the dura, and dental cement was
applied to fix the electrodes in place. The animals were then
placed in separate cages for 7-days recovery with food and water
ad libitum prior to the pharmacological experiments.
In a second series of chronic experiments, two stainless steel
screws were implanted under stereotaxic guidance extradurally
either over the frontal (or motor; from bregma: 1 mm anterior and
2 mm lateral) and parietal (or somatosensory; 21 mm posterior and
4 mm lateral) cortices (4 rats), or over the frontal and occipital (or
visual; 25 mm posterior and 2 mm lateral) cortices (3 rats). Surgery
was made under deep anesthesia (pentobarbital: 40 mg/kg, i.p. and
ketamine: 50 mg/kg, i.m.). Two additional screws were fixed in the
frontal bone for ground connection and in the skull over the
cerebellum for reference. The screws were connected to a
subminiature connector fixed to the skull with dental cement.
Surgery and experimental conditions for acuteexperiments
Surgical procedures were made under deep general anesthesia
with pentobarbital (40 mg/kg, i.p.) and ketamine (50 mg/kg, i.m.)
and under stereotaxic conditions. For the recording session, this
anesthesia was discontinued and the rat was maintained under one
of these four states: 1) deep anesthesia induced by urethane (1.5 g/
kg, i.p.; 4 rats); 2) deep barbiturate–fentanyl anesthesia (7 rats)
induced by continuous intravenous injection (0.5 ml/h) of the
following mixture (quantity given per hour for a rat of 300 g):
fentanyl (1 mg), pentobarbital (3.5–8.2 mg) and glucose (25 mg);
3) neuroleptanalgesia (12 rats) produced by continuous intrave-
nous injection of the following mixture (quantity given per hour for
a rat of 300 g): fentanyl (1 mg), haldol (100 mg) and glucose
(25 mg); 4) Sedated narcotized state (8 rats) induced by continuous
intravenous injection of the following mixture (quantity given per
hour for a rat of 300 g): fentanyl (2 mg) and glucose (25 mg).
Muscle rigidity and tremors were blocked with intravenous
administration of D-Tubocurarine chloride (0.4 mg/hr). The rats
were artificially ventilated in the pressure mode (8–12 cm H2O;
60 bpm) using an O2-enriched gas mixture (50% air-50% O2).
The rat’s rectal temperature was maintained at its physiological
level (37–38.3uC) using a thermoregulated blanket. The electro-
corticogram (ECoG) and the heart rate were also under
continuous monitoring to maintain a steady depth of anesthesia
or sedation either by giving a bolus or adjusting the injection rate
of the anesthetizing or sedating mixture. The depth of anesthesia
was ascertained by the occurrence of slow waves in the ECoG.
Recording sessions started 3 hours after state induction. Local
anesthetic (lidocaine, 2%) was infiltrated in all surgical wounds
every 2 hours.
ECoG and locomotion in freely moving ratsOn the day of testing, rats were brought into the behavioral
testing facility 30 minutes prior to experimentation to allow
habituation to the environment. They were then individually
placed into an open arena (1 m diameter) with the recording
electrodes attached to a cable suspended from the ceiling to record
the ECoG. The rat was allowed to explore the arena for 30 minutes
after which they were subcutaneously (sc) injected with either
ketamine (2.5 and 5 mg/kg), MK-801 (0.08 and 0.16 mg/kg), or
vehicle (0.9% NaCl) and returned to the arena for a further 90
minutes. This procedure was repeated on subsequent days with a
different drug treatment until each rat had received each dose of
each drug. During the 120-minutes recording period, the animal’s
locomotor activity was continuously video-tracked and objectively
assessed using Ethovision Software (NoldusH, Netherlands). The
total distance travelled (i.e. locomotion) was calculated every 2
seconds during the entire recording session.
ECoG and local field potential (LFP) recordings, and druginjection under acute conditions
The monopolar frontoparietal ECoG was recorded with silver
wire (diameter: 150 mm) insulated with teflon (inserted in the bone
without contact with the dura mater; see Fig. 4A) and connected to
an ultralow noise amplifier (AI 402, x50; Axon Instruments,
subsidiary of Molecular Devices, Sunnyvale, California, USA).
The reference electrode (set to ground) was inserted into the
occipital crest). Multiple subcortical LFP recordings were obtained
with glass micropipettes filled with ACSF-Neurobiotin (1%).
Ketamine or MK-801 and the corresponding vehicle (0.9% NaCl)
were subcutaneously administered (1 ml/kg) or intravenously
(maximal injection volume = 0.25 ml; injection time: ,2 min;
Ketamine-Induced c Noise
PLoS ONE | www.plosone.org 13 August 2009 | Volume 4 | Issue 8 | e6755
see Fig. S2 and S3). At the end of the recording session,
extracellular iontophoresis of Neurobiotin was achieved with
positive current pulses (200 ms on/200 ms off; +600 nA during
5 min) delivered by a microiontophoresis current generator (SYS-
260; WPI, Sarasota, FL, USA). After a survival time (,60 min) the
animals were euthanized with a lethal dose of pentobarbital; their
brain were fixed transcardially with 4% paraformaldehyde,
removed and processed for histology to reveal the neuronal tracer
(Neurobiotin) for localization and identification of the recording
sites using standard procedures.
Signal conditioningIn freely-moving rats, the bilateral ECoG was processed using
an electro-encephalographic hardware/software (Chart V 3.5,
ADI Instruments, Mac Lab) with a bandpass of 1–1000 Hz and
digitized at 1.0 kHz. The line power 50 Hz noise was eliminated
from the signal using selective filters (Humbugs; Digitimer,
Letchworth Garden City, UK). In acute experiments, the ECoG
and LFP were processed with a bandpass of 0.1–800 Hz and
digitized at 10 kHz (Clampex, v7, Axon Instruments).
Quantitative and statistical data analysesECoG data from freely moving rats were analyzed using
NEUROSCANH software (Compumedics, Melbourne, Australia).
Using Fast Fourier Transformations (FFT), average power in the cfrequency band (30–80 Hz) was determined for each 2.05 sec
epoch for the entire duration of the recording period. For both cpower and locomotor activity data, the values obtained during the
30-minutes pre-injection period were averaged for each individual
animal, and all recorded values then expressed as a percent
change of this response. Two endpoints were quantified for
statistical comparison for both the c power analyses and the
locomotor activity measurements: the peak drug response and the
total drug response as assessed by measuring the area under the
curve (AUC). Peak responses were compared using one-way
ANOVA with repeated measures (dose of drug). AUC measures
were calculated by determining at which times the trace acquired
from the highest drug dose increased .2 standard deviations
above the vehicle-treated trace. Total area was then calculated
during these periods. For ketamine-treated rats, this represented
the period starting at the time of drug injection and ceasing after
30 minutes, and for rats treated with MK-801, this period began
10 minutes after the injection and persisted until the end of the
recording period. For correlation analyses, data were split into
three 30-min blocks after drug treatment. Group mean c power
measures at each two minute time point were related with the
corresponding group mean locomotor activity, and Spearman’s
correlation coefficients (r) were then calculated for each time
window for each drug. For statistical analyses, correlation
coefficients were calculated for each individual rat following each
drug for the same 30-minute blocks, and group means calculated
for each time window. Statistical comparison of the mean
correlation coefficients for each drug was then performed using
one-way ANOVA with repeated measures for each time window,
using Dunnett’s post-hoc analysis if appropriate comparing
ketamine and MK-801 to vehicle. Data were analyzed using
Statistica softwareH (Tulsa, OK) and statistical significance was set
at p,0.05 in all cases.
The FFT of ECoG recordings from acute experiments were
computed using DataWave softwares (SciWorks, v4, DataWave
Technologies, Berthoud, CO, USA). Spectral analysis was based
on 1.6-s epochs, with a resolution of 0.610 Hz and with a
hamming window to prevent spectral leakage. The 50 Hz values
were discarded to avoid contamination from possible AC noise.
The sum of the 30–49 Hz and 51–80 Hz FFT values gave the
total power of c oscillations (30–80 Hz). The frequency at
maximal power was also extracted. Thereby, properties of coscillations recorded before and after the administration of a given
agent (vehicle or substance) could be compared. They were
evaluated for statistical significance using Student’s t-test, the
significance level being set to 0.05.
The degree of linear relationship between continuous FFT
values (N.100) of c oscillations recorded in two regions (surface
ECoG and underlying intracortical LFP) was assessed using the
Pearson’s correlation (implemented with Bonferroni probability).
Thereby, the Pearson’s correlation coefficient gave an index of the
coherence of c oscillations between these two regions.
Data are presented as means6s.e.m.
Supporting Information
Figure S1 Pattern of ECoG c oscillations under different
experimental conditions. Typical 1-sec ECoG episodes under
drug-free awaked condition (FREE), fentanyl-haldol neuroleptan-
algesia (SEDATION), urethane-anesthesia and pentobarbital-
fentanyl (PENTO) anesthesia.
Found at: doi:10.1371/journal.pone.0006755.s001 (0.03 MB
PDF)
Figure S2 Ketamine or MK-801 dose-dependently increases the
power of ongoing c oscillations under neuroleptanalgesia. (A), (B1)
and (B2) are from three experiments under fentanyl-haldol
neuroleptanalgesia. (A): Changes in c power during a full
recording session under 3 different conditions, vehicle (NaCl),
ketamine, and MK-801 (sc, subcutaneous injection). (B1 or B2):
Changes in c power during a recording session, during which the
rat received intravenous (iv) injections (increasing doses; arrows) of
ketamine (B1) or MK-801 (B2).
Found at: doi:10.1371/journal.pone.0006755.s002 (0.06 MB
PDF)
Figure S3 A single intravenous injection of ketamine (0.5 mg/
kg) quickly increases the power of c oscillations in the
frontoparietal cortex, hippocampus, thalamus and zona incerta.
(A): Experimental design (dorsal and coronal views): In these
experiments (N = 3), the frontoparietal (FP) ECoG (or FP cx) and
the hippocampal (dentate gyrus or DG) LFP recordings were
permanent. On the other hand, a Neurobiotin-ACSF-filled
micropipette (tip diameter: 3–7 mm) was moved down in
subcortical structures, including the thalamus (Th) and zona
incerta (ZI). At the end of the recording session, the neuronal
tracer is applied using extracellular iontophoresis (+600 nA,
200 ms on, 200 ms off, for 10 min). The tracer is revealed using a
standard ABC-DAB procedure (Pinault, 1996). The microphoto-
graphs reveal the location of the recording sites (black spots). (B):
The left and right panels show % change in c power measured
from two successive triple recording sessions, FPcx-DG-Th and
FPcx-DG-ZI. The second intravenous injection of ketamine was
made more than 2 hours after the first injection. Note that
ketamine increases the c power simultaneously at all recording
sites. (C): The charts show the quick increase in c oscillations
during the first 2 minutes that followed the onset of intravenous
injection of ketamine. The grey areas indicate the period during
which ketamine was intravenously injected. Each point is the
average of 12–15 successive FFT values (6sem) of c power. Note
that, at all recording sites, the c power starts to increase during
ketamine injection.
Found at: doi:10.1371/journal.pone.0006755.s003 (0.12 MB
PDF)
Ketamine-Induced c Noise
PLoS ONE | www.plosone.org 14 August 2009 | Volume 4 | Issue 8 | e6755

Acknowledgments
We thank Margaret Morris for fruitful discussions, Yoshinori Masuo for
critical reading of a previous version of the manuscript, and Nelly Boehm
for microphotographs.
Author Contributions
Conceived and designed the experiments: NCj MS TJO DP. Performed
the experiments: TH NCJ EAT JG JC DP. Analyzed the data: TH NCJ
EAT JG JC DP. Contributed reagents/materials/analysis tools: NCJ MS
TJO DP. Wrote the paper: NCJ MS TJO DP.
References
1. Friston KJ (2002) Dysfunctional connectivity in schizophrenia. World Psychiatry
1: 66–71.
2. Ross CA, Margolis RL, Reading SA, Pletnikov M, Coyle JT (2006)
Neurobiology of schizophrenia. Neuron 52: 139–153.
3. Stephan KE, Baldeweg T, Friston KJ (2006) Synaptic plasticity and
dysconnection in schizophrenia. Biol Psychiatry 59: 929–939.
4. Javitt DC (2007) Glutamate and Schizophrenia: Phencyclidine, N-Methyl-d-
Aspartate Receptors, and Dopamine-Glutamate Interactions. Int Rev Neurobiol
78: 69–108.
5. Moghaddam B (2003) Bringing order to the glutamate chaos in schizophrenia.
Neuron 40: 881–884.
6. Rujescu D, Bender A, Keck M, Hartmann AM, Ohl F, et al. (2006) A
pharmacological model for psychosis based on N-methyl-D-aspartate receptor
hypofunction: molecular, cellular, functional and behavioral abnormalities. Biol
Psychiatry 59: 721–729.
7. Woo TU, Walsh JP, Benes FM (2004) Density of glutamic acid decarboxylase 67
messenger RNA-containing neurons that express the N-methyl-D-aspartate
receptor subunit NR2A in the anterior cingulate cortex in schizophrenia and
bipolar disorder. Arch Gen Psychiatry 61: 649–657.
8. Adler CM, Goldberg TE, Malhotra AK, Pickar D, Breier A (1998) Effects of
Ketamine on Thought Disorder, Working Memory, and Semantic Memory in
Healthy Volunteers. Biological Psychiatry 43: 811–816.
9. Hetem LA, Danion JM, Diemunsch P, Brandt C (2000) Effect of a subanesthetic
dose of ketamine on memory and conscious awareness in healthy volunteers.
Psychopharmacology (Berl) 152: 283–288.
10. Krystal JH, Karper LP, Seibyl JP, Freeman GK, Delaney R, et al. (1994)
Subanesthetic effects of the noncompetitive NMDA antagonist, ketamine, in
humans. Psychotomimetic, perceptual, cognitive, and neuroendocrine responses.
Arch Gen Psychiatry 51: 199–214.
11. Newcomer JW, Farber NB, Jevtovic-Todorovic V, Selke G, Melson AK, et al.
(1999) Ketamine-induced NMDA receptor hypofunction as a model of memory
impairment and psychosis. Neuropsychopharmacology 20: 106–118.
12. Pinault D (2008) N-methyl d-aspartate receptor antagonists ketamine and MK-
801 induce wake-related aberrant gamma oscillations in the rat neocortex. Biol
Psychiatry 63: 730–735.
13. Deshmukh A, Rosenbloom MJ, Pfefferbaum A, Sullivan EV (2002) Clinical signs
of cerebellar dysfunction in schizophrenia, alcoholism, and their comorbidity.
Schizophr Res 57: 281–291.
14. Ho BC, Mola C, Andreasen NC (2004) Cerebellar dysfunction in neuroleptic
naive schizophrenia patients: clinical, cognitive, and neuroanatomic correlates of
cerebellar neurologic signs. Biol Psychiatry 55: 1146–1153.
15. Jeon HJ, Cho MJ, Cho SJ, Kim SU, Park SK, et al. (2007) Quantitative analysis
of ataxic gait in patients with schizophrenia: the influence of age and visual
control. Psychiatry Res 152: 155–164.
16. Sullivan EV, Rosenbloom MJ, Pfefferbaum A (2004) Balance and gait deficits in
schizophrenia compounded by the comorbidity of alcoholism. Am J Psychiatry
161: 751–755.
17. Buzsaki G (2006) Rhythms of the Brain. Oxford, University Press.
18. Vanderwolf CH (2000) Are neocortical gamma waves related to consciousness?
Brain Res 855: 217–224.
19. Simons DJ, Carvell GE (1989) Thalamocortical response transformation in the
rat vibrissa/barrel system. J Neurophysiol 61: 311–330.
20. Pinault D, Vergnes M, Marescaux C (2001) Medium-voltage 5-9-Hz oscillations
give rise to spike-and-wave discharges in a genetic model of absence epilepsy: in
vivo dual extracellular recording of thalamic relay and reticular neurons.
Neuroscience 105: 181–201.
21. Cohen MX, Axmacher N, Lenartz D, Elger CE, Sturm V, et al. (2009) Good
Vibrations: Cross-frequency Coupling in the Human Nucleus Accumbens
during Reward Processing. J Cogn Neurosci 21: 875–889.
22. Bauer EP, Paz R, Pare D (2007) Gamma oscillations coordinate amygdalo-
rhinal interactions during learning. J Neurosci 27: 9369–9379.
23. Alonso A, Khateb A, Fort P, Jones BE, Muhlethaler M (1996) Differential
oscillatory properties of cholinergic and noncholinergic nucleus basalis neurons
in guinea pig brain slice. Eur J Neurosci 8: 169–182.
24. Csicsvari J, Jamieson B, Wise KD, Buzsaki G (2003) Mechanisms of gamma
oscillations in the hippocampus of the behaving rat. Neuron 37: 311–322.
25. Pinault D, Deschenes M (1992) Voltage-dependent 40-Hz oscillations in rat
reticular thalamic neurons in vivo. Neuroscience 51: 245–258.
26. Steriade M, Curro DR, Contreras D (1993) Electrophysiological properties of
intralaminar thalamocortical cells discharging rhythmic (approximately 40 HZ)
spike-bursts at approximately 1000 HZ during waking and rapid eye movement
sleep. Neuroscience 56: 1–9.
27. Ramanathan S, Hanley JJ, Deniau JM, Bolam JP (2002) Synaptic convergence
of motor and somatosensory cortical afferents onto GABAergic interneurons in
the rat striatum. J Neurosci 22: 8158–8169.
28. Masimore B, Schmitzer-Torbert NC, Kakalios J, Redish AD (2005) Transient
striatal gamma local field potentials signal movement initiation in rats.
Neuroreport 16: 2021–2024.
29. Hunt MJ, Raynaud B, Garcia R (2006) Ketamine dose-dependently induces
high-frequency oscillations in the nucleus accumbens in freely moving rats. Biol
Psychiatry 60: 1206–1214.
30. Imre G, Fokkema DS, Den Boer JA, Ter Horst GJ (2006) Dose-response
characteristics of ketamine effect on locomotion, cognitive function and central
neuronal activity. Brain Res Bull 69: 338–345.
31. Olney JW, Newcomer JW, Farber NB (1999) NMDA receptor hypofunction
model of schizophrenia. J Psychiatr Res 33: 523–533.
32. Tomitaka S, Tomitaka M, Tolliver BK, Sharp FR (2000) Bilateral blockade of
NMDA receptors in anterior thalamus by dizocilpine (MK-801) injures
pyramidal neurons in rat retrosplenial cortex. Eur J Neurosci 12: 1420–1430.
33. Ma J, Leung LS (2007) The supramammillo-septal-hippocampal pathway
mediates sensorimotor gating impairment and hyperlocomotion induced by
MK-801 and ketamine in rats. Psychopharmacology (Berl) 191: 961–974.
34. Chrobak JJ, Hinman JR, Sabolek HR (2008) Revealing past memories:
proactive interference and ketamine-induced memory deficits. J Neurosci 28:
4512–4520.
35. Pitsikas N, Boultadakis A, Sakellaridis N (2008) Effects of sub-anesthetic doses of
ketamine on rats’ spatial and non-spatial recognition memory. Neuroscience
154: 454–460.
36. White PF, Marietta MP, Pudwill CR, Way WL, Trevor AJ (1976) Effects of
halothane anesthesia on the biodisposition of ketamine in rats. J Pharmacol Exp
Ther 196: 545–555.
37. Jansen KL (1993) Non-medical use of ketamine. BMJ 306: 601–602.
38. Fisahn A, Pike FG, Buhl EH, Paulsen O (1998) Cholinergic induction of network
oscillations at 40 Hz in the hippocampus in vitro. Nature 394: 186–189.
39. Bartos M, Vida I, Jonas P (2007) Synaptic mechanisms of synchronized gamma
oscillations in inhibitory interneuron networks. Nat Rev Neurosci 8: 45–56.
40. Gonzalez-Burgos G, Lewis DA (2008) GABA neurons and the mechanisms of
network oscillations: implications for understanding cortical dysfunction in
schizophrenia. Schizophr Bull 34: 944–961.
41. Whittington MA, Traub RD, Jefferys JG (1995) Synchronized oscillations in
interneuron networks driven by metabotropic glutamate receptor activation.
Nature 373: 612–615.
42. Llinas RR, Grace AA, Yarom Y (1991) In vitro neurons in mammalian cortical
layer 4 exhibit intrinsic oscillatory activity in the 10- to 50-Hz frequency range.
Proc Natl Acad Sci U S A 88: 897–901.
43. Nunez A, Amzica F, Steriade M (1992) Voltage-dependent fast (20–40 Hz)
oscillations in long-axoned neocortical neurons [letter]. Neuroscience 51: 7–10.
44. Roopun AK, Cunningham MO, Racca C, Alter K, Traub RD, et al. (2008)
Region-specific changes in gamma and beta2 rhythms in NMDA receptor
dysfunction models of schizophrenia. Schizophr Bull 34: 962–973.
45. Homayoun H, Moghaddam B (2007) NMDA receptor hypofunction produces
opposite effects on prefrontal cortex interneurons and pyramidal neurons.
J Neurosci 27: 11496–11500.
46. Moghaddam B, Adams B, Verma A, Daly D (1997) Activation of glutamatergic
neurotransmission by ketamine: a novel step in the pathway from NMDA
receptor blockade to dopaminergic and cognitive disruptions associated with the
prefrontal cortex. J Neurosci 17: 2921–2927.
47. Razoux F, Garcia R, Lena I (2007) Ketamine, at a dose that disrupts motor
behavior and latent inhibition, enhances prefrontal cortex synaptic efficacy and
glutamate release in the nucleus accumbens. Neuropsychopharmacology 32:
719–727.
48. Maeng S, Zarate CA Jr, Du J, Schloesser RJ, McCammon J, et al. (2008)
Cellular mechanisms underlying the antidepressant effects of ketamine: role of
alpha-amino-3-hydroxy-5-methylisoxazole-4-propionic acid receptors. Biol Psy-
chiatry 63: 349–352.
49. Serrano A, Robitaille R, Lacaille JC (2008) Differential NMDA-dependent
activation of glial cells in mouse hippocampus. Glia 56: 1648–1663.
50. Fellin T, Pascual O, Gobbo S, Pozzan T, Haydon PG, et al. (2004) Neuronal
synchrony mediated by astrocytic glutamate through activation of extrasynaptic
NMDA receptors. Neuron 43: 729–743.
51. Kanahara N, Shimizu E, Ohgake S, Fujita Y, Kohno M, et al. (2008) Glycine
and D: -serine, but not D: -cycloserine, attenuate prepulse inhibition deficits
induced by NMDA receptor antagonist MK-801. Psychopharmacology (Berl)
198: 363–374.
Ketamine-Induced c Noise
PLoS ONE | www.plosone.org 15 August 2009 | Volume 4 | Issue 8 | e6755

52. Kapur S, Seeman P (2002) NMDA receptor antagonists ketamine and PCP have
direct effects on the dopamine D(2) and serotonin 5-HT(2)receptors-implications
for models of schizophrenia. Mol Psychiatry 7: 837–844.
53. Seeman P, Lasaga M (2005) Dopamine agonist action of phencyclidine. Synapse
58: 275–277.
54. Heinzel A, Steinke R, Poeppel TD, Grosser O, Bogerts B, et al. (2008) S-
ketamine and GABA-A-receptor interaction in humans: an exploratory study
with I-123-iomazenil SPECT. Hum Psychopharmacol 23: 549–554.
55. Lewis DA, Cho RY, Carter CS, Eklund K, Forster S, et al. (2008) Subunit-
selective modulation of GABA type A receptor neurotransmission and cognition
in schizophrenia. Am J Psychiatry 165: 1585–1593.
56. Harrison PJ (1999) The neuropathology of schizophrenia. A critical review of the
data and their interpretation. Brain JID - 0372537 122 (Pt 4): 593–624.
57. Jasper HH (1936) CORTICAL EXCITATORY STATE AND VARIABILITY
IN HUMAN BRAIN RHYTHMS. Science 83: 259–260.
58. Sheer DE (1975) Behavior and brain electrical activity. New York and London:
Plenum Press. 362 p.
59. Regan D, Spekreijse H (1986) Evoked potentials in vision research 1961-86.
Vision Res 26: 1461–1480.
60. Pantev C, Makeig S, Hoke M, Galambos R, Hampson S, et al. (1991) Human
auditory evoked gamma-band magnetic fields. Proc Natl Acad Sci U S A 88:
8996–9000.
61. Gray CM, Konig P, Engel AK, Singer W (1989) Oscillatory responses in cat
visual cortex exhibit inter-columnar synchronization which reflects global
stimulus properties. Nature 338: 334–337.
62. Joliot M, Ribary U, Llinas R (1994) Human oscillatory brain activity near 40 Hz
coexists with cognitive temporal binding. Proc Natl Acad Sci U S A JID - 7505876
91: 11748–11751.
63. Light GA, Hsu JL, Hsieh MH, Meyer-Gomes K, Sprock J, et al. (2006) Gamma
band oscillations reveal neural network cortical coherence dysfunction inschizophrenia patients. Biol Psychiatry 60: 1231–1240.
64. Herrmann CS, Demiralp T (2005) Human EEG gamma oscillations in
neuropsychiatric disorders. Clin Neurophysiol 116: 2719–2733.65. Lee KH, Williams LM, Haig A, Gordon E (2003) ‘‘Gamma (40 Hz) phase
synchronicity’’ and symptom dimensions in schizophrenia. Cognit Neuropsychiatry8: 57–71.
66. Spencer KM, Nestor PG, Perlmutter R, Niznikiewicz MA, Klump MC, et al.
(2004) Neural synchrony indexes disordered perception and cognition inschizophrenia. Proc Natl Acad Sci U S A 101: 17288–17293.
67. Uhlhaas PJ, Singer W (2006) Neural synchrony in brain disorders: relevance forcognitive dysfunctions and pathophysiology. Neuron 52: 155–168.
68. Basar-Eroglu C, Brand A, Hildebrandt H, Karolina KK, Mathes B, et al. (2007)Working memory related gamma oscillations in schizophrenia patients.
Int J Psychophysiol 64: 39–45.
69. Baldeweg T, Spence S, Hirsch SR, Gruzelier J (1998) Gamma-bandelectroencephalographic oscillations in a patient with somatic hallucinations.
Lancet 352: 620–621.70. Becker C, Gramann K, Muller HJ, Elliott MA (2009) Electrophysiological
correlates of flicker-induced color hallucinations. Conscious Cogn 18: 266–276.
71. Behrendt RP (2003) Hallucinations: synchronisation of thalamocortical gammaoscillations underconstrained by sensory input. Conscious Cogn 12: 413–451.
72. Paxinos G, Watson C (1998) The rat brain in stereotaxic coordinates. AcademicPress.
73. Pinault D (1996) A novel single-cell staining procedure performed in vivo underelectrophysiological control: morpho-functional features of juxtacellularly
labeled thalamic cells and other central neurons with biocytin or Neurobiotin.
J Neurosci Methods 65: 113–136.
Ketamine-Induced c Noise
PLoS ONE | www.plosone.org 16 August 2009 | Volume 4 | Issue 8 | e6755


![The Hypothesis of NMDA Receptor Hypofunction for …cent hypothesis of schizophrenia as a “glutamate disorder” [12], the glutamatergic hypofunction hypothesis is not in confl](https://static.cupdf.com/doc/110x72/5fd7f5f77ba0784ee13d01f1/the-hypothesis-of-nmda-receptor-hypofunction-for-cent-hypothesis-of-schizophrenia.jpg)


