NITROGEN MANAGEMENT EVALUATION TOOL
TUTORIAL WORKBOOK Patty Ristow, Quirine M. Ketterings, Karl Czymmek
FEBRUARY 2011
Nutrient Management Spear Program
Collaboration among the Cornell University Department of Animal Science,
PRODAIRY and Cornell Cooperative Extension
http://nmsp.cals.cornell.edu
ii
Teaching Goals
The exercises presented in this teaching guide are designed as a computer laboratory exercise.
The purposes of this segment of the curriculum are two-fold:
(1) To reinforce nitrogen (N) management concepts presented in lecture by reading through
extension fact sheets and answering question independently or through group discussions.
(2) Become familiar with the “look and feel” of the tool/software.
Completing this section of the curriculum after the lecture solidifies concepts presented in lecture
by providing the same information in multiple learning formats. It also engages the use of
professional reference tools (fact sheets and software), providing experiences and skills that are
immediately applicable for crop and farm advisors or managers.
Materials used for this section of the curriculum are:
(1) Software - The Nitrogen Evaluation for Corn Tool
(2) Tutorial Workbook - The Nitrogen Evaluation for Corn Tool
The Tutorial for the Nitrogen Evaluation for Corn Tool takes the user through a step by step set
of fact sheet references, questions, data entry and evaluation exercises. This Teaching Guide
offers guidance on discussion points for each section.
The tutorial begins with downloading and opening the Nitrogen Evaluation for Corn Tool on
each student’s desktop which requires an internet connection. If an in-class internet connection is
unavailable, the calculator can be downloaded on a computer that does have internet access and
transferred to class computers using a portable drive or disk.
It is recommended that no more than two people share a computer for optimal learning.
Correct Citation:
Ristow, P.L., Q.M. Ketterings, and K.J. Czymmek (2011). Nitrogen Management Evaluation
Tool; Tutorial Workbook. Department of Animal Science. Cornell University, Ithaca NY.
Downloadable from: http://nmsp.cals.cornell.edu/projects/curriculum.html.
For more information contact Quirine Ketterings at the Cornell Nutrient Management Spear
Program, Department of Animal Science, Cornell University, 330 Morrison Hall, Ithaca NY
14583, or e-mail: [email protected].
iii
Contents
Introduction ..................................................................................................................................... 1
Quick Review of Nitrogen Basics................................................................................................... 2
Farm Contact Information............................................................................................................... 4
Field and Crop Characteristics ........................................................................................................ 4
Current and Past Manure Application Section................................................................................ 6
Fertilizer Additions ......................................................................................................................... 7
Crop Conditions .............................................................................................................................. 8
Soil Test Results ............................................................................................................................. 9
Nitrogen Balance .......................................................................................................................... 11
Pre-Sidedress Nitrate Test............................................................................................................. 14
Illinois Soil Nitrogen Test ............................................................................................................. 15
Corn Stalk Nitrate Test ................................................................................................................. 16
Summary Questions ...................................................................................................................... 18
Appendices .................................................................................................................................... 20
1
Introduction
Teaching Guide: Discuss the questions in the context that it is important to develop an
understanding for site specific N management because it is complex and dependent on individual
growing season and field conditions. Crop managers and advisors can develop reference
information and skills over time by evaluating N management using the tools presented in this
software.
The Nitrogen Evaluation for Corn Tool automates calculation of nitrogen (N) guidelines using
information about soil type, crop rotation, legume management in the rotation, drainage and
manure and fertilizer applications.
In this calculator white cells (boxes) are open for data entry and yellow cells (boxes) are
calculated values. The yellow cells present results based on data entered into white cells. Yellow
cells are locked and cannot be manipulated.
Warning: Useable output requires realistic values as input variables. The quality of the output is
dependent on the data used and is the responsibility of the person using the calculator.
Efficient use of N is an important economic and environmental goal for many farms. Nitrogen
can be difficult to manage due to its multiple and very mobile forms. Fine-tuning N management
requires developing site-specific knowledge through on-farm measurements. The Nitrogen
Management Evaluation Tool is a Microsoft Excel spreadsheet that combines multiple tools for
N management for improved understanding and evaluation of farm-specific, field-specific N
conditions. The tool requires Microsoft Excel to be installed (Microsoft Office 2003® or
2007®).
The Nitrogen Evaluation for Corn Tool integrates four stand-alone tools:
Cornell Corn N Guidelines
Pre-Sidedress Nitrate Test (PSNT)
Illinois Soil Nitrogen Test (ISNT)
Corn Stalk Nitrate Test (CSNT)
Each individual tool can be used to develop skills for accurately assessing farm-specific
conditions that impact N availability and evaluating and fine-tuning decisions. Use of these tools
can lead to improved N use efficiency over time.
2
Quick Review of Nitrogen Basics
A review of N basics is suggested by reading the two fact sheets listed below and then answering
questions 1-5. The fact sheets can be found in the Appendix of this tutorial workbook or
downloaded from http://nmsp.cals.cornell.edu/guidelines/factsheets.html.
Agronomy Fact Sheet #2: Nitrogen Basics – The Nitrogen Cycle.
Agronomy Fact Sheet #41: Soil Organic Matter.
Question (1):
A large proportion of the N in animal manure (feces + urine + bedding) is in the form of
inorganic N. What makes this form of N so (1) valuable, and (2) difficult to manage?
Answer (1):
It becomes plant available very quickly, and is similar in availability as N in urea fertilizer.
The ammonia can be lost quickly through volatilization, or the ammonia can be converted
by soil microbes to nitrate (plant-preferred form) which is susceptible to losses through
leaching or denitrification.
Question (2):
When a large quantity of corn stalks are plowed in to the soil or manure with lots of straw
bedding is applied to a field (hint: both materials have a high carbon (C) to N ratio) what
happens for a number of weeks to the plant available N in the soil?
Answer (2):
Since the freshly supplied material (cornstalks or manure with heavy bedding) has much
more C than N, the microbial populations need to pull N from any other available source
to support their efforts to break down the organic material. With material that has a high
C content, there will not be enough N to quickly break down the stalks or the bedded
manure. Thus, the microbes will be a net consumer of N. A shortage of N in the soil will
slow down the breakdown of the manure/straw or cornstalks. Depending on the amount
of C:N in the plant material (often defined by the plant stage of the perennial plant, older
= more C) immobilization can a last weeks to months.
Question (3):
List long-term physical, chemical and biological benefits that result when materials with
a high C:N ratio is added to the soil.
Answer (3):
Materials with a high C content help build soil organic matter levels and microbial
activity, because they do not decompose rapidly. Organic matter levels help give soil its
physical structure, helping to improve a soil’s water holding capacity, ability to drain
excess water, etc.
Question (4):
It is early summer and soils have been moist, warm and well-aerated for a number of
weeks. What two microbial-driven processes have been taking place that will provide
corn plant available N?
3
Answer (4):
Mineralization = conversion of N from organic N sources to ammonia-N to ammonium-N.
Nitrification = conversion of ammonium-N to nitrite-N to nitrate-N.
Question (5):
After a spring and early summer of conditions as described above in question (4) an area
that you work in received four inches of rain over two days! You receive a call from a
farm manager wondering about N availability for corn in soils that (1) are well-drained
and gravelly, (2) for soils that are high in organic matter but have a poorly drained sub-
layer and have been saturated for the past two days, and (3) for soils that are deep with a
long history of high organic matter levels built up and maintained through manure
applications and cover crop incorporation. Each field received 30 pounds of starter N.
How to do you respond?
Answer (5):
Soils that are well-drained and
gravelly.
Nitrate present in the soil solution during the
rainfall would likely have leached below the
root zone. The nitrate can be replenished
however the rate is dependent on weather
(temperature, moisture and oxygen in the soil),
total mass of microbial populations in the soil,
and the soil organic matter content.
Soils that have high organic
matter levels but also have a
poorly-drained sub-layer and
the soils above have been
saturated for 48 hours.
Nitrate present after the nice spring warm-up
might have been lost through denitrification.
Organic matter can mineralize and replenish
the soil nitrate pool. The rate is dependent on
weather (temperature, moisture and oxygen in
the soil).
Soils are deep with a long
history of high organic matter
levels built up and maintained
through manure applications
and cover crop incorporation.
For these soils, nitrate was likely lost through
leaching. If the soil is drained and did not
experience saturated conditions and the
weather is warm enough, the soil solution will
probably quickly replenish significant nitrate
again given the manure and cover crop history
and soil type.
4
Farm Contact Information
Teaching Guide: The following exercises aim to help users to become familiar with data needs
of the software and more comfortable with entering data and understanding why the data are
important for N management evaluation.
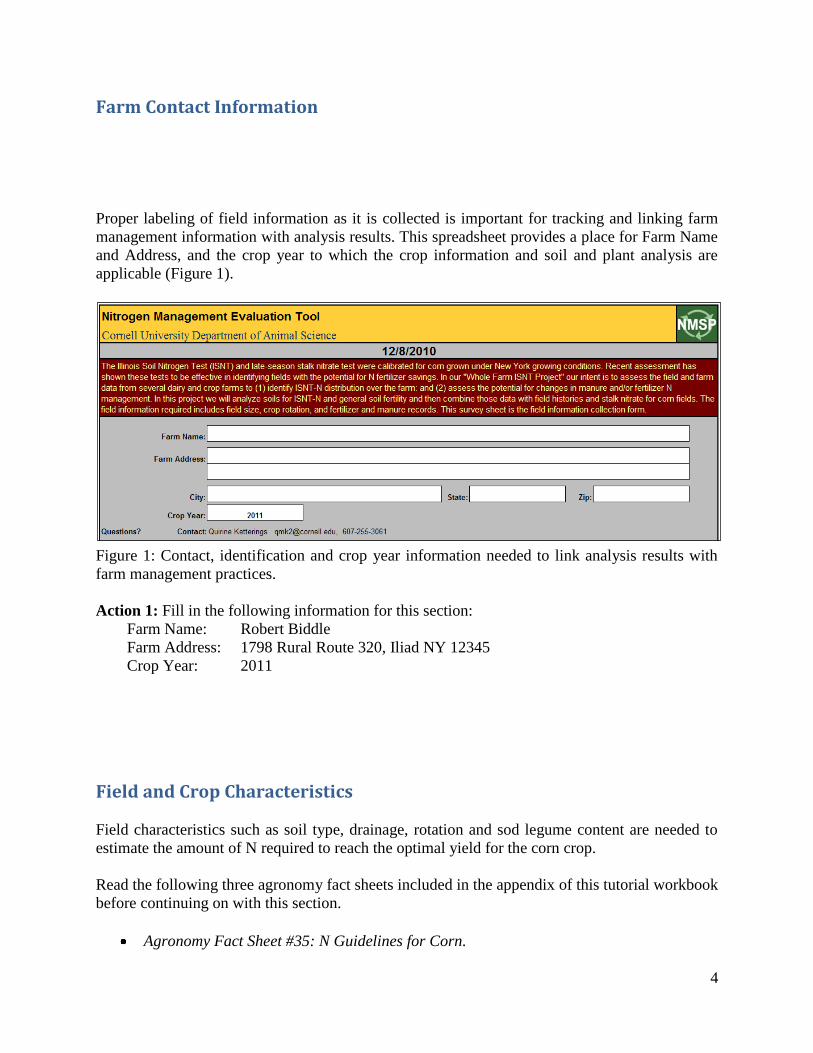
Proper labeling of field information as it is collected is important for tracking and linking farm
management information with analysis results. This spreadsheet provides a place for Farm Name
and Address, and the crop year to which the crop information and soil and plant analysis are
applicable (Figure 1).
Figure 1: Contact, identification and crop year information needed to link analysis results with
farm management practices.
Action 1: Fill in the following information for this section:
Farm Name: Robert Biddle
Farm Address: 1798 Rural Route 320, Iliad NY 12345
Crop Year: 2011
Teaching Guide: The users should be able to identify data needed to calculate N requirements
for corn (agronomy fact sheet #35) and answer why soil type, drainage, crop rotation and
percent legume in the sod are all needed.
Field and Crop Characteristics
Field characteristics such as soil type, drainage, rotation and sod legume content are needed to
estimate the amount of N required to reach the optimal yield for the corn crop.
Read the following three agronomy fact sheets included in the appendix of this tutorial workbook
before continuing on with this section.
Agronomy Fact Sheet #35: N Guidelines for Corn.
5
Agronomy Fact Sheet #21: Nitrogen Needs of 1st Year Corn.
Agronomy Fact Sheet #30: Soybean N Credits.
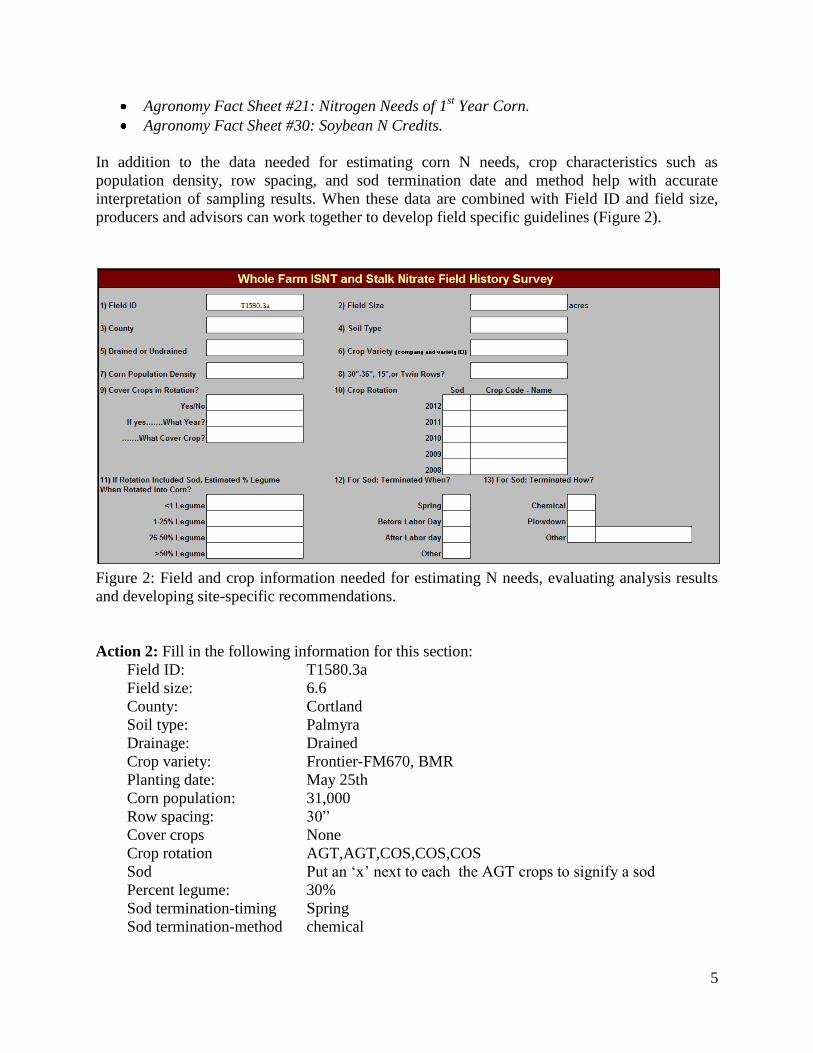
In addition to the data needed for estimating corn N needs, crop characteristics such as
population density, row spacing, and sod termination date and method help with accurate
interpretation of sampling results. When these data are combined with Field ID and field size,
producers and advisors can work together to develop field specific guidelines (Figure 2).
Figure 2: Field and crop information needed for estimating N needs, evaluating analysis results
and developing site-specific recommendations.
Action 2: Fill in the following information for this section:
Field ID: T1580.3a
Field size: 6.6
County: Cortland
Soil type: Palmyra
Drainage: Drained
Crop variety: Frontier-FM670, BMR
Planting date: May 25th
Corn population: 31,000
Row spacing: 30”
Cover crops None
Crop rotation AGT,AGT,COS,COS,COS
Sod Put an ‘x’ next to each the AGT crops to signify a sod
Percent legume: 30%
Sod termination-timing Spring
Sod termination-method chemical
6
Current and Past Manure Application Section
Teaching Guide: Students should be able to identify two fractions of manure N and how they
behave, which manure applications credit both organic and ammonium N and which manure
applications only credit organic-N.
Manure provides N in primarily two forms: inorganic (often listed as ammonium or ammonia) N
and organic N. After manure is applied these two forms become available to crops following
different mechanisms. Read through the following agronomy fact sheet prior to continuing
further in this user manual:
Agronomy Fact Sheet #4: Nitrogen Credits from Manure.
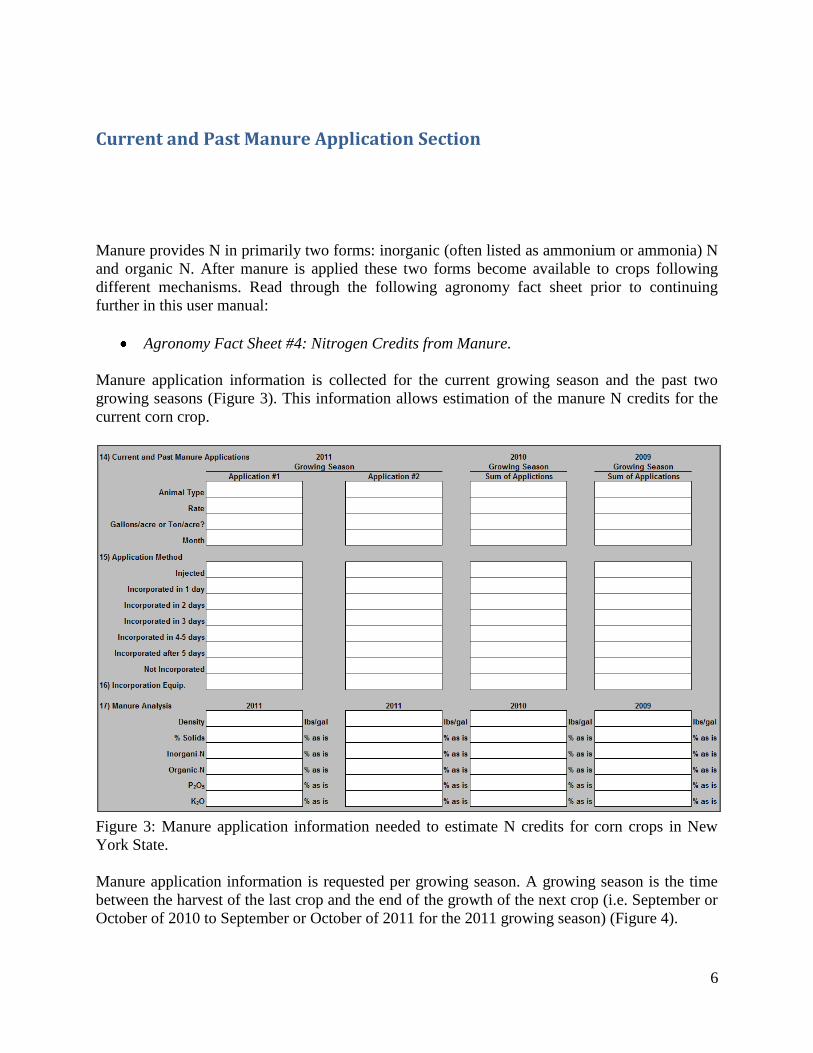
Manure application information is collected for the current growing season and the past two
growing seasons (Figure 3). This information allows estimation of the manure N credits for the
current corn crop.
Figure 3: Manure application information needed to estimate N credits for corn crops in New
York State.
Manure application information is requested per growing season. A growing season is the time
between the harvest of the last crop and the end of the growth of the next crop (i.e. September or
October of 2010 to September or October of 2011 for the 2011 growing season) (Figure 4).

7
Growing Season 2010 Growing Season 2011 Growing Season Month O N D J F M A M J J A S O N D J F M A M J J A S
Calendar Year 2009 2010 2011
Figure 4: Growing seasons begin after final crops are removed the preceding year, usually by
October 1st.
The manure applied in the current growing season can be a source of inorganic N depending on
timing and application methods. The calculator uses the manure analysis, manure rate, timing
and application method to calculate the amount of inorganic N to be credited. Manure applied in
the current and past two growing seasons supplies the current crop with N from mineralization of
the organic N in the manure. Nitrogen credits from the organic fraction depend on the species of
animal that the manure came from, the solids content of the manure and the manure application
rate.
Action 3: Fill in the following information for this section:
Current Growing
Season
Last Growing
Season
Two Seasons
Ago
Animal Type Cattle Cattle Cattle
Rate 8,000 10,000 8,000
Gallons or Tons? Gal Gal Gal
Month April April Oct
Application Method Surface Inc. 1 day Surface
Incorporation Equipment Aeration tool
Manure Analysis
Density 8.4 8.4 8.4
% Solids 6 6 6
Inorganic N 0.206 0.206 0.206
Organic N 0.093 0.093 0.093
P2O5 0.094 0.094 0.094
K2O 0.298 0.298 0.298
Teaching Guide: The students should be able to identify the percent N, P2O5 and K2O in a
fertilizer and know why they need to know the density of a liquid fertilizer to figure our lbs of
nutrients delivered per acre. An understanding of the different types of fertilizer application
methods (pop-up, sidedress, topdress, etc…) is encouraged.
Fertilizer Additions
Information on pre-plant, starter, and sidedress fertilizer treatments are important for determining
where additional fertilizer may be needed or where fertilizer savings can be made.
Read through the following agronomy fact sheet included in the appendix of this user manual:
8
Agronomy Fact Sheet #44: Nitrogen Fertilizers for Field Crops.
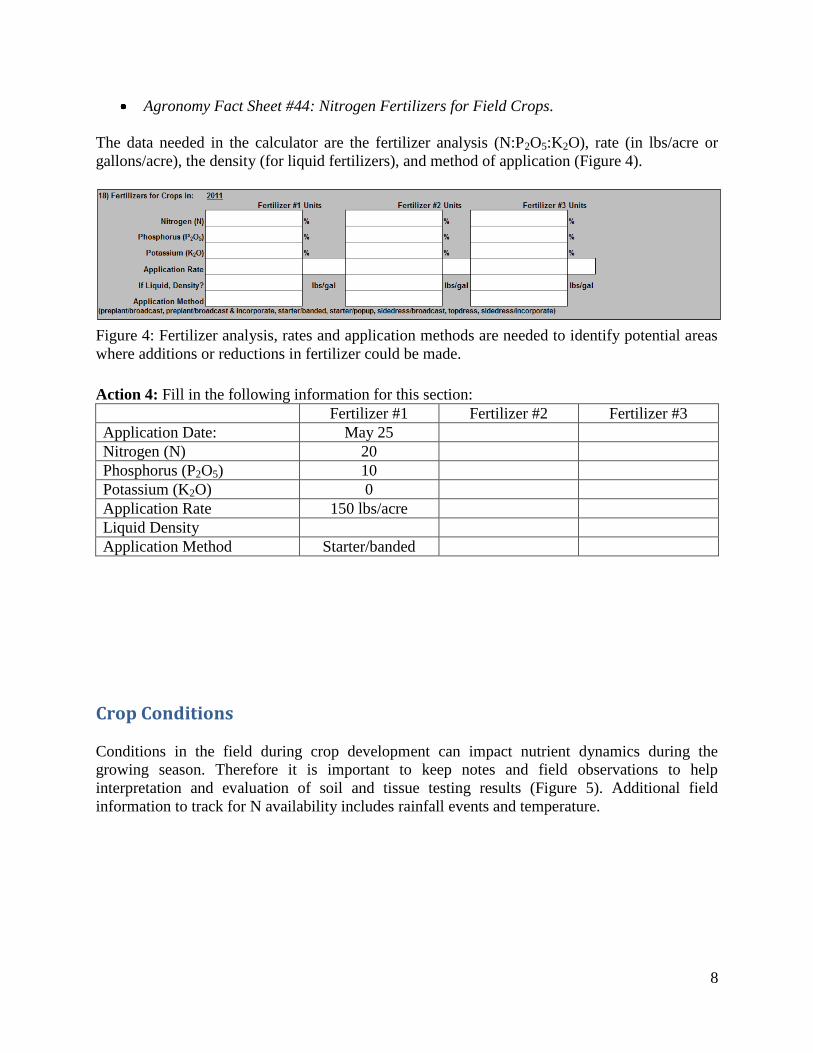
The data needed in the calculator are the fertilizer analysis (N:P2O5:K2O), rate (in lbs/acre or
gallons/acre), the density (for liquid fertilizers), and method of application (Figure 4).
Figure 4: Fertilizer analysis, rates and application methods are needed to identify potential areas
where additions or reductions in fertilizer could be made.
Action 4: Fill in the following information for this section:
Fertilizer #1 Fertilizer #2 Fertilizer #3
Application Date: May 25
Nitrogen (N) 20
Phosphorus (P2O5) 10
Potassium (K2O) 0
Application Rate 150 lbs/acre
Liquid Density
Application Method Starter/banded
Teaching Guide: Discuss how different field conditions might impact N needs and availability
during the growing season and might impact the interpretation of different N evaluation tools
which are calibrated for “normal” growing conditions (no weed competition, no extra N needs
for re-growth after hail damage etc…).
Crop Conditions
Conditions in the field during crop development can impact nutrient dynamics during the
growing season. Therefore it is important to keep notes and field observations to help
interpretation and evaluation of soil and tissue testing results (Figure 5). Additional field
information to track for N availability includes rainfall events and temperature.

9
Figure 5: The ISNT/CSNT calculator provides a place to record observation of field conditions
during the growing season to aide in evaluation later on.
Action 5: Fill in the ‘Addition Field Information of Relevance’ with the following data:
5/28 - planted
6/20 - 3 inches of rain (24 hrs), 68 degrees
6/24 - 1 inch of rain, 72 degrees
6/28 - 0.8 inches of rain, 75 degrees
Soil Test Results
The calculator provides a place to record soil analysis results that relate directly to N availability
(ISNT and PSNT) as well as other soil nutrient levels that could interact with plant uptake of
nitrogen (Figure 6). Recording all soil analysis results allows the most comprehensive
interpretation of N availability during the growing season.
Figure 6: Nutrient analysis results are recorded and when combined with additional field
conditions listed in previous sections allows a comprehensive evaluation of nitrogen availability
during the growing season.
Action 6: Fill in the following information for this section: Lab Name Cornell -CNAL Mn (lbs/ac) Date 9/2/2010 Zn (lbs/ac) Sample ID OM (%) 5.28
Extraction Method Morgan Buffer pH pH 7.4 CNAL - LOI (%) 2.5

10
P (lbs/ac) 25 CNAL - ISNT-N (ppm) 230 K (lbs/ac) 180 PSNT (ppm) 28 Mg (lbs/ac) 890 pH CaCl2 Ca (lbs/ac) 5862 pH (0-1 inch: no till) Ex. Acidity (ME/100g) Soluble salts (mmho) Al (lbs/ac) B (lbs/ac) Fe (lbs/ac) CEC (NH4OAc)

11
Nitrogen Balance Teaching Guide: The software uses the data entered to keep track of the N balance. Discussions
can be held on how a N balance can be helpful prior to and during the growing season.
Completions of this section should enforce the role of soil type, rotation (1st year corn and sod
credits), fertilizer N, and different sources of N in manure in supplying N to a corn crop.
Keeping track of the N balance prior to and during the growing season can help estimate the
quantity of fertilizer or manure needed at planting and sidedress time.
This spreadsheet is a tool that can help calculate corn N need based on the information entered.
This tool can also help to interpret the results of different tools for fine-tuning N management for
improved efficiency on the farm.
The information entered so far for the field shows that it is has a well-drained Palmyra soil in its
second year of corn silage. The legume is generally 26-50% legume when plowed up and no
cover crops are planted. The field has at least had 8,000 gallons of manure applied two years ago,
10,000 gallons last year and 8,000 gallons applied this year and the field received 30 lbs of N as
a starter fertilizer. According to the information entered in the spreadsheet on soil type, drainage,
crop rotation, percent legume in the previous sod and manure and fertilizer additions the N
balance for this field shows a 26 lbs/acre deficient remaining (Figure 7).
Figure 7: Corn N balance
is calculated based on
information entered in the
calculator.
The preliminary N need is calculated for the crop using the Cornell Nitrogen Guidelines for Corn
equation (Agronomy Fact Sheet #35: N Guidelines for Corn).
N needs (lbs/acre) = [(Yield potential*1.2-SoilN-SodN)/(N uptake efficiency of the soil/100)]
Past manure credits are subtracted to give the ‘Preliminary N Need’ at the beginning of the
cropping season.
12
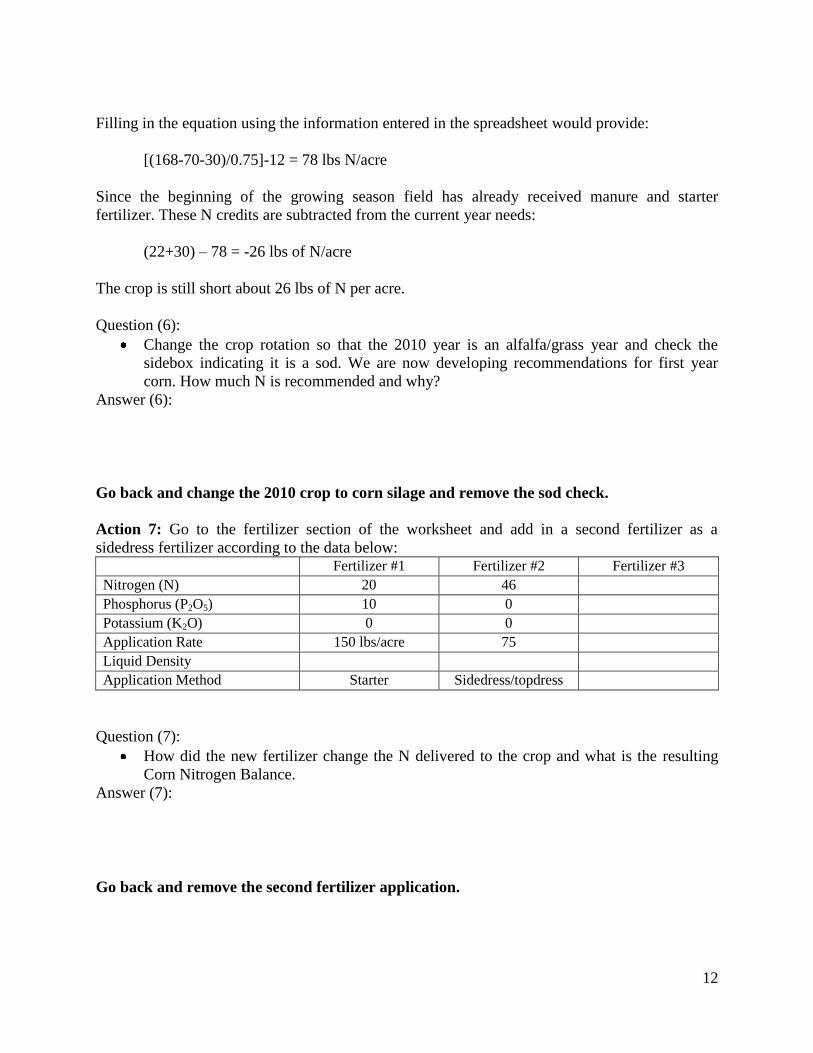
Filling in the equation using the information entered in the spreadsheet would provide:
[(168-70-30)/0.75]-12 = 78 lbs N/acre
Since the beginning of the growing season field has already received manure and starter
fertilizer. These N credits are subtracted from the current year needs:
(22+30) – 78 = -26 lbs of N/acre
The crop is still short about 26 lbs of N per acre.
Question (6):
Change the crop rotation so that the 2010 year is an alfalfa/grass year and check the
sidebox indicating it is a sod. We are now developing recommendations for first year
corn. How much N is recommended and why?
Answer (6):
Because it is first year corn and first year corn after a well-managed sod does not need
anything more than a small N starter (30 lbs N/acre).
Go back and change the 2010 crop to corn silage and remove the sod check.
Action 7: Go to the fertilizer section of the worksheet and add in a second fertilizer as a
sidedress fertilizer according to the data below:
Fertilizer #1 Fertilizer #2 Fertilizer #3
Nitrogen (N) 20 46 Phosphorus (P2O5) 10 0 Potassium (K2O) 0 0 Application Rate 150 lbs/acre 75 Liquid Density Application Method Starter Sidedress/topdress
Question (7):
How did the new fertilizer change the N delivered to the crop and what is the resulting
Corn Nitrogen Balance.
Answer (7):
Fertilizer = 65 lbs of N credited.
Balance = 8 lbs in excess.
Go back and remove the second fertilizer application.
13
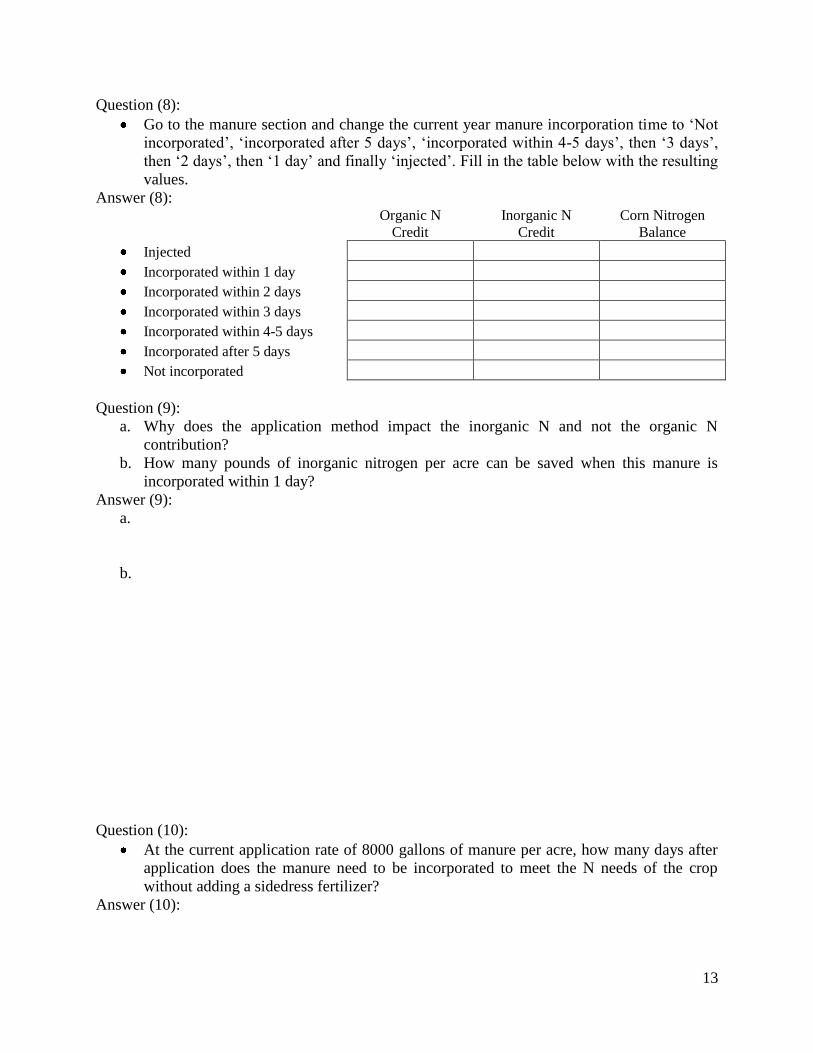
Question (8):
Go to the manure section and change the current year manure incorporation time to ‘Not
incorporated’, ‘incorporated after 5 days’, ‘incorporated within 4-5 days’, then ‘3 days’,
then ‘2 days’, then ‘1 day’ and finally ‘injected’. Fill in the table below with the resulting
values.
Answer (8):
Organic N
Credit Inorganic N
Credit Corn Nitrogen
Balance
Injected 22 168 112
Incorporated within 1 day 22 90 64
Incorporated within 2 days 22 73 47
Incorporated within 3 days 22 57 30
Incorporated within 4-5 days 22 32 6
Incorporated after 5 days 22 0 -26
Not incorporated 22 0 -26
Question (9):
a. Why does the application method impact the inorganic N and not the organic N
contribution?
b. How many pounds of inorganic nitrogen per acre can be saved when this manure is
incorporated within 1 day?
Answer (9):
a. Because the inorganic N is subject to volatilization losses when the manure is not mixed
in with the soil and in our climate, little inorganic N is retained in the soil profile over
late fall and early springs (no inorganic N credit from fall applied manure).
b. The farm can save 90 lbs of N per acre.
Teaching Guide: The next section reinforces the impact manure application method and timing have on N delivery
and necessary application rates to deliver a desired amounts of N. Discussions can raise
awareness on multiple facets that can be presented during farm decision-makers: (1) inorganic-
N from manure is more like fertilizer N and is considered immediately plant available, (2) lower
rates can lower applications costs to an individual field, (3) lower rates may require longer
application trips to further away fields, increasing whole farm costs of manure applications
when these costs are higher than the equivalent cost of a fertilizer application, and (4) fertilizer
prices will have an impact on making manure management decisions.
Question (10):
At the current application rate of 8000 gallons of manure per acre, how many days after
application does the manure need to be incorporated to meet the N needs of the crop
without adding a sidedress fertilizer?
Answer (10):
4-5 days.
14
Action 8: Set manure incorporation to within 1 day.
Question (11):
What is the minimum application rate (round to the nearest 500 gallons) the farm could
use and still meet the N needs of the crop?
Answer (11):
3,500 gallons/acre
Put the manure application back to 8000 gallons with incorporation within 4-5 days.
Teaching Guide: Users should fully understand the conditions under which a PSNT should be
taken and results applied, they should practice interpreting the results and also the practical
limitations that the test presents (12” cores, limited sampling window, sampling during a time
when workloads for cropping personnel are heavy).
Take home message – Test strips left in fields are a good way to increase site-specific working
knowledge for farm advisors and crop managers.
Pre-Sidedress Nitrate Test
The Pre-Sidedress Nitrate Test (PSNT) is an in-season soil nitrate test that can be used to
estimate where additional fertilizer may not be needed. This test is taken at corn sidedressing
time just before the period of major N demand by corn. It should be used on fields with a history
of manure and/or sod incorporation and cannot be used on fields that received N beyond 30 lbs
N/acre in the starter band. The PSNT is designed to (1) estimate the soil’s N supplying potential
from organic N sources, and (2) decide if that is enough N to meet crop needs.
Read through both of the following two page documents, which can be found in the appendix.
Agronomy Fact Sheet #3: Pre-sidedress Nitrate Test.
Pre-Sidedress Nitrate Test (PSNT) Refresher.
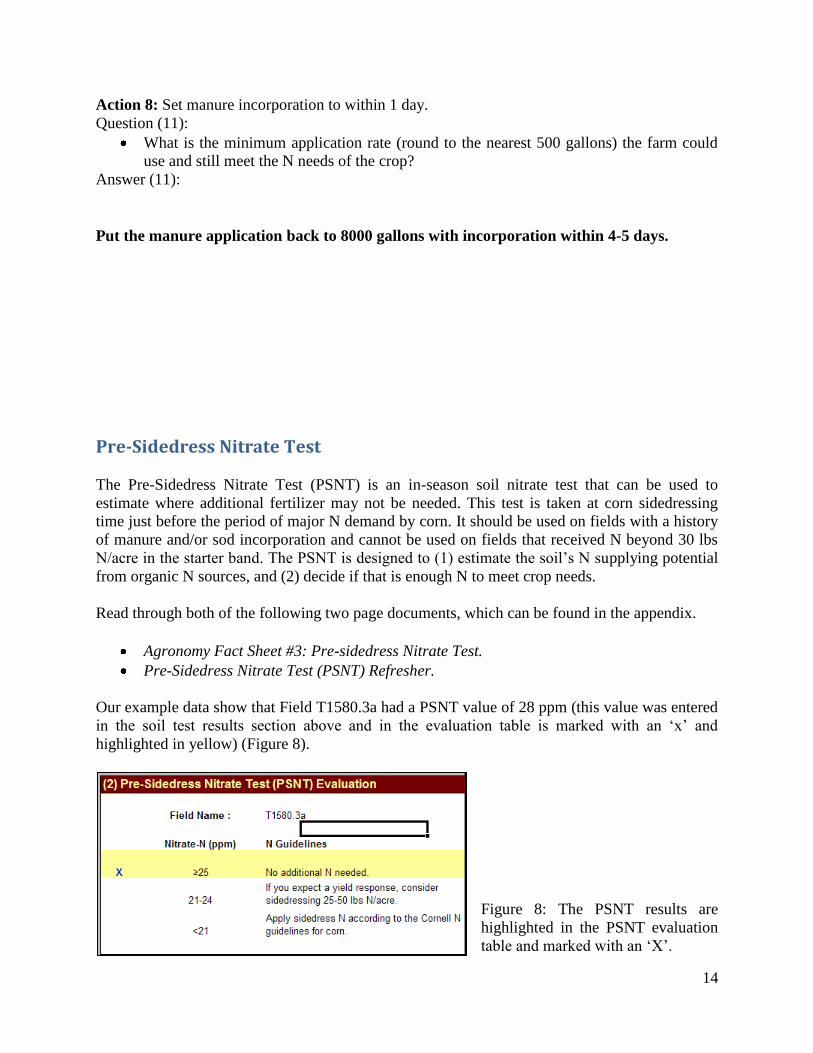
Our example data show that Field T1580.3a had a PSNT value of 28 ppm (this value was entered
in the soil test results section above and in the evaluation table is marked with an ‘x’ and
highlighted in yellow) (Figure 8).
Figure 8: The PSNT results are
highlighted in the PSNT evaluation
table and marked with an ‘X’.
15
Question (12)
Based on what you have read and the PSNT results on our example field and the manure
management on this field what would you recommend? Should the farmer sidedress N?
Answer (12)
No, although the field balance shows a 26 lb per acre deficit the PSNT is showing that
there is enough nitrate in the soil profile to support the corn crop. Most likely the
adequate nitrate levels are due to the long manure history on this field.
Teaching Guide: The ISNT is an indicator of soil nitrogen supply potential. It is important to
understand how to use the ISNT.
Illinois Soil Nitrogen Test
The Illinois Soil Nitrogen Test (ISNT) estimates the amount of readily mineralizable soil organic
N and when coupled with the organic matter levels in the soil (loss-on-ignition (LOI)) the ISNT-
N value can be used to determine if a field is likely or unlikely to respond to additional N (i.e. if
the soil has sufficient mineralizable N to not need external supplies in the form of fertilizer N).
Read through the following agronomy fact sheet before continuing further in this user manual:
Agronomy Fact Sheet #36: Illinois Soil Nitrogen Test.
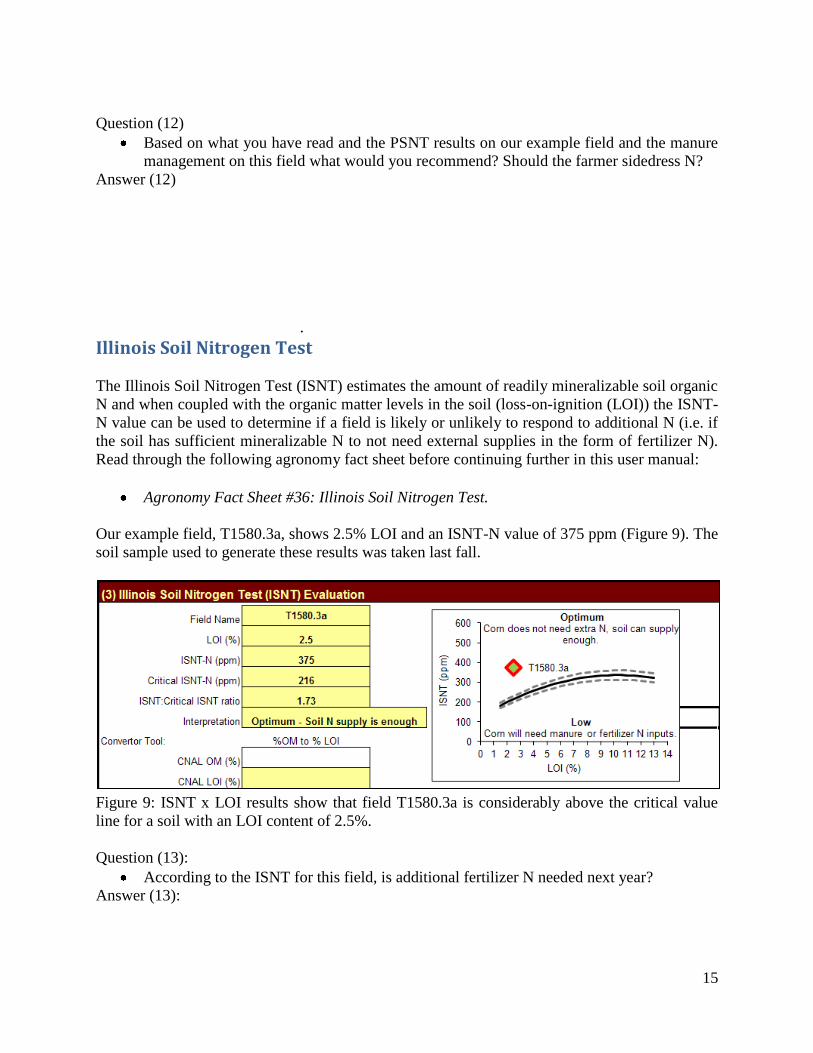
Our example field, T1580.3a, shows 2.5% LOI and an ISNT-N value of 375 ppm (Figure 9). The
soil sample used to generate these results was taken last fall.
Figure 9: ISNT x LOI results show that field T1580.3a is considerably above the critical value
line for a soil with an LOI content of 2.5%.
Question (13):
According to the ISNT for this field, is additional fertilizer N needed next year?
Answer (13):

16
No, the soil, under good mineralization conditions, will provide enough N. Manure
application will help maintain ISNT-N levels over time (i.e. without manure addition,
ISNT-N levels will go down) but this field does not need extra fertilizer N.
Question (14):
Refer back to the Corn N Balance evaluation table. A number of factors were considered
to estimate the Preliminary N Need for a field. Which of these numbers may have been
underestimated according to the ISNT results? Why?
Answer (14):
The soil N contribution. The soil N contribution is based on research results that
represent ‘average’ soil conditions. Farm management can improve soil N mineralization
capacity beyond this ‘average’ number and allow the farm to manage crop N needs with
less nitrogen inputs.
Question (15):
Why might a farm still want to apply manure to a field even when the ISNT analysis
shows that additional N is not needed?
Answer (15):
They may want to apply manure as a way to maintain the soils ability to supply N as well
as other nutrients. For example, manure can help maintain organic matter levels over
time, supply P and K, etc.
Question (16):
Go up to the soil analysis data entry section and change the ISNT value to 250 ppm.
Would your recommendation to the farm manager change?
Answer (16)
The fact that the value falls closer to the cut-off line illustrates that the certainty of the
soil in providing enough N is lower, therefore recommendations might be more
conservative. It is always advisable to leave test strips to raise the collective knowledge
of the crop manager and consultant on how to best manage N on that farm given their
field histories and soil management.
Change the soil ISNT value back to 375 ppm.
Teaching Guide: The CSNT is an important tool for developing nitrogen management skills. It
can be used by crop managers and advisors to measure, evaluate and reflect on seasonal
nitrogen management and to identify if changes are needed in N management the next season.
Corn Stalk Nitrate Test
The CSNT is useful as an end-of-season test because it helps identify opportunities for reducing
or increasing fertilizer inputs and/or re-allocate manure over time for the greatest benefits of the
manure.
Read the following agronomy fact sheet before proceeding further in this user manual:
17
Agronomy Fact Sheet #31: Late Season Stalk Nitrate Test.
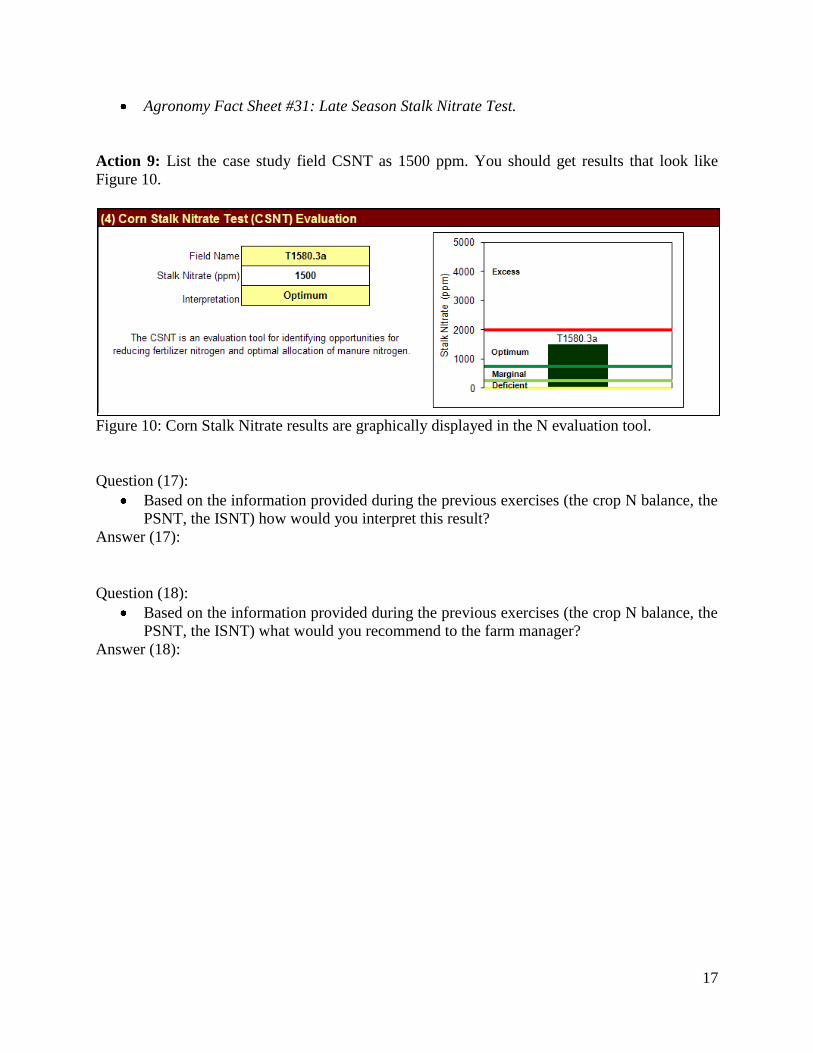
Action 9: List the case study field CSNT as 1500 ppm. You should get results that look like
Figure 10.
Figure 10: Corn Stalk Nitrate results are graphically displayed in the N evaluation tool.
Question (17):
Based on the information provided during the previous exercises (the crop N balance, the
PSNT, the ISNT) how would you interpret this result?
Answer (17):
The crop had enough N to reach full yield potential.
Question (18):
Based on the information provided during the previous exercises (the crop N balance, the
PSNT, the ISNT) what would you recommend to the farm manager?
Answer (18):
A sound recommendation might be to test again next year but preliminary indications
show that this field has a high potential to supply enough N under current management
without additional fertilizer N.

18
Summary Questions
Question (19):
Based on the above N delivery to a corn crop through manure and fertilizer, give a reason
why lowering the manure application rate would be advantageous for the farm and
environment.
Answer (19):
Less cost for spreading on that field if it is a field far from the manure source.
Leaves manure available to spread on other land to reduce fertilizer need or increase yield
or both.
Less likely to rapidly build soil P and K levels.
Less risk of environmental losses of N, P and K.
Question (20):
Based on the above nitrogen delivery to a corn crop through manure and fertilizer, give a
reason why lowering the manure application rate would be disadvantageous for the farm
and environment. Explain.
Answer (20):
Not be able to build soil P and K (and other nutrient) levels high enough to meet crop
nutrient needs during the part of the crop rotation when land may not receive manure and
so chemical fertilizer would be needed to be brought onto a farm that actually has enough
P and K for its cropping needs.
May increase total farm and environmental costs for spreading manure because will need
to haul manure further.
Question (21):
If the PSNT results indicated more nitrogen might be needed. How might the ISNT
results for a field help fine-tune your interpretation of the PSNT results?
Answer (21):
The ISNT showed that the soil had the mineralization potential to support a corn crop
providing additional support to the idea that a sidedress application will not be
economically beneficial. The manure application added extra insurance.
Question (22):
Given the results of both the PSNT and the ISNT in the class example, what would your
recommendation be to the farm production manager?
Answer (22):
No sidedress N would be needed and it is an opportunity to work together to develop
confidence in the tests by leaving untreated check strips if there is a decision to treat the
field.
Question (23):
Corn is six inches tall and the weather has been wet and cold for two weeks. Growing
degree days for corn are barely accumulating and the corn is barely growing. Warmer
temperatures are in the forecast but the rain is due to continue for another week, about
19
every other day a new storm rolling through with predictions of an inch or more of rain.
A farmer calls for you to come look at some fields that he wants to sidedress. You arrive
at the fields and notice the topography is very gently rolling, the corn in the headlands
and depressions (which account for over half the field acreage) are a few inches shorter
than the higher ground, and it is showing signs of N deficiency. The field has an ISNT
test result that shows the soil testing considerably above the critical value for the LOI
level of the field. Should the field be sidedressed?
Answer (23):
The fact that low areas and headlands (compaction) are yellow implies that underlying
water or compacted layers may be restricting root growth and/or causing waterlogged
soils which can lead to loss of N and poor root development of the corn. When the soils
drain, mineralization and plant growth will commence again and the crop should respond.
Because the ISNT is considerably above the line, the soil is likely to mineralize enough N
to support the corn crop once it stops raining and the free water drains from the soil. If
the field has a long manure history the rate of mineralization is expected to be high
enough to supply the corn crop with N during its rapid growth phase. If the farmer still
wants to sidedress, wait until soils drain and leave a no-N test strip.
Question (24):
As farms work to reduce their carbon footprint through manure digestion and energy
generation, the manure tends to be less viscous (more liquid, less solids) and the nutrients
are more reactive in the environment (immediately available to plants and microbes and
potential for environmental loss). Knowing what you have learned about nutrient
dynamics in the field what are some management changes that could be made to help
keep nutrients on the field where they are needed?
Answer (24):
Find ways to increase soil carbon through application of:
a. High solids content manures or compost.
b. Incorporation of more corn stover in the rotation by including more corn grain.
c. Including high carbon cover crops in the rotation.
d. No-till.
The higher soil carbon levels allow:
a. Higher microbial populations that can immobilize the manure nutrients and hold
them in the soil profile for longer.
b. Higher CEC levels though increased humus in the soil that can also increase the
soil’s nutrient holding capacity.
c. Improved soil structure and drainage so that the manure and nutrients are more
likely to infiltrate the soil.
Incorporate or shallowly mix the manure with soil when applied to bare ground.

20
Appendices
Agronomy Fact Sheet #2: Nitrogen Basics
Agronomy Fact Sheet #3: Pre-Sidedress Nitrate Test
Agronomy Fact Sheet #4: Nitrogen Credits from Manure
Agronomy Fact Sheet #21: Nitrogen Needs of 1st Year Corn
Agronomy Fact Sheet #22: Cation Exchange Capacity (CEC)
Agronomy Fact Sheet #30: Soybean N Credits
Agronomy Fact Sheet #31: Late Season Stalk Nitrate Test
Agronomy Fact Sheet #35: N Guidelines for Corn
Agronomy Fact Sheet #36: Illinois Soil Nitrogen Test
Agronomy Fact Sheet #39: Nitrogen Fixation
Agronomy Fact Sheet #41: Soil Organic Matter
Agronomy Fact Sheet #44: Nitrogen Fertilizers for Field Crops
Agronomy Fact Sheet #45: Enhanced-Efficiency Nitrogen Sources

Fact Sheet 2
Nitrogen Basics – The Nitrogen Cycle
Agronomy Fact Sheet Series
Department of Crop and Soil Sciences 1 College of Agriculture and Life Sciences
Nitrogen, Crops and the Environment Nitrogen (N) is essential for the development of field crops. When N is deficient, root systems and plant growth are stunted, older leaves turn yellow and the crop is low in crude protein. Too much N
can delay maturity and cause excessive vegetative growth at the expense of grain yield. Nitrogen fertilizer is expensive and losses can be detrimental to the environment. Efficient use of N by meeting
crop needs while avoiding excessive applications of N is an important goal. This fact sheet provides a brief overview of the important components of the
N cycle to aid in reaching that goal.
Nitrogen Cycle The N cycle illustrates how N from manure, fertilizers and plants moves through the soil to crops, water and the air. Understanding the N cycle
will help you make the best use of manure and fertilizers to meet crop needs while safeguarding the environment. In general, the N cycle processes of fixation, mineralization and nitrification increase
plant available N. Denitrification, volatilization, immobilization, and leaching result in permanent or temporary N losses from the root zone. Read on for specifics about each of the N cycle processes.
Fixation refers to the conversion of atmospheric N to a plant available form. This occurs either through an industrial process, as in the production of commercial fertilizers, or a biological process, as
with legumes such as alfalfa and clover. Nitrogen fixation requires energy, enzymes and minerals, so if a plant available form of N is present, the crop will
use it instead of fixing it from the air.
When legumes are tilled into the soil, the N
stored in their roots is released and made available to the next crop or lost to the environment, depending on management.
In mixed legume-grass stands, the grass can utilize N fixed by the legumes. If the stand has 25% or more legume, no additional N is needed.
Mineralization is the process by which microbes decompose organic N from manure, organic matter and crop residues to ammonium. Because it is a biological process, rates of mineralization vary with soil temperature, moisture and the amount of oxygen in the soil (aeration).
Mineralization readily occurs in warm (68-95°F),
well-aerated and moist soils. In New York State, approximately 60—80 lbs of N
per acre is mineralized on average from soil organic matter each year.
Nitrification is the process by which microorganisms convert ammonium to nitrate to
obtain energy. Nitrate is the most plant available form of N, but is also highly susceptible to leaching losses.
Nitrification is most rapid when soil is warm (67-86°F), moist and well-aerated, but is virtually halted below 41°F and above 122°F.
R-NH2 NH3 NH4+
organic N ammonia ammonium
N2 NH3 R-NH2
nitrogen gas ammonia organic N
NH4+
NO2- NO3
-
ammonium nitrite nitrate
The
Nitrogen
Cycle

Department of Crop and Soil Sciences 2 College of Agriculture and Life Sciences
Denitrification occurs when N is lost through the conversion of nitrate to gaseous forms of N, such as
nitric oxide, nitrous oxide and dinitrogen gas. This occurs when the soil is saturated and the bacteria
use nitrate as an oxygen source.
De-nitrification is common in poorly drained soils. Volatilization is the loss of N through the conversion of ammonium to ammonia gas, which is released to the atmosphere. The volatilization losses
increase at higher soil pH and conditions that favor evaporation (e.g. hot and windy).
Volatilization losses are higher for manures and urea fertilizers that are surface applied and not incorporated (by tillage or by rain) into the soil.
Manure contains N in two primary forms: ammonium and organic N. If manure is incorporated within one day, 65% of the ammonium N is retained; when incorporated after 5 days the ammonium N will have been lost through volatilization. Organic N in manure is not lost through volatilization, but it takes time to
mineralize and become plant available. Immobilization is the reverse of mineralization. All
living things require N; therefore microorganisms in the soil compete with crops for N. Immobilization refers to the process in which nitrate and ammonium are taken up by soil organisms and
therefore become unavailable to crops.
Incorporation of materials with a high carbon to
nitrogen ratio (e.g. sawdust, straw, etc.), will increase biological activity and cause a greater demand for N, and thus result in N immobilization
Immobilization only temporarily locks up N. When the microorganisms die, the organic N contained in their cells is converted by mineralization and
nitrification to plant available nitrate.
Leaching is a pathway of N loss of a high concern to water quality. Soil particles do not retain nitrate very well because both are negatively charged. As a result, nitrate easily moves with water in the soil. The rate of leaching depends on soil drainage, rainfall, amount of nitrate present in the soil, and
crop uptake. The EPA has set the maximum contaminant level
for drinking water at 10 ppm N as nitrate. Well-drained soils, unexpected low crop yield,
high N inputs (especially outside of the growing season) and high rainfall are all conditions that
increase the potential for nitrate leaching.
Crop Uptake is the prime goal of N management on farms. The greatest efficiency occurs when adequate N is applied at a time when the crop is actively taking it up. Efficient N use also depends on a number of other factors including temperature, soil moisture, pest pressure, and soil compaction. In the moist Northeast climate, nitrate remaining
in the soil after the growing season will be lost to leaching or denitrification between crop harvest and the next planting season.
Efficient N use during the growing season and the use of cover crops can minimize such losses.
Summary The ultimate goal of N management is to
maximize N efficiency by increasing crop uptake and minimizing N losses to the environment. Crop N needs can be met through existing N sources (e.g. from soil organic matter, past sods and previously applied manure) and supplementary applications of N through manure and fertilizers. To make the most
of existing N sources and purchased fertilizers, consider the N cycle facts, below: N released from killed sods, via mineralization
and nitrification, can supply enough N for most, if not all, of the N needs of the following corn crop.
The timing and method of manure and fertilizer applications determine the availability of nitrogen
to the crop, but also the potential for loss. Spring applications with immediate incorporation will conserve ammonium from volatilization losses.
Fall cover crops act as a “nutrient savings account” by taking up residual N from the growing season or fall manure applications and,
thereby, reducing leaching losses. The nutrients in the cover crop become available for the next crop (by mineralization) after the sod is rotated.
For more information about N management in field crops (N guidelines, N calculators, etc.), see the “Nutrient Guidelines” section of the Nutrient
Management Spear Program web site, below, or contact your local Cornell Cooperative Extension field crop educator.
H2N-C-NH2 NH4
+ NH3
Urea ammonium ammonia
NO3- NO2
- NO N2O N2
nitrate nitrite nitric nitrous dinitrogen oxide oxide gas
NH4+ and/or NO3
- R-NH2
ammonium nitrate organic N
For more information
Nutrient Management Spear Program http://nmsp.css.cornell.edu
Authors Courtney Johnson, Greg Albrecht, Quirine Ketterings,
Jen Beckman, and Kristen Stockin
2005

Fact Sheet 41
Soil Organic Matter
Agronomy Fact Sheet Series
Department of Crop and Soil Sciences 1 College of Agriculture and Life Sciences
Soil organic matter is the fraction of the soil that consists of plant or animal tissue in various stages of breakdown (decomposition). Most of our productive agricultural soils have between 3 and 6% organic matter.
Soil organic matter contributes to soil productivity in many different ways. In this fact sheet, we describe the various components of organic matter and the different roles organic matter plays in soil productivity. We also discuss field management practices that will help preserve or increase soil organic matter levels over time.
What is Soil Organic Matter? Organic matter is made up of different components that can be grouped into three major types:
1. Plant residues and living microbial biomass.
2. Active soil organic matter also referred to as detritus.
3. Stable soil organic matter, often referred to as humus.
The living microbial biomass includes the microorganisms responsible for decomposition (breakdown) of both plant residues and active soil organic matter or detritus. Humus is the stable fraction of the soil organic matter that is formed from decomposed plant and animal tissue. It is the final product of decomposition. The first two types of organic matter contribute to soil fertility because the breakdown of these fractions results in the release of plant nutrients such as nitrogen, phosphorus, potassium, etc. The humus fraction has less influence on soil fertility because it is the final product of decomposition (hence the term “stable organic matter”). However, it is still important for soil fertility management because it contributes to soil structure, soil tilth, and cation exchange capacity (CEC, see Agronomy Fact Sheet #22). This is also the fraction that darkens the soil’s color.
Benefits of Stable Soil Organic Matter There are numerous benefits to having a relatively high stable organic matter level in an agricultural soil. These benefits can be grouped into three categories: Physical Benefits
• Enhances aggregate stability, improving water infiltration and soil aeration, reducing runoff.
• Improves water holding capacity. • Reduces the stickiness of clay soils
making them easier to till. • Reduces surface crusting, facilitating
seedbed preparation.
Chemical Benefits
• Increases the soil’s CEC or its ability to hold onto and supply over time essential nutrients such as calcium, magnesium and potassium.
• Improves the ability of a soil to resist pH change; this is also known as buffering capacity (see Agronomy Fact Sheet #5).
• Accelerates decomposition of soil minerals over time, making the nutrients in the minerals available for plant uptake.
Biological Benefits
• Provides food for the living organisms in the soil.
• Enhances soil microbial biodiversity and activity which can help in the suppression of diseases and pests.
• Enhances pore space through the actions of soil microorganisms. This helps to increase infiltration and reduce runoff.
Organic Materials Over time, the application and incorporation of organic materials can result in an increase in stable soil organic matter levels. Sources of organic materials include:
• Crop residues. • Animal manure.

Department of Crop and Soil Sciences 2 College of Agriculture and Life Sciences
• Compost (Figure 1). • Cover crops (green manure) • Perennial grasses and legumes.
The quickest increases are obtained with sources that are high in carbon such as compost or semi-solid manure.
Figure 1: Compost application can increase soil organic matter levels over time. Organic Matter Management Farm practices that help to maintain or increase soil organic matter levels:
• Use of conservation tillage practices (for example zone tillage or no-till). Tillage exposes the organic matter to air and will result in the lowering of stable organic matter due to increased mineralization rates and erosion losses.
• Rotation of annual row crops with perennial grass or legume sods will reduce erosion and build up organic matter as a result of the decomposition of the rootmass.
• Establishment of legume cover crops will enhance organic matter accumulation by providing the nitrogen (N) needed for decomposition of freshly added organic materials, especially those with a high C to N ratio (corn stover, cereal straw, heavily bedded manure, etc.).
• Avoiding soil compaction which increases waterlogging, and maintaining proper pH to enhance microbial activity and decomposition of freshly added materials.
Actual buildup of stable organic matter will, in addition to the amount and source of organic
material added, and tillage and rotation practices, also depend on:
• Soil temperature. • Precipitation and soil moisture holding
capacity. • Soil type and drainage class. • Existing microbial community. • Soil fertility status and soil pH.
Monitoring Soil Organic Matter To get an idea of the effect of farm management practices on soil organic matter buildup or decrease, soil samples should be taken over time. Consistency in sampling time is important to build records for fields over time (see Agronomy Fact Sheet #1). Although other tests are available, most laboratories will do a loss-on-ignition (LOI) test to estimate the organic matter content of the soil. At Cornell University, soil is exposed to 105oC (221oF) for 1.5 hours to remove soil moisture and then to 500oC (932oF) for 2 hours to determine LOI. Not all laboratories us the same method so for accurate records over time, it is important to consistently use the same laboratory service. In Summary With careful management the preservation and accumulation of soil organic matter can help to improve soil productivity resulting in greater farm profitability. Additional Resources o Cornell University Agronomy Fact Sheet series:
nmsp.css.cornell.edu/publications/factsheets.asp. Disclaimer This fact sheet reflects the current (and past) authors’ best effort to interpret a complex body of scientific research, and to translate this into practical management options. Following the guidance provided in this fact sheet does not assure compliance with any applicable law, rule, regulation or standard, or the achievement of particular discharge levels from agricultural land.
For more information
Nutrient Management Spear Program http://nmsp.css.cornell.edu
Megan Fenton, Carl Albers, Quirine Ketterings
2008
Fact Sheet 35
N Guidelines for Corn
Agronomy Fact Sheet Series
Department of Crop and Soil Sciences 1 College of Agriculture and Life Sciences
With increasing fertilizer prices and concerns about nutrient losses to the environment, it is especially important to account for all nutrient sources when determining the optimum nitrogen (N) application rate for corn.
Recommendations for phosphorus (P), potassium (K) and other nutrients are derived from soil tests. However, in the humid climate of the Northeastern US, it is difficult to base N guidelines on soil nitrate because soil nitrate levels change rapidly depending on rainfall and temperature. Instead, Cornell N guidelines for corn consider soil specific yield potentials (YP in bushels/acre), annual N contribution from the soil organic matter (SoilN in lbs N/acre), N release from a decomposing sod (SodN in lbs N/acre), and soil specific fertilizer N uptake efficiency (Neff as a percentage):
Recommended N = (YP*1.2-SoilN-SodN)/(Neff/100)
In this fact sheet we describe each of these inputs, identify where you can find the necessary information, and show some example calculations. Yield Potential (YP) Yield potential is defined as the expected yield over 3-4 of 5 years under good management. Corn yield potentials have been derived for all agricultural soils in New York and are updated as new research is conducted. Yield potentials are drainage dependent, reflecting different yields under drained and undrained conditions for soils that are, by nature, poorly drained. A few examples for New York soils are given in Table 1. Table 1: Examples of corn yield potentials (YP) for New York soils. Soil type Corn yield potential Undrained Drained bushels per acre bushels per acre Howard 135 135 Hamlin 155 155 Volusia 95 105 Rhinebeck 105 120
Yield potentials can be looked up in Appendix 1 of the Nitrogen Guidelines for Field Crops in New York (see additional resources). They are given in bushels/acre (85%DM). To convert to the equivalent yield as silage (35% DM), divide grain yield by 5.9 bu/ton. Use a local soil survey to determine the soil type. Soil Nitrogen (SoilN) Soil N availability through mineralization of soil organic matter is a function of soil type and artificial drainage class. Look-up tables exist that show estimates of SoilN under undrained (UD) and under excellent artificial drainage conditions (see Appendix 1 of the Nitrogen Guidelines for Field Crops in New York). Table 2: Examples of soil N contributions for New York soils. Soil type Soil N supply (SoilN) Undrained Drained lbs per acre lbs per acre Howard 70 70 Hamlin 80 80 Volusia 60 70 Rhinebeck 65 75
Sod Nitrogen (SodN) Sods provide a substantial amount of N for three years following plow down. When the sod is killed, the organic N will become available through mineralization. The amount of N available is a function of the sod density and quality, the percent of legume, and time since the sod crop was plowed or killed. The amount of N available from different sods can be estimated using Table 3. Table 3: Sod N release rates.
Available N Total N pool Yr 1* Yr 2 Yr 3 Legume in
sod (%) lbs per acre 0 150 83 18 8
1-25 200 110 24 10 26-50 250 138 30 13
50 or more 300 165 36 15 * First year following plow down.

Department of Crop and Soil Sciences 2 College of Agriculture and Life Sciences
For more information on accounting for sod N contributions see fact sheet #21 (Nitrogen needs for first year corn). Soil N Uptake Efficiency (Neff) The percentage of applied fertilizer that can become part of the plant is called the uptake efficiency. Plants are not able to take up 100% of the inorganic N supplied to the soil. Sidedress applications of fertilizer and inorganic N from manure can be high (if applied at the right amount) but usually efficiencies for NY soils range from 50 to 75%. Nitrogen uptake efficiency data can be found in Nitrogen Guidelines for Field Crops in New York (see additional resources below). Table 4: Examples of soil N uptake efficiencies. Soil type N uptake efficiency (Neff) Undrained Drained % % Howard 75 75 Hamlin 75 75 Volusia 60 65 Rhinebeck 60 65
Other Factors • The N requirement for corn in a no-till
system is increased 10 lbs/acre due to slower soil warming in the spring.
• The N requirement of corn grown on muck soils is 95 lbs per acre.
Example Calculations Using the information presented above, N recommendations can be calculated for a second year corn crop in an undrained, Hamlin soil in continuous corn:
[(155*1.2) – 80 – 0] / (75/100) = 141 lbs N per acre
Another example is the N recommendation for a third year corn following a 50% alfalfa sod on a drained Volusia soil:
[(120*1.2) – 70 – 13] / (65/100) 94 lbs N per acre
Both fields require additional fertilization with either manure or chemical fertilizers or a combination. When calculated N needs are zero (or negative) and no manure has been applied, a starter fertilizer is recommended at a rate of 10-30 lbs per acre (fact sheet #21).
Manure N Credits After calculating the N recommendation for a field, N supplies from manure applications in the three previous years must be accounted for and subtracted from the N recommendations. More information on how to account for manure N credits can be found in fact sheet #4 (Nitrogen credits from manure). Software and Calculators Tools have been developed to estimate N contributions without having to go through the calculations. An on-line calculator can be used that also incorporates residual manure N and current year manure N (refer to additional resources below for web address). The results can be used to identify additional fertilizers that may need to be purchased or N surpluses on a field.
Cropware, a comprehensive nutrient management software, can provide automatic calculations of N, P and K recommendations for numerous crops. The software can be downloaded, free of charge, from the website listed below. Additional Resources o Nutrient Management Spear Program Agronomy Fact
Sheet Series: http://nmsp.css.cornell.edu o Nutrient Guidelines for Field Crops in New York:
http://nmsp.css.cornell.edu/nutrient_guidelines/ o Cropware: A tool for nutrient management planning:
http://msp.css.cornell.edu/software/cropware.asp o NYS Corn Nitrogen Calculator:
http://nmsp.css.cornell.edu/nutrient_guidelines/ Disclaimer This fact sheet reflects the current (and past) authors’ best effort to interpret a complex body of scientific research, and to translate this into practical management options. Following the guidance provided in this fact sheet does not assure compliance with any applicable law, rule, regulation or standard, or the achievement of particular discharge levels from agricultural land.
For more information
Nutrient Management Spear Program http://nmsp.css.cornell.edu
Patty Ristow, Quirine Ketterings, Joe Lawrence, Karl Czymmek
2007
Fact Sheet 30
“Soybean N Credits”
Agronomy Fact Sheet Series
Department of Crop and Soil Sciences 1 College of Agriculture and Life Sciences
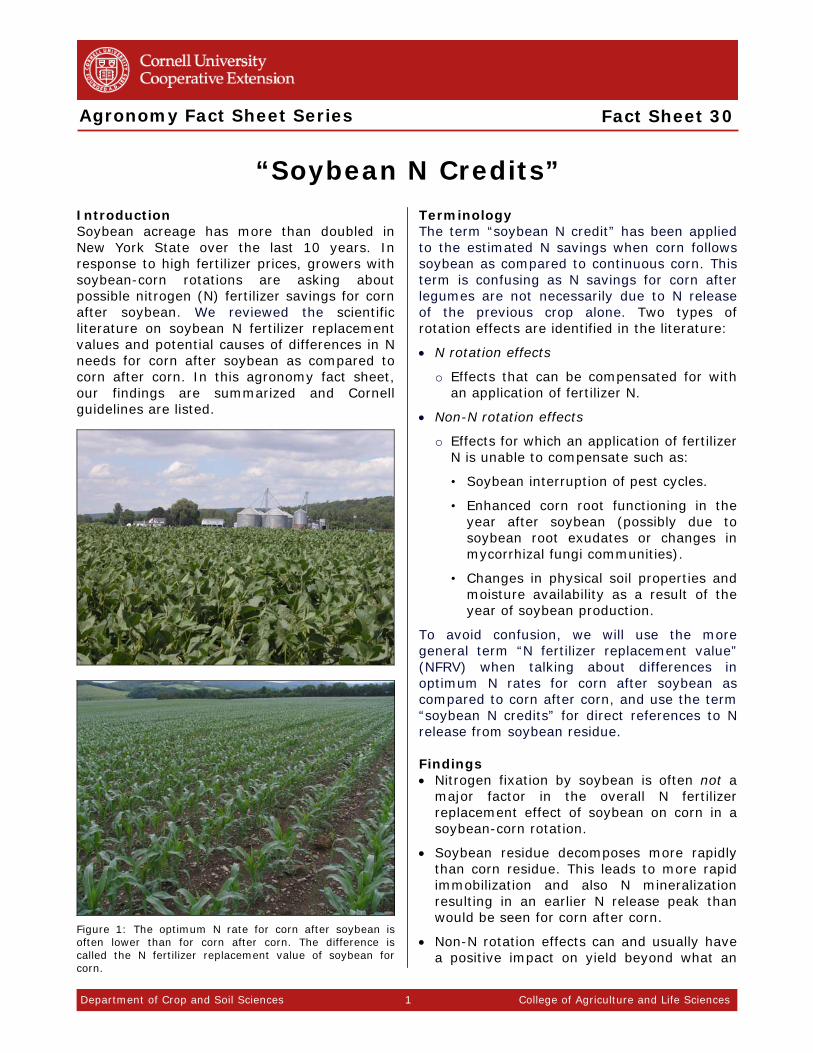
Introduction Soybean acreage has more than doubled in New York State over the last 10 years. In response to high fertilizer prices, growers with soybean-corn rotations are asking about possible nitrogen (N) fertilizer savings for corn after soybean. We reviewed the scientific literature on soybean N fertilizer replacement values and potential causes of differences in N needs for corn after soybean as compared to corn after corn. In this agronomy fact sheet, our findings are summarized and Cornell guidelines are listed.
Figure 1: The optimum N rate for corn after soybean is often lower than for corn after corn. The difference is called the N fertilizer replacement value of soybean for corn.
Terminology The term “soybean N credit” has been applied to the estimated N savings when corn follows soybean as compared to continuous corn. This term is confusing as N savings for corn after legumes are not necessarily due to N release of the previous crop alone. Two types of rotation effects are identified in the literature:
• N rotation effects
o Effects that can be compensated for with an application of fertilizer N.
• Non-N rotation effects
o Effects for which an application of fertilizer N is unable to compensate such as:
• Soybean interruption of pest cycles.
• Enhanced corn root functioning in the year after soybean (possibly due to soybean root exudates or changes in mycorrhizal fungi communities).
• Changes in physical soil properties and moisture availability as a result of the year of soybean production.
To avoid confusion, we will use the more general term “N fertilizer replacement value” (NFRV) when talking about differences in optimum N rates for corn after soybean as compared to corn after corn, and use the term “soybean N credits” for direct references to N release from soybean residue. Findings • Nitrogen fixation by soybean is often not a
major factor in the overall N fertilizer replacement effect of soybean on corn in a soybean-corn rotation.
• Soybean residue decomposes more rapidly than corn residue. This leads to more rapid immobilization and also N mineralization resulting in an earlier N release peak than would be seen for corn after corn.
• Non-N rotation effects can and usually have a positive impact on yield beyond what an

Department of Crop and Soil Sciences 2 College of Agriculture and Life Sciences
extra N addition to corn after corn can achieve.
• Several management factors can impact the N fertilizer replacement value of soybean for corn in a rotation, but additional research is needed in the following areas before adjustments can be recommended:
o Soil type and properties:
• Some studies show higher N savings on medium textured soils with low organic matter (OM) than on sandy or heavy clay soils with higher OM.
o Tillage systems:
• Some studies show higher N savings in tilled than in reduced-till systems.
• There is no consistent link between previous year soybean yield and nitrogen fertilizer replacement value.
• The beneficial effects of soybean in the rotation last one year only.
N Guidelines for Corn after Soybean Based on this literature summary and limited research in New York State, we conclude that for corn grown after soybeans in New York State, the optimum economic N rate can be lowered by 20-30 lbs N/acre as compared to corn after corn. Table 1: Adjustment in Land Grant University recommended rate of nitrogen for corn after soybean versus corn after corn.
Location
N replacement value (lbs N/acre)
Northeast Connecticut No soybean production Maine 0 Massachusetts 0 New Hampshire 30 New Jersey 15 New York 20-30 Vermont 30
Mid-Atlantic Delaware 0.5 lb N/bu soybean yield Maryland 15-40 Pennsylvania 1 lb N/bu soybean yield Virginia 0.5 lb N/bu soybean yield* West Virginia 0.5 lb N/bu soybean yield*
Canada Ontario 27
*If yields are unknown, a N fertilizer replacement value of 20 lbs/acre is recommended.
This adjustment should be applied for one year only and is very much in line with recommendations from other land grant universities in the Northeast and Mid Atlantic States and Ontario, Canada (Table 1). To derive N guidelines for corn after soybean, determine N guidelines for corn without soybean or grass/alfalfa sod history (see nmsp.css.cornell.edu/nutrient_guidelines/) and subtract 20-30 lbs N/acre from the recommended N rate for corn after corn.
Additional Resources: o Cornell Guide for Integrated Field Crop Management:
http://www.fieldcrops.org. o Cornell Nutrient Guidelines for Field Crops:
http://nmsp.css.cornell.edu/nutrient guidelines. o Cornell University Agronomy Fact Sheets #2 (Nitrogen
Basics – The Nitrogen Cycle), #3 (Pre-sidedress Nitrate Test), #4 (Nitrogen Credits from Manure), and #21 (Nitrogen needs for first year corn). http://nmsp.css.cornell.edu/publications/factsheets.asp.
Disclaimer: This fact sheet reflects the current (and past) authors’ best effort to interpret a complex body of scientific research, and to translate this into practical management options. Following the guidance provided in this fact sheet does not assure compliance with any applicable law, rule, regulation or standard, or the achievement of particular discharge levels from agricultural land.
For more information
Nutrient Management Spear Program http://nmsp.css.cornell.edu
Quirine Ketterings, Sheryl Swink, Bill Cox, Karl Czymmek
2007
Cornell University
Nitrogen Fertilizer Replacement Value of Soybean for Corn
“Soybean N credits”
The optimum economic N rate for corn after soybean can be lowered by 20-30 lbs N/acre. This adjustment should be applied only for the first year of corn following soybean.

Fact Sheet 4
Nitrogen Credits from Manure
Agronomy Fact Sheet Series
Department of Crop and Soil Sciences 1 College of Agriculture and Life Sciences
Nitrogen Sources There are often four main sources of nitrogen (N) on farms: (1) soil organic matter; (2) organic residues (animal and green manure, compost, plowed under sods); (3) N fixed by legumes; and (4) inorganic fertilizer N. To calculate the amount of fertilizer N required for optimum economic yield, adjustments need to be made for fixed N and any N released from the organic sources. This fact sheets provides an overview of nitrogen credits from manure. Nitrogen in Manure There are primarily two forms of N in manure: inorganic (ammonium) N and organic N (Figure 1). The ammonium N is initially present in urine as urea in dairy or beef manure, and may account for about 50% of the total N. Urea in manure is no different from urea in commercial fertilizer. It converts rapidly to ammonium when conditions allow.
Total Manure Nitrogen
Urine Feces
Ammonium N(fast N)
Organic N(slow N)
Available N = + +
Ammonium N from present
application
Mineralized organic N from
present application
Mineralized organic N from
past applications
Mineralized slowly during the year of
application
Residual – mineralized very slowly during
future years
Figure 1: Manure N consists of ammonium and organic N (modified from Klausner, 1997). Ammonium N in Manure In principle, the ammonium from urea in manure is available for plant growth. However, part or all of it may be lost because ammonium is rapidly converted to ammonia gas. When manure is spread on the surface of the soil (especially high pH soils), ammonia
enters the air or “volatilizes”. Whenever manure is exposed to air on the barn floor, in the feedlot, in storage, or after spreading, N loss occurs. Testing is essential to determine how much inorganic N could potentially be conserved. Samples should be taken while loading the spreader or while spreading in the field for a good estimate of the nutrient value of the manure. Table 1 shows the estimated amount of ammonium N available for plant use for different application methods and timing. The table shows the benefits of manure incorporation shortly after spreading in the spring. For example, if manure contains 14 lbs inorganic N per 1000 gallons, incorporation of 6000 gallons within 1 day can save 55 lbs of fertilizer N!
Table 1: Estimated ammonia-N losses as affected by manure application method.
Manure Application Method %
remaining Injected during growing season 100 Incorporated within 1 day 65 Incorporated within 2 days 53 Incorporated within 3 days 41 Incorporated within 4 days 29 Incorporated within 5 days 17 No conservation or injected in fall 0
Figure 2: Surface application of manure without incorporation will result in the loss of inorganic N from the manure.
Department of Crop and Soil Sciences 2 College of Agriculture and Life Sciences
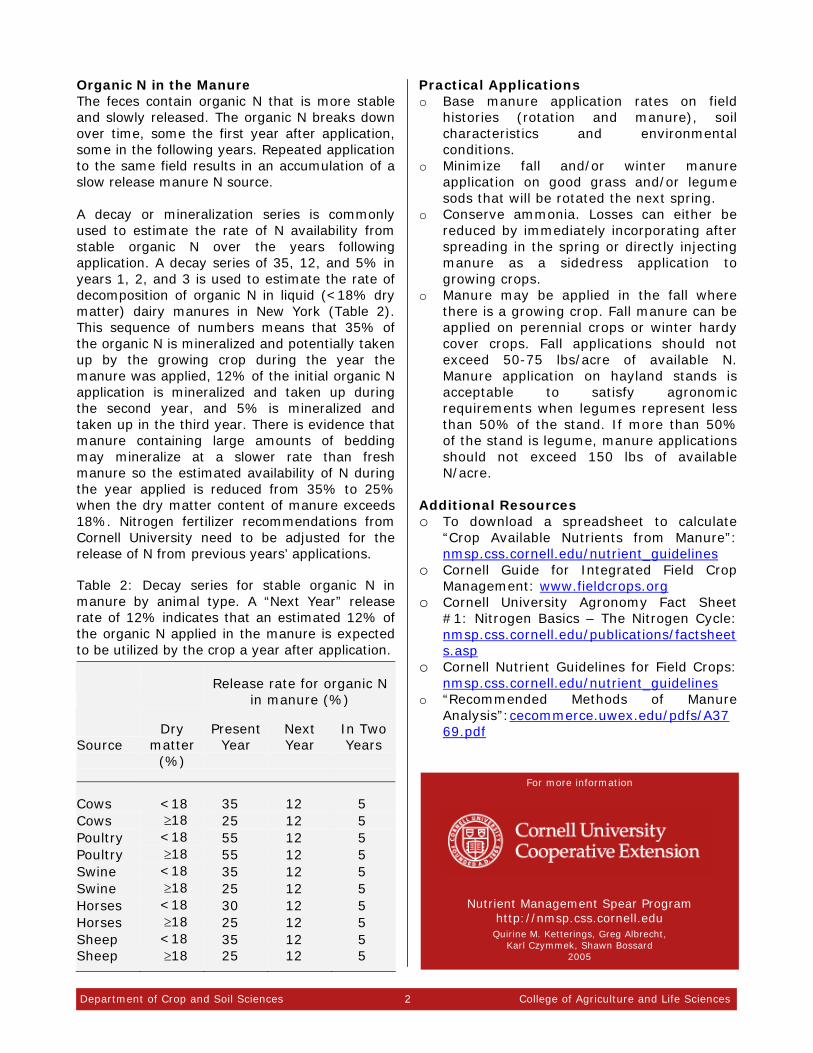
Organic N in the Manure The feces contain organic N that is more stable and slowly released. The organic N breaks down over time, some the first year after application, some in the following years. Repeated application to the same field results in an accumulation of a slow release manure N source. A decay or mineralization series is commonly used to estimate the rate of N availability from stable organic N over the years following application. A decay series of 35, 12, and 5% in years 1, 2, and 3 is used to estimate the rate of decomposition of organic N in liquid (<18% dry matter) dairy manures in New York (Table 2). This sequence of numbers means that 35% of the organic N is mineralized and potentially taken up by the growing crop during the year the manure was applied, 12% of the initial organic N application is mineralized and taken up during the second year, and 5% is mineralized and taken up in the third year. There is evidence that manure containing large amounts of bedding may mineralize at a slower rate than fresh manure so the estimated availability of N during the year applied is reduced from 35% to 25% when the dry matter content of manure exceeds 18%. Nitrogen fertilizer recommendations from Cornell University need to be adjusted for the release of N from previous years’ applications. Table 2: Decay series for stable organic N in manure by animal type. A “Next Year” release rate of 12% indicates that an estimated 12% of the organic N applied in the manure is expected to be utilized by the crop a year after application.
Release rate for organic N
in manure (%)
Source
Dry
matter (%)
Present Year
Next Year
In Two Years
Cows
<18 35 12 5
Cows ≥18 25 12 5 Poultry <18 55 12 5 Poultry ≥18 55 12 5 Swine <18 35 12 5 Swine ≥18 25 12 5 Horses <18 30 12 5 Horses ≥18 25 12 5 Sheep <18 35 12 5 Sheep ≥18 25 12 5
Practical Applications o Base manure application rates on field
histories (rotation and manure), soil characteristics and environmental conditions.
o Minimize fall and/or winter manure application on good grass and/or legume sods that will be rotated the next spring.
o Conserve ammonia. Losses can either be reduced by immediately incorporating after spreading in the spring or directly injecting manure as a sidedress application to growing crops.
o Manure may be applied in the fall where there is a growing crop. Fall manure can be applied on perennial crops or winter hardy cover crops. Fall applications should not exceed 50-75 lbs/acre of available N. Manure application on hayland stands is acceptable to satisfy agronomic requirements when legumes represent less than 50% of the stand. If more than 50% of the stand is legume, manure applications should not exceed 150 lbs of available N/acre.
Additional Resources o To download a spreadsheet to calculate
“Crop Available Nutrients from Manure”: nmsp.css.cornell.edu/nutrient_guidelines
o Cornell Guide for Integrated Field Crop Management: www.fieldcrops.org
o Cornell University Agronomy Fact Sheet #1: Nitrogen Basics – The Nitrogen Cycle: nmsp.css.cornell.edu/publications/factsheets.asp
o Cornell Nutrient Guidelines for Field Crops: nmsp.css.cornell.edu/nutrient_guidelines
o “Recommended Methods of Manure Analysis”:cecommerce.uwex.edu/pdfs/A3769.pdf
For more information
Nutrient Management Spear Program http://nmsp.css.cornell.edu
Quirine M. Ketterings, Greg Albrecht, Karl Czymmek, Shawn Bossard
2005
Fact Sheet 44
Nitrogen Fertilizers for Field Crops
Agronomy Fact Sheet Series
Field Crops Extension 1 College of Agriculture and Life Sciences
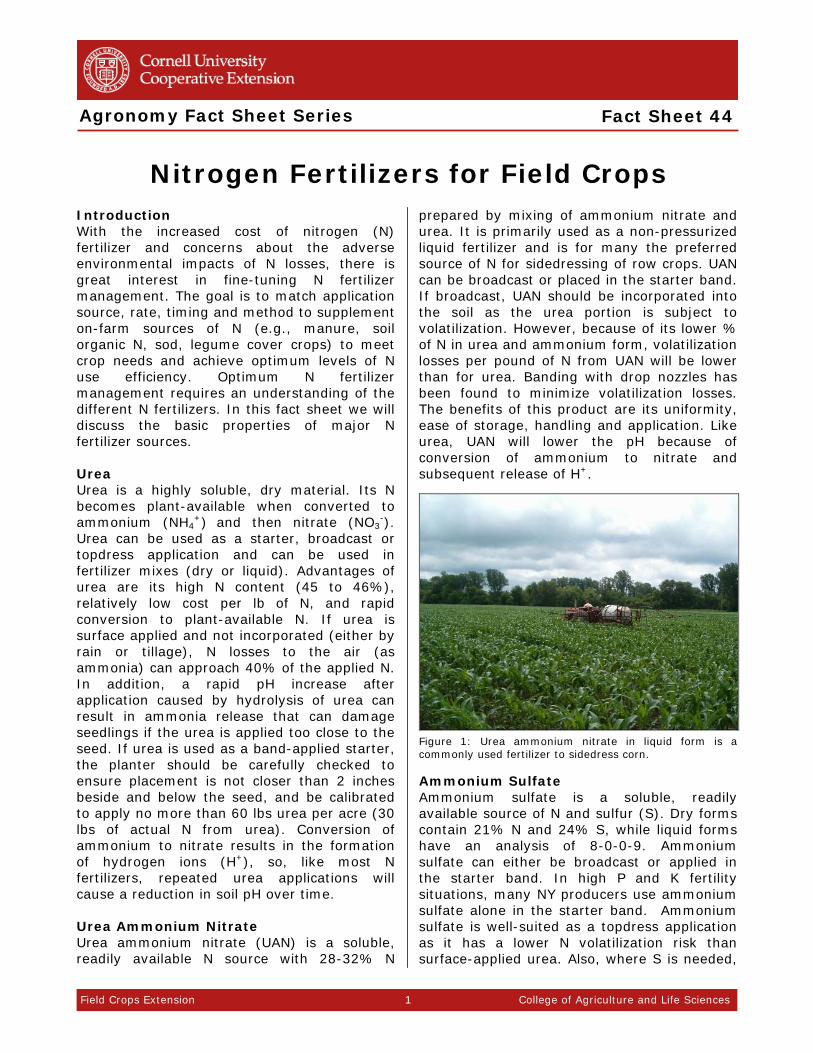
Introduction With the increased cost of nitrogen (N) fertilizer and concerns about the adverse environmental impacts of N losses, there is great interest in fine-tuning N fertilizer management. The goal is to match application source, rate, timing and method to supplement on-farm sources of N (e.g., manure, soil organic N, sod, legume cover crops) to meet crop needs and achieve optimum levels of N use efficiency. Optimum N fertilizer management requires an understanding of the different N fertilizers. In this fact sheet we will discuss the basic properties of major N fertilizer sources. Urea Urea is a highly soluble, dry material. Its N becomes plant-available when converted to ammonium (NH4
+) and then nitrate (NO3-).
Urea can be used as a starter, broadcast or topdress application and can be used in fertilizer mixes (dry or liquid). Advantages of urea are its high N content (45 to 46%), relatively low cost per lb of N, and rapid conversion to plant-available N. If urea is surface applied and not incorporated (either by rain or tillage), N losses to the air (as ammonia) can approach 40% of the applied N. In addition, a rapid pH increase after application caused by hydrolysis of urea can result in ammonia release that can damage seedlings if the urea is applied too close to the seed. If urea is used as a band-applied starter, the planter should be carefully checked to ensure placement is not closer than 2 inches beside and below the seed, and be calibrated to apply no more than 60 lbs urea per acre (30 lbs of actual N from urea). Conversion of ammonium to nitrate results in the formation of hydrogen ions (H+), so, like most N fertilizers, repeated urea applications will cause a reduction in soil pH over time. Urea Ammonium Nitrate Urea ammonium nitrate (UAN) is a soluble, readily available N source with 28-32% N
prepared by mixing of ammonium nitrate and urea. It is primarily used as a non-pressurized liquid fertilizer and is for many the preferred source of N for sidedressing of row crops. UAN can be broadcast or placed in the starter band. If broadcast, UAN should be incorporated into the soil as the urea portion is subject to volatilization. However, because of its lower % of N in urea and ammonium form, volatilization losses per pound of N from UAN will be lower than for urea. Banding with drop nozzles has been found to minimize volatilization losses. The benefits of this product are its uniformity, ease of storage, handling and application. Like urea, UAN will lower the pH because of conversion of ammonium to nitrate and subsequent release of H+.
Figure 1: Urea ammonium nitrate in liquid form is a commonly used fertilizer to sidedress corn.
Ammonium Sulfate Ammonium sulfate is a soluble, readily available source of N and sulfur (S). Dry forms contain 21% N and 24% S, while liquid forms have an analysis of 8-0-0-9. Ammonium sulfate can either be broadcast or applied in the starter band. In high P and K fertility situations, many NY producers use ammonium sulfate alone in the starter band. Ammonium sulfate is well-suited as a topdress application as it has a lower N volatilization risk than surface-applied urea. Also, where S is needed,

Field Crops Extension 2 College of Agriculture and Life Sciences
ammonium sulfate is a good source of S. The drawbacks to using ammonium sulfate include a relatively high salt index and greater acidification potential per unit N applied than other ammonium-containing N sources, higher cost per lb of N, and relative low N content, requiring more frequent refilling of hoppers. Anhydrous Ammonia Anhydrous ammonia has the highest percentage of N of all fertilizers (82% N) and tends to be the cheapest N source (cost per unit N). It is a high-pressure liquid that can be deep-banded before, at or after seeding provided that there is no direct seed contact. Anhydrous ammonia must be injected 6 to 8 inches deep into moist and friable soil to limit ammonia loss (liquid ammonia converts to gas when no longer under pressure). It must be stored under high pressure, which requires specially designed, well-maintained equipment and facilities should be well-protected for safety reasons. During application, personal protective equipment (gloves and goggles) should be used. Ammonium Nitrate Ammonium nitrate is an odorless salt with 33 to 34% N. It can be surface-applied or incorporated into the soil. It contains both ammonium and nitrate resulting in reduced volatilization risk as compared to urea, and the nitrate provides a directly available N source. Since it contains ammonium, this fertilizer also lowers the pH of the soil. Potassium Nitrate Potassium nitrate, also known as saltpeter or nitric acid, is considered a specialty fertilizer. It is a colorless transparent crystal or white powder with 14% N and 46% potassium (K). Potassium nitrate does not lower the soil pH. Mono-Ammonium Phosphate Mono-ammonium phosphate (MAP) contains readily available sources of N (11%), P (52%) and S (1.5%). MAP is a dry granular material that is applied alone or often blended with other materials such as potash. It can be broadcast, band-applied or placed in the seed furrow. MAP can lower the soil pH but is an excellent starter fertilizer. Di-Ammonium Phosphate Di-ammonium phosphate (DAP) is dry fertilizer
that contains readily available sources of N (18%) and P (46%). Formation of free ammonia produced after mixing of DAP with soil can cause seedling injury as described for urea. To prevent such injury using DAP, it is recommended to limit band-applications to (1) 65 lbs per acre of DAP, or (2) 30 pounds of urea N plus N from DAP. Chilean Nitrate Chilean nitrate can be used in conventional and organic cropping systems (permitted for use by USDA/NOP in 2003). It contains 16% of a readily plant-available form of nitrate-N and sodium. It is available in a dry, flowable prill form. Enhanced-Efficiency Nitrogen Sources Enhanced efficiency N sources are designed to reduce losses of N due to leaching, denitrification and/or volatilization. For more information on these enhanced-efficiency fertilizers see Agronomy Fact Sheet #45. Concluding Remarks Applying the right source of N fertilizer at the right rate, time, and place is critical to proper N management. For the best results, apply N only when needed, calibrate application equipment to ensure proper placement, and adjust source, rate and timing to meet N needs and avoid seed or seedling injury. Additional Resources o Nutrient Management Spear Program Agronomy Fact
Sheet Series. http://nmsp.css.cornell.edu. Disclaimer This fact sheet reflects the current (and past) authors’ best effort to interpret a complex body of scientific research, and to translate this into practical management options. Following the guidance provided in this fact sheet does not assure compliance with any applicable law, rule, regulation or standard, or the achievement of particular discharge levels from agricultural land.
For more information
Nutrient Management Spear Program http://nmsp.css.cornell.edu
John Weiss, Tom Bruulsema (IPNI), Mike Hunter, Karl Czymmek, Joe Lawrence, Quirine Ketterings
2009
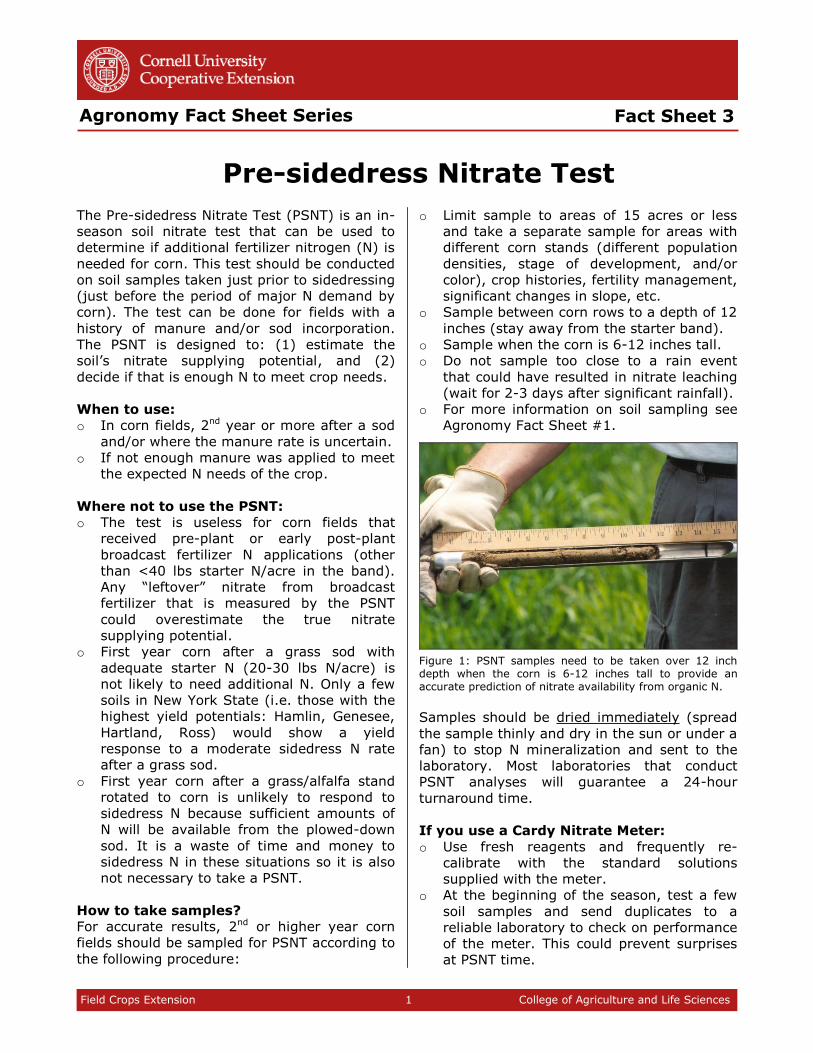
Fact Sheet 3
Pre-sidedress Nitrate Test
Agronomy Fact Sheet Series
Field Crops Extension 1 College of Agriculture and Life Sciences
The Pre-sidedress Nitrate Test (PSNT) is an in-
season soil nitrate test that can be used to
determine if additional fertilizer nitrogen (N) is
needed for corn. This test should be conducted
on soil samples taken just prior to sidedressing
(just before the period of major N demand by
corn). The test can be done for fields with a
history of manure and/or sod incorporation.
The PSNT is designed to: (1) estimate the
soil’s nitrate supplying potential, and (2)
decide if that is enough N to meet crop needs.
When to use:
o In corn fields, 2nd year or more after a sod
and/or where the manure rate is uncertain.
o If not enough manure was applied to meet
the expected N needs of the crop.
Where not to use the PSNT:
o The test is useless for corn fields that
received pre-plant or early post-plant
broadcast fertilizer N applications (other
than <40 lbs starter N/acre in the band).
Any “leftover” nitrate from broadcast
fertilizer that is measured by the PSNT
could overestimate the true nitrate
supplying potential.
o First year corn after a grass sod with
adequate starter N (20-30 lbs N/acre) is
not likely to need additional N. Only a few
soils in New York State (i.e. those with the
highest yield potentials: Hamlin, Genesee,
Hartland, Ross) would show a yield
response to a moderate sidedress N rate
after a grass sod.
o First year corn after a grass/alfalfa stand
rotated to corn is unlikely to respond to
sidedress N because sufficient amounts of
N will be available from the plowed-down
sod. It is a waste of time and money to
sidedress N in these situations so it is also
not necessary to take a PSNT.
How to take samples?
For accurate results, 2nd or higher year corn
fields should be sampled for PSNT according to
the following procedure:
o Limit sample to areas of 15 acres or less
and take a separate sample for areas with
different corn stands (different population
densities, stage of development, and/or
color), crop histories, fertility management,
significant changes in slope, etc.
o Sample between corn rows to a depth of 12
inches (stay away from the starter band).
o Sample when the corn is 6-12 inches tall.
o Do not sample too close to a rain event
that could have resulted in nitrate leaching
(wait for 2-3 days after significant rainfall).
o For more information on soil sampling see
Agronomy Fact Sheet #1.
Figure 1: PSNT samples need to be taken over 12 inch depth when the corn is 6-12 inches tall to provide an accurate prediction of nitrate availability from organic N.
Samples should be dried immediately (spread
the sample thinly and dry in the sun or under a
fan) to stop N mineralization and sent to the
laboratory. Most laboratories that conduct
PSNT analyses will guarantee a 24-hour
turnaround time.
If you use a Cardy Nitrate Meter:
o Use fresh reagents and frequently re-
calibrate with the standard solutions
supplied with the meter.
o At the beginning of the season, test a few
soil samples and send duplicates to a
reliable laboratory to check on performance
of the meter. This could prevent surprises
at PSNT time.
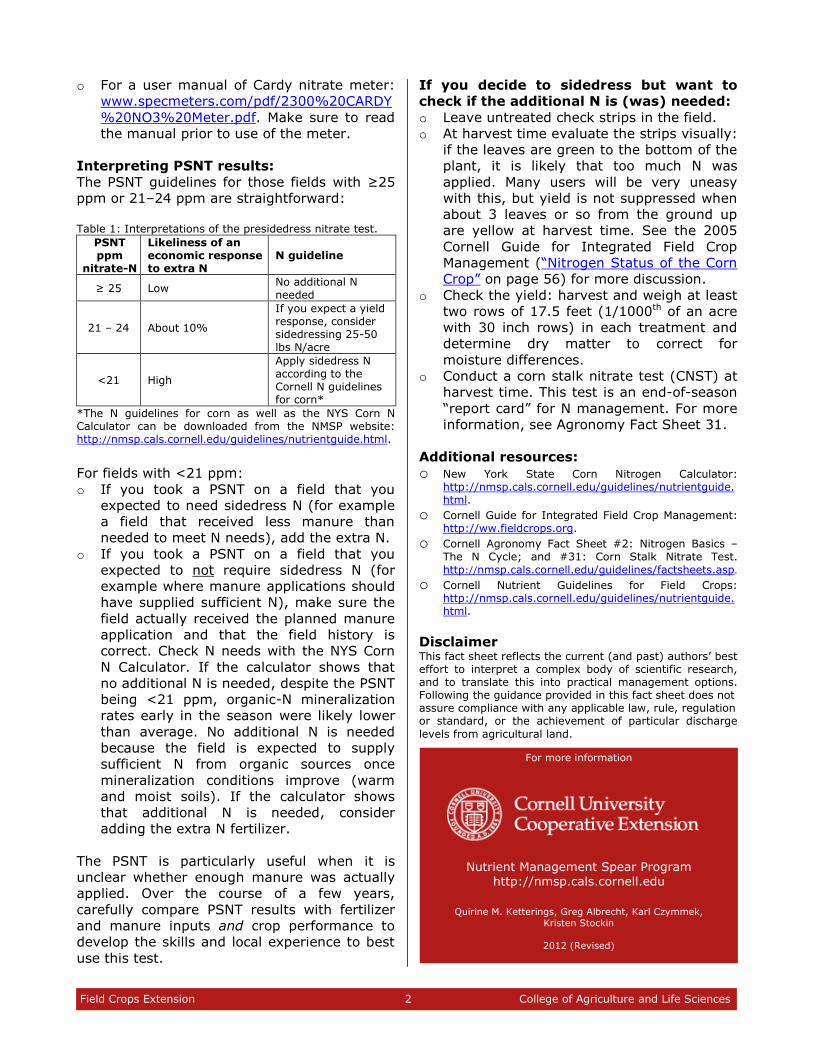
Field Crops Extension 2 College of Agriculture and Life Sciences
o For a user manual of Cardy nitrate meter:
www.specmeters.com/pdf/2300%20CARDY
%20NO3%20Meter.pdf. Make sure to read
the manual prior to use of the meter.
Interpreting PSNT results:
The PSNT guidelines for those fields with ≥25
ppm or 21–24 ppm are straightforward:
Table 1: Interpretations of the presidedress nitrate test.
PSNT ppm
nitrate-N
Likeliness of an economic response to extra N
N guideline
≥ 25 Low No additional N needed
21 – 24 About 10%
If you expect a yield response, consider sidedressing 25-50 lbs N/acre
<21 High
Apply sidedress N according to the Cornell N guidelines for corn*
*The N guidelines for corn as well as the NYS Corn N Calculator can be downloaded from the NMSP website: http://nmsp.cals.cornell.edu/guidelines/nutrientguide.html.
For fields with <21 ppm:
o If you took a PSNT on a field that you
expected to need sidedress N (for example
a field that received less manure than
needed to meet N needs), add the extra N.
o If you took a PSNT on a field that you
expected to not require sidedress N (for
example where manure applications should
have supplied sufficient N), make sure the
field actually received the planned manure
application and that the field history is
correct. Check N needs with the NYS Corn
N Calculator. If the calculator shows that
no additional N is needed, despite the PSNT
being <21 ppm, organic-N mineralization
rates early in the season were likely lower
than average. No additional N is needed
because the field is expected to supply
sufficient N from organic sources once
mineralization conditions improve (warm
and moist soils). If the calculator shows
that additional N is needed, consider
adding the extra N fertilizer.
The PSNT is particularly useful when it is
unclear whether enough manure was actually
applied. Over the course of a few years,
carefully compare PSNT results with fertilizer
and manure inputs and crop performance to
develop the skills and local experience to best
use this test.
If you decide to sidedress but want to
check if the additional N is (was) needed:
o Leave untreated check strips in the field.
o At harvest time evaluate the strips visually:
if the leaves are green to the bottom of the
plant, it is likely that too much N was
applied. Many users will be very uneasy
with this, but yield is not suppressed when
about 3 leaves or so from the ground up
are yellow at harvest time. See the 2005
Cornell Guide for Integrated Field Crop
Management (“Nitrogen Status of the Corn
Crop” on page 56) for more discussion.
o Check the yield: harvest and weigh at least
two rows of 17.5 feet (1/1000th of an acre
with 30 inch rows) in each treatment and
determine dry matter to correct for
moisture differences.
o Conduct a corn stalk nitrate test (CNST) at
harvest time. This test is an end-of-season
“report card” for N management. For more
information, see Agronomy Fact Sheet 31.
Additional resources:
o New York State Corn Nitrogen Calculator: http://nmsp.cals.cornell.edu/guidelines/nutrientguide.html.
o Cornell Guide for Integrated Field Crop Management: http://ww.fieldcrops.org.
o Cornell Agronomy Fact Sheet #2: Nitrogen Basics – The N Cycle; and #31: Corn Stalk Nitrate Test.
http://nmsp.cals.cornell.edu/guidelines/factsheets.asp.
o Cornell Nutrient Guidelines for Field Crops: http://nmsp.cals.cornell.edu/guidelines/nutrientguide.html.
Disclaimer This fact sheet reflects the current (and past) authors’ best effort to interpret a complex body of scientific research, and to translate this into practical management options. Following the guidance provided in this fact sheet does not assure compliance with any applicable law, rule, regulation or standard, or the achievement of particular discharge
levels from agricultural land.
For more information
Nutrient Management Spear Program http://nmsp.cals.cornell.edu
Quirine M. Ketterings, Greg Albrecht, Karl Czymmek,
Kristen Stockin
2012 (Revised)
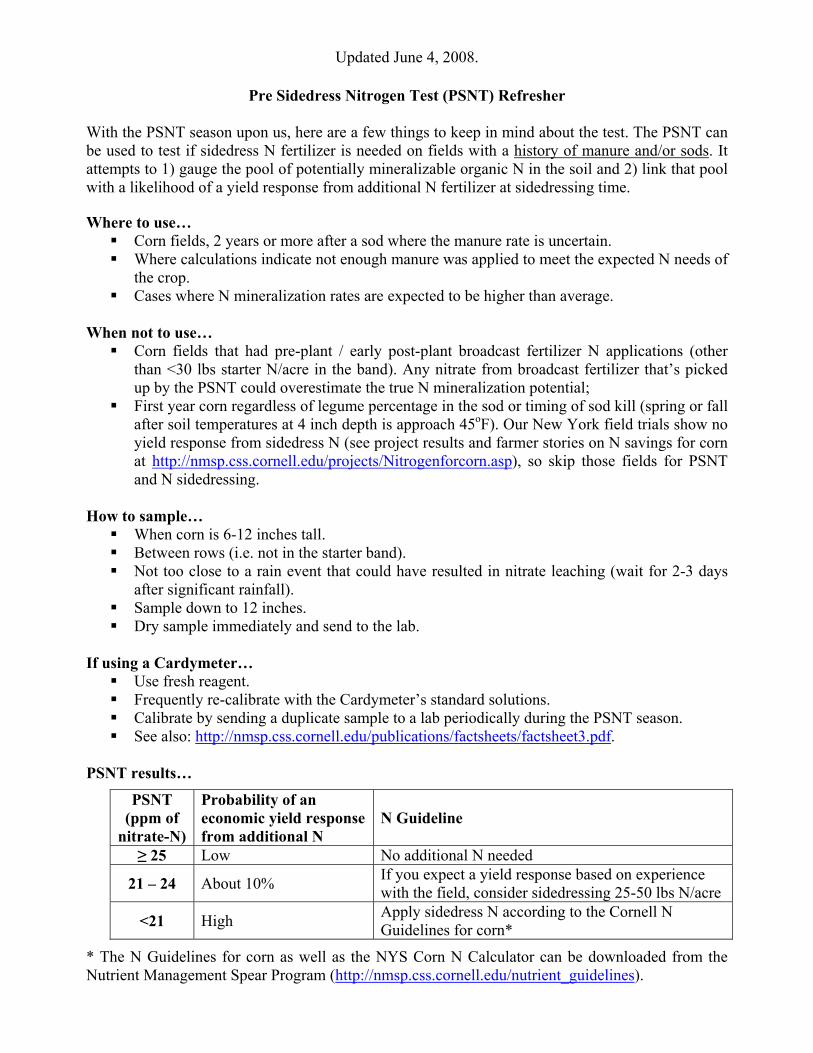
Updated June 4, 2008.
Pre Sidedress Nitrogen Test (PSNT) Refresher With the PSNT season upon us, here are a few things to keep in mind about the test. The PSNT can be used to test if sidedress N fertilizer is needed on fields with a history of manure and/or sods. It attempts to 1) gauge the pool of potentially mineralizable organic N in the soil and 2) link that pool with a likelihood of a yield response from additional N fertilizer at sidedressing time. Where to use…
Corn fields, 2 years or more after a sod where the manure rate is uncertain. Where calculations indicate not enough manure was applied to meet the expected N needs of
the crop. Cases where N mineralization rates are expected to be higher than average.
When not to use…
Corn fields that had pre-plant / early post-plant broadcast fertilizer N applications (other than <30 lbs starter N/acre in the band). Any nitrate from broadcast fertilizer that’s picked up by the PSNT could overestimate the true N mineralization potential;
First year corn regardless of legume percentage in the sod or timing of sod kill (spring or fall after soil temperatures at 4 inch depth is approach 45oF). Our New York field trials show no yield response from sidedress N (see project results and farmer stories on N savings for corn at http://nmsp.css.cornell.edu/projects/Nitrogenforcorn.asp), so skip those fields for PSNT and N sidedressing.
How to sample…
When corn is 6-12 inches tall. Between rows (i.e. not in the starter band). Not too close to a rain event that could have resulted in nitrate leaching (wait for 2-3 days
after significant rainfall). Sample down to 12 inches. Dry sample immediately and send to the lab.
If using a Cardymeter…
Use fresh reagent. Frequently re-calibrate with the Cardymeter’s standard solutions. Calibrate by sending a duplicate sample to a lab periodically during the PSNT season. See also: http://nmsp.css.cornell.edu/publications/factsheets/factsheet3.pdf.
PSNT results…
PSNT (ppm of
nitrate-N)
Probability of an economic yield response from additional N
N Guideline
≥ 25 Low No additional N needed
21 – 24 About 10% If you expect a yield response based on experience with the field, consider sidedressing 25-50 lbs N/acre
<21 High Apply sidedress N according to the Cornell N Guidelines for corn*
* The N Guidelines for corn as well as the NYS Corn N Calculator can be downloaded from the Nutrient Management Spear Program (http://nmsp.css.cornell.edu/nutrient_guidelines).

Updated June 4, 2008.
The PSNT guidelines for those fields in the ≥25 ppm and the 21–24 ppm ranges are straightforward. For fields with <21 ppm (assuming a good sample was taken), the N guideline for the PSNT falls into one of two camps:
1) If you took a PSNT on a field that you expected to require some sidedress N (i.e. the pre-
season N recommendation called for additional N), then make sure the original N management plan for the field is still relevant and, if so, put that plan for sidedress N into action.
2) If you took a PSNT on a field that you expected to not require sidedress N (e.g. it received enough manure), make sure the field actually received the planned manure application, that the field history is correct, and then run it through the NYS Corn N Calculator. If the revised guideline still doesn’t call for additional N, despite being <21 ppm, organic-N mineralization rates and/or N losses were likely significantly different than average.
The PSNT is particularly useful when there is uncertainty as to whether enough manure was actually applied to meet expected corn N requirements. PSNT users and anyone else attempting to adjust N applications to corn, should, over the course of a few years, carefully compare test results with fertilizer and manure inputs AND crop performance to develop the skills and local experience to best use this test. Consider the following for this year to begin to build your experience bank.
If you decide to sidedress: Leave untreated check strips on fields:
that received enough manure to satisfy N needs based on NYS Corn N Guidelines, yet have PSNT results<21 ppm;
second year corn fields that received some manure; first year corn fields following a good grass or grass/legume sod (if in the habit of
sidedressing these based on PSNT). At harvest, visit the strips to judge if the extra N was needed. Evaluate visually: If the leaves are green to the bottom of the plant, it is likely that TOO
MUCH N was applied. As plants mature, the lower leaves become useless and so a plant will recycle N from there for other uses. Many users will be very uneasy with this, but yield is not suppressed when about 3 leaves or so from the ground up are YELLOW at harvest time. See the 2007 Cornell Guide (“Nitrogen Status of the Corn Crop” on page 51-53) for more discussion on this.
Check the yield: harvest and weigh at least two rows over a 17.5 foot length (1/1000th of an acre with 30 inch rows) of representative areas in each treatment and run dry matter to correct for moisture differences.
Please contact Quirine Ketterings ([email protected] or 607-255-3061) or Karl Czymmek ([email protected] or 607-255-4890) with any questions, discussions, or interest in on-going N for corn research.

Fact Sheet 36
Illinois Soil Nitrogen Test (ISNT)
Agronomy Fact Sheet Series
Field Crops Extension 1 College of Agriculture and Life Sciences
Accounting for in-field sources of nitrogen
Plants take up nitrogen (N) from different
sources; plant residues, roots, past manure
applications, soil organic matter and fertilizer N
all contribute to the total amount of N used by
a crop. The Cornell N equation calculates an N
guideline for corn by taking into account the
amount of N needed by the corn crop (based
on soil and drainage specific corn yield
potentials), and N available from sources
already on the farm, including biomass from
previous crops (sod N or soybean N credits), N
from past manure applications, and N expected
to be mineralized from soil organic matter
(SOM) that growing season (soil N supply).
Once in-field sources are accounted for the
final N application value is adjusted (upward)
to reflect fertilizer uptake inefficiencies (N
fertilizer uptake efficiency under good
management ranges from 50-75%). See
Agronomy Factsheet #35 (N Guidelines for
Corn) for more details.
Variability of soil N supply
A major factor in the Cornell N equation is soil
N supply, yet soil N supply is very difficult to
predict accurately. The soil N-supply values
used for the Cornell N equation for corn are
estimates (book values) developed for more
than 600 New York soil types. Book values are
based on studies of N uptake by continuous
corn grown without additional N. For New York
soils, soil N supply can range from 50 to 140
lbs N/acre, with 60-70 lbs N/acre typical for
many common agricultural soils.
There are many challenges to develop a
soil test that can more accurately predict the
soil N-supply for a specific field in a timely
manner. Soil organic matter levels have been
used to gauge soil N availability; however, this
method is not accurate. Typically, to determine
SOM as reported on a soil fertility report, a soil
sample is burned at a very high temperature.
This method is called loss-on-ignition (LOI).
The difference in mass before and after
burning is converted into a percent SOM
(%SOM). This LOI value on its own, although
useful for other purposes, is not a good
predictor of soil N supply as it does not
distinguish between SOM with readily available
N and SOM that does not supply N, and
proportions vary across fields and farms. Until
recently, the best option to estimate if there
was sufficient plant available N from organic
sources (manure, sod, soil) was the pre-
sidedress nitrate test (PSNT) but the PSNT
presents some practical sampling challenges,
results can be misleading in both dry and wet
springs, and often N management decisions
need to be made earlier in the season.
Illinois Soil Nitrogen Test (ISNT)
Field research in New York the past 8 years
has shown a new soil N test, the Illinois Soil
Nitrogen Test (ISNT), to be the best option for
determining soil N supply potential for New
York corn growers. The ISNT is a laboratory
test that estimates the amount of readily
mineralizable soil organic N. The test has been
83% accurate in our trials predicting if soil-N
supply alone could provide adequate N for a
corn crop in New York.
Interpreting the results
To interpret ISNT-N values, we have to know
both the ISNT-N value and the LOI value
(Figure 1). Three results are possible: (1)
above the curve (the black line in Figure 1)
and outside the upper marginal grey zone; (2)
below the curve and outside the lower
marginal grey zone; or (3) close to the curve
in the marginal (grey) zone.
Figure 1: ISNTxLOI critical value curve for predicting if corn will respond to extra N.
0
100
200
300
400
500
600
0 1 2 3 4 5 6 7 8 9 10 11 12 13 14
ISN
T (
pp
m)
LOI (%)
Optimum Corn does not need extra N, soil can supply enough.
Manure applications may be desired to maintain optimum ISNT levels.
Low Corn will likely need manure or fertilizer N
inputs, refer to Cornell N guidelines.
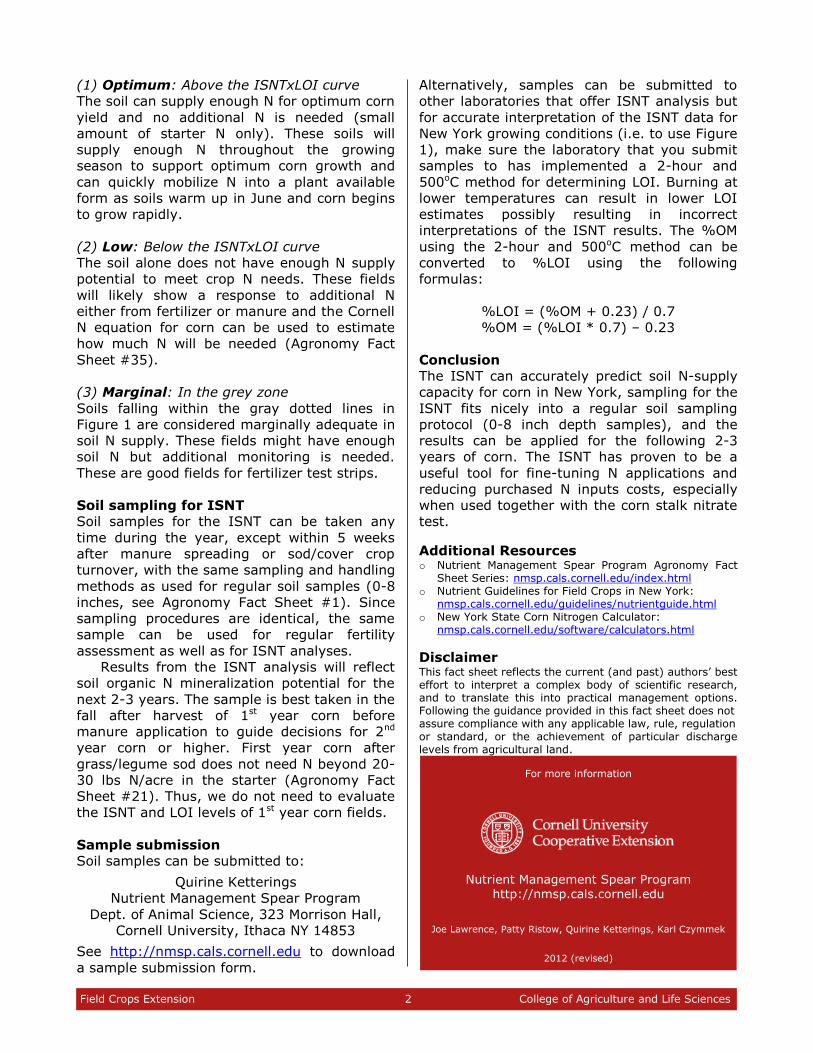
Field Crops Extension 2 College of Agriculture and Life Sciences
(1) Optimum: Above the ISNTxLOI curve
The soil can supply enough N for optimum corn
yield and no additional N is needed (small
amount of starter N only). These soils will
supply enough N throughout the growing
season to support optimum corn growth and
can quickly mobilize N into a plant available
form as soils warm up in June and corn begins
to grow rapidly.
(2) Low: Below the ISNTxLOI curve
The soil alone does not have enough N supply
potential to meet crop N needs. These fields
will likely show a response to additional N
either from fertilizer or manure and the Cornell
N equation for corn can be used to estimate
how much N will be needed (Agronomy Fact
Sheet #35).
(3) Marginal: In the grey zone
Soils falling within the gray dotted lines in
Figure 1 are considered marginally adequate in
soil N supply. These fields might have enough
soil N but additional monitoring is needed.
These are good fields for fertilizer test strips.
Soil sampling for ISNT
Soil samples for the ISNT can be taken any
time during the year, except within 5 weeks
after manure spreading or sod/cover crop
turnover, with the same sampling and handling
methods as used for regular soil samples (0-8
inches, see Agronomy Fact Sheet #1). Since
sampling procedures are identical, the same
sample can be used for regular fertility
assessment as well as for ISNT analyses.
Results from the ISNT analysis will reflect
soil organic N mineralization potential for the
next 2-3 years. The sample is best taken in the
fall after harvest of 1st year corn before
manure application to guide decisions for 2nd
year corn or higher. First year corn after
grass/legume sod does not need N beyond 20-
30 lbs N/acre in the starter (Agronomy Fact
Sheet #21). Thus, we do not need to evaluate
the ISNT and LOI levels of 1st year corn fields.
Sample submission
Soil samples can be submitted to:
Quirine Ketterings
Nutrient Management Spear Program
Dept. of Animal Science, 323 Morrison Hall,
Cornell University, Ithaca NY 14853
See http://nmsp.cals.cornell.edu to download
a sample submission form.
Alternatively, samples can be submitted to
other laboratories that offer ISNT analysis but
for accurate interpretation of the ISNT data for
New York growing conditions (i.e. to use Figure
1), make sure the laboratory that you submit
samples to has implemented a 2-hour and
500oC method for determining LOI. Burning at
lower temperatures can result in lower LOI
estimates possibly resulting in incorrect
interpretations of the ISNT results. The %OM
using the 2-hour and 500oC method can be
converted to %LOI using the following
formulas:
%LOI = (%OM + 0.23) / 0.7
%OM = (%LOI * 0.7) – 0.23
Conclusion
The ISNT can accurately predict soil N-supply
capacity for corn in New York, sampling for the
ISNT fits nicely into a regular soil sampling
protocol (0-8 inch depth samples), and the
results can be applied for the following 2-3
years of corn. The ISNT has proven to be a
useful tool for fine-tuning N applications and
reducing purchased N inputs costs, especially
when used together with the corn stalk nitrate
test.
Additional Resources o Nutrient Management Spear Program Agronomy Fact
Sheet Series: nmsp.cals.cornell.edu/index.html o Nutrient Guidelines for Field Crops in New York:
nmsp.cals.cornell.edu/guidelines/nutrientguide.html o New York State Corn Nitrogen Calculator: nmsp.cals.cornell.edu/software/calculators.html
Disclaimer This fact sheet reflects the current (and past) authors’ best effort to interpret a complex body of scientific research, and to translate this into practical management options. Following the guidance provided in this fact sheet does not assure compliance with any applicable law, rule, regulation or standard, or the achievement of particular discharge levels from agricultural land.
For more information
Nutrient Management Spear Program
http://nmsp.cals.cornell.edu
Joe Lawrence, Patty Ristow, Quirine Ketterings, Karl Czymmek
2012 (revised)

Fact Sheet 31
Corn Stalk Nitrate Test (CSNT)
Agronomy Fact Sheet Series
Field Crops Extension 1 College of Agriculture and Life Sciences
Recent increases in nitrogen (N) fertilizer costs
have caused producers to strive for better use
of the N already on the farm (manure, sods,
cover crops, etc.) to meet N requirements of
silage corn. However, at the end of the
growing season, unless drastic yield losses are
observed, it is often difficult to determine if the
corn crop had enough N for optimum yield that
growing season. An end-of-season stalk nitrate
test for evaluation of the N supply during the
growing season is useful as a management
tool as it helps identify if adjustments in N
management are needed in future years. In
1996 researchers at Iowa State University
developed a new tissue test: the Corn Stalk
Nitrate Test (CSNT). In their studies, this plant
test could evaluate management practices
used in any corn field in any year.
Since it was first developed, the CSNT has
gained use in several parts of the US and over
the past three years we have tested its
performance under New York growing
conditions. In this fact sheet we summarize
our research findings and give interpretations
for New York soils and growing conditions.
Sampling procedure
Timing
For corn silage, samples could be collected
starting one week prior to harvest until four
days after harvest.
Method
The portion of the stalk used for the test is
important as the test is calibrated for the
nitrates that accumulate in this part of the
stalk. First measure up 6 inches from the soil
surface and cut the plant. Then measure 8
inches up from this first cut, and make a 2nd
cut. These cuts result in an 8-inch sample
taken from between 6 and 14 inches above the
ground (see Figure 1). Make sure not to touch
the soil with the corn stalk segment;
contamination with soil will impact test results.
Split each stalk into four parts by cutting it
lengthwise using a clean kitchen knife. Discard
3 of the 4 quarters. This will quicken the
drying process without compromising on the
number of plants sampled. In a uniform field
(≤15 acres in size), fifteen 8-inch segments
should be randomly cut and combined to make
one sample to be submitted for analysis. Areas
differing in management or soil type should be
sampled separately. Similarly, fields that are
more than 15 acres large should be subdivided
into smaller sampling units.
Figure 1: Sample an 8-inch segment of the corn stalk between 6 and 14 inches above the ground.
Sample submission
Samples should be submitted as soon after
collection as possible. Samples should be
placed in a paper bag (not plastic). This allows
for some drying to occur and minimizes growth
of mold. Samples should not be stored for
more than 1 day before shipment to the
laboratory. See http://nmsp.cals.cornell.edu to
download a sample submission form. Samples
can be submitted for CSNT analyses to:
Quirine Ketterings
Nutrient Management Spear Program
Dept. of Animal Science, 323 Morrison Hall,
Cornell University, Ithaca NY 14853
Interpretation of test results
Research conducted in New York supports the
following interpretations:
Low = less than 250 ppm N
Marginal = 250 to 750 ppm N
Optimal = 750 to 2000 ppm N
Excess = greater than 2000 ppm N
Corn stalk
segment
8 inches in
length for
testing
Bottom cut
6 inches above ground
Top cut
14 inches above ground
Corn
Stalk Nitrate Test
Field Sampling
Procedure
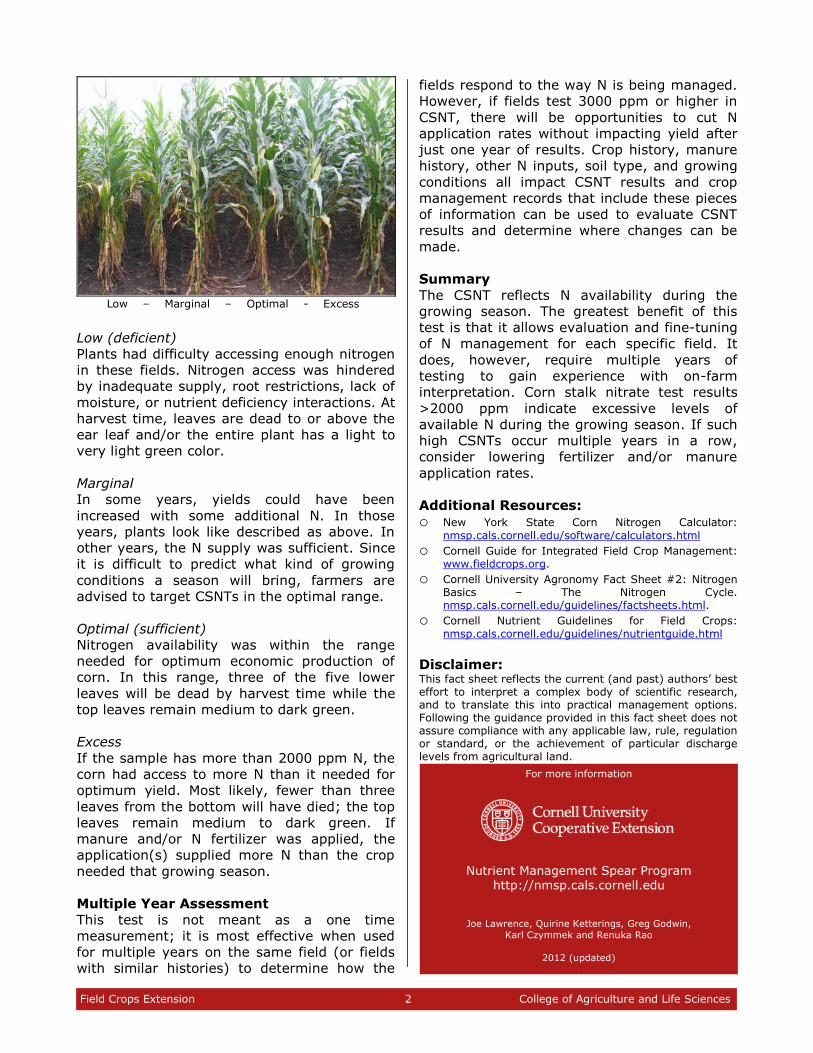
Field Crops Extension 2 College of Agriculture and Life Sciences
Low – Marginal – Optimal - Excess
Low (deficient)
Plants had difficulty accessing enough nitrogen
in these fields. Nitrogen access was hindered
by inadequate supply, root restrictions, lack of
moisture, or nutrient deficiency interactions. At
harvest time, leaves are dead to or above the
ear leaf and/or the entire plant has a light to
very light green color.
Marginal
In some years, yields could have been
increased with some additional N. In those
years, plants look like described as above. In
other years, the N supply was sufficient. Since
it is difficult to predict what kind of growing
conditions a season will bring, farmers are
advised to target CSNTs in the optimal range.
Optimal (sufficient)
Nitrogen availability was within the range
needed for optimum economic production of
corn. In this range, three of the five lower
leaves will be dead by harvest time while the
top leaves remain medium to dark green.
Excess
If the sample has more than 2000 ppm N, the
corn had access to more N than it needed for
optimum yield. Most likely, fewer than three
leaves from the bottom will have died; the top
leaves remain medium to dark green. If
manure and/or N fertilizer was applied, the
application(s) supplied more N than the crop
needed that growing season.
Multiple Year Assessment
This test is not meant as a one time
measurement; it is most effective when used
for multiple years on the same field (or fields
with similar histories) to determine how the
fields respond to the way N is being managed.
However, if fields test 3000 ppm or higher in
CSNT, there will be opportunities to cut N
application rates without impacting yield after
just one year of results. Crop history, manure
history, other N inputs, soil type, and growing
conditions all impact CSNT results and crop
management records that include these pieces
of information can be used to evaluate CSNT
results and determine where changes can be
made.
Summary
The CSNT reflects N availability during the
growing season. The greatest benefit of this
test is that it allows evaluation and fine-tuning
of N management for each specific field. It
does, however, require multiple years of
testing to gain experience with on-farm
interpretation. Corn stalk nitrate test results
>2000 ppm indicate excessive levels of
available N during the growing season. If such
high CSNTs occur multiple years in a row,
consider lowering fertilizer and/or manure
application rates.
Additional Resources:
o New York State Corn Nitrogen Calculator:
nmsp.cals.cornell.edu/software/calculators.html
o Cornell Guide for Integrated Field Crop Management: www.fieldcrops.org.
o Cornell University Agronomy Fact Sheet #2: Nitrogen Basics – The Nitrogen Cycle. nmsp.cals.cornell.edu/guidelines/factsheets.html.
o Cornell Nutrient Guidelines for Field Crops:
nmsp.cals.cornell.edu/guidelines/nutrientguide.html
Disclaimer: This fact sheet reflects the current (and past) authors’ best effort to interpret a complex body of scientific research, and to translate this into practical management options. Following the guidance provided in this fact sheet does not assure compliance with any applicable law, rule, regulation or standard, or the achievement of particular discharge levels from agricultural land.
For more information
Nutrient Management Spear Program http://nmsp.cals.cornell.edu
Joe Lawrence, Quirine Ketterings, Greg Godwin,
Karl Czymmek and Renuka Rao
2012 (updated)