ORIGINAL ARTICLE
doi:10.1111/evo.12206
NEUROSPORA AND THE DEAD-ENDHYPOTHESIS: GENOMIC CONSEQUENCESOF SELFING IN THE MODEL GENUSAnastasia Gioti,1,2 Jason E. Stajich,3 and Hanna Johannesson1
1Department of Evolutionary Biology, Uppsala University, Norbyvagen 18D, 752 36 Uppsala, Sweden2E-mail: [email protected]
3Department of Plant Pathology & Microbiology and Institute for Integrative Genome Biology, University of
California-Riverside (UCR), Riverside, California
Received December 31, 2012
Accepted June 24, 2013
Data Archived: Dryad doi:10.5061/dryad.4n9b4
It is becoming increasingly evident that adoption of different reproductive strategies, such as sexual selfing and asexuality, greatly
impacts genome evolution. In this study, we test theoretical predictions on genomic maladaptation of selfing lineages using
empirical data from the model fungus Neurospora. We sequenced the genomes of four species representing distinct transitions
to selfing within the history of the genus, as well as the transcriptome of one of these, and compared with available data from
three outcrossing species. Our results provide evidence for a relaxation of purifying selection in protein-coding genes and for a
reduced efficiency of transposable element silencing by Repeat Induced Point mutation. A reduction in adaptive evolution was
also identified in the form of reduced codon usage bias in highly expressed genes of selfing Neurospora, but this result may be
confounded by mutational bias. Potentially counteracting these negative effects, the nucleotide substitution rate and the spread
of transposons is reduced in selfing species. We suggest that differences in substitution rate relate to the absence, in selfing
Neurospora, of the asexual pathway producing conidia. Our results support the dead-end theory and show that Neurospora
genomes bear signatures of both sexual and asexual reproductive mode.
KEY WORDS: Evolutionary genomics, mating systems, molecular evolution, mutations, reproductive strategies, selection—
natural.
Selfing is a widespread strategy allowing reproductive assurance
(Aanen and Hoekstra 2007; Busch and Delph 2011), but comes
with long-term evolutionary costs. Population genetic theory
Genome assemblies and raw reads presented in this study are de-
posited at the EMBL and SRA databases under accession numbers
CAPO020000001–CAPO020013167, HF970591–HF972568 (N. africana),
CAPP020000001–CAPP020022228, HF972687–HF975603 (N. sublineo-
lata), CAPQ020000001–CAPQ020030909, HF975656-HF979206 (N. pan-
nonica), and CAPR020000001–CAPR020040841, HF979207–HF985214
(N. terricola). Raw reads from N. africana RNA sequencing are available at the
SRA under accession ERP002224. Sequence alignments are available at the
digital repository Dryad under accession number doi:10.5061/dryad.4n9b4.
predicts that selfing populations will suffer from a reduced
effective recombination rate and population size (Pollack 1987;
Charlesworth and Wright 2001). Consequently, a reduced effi-
cacy of purifying selection (Hill and Robertson 1966) and a more
important role for genetic drift are expected in these populations
(Otto and Lenormand 2002), which will show an excess of
slightly deleterious mutations and lower frequencies of adaptive
alleles (Charlesworth 1992). The long-term negative effects
of selfing have been formalized in the “dead-end” hypothesis,
which makes two assumptions: first, transitions from outcrossing
to selfing are irreversible, and second, the reduced efficacy of
selection and the reduced adaptive potential renders these species
1C© 2013 The Author(s).Evolution
ANASTASIA GIOTI ET AL.
maladapted (Stebbins 1957; Takebayashi and Morrell 2001). The
dead-end theory was initially formulated in plants, but holds
for any population with reduced effective recombination rate,
with the most extreme examples provided by asexual lineages
(Normark et al. 2003).
The irreversibility of transitions from outcrossing to self-
ing/asexuality is supported from the study of a wide range of sys-
tems, for example, plants (Goodwillie 1997; Schoen et al. 1997;
Igic et al. 2006) and fungi (Yun et al. 1999; Gioti et al. 2012). The
most commonly used criterion to empirically test for maladapta-
tion under less efficient purifying selection is the accelerated rates
of protein evolution, that is, a relatively high dN/dS in a majority
of coding genes. The use of this criterion provides confirming
results in asexual animal phyla (Paland and Lynch 2006), but in-
conclusive results in selfing taxa of plants (Wright et al. 2002;
Haudry et al. 2008; Escobar et al. 2010) and in Caenorhabditis
elegans (Artieri et al. 2008; Cutter et al. 2008). Mating system
may also affect the dynamics of transposable elements (TEs), the
spread of which is predicted to depend on the balance between
transposition rate (Wright and Schoen 1999; Morgan 2001) and
negative selection (Charlesworth and Langley 1989; Charlesworth
and Charlesworth 1995). These predictions have been most ex-
tensively tested with simulations in plants (reviewed in Wright
et al. 2008), whereas in C. elegans polymorphism data revealed
a reduced efficacy of selection for a class of DNA transposons
(Dolgin et al. 2008). Finally, maladaptation expressed as a reduc-
tion in adaptive evolution can be tested through examination of
the strength of synonymous codon usage bias, which can result
from selective pressure for more efficient and accurate transla-
tion (Akashi 1994; Duret and Mouchiroud 1999; Duret 2000;
Stoletzki and Eyre-Walker 2007). A correlation between selfing
and reduced codon usage bias was shown in Arabidopsis (Wright
et al. 2002; Qiu et al. 2011b), whereas mild reductions were ob-
served in selfing Triticeae species (Haudry et al. 2008; Escobar
et al. 2010) and C. elegans (Artieri et al. 2008; Cutter et al. 2008).
Overall, previous studies have shown that genomic signatures of
maladaptation can be subtle; they are easily obscured by even
small degrees of residual outcrossing (Glemin and Galtier 2012)
or if the age of selfing is relatively young (e.g., Cutter et al. 2008;
Escobar et al. 2010).
It is of particular interest to study the dead-end theory in
organisms with a predominant haploid life stage, such as As-
comycete fungi, for two reasons: First, haploidy allows one to
exclude the confounding effect of purging of deleterious muta-
tions, expected as a result of increased levels of homozygosity
in diploid selfers. Second, haploid selfing implies fusion of two
mitotic descendants of the same cell and is thus very different
from diploid selfing as known in plants and animals (Billiard
et al. 2012). Under this mode of selfing, effective recombination
rate approaches zero, such that from a genetic point of view, this
mating system is equivalent to asexuality (Nauta and Hoekstra
1992a). So far, the question of genomic consequences of selfing
has been tackled in the fungal kingdom solely by population ge-
netic models (Nauta and Hoekstra 1992b,a). These models were
built on the genus Neurospora, within which a high degree of out-
crossing is observed in heterothallic species, such as Neurospora
crassa (Powell et al. 2003; Ellison et al. 2011a), and facultative
outcrossing is observed in pseudohomothallic species, such as
Neurospora tetrasperma (Raju 1992; Powell et al. 2001; Menkis
et al. 2009); we will refer to species exhibiting these two mating
systems as “outcrossing” in this study. Obligate haploid selfing is
assumed in homothallic Neurospora species such as Neurospora
africana, because these appear to lack the morphological struc-
tures important for outcrossing (Howe and Page 1963; Perkins
1987; Glass et al. 1990). We will refer to these as “selfing” here,
although one needs to note that the absence of outcrossing in
nature for these species has not been proven so far.
We previously made use of an exhaustive phylogenetic
framework available for Neurospora (Nygren et al. 2011) and the
structure of the mating-type (mat) locus, to confirm that mating-
system shifts in the genus are unidirectional, from outcrossing to
selfing. Thereby, we confirmed the first assumption of the dead-
end theory on the irreversibility of transitions to selfing (Gioti
et al. 2012). The four selfing species that were considered in this
study represent independent mating-system transitions, because
they belong to distinct phylogenetic clades (Nygren et al. 2011)
and showed different mat locus architectures that could be ex-
plained by distinct mechanistic models for the transitions (Gioti
et al. 2012). In this study, we sequenced the genomes of these
four species and contrasted dN/dS, TE spread and silencing, base
composition, and codon usage patterns between these and three
Neurospora species reported to outcross in nature. Our results
overall support the second assumption of the dead-end theory on
maladaptation of selfing species.
MethodsSTRAINS AND CULTURE CONDITIONS
The isolates used for genome sequencing, N. africana (FGSC
1740), Neurospora sublineolata (FGSC 5508), Neurospora pan-
nonica (FGSC 7221), and Neurospora terricola (FGSC 1889)
were obtained from the Fungal Genetics Stock Center (FGSC,
University of Missouri, Kansas City, MI). Mycelia for DNA ex-
traction were grown in 18 × 200 mm culture tubes containing
minimal medium broth (Vogel 1964) with 1% sucrose. For to-
tal RNA isolation, N. africana was cultured: (1) In liquid syn-
thetic crossing (SC) medium (Westergaard and Mitchell 1947),
supplemented with sucrose (Sigma) to a final concentration of
2% or 0.1% for vegetative and carbon-starved vegetative growth,
respectively. The cultures were shaken at 200 rpm at 22◦ with a
2 EVOLUTION 2013
GENOMIC MALADAPTATION IN SELFING FUNGAL SPECIES
12 h:12 h photoperiod for 4 days. (2) In SC solid medium plates,
kept in darkness until the first protoperithecia were observed in the
microscope (6–8 days: early mating condition) or after abundant
mature perithecia were observed (12–14 days: late mating).
NUCLEIC ACIDS ISOLATION
Genomic DNA was extracted from 2 days old fungal mycelium
using the Easy-DNA Kit (Invitrogen, Carlsbad, CA). We extracted
total RNA by using TRI REAGENT (Molecular Research Center
Inc., Cincinnati, OH) following the manufacturer’s protocol. Tis-
sues for RNA extraction were homogenized with a Dounce glass
grinder and debris was filtered on Qiashredder columns (Qiagen,
Chatsworth, CA). Total RNA was treated with DNase I according
to the manufacturer’s protocol (Fermentas, Burlington, Canada).
RNA quality and quantity were analyzed by electrophoresis with
an Agilent Bioanalyzer using the RNA 6000 Nano Kit (Agilent
Technologies, Santa Clara, CA).
GENOME AND TRANSCRIPTOME SEQUENCING
Whole-genome sequencing was performed with the Illumina
Genome Analyzer (GA) version II platform (Geneservice Source
BioScience plc, Nottingham, UK), on genomic libraries sheared
and gel- purified to select for 130 bp mean insert size (adapters
excluded). Each library was sequenced for 55 cycles in paired-end
mode, in separate lanes of two different flowcells; an additional
run for 75 cycles was performed for N. africana. Image analysis,
base calling, and filtering were performed with the GA pipeline
software (version 1.3, Illumina). For whole-transcriptome se-
quencing in N. africana, we used a pooled sample of total 35.65 μg
RNA: 7.15 μg from vegetative growth and 9.5 μg from each of
carbon-starved vegetative growth, early mating and late mating
conditions. A cDNA library was constructed through full random
priming of polyA- mRNA, size fractioned, normalized, and sub-
sequently sequenced by Eurofins MWG Operon (Germany) using
Roche GS FLX (Titanium chemistry).
ASSEMBLIES OF GENOMIC AND TRANSCRIPTOMIC
DATA AND CEGMA ANALYSIS
Genomic DNA sequencing reads were de novo assembled using
the program Velvet version 0.7.58 (Zerbino and Birney 2008).
Quality controls, optimizations of the assembly and estimations
of error rates for the assembled genomes are described in
Supporting Information: Methods. We extended the scaffolds
with Mercator (Dewey 2007), using the finished genomes of
N. crassa (Galagan et al. 2003), Neurospora discreta (FGSC
8579: http://genome.jgi-psf.org/Neudi1/Neudi1.home.html), and
N. tetrasperma (Ellison et al. 2011b; FGSC 2508: http://genome.
jgi-psf.org/Neute_matA2/Neute_matA2.home.html). Note that
data on extended scaffolds (N. sublineolata, N. pannonica)
and corrected misassemblies (N. terricola) for the mat loci are
separately deposited (Gioti et al. 2012). Core eukaryotic genes
mapping approach (CEGMA) analysis (Parra et al. 2007) was
run using a set of 248 core eukaryotic genes (CEGs) as queries
against each genome. Neurospora africana RNA-sequencing
reads were assembled by aligning to the N. africana draft genome
with the Program to Assemble Spliced Alignments (PASA) (Haas
et al. 2003).
NEUROSPORA CRASSA ILLUMINA AND SIMULATED
DATA
To generate a genomic dataset from an outcrossing species com-
parable to the datasets from selfing species, we simulated two sets
of paired-end reads from the genome of N. crassa (version 10)
using the program wgsim (https://github.com/lh3/wgsim). A total
of 29–30 million reads were generated for each dataset, using
the expected base error rate after Illumina GAII quality trimming
(0.02, as in Kircher et al. 2009; Luo et al. 2012), library insert
sizes equal to 250 and 150 bp (Table S1) and read lengths set to
55 bp (as untrimmed data) and to 33–55 bp (as trimmed data).
Furthermore, we downloaded ∼30 million Illumina reads (short
read archive: SRA026343) of resequencing of a N. crassa mutant
strain (McCluskey et al. 2011) and performed the same analyses
as on sequenced reads from selfing species.
GENOME ANNOTATIONS
Assembled genomes were annotated using the program MAKER
version 2.05 (Cantarel et al. 2008). Composite gene models,
not further curated, were created by combining the follow-
ing sources of evidence: (1) Ab initio gene predictions from
AUGUSTUS (Stanke and Waack 2003) trained with N. crassa
gene models, SNAP (Korf 2004) trained on N. crassa, and
Genemark-ES version 2.3a (Ter-Hovhannisyan et al. 2008) with
a self-trained model from each genome. (2) Protein align-
ments to a set of 41,708 proteins from the closely related
species Fusarium graminearum, Magnaporthe grisea, N. discreta,
N. tetrasperma, and Sordaria macrospora and clustered using
CD-HIT version 4.0 (Li et al. 2001) with a protein identity thresh-
old of 90%. (3) Nucleotide alignments of the 27,056 EST tran-
script sequences obtained from assembly of N. africana RNA-
sequencing data. (4) Nucleotide alignments to the 9908 N. crassa
near full-length transcripts inferred from the genome annotation
(http://www.broadinstitute.org/annotation/genome/neurospora/).
ALIGNMENTS AND IDENTIFICATION OF ORTHOLOGS
A whole-genome seven-way alignment was constructed with Mer-
cator (Dewey 2007) using the genomes of outcrossing species as
“finished” and the genomes of selfing species as “draft genomes”.
This alignment was combined with gene prediction data from
MAKER to extract single-copy syntenic orthologs using cus-
tom Perl scripts (https://github.com/hyphaltip/fungaltools). We
EVOLUTION 2013 3
ANASTASIA GIOTI ET AL.
selected a strict set of orthologous genes that show microsynteny,
by requiring each gene and its left and right flanking genes in
N. crassa to be in a syntenic block. In cases where MAKER
predicted two open reading frames (ORFs) for a single N.
crassa gene at orthologous positions, the gene was excluded. The
protein-coding sequences corresponding to orthologous genes
were aligned using MUSCLE version 3.8.31 (Edgar 2004) and
the alignments were “back-translated” using the sequence of the
coding genes and the “bp mrtrans.pl” script of BioPerl (Stajich
et al. 2002). To exclude low-quality alignments, we kept those
that showed a proportion of residue pairs (equivalent to sum-
of-pairs score) equal or higher than 99% following a “Heads or
Tails” analysis (Landan and Graur 2007). We further excluded
alignments where the estimated tree length based on the number
of synonymous substitutions per codon was higher than five in
preliminary analyses using the codeml program in PAML (branch
models), as manual inspections revealed cases where the observed
dS saturation was caused by misalignments.
MOLECULAR EVOLUTION ANALYSES
The programs codeml and baseml, included in the PAML package
version 4.4 (Yang 1997, 2007), were used to test models of codon
and nucleotide substitution rate constancy across the Neurospora
phylogeny. We used the following topology and branch designa-
tion for reproductive mode (when specified): (((N. discreta, (N.
crassa, N. tetrasperma)), N. africana #1), (N. pannonica #1, N.
sublineolata #1), N. terricola #1), where #1 designates branches
delineating selfing species. The topology is derived from MrBayes
(Ronquist et al. 2012) analysis of data from previously published
genus phylogenies (Nygren et al. 2011) and branch designation
is based on the assumption of an outcrossing ancestor of Neu-
rospora (Gioti et al. 2012). The following alternative topology,
derived from MrBayes phylogenetic reconstruction on the con-
catenated dataset of the 2789 reliable gene alignments identified
in this study, was also used in Branch models and in baseml anal-
yses: (N. africana#1, (N. discreta, (N. crassa, N. tetrasperma)),
((N. pannonica#1, N. terricola#1)#1, N. sublineolata#1)#1). For
baseml analyses, we used a GTR+G model, the closest available
substitution model to REV, which best fitted a dataset of four-fold
degenerative sites from 500 randomly picked alignments accord-
ing to a ModelGenerator (Keane et al. 2006) analysis. Tested
models and summary calculations of dN/dS are detailed in Sup-
porting Information: Methods. Likelihood ratio tests (LRTs) were
performed by comparing twice the difference in log-likelihood
values (−2ln �) between nested models using a χ2 distribution.
The false discovery rate for multiple testing corrections (q <
0.05) was calculated using the Q-value package (Storey 2002);
we chose the tuning parameter in the estimation of the proportion
of true null hypotheses using the bootstrap method.
TRANSPOSABLE ELEMENT ANALYSES
The genomes of all species were scanned for TEs with Repeat-
Masker (version open-3.3.0) using a library generated by the fu-
sion of 430 fungal TE families available from RepBase release
15.02 (Jurka et al. 2005) with a previously described custom
library comprising de novo-identified TEs (Gioti et al. 2012).
Copies of nsubGypsy were retrieved in the genomes of Neu-
rospora species using the nucleotide sequence as query in the
web interface of TARGeT (Han et al. 2009), setting the minimum
matched percentage of query at 50%. The copies were aligned
using MUSCLE (Edgar 2004) and ambiguous characters and gap
positions were trimmed off using trimAl version 1.3 (Capella-
Gutiierrez et al. 2009) with the “nogaps” option. The phyloge-
netic tree of nsubGypsy was constructed with PhyML (Guindon
et al. 2010), using a GTR model (based on a Modeltest run) and
NNI tree search, starting with a BioNJ tree. Support for branch
nodes was obtained using 1000 bootstraps. Additional analyses
aiming to consolidate our findings on TE content are presented
in Supporting Information: Methods. We calculated the Compos-
ite Repeat induced point mutation Index (CRI) = (TpA/ApT) –
(CpA + TpG/ApC + GpT), as defined in Lewis et al. (2009),
in nonoverlapping 50 bp windows of TEs and in 500 bp win-
dows of the assemblies, using custom Perl scripts available at
https://github.com/hyphaltip/fungaltools/. Plots were generated
with R version 2.9 and greater (http://www.R-project.org/).
CODON USAGE ANALYSES
To identify the 100 most highly expressed genes (HEGs) of
N. crassa and of N. africana, we generated spliced alignments
of transcriptome data against genome assemblies using TopHat
(Trapnell et al. 2009). Next, we used the Fragments Per Kilobase
of gene per Million reads criterion within Cufflinks (Trapnell
et al. 2010) to sort genes according to their expression level. For
N. crassa, we used published Illumina-sequencing transcriptome
data (Ellison et al. 2011a) and for N. africana, the 454-sequencing
transcriptome data generated in this study. Codon usage tables
and the Frank Wright’s Nc statistic for the effective number of
codons (Wright 1990) were calculated on coding sequences of all
genes and HEGs using the programs “cusp” and “chips” avail-
able with emboss tools (Rice et al. 2000); both individual (for
plots of distribution and statistical tests) and total (summed over
all gene features) Nc values were computed. To assess statistical
significance of Nc differences, we generated 10,000 randomized
datasets of 100 coding genes from the N. africana and N. crassa
genomes with custom Python scripts using Biopython version
1.57 modules (Cock et al. 2009); the Nc values of these datasets
reflected the codon usage of all genes (N. africanaRandom = 53.64,
N. crassaRandom = 53.26). P-values were calculated by dividing
the number of occurrences in the randomized datasets where Nc
was equal to the Nc of HEGs by the sample size.
4 EVOLUTION 2013
GENOMIC MALADAPTATION IN SELFING FUNGAL SPECIES
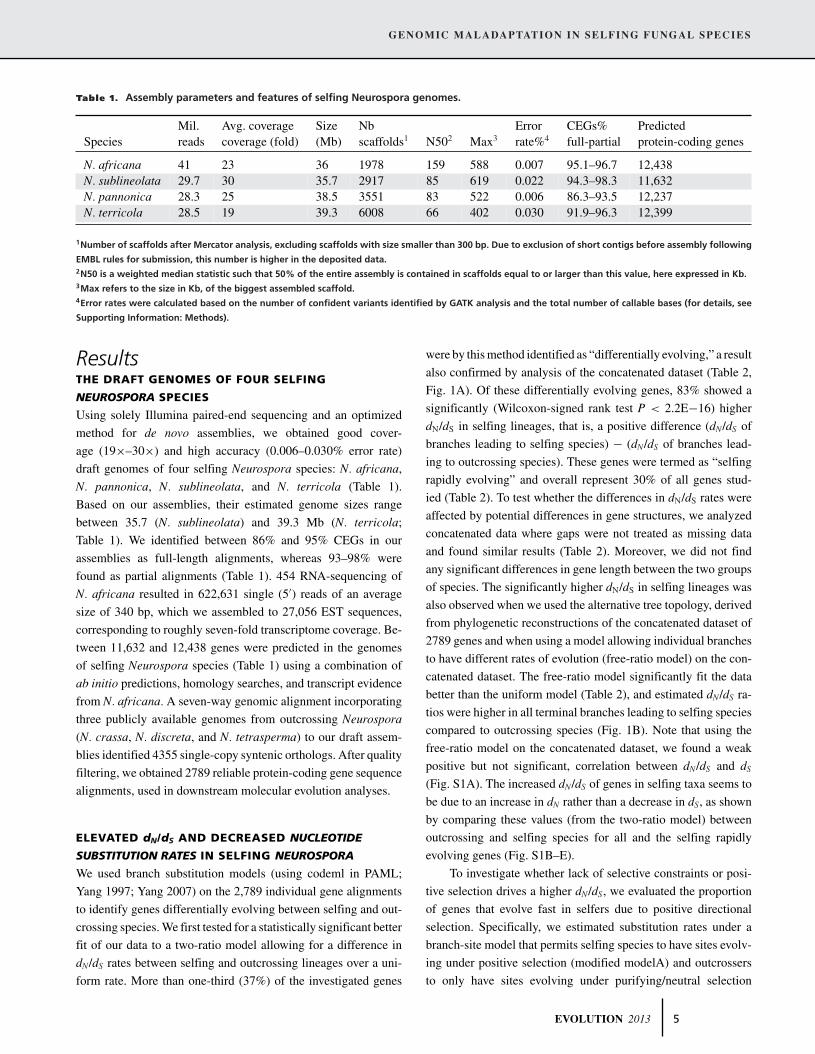
Table 1. Assembly parameters and features of selfing Neurospora genomes.
Mil. Avg. coverage Size Nb Error CEGs% PredictedSpecies reads coverage (fold) (Mb) scaffolds1 N502 Max3 rate%4 full-partial protein-coding genes
N. africana 41 23 36 1978 159 588 0.007 95.1–96.7 12,438N. sublineolata 29.7 30 35.7 2917 85 619 0.022 94.3–98.3 11,632N. pannonica 28.3 25 38.5 3551 83 522 0.006 86.3–93.5 12,237N. terricola 28.5 19 39.3 6008 66 402 0.030 91.9–96.3 12,399
1Number of scaffolds after Mercator analysis, excluding scaffolds with size smaller than 300 bp. Due to exclusion of short contigs before assembly following
EMBL rules for submission, this number is higher in the deposited data.2N50 is a weighted median statistic such that 50% of the entire assembly is contained in scaffolds equal to or larger than this value, here expressed in Kb.3Max refers to the size in Kb, of the biggest assembled scaffold.4Error rates were calculated based on the number of confident variants identified by GATK analysis and the total number of callable bases (for details, see
Supporting Information: Methods).
ResultsTHE DRAFT GENOMES OF FOUR SELFING
NEUROSPORA SPECIES
Using solely Illumina paired-end sequencing and an optimized
method for de novo assemblies, we obtained good cover-
age (19×–30×) and high accuracy (0.006–0.030% error rate)
draft genomes of four selfing Neurospora species: N. africana,
N. pannonica, N. sublineolata, and N. terricola (Table 1).
Based on our assemblies, their estimated genome sizes range
between 35.7 (N. sublineolata) and 39.3 Mb (N. terricola;
Table 1). We identified between 86% and 95% CEGs in our
assemblies as full-length alignments, whereas 93–98% were
found as partial alignments (Table 1). 454 RNA-sequencing of
N. africana resulted in 622,631 single (5′) reads of an average
size of 340 bp, which we assembled to 27,056 EST sequences,
corresponding to roughly seven-fold transcriptome coverage. Be-
tween 11,632 and 12,438 genes were predicted in the genomes
of selfing Neurospora species (Table 1) using a combination of
ab initio predictions, homology searches, and transcript evidence
from N. africana. A seven-way genomic alignment incorporating
three publicly available genomes from outcrossing Neurospora
(N. crassa, N. discreta, and N. tetrasperma) to our draft assem-
blies identified 4355 single-copy syntenic orthologs. After quality
filtering, we obtained 2789 reliable protein-coding gene sequence
alignments, used in downstream molecular evolution analyses.
ELEVATED dN/dS AND DECREASED NUCLEOTIDE
SUBSTITUTION RATES IN SELFING NEUROSPORA
We used branch substitution models (using codeml in PAML;
Yang 1997; Yang 2007) on the 2,789 individual gene alignments
to identify genes differentially evolving between selfing and out-
crossing species. We first tested for a statistically significant better
fit of our data to a two-ratio model allowing for a difference in
dN/dS rates between selfing and outcrossing lineages over a uni-
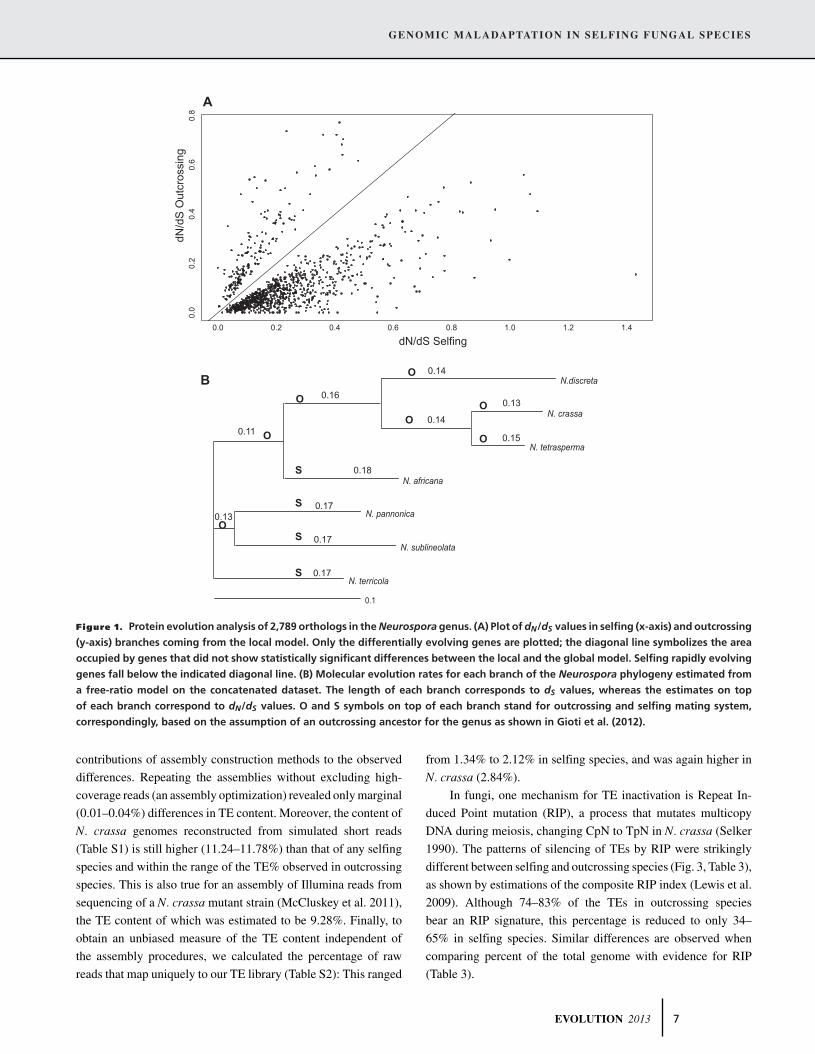
form rate. More than one-third (37%) of the investigated genes
were by this method identified as “differentially evolving,” a result
also confirmed by analysis of the concatenated dataset (Table 2,
Fig. 1A). Of these differentially evolving genes, 83% showed a
significantly (Wilcoxon-signed rank test P < 2.2E−16) higher
dN/dS in selfing lineages, that is, a positive difference (dN/dS of
branches leading to selfing species) − (dN/dS of branches lead-
ing to outcrossing species). These genes were termed as “selfing
rapidly evolving” and overall represent 30% of all genes stud-
ied (Table 2). To test whether the differences in dN/dS rates were
affected by potential differences in gene structures, we analyzed
concatenated data where gaps were not treated as missing data
and found similar results (Table 2). Moreover, we did not find
any significant differences in gene length between the two groups
of species. The significantly higher dN/dS in selfing lineages was
also observed when we used the alternative tree topology, derived
from phylogenetic reconstructions of the concatenated dataset of
2789 genes and when using a model allowing individual branches
to have different rates of evolution (free-ratio model) on the con-
catenated dataset. The free-ratio model significantly fit the data
better than the uniform model (Table 2), and estimated dN/dS ra-
tios were higher in all terminal branches leading to selfing species
compared to outcrossing species (Fig. 1B). Note that using the
free-ratio model on the concatenated dataset, we found a weak
positive but not significant, correlation between dN/dS and dS
(Fig. S1A). The increased dN/dS of genes in selfing taxa seems to
be due to an increase in dN rather than a decrease in dS, as shown
by comparing these values (from the two-ratio model) between
outcrossing and selfing species for all and the selfing rapidly
evolving genes (Fig. S1B–E).
To investigate whether lack of selective constraints or posi-
tive selection drives a higher dN/dS, we evaluated the proportion
of genes that evolve fast in selfers due to positive directional
selection. Specifically, we estimated substitution rates under a
branch-site model that permits selfing species to have sites evolv-
ing under positive selection (modified modelA) and outcrossers
to only have sites evolving under purifying/neutral selection
EVOLUTION 2013 5
ANASTASIA GIOTI ET AL.
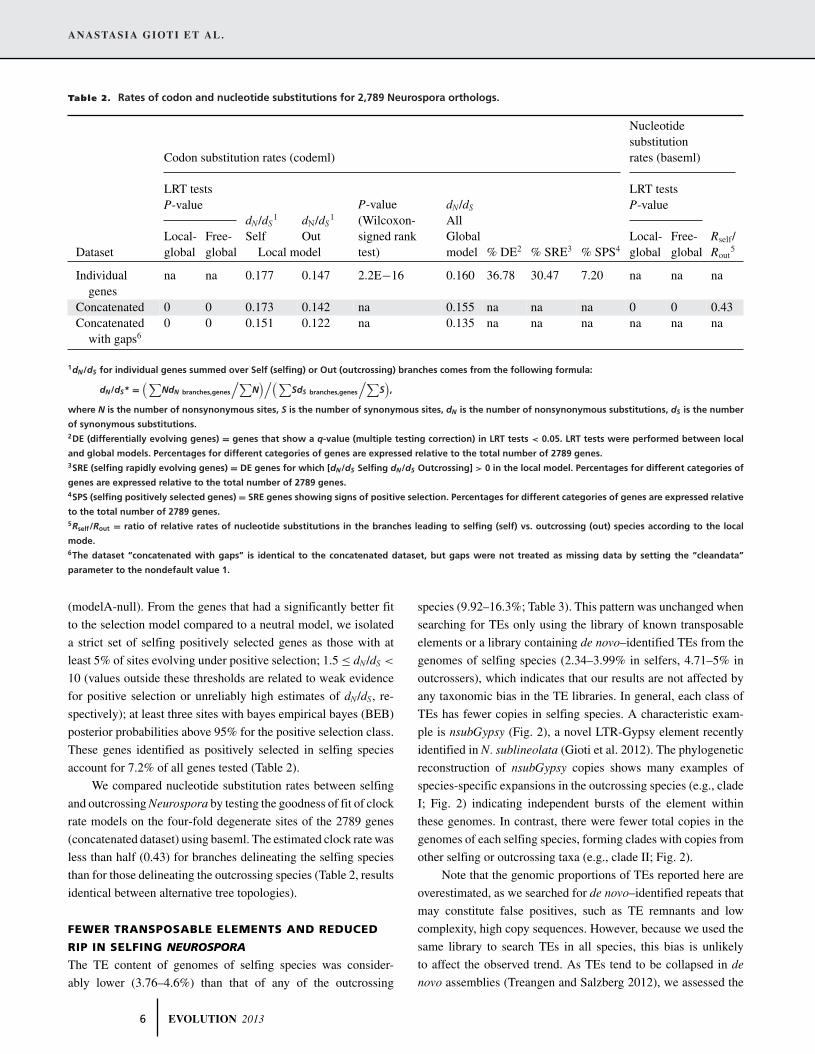
Table 2. Rates of codon and nucleotide substitutions for 2,789 Neurospora orthologs.
Nucleotidesubstitution
Codon substitution rates (codeml) rates (baseml)
LRT tests LRT testsP-value P-value
Local- Free-dN/dS
1
SelfdN/dS
1
Out
dN/dS
AllGlobal Local- Free- Rself/
Dataset global global Local model
P-value(Wilcoxon-signed ranktest) model % DE2 % SRE3 % SPS4 global global Rout
5
Individualgenes
na na 0.177 0.147 2.2E−16 0.160 36.78 30.47 7.20 na na na
Concatenated 0 0 0.173 0.142 na 0.155 na na na 0 0 0.43Concatenated
with gaps60 0 0.151 0.122 na 0.135 na na na na na na
1dN/dS for individual genes summed over Self (selfing) or Out (outcrossing) branches comes from the following formula:
dN/dS* =(∑
NdN branches,genes
/∑N
)/(∑SdS branches,genes
/∑S),
where N is the number of nonsynonymous sites, S is the number of synonymous sites, dN is the number of nonsynonymous substitutions, dS is the number
of synonymous substitutions.2DE (differentially evolving genes) = genes that show a q-value (multiple testing correction) in LRT tests < 0.05. LRT tests were performed between local
and global models. Percentages for different categories of genes are expressed relative to the total number of 2789 genes.3SRE (selfing rapidly evolving genes) = DE genes for which [dN/dS Selfing dN/dS Outcrossing] > 0 in the local model. Percentages for different categories of
genes are expressed relative to the total number of 2789 genes.4SPS (selfing positively selected genes) = SRE genes showing signs of positive selection. Percentages for different categories of genes are expressed relative
to the total number of 2789 genes.5Rself/Rout = ratio of relative rates of nucleotide substitutions in the branches leading to selfing (self) vs. outcrossing (out) species according to the local
mode.6The dataset “concatenated with gaps” is identical to the concatenated dataset, but gaps were not treated as missing data by setting the “cleandata”
parameter to the nondefault value 1.
(modelA-null). From the genes that had a significantly better fit
to the selection model compared to a neutral model, we isolated
a strict set of selfing positively selected genes as those with at
least 5% of sites evolving under positive selection; 1.5 ≤ dN/dS <
10 (values outside these thresholds are related to weak evidence
for positive selection or unreliably high estimates of dN/dS, re-
spectively); at least three sites with bayes empirical bayes (BEB)
posterior probabilities above 95% for the positive selection class.
These genes identified as positively selected in selfing species
account for 7.2% of all genes tested (Table 2).
We compared nucleotide substitution rates between selfing
and outcrossing Neurospora by testing the goodness of fit of clock
rate models on the four-fold degenerate sites of the 2789 genes
(concatenated dataset) using baseml. The estimated clock rate was
less than half (0.43) for branches delineating the selfing species
than for those delineating the outcrossing species (Table 2, results
identical between alternative tree topologies).
FEWER TRANSPOSABLE ELEMENTS AND REDUCED
RIP IN SELFING NEUROSPORA
The TE content of genomes of selfing species was consider-
ably lower (3.76–4.6%) than that of any of the outcrossing
species (9.92–16.3%; Table 3). This pattern was unchanged when
searching for TEs only using the library of known transposable
elements or a library containing de novo–identified TEs from the
genomes of selfing species (2.34–3.99% in selfers, 4.71–5% in
outcrossers), which indicates that our results are not affected by
any taxonomic bias in the TE libraries. In general, each class of
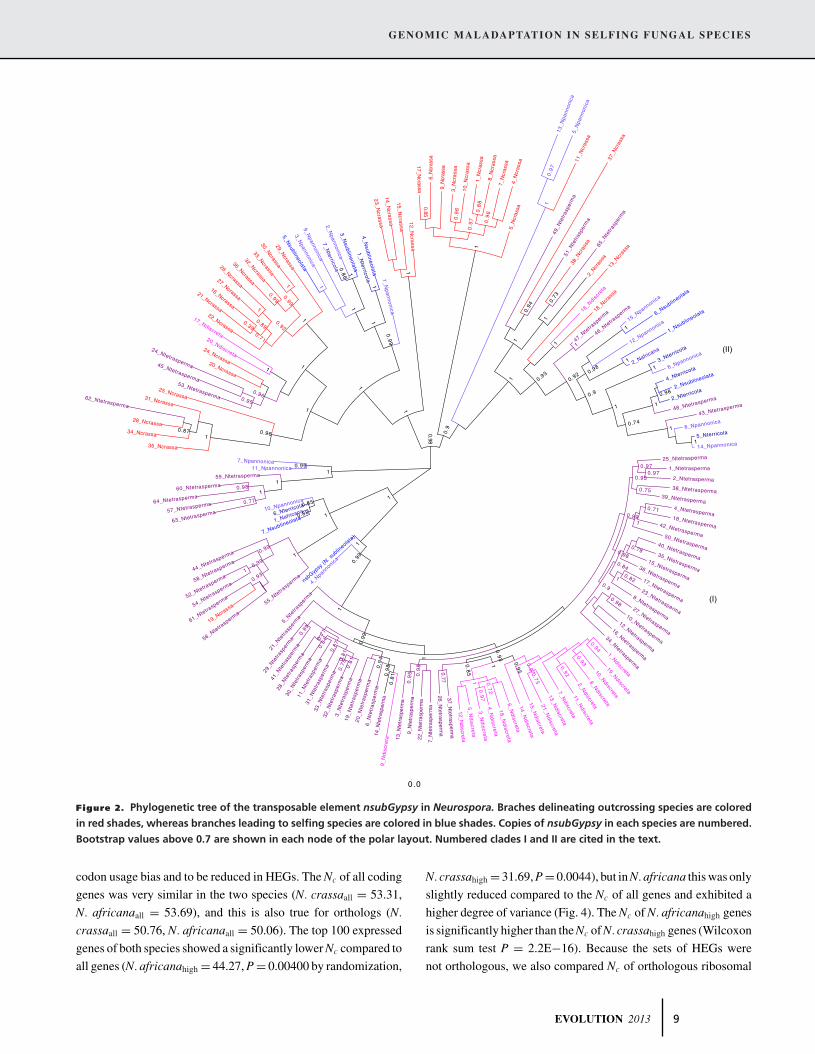
TEs has fewer copies in selfing species. A characteristic exam-
ple is nsubGypsy (Fig. 2), a novel LTR-Gypsy element recently
identified in N. sublineolata (Gioti et al. 2012). The phylogenetic
reconstruction of nsubGypsy copies shows many examples of
species-specific expansions in the outcrossing species (e.g., clade
I; Fig. 2) indicating independent bursts of the element within
these genomes. In contrast, there were fewer total copies in the
genomes of each selfing species, forming clades with copies from
other selfing or outcrossing taxa (e.g., clade II; Fig. 2).
Note that the genomic proportions of TEs reported here are
overestimated, as we searched for de novo–identified repeats that
may constitute false positives, such as TE remnants and low
complexity, high copy sequences. However, because we used the
same library to search TEs in all species, this bias is unlikely
to affect the observed trend. As TEs tend to be collapsed in de
novo assemblies (Treangen and Salzberg 2012), we assessed the
6 EVOLUTION 2013
GENOMIC MALADAPTATION IN SELFING FUNGAL SPECIES
A
0.0 0.2 0.4 0.6 0.8 1.0 1.2 1.4
0.0
0.2
0.4
0.6
0.8
dN/dS Selfing
dN/d
S O
utcr
ossi
ng
N.discreta
N. crassa
N. tetrasperma
N. africana
N. pannonica
N. sublineolata
N. terricola
0.1
0.14
0.17
0.17
0.13
0.15
0.14
0.16
0.17
0.18
0.11
0.13
B O
OO
O
O
O
S
S
SO
S
Figure 1. Protein evolution analysis of 2,789 orthologs in the Neurospora genus. (A) Plot of dN/dS values in selfing (x-axis) and outcrossing
(y-axis) branches coming from the local model. Only the differentially evolving genes are plotted; the diagonal line symbolizes the area
occupied by genes that did not show statistically significant differences between the local and the global model. Selfing rapidly evolving
genes fall below the indicated diagonal line. (B) Molecular evolution rates for each branch of the Neurospora phylogeny estimated from
a free-ratio model on the concatenated dataset. The length of each branch corresponds to dS values, whereas the estimates on top
of each branch correspond to dN/dS values. O and S symbols on top of each branch stand for outcrossing and selfing mating system,
correspondingly, based on the assumption of an outcrossing ancestor for the genus as shown in Gioti et al. (2012).
contributions of assembly construction methods to the observed
differences. Repeating the assemblies without excluding high-
coverage reads (an assembly optimization) revealed only marginal
(0.01–0.04%) differences in TE content. Moreover, the content of
N. crassa genomes reconstructed from simulated short reads
(Table S1) is still higher (11.24–11.78%) than that of any selfing
species and within the range of the TE% observed in outcrossing
species. This is also true for an assembly of Illumina reads from
sequencing of a N. crassa mutant strain (McCluskey et al. 2011),
the TE content of which was estimated to be 9.28%. Finally, to
obtain an unbiased measure of the TE content independent of
the assembly procedures, we calculated the percentage of raw
reads that map uniquely to our TE library (Table S2): This ranged
from 1.34% to 2.12% in selfing species, and was again higher in
N. crassa (2.84%).
In fungi, one mechanism for TE inactivation is Repeat In-
duced Point mutation (RIP), a process that mutates multicopy
DNA during meiosis, changing CpN to TpN in N. crassa (Selker
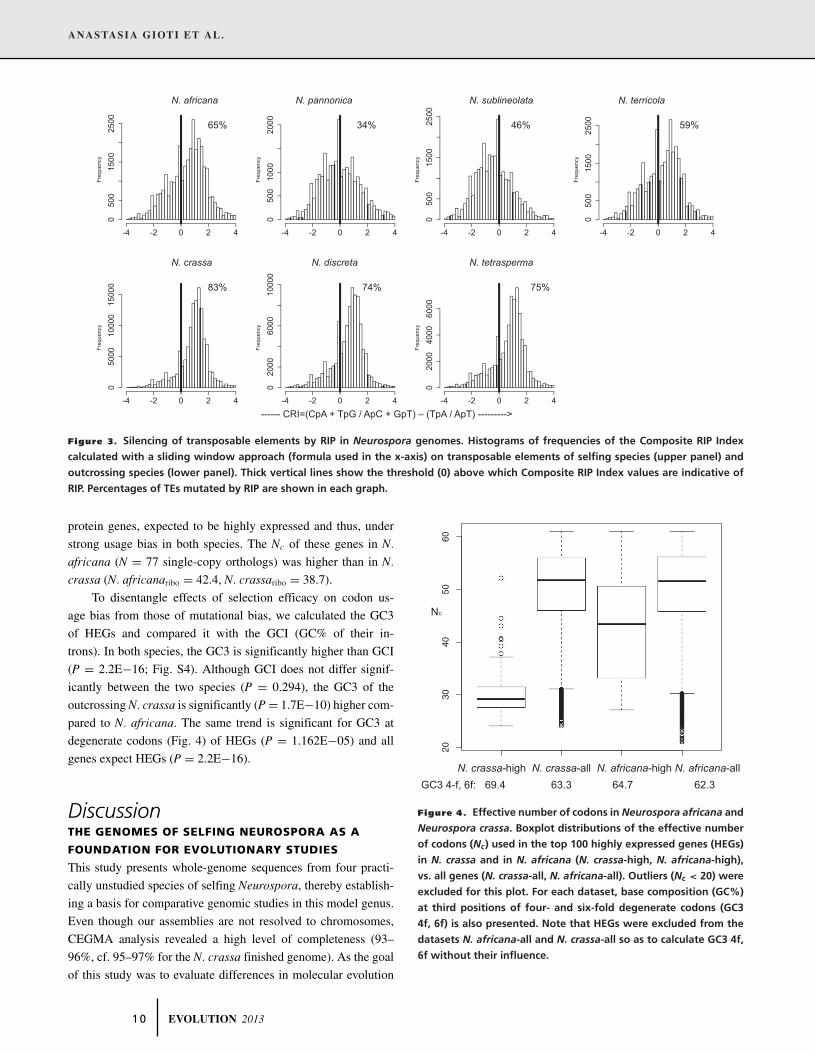
1990). The patterns of silencing of TEs by RIP were strikingly
different between selfing and outcrossing species (Fig. 3, Table 3),
as shown by estimations of the composite RIP index (Lewis et al.
2009). Although 74–83% of the TEs in outcrossing species
bear an RIP signature, this percentage is reduced to only 34–
65% in selfing species. Similar differences are observed when
comparing percent of the total genome with evidence for RIP
(Table 3).
EVOLUTION 2013 7
ANASTASIA GIOTI ET AL.
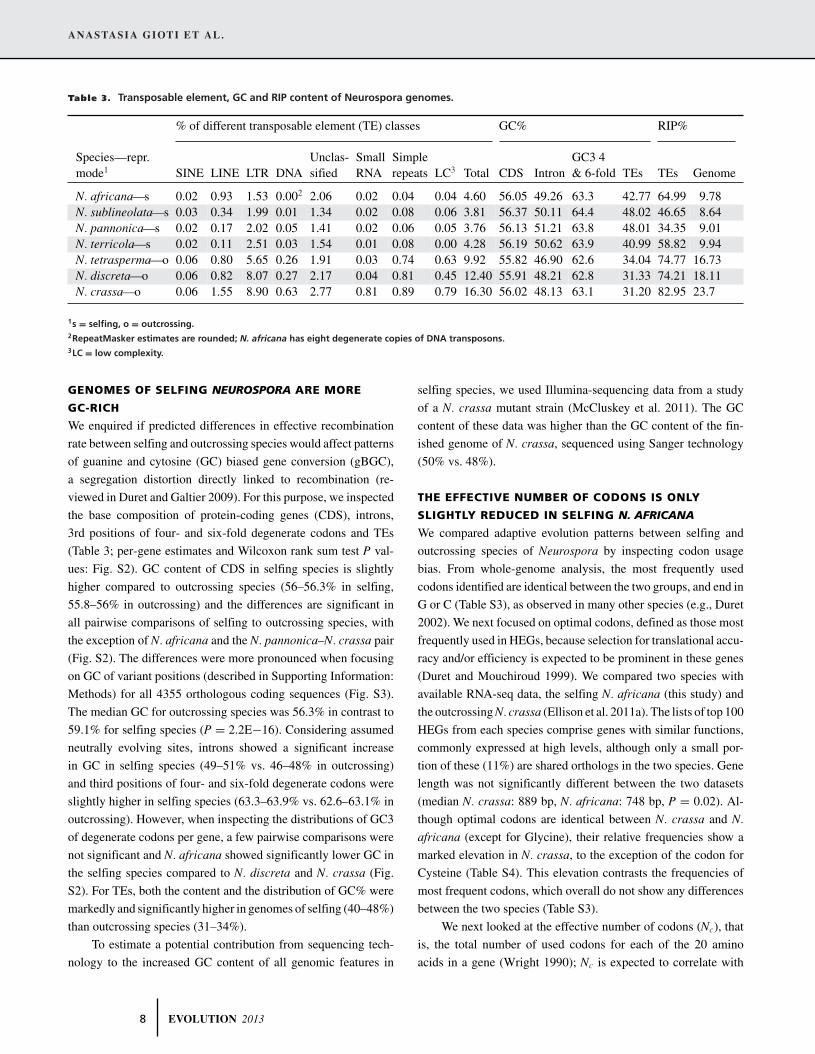
Table 3. Transposable element, GC and RIP content of Neurospora genomes.
% of different transposable element (TE) classes GC% RIP%
Unclas- Small Simple GC3 4Species—repr.mode1 SINE LINE LTR DNA sified RNA repeats LC3 Total CDS Intron & 6-fold TEs TEs Genome
N. africana—s 0.02 0.93 1.53 0.002 2.06 0.02 0.04 0.04 4.60 56.05 49.26 63.3 42.77 64.99 9.78N. sublineolata—s 0.03 0.34 1.99 0.01 1.34 0.02 0.08 0.06 3.81 56.37 50.11 64.4 48.02 46.65 8.64N. pannonica—s 0.02 0.17 2.02 0.05 1.41 0.02 0.06 0.05 3.76 56.13 51.21 63.8 48.01 34.35 9.01N. terricola—s 0.02 0.11 2.51 0.03 1.54 0.01 0.08 0.00 4.28 56.19 50.62 63.9 40.99 58.82 9.94N. tetrasperma—o 0.06 0.80 5.65 0.26 1.91 0.03 0.74 0.63 9.92 55.82 46.90 62.6 34.04 74.77 16.73N. discreta—o 0.06 0.82 8.07 0.27 2.17 0.04 0.81 0.45 12.40 55.91 48.21 62.8 31.33 74.21 18.11N. crassa—o 0.06 1.55 8.90 0.63 2.77 0.81 0.89 0.79 16.30 56.02 48.13 63.1 31.20 82.95 23.7
1s = selfing, o = outcrossing.2RepeatMasker estimates are rounded; N. africana has eight degenerate copies of DNA transposons.3LC = low complexity.
GENOMES OF SELFING NEUROSPORA ARE MORE
GC-RICH
We enquired if predicted differences in effective recombination
rate between selfing and outcrossing species would affect patterns
of guanine and cytosine (GC) biased gene conversion (gBGC),
a segregation distortion directly linked to recombination (re-
viewed in Duret and Galtier 2009). For this purpose, we inspected
the base composition of protein-coding genes (CDS), introns,
3rd positions of four- and six-fold degenerate codons and TEs
(Table 3; per-gene estimates and Wilcoxon rank sum test P val-
ues: Fig. S2). GC content of CDS in selfing species is slightly
higher compared to outcrossing species (56–56.3% in selfing,
55.8–56% in outcrossing) and the differences are significant in
all pairwise comparisons of selfing to outcrossing species, with
the exception of N. africana and the N. pannonica–N. crassa pair
(Fig. S2). The differences were more pronounced when focusing
on GC of variant positions (described in Supporting Information:
Methods) for all 4355 orthologous coding sequences (Fig. S3).
The median GC for outcrossing species was 56.3% in contrast to
59.1% for selfing species (P = 2.2E−16). Considering assumed
neutrally evolving sites, introns showed a significant increase
in GC in selfing species (49–51% vs. 46–48% in outcrossing)
and third positions of four- and six-fold degenerate codons were
slightly higher in selfing species (63.3–63.9% vs. 62.6–63.1% in
outcrossing). However, when inspecting the distributions of GC3
of degenerate codons per gene, a few pairwise comparisons were
not significant and N. africana showed significantly lower GC in
the selfing species compared to N. discreta and N. crassa (Fig.
S2). For TEs, both the content and the distribution of GC% were
markedly and significantly higher in genomes of selfing (40–48%)
than outcrossing species (31–34%).
To estimate a potential contribution from sequencing tech-
nology to the increased GC content of all genomic features in
selfing species, we used Illumina-sequencing data from a study
of a N. crassa mutant strain (McCluskey et al. 2011). The GC
content of these data was higher than the GC content of the fin-
ished genome of N. crassa, sequenced using Sanger technology
(50% vs. 48%).
THE EFFECTIVE NUMBER OF CODONS IS ONLY
SLIGHTLY REDUCED IN SELFING N. AFRICANA
We compared adaptive evolution patterns between selfing and
outcrossing species of Neurospora by inspecting codon usage
bias. From whole-genome analysis, the most frequently used
codons identified are identical between the two groups, and end in
G or C (Table S3), as observed in many other species (e.g., Duret
2002). We next focused on optimal codons, defined as those most
frequently used in HEGs, because selection for translational accu-
racy and/or efficiency is expected to be prominent in these genes
(Duret and Mouchiroud 1999). We compared two species with
available RNA-seq data, the selfing N. africana (this study) and
the outcrossing N. crassa (Ellison et al. 2011a). The lists of top 100
HEGs from each species comprise genes with similar functions,
commonly expressed at high levels, although only a small por-
tion of these (11%) are shared orthologs in the two species. Gene
length was not significantly different between the two datasets
(median N. crassa: 889 bp, N. africana: 748 bp, P = 0.02). Al-
though optimal codons are identical between N. crassa and N.
africana (except for Glycine), their relative frequencies show a
marked elevation in N. crassa, to the exception of the codon for
Cysteine (Table S4). This elevation contrasts the frequencies of
most frequent codons, which overall do not show any differences
between the two species (Table S3).
We next looked at the effective number of codons (Nc), that
is, the total number of used codons for each of the 20 amino
acids in a gene (Wright 1990); Nc is expected to correlate with
8 EVOLUTION 2013
GENOMIC MALADAPTATION IN SELFING FUNGAL SPECIES
Figure 2. Phylogenetic tree of the transposable element nsubGypsy in Neurospora. Braches delineating outcrossing species are colored
in red shades, whereas branches leading to selfing species are colored in blue shades. Copies of nsubGypsy in each species are numbered.
Bootstrap values above 0.7 are shown in each node of the polar layout. Numbered clades I and II are cited in the text.
codon usage bias and to be reduced in HEGs. The Nc of all coding
genes was very similar in the two species (N. crassaall = 53.31,
N. africanaall = 53.69), and this is also true for orthologs (N.
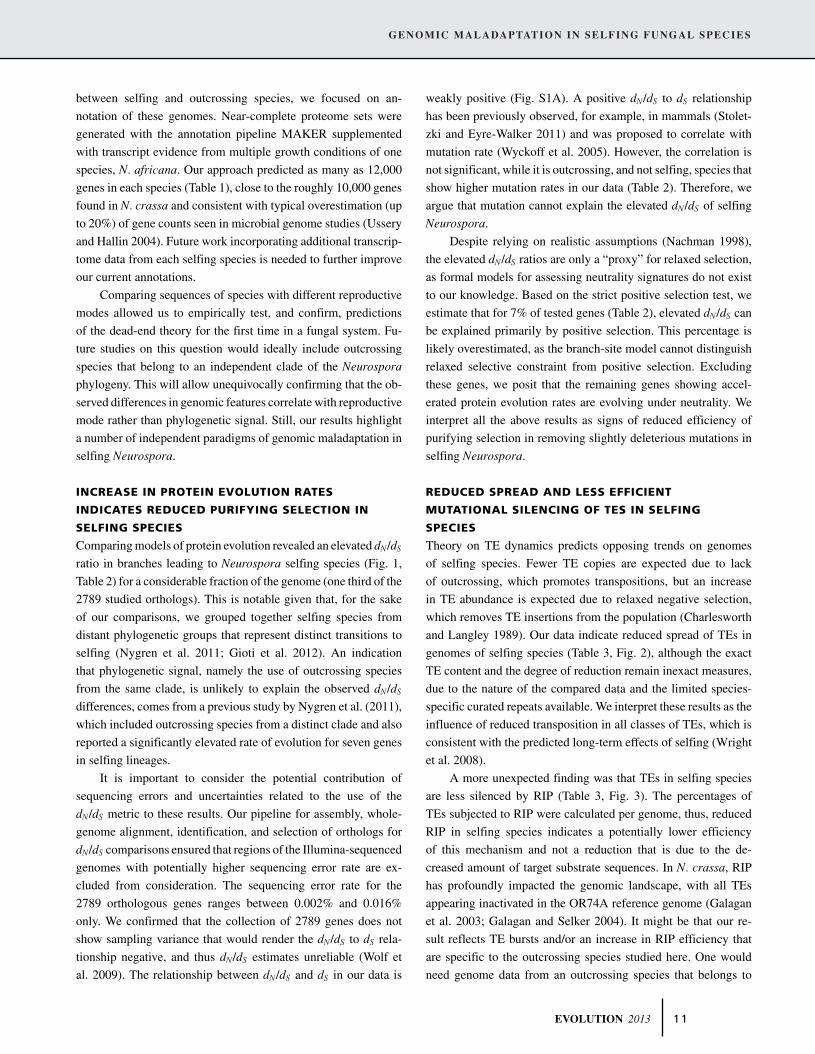
crassaall = 50.76, N. africanaall = 50.06). The top 100 expressed
genes of both species showed a significantly lower Nc compared to
all genes (N. africanahigh = 44.27, P = 0.00400 by randomization,
N. crassahigh = 31.69, P = 0.0044), but in N. africana this was only
slightly reduced compared to the Nc of all genes and exhibited a
higher degree of variance (Fig. 4). The Nc of N. africanahigh genes
is significantly higher than the Nc of N. crassahigh genes (Wilcoxon
rank sum test P = 2.2E−16). Because the sets of HEGs were
not orthologous, we also compared Nc of orthologous ribosomal
EVOLUTION 2013 9
ANASTASIA GIOTI ET AL.
Freq
uenc
y
-4 -2 0 2 4
050
015
0025
00
Freq
uenc
y
-4 -2 0 2 4
050
010
0020
00
Freq
uenc
y
-4 -2 0 2 4
050
015
0025
00
Freq
uenc
y
-4 -2 0 2 4
050
015
0025
00
Freq
uenc
y
-4 -2 0 2 4
050
0010
000
1500
0
Freq
uenc
y
-4 -2 0 2 4
020
0060
0010
000
Freq
uenc
y
-4 -2 0 2 4
020
0040
0060
00------ CRI=(CpA + TpG / ApC + GpT) – (TpA / ApT) --------->
N. africana N. pannonica N. sublineolata N. terricola
N. crassa N. discreta N. tetrasperma
65% 34% 46% 59%
83% 74% 75%
Figure 3. Silencing of transposable elements by RIP in Neurospora genomes. Histograms of frequencies of the Composite RIP Index
calculated with a sliding window approach (formula used in the x-axis) on transposable elements of selfing species (upper panel) and
outcrossing species (lower panel). Thick vertical lines show the threshold (0) above which Composite RIP Index values are indicative of
RIP. Percentages of TEs mutated by RIP are shown in each graph.
protein genes, expected to be highly expressed and thus, under
strong usage bias in both species. The Nc of these genes in N.
africana (N = 77 single-copy orthologs) was higher than in N.
crassa (N. africanaribo = 42.4, N. crassaribo = 38.7).
To disentangle effects of selection efficacy on codon us-
age bias from those of mutational bias, we calculated the GC3
of HEGs and compared it with the GCI (GC% of their in-
trons). In both species, the GC3 is significantly higher than GCI
(P = 2.2E−16; Fig. S4). Although GCI does not differ signif-
icantly between the two species (P = 0.294), the GC3 of the
outcrossing N. crassa is significantly (P = 1.7E−10) higher com-
pared to N. africana. The same trend is significant for GC3 at
degenerate codons (Fig. 4) of HEGs (P = 1.162E−05) and all
genes expect HEGs (P = 2.2E−16).
DiscussionTHE GENOMES OF SELFING NEUROSPORA AS A
FOUNDATION FOR EVOLUTIONARY STUDIES
This study presents whole-genome sequences from four practi-
cally unstudied species of selfing Neurospora, thereby establish-
ing a basis for comparative genomic studies in this model genus.
Even though our assemblies are not resolved to chromosomes,
CEGMA analysis revealed a high level of completeness (93–
96%, cf. 95–97% for the N. crassa finished genome). As the goal
of this study was to evaluate differences in molecular evolution
1 2 3 4
2030
4050
60
N. crassa-high N. crassa-all N. africana-high N. africana-all
Nc
GC3 4-f, 6f: 69.4 63.3 64.7 62.3
Figure 4. Effective number of codons in Neurospora africana and
Neurospora crassa. Boxplot distributions of the effective number
of codons (Nc) used in the top 100 highly expressed genes (HEGs)
in N. crassa and in N. africana (N. crassa-high, N. africana-high),
vs. all genes (N. crassa-all, N. africana-all). Outliers (Nc < 20) were
excluded for this plot. For each dataset, base composition (GC%)
at third positions of four- and six-fold degenerate codons (GC3
4f, 6f) is also presented. Note that HEGs were excluded from the
datasets N. africana-all and N. crassa-all so as to calculate GC3 4f,
6f without their influence.
1 0 EVOLUTION 2013
GENOMIC MALADAPTATION IN SELFING FUNGAL SPECIES
between selfing and outcrossing species, we focused on an-
notation of these genomes. Near-complete proteome sets were
generated with the annotation pipeline MAKER supplemented
with transcript evidence from multiple growth conditions of one
species, N. africana. Our approach predicted as many as 12,000
genes in each species (Table 1), close to the roughly 10,000 genes
found in N. crassa and consistent with typical overestimation (up
to 20%) of gene counts seen in microbial genome studies (Ussery
and Hallin 2004). Future work incorporating additional transcrip-
tome data from each selfing species is needed to further improve
our current annotations.
Comparing sequences of species with different reproductive
modes allowed us to empirically test, and confirm, predictions
of the dead-end theory for the first time in a fungal system. Fu-
ture studies on this question would ideally include outcrossing
species that belong to an independent clade of the Neurospora
phylogeny. This will allow unequivocally confirming that the ob-
served differences in genomic features correlate with reproductive
mode rather than phylogenetic signal. Still, our results highlight
a number of independent paradigms of genomic maladaptation in
selfing Neurospora.
INCREASE IN PROTEIN EVOLUTION RATES
INDICATES REDUCED PURIFYING SELECTION IN
SELFING SPECIES
Comparing models of protein evolution revealed an elevated dN/dS
ratio in branches leading to Neurospora selfing species (Fig. 1,
Table 2) for a considerable fraction of the genome (one third of the
2789 studied orthologs). This is notable given that, for the sake
of our comparisons, we grouped together selfing species from
distant phylogenetic groups that represent distinct transitions to
selfing (Nygren et al. 2011; Gioti et al. 2012). An indication
that phylogenetic signal, namely the use of outcrossing species
from the same clade, is unlikely to explain the observed dN/dS
differences, comes from a previous study by Nygren et al. (2011),
which included outcrossing species from a distinct clade and also
reported a significantly elevated rate of evolution for seven genes
in selfing lineages.
It is important to consider the potential contribution of
sequencing errors and uncertainties related to the use of the
dN/dS metric to these results. Our pipeline for assembly, whole-
genome alignment, identification, and selection of orthologs for
dN/dS comparisons ensured that regions of the Illumina-sequenced
genomes with potentially higher sequencing error rate are ex-
cluded from consideration. The sequencing error rate for the
2789 orthologous genes ranges between 0.002% and 0.016%
only. We confirmed that the collection of 2789 genes does not
show sampling variance that would render the dN/dS to dS rela-
tionship negative, and thus dN/dS estimates unreliable (Wolf et
al. 2009). The relationship between dN/dS and dS in our data is
weakly positive (Fig. S1A). A positive dN/dS to dS relationship
has been previously observed, for example, in mammals (Stolet-
zki and Eyre-Walker 2011) and was proposed to correlate with
mutation rate (Wyckoff et al. 2005). However, the correlation is
not significant, while it is outcrossing, and not selfing, species that
show higher mutation rates in our data (Table 2). Therefore, we
argue that mutation cannot explain the elevated dN/dS of selfing
Neurospora.
Despite relying on realistic assumptions (Nachman 1998),
the elevated dN/dS ratios are only a “proxy” for relaxed selection,
as formal models for assessing neutrality signatures do not exist
to our knowledge. Based on the strict positive selection test, we
estimate that for 7% of tested genes (Table 2), elevated dN/dS can
be explained primarily by positive selection. This percentage is
likely overestimated, as the branch-site model cannot distinguish
relaxed selective constraint from positive selection. Excluding
these genes, we posit that the remaining genes showing accel-
erated protein evolution rates are evolving under neutrality. We
interpret all the above results as signs of reduced efficiency of
purifying selection in removing slightly deleterious mutations in
selfing Neurospora.
REDUCED SPREAD AND LESS EFFICIENT
MUTATIONAL SILENCING OF TES IN SELFING
SPECIES
Theory on TE dynamics predicts opposing trends on genomes
of selfing species. Fewer TE copies are expected due to lack
of outcrossing, which promotes transpositions, but an increase
in TE abundance is expected due to relaxed negative selection,
which removes TE insertions from the population (Charlesworth
and Langley 1989). Our data indicate reduced spread of TEs in
genomes of selfing species (Table 3, Fig. 2), although the exact
TE content and the degree of reduction remain inexact measures,
due to the nature of the compared data and the limited species-
specific curated repeats available. We interpret these results as the
influence of reduced transposition in all classes of TEs, which is
consistent with the predicted long-term effects of selfing (Wright
et al. 2008).
A more unexpected finding was that TEs in selfing species
are less silenced by RIP (Table 3, Fig. 3). The percentages of
TEs subjected to RIP were calculated per genome, thus, reduced
RIP in selfing species indicates a potentially lower efficiency
of this mechanism and not a reduction that is due to the de-
creased amount of target substrate sequences. In N. crassa, RIP
has profoundly impacted the genomic landscape, with all TEs
appearing inactivated in the OR74A reference genome (Galagan
et al. 2003; Galagan and Selker 2004). It might be that our re-
sult reflects TE bursts and/or an increase in RIP efficiency that
are specific to the outcrossing species studied here. One would
need genome data from an outcrossing species that belongs to
EVOLUTION 2013 1 1
ANASTASIA GIOTI ET AL.
a distinct phylogenetic clade to explore these hypotheses. Be-
cause genome defense mechanisms, such as RIP, can protect
against the deleterious effects of selfish DNA, we propose that
less efficient RIP in selfing species could reflect reduced purifying
selection.
RELAXED SYNONYMOUS CODON USAGE BIAS IN
SELFING SPECIES INDICATES REDUCED ADAPTIVE
ABILITY
One way to address the adaptive ability of a species at the genome
level is to investigate the level of synonymous codon usage bias in
highly expressed genes. Codon usage bias correlates with tRNA
abundance (Ikemura 1982, 1985; Duret 2000) and with gene ex-
pression in a wide range of taxonomic groups (Sharp and Li
1987; Duret and Mouchiroud 1999; Cutter et al. 2006; Ingvarsson
2008; Qiu et al. 2011a). A correlation of codon usage bias with
gene expression is also observed in Neurospora, considering the
significant differences in Nc values of HEGs vs. all genes in
both outcrossing N. crassa and selfing N. africana (Fig. 4). We
observe a near complete identity of most frequent and optimal
codons between the two species (Table S3), but find that the
effective number of codons of N. africana HEGs (Fig. 4) and ri-
bosomal genes is significantly higher compared to N. crassa, and
the relative frequencies of optimal codons are lower (Table S4).
It is worth pointing out that weak codon usage in N. africana is
consistent with both a reduced adaptive ability and a relaxed neg-
ative selection for nonoptimal codons, and data on codon usage
bias of the ancestor would be needed to disentangle between these
possibilities.
Biases in synonymous codon usage may also result from
mutational pressure (Osawa et al. 1988; Sharp et al. 1995), ei-
ther biased mutation or biased gene conversion (gBGC), the lat-
ter mimicking selection (Marais 2003; Haudry et al. 2008). The
higher GC3% of N. crassa and N. africana HEGs compared to
related GCI values (Fig. S4) argues against this, similarly to previ-
ous studies (Whittle et al. 2011 and references within) and implies
that GC3 does not evolve neutrally in Neurospora. Because op-
timal codons end in G or C (Table S4), the significantly higher
GC3% of N. crassa HEGs compared to N. africana (Figs. 4,
S4) would argue for higher selection on codon usage bias in the
outcrossing species. However, this pattern seems independent of
expression level (Fig. 4), suggesting that patterns of codon usage
bias might be confounded by another factor driving nucleotide
composition. Taken together, our data provide weak support for
reduced selection for codons in the selfing N. africana com-
pared to N. crassa. Because this was a pairwise comparison, it
will be interesting to test the generality of our results once more
transcriptome data from selfing and outcrossing species become
available.
BASE COMPOSITION IN NEUROSPORA IS PRIMARILY
INFLUENCED BY NEUTRAL PROCESSES
Besides being a confounding factor for molecular evolution stud-
ies (Marais 2003; Berglund et al. 2009), gBGC can also reflect
differences in mating system. Simulations in A. thaliana showed
that gBGC is inefficient in highly inbred species (Marais et al.
2004), but no significant correlation between gBGC and mat-
ing system was found in Triticeae plants (Escobar et al. 2010).
The significantly higher GC% of selfing compared to outcrossing
Neurospora species (Table 3, Figs. 2, 3) is surprising, because it
is the opposite pattern of what one would expect under the influ-
ence of reduced effective recombination on gBGC. Cases where
GC content is higher in outcrossers as expected through the ac-
tion of gBGC are found only on third positions (N. africana–N.
crassa and N. discreta comparisons; Fig. S2), where selection
for codon usage may also interfere. In agreement with a role for
gBGC, GC3 of degenerate codons is lower in N. africana com-
pared to N. crassa for both HEGs and all genes (Fig. 4). Other
neutrally evolving features, such as introns and TEs, show either
no difference (GCIHEGs; Fig. S4) or higher GC% in selfing taxa
(GCIall genes, GCTEs; Fig. S2). Because gBGC in theory affects all
gene features, it seems unlikely from the present data that gBGC
strongly affects GC content in Neurospora.
One explanation for our results is that gBGC may not strongly
influence genomic base composition in fungi. In yeast, gBGC
was proposed to represent a relatively weak force genome-wide
(Harrison and Charlesworth 2011), whereas in Cryptococcus ne-
oformans, no strong evidence for a correlation of gBGC with
recombination was found (Pessia et al. 2012). A technical factor
potentially related to the higher GC% in selfing species is the
Illumina technology used for sequencing the genomes of these
species, as opposed to Sanger used for N. crassa and 454 used for
N. discreta and N. tetrasperma. Evidence for this artifact comes
from the higher GC% of N. crassa Illumina reads compared to the
finished genome; note however that the strains compared here are
not identical. We interpret how this technical difference might af-
fect our data with caution. Despite reports on a positive correlation
of Illumina-sequencing coverage and GC% (Dohm et al. 2008;
Minoche et al. 2011), we are not aware of a study that shows
that this GC bias preferentially occurs in Illumina vs. Sanger
and 454 technologies. In contrast, the fact that differences in
GC% overall affect both coding and noncoding genomic elements
(Fig. S2) indicates that a neutral process primarily drives base
composition in Neurospora. We propose below that this process
is mutation.
AN INCREASE IN MUTATION RATE IN OUTCROSSING
NEUROSPORA SPECIES
In contrast to protein evolution rates, the substitution rate is 2–3
times higher in outcrossing Neurospora species (Table 2). This
1 2 EVOLUTION 2013
GENOMIC MALADAPTATION IN SELFING FUNGAL SPECIES
finding could explain their lower GC%. An AT-bias among uncor-
rected mutations has been reported in yeast (Lynch et al. 2008),
whereas many common types of damage cause AT-biased mu-
tations (Wernegreen and Funk 2004 and references within). We
would need to further explore this hypothesis by estimating the
equilibrium GC in Neurospora, for example, by using the meth-
ods described in (Dutheil et al. 2012). RIP is an additional process
that is increased in outcrossing species (Fig. 3) and contributes to
base composition differences of TEs (Pearson’s product–moment
correlation for GC%TEs and RIP = −0.931, P = 0.001148). This
is because RIP introduces C:G to T:A transition mutations (Selker
1990). Therefore, the high fraction of RIP-inactivated TEs in out-
crossing species can explain their lower GC% (Table 3) and the
considerable variation in TE base composition in these genomes
(Fig. S2).
Assuming little/no selection at silent sites, nucleotide sub-
stitution rates approximate genomic mutation rate. Why is the
mutation rate higher in outcrossing Neurospora? The most obvi-
ous explanation comes from the fact that these species, in contrast
to selfing Neurospora, have an asexual reproduction pathway,
which involves formation of structures called conidia through mi-
totic divisions (Springer 1993). Mutations arise when base misin-
corporations or insertion/deletions remain after proofreading by
the replicating DNA polymerase. Therefore, it is plausible that
an increased rate of mitotic divisions and thus, replication er-
rors, during conidiation can contribute to the higher substitution
rate of outcrossing species. Mitotic recombination can further
cause point mutations, as in yeast (Strathern et al. 1995; Hicks
et al. 2010). Alternatively, one could consider the contribution
of higher effective meiotic recombination in outcrossing species.
Indel-associated mutations depend on the level of heterozygosity,
such that heterozygote indels could increase the point mutation
rate at nearby nucleotides because of errors during meiosis (Tian
et al. 2008). The observed differences in nucleotide substitution
rates could thus reflect a reduced mutation rate in genomes of
Neurospora selfing species as a consequence of low heterozy-
gosity levels. However, this hypothesis relies on the assumption
of a relatively high occurrence of indels, whereas whether mei-
otic recombination is mutagenic remains controversial (Webster
and Hurst 2012). A final hypothesis to consider is that intrin-
sic mutation rate is lowered in selfing species; it was proposed
that selective processes can modify genomic mutation rate (e.g.,
Kondrashov 1995; Dawson 1998).
ON THE LONG-TERM PERSISTENCE OF SELFING
NEUROSPORA
Our study provides several lines of evidence for reduced strength
of selection (elevation of dN/dS, reduced silencing of TEs by RIP,
relaxed codon usage bias), in line with the prediction for mal-
adaptation in selfing lineages. Along with a previous study on
unidirectional shifts to self-fertility (Gioti et al. 2012), we overall
confirm both postulates of the dead-end theory in a selfing fun-
gus. Are then selfing Neurospora species reaching an evolutionary
impass? The diversification of selfing lineages in Neurospora in-
dicates that the origins of this mating system are not recent in the
genus (Nygren et al. 2011). Ancient asexual lineages exist in the
fungal and other kingdoms, providing examples of mechanisms
that promote genetic diversity and thus, long-term persistence
(Kuhn et al. 2001; Pouchkina-Stantcheva et al. 2007; Rice and
Friberg 2007; Gladyshev et al. 2008; Boschetti et al. 2012). Our
findings suggest two factors potentially counteracting the nega-
tive effects of selfing in Neurospora. One is the limited spread of
TEs, which can protect the genomes of selfing species from their
deleterious effects. A second factor is the absence of the conidi-
ation pathway, which may offer genome-wide protection from a
mutational load.
Estimating the theoretical potential for extinction of species
relies on parameters that are currently unknown for selfing Neu-
rospora, such as the effective population size. Differences in the
ecology of Neurospora species may further contribute in under-
standing why obligate haploid selfing was favored and persisted
in this genus. Our study implies that both sexual and asexual re-
production pathways affect genome evolution in a filamentous
fungus. Therefore, assessing the meiotic and mitotic spore fitness
and survival may prove very useful in understanding the history of
reproductive systems (Nauta and Hoekstra 1992b). For example
in yeast, it was proposed that heterozygosity among lineages cor-
relates with a life-history trade-off that involves how readily the
species switch from asexual to sexual reproduction when faced
with nutrient stress (Magwene et al. 2011). Future population ge-
nomic studies are expected to shed light in the benefits and costs
of adopting a selfing reproductive mode.
ACKNOWLEDGMENTSThe authors thank B. Nabholz, J. Wolf, and S. Glemin for helpfuldiscussions, M. Karlsson for help with the Bioanalyzer apparatus, S.Robb for sharing scripts on TE analyses, and D. Vanderpool for advice onphylogenetic reconstructions. Two anonymous reviewers are thanked foruseful proposals on consolidation of our results. This work was supportedby Carl Tryggers Stiftelse and Nilsson-Ehle foundations (to AG) and theSwedish Research Council (to HJ). Computational resources, includingaccess to the Bioinformatics Core at UCR, were made available throughinitial complement funds to JES. The authors declare no conflict ofinterest.
LITERATURE CITEDAanen, D. K., and R. F. Hoekstra. 2007. Why sex is good: on fungi and
beyond. Pp. 527–534 in J. W. K. J. Heitman, J. W. Taylor, and L. A.Casselton, ed. Sex in fungi: molecular determination and evolutionaryimplications. ASM Press, Washington, DC.
Akashi, H. 1994. Synonymous codon usage in Drosophila melanogaster:natural selection and translational accuracy. Genetics 136:927–935.
EVOLUTION 2013 1 3
ANASTASIA GIOTI ET AL.
Artieri, C. G., W. Haerty, B. P. Gupta, and R. S. Singh. 2008. Sexual selectionand maintenance of sex: evidence from comparisons of rates of genomicaccumulation of mutations and divergence of sex-related genes in sexualand hermaphroditic species of Caenorhabditis. Mol. Biol. Evol. 25:972–979.
Berglund, J., K. S. Pollard, and M. T. Webster. 2009. Hotspots of biasednucleotide substitutions in human genes. PLoS Biol. 7:e1000026.
Billiard, S., M. Lopez-Villavicencio, M. E. Hood, and T. Giraud. 2012. Sex,outcrossing and mating types: unsolved questions in fungi and beyond.J. Evol. Biol. 25:1020–1038.
Boschetti, C., A. Carr, A. Crisp, I. Eyres, Y. Wang-Koh, E. Lubzens, T. G.Barraclough, G. Micklem, and A. Tunnacliffe. 2012. Biochemical di-versification through foreign gene expression in bdelloid rotifers. PLoSGenet. 8:e1003035.
Busch, J. W., and L. F. Delph. 2011. The relative importance of reproductiveassurance and automatic selection as hypotheses for the evolution ofself-fertilization. Ann. Bot 109:553–562.
Cantarel, B. L., I. Korf, S. M. Robb, G. Parra, E. Ross, B. Moore, C. Holt,A. Sanchez Alvarado, and M. Yandell. 2008. MAKER: an easy-to-useannotation pipeline designed for emerging model organism genomes.Genome Res. 18:188–196.
Capella-Gutiierrez, S., J. M. Silla-Martınez, and T. Gabaldon. 2009. trimAl:a tool for automated alignment trimming in large-scale phylogeneticanalyses. Bioinformatics 25:1972–1973.
Charlesworth, B. 1992. Evolutionary rates in partially self-fertilizing species.Am. Nat. 140:126–148.
Charlesworth, B., and C. H. Langley. 1989. The population genetics ofDrosophila transposable elements. Ann. Rev. Genet. 23:251–287.
Charlesworth, D., and B. Charlesworth. 1995. Transposable elements in in-breeding and outbreeding populations. Genetics 140:415–417.
Charlesworth, D., and S. I. Wright. 2001. Breeding systems and genomeevolution. Curr. Opin. Genet. Develop. 11:685–690.
Cock, P. J. A., T. Antao, J. T. Chang, B. A. Chapman, C. J. Cox, A. Dalke,I. Friedberg, T. Hamelryck, F. Kauff, B. Wilczynski, and M. J. L. deHoon. 2009. Biopython: freely available Python tools for computationalmolecular biology and bioinformatics. Bioinformatics 25:1422–1423.
Cutter, A. D., J. D. Wasmuth, and M. L. Blaxter. 2006. The evolution ofbiased codon and amino acid usage in nematode genomes. Mol. Biol.Evol. 23:2303–2315.
Cutter, A. D., J. D. Wasmuth, and N. L. Washington. 2008. Patterns of molec-ular evolution in Caenorhabditis preclude ancient origins of selfing.Genetics 178:2093–2104.
Dawson, K. J. 1998. Evolutionarily stable mutation rates. J. Theor. Biol.194:143–157.
Dewey, C. N. 2007. Aligning multiple whole genomes with Mercator andMAVID. Methods Mol. Biol. 395:221–236.
Dohm, J. C., C. Lottaz, T. Borodina, and H. Himmelbauer. 2008. Substantialbiases in ultra-short read datasets from high-throughput DNA sequenc-ing. Nucleic Acids Res. 36:e105.
Dolgin, E. S., B. Charlesworth, A. D. Cutter, E. S. Dolgin, B. Charlesworth,and A. D. Cutter. 2008. Population frequencies of transposable ele-ments in selfing and outcrossing Caenorhabditis nematodes. Genet. Res.90:317–329.
Duret, L. 2000. tRNA gene number and codon usage in the C. elegans genomeare coadapted for optimal translation of highly expressed genes. TrendsGenet. 16:287–289.
——— 2002. Evolution of synonymous codon usage in metazoans. Curr.Opin. Genet. Develop. 12:640–649.
Duret, L., and N. Galtier. 2009. Biased gene conversion and the evolutionof mammalian genomic landscapes. Ann. Rev. Genom. Human Genet.10:285–311.
Duret, L., and D. Mouchiroud. 1999. Expression pattern and, surprisingly,gene length shape codon usage in Caenorhabditis, Drosophila, and Ara-bidopsis. Proc. Natl. Acad. Sci. 96:4482–4487.
Dutheil, J. Y., N. Galtier, J. Romiguier, E. J. P. Douzery, V. Ranwez, and B.Boussau. 2012. Efficient selection of branch-specific models of sequenceevolution. Mol. Biol. Evol. 29:1861–1874.
Edgar, R. C. 2004. MUSCLE: multiple sequence alignment with high accuracyand high throughput. Nucleic Acids Res. 32:1792–1797.
Ellison, C. E., C. Hall, D. Kowbel, J. Welch, R. B. Brem, N. L. Glass, andJ. W. Taylor. 2011a. Population genomics and local adaptation in wildisolates of a model microbial eukaryote. Proc. Natl. Acad. Sci. USA108:2831–2836.
Ellison, C. E., J. E. Stajich, D. J. Jacobson, D. O. Natvig, A. Lapidus, B. Fos-ter, A. Aerts, R. Riley, E. A. Lindquist, I. V. Grigoriev, and J. W. Taylor.2011b. Massive changes in genome architecture accompany the transi-tion to self-fertility in the filamentous fungus Neurospora tetrasperma.Genetics 189:55–69.
Escobar, J. S., A. Cenci, J. Bolognini, A. Haudry, S. Laurent, J. David, and S.Glemin. 2010. An integrative test of the dead-end hypothesis of selfingevolution in Triticae (Poaceae). Evolution 64:2855–2872.
Galagan, J. E., and E. U. Selker. 2004. RIP: the evolutionary cost of genomedefense. Trends Genet. 20:417–423.
Galagan, J. E., S. E. Calvo, K. A. Borkovich, E. U. Selker, N. D. Read, D.Jaffe, W. FitzHugh, L. J. Ma, S. Smirnov, S. Purcell, et al. 2003. Thegenome sequence of the filamentous fungus Neurospora crassa. Nature422:859–868.
Gioti, A., A. A. Mushegian, R. Strandberg, J. E. Stajich, and H. Johannesson.2012. Unidirectional evolutionary transitions in fungal mating systemsand the role of transposable elements. Mol. Biol. Evol. 29:3215–3226.
Gladyshev, E. A., M. Meselson, and I. R. Arkhipova. 2008. Massive horizontalgene transfer in bdelloid rotifers. Science 320:1210–1213.
Glass, N. L., R. L. Metzenberg, and N. B. Raju. 1990. Homothallic Sordari-aceae from nature: the absence of strains containing only the a matingtype sequence. Exp. Mycol. 14:274–289.
Glemin, S., and N. Galtier. 2012. Genome evolution in outcrossing versusselfing versus asexual species. In M. Anisimova, ed. Evolutionary ge-nomics: statistical and computational methods, Vol 1; Methods Mol.Biol., 855:311–335, Springer.
Goodwillie, C. 1997. The genetic control of self-incompatibility in Linanthusparviflorus (Polemoniaceae). Heredity 79:424–432.
Guindon, S., J.-F. Dufayard, V. Lefort, M. Anisimova, W. Hordijk, and O.Gascuel. 2010. New algorithms and methods to estimate maximum-likelihood phylogenies: assessing the performance of PhyML 3.0. Syst.Biol. 59:307–321.
Haas, B. J., A. L. Delcher, S. M. Mount, J. R. Wortman, R. K. Smith, L.I. Hannick, R. Maiti, C. M. Ronning, D. B. Rusch, C. D. Town, S. L.Salzberg, and O. White. 2003. Improving the Arabidopsis genome an-notation using maximal transcript alignment assemblies. Nucleic AcidsRes. 31:5654–5666.
Han, Y., J. M. Burnette, III, and S. R. Wessler. 2009. TARGeT: a web-basedpipeline for retrieving and characterizing gene and transposable elementfamilies from genomic sequences. Nucleic Acids Res. 37:e78.
Harrison, R. J., and B. Charlesworth. 2011. Biased gene conversion affectspatterns of codon usage and amino acid usage in the Saccharomyces
sensu stricto group of yeasts. Mol. Biol. Evol. 28:117–129.Haudry, A., A. Cenci, C. Guilhaumon, E. Paux, S. Poirier, S. Santoni, J. David,
and S. Glemin. 2008. Mating system and recombination affect molecularevolution in four Triticeae species. Genetic Res. (Camb.) 90:97–109.
Hicks, W. M., M. Kim, and J. E. Haber. 2010. Increased mutagenesis andunique mutation signature associated with mitotic gene conversion.Science 329:82–85.
1 4 EVOLUTION 2013

GENOMIC MALADAPTATION IN SELFING FUNGAL SPECIES
Hill, W. G., and A. Robertson. 1966. The effect of linkage on limits to artificialselection. Genet. Res. 8:269–294.
Howe, J. H. B., and J. E. Page. 1963. Nonconidiation in the new homothallicspecies, Neurospora terricola. Neurospora Newslett. 4:7.
Igic, B., L. Bohs, and J. R. Kohn. 2006. Ancient polymorphism reveals unidi-rectional breeding system shifts. Proc. Natl. Acad. Sci. USA 103:1359–1363.
Ingvarsson, P. 2008. Molecular evolution of synonymous codon usage inPopulus. BMC Evol. Biol. 8:307. doi:10.1186/1471-2148-8-307.
Ikemura, T. 1982. Correlation between the abundance of yeast transfer RNAsand the occurrence of the respective codons in protein genes: differencesin synonymous codon choice patterns of yeast and Escherichia coli withreference to the abundance of isoaccepting transfer RNAs. J. Mol. Biol.158:573–597.
Ikemura, T. 1985. Codon usage and tRNA content in unicellular and multi-cellular organisms. Mol. Biol. Evol. 2:13–34.
Jurka, J., V. V. Kapitonov, A. Pavlicek, P. Klonowski, O. Kohany, and J.Walichiewicz. 2005. Repbase Update, a database of eukaryotic repetitiveelements. Cytogenet. Genome Res. 110:462–467.
Keane, T. M., C. J. Creevey, M. M. Pentony, T. J. Naughton, and J. O. McLner-ney. 2006. Assessment of methods for amino acid matrix selection andtheir use on empirical data shows that ad hoc assumptions for choice ofmatrix are not justified. BMC Evol. Biol. 6:29.
Kircher, M., U. Stenzel, and J. Kelso. 2009. Improved base calling for theIllumina Genome Analyzer using machine learning strategies. GenomeBiol. 10:R83.
Kondrashov, A. S. 1995. Modifiers of mutation-selection balance: generalapproach and the evolution of mutation rates. Genet. Res. 66:53–69.
Korf, I. 2004. Gene finding in novel genomes. BMC Bioinform. 5:59.doi:10.1186/1471-2105-5-59
Kuhn, G., M. Hijri, and I. R. Sanders. 2001. Evidence for the evolution ofmultiple genomes in arbuscular mycorrhizal fungi. Nature 414:745–748.
Landan, G., and D. Graur. 2007. Heads or tails: a simple reliability check formultiple sequence alignments. Mol. Biol. Evol. 24:1380–1383.
Lewis, Z. A., S. Honda, T. K. Khlafallah, J. K. Jeffress, M. Freitag, F. Mohn, D.Schuebeler, and E. U. Selker. 2009. Relics of repeat-induced point mu-tation direct heterochromatin formation in Neurospora crassa. GenomeRes. 19:427–437.
Li, W. Z., L. Jaroszewski, and A. Godzik. 2001. Clustering of highly homol-ogous sequences to reduce the size of large protein databases. Bioinfor-matics 17:282–283.
Luo, C., D. Tsementzi, N. Kyrpides, T. Read, and K. T. Konstantinidis. 2012.Direct comparisons of illumina vs. roche 454 sequencing technologieson the same microbial community DNA sample. PLoS One 7:e30087.
Lynch, M., W. Sung, K. Morris, N. Coffey, C. R. Landry, E. B. Dopman,W. J. Dickinson, K. Okamoto, S. Kulkarni, D. L. Hartl, et al. 2008. Agenome-wide view of the spectrum of spontaneous mutations in yeast.Proc. Natl. Acad. Sci. 105:9272–9277.
Magwene, P. M., O. Kayıkcı, J. A. Granek, J. M. Reininga, Z. Scholl, andD. Murray. 2011. Outcrossing, mitotic recombination, and life-historytrade-offs shape genome evolution in Saccharomyces cerevisiae. Proc.Natl. Acad. Sci. 108:1987–1992.
Marais, G. 2003. Biased gene conversion: implications for genome and sexevolution. Trends Genet. 19:330–338.
Marais, G., B. Charlesworth, and S. I. Wright. 2004. Recombination and basecomposition: the case of the highly self-fertilizing plant Arabidopsisthaliana. Genome Biol. 5:1–9.
McCluskey, K., A. E. Wiest, I. V. Grigoriev, A. Lipzen, J. Martin, W. Schack-witz, and S. E. Baker. 2011. Rediscovery by whole genome sequencing:classical mutations and genome polymorphisms in Neurospora crassa.G3: Genes, Genomes, Genet. 1:303–316.
Menkis, A., E. Bastiaans, D. J. Jacobson, and H. Johannesson. 2009. Phyloge-netic and biological species diversity within the Neurospora tetraspermacomplex. J. Evol. Biol. 22:1923–1936.
Minoche, A., J. Dohm, and H. Himmelbauer. 2011. Evaluation of genomichigh-throughput sequencing data generated on Illumina HiSeq andGenome Analyzer systems. Genome Biol. 12:R112.
Morgan, M. T. 2001. Transposable element number in mixed mating popula-tions. Genet. Res. 77:261–275.
Nachman, M. 1998. Deleterious mutations in animal mitochondrial DNA.Genetica 102–103:61–69.
Nauta, M. J., and R. F. Hoekstra. 1992a. Evolution of reproductive systems infilamentous ascomycetes. I. Evolution of mating types. Heredity 68:405–410.
Nauta, M. J., and R. F. Hoekstra. 1992b. Evolution of reproductive systemsin filamentous ascomycetes. II. Evolution of hermaphroditism and otherreproductive strategies. Heredity 68(Pt 6):537–546.
Normark, B. B., O. P. Judson, and N. A. Moran. 2003. Genomic signatures ofancient asexual lineages. Biol. J. Linnean Soc. 79:69–84.
Nygren, K., R. Strandberg, A. Wallberg, B. Nabholz, T. Gustafsson, D. Gar-cia, J. Cano, J. Guarro, and H. Johannesson. 2011. A comprehensivephylogeny of Neurospora reveals a link between reproductive mode andmolecular evolution in fungi. Mol. Phylogenet. Evol. 59:649–663.
Osawa, S., T. Ohama, F. Yamao, A. Muto, T. H. Jukes, H. Ozeki, and K.Umesono. 1988. Directional mutation pressure and transfer RNA inchoice of the third nucleotide of synonymous two-codon sets. Proc.Natl. Acad. Sci. 85:1124–1128.
Otto, S. P., and T. Lenormand. 2002. Resolving the paradox of sex and recom-bination. Nat. Rev. Genet. 3:252–261.
Paland, S., and M. Lynch. 2006. Transitions to asexuality result in excessamino acid substitutions. Science 311:990–992.
Parra, G., K. Bradnam, and I. Korf. 2007. CEGMA: a pipeline to accuratelyannotate core genes in eukaryotic genomes. Bioinformatics 23:1061–1067.
Perkins, D. D. 1987. Mating-type switching in filamentous ascomycetes. Ge-netics 115:215–216.
Pessia, E., A. Popa, S. Mousset, C. Rezvoy, L. Duret, and G. A. B. Marais.2012. Evidence for widespread GC-biased gene conversion in eukary-otes. Genome Biol. Evol. 4:675–682.
Pollack, E. 1987. On the theory of partially inbreeding finite populations.I. Partial selfing. Genetics 117:353–360.
Pouchkina-Stantcheva, N. N., B. M. McGee, C. Boschetti, D. Tolleter, S.Chakrabortee, A. V. Popova, F. Meersman, D. Macherel, D. K. Hincha,and A. Tunnacliffe. 2007. Functional divergence of former alleles in anancient asexual invertebrate. Science 318:268–271.
Powell, A. J., D. J. Jacobson, and D. O. Natvig. 2001. Allelic diversityat the het-c locus in Neurospora tetrasperma confirms outcrossingin nature and reveals an evolutionary dilemma for pseudohomothallicascomycetes. J. Mol. Evol. 52:94–102.
Powell, A. J., D. J. Jacobson, L. Salter, and D. O. Natvig. 2003. Variationamong natural isolates of Neurospora on small spatial scales. Mycologia95:809–819.
Qiu, S., R. Bergero, K. Zeng, and D. Charlesworth. 2011a. Patterns of codonusage bias in Silene latifolia. Mol. Biol. Evol. 28:771–780.
Qiu, S., K. Zeng, T. Slotte, S. Wright, and D. Charlesworth. 2011b. Reducedefficacy of natural selection on codon usage bias in selfing Arabidopsisand Capsella species. Genome Biol. Evol. 3:868–880.
Raju, N. B. 1992. Functional heterothallism resulting from homokaryoticconidia and ascospores in Neurospora tetrasperma. Mycol. Res. 96:103–116.
Rice, P., I. Longden, and A. Bleasby. 2000. EMBOSS: The European molec-ular biology open software suite. Trends Genet. 16:276–277.
EVOLUTION 2013 1 5
ANASTASIA GIOTI ET AL.
Rice, W. R., and U. Friberg. 2007. Genomic clues to an ancient asexualscandal. Genome Biol. 8:232. doi: 10.1186/gb-2007-8-12-232
Ronquist, F., M. Teslenko, P. van der Mark, D. L. Ayres, A. Darling, S. Hohna,B. Larget, L. Liu, M. A. Suchard, and J. P. Huelsenbeck. 2012. MrBayes3.2: efficient Bayesian phylogenetic inference and model choice acrossa large model space. Syst. Biol 61:539–542.
Schoen, D. J., M. O. Johnston, A.-M. L’Heureux, and J. V. Marsolais. 1997.Evolutionary history of the mating system in Amsinckia (Boraginaceae).Evolution 51:1090–1099.
Selker, E. U. 1990. Premeiotic instability of repeated sequences in Neurospora
crassa. Ann. Rev. Genet. 24:579–613.Sharp, P. M., M. Averof, A. T. Lloyd, G. Matassi, and J. F. Peden. 1995. DNA
sequence evolution: the sounds of silence. Philos. Trans. R. Soc. Lond.Ser. B: Biol. Sci. 349:241–247.
Sharp, P. M., and W. H. Li. 1987. The codon adaptation index-a measure ofdirectional synonymous codon usage bias, and its potential applications.Nucleic Acids Res. 15:1281–1295.
Springer, M. L. 1993. Genetic control of fungal differentiation: the threesporulation pathways of Neurospora crassa. BioEssays 15:365–374.
Stajich, J. E., D. Block, K. Boulez, S. E. Brenner, S. A. Chervitz, C. Dagdi-gian, G. Fuellen, J. G. R. Gilbert, I. Korf, H. Lapp, et al. 2002. The biop-erl toolkit: perl modules for the life sciences. Genome Res. 12:1611–1618.
Stanke, M., and S. Waack. 2003. Gene prediction with a hidden Markov modeland a new intron submodel. Bioinformatics 19(Suppl 2):ii215–ii225.
Stebbins, G. L. 1957. Self fertilization and population variability in the higherplants. Am. Nat. 91:337–354.
Stoletzki, N., and A. Eyre-Walker. 2007. Synonymous codon usage in Es-cherichia coli: Selection for translational accuracy. Mol. Biol. Evol.24:374–381.
——— 2011. The positive correlation between dN/dS and dS in mammals Isdue to runs of adjacent substitutions. Mol. Biol. Evol. 28:1371–1380.
Storey, J. D. 2002. A direct approach to false discovery rates. J. R. Stat. Soc.Ser. B-Stat. Methodol. 64:479–498.
Strathern, J. N., B. K. Shafer, and C. B. McGill. 1995. DNA synthesis errorsassociated with double-strand-break repair. Genetics 140:965–972.
Takebayashi, N. T., and P. Morrell. 2001. Is self-fertilization an evolution-ary dead-end? Revisiting an old hypothesis with genetic theories and amacroevolutionary approach. Am. J. Bot. 88:1143–1150.
Ter-Hovhannisyan, V., A. Lomsadze, Y. O. Chernoff, and M. Borodovsky.2008. Gene prediction in novel fungal genomes using an ab initio algo-rithm with unsupervised training. Genome Res. 18:1979–1990.
Tian, D., Q. Wang, P. Zhang, H. Araki, S. Yang, M. Kreitman, T. Nagylaki,R. Hudson, J. Bergelson, and J.-Q. Chen. 2008. Single-nucleotide mu-tation rate increases close to insertions/deletions in eukaryotes. Nature455:105–108.
Trapnell, C., L. Pachter, and S. L. Salzberg. 2009. TopHat: discovering splicejunctions with RNA-Seq. Bioinformatics 25:1105–1111.
Trapnell, C., B. A. Williams, G. Pertea, A. Mortazavi, G. Kwan, M. J. vanBaren, S. L. Salzberg, B. J. Wold, and L. Pachter. 2010. Transcript assem-
bly and quantification by RNA-Seq reveals unannotated transcripts andisoform switching during cell differentiation. Nat. Biotechnol. 28:511-U174.
Treangen, T. J., and S. L. Salzberg. 2012. Repetitive DNA and next-generationsequencing: computational challenges and solutions. Nat. Rev. Genet.13:36–46.
Ussery, D. W., and P. F. Hallin. 2004. Genome Update: annotation quality insequenced microbial genomes. Microbiology 150:2015–2017.
Vogel, H. J. 1964. Distribution of Lysine Pathways Among Fungi: Evolution-ary Implications. Am. Nat. 98:435–446.
Webster, M. T., and L. D. Hurst. 2012. Direct and indirect consequencesof meiotic recombination: implications for genome evolution. TrendsGenet. 28:101–109.
Wernegreen, J., and D. Funk. 2004. Mutation exposed: a neutral explanationfor extreme base composition of an endosymbiont genome. J. Mol. Evol.59:849–858.
Westergaard, M., and H. K. Mitchell. 1947. A synthetic medium favouringsexual reproduction. Am. J. Bot. 34:573–577.
Whittle, C. A., Y. Sun, and H. Johannesson. 2011. Evolution of synony-mous codon usage in Neurospora tetrasperma and Neurospora discreta.Genome Biol. Evol. 3:332–343.
Wolf, J. B. W., A. Kunstner, K. Nam, M. Jakobsson, and H. Ellegren. 2009.Nonlinear dynamics of nonsynonymous (dN) and synonymous (dS) sub-stitution rates affects inference of selection. Genome Biol. Evol. 1:308–319.
Wright, F. 1990. The effective number of codons used in a gene. Gene 87:23–29.
Wright, S. I., and D. J. Schoen. 1999. Transposon dynamics and the breedingsystem. Genetica 107:139–148.
Wright, S. I., B. Lauga, and D. Charlesworth. 2002. Rates and patterns ofmolecular evolution in inbred and outbred Arabidopsis. Mol. Biol. Evol.19:1407–1420.
Wright, S. I., R. W. Ness, J. P. Foxe, and S. C. H. Barrett. 2008. Genomicconsequences of outcrossing and selfing in plants. Intl. J. Plant Sci.169:105–118.
Wyckoff, G. J., C. M. Malcom, E. J. Vallender, and B. T. Lahn. 2005. Ahighly unexpected strong correlation between fixation probability ofnonsynonymous mutations and mutation rate. Trends Genet. 21:381–385.
Yang, Z. 2007. PAML 4: phylogenetic analysis by maximum likelihood. Mol.Biol. Evol. 24:1586–1591.
Yang, Z. H. 1997. PAML: a program package for phylogenetic analysis bymaximum likelihood. Comput. Appl. Biosci. 13:555–556.
Yun, S. H., M. L. Berbee, O. C. Yoder, and B. G. Turgeon. 1999. Evolution ofthe fungal self-fertile reproductive life style from self-sterile ancestors.Proc. Natl. Acad. Sci. USA 96:5592–5597.
Zerbino, D. R., and E. Birney. 2008. Velvet: algorithms for de novo short readassembly using de Bruijn graphs. Genome Res. 18:821–829.
Associate Editor: L. Jesson
1 6 EVOLUTION 2013
GENOMIC MALADAPTATION IN SELFING FUNGAL SPECIES
Supporting InformationAdditional Supporting Information may be found in the online version of this article at the publisher’s website:
Figure S1. Molecular evolution analyses on concatenated and individual genes.
Figure S2. GC% of different classes of genomic features in Neurospora genomes.
Figure S3. Boxplot distributions of GC% at variant positions of Neurospora orthologs.
Figure S4. GC% of genes used for codon usage bias analyses.
Table S1. Full summary of genome and assembly statistics.
Table S2. Transposable element content of raw reads.
Table S3. Codon usage in Neurospora species.
Table S4. Codon usage in highly expressed genes of the selfing species N. africana and the outcrossing species N. crassa.
EVOLUTION 2013 1 7