312
Nano-FTIR chemical mapping of mineralsin biological materials
Sergiu Amarie1, Paul Zaslansky2, Yusuke Kajihara1,3, Erika Griesshaber4,Wolfgang W. Schmahl4 and Fritz Keilmann*1
Full Research Paper Open Access
Address:1Max Planck Institute of Quantum Optics and Center forNanoScience, 85748 Garching, Germany, 2Max Planck Institute ofColloids and Interfaces, Wissenschaftspark Golm, 14424 Potsdam,Germany, 3Department of Basic Science, The University of Tokyo,Tokyo 153-8902, Japan and 4GeoBio-Center at LMU and Departmentof Earth and Environmental Sciences,Ludwig-Maximilians-Universität, 80333 München, Germany
Email:Fritz Keilmann* - [email protected]
* Corresponding author
Keywords:biomineralization; chemical mapping; infrared spectroscopy;nanocrystals; optical near-field microscopy
Beilstein J. Nanotechnol. 2012, 3, 312–323.doi:10.3762/bjnano.3.35
Received: 30 December 2011Accepted: 07 March 2012Published: 05 April 2012
This article is part of the Thematic Series "Nanophotonics, nano-opticsand nanospectroscopy".
Guest Editor: A. J. Meixner
© 2012 Amarie et al; licensee Beilstein-Institut.License and terms: see end of document.
AbstractMethods for imaging of nanocomposites based on X-ray, electron, tunneling or force microscopy provide information about the
shapes of nanoparticles; however, all of these methods fail on chemical recognition. Neither do they allow local identification of
mineral type. We demonstrate that infrared near-field microscopy solves these requirements at 20 nm spatial resolution, high-
lighting, in its first application to natural nanostructures, the mineral particles in shell and bone. "Nano-FTIR" spectral images result
from Fourier-transform infrared (FTIR) spectroscopy combined with scattering scanning near-field optical microscopy (s-SNOM).
On polished sections of Mytilus edulis shells we observe a reproducible vibrational (phonon) resonance within all biocalcite micro-
crystals, and distinctly different spectra on bioaragonite. Surprisingly, we discover sparse, previously unknown, 20 nm thin
nanoparticles with distinctly different spectra that are characteristic of crystalline phosphate. Multicomponent phosphate bands are
observed on human tooth sections. These spectra vary characteristically near tubuli in dentin, proving a chemical or structural varia-
tion of the apatite nanocrystals. The infrared band strength correlates with the mineral density determined by electron microscopy.
Since nano-FTIR sensitively responds to structural disorder it is well suited for the study of biomineral formation and aging.
Generally, nano-FTIR is suitable for the analysis and identification of composite materials in any discipline, from testing during
nanofabrication to even the clinical investigation of osteopathies.
312
Beilstein J. Nanotechnol. 2012, 3, 312–323.
313
IntroductionFourier-transform infrared spectroscopy (FTIR) [1] is a stan-
dard tool in chemical analysis. It can identify virtually any
substance through the "fingerprint" of the molecular vibrational
absorption spectrum in the 3–30 µm wavelength region. Nano-
FTIR spectroscopic near-field microscopy is a fascinating
recent advance [2-4]. It enables scattering near-field optical
microscopes (s-SNOM) [5,6] to operate at ultrahigh spatial
resolution over a broad mid-infrared spectrum emitted from
either a coherent supercontinuum source [2,3] or an incoherent
thermal source [4]. The s-SNOM uses a metalized AFM tip as a
light-concentrating antenna such that the sample is probed with
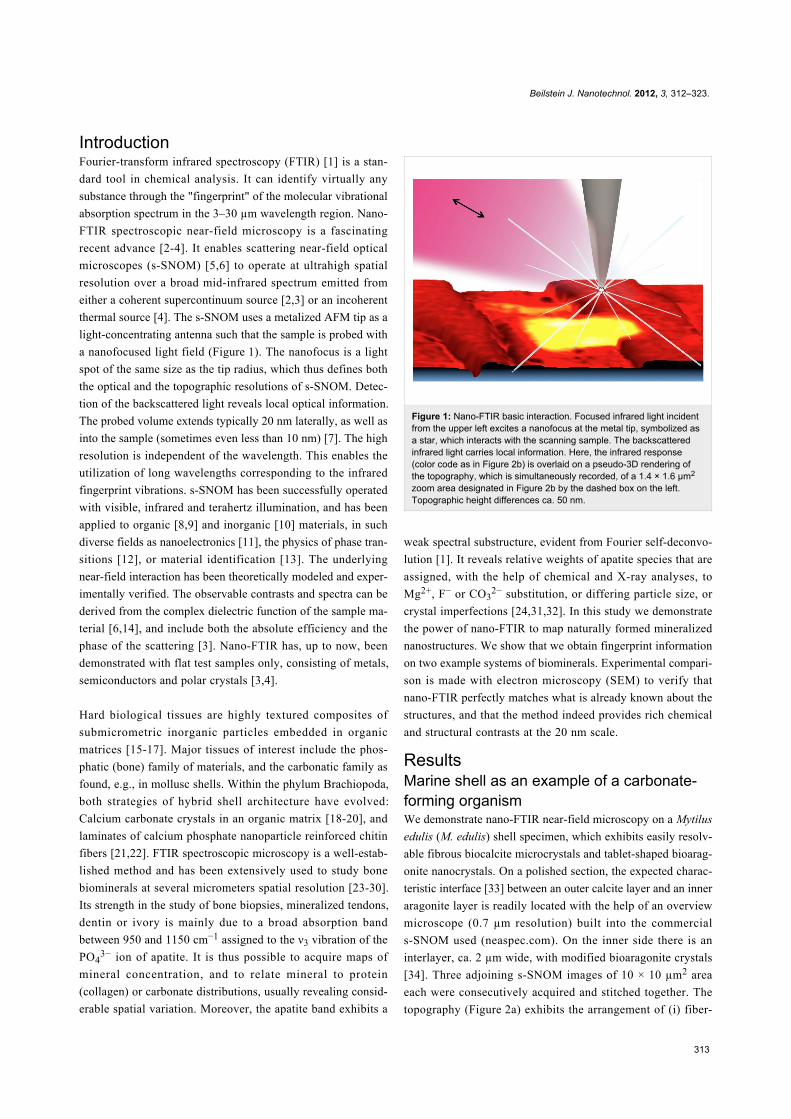
a nanofocused light field (Figure 1). The nanofocus is a light
spot of the same size as the tip radius, which thus defines both
the optical and the topographic resolutions of s-SNOM. Detec-
tion of the backscattered light reveals local optical information.
The probed volume extends typically 20 nm laterally, as well as
into the sample (sometimes even less than 10 nm) [7]. The high
resolution is independent of the wavelength. This enables the
utilization of long wavelengths corresponding to the infrared
fingerprint vibrations. s-SNOM has been successfully operated
with visible, infrared and terahertz illumination, and has been
applied to organic [8,9] and inorganic [10] materials, in such
diverse fields as nanoelectronics [11], the physics of phase tran-
sitions [12], or material identification [13]. The underlying
near-field interaction has been theoretically modeled and exper-
imentally verified. The observable contrasts and spectra can be
derived from the complex dielectric function of the sample ma-
terial [6,14], and include both the absolute efficiency and the
phase of the scattering [3]. Nano-FTIR has, up to now, been
demonstrated with flat test samples only, consisting of metals,
semiconductors and polar crystals [3,4].
Hard biological tissues are highly textured composites of
submicrometric inorganic particles embedded in organic
matrices [15-17]. Major tissues of interest include the phos-
phatic (bone) family of materials, and the carbonatic family as
found, e.g., in mollusc shells. Within the phylum Brachiopoda,
both strategies of hybrid shell architecture have evolved:
Calcium carbonate crystals in an organic matrix [18-20], and
laminates of calcium phosphate nanoparticle reinforced chitin
fibers [21,22]. FTIR spectroscopic microscopy is a well-estab-
lished method and has been extensively used to study bone
biominerals at several micrometers spatial resolution [23-30].
Its strength in the study of bone biopsies, mineralized tendons,
dentin or ivory is mainly due to a broad absorption band
between 950 and 1150 cm−1 assigned to the ν3 vibration of the
PO43− ion of apatite. It is thus possible to acquire maps of
mineral concentration, and to relate mineral to protein
(collagen) or carbonate distributions, usually revealing consid-
erable spatial variation. Moreover, the apatite band exhibits a
Figure 1: Nano-FTIR basic interaction. Focused infrared light incidentfrom the upper left excites a nanofocus at the metal tip, symbolized asa star, which interacts with the scanning sample. The backscatteredinfrared light carries local information. Here, the infrared response(color code as in Figure 2b) is overlaid on a pseudo-3D rendering ofthe topography, which is simultaneously recorded, of a 1.4 × 1.6 µm2
zoom area designated in Figure 2b by the dashed box on the left.Topographic height differences ca. 50 nm.
weak spectral substructure, evident from Fourier self-deconvo-
lution [1]. It reveals relative weights of apatite species that are
assigned, with the help of chemical and X-ray analyses, to
Mg2+, F− or CO32− substitution, or differing particle size, or
crystal imperfections [24,31,32]. In this study we demonstrate
the power of nano-FTIR to map naturally formed mineralized
nanostructures. We show that we obtain fingerprint information
on two example systems of biominerals. Experimental compari-
son is made with electron microscopy (SEM) to verify that
nano-FTIR perfectly matches what is already known about the
structures, and that the method indeed provides rich chemical
and structural contrasts at the 20 nm scale.
ResultsMarine shell as an example of a carbonate-forming organismWe demonstrate nano-FTIR near-field microscopy on a Mytilus
edulis (M. edulis) shell specimen, which exhibits easily resolv-
able fibrous biocalcite microcrystals and tablet-shaped bioarag-
onite nanocrystals. On a polished section, the expected charac-
teristic interface [33] between an outer calcite layer and an inner
aragonite layer is readily located with the help of an overview
microscope (0.7 µm resolution) built into the commercial
s-SNOM used (neaspec.com). On the inner side there is an
interlayer, ca. 2 µm wide, with modified bioaragonite crystals
[34]. Three adjoining s-SNOM images of 10 × 10 µm2 area
each were consecutively acquired and stitched together. The
topography (Figure 2a) exhibits the arrangement of (i) fiber-
Beilstein J. Nanotechnol. 2012, 3, 312–323.
314
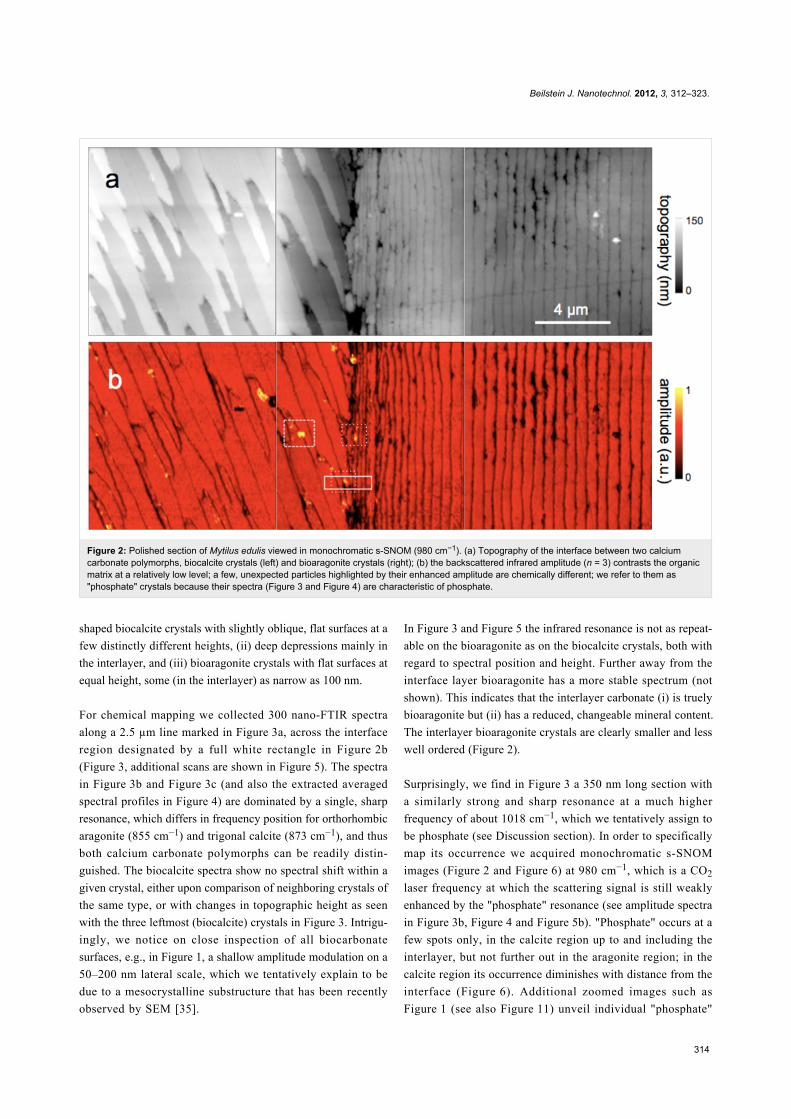
Figure 2: Polished section of Mytilus edulis viewed in monochromatic s-SNOM (980 cm−1). (a) Topography of the interface between two calciumcarbonate polymorphs, biocalcite crystals (left) and bioaragonite crystals (right); (b) the backscattered infrared amplitude (n = 3) contrasts the organicmatrix at a relatively low level; a few, unexpected particles highlighted by their enhanced amplitude are chemically different; we refer to them as"phosphate" crystals because their spectra (Figure 3 and Figure 4) are characteristic of phosphate.
shaped biocalcite crystals with slightly oblique, flat surfaces at a
few distinctly different heights, (ii) deep depressions mainly in
the interlayer, and (iii) bioaragonite crystals with flat surfaces at
equal height, some (in the interlayer) as narrow as 100 nm.
For chemical mapping we collected 300 nano-FTIR spectra
along a 2.5 µm line marked in Figure 3a, across the interface
region designated by a full white rectangle in Figure 2b
(Figure 3, additional scans are shown in Figure 5). The spectra
in Figure 3b and Figure 3c (and also the extracted averaged
spectral profiles in Figure 4) are dominated by a single, sharp
resonance, which differs in frequency position for orthorhombic
aragonite (855 cm−1) and trigonal calcite (873 cm−1), and thus
both calcium carbonate polymorphs can be readily distin-
guished. The biocalcite spectra show no spectral shift within a
given crystal, either upon comparison of neighboring crystals of
the same type, or with changes in topographic height as seen
with the three leftmost (biocalcite) crystals in Figure 3. Intrigu-
ingly, we notice on close inspection of all biocarbonate
surfaces, e.g., in Figure 1, a shallow amplitude modulation on a
50–200 nm lateral scale, which we tentatively explain to be
due to a mesocrystalline substructure that has been recently
observed by SEM [35].
In Figure 3 and Figure 5 the infrared resonance is not as repeat-
able on the bioaragonite as on the biocalcite crystals, both with
regard to spectral position and height. Further away from the
interface layer bioaragonite has a more stable spectrum (not
shown). This indicates that the interlayer carbonate (i) is truely
bioaragonite but (ii) has a reduced, changeable mineral content.
The interlayer bioaragonite crystals are clearly smaller and less
well ordered (Figure 2).
Surprisingly, we find in Figure 3 a 350 nm long section with
a similarly strong and sharp resonance at a much higher
frequency of about 1018 cm−1, which we tentatively assign to
be phosphate (see Discussion section). In order to specifically
map its occurrence we acquired monochromatic s-SNOM
images (Figure 2 and Figure 6) at 980 cm−1, which is a CO2
laser frequency at which the scattering signal is still weakly
enhanced by the "phosphate" resonance (see amplitude spectra
in Figure 3b, Figure 4 and Figure 5b). "Phosphate" occurs at a
few spots only, in the calcite region up to and including the
interlayer, but not further out in the aragonite region; in the
calcite region its occurrence diminishes with distance from the
interface (Figure 6). Additional zoomed images such as
Figure 1 (see also Figure 11) unveil individual "phosphate"
Beilstein J. Nanotechnol. 2012, 3, 312–323.
315
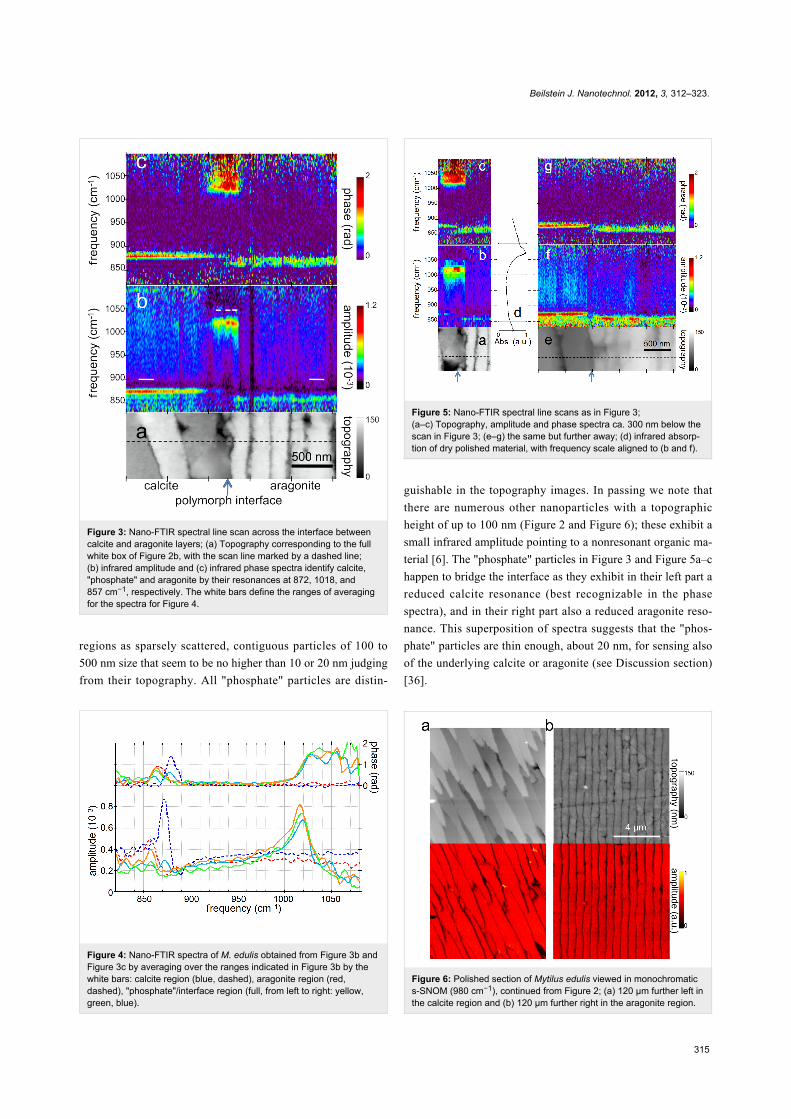
Figure 3: Nano-FTIR spectral line scan across the interface betweencalcite and aragonite layers; (a) Topography corresponding to the fullwhite box of Figure 2b, with the scan line marked by a dashed line;(b) infrared amplitude and (c) infrared phase spectra identify calcite,"phosphate" and aragonite by their resonances at 872, 1018, and857 cm−1, respectively. The white bars define the ranges of averagingfor the spectra for Figure 4.
Figure 4: Nano-FTIR spectra of M. edulis obtained from Figure 3b andFigure 3c by averaging over the ranges indicated in Figure 3b by thewhite bars: calcite region (blue, dashed), aragonite region (red,dashed), "phosphate"/interface region (full, from left to right: yellow,green, blue).
regions as sparsely scattered, contiguous particles of 100 to
500 nm size that seem to be no higher than 10 or 20 nm judging
from their topography. All "phosphate" particles are distin-
Figure 5: Nano-FTIR spectral line scans as in Figure 3;(a–c) Topography, amplitude and phase spectra ca. 300 nm below thescan in Figure 3; (e–g) the same but further away; (d) infrared absorp-tion of dry polished material, with frequency scale aligned to (b and f).
Figure 6: Polished section of Mytilus edulis viewed in monochromatics-SNOM (980 cm−1), continued from Figure 2; (a) 120 µm further left inthe calcite region and (b) 120 µm further right in the aragonite region.
guishable in the topography images. In passing we note that
there are numerous other nanoparticles with a topographic
height of up to 100 nm (Figure 2 and Figure 6); these exhibit a
small infrared amplitude pointing to a nonresonant organic ma-
terial [6]. The "phosphate" particles in Figure 3 and Figure 5a–c
happen to bridge the interface as they exhibit in their left part a
reduced calcite resonance (best recognizable in the phase
spectra), and in their right part also a reduced aragonite reso-
nance. This superposition of spectra suggests that the "phos-
phate" particles are thin enough, about 20 nm, for sensing also
of the underlying calcite or aragonite (see Discussion section)
[36].
Beilstein J. Nanotechnol. 2012, 3, 312–323.
316
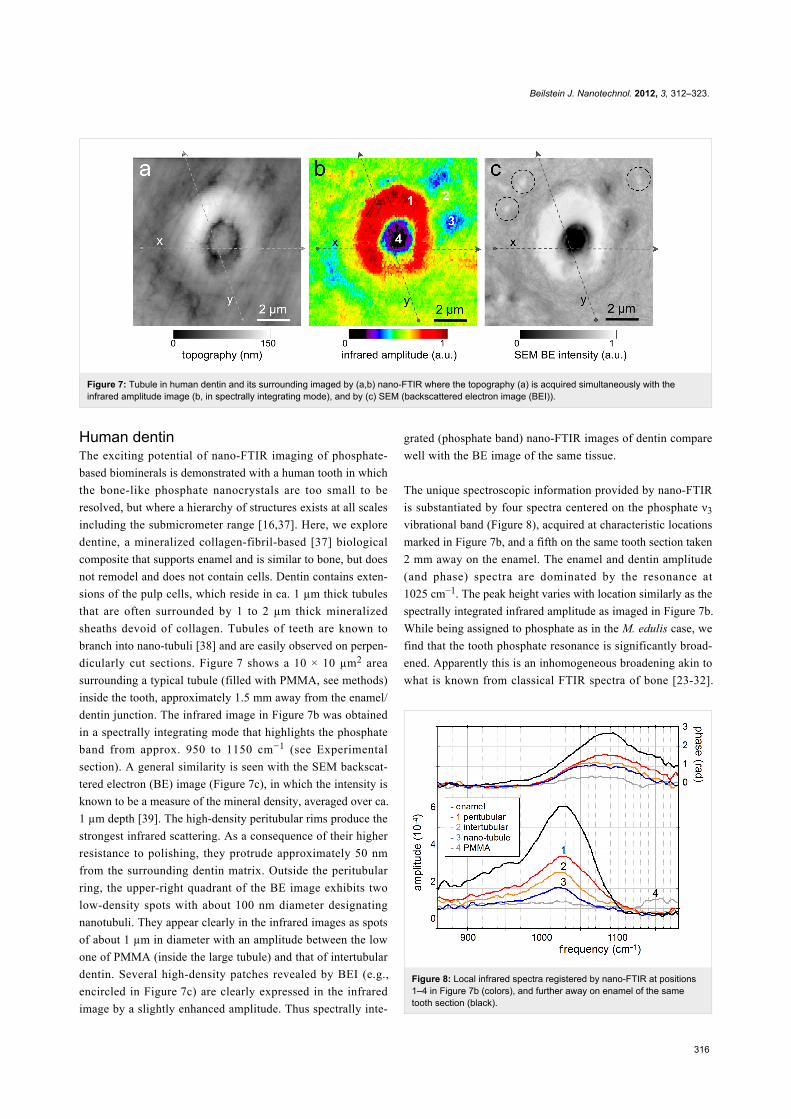
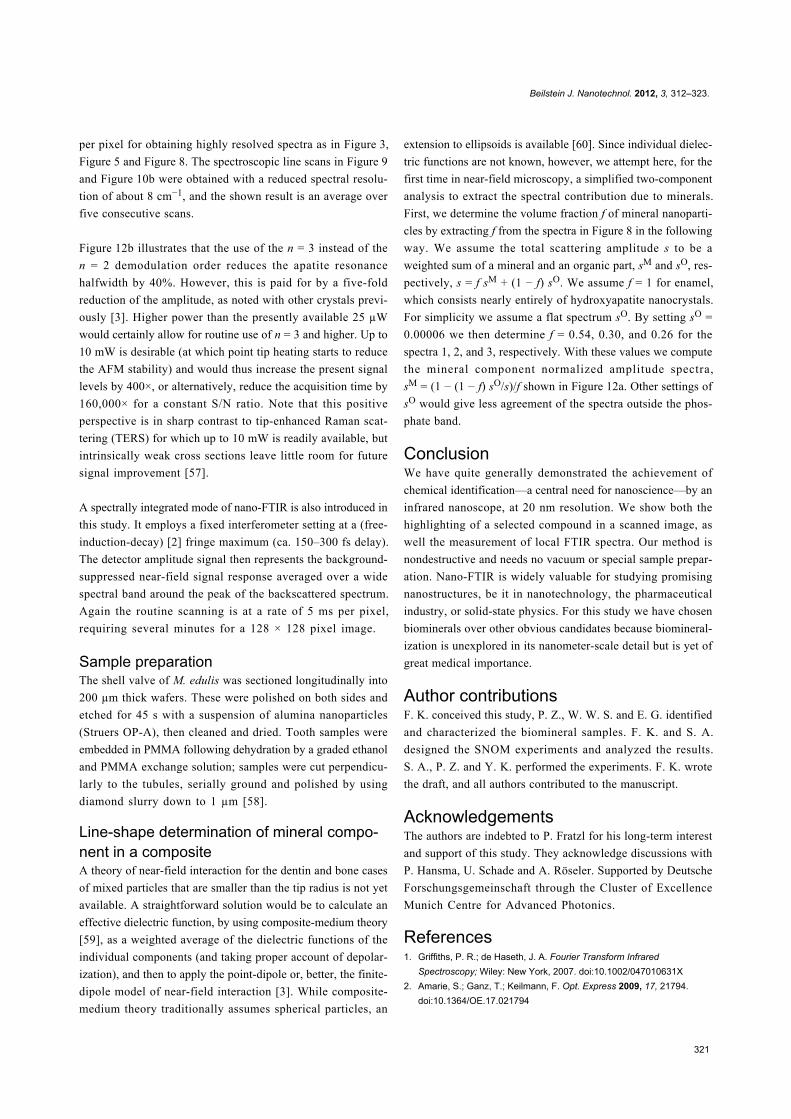
Figure 7: Tubule in human dentin and its surrounding imaged by (a,b) nano-FTIR where the topography (a) is acquired simultaneously with theinfrared amplitude image (b, in spectrally integrating mode), and by (c) SEM (backscattered electron image (BEI)).
Human dentinThe exciting potential of nano-FTIR imaging of phosphate-
based biominerals is demonstrated with a human tooth in which
the bone-like phosphate nanocrystals are too small to be
resolved, but where a hierarchy of structures exists at all scales
including the submicrometer range [16,37]. Here, we explore
dentine, a mineralized collagen-fibril-based [37] biological
composite that supports enamel and is similar to bone, but does
not remodel and does not contain cells. Dentin contains exten-
sions of the pulp cells, which reside in ca. 1 µm thick tubules
that are often surrounded by 1 to 2 µm thick mineralized
sheaths devoid of collagen. Tubules of teeth are known to
branch into nano-tubuli [38] and are easily observed on perpen-
dicularly cut sections. Figure 7 shows a 10 × 10 µm2 area
surrounding a typical tubule (filled with PMMA, see methods)
inside the tooth, approximately 1.5 mm away from the enamel/
dentin junction. The infrared image in Figure 7b was obtained
in a spectrally integrating mode that highlights the phosphate
band from approx. 950 to 1150 cm−1 (see Experimental
section). A general similarity is seen with the SEM backscat-
tered electron (BE) image (Figure 7c), in which the intensity is
known to be a measure of the mineral density, averaged over ca.
1 µm depth [39]. The high-density peritubular rims produce the
strongest infrared scattering. As a consequence of their higher
resistance to polishing, they protrude approximately 50 nm
from the surrounding dentin matrix. Outside the peritubular
ring, the upper-right quadrant of the BE image exhibits two
low-density spots with about 100 nm diameter designating
nanotubuli. They appear clearly in the infrared images as spots
of about 1 µm in diameter with an amplitude between the low
one of PMMA (inside the large tubule) and that of intertubular
dentin. Several high-density patches revealed by BEI (e.g.,
encircled in Figure 7c) are clearly expressed in the infrared
image by a slightly enhanced amplitude. Thus spectrally inte-
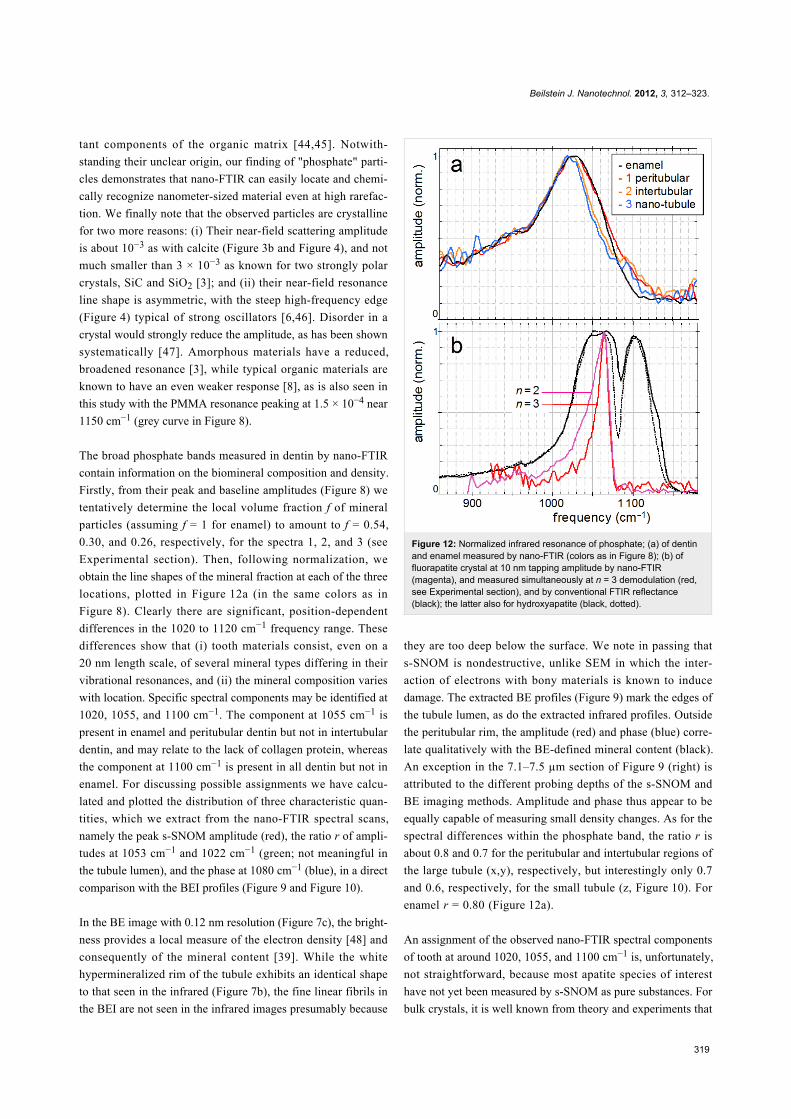
Figure 8: Local infrared spectra registered by nano-FTIR at positions1–4 in Figure 7b (colors), and further away on enamel of the sametooth section (black).
grated (phosphate band) nano-FTIR images of dentin compare
well with the BE image of the same tissue.
The unique spectroscopic information provided by nano-FTIR
is substantiated by four spectra centered on the phosphate ν3
vibrational band (Figure 8), acquired at characteristic locations
marked in Figure 7b, and a fifth on the same tooth section taken
2 mm away on the enamel. The enamel and dentin amplitude
(and phase) spectra are dominated by the resonance at
1025 cm−1. The peak height varies with location similarly as the
spectrally integrated infrared amplitude as imaged in Figure 7b.
While being assigned to phosphate as in the M. edulis case, we
find that the tooth phosphate resonance is significantly broad-
ened. Apparently this is an inhomogeneous broadening akin to
what is known from classical FTIR spectra of bone [23-32].
Beilstein J. Nanotechnol. 2012, 3, 312–323.
317
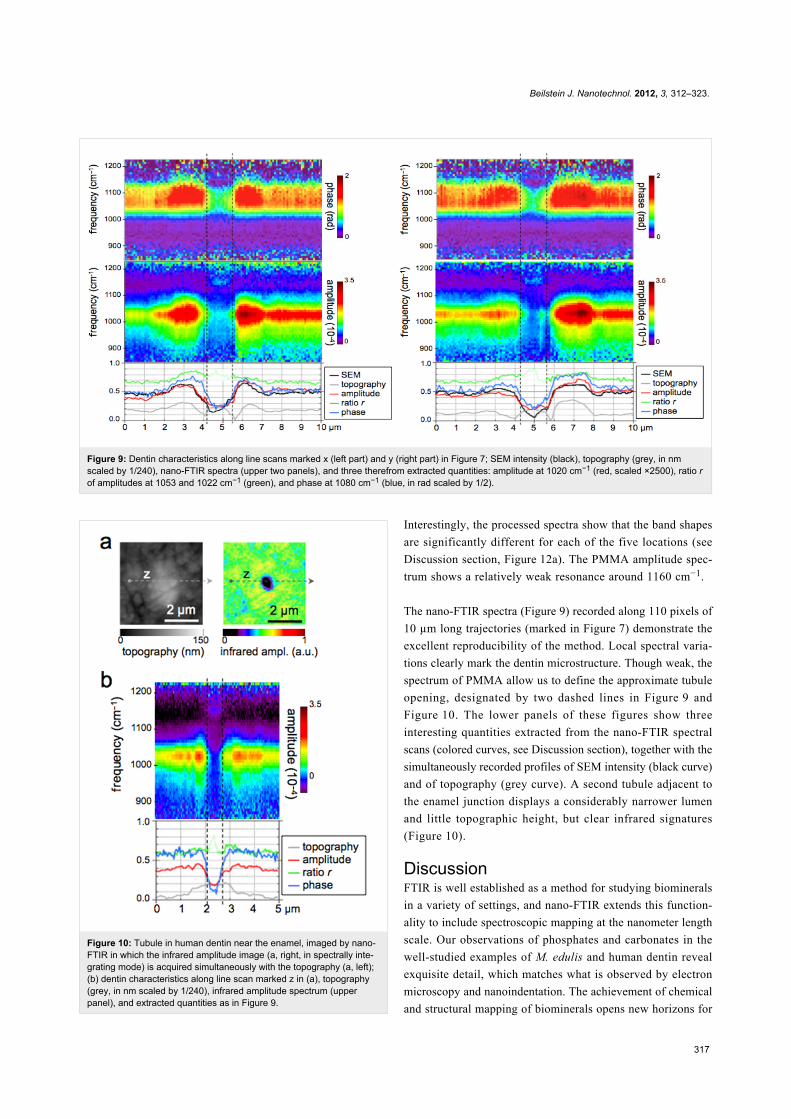
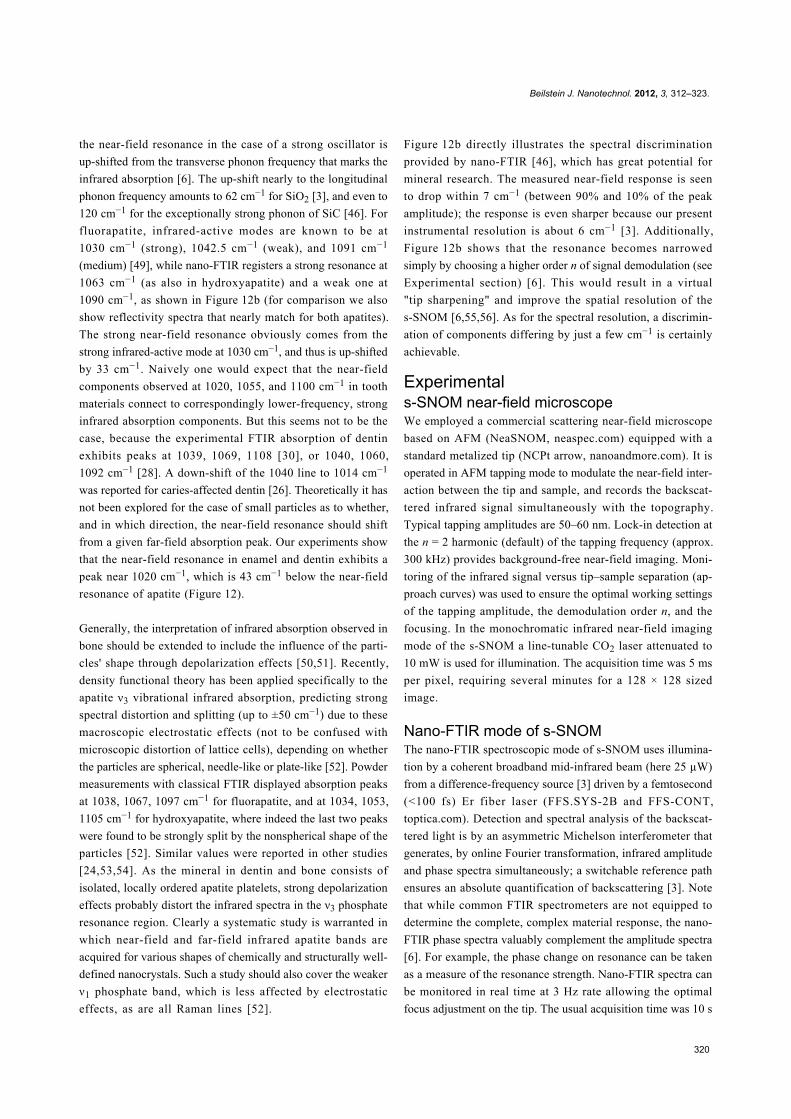
Figure 9: Dentin characteristics along line scans marked x (left part) and y (right part) in Figure 7; SEM intensity (black), topography (grey, in nmscaled by 1/240), nano-FTIR spectra (upper two panels), and three therefrom extracted quantities: amplitude at 1020 cm−1 (red, scaled ×2500), ratio rof amplitudes at 1053 and 1022 cm−1 (green), and phase at 1080 cm−1 (blue, in rad scaled by 1/2).
Figure 10: Tubule in human dentin near the enamel, imaged by nano-FTIR in which the infrared amplitude image (a, right, in spectrally inte-grating mode) is acquired simultaneously with the topography (a, left);(b) dentin characteristics along line scan marked z in (a), topography(grey, in nm scaled by 1/240), infrared amplitude spectrum (upperpanel), and extracted quantities as in Figure 9.
Interestingly, the processed spectra show that the band shapes
are significantly different for each of the five locations (see
Discussion section, Figure 12a). The PMMA amplitude spec-
trum shows a relatively weak resonance around 1160 cm−1.
The nano-FTIR spectra (Figure 9) recorded along 110 pixels of
10 µm long trajectories (marked in Figure 7) demonstrate the
excellent reproducibility of the method. Local spectral varia-
tions clearly mark the dentin microstructure. Though weak, the
spectrum of PMMA allow us to define the approximate tubule
opening, designated by two dashed lines in Figure 9 and
Figure 10. The lower panels of these figures show three
interesting quantities extracted from the nano-FTIR spectral
scans (colored curves, see Discussion section), together with the
simultaneously recorded profiles of SEM intensity (black curve)
and of topography (grey curve). A second tubule adjacent to
the enamel junction displays a considerably narrower lumen
and little topographic height, but clear infrared signatures
(Figure 10).
DiscussionFTIR is well established as a method for studying biominerals
in a variety of settings, and nano-FTIR extends this function-
ality to include spectroscopic mapping at the nanometer length
scale. Our observations of phosphates and carbonates in the
well-studied examples of M. edulis and human dentin reveal
exquisite detail, which matches what is observed by electron
microscopy and nanoindentation. The achievement of chemical
and structural mapping of biominerals opens new horizons for
Beilstein J. Nanotechnol. 2012, 3, 312–323.
318
our understanding of mineral arrangements and variability in
biological systems. Intricate carbonate-based natural skeletons,
that may include transient and stabilized amorphous phases, can
now be mapped within and across interfaces by a noncontact
and nondestructive imaging technique. With respect to apatite
studies, our method is directly applicable to the investigation of
healthy and diseased forms of vertebrate bones and teeth.
Mineral precipitation, aggregation and aging can now be
analyzed and quantified in submicrometer detail, to better
understand the biological processes of bone formation,
abnormal development, and healing in response to drug treat-
ment.
Several technical advantages of surface scanning make the
nano-FTIR approach extremely robust and useful for the study
of biological materials. The samples need not be thin, only
reasonably flat, thus avoiding thin-section preparations, which
are prone to damage. Unavoidable topographic obstacles
resulting from the cutting and polishing procedures are of little
consequence: Height variations of 100 nm do not change the
off-resonant infrared amplitude (Figure 2) nor the resonant
response in amplitude and phase, as demonstrated for example
by the repeatability of the carbonate resonance spectra within
the sample region containing biocalcite (Figure 3). At steep
topographic edges though, the s-SNOM amplitude is known to
be reduced over a width equal to the spatial resolution, resulting
in "edge darkening" [6]. This effect probably contributes to the
dark regions seen between calcite crystals in Figure 2b and
remains to be further investigated. The impressive spatial reso-
lution of nano-FTIR can be judged from the edges of the biocal-
cite crystals (Figure 3a) that demonstrate a mechanical (AFM)
resolution certainly below 30 nm. Abrupt edges of the nano-
FTIR line section showing the phosphate resonance
(Figure 3b,c and Figure 5b,c) prove that the infrared resolution
is better than 20 nm.
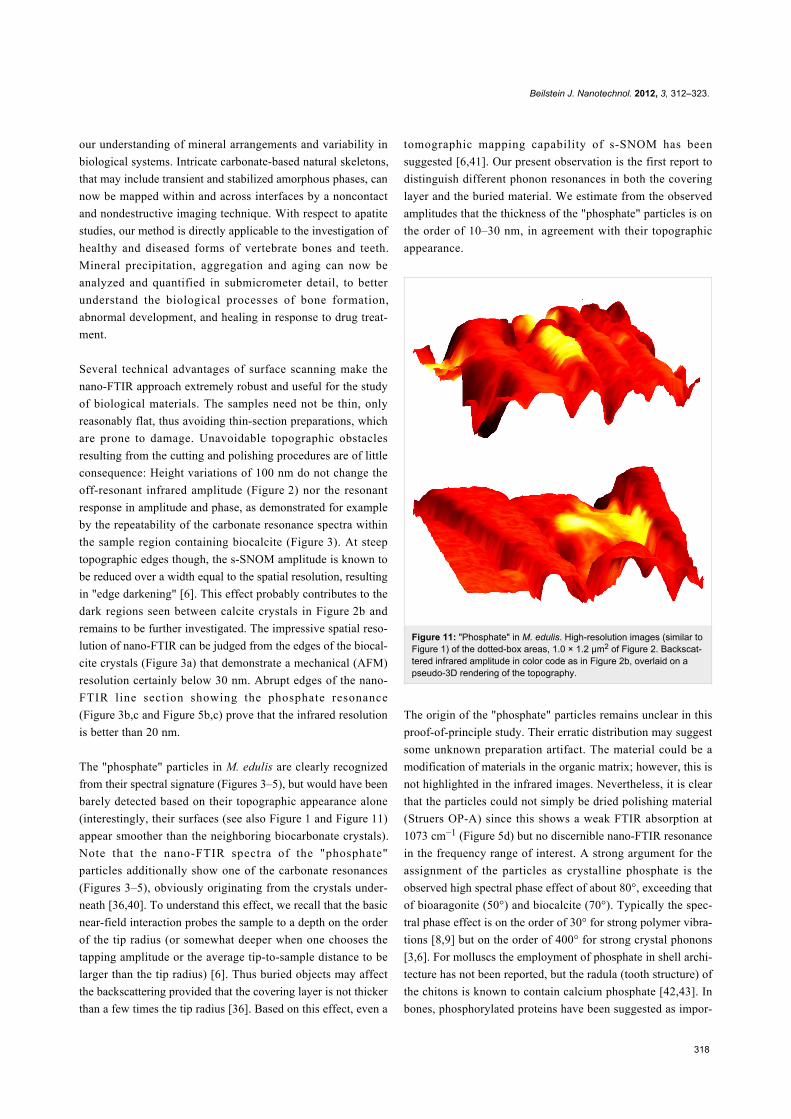
The "phosphate" particles in M. edulis are clearly recognized
from their spectral signature (Figures 3–5), but would have been
barely detected based on their topographic appearance alone
(interestingly, their surfaces (see also Figure 1 and Figure 11)
appear smoother than the neighboring biocarbonate crystals).
Note that the nano-FTIR spectra of the "phosphate"
particles additionally show one of the carbonate resonances
(Figures 3–5), obviously originating from the crystals under-
neath [36,40]. To understand this effect, we recall that the basic
near-field interaction probes the sample to a depth on the order
of the tip radius (or somewhat deeper when one chooses the
tapping amplitude or the average tip-to-sample distance to be
larger than the tip radius) [6]. Thus buried objects may affect
the backscattering provided that the covering layer is not thicker
than a few times the tip radius [36]. Based on this effect, even a
tomographic mapping capability of s-SNOM has been
suggested [6,41]. Our present observation is the first report to
distinguish different phonon resonances in both the covering
layer and the buried material. We estimate from the observed
amplitudes that the thickness of the "phosphate" particles is on
the order of 10–30 nm, in agreement with their topographic
appearance.
Figure 11: "Phosphate" in M. edulis. High-resolution images (similar toFigure 1) of the dotted-box areas, 1.0 × 1.2 µm2 of Figure 2. Backscat-tered infrared amplitude in color code as in Figure 2b, overlaid on apseudo-3D rendering of the topography.
The origin of the "phosphate" particles remains unclear in this
proof-of-principle study. Their erratic distribution may suggest
some unknown preparation artifact. The material could be a
modification of materials in the organic matrix; however, this is
not highlighted in the infrared images. Nevertheless, it is clear
that the particles could not simply be dried polishing material
(Struers OP-A) since this shows a weak FTIR absorption at
1073 cm−1 (Figure 5d) but no discernible nano-FTIR resonance
in the frequency range of interest. A strong argument for the
assignment of the particles as crystalline phosphate is the
observed high spectral phase effect of about 80°, exceeding that
of bioaragonite (50°) and biocalcite (70°). Typically the spec-
tral phase effect is on the order of 30° for strong polymer vibra-
tions [8,9] but on the order of 400° for strong crystal phonons
[3,6]. For molluscs the employment of phosphate in shell archi-
tecture has not been reported, but the radula (tooth structure) of
the chitons is known to contain calcium phosphate [42,43]. In
bones, phosphorylated proteins have been suggested as impor-
Beilstein J. Nanotechnol. 2012, 3, 312–323.
319
tant components of the organic matrix [44,45]. Notwith-
standing their unclear origin, our finding of "phosphate" parti-
cles demonstrates that nano-FTIR can easily locate and chemi-
cally recognize nanometer-sized material even at high rarefac-
tion. We finally note that the observed particles are crystalline
for two more reasons: (i) Their near-field scattering amplitude
is about 10−3 as with calcite (Figure 3b and Figure 4), and not
much smaller than 3 × 10⁻³ as known for two strongly polar
crystals, SiC and SiO2 [3]; and (ii) their near-field resonance
line shape is asymmetric, with the steep high-frequency edge
(Figure 4) typical of strong oscillators [6,46]. Disorder in a
crystal would strongly reduce the amplitude, as has been shown
systematically [47]. Amorphous materials have a reduced,
broadened resonance [3], while typical organic materials are
known to have an even weaker response [8], as is also seen in
this study with the PMMA resonance peaking at 1.5 × 10⁻⁴ near
1150 cm−1 (grey curve in Figure 8).
The broad phosphate bands measured in dentin by nano-FTIR
contain information on the biomineral composition and density.
Firstly, from their peak and baseline amplitudes (Figure 8) we
tentatively determine the local volume fraction f of mineral
particles (assuming f = 1 for enamel) to amount to f = 0.54,
0.30, and 0.26, respectively, for the spectra 1, 2, and 3 (see
Experimental section). Then, following normalization, we
obtain the line shapes of the mineral fraction at each of the three
locations, plotted in Figure 12a (in the same colors as in
Figure 8). Clearly there are significant, position-dependent
differences in the 1020 to 1120 cm−1 frequency range. These
differences show that (i) tooth materials consist, even on a
20 nm length scale, of several mineral types differing in their
vibrational resonances, and (ii) the mineral composition varies
with location. Specific spectral components may be identified at
1020, 1055, and 1100 cm−1. The component at 1055 cm−1 is
present in enamel and peritubular dentin but not in intertubular
dentin, and may relate to the lack of collagen protein, whereas
the component at 1100 cm−1 is present in all dentin but not in
enamel. For discussing possible assignments we have calcu-
lated and plotted the distribution of three characteristic quan-
tities, which we extract from the nano-FTIR spectral scans,
namely the peak s-SNOM amplitude (red), the ratio r of ampli-
tudes at 1053 cm−1 and 1022 cm−1 (green; not meaningful in
the tubule lumen), and the phase at 1080 cm−1 (blue), in a direct
comparison with the BEI profiles (Figure 9 and Figure 10).
In the BE image with 0.12 nm resolution (Figure 7c), the bright-
ness provides a local measure of the electron density [48] and
consequently of the mineral content [39]. While the white
hypermineralized rim of the tubule exhibits an identical shape
to that seen in the infrared (Figure 7b), the fine linear fibrils in
the BEI are not seen in the infrared images presumably because
Figure 12: Normalized infrared resonance of phosphate; (a) of dentinand enamel measured by nano-FTIR (colors as in Figure 8); (b) offluorapatite crystal at 10 nm tapping amplitude by nano-FTIR(magenta), and measured simultaneously at n = 3 demodulation (red,see Experimental section), and by conventional FTIR reflectance(black); the latter also for hydroxyapatite (black, dotted).
they are too deep below the surface. We note in passing that
s-SNOM is nondestructive, unlike SEM in which the inter-
action of electrons with bony materials is known to induce
damage. The extracted BE profiles (Figure 9) mark the edges of
the tubule lumen, as do the extracted infrared profiles. Outside
the peritubular rim, the amplitude (red) and phase (blue) corre-
late qualitatively with the BE-defined mineral content (black).
An exception in the 7.1–7.5 µm section of Figure 9 (right) is
attributed to the different probing depths of the s-SNOM and
BE imaging methods. Amplitude and phase thus appear to be
equally capable of measuring small density changes. As for the
spectral differences within the phosphate band, the ratio r is
about 0.8 and 0.7 for the peritubular and intertubular regions of
the large tubule (x,y), respectively, but interestingly only 0.7
and 0.6, respectively, for the small tubule (z, Figure 10). For
enamel r = 0.80 (Figure 12a).
An assignment of the observed nano-FTIR spectral components
of tooth at around 1020, 1055, and 1100 cm−1 is, unfortunately,
not straightforward, because most apatite species of interest
have not yet been measured by s-SNOM as pure substances. For
bulk crystals, it is well known from theory and experiments that
Beilstein J. Nanotechnol. 2012, 3, 312–323.
320
the near-field resonance in the case of a strong oscillator is
up-shifted from the transverse phonon frequency that marks the
infrared absorption [6]. The up-shift nearly to the longitudinal
phonon frequency amounts to 62 cm−1 for SiO2 [3], and even to
120 cm−1 for the exceptionally strong phonon of SiC [46]. For
fluorapatite, infrared-active modes are known to be at
1030 cm−1 (strong), 1042.5 cm−1 (weak), and 1091 cm−1
(medium) [49], while nano-FTIR registers a strong resonance at
1063 cm−1 (as also in hydroxyapatite) and a weak one at
1090 cm−1, as shown in Figure 12b (for comparison we also
show reflectivity spectra that nearly match for both apatites).
The strong near-field resonance obviously comes from the
strong infrared-active mode at 1030 cm−1, and thus is up-shifted
by 33 cm−1. Naively one would expect that the near-field
components observed at 1020, 1055, and 1100 cm−1 in tooth
materials connect to correspondingly lower-frequency, strong
infrared absorption components. But this seems not to be the
case, because the experimental FTIR absorption of dentin
exhibits peaks at 1039, 1069, 1108 [30], or 1040, 1060,
1092 cm−1 [28]. A down-shift of the 1040 line to 1014 cm−1
was reported for caries-affected dentin [26]. Theoretically it has
not been explored for the case of small particles as to whether,
and in which direction, the near-field resonance should shift
from a given far-field absorption peak. Our experiments show
that the near-field resonance in enamel and dentin exhibits a
peak near 1020 cm−1, which is 43 cm−1 below the near-field
resonance of apatite (Figure 12).
Generally, the interpretation of infrared absorption observed in
bone should be extended to include the influence of the parti-
cles' shape through depolarization effects [50,51]. Recently,
density functional theory has been applied specifically to the
apatite ν3 vibrational infrared absorption, predicting strong
spectral distortion and splitting (up to ±50 cm−1) due to these
macroscopic electrostatic effects (not to be confused with
microscopic distortion of lattice cells), depending on whether
the particles are spherical, needle-like or plate-like [52]. Powder
measurements with classical FTIR displayed absorption peaks
at 1038, 1067, 1097 cm−1 for fluorapatite, and at 1034, 1053,
1105 cm−1 for hydroxyapatite, where indeed the last two peaks
were found to be strongly split by the nonspherical shape of the
particles [52]. Similar values were reported in other studies
[24,53,54]. As the mineral in dentin and bone consists of
isolated, locally ordered apatite platelets, strong depolarization
effects probably distort the infrared spectra in the ν3 phosphate
resonance region. Clearly a systematic study is warranted in
which near-field and far-field infrared apatite bands are
acquired for various shapes of chemically and structurally well-
defined nanocrystals. Such a study should also cover the weaker
ν1 phosphate band, which is less affected by electrostatic
effects, as are all Raman lines [52].
Figure 12b directly illustrates the spectral discrimination
provided by nano-FTIR [46], which has great potential for
mineral research. The measured near-field response is seen
to drop within 7 cm−1 (between 90% and 10% of the peak
amplitude); the response is even sharper because our present
instrumental resolution is about 6 cm−1 [3]. Additionally,
Figure 12b shows that the resonance becomes narrowed
simply by choosing a higher order n of signal demodulation (see
Experimental section) [6]. This would result in a virtual
"tip sharpening" and improve the spatial resolution of the
s-SNOM [6,55,56]. As for the spectral resolution, a discrimin-
ation of components differing by just a few cm−1 is certainly
achievable.
Experimentals-SNOM near-field microscopeWe employed a commercial scattering near-field microscope
based on AFM (NeaSNOM, neaspec.com) equipped with a
standard metalized tip (NCPt arrow, nanoandmore.com). It is
operated in AFM tapping mode to modulate the near-field inter-
action between the tip and sample, and records the backscat-
tered infrared signal simultaneously with the topography.
Typical tapping amplitudes are 50–60 nm. Lock-in detection at
the n = 2 harmonic (default) of the tapping frequency (approx.
300 kHz) provides background-free near-field imaging. Moni-
toring of the infrared signal versus tip–sample separation (ap-
proach curves) was used to ensure the optimal working settings
of the tapping amplitude, the demodulation order n, and the
focusing. In the monochromatic infrared near-field imaging
mode of the s-SNOM a line-tunable CO2 laser attenuated to
10 mW is used for illumination. The acquisition time was 5 ms
per pixel, requiring several minutes for a 128 × 128 sized
image.
Nano-FTIR mode of s-SNOMThe nano-FTIR spectroscopic mode of s-SNOM uses illumina-
tion by a coherent broadband mid-infrared beam (here 25 µW)
from a difference-frequency source [3] driven by a femtosecond
(<100 fs) Er fiber laser (FFS.SYS-2B and FFS-CONT,
toptica.com). Detection and spectral analysis of the backscat-
tered light is by an asymmetric Michelson interferometer that
generates, by online Fourier transformation, infrared amplitude
and phase spectra simultaneously; a switchable reference path
ensures an absolute quantification of backscattering [3]. Note
that while common FTIR spectrometers are not equipped to
determine the complete, complex material response, the nano-
FTIR phase spectra valuably complement the amplitude spectra
[6]. For example, the phase change on resonance can be taken
as a measure of the resonance strength. Nano-FTIR spectra can
be monitored in real time at 3 Hz rate allowing the optimal
focus adjustment on the tip. The usual acquisition time was 10 s
Beilstein J. Nanotechnol. 2012, 3, 312–323.
321
per pixel for obtaining highly resolved spectra as in Figure 3,
Figure 5 and Figure 8. The spectroscopic line scans in Figure 9
and Figure 10b were obtained with a reduced spectral resolu-
tion of about 8 cm−1, and the shown result is an average over
five consecutive scans.
Figure 12b illustrates that the use of the n = 3 instead of the
n = 2 demodulation order reduces the apatite resonance
halfwidth by 40%. However, this is paid for by a five-fold
reduction of the amplitude, as noted with other crystals previ-
ously [3]. Higher power than the presently available 25 µW
would certainly allow for routine use of n = 3 and higher. Up to
10 mW is desirable (at which point tip heating starts to reduce
the AFM stability) and would thus increase the present signal
levels by 400×, or alternatively, reduce the acquisition time by
160,000× for a constant S/N ratio. Note that this positive
perspective is in sharp contrast to tip-enhanced Raman scat-
tering (TERS) for which up to 10 mW is readily available, but
intrinsically weak cross sections leave little room for future
signal improvement [57].
A spectrally integrated mode of nano-FTIR is also introduced in
this study. It employs a fixed interferometer setting at a (free-
induction-decay) [2] fringe maximum (ca. 150–300 fs delay).
The detector amplitude signal then represents the background-
suppressed near-field signal response averaged over a wide
spectral band around the peak of the backscattered spectrum.
Again the routine scanning is at a rate of 5 ms per pixel,
requiring several minutes for a 128 × 128 pixel image.
Sample preparationThe shell valve of M. edulis was sectioned longitudinally into
200 µm thick wafers. These were polished on both sides and
etched for 45 s with a suspension of alumina nanoparticles
(Struers OP-A), then cleaned and dried. Tooth samples were
embedded in PMMA following dehydration by a graded ethanol
and PMMA exchange solution; samples were cut perpendicu-
larly to the tubules, serially ground and polished by using
diamond slurry down to 1 µm [58].
Line-shape determination of mineral compo-nent in a compositeA theory of near-field interaction for the dentin and bone cases
of mixed particles that are smaller than the tip radius is not yet
available. A straightforward solution would be to calculate an
effective dielectric function, by using composite-medium theory
[59], as a weighted average of the dielectric functions of the
individual components (and taking proper account of depolar-
ization), and then to apply the point-dipole or, better, the finite-
dipole model of near-field interaction [3]. While composite-
medium theory traditionally assumes spherical particles, an
extension to ellipsoids is available [60]. Since individual dielec-
tric functions are not known, however, we attempt here, for the
first time in near-field microscopy, a simplified two-component
analysis to extract the spectral contribution due to minerals.
First, we determine the volume fraction f of mineral nanoparti-
cles by extracting f from the spectra in Figure 8 in the following
way. We assume the total scattering amplitude s to be a
weighted sum of a mineral and an organic part, sM and sO, res-
pectively, s = f sM + (1 − f) sO. We assume f = 1 for enamel,
which consists nearly entirely of hydroxyapatite nanocrystals.
For simplicity we assume a flat spectrum sO. By setting sO =
0.00006 we then determine f = 0.54, 0.30, and 0.26 for the
spectra 1, 2, and 3, respectively. With these values we compute
the mineral component normalized amplitude spectra,
sM = (1 − (1 − f) sO/s)/f shown in Figure 12a. Other settings of
sO would give less agreement of the spectra outside the phos-
phate band.
ConclusionWe have quite generally demonstrated the achievement of
chemical identification—a central need for nanoscience—by an
infrared nanoscope, at 20 nm resolution. We show both the
highlighting of a selected compound in a scanned image, as
well the measurement of local FTIR spectra. Our method is
nondestructive and needs no vacuum or special sample prepar-
ation. Nano-FTIR is widely valuable for studying promising
nanostructures, be it in nanotechnology, the pharmaceutical
industry, or solid-state physics. For this study we have chosen
biominerals over other obvious candidates because biomineral-
ization is unexplored in its nanometer-scale detail but is yet of
great medical importance.
Author contributionsF. K. conceived this study, P. Z., W. W. S. and E. G. identified
and characterized the biomineral samples. F. K. and S. A.
designed the SNOM experiments and analyzed the results.
S. A., P. Z. and Y. K. performed the experiments. F. K. wrote
the draft, and all authors contributed to the manuscript.
AcknowledgementsThe authors are indebted to P. Fratzl for his long-term interest
and support of this study. They acknowledge discussions with
P. Hansma, U. Schade and A. Röseler. Supported by Deutsche
Forschungsgemeinschaft through the Cluster of Excellence
Munich Centre for Advanced Photonics.
References1. Griffiths, P. R.; de Haseth, J. A. Fourier Transform Infrared
Spectroscopy; Wiley: New York, 2007. doi:10.1002/047010631X2. Amarie, S.; Ganz, T.; Keilmann, F. Opt. Express 2009, 17, 21794.
doi:10.1364/OE.17.021794
Beilstein J. Nanotechnol. 2012, 3, 312–323.
322
3. Amarie, S.; Keilmann, F. Phys. Rev. B 2011, 83, 45404.doi:10.1103/PhysRevB.83.045404
4. Huth, F.; Schnell, M.; Wittborn, J.; Ocelic, N.; Hillenbrand, R.Nat. Mater. 2011, 10, 352. doi:10.1038/nmat3006
5. Knoll, B.; Keilmann, F. Nature 1999, 399, 134. doi:10.1038/201546. Keilmann, F.; Hillenbrand, R. In Nano-Optics and Near-Field Optical
Microscopy; Richards, D.; Zayats, A., Eds.; Artech House: Boston,London, 2009.
7. Cvitkovic, A.; Ocelic, N.; Hillenbrand, R. Nano Lett. 2007, 7, 3177.doi:10.1021/nl071775+
8. Taubner, T.; Hillenbrand, R.; Keilmann, F. Appl. Phys. Lett. 2004, 85,5064. doi:10.1063/1.1827334
9. Brehm, M.; Taubner, T.; Hillenbrand, R.; Keilmann, F. Nano Lett. 2006,6, 1307. doi:10.1021/nl0610836
10. Kim, Z. H.; Liu, B.; Leone, S. R. J. Phys. Chem. B 2005, 109, 8503.doi:10.1021/jp047425i
11. Huber, A. J.; Keilmann, F.; Wittborn, J.; Aizpurua, J.; Hillenbrand, R.Nano Lett. 2008, 8, 3766. doi:10.1021/nl802086x
12. Qazilbash, M. M.; Brehm, M.; Chae, B.-G.; Ho, P.-C.; Andreev, G. O.;Kim, B.-J.; Yun, S. J.; Balatsky, A. V.; Maple, M. B.; Keilmann, F.;Kim, H.-T.; Basov, D. N. Science 2007, 318, 1750.doi:10.1126/science.1150124
13. Hillenbrand, R.; Keilmann, F. Appl. Phys. Lett. 2002, 80, 25.doi:10.1063/1.1428767
14. Hillenbrand, R.; Keilmann, F. Phys. Rev. Lett. 2000, 85, 3029.doi:10.1103/PhysRevLett.85.3029
15. Lowenstam, H. A. Science 1981, 211, 1126.doi:10.1126/science.7008198
16. Weiner, S.; Wagner, H. D. Annu. Rev. Mater. Sci. 1998, 28, 271.doi:10.1146/annurev.matsci.28.1.271
17. Meldrum, F. C.; Cölfen, H. Chem. Rev. 2008, 108, 4332.doi:10.1021/cr8002856
18. Schmahl, W. W.; Griesshaber, E.; Neuser, R.; Lenze, A.; Job, R.;Brand, U. Eur. J. Mineral. 2004, 16, 693.doi:10.1127/0935-1221/2004/0016-0693
19. Griesshaber, E.; Schmahl, W. W.; Neuser, R.; Pettke, T.; Blüm, M.;Mutterlose, J.; Brand, U. Am. Mineral. 2007, 92, 722.doi:10.2138/am.2007.2220
20. Goetz, A. J.; Steinmetz, D. R.; Griesshaber, E.; Zaeffere, S.;Raabe, D.; Kelm, K.; Irsen, S.; Sehrbock, A.; Schmahl, W. W.Acta Biomater. 2011, 7, 2237. doi:10.1016/j.actbio.2011.01.035
21. Merkel, C.; Griesshaber, E.; Kelm, K.; Neuser, R.; Jordan, G.;Logan, A.; Mader, W.; Schmahl, W. W. J. Geophys. Res. 2007, 112,G02008. doi:10.1029/2006JG000253
22. Schmahl, W. W.; Griesshaber, E.; Merkel, C.; Kelm, K.; Deuschle, J.;Neuser, R. D.; Göetz, A. J.; Sehrbrock, A.; Mader, W. Mineral. Mag.2008, 72, 541. doi:10.1180/minmag.2008.072.2.541
23. Rey, C.; Shimizu, M.; Collins, B.; Glimcher, M. J. Calcif. Tissue Int.1991, 49, 383. doi:10.1007/BF02555847
24. Pleshko, N.; Boskey, A.; Mendelsohn, R. Biophys. J. 1991, 60, 786.doi:10.1016/S0006-3495(91)82113-0
25. Carden, A.; Morris, M. D. J. Biomed. Opt. 2000, 5, 259.doi:10.1117/1.429994
26. Spencer, P.; Wang, Y.; Katz, J. L.; Misra, A. J. Biomed. Opt. 2005, 10,031104. doi:10.1117/1.1914844
27. Boskey, A.; Mendelsohn, R. J. Biomed. Opt. 2005, 10, 031102.doi:10.1117/1.1922927
28. Abraham, J. A.; Sánchez, H. J.; Marceli, C. A.; Grenón, M.;Guidi, M. C.; Piccinini, M. Anal. Bioanal. Chem. 2011, 399, 1699.doi:10.1007/s00216-010-4430-0
29. Paschalis, E. P.; Mendelsohn, R.; Boskey, A. L.Clin. Orthop. Relat. Res. 2011, 469, 2170.doi:10.1007/s11999-010-1751-4
30. Tesch, W.; Eidelman, N.; Roschger, P.; Goldenberg, F.; Klaushofer, K.;Fratzl, P. Calcif. Tissue Int. 2001, 69, 147.doi:10.1007/s00223-001-2012-z
31. Paschalis, E. P.; DiCarlo, E.; Betts, F.; Sherman, P.; Mendelsohn, R.;Boskey, A. L. Calcif. Tissue Int. 1996, 59, 480.doi:10.1007/BF00369214
32. Gourion-Arsiquaud, S.; Faibish, D.; Myers, E.; Spevak, L.;Compston, J.; Hodsman, A.; Shane, E.; Recker, R. R.; Boskey, E. R.;Boskey, A. L. J. Bone Miner. Res. 2009, 24, 1565.doi:10.1359/jbmr.090414
33. Dalbeck, P.; England, J.; Cusack, M.; Lee, M. R.; Fallick, A. E.Eur. J. Mineral. 2006, 18, 601. doi:10.1127/0935-1221/2006/0018-0601
34. Feng, Q. L.; Li, H. B.; Pu, G.; Zhang, D. M.; Cui, F. Z.; Li, H. D.;Kim, T. N. J. Mater. Sci. 2000, 35, 3337.doi:10.1023/A:1004843900161
35. Griesshaber, E.; Kelm, K.; Jordan, G.; Xu, D.; Schmahl, W. W. Inpreparation.
36. Taubner, T.; Keilmann, F.; Hillenbrand, R. Opt. Express 2005, 13,8893. doi:10.1364/OPEX.13.008893
37. Zaslansky, P. In Collagen: Structure and Mechanics; Fratzl, P., Ed.;Springer: Berlin, Heidelberg, 2008.
38. Mjör, I. A.; Nordahl, I. Arch. Oral Biol. 1996, 41, 401.doi:10.1016/0003-9969(96)00008-8
39. Roschger, P.; Fratzl, P.; Eschberger, J.; Klaushofer, K. Bone 1998, 23,319. doi:10.1016/S8756-3282(98)00112-4
40. Raschke, M. B.; Lienau, C. Appl. Phys. Lett. 2003, 83, 5089.doi:10.1063/1.1632023
41. Sun, J.; Schotland, J. C.; Hillenbrand, R.; Carney, P. S.Appl. Phys. Lett. 2009, 95, 121108. doi:10.1063/1.3224177
42. Lowenstam, H. A.; Weiner, S. Science 1985, 227, 51.doi:10.1126/science.227.4682.51
43. Lee, A. P.; Brooker, L. R.; Macey, D. J.; van Bronswijk, W.; Webb, J.Calcif. Tissue Int. 2000, 67, 408. doi:10.1007/s002230001156
44. Thurner, P. J.; Lam, S.; Weaver, J. C.; Morse, D. E.; Hansma, P. K.J. Adhes. 2009, 85, 526. doi:10.1080/00218460902996424
45. Becker, A.; Ziegler, A.; Epple, M. Dalton Trans. 2005, 1814.doi:10.1039/b412062k
46. Hillenbrand, R.; Taubner, T.; Keilmann, F. Nature 2002, 418, 159.doi:10.1038/nature00899
47. Ocelic, N.; Hillenbrand, R. Nat. Mater. 2004, 3, 606.doi:10.1038/nmat1194
48. Wells, O. C. Scanning Electron Microsc. 1977, 1, 747.49. Kravitz, L. C.; Kingsley, J. D.; Elkin, E. L. J. Chem. Phys. 1968, 49,
4600. doi:10.1063/1.166991850. Fuchs, R. Phys. Rev. B 1975, 11, 1732.
doi:10.1103/PhysRevB.11.173251. Bohren, C. F.; Huffmann, D. R. Absorption and Scattering of Light by
Small Particles; Wiley: New York, 1983.52. Balan, E.; Delattre, S.; Roche, D.; Segalen, L.; Morin, G.;
Guillaumet, M.; Blanchard, M.; Lazzeri, M.; Brouder, C.; Salje, E. K. H.Phys. Chem. Miner. 2011, 38, 111. doi:10.1007/s00269-010-0388-x
53. Penel, G.; Leroy, G.; Rey, C.; Sombret, B.; Huvenne, J. P.; Bres, E.J. Mater. Sci.: Mater. Med. 1997, 8, 271.doi:10.1023/A:1018504126866
54. Leroy, G.; Leroy, N.; Penel, G.; Rey, C.; Lafforgue, P.; Bres, E.Appl. Spectrosc. 2000, 54, 1521. doi:10.1366/0003702001948448

Beilstein J. Nanotechnol. 2012, 3, 312–323.
323
55. Knoll, B.; Keilmann, F. Opt. Commun. 2000, 182, 321.doi:10.1016/S0030-4018(00)00826-9
56. Giessibl, F. J. Science 1995, 267, 68. doi:10.1126/science.267.5194.6857. Richter, M.; Hedegaard, M.; Deckert-Gaudig, T.; Lampen, P.;
Deckert, V. Small 2011, 7, 209. doi:10.1002/smll.20100150358. Zaslansky, P.; Zabler, S.; Fratzl, P. Dent. Mater. 2010, 26, e1.
doi:10.1016/j.dental.2009.09.00759. Bruggeman, D. A. G. Ann. Phys. (Berlin, Ger.) 1935, 416, 636.
doi:10.1002/andp.1935416070560. Hinrichs, K.; Röseler, A.; Roodenko, K.; Rappich, J. Appl. Spectrosc.
2008, 62, 121. doi:10.1366/000370208783412744
License and TermsThis is an Open Access article under the terms of the
Creative Commons Attribution License
(http://creativecommons.org/licenses/by/2.0), which
permits unrestricted use, distribution, and reproduction in
any medium, provided the original work is properly cited.
The license is subject to the Beilstein Journal of
Nanotechnology terms and conditions:
(http://www.beilstein-journals.org/bjnano)
The definitive version of this article is the electronic one
which can be found at:
doi:10.3762/bjnano.3.35