Myths and Facts About Hurricane
Evacuation Modeling Rebecca Jetton

FLORIDA KEYS ACSC
COLLABORATIVE EFFORT TO PROJECT THE NEXT TEN YEARS OF
GROWTH

Potential Outcomes for Ten Year Allocation
• Maintain the current allocation
• Decrease the allocation
• Re-distribute the allocation based on vacant land analysis
• Revise evacuation policies
• Expand mitigation approaches
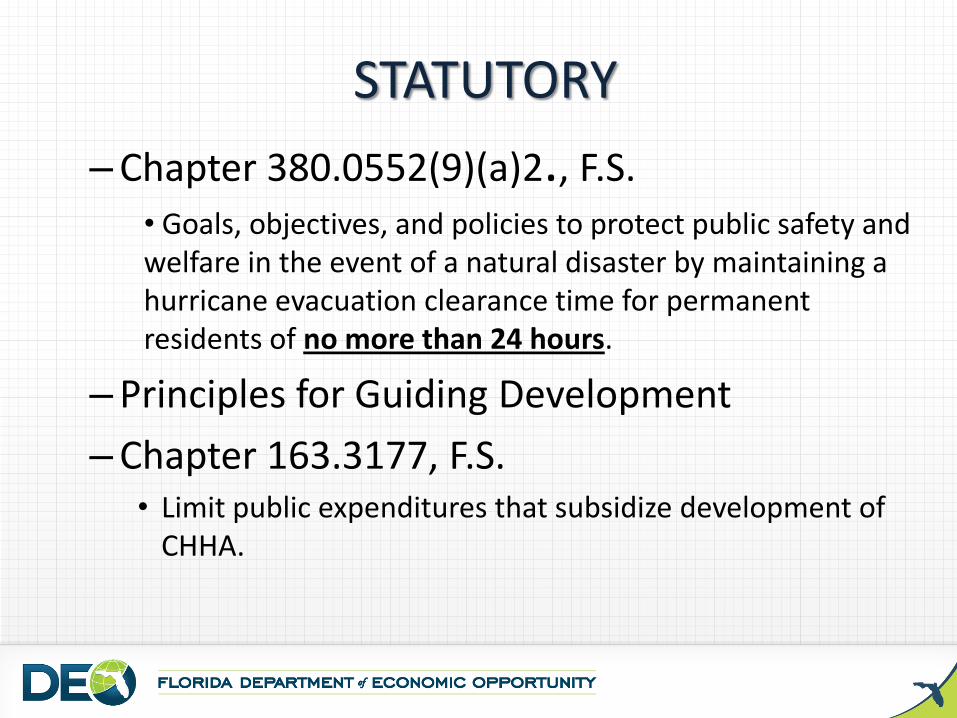
STATUTORY
–Chapter 380.0552(9)(a)2., F.S. • Goals, objectives, and policies to protect public safety and welfare in the event of a natural disaster by maintaining a hurricane evacuation clearance time for permanent residents of no more than 24 hours.
–Principles for Guiding Development
–Chapter 163.3177, F.S. • Limit public expenditures that subsidize development of
CHHA.
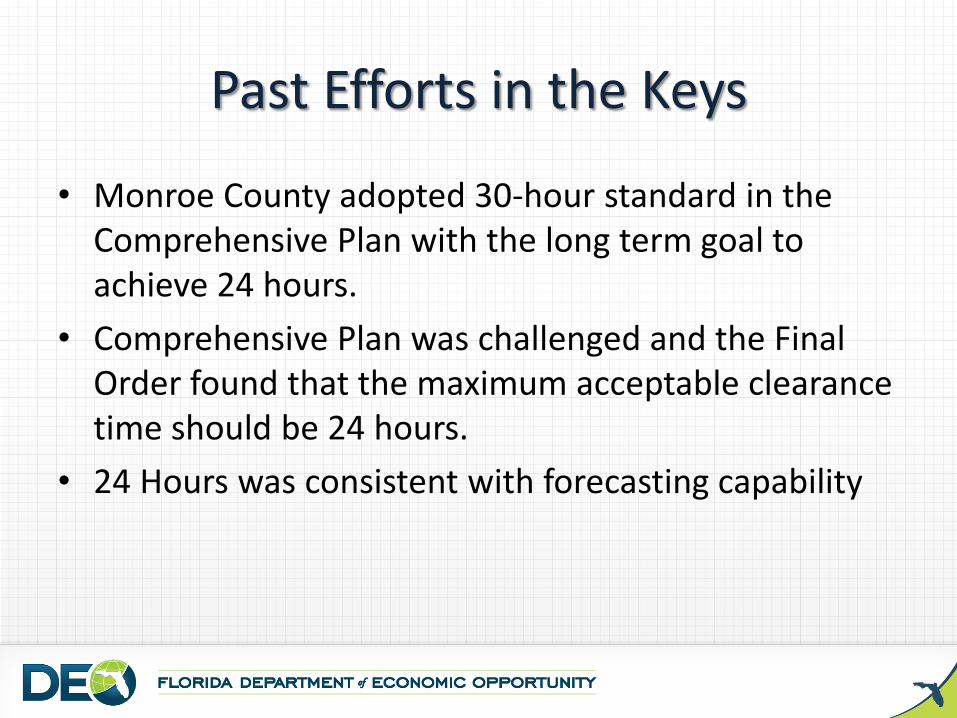
Past Efforts in the Keys
• Monroe County adopted 30-hour standard in the Comprehensive Plan with the long term goal to achieve 24 hours.
• Comprehensive Plan was challenged and the Final Order found that the maximum acceptable clearance time should be 24 hours.
• 24 Hours was consistent with forecasting capability

•Hurricane Carrying Capacity Concept •Limit development based on ability to evacuate •Provided time to acquire environmentally-sensitive land •Limited impacts on habitat •Limited Nutrients
Stipulated Settlement Agreement

20 YEARS OF GROWTH
Unit Type 1990
2000 2010
Site-Built 34,494 44,729 46,185
Mobile Homes 11,721 6,888 8,768
Total 46,215 51,617 52,764
Hotels/Motels 9,918 15,257 15,697 (8000 rooms)

Changes in Units Over Time
Change in Units from 1990 – 2000
Increase of 5,402 units
Change in Units from 2000 – 2010
Increase of 1,147 units

1992 ROGO
• Allocation percentage based on platted lands
• 255 COUNTY
• 90 KEY WEST
• 345 X TEN YEARS 3450
• 6810 UNITS
• Layton, Key Colony not included
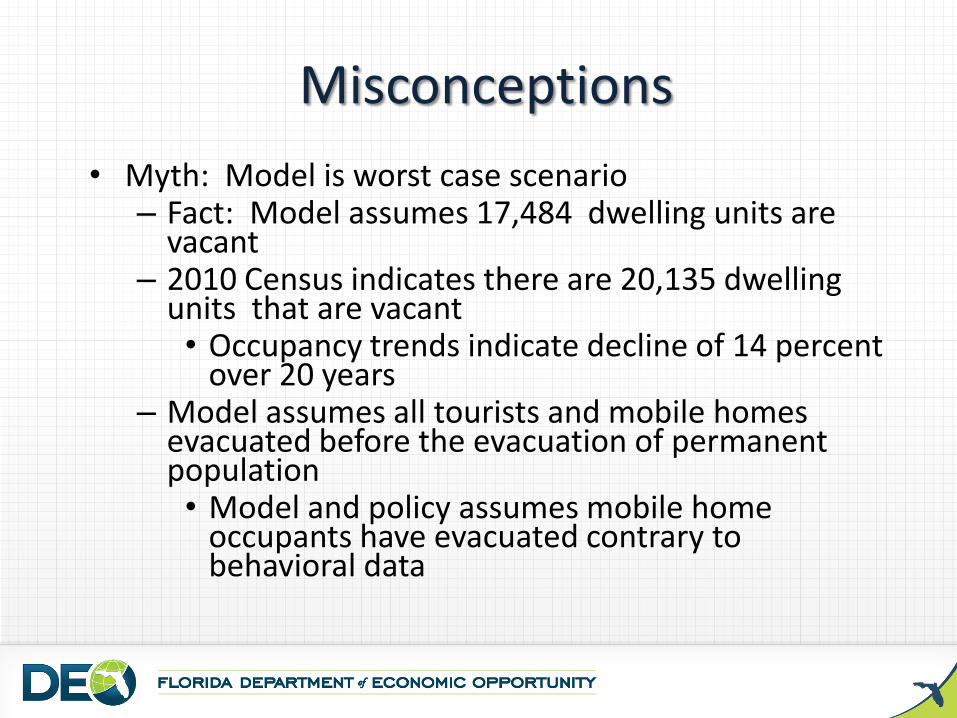
Misconceptions
• Myth: Model is worst case scenario – Fact: Model assumes 17,484 dwelling units are
vacant – 2010 Census indicates there are 20,135 dwelling
units that are vacant • Occupancy trends indicate decline of 14 percent
over 20 years – Model assumes all tourists and mobile homes
evacuated before the evacuation of permanent population • Model and policy assumes mobile home
occupants have evacuated contrary to behavioral data
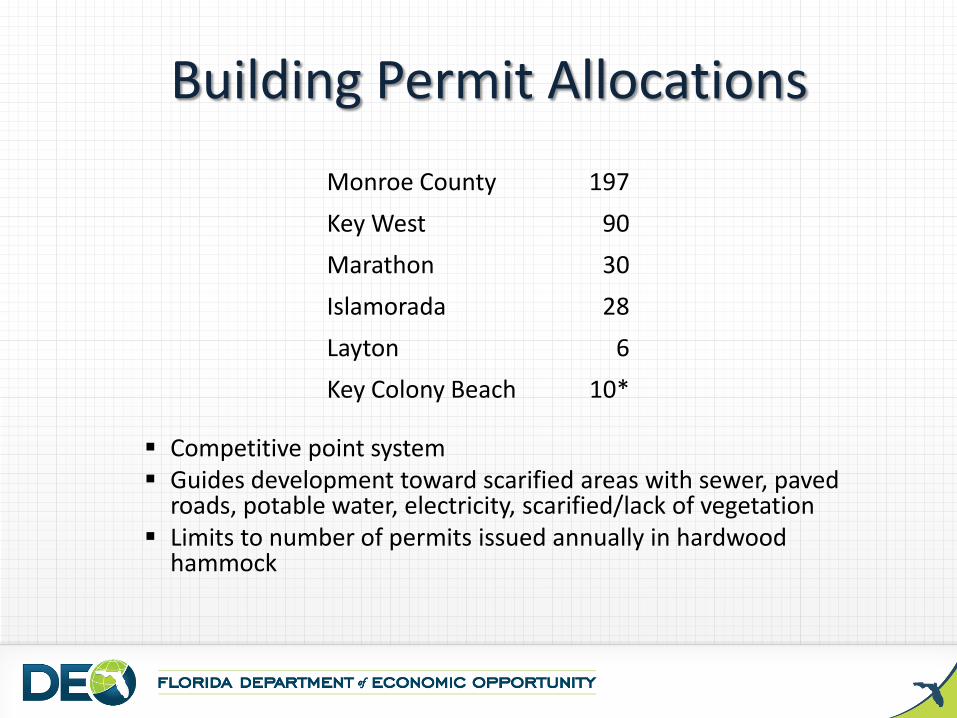
Building Permit Allocations
Competitive point system Guides development toward scarified areas with sewer, paved
roads, potable water, electricity, scarified/lack of vegetation Limits to number of permits issued annually in hardwood
hammock
Monroe County 197
Key West 90
Marathon 30
Islamorada 28
Layton 6
Key Colony Beach 10*

BASIC FACTS
• Number of evacuating vehicles
• Occupancy rate of site-built units
• Flow rate set by FDOT (how many cars can be processed / how many lanes)
Focus
• Storm characteristics are part of model
• Storm characteristics affect behavioral characteristics

Why a 24-hour evacuation standard?
• Forecasting capability
–Hurricane warning issued 24 hours prior to landfall
• Tropical force winds occur 8-12 hours prior to landfall
• Forecasting capability

An Evacuating History…
• 2001 – Miller Consulting, Inc. and Florida Department of Transportation (FDOT) conducted the “Florida Keys Hurricane Evacuation Study”
– Based upon 1990 Census data
– Clearance Time – 25 hours and 32 minutes
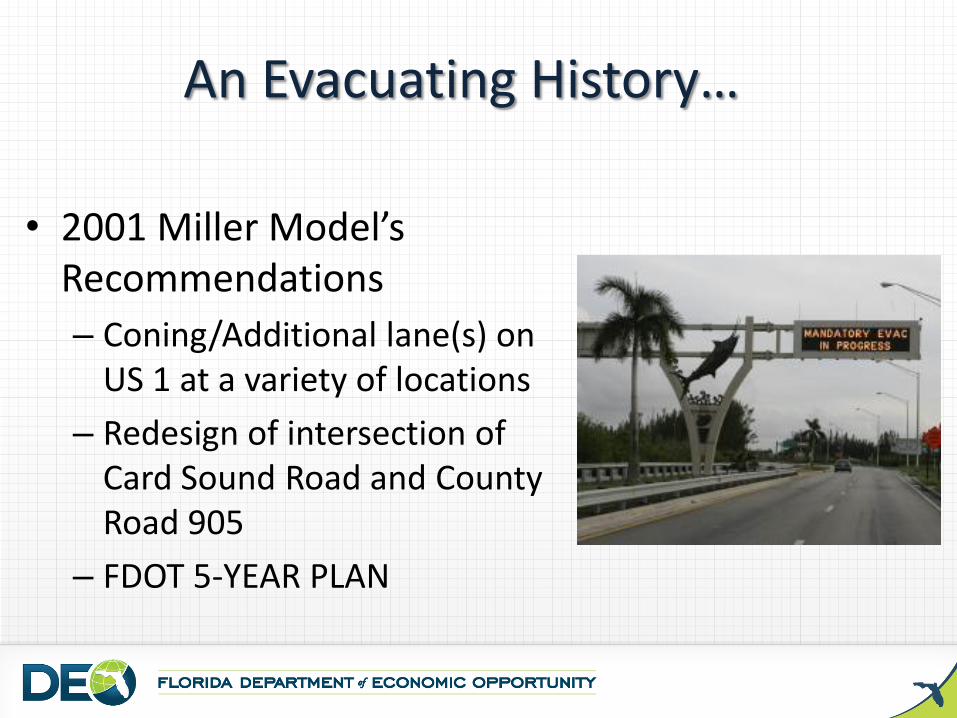
An Evacuating History…
• 2001 Miller Model’s Recommendations
– Coning/Additional lane(s) on US 1 at a variety of locations
– Redesign of intersection of Card Sound Road and County Road 905
– FDOT 5-YEAR PLAN
Flow Rate Improvement
• Clearance time improves by only one hour by adding one additional outbound lane in Islamorada (MM. 85-90), Key Largo and Florida City. – Road widening – environmental, community
character – Transportation Management – reverse
laning/temporary lanes require significant set up time (6-10 hours)
– !8 Mile stretch law suit

An Evacuating History…
• 2003 Miller Model Update
– Using the same parameters of 2001 Miller Model, clearance time is approximately 24 hours
– Phased evacuation
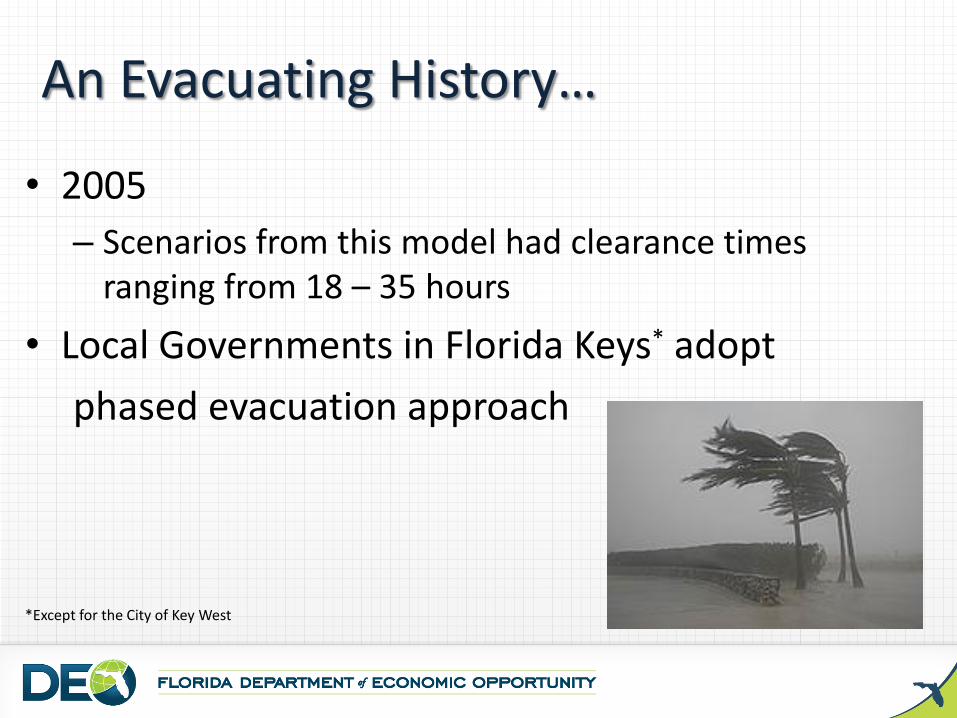
An Evacuating History…
• 2005
– Scenarios from this model had clearance times ranging from 18 – 35 hours
• Local Governments in Florida Keys* adopt
phased evacuation approach
*Except for the City of Key West

Phased Evacuation
Tourists Ordered to Evacuate
48 36 30 24 18 12 6 0 42
Mobile Home Residents Ordered
to Evacuate Site-built Home Residents Ordered to
Evacuate
Predicted Tropical Storm Force Winds
7 am 7pm 1am 7 am 1 pm 7 pm 1 am 7 am 1 pm

• 2009 – Florida Keys Hurricane Evacuation Technical Focus Group convenes
– Discusses static versus
Dynamic models;
Roadway links and
sustainable capacity;
utilization of the DEM or
Miller Model
An Evacuating History…

An Evacuating History…
• 2010 – present – Statewide Regional Evacuation Study Program and the Transportation Interface for Modeling Evacuations (TIME) Model – New uniform statewide model for hurricane evacuation
– Has been “adjusted” to conform to the unique constraints and factors regarding evacuation in Florida Keys
• Shift from Miller Model to TIME Model – Be more uniform with state
– Best available data and technology for hurricane modeling

Current Clearance Times • From DEM TIME Model scenarios
– For phased evacuation:
• Tourists and mobiles homes – 17 hours
• 70% participation for permanent population – 22 hours and 30 minutes
• 100 % participation for permanent population – 31 hours
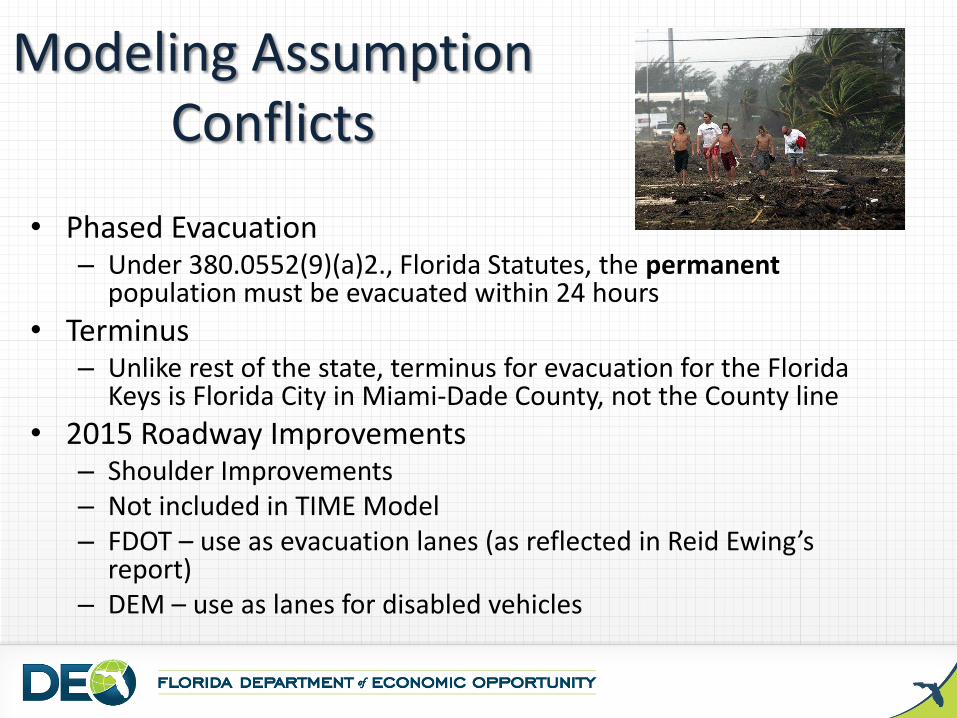
Modeling Assumption Conflicts
• Phased Evacuation – Under 380.0552(9)(a)2., Florida Statutes, the permanent
population must be evacuated within 24 hours
• Terminus – Unlike rest of the state, terminus for evacuation for the Florida
Keys is Florida City in Miami-Dade County, not the County line
• 2015 Roadway Improvements – Shoulder Improvements – Not included in TIME Model – FDOT – use as evacuation lanes (as reflected in Reid Ewing’s
report) – DEM – use as lanes for disabled vehicles

• US Constitution – 5th Amendment
• No person shall . . .be deprived of life, liberty, or property, without due process of law; nor shall private property be taken for public use, without just compensation.
• Florida Constitution – Article X Section 6
• No private property shall be taken except for a public purpose and with full compensation therefore paid to each owner or secured by deposit in the registry of the court and available to the owner.

Regulatory Takings
• Deprive the owner of all economically beneficial
use of land
• Build Out Analysis
• Vacant lots increase local government
exposure to liability claims for taking of land

Balancing Public Safety and Private Property Rights
Public Safety Private Property Rights
Balancing Act

Vacant Land Analysis
9.78%
0.81% 0.74%
0.11%
11.30%
77.25%
Islamorada (1,109 parcels)
Key Colony Beach (92 parcels)
Key West (84 parcels)
Layton (13 parcels)
Marathon (1,281 parcels)
Monroe (8,758 parcels)

Thank you… Questions?