1
Musical Modality in Spontaneous and Acted Speech
Dicky Gilbers & Laura van Eerten
in cooperation with Maartje Schreuder and the MA students Astrid Menninga, Frida Koopmans, Jolien Zoodsma, Henk Leo Deuzeman, Nynke Broersma, Judith Meijer, Marleen Broekema,
Jenne Klimp, Jan-Maarten Bomhof, Noreen Dijkmeijer, Ria Visscher, Trudy Krajenbrink, Judith Reedeker, Klarien Haan, Laura Bos, Tim Heeres, Menke Muller, Nora de Vries and Ellis
Wierenga
University of GroningenThe Netherlands
Seattle, ICMPC11, August 2010
2
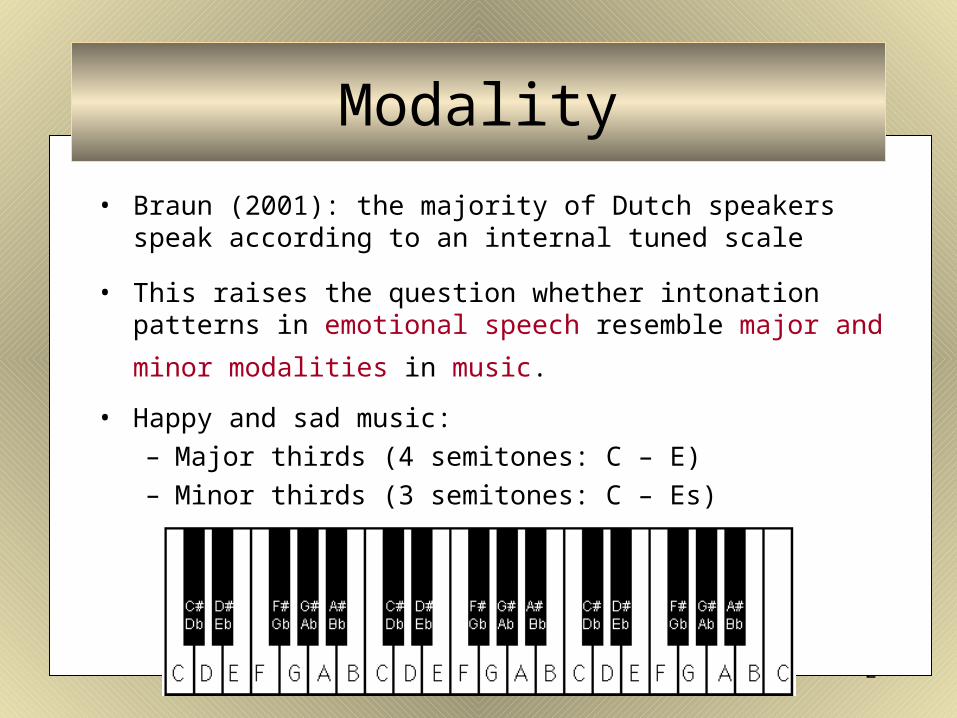
• Braun (2001): the majority of Dutch speakers speak according to an internal tuned scale
• This raises the question whether intonation patterns in emotional speech resemble major and minor modalities
in music. • Happy and sad music:
– Major thirds (4 semitones: C – E)– Minor thirds (3 semitones: C – Es)
Modality

3
Outline• Pilot study (Schreuder, Van Eerten & Gilbers, 2006)
• Emotional speech (MA-students Phonology 2008-2009) – Soccer coaches– Bert & Ernie (Sesame Street)– Methodological problems
• Modality in spontaneous happy speech and acted happy speech (MA-students Phonology 2009-2010)
4
Selective References Emotional Speech
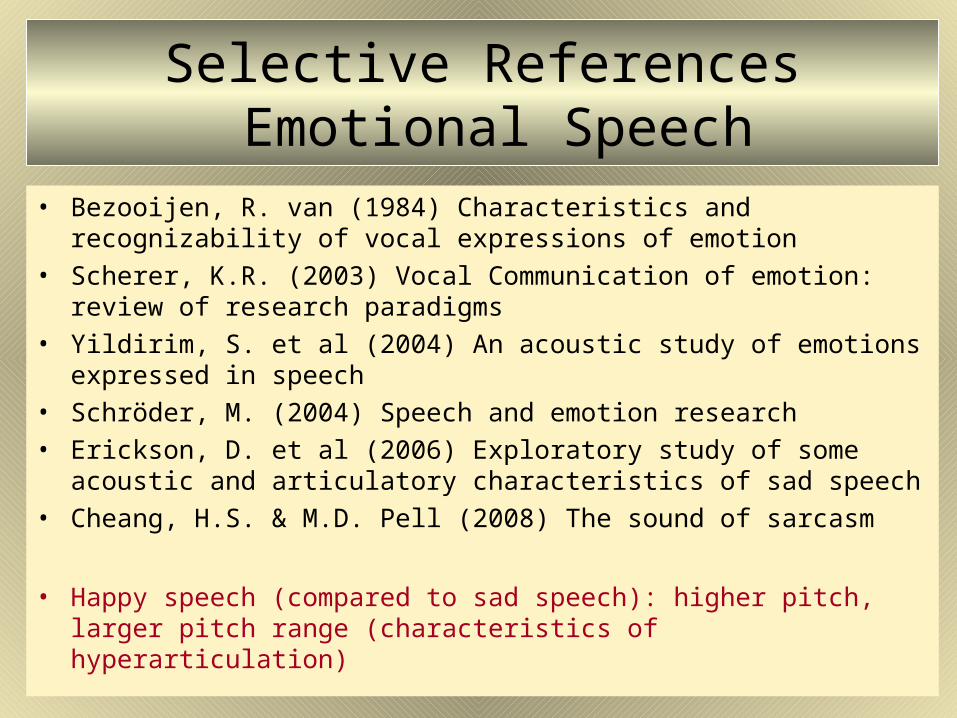
• Bezooijen, R. van (1984) Characteristics and recognizability of vocal expressions of emotion
• Scherer, K.R. (2003) Vocal Communication of emotion: review of research paradigms
• Yildirim, S. et al (2004) An acoustic study of emotions expressed in speech
• Schröder, M. (2004) Speech and emotion research• Erickson, D. et al (2006) Exploratory study of some acoustic
and articulatory characteristics of sad speech• Cheang, H.S. & M.D. Pell (2008) The sound of sarcasm
• Happy speech (compared to sad speech): higher pitch, larger pitch range (characteristics of hyperarticulation)

5
Schreuder Van Eerten & Gilbers (2006)Cook Fujisawa & Takami (2004)
• Modality in speech
6
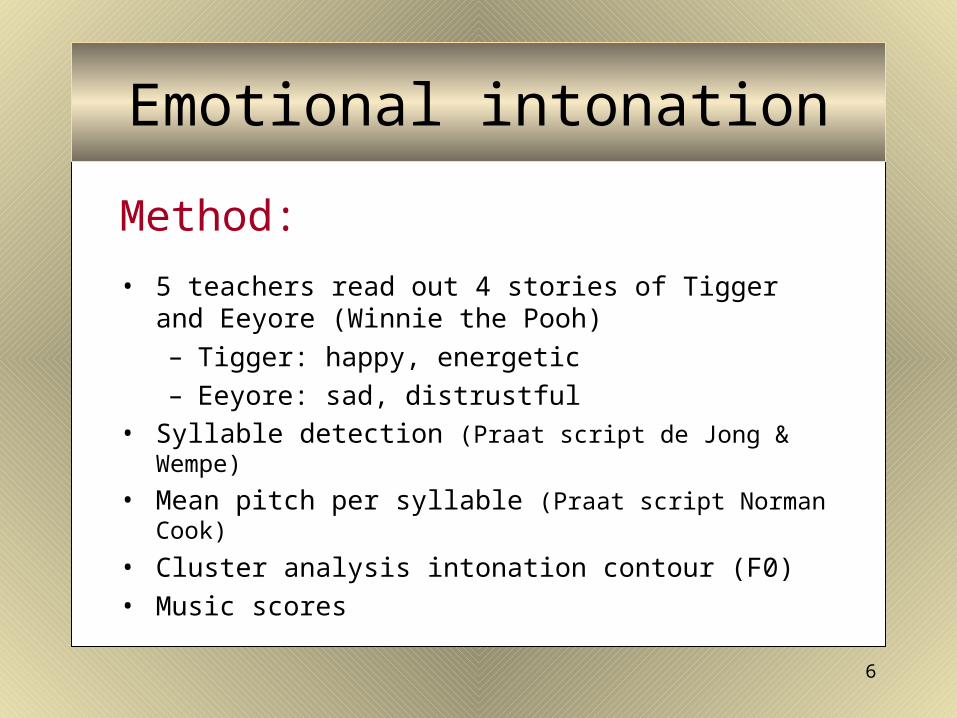
Method:
• 5 teachers read out 4 stories of Tigger and Eeyore (Winnie the Pooh)– Tigger: happy, energetic– Eeyore: sad, distrustful
• Syllable detection (Praat script de Jong & Wempe)
• Mean pitch per syllable (Praat script Norman Cook)
• Cluster analysis intonation contour (F0)• Music scores
Emotional intonation

7
Semitones in frequencies
8
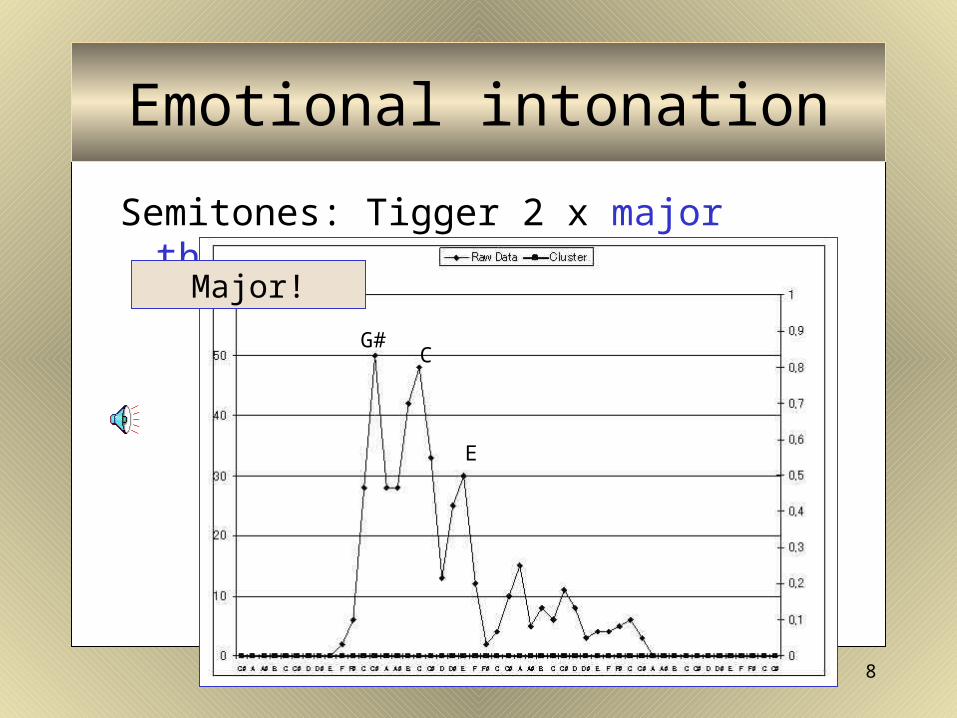
Semitones: Tigger 2 x major thirds
G#C
E
Major!
Emotional intonation
9
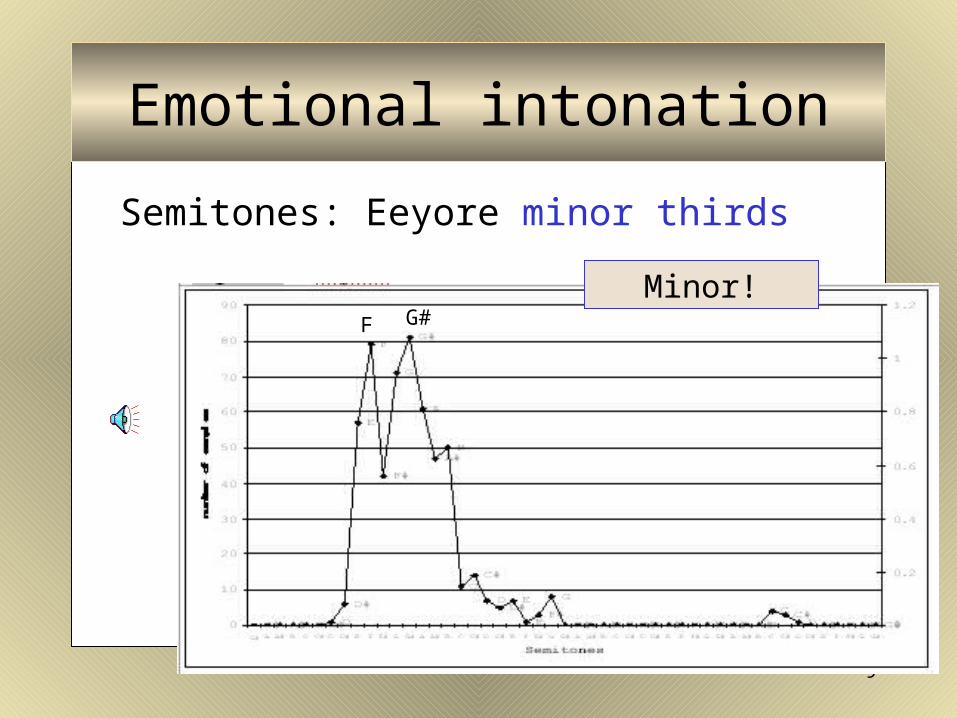
Semitones: Eeyore minor thirds
Minor!F G#
Emotional intonation
10
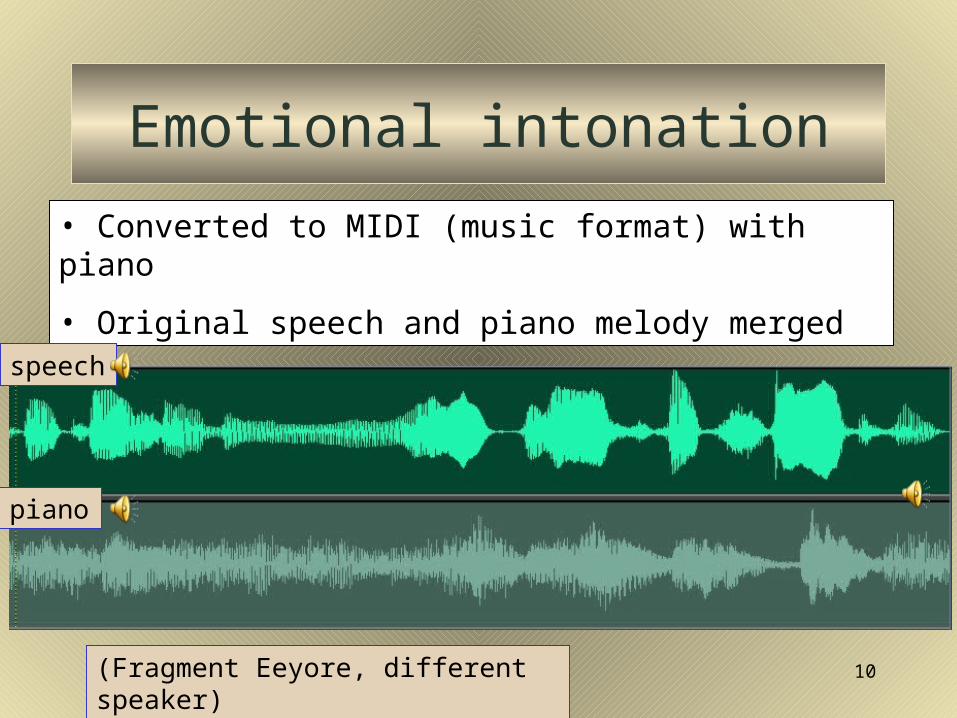
Emotional intonation
• Converted to MIDI (music format) with piano
• Original speech and piano melody merged
(Fragment Eeyore, different speaker)
speech
piano

11
Gb - A
F - Ab
G# - E
C# - A
The music scores of speech fragments incorporate time as a factor in the sequence of notes (which is not the case in cluster analysis)
Scores
12
Results
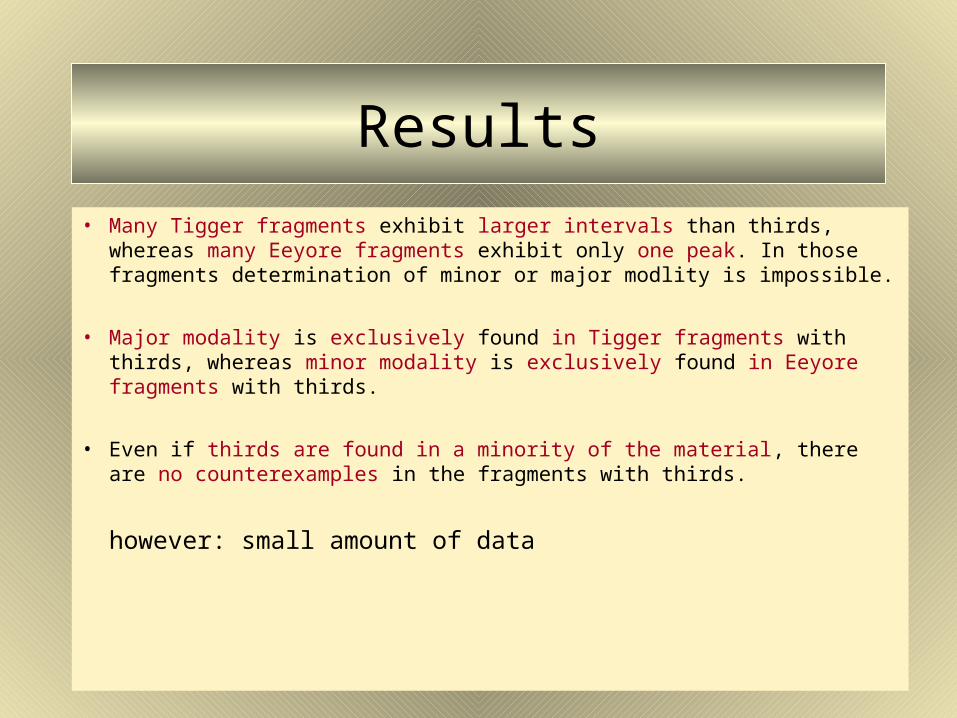
• Many Tigger fragments exhibit larger intervals than thirds, whereas many Eeyore fragments exhibit only one peak. In those fragments determination of minor or major modlity is impossible.
• Major modality is exclusively found in Tigger fragments with thirds, whereas minor modality is exclusively found in Eeyore fragments with thirds.
• Even if thirds are found in a minority of the material, there are no counterexamples in the fragments with thirds.
however: small amount of data
13
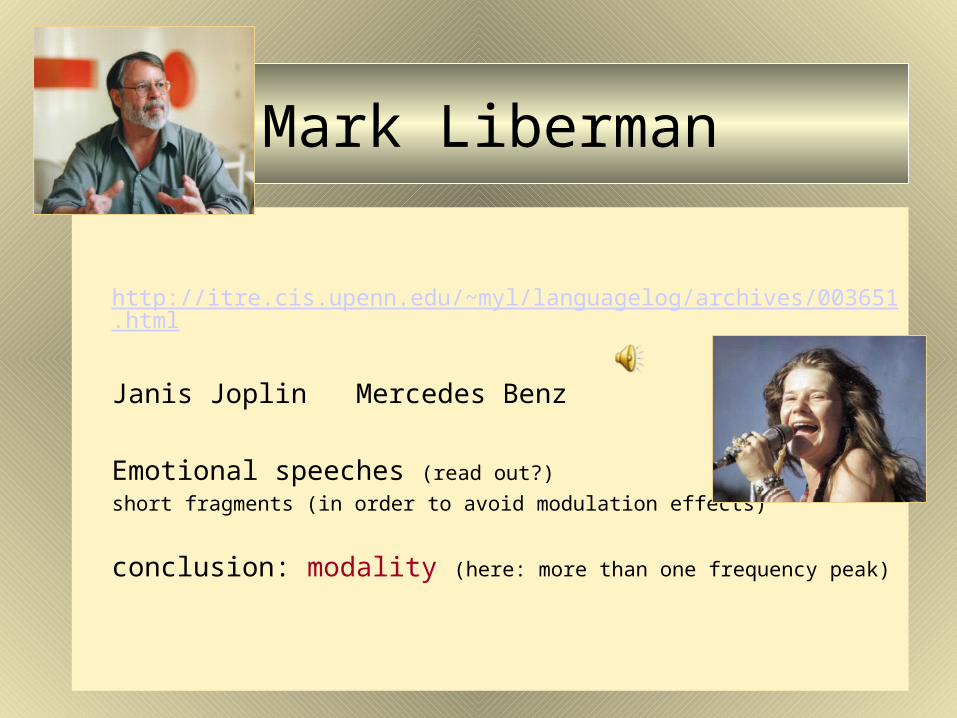
Mark Liberman
http://itre.cis.upenn.edu/~myl/languagelog/archives/003651.html
Janis Joplin Mercedes Benz
Emotional speeches (read out?)
short fragments (in order to avoid modulation effects)
conclusion: modality (here: more than one frequency peak)
14
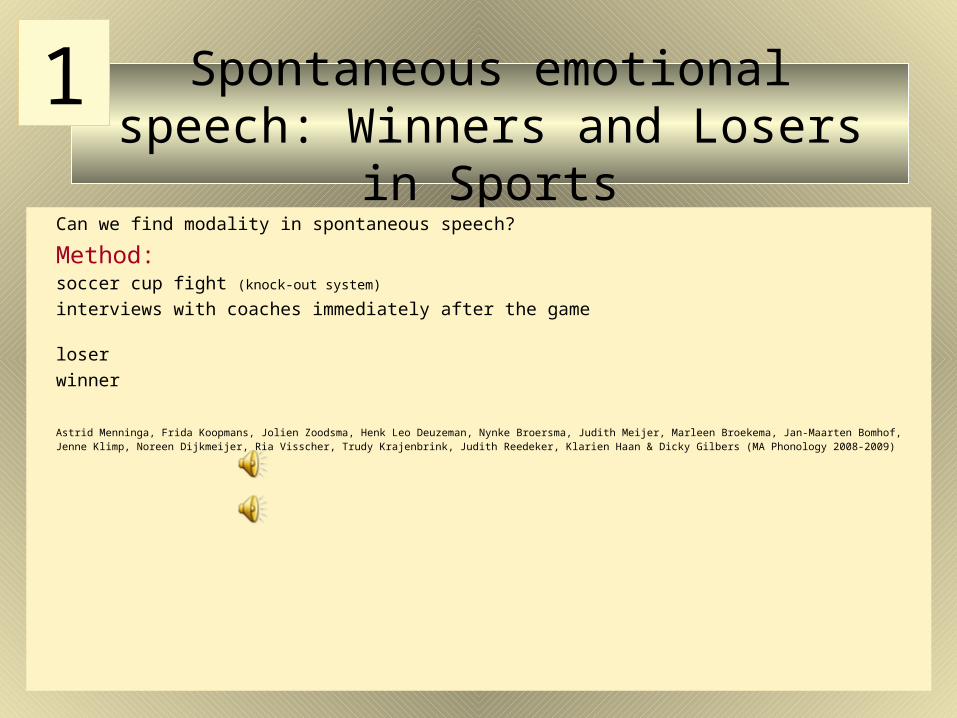
Spontaneous emotional speech: Winners and Losers in Sports
Can we find modality in spontaneous speech?
Method:soccer cup fight (knock-out system)
interviews with coaches immediately after the game
loserwinner
Astrid Menninga, Frida Koopmans, Jolien Zoodsma, Henk Leo Deuzeman, Nynke Broersma, Judith Meijer, Marleen Broekema, Jan-Maarten Bomhof, Jenne Klimp, Noreen Dijkmeijer, Ria Visscher, Trudy Krajenbrink, Judith Reedeker, Klarien Haan & Dicky Gilbers (MA Phonology 2008-2009)
1
150
2
4
6
8
10
12
0
0,1
0,2
0,3
0,4
0,5
0,6
0,7
0,8
0,9
1
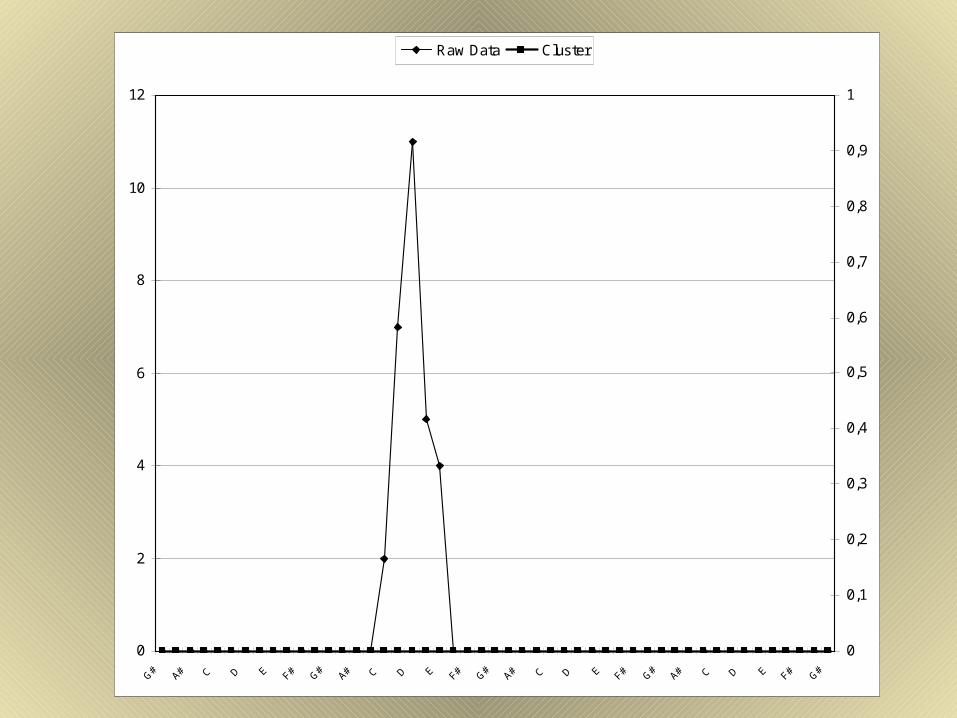
Raw Data Cluster
16
Modality mainly in acted speech?
Does acted speech exhibit more modality than spontaneous speech?
If so, (an excessive number of fragments exhibiting) modality can be a cue for (over)acting
17
Bert & Ernie
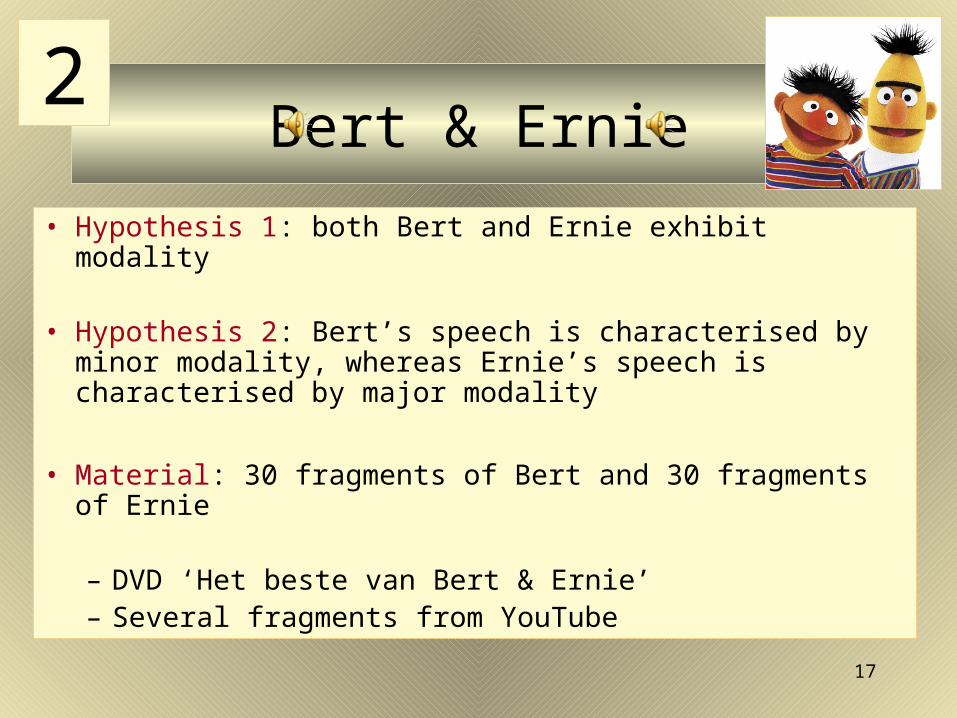
• Hypothesis 1: both Bert and Ernie exhibit modality • Hypothesis 2: Bert’s speech is characterised by
minor modality, whereas Ernie’s speech is characterised by major modality
• Material: 30 fragments of Bert and 30 fragments of Ernie
– DVD ‘Het beste van Bert & Ernie’– Several fragments from YouTube
2
18
Results
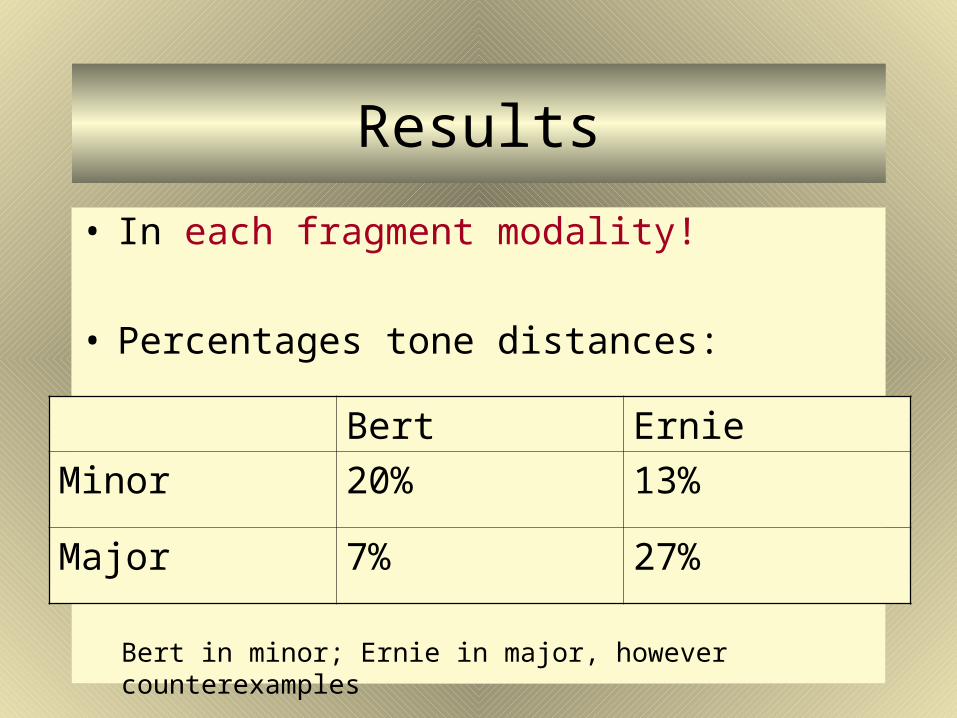
• In each fragment modality!
• Percentages tone distances:
Bert Ernie
Minor 20% 13%
Major 7% 27%
Bert in minor; Ernie in major, however counterexamples
19
Methodological problems
Many supposedly happy fragments do not sound happy at all
follow-up study: fragments should be judged on a 5-points Likert scale
Cluster Analysis gives no information on the sequence of tones (for example, c-e in C or Amin)
follow-up study: in case of ambiguity, highest peak in histogram is key-note
Laura Bos, Dicky Gilbers, Tim Heeres, Menke Muller, Nora de Vries & Ellis Wierenga (2009-2010)
20
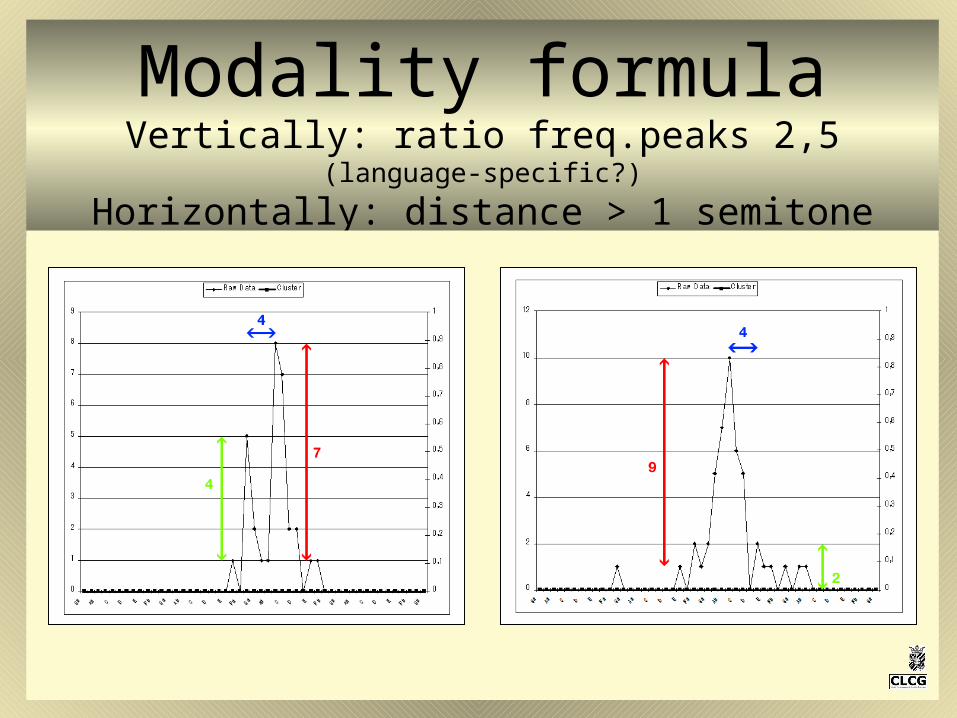
Modality formulaVertically: ratio freq.peaks 2,5 (language-specific?)
Horizontally: distance > 1 semitone
21
Modality in spontaneous and in acted speech
Hypotheses:
1. more modality in acted speech than in spontaneous speech
2. more major modality than minor modality in acted happy speech
22
Selective references
Listeners are well capable of hearing the difference between spontaneous and acted speech (Campbell 2001, 2003; Mathon & de Abreu, 2007)
Cues: speech rate, accuracy of articulation, pauses
In read out speech: less pauses (in comparison with spontaneous speech) (Howel en Kadi-Hanifi, 1991)
Pauses in read out speech (or: non-natural speech) are shorter than in spontaneous speech(O’Connell & Kowal, 1972; Kowal, O’Connell, O’Brien & Bryant, 1975)
In spontaneous speech 55% of all pauses align with grammatical edges (Henderson, Goldman-Eisler & Skarbek, 1966), whereas pauses in read out speech almost always coincide with the edges of grammatica domains (Levin, Schaffer & Snow, 1982)
Hypothesis: modality also a cue for the difference
23
Method
22 interviews female participants (age 18-25) (they were asked to talk about hilarious passages from a movie or a book)
aim: eliciting spontaneous cheerful speech
92 (cheerful) fragments of 5-10 sec were selected and filtered(abstracted from meaning by filtering out frequencies above 700 Hz)
degree of happiness judged by 116 reviewers (8 lists with 14 happy fragments + 6 fillers; 5-point Likert scale)
Cluster Frequency plots were made for all spontaneous fragments
21 top judged cheerful fragments were repeated by 3 actresses in a performance task (play)
Subsequently, the acted cheerful fragments were filtered, judged and Cluster Frequency plots were made
24
Method
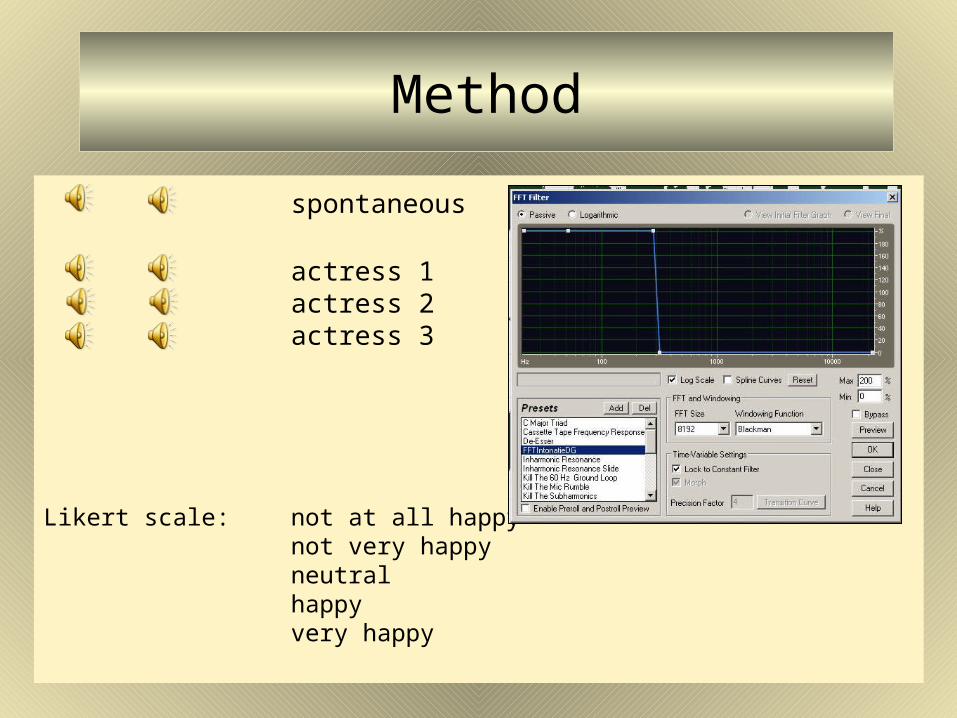
spontaneous
actress 1actress 2actress 3
Likert scale: not at all happy not very happy neutralhappy very happy
25
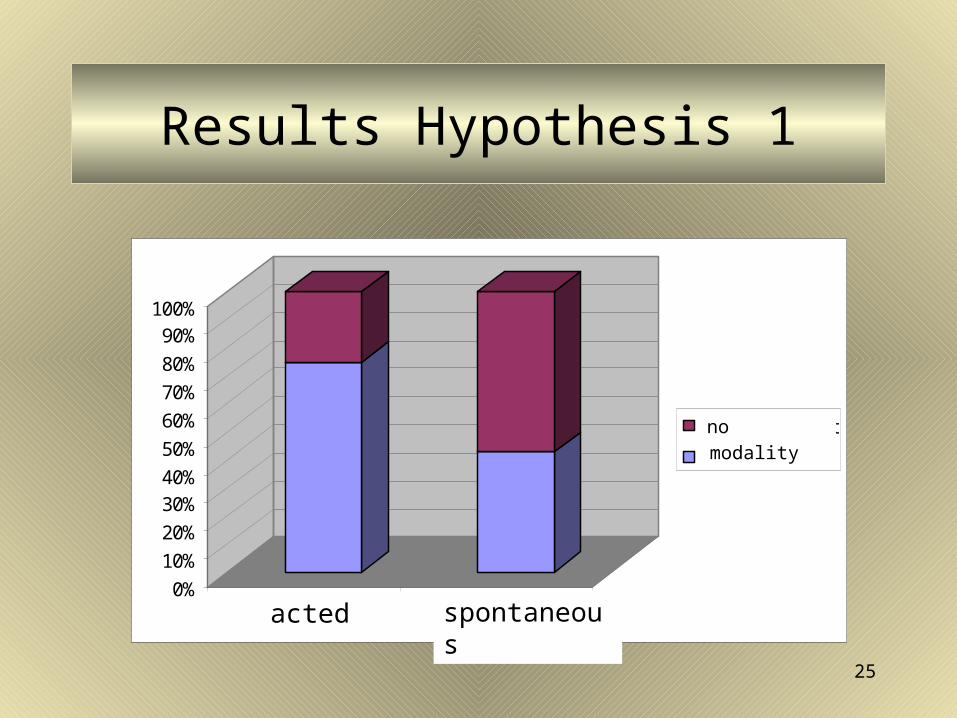
Results Hypothesis 1
0%
10%
20%
30%40%
50%
60%
70%
80%
90%100%
geacteerd spontaan
Geen modaliteit
Modaliteit
acted spontaneous
no modalitymodality
26
Results Hypothesis 1
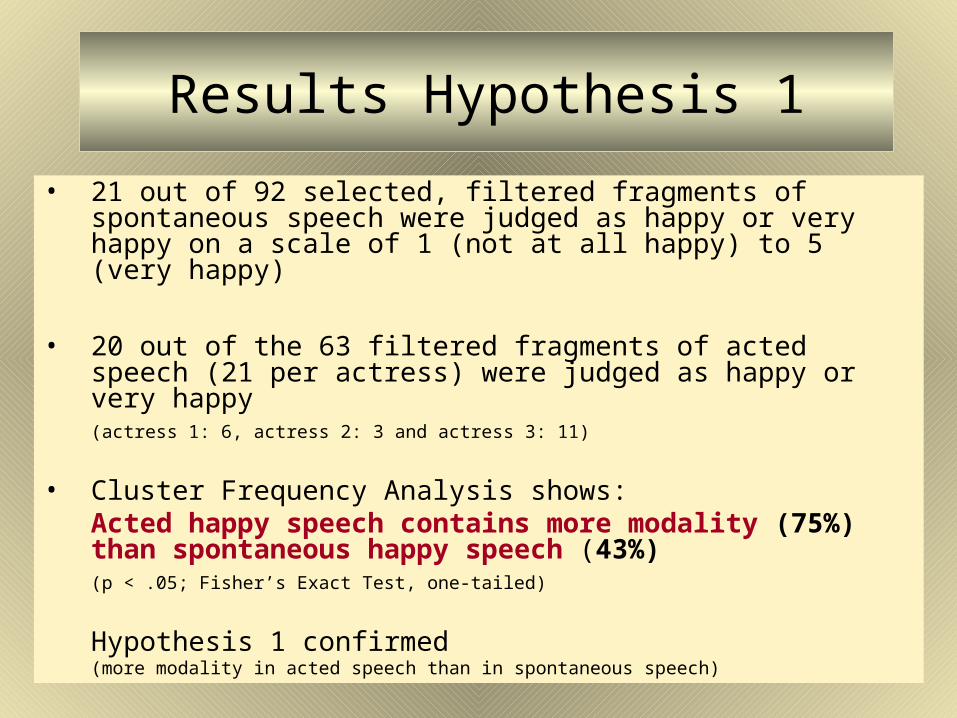
• 21 out of 92 selected, filtered fragments of spontaneous speech were judged as happy or very happy on a scale of 1 (not at all happy) to 5 (very happy)
• 20 out of the 63 filtered fragments of acted speech (21 per actress) were judged as happy or very happy(actress 1: 6, actress 2: 3 and actress 3: 11)
• Cluster Frequency Analysis shows:Acted happy speech contains more modality (75%) than spontaneous happy speech (43%)(p < .05; Fisher’s Exact Test, one-tailed)
Hypothesis 1 confirmed(more modality in acted speech than in spontaneous speech)
27
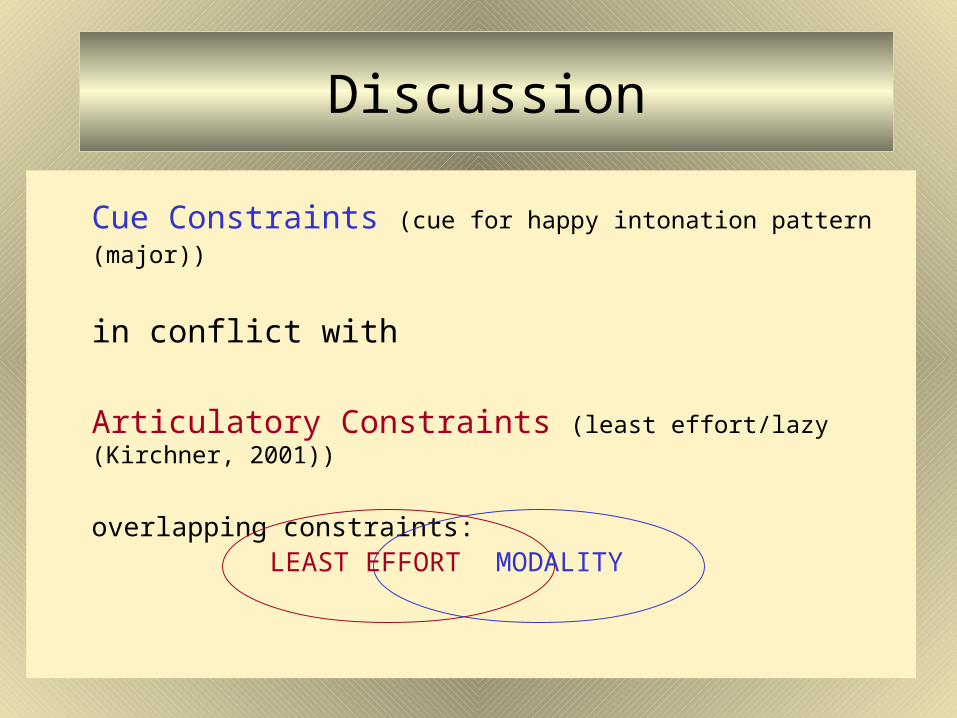
Discussion
Cue Constraints (cue for happy intonation pattern (major))
in conflict with
Articulatory Constraints (least effort/lazy (Kirchner, 2001))
overlapping constraints:
MODALITY
LEAST EFFORT
28
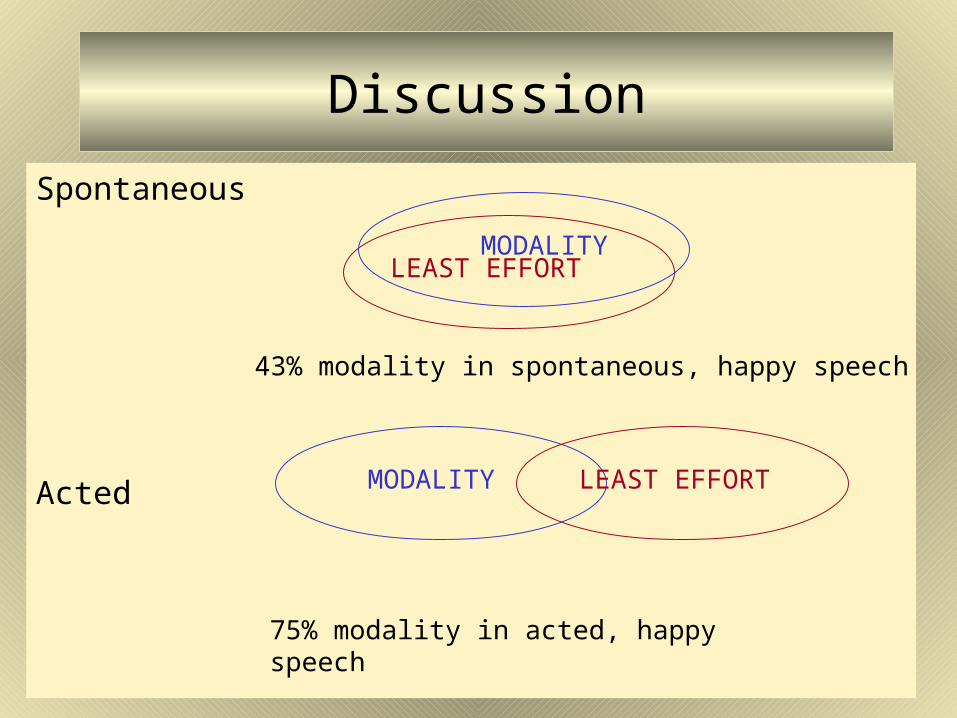
Discussion
Spontaneous
Acted MODALITY
LEAST EFFORT
MODALITYLEAST EFFORT
75% modality in acted, happy speech
43% modality in spontaneous, happy speech
29
Results Hypothesis 2
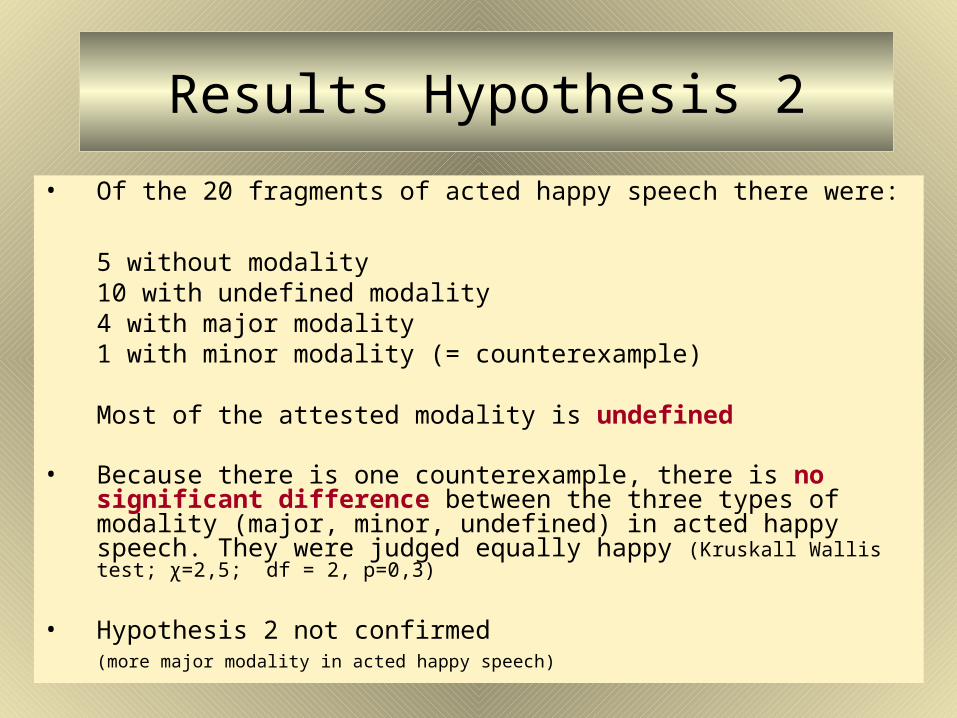
• Of the 20 fragments of acted happy speech there were:
5 without modality10 with undefined modality 4 with major modality 1 with minor modality (= counterexample)
Most of the attested modality is undefined • Because there is one counterexample, there is no
significant difference between the three types of modality (major, minor, undefined) in acted happy speech. They were judged equally happy (Kruskall Wallis test; χ=2,5; df = 2, p=0,3)
• Hypothesis 2 not confirmed(more major modality in acted happy speech)
30
Conclusion
Hypothesis 1 confirmed(more modality in acted happy speech than in spontaneous happy speech)
Hypothesis 2 not confirmed(more major modality in acted happy speech)
31
Appendix 1: Method
Adobe Audition 1.5Praat: syllable script (Nivka de Jong)Sample script (Norman Cook)Excel macro (Norman Cook)
32
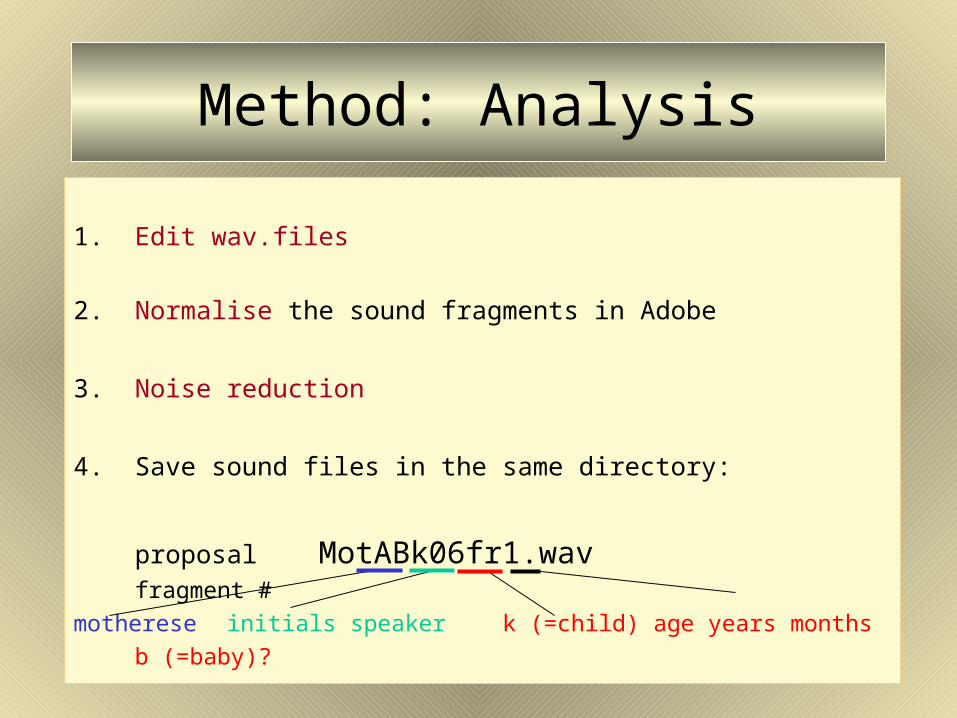
Method: Analysis
1. Edit wav.files
2. Normalise the sound fragments in Adobe
3. Noise reduction
4. Save sound files in the same directory:
proposal MotABk06fr1.wav
fragment #motherese initials speaker k (=child) age years months
b (=baby)?
33
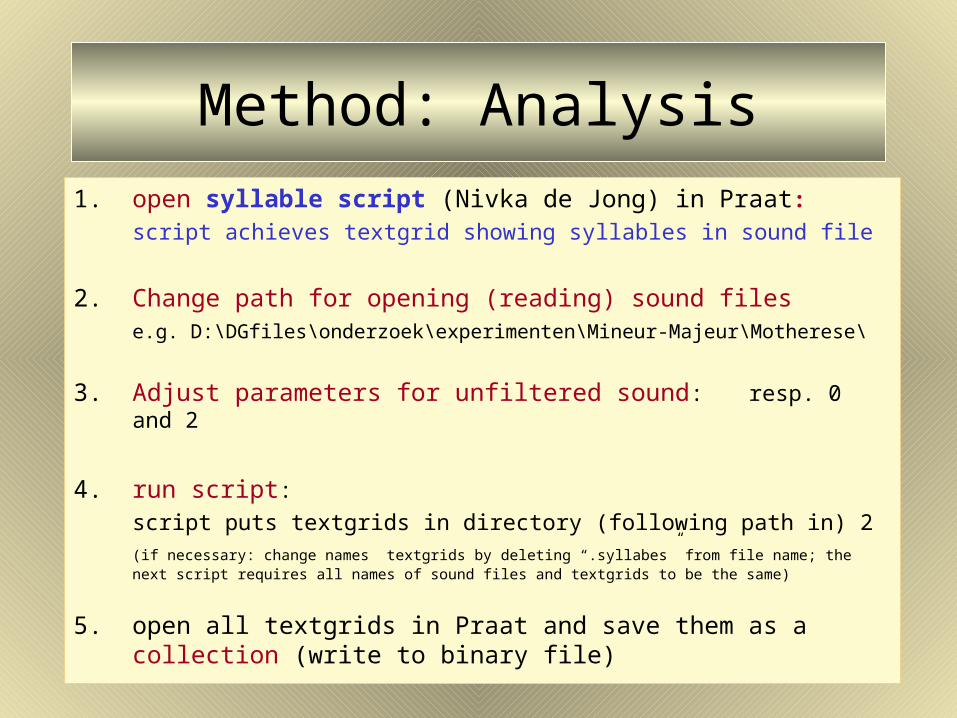
Method: Analysis1. open syllable script (Nivka de Jong) in Praat:
script achieves textgrid showing syllables in sound file
2. Change path for opening (reading) sound files e.g. D:\DGfiles\onderzoek\experimenten\Mineur-Majeur\Motherese\
3. Adjust parameters for unfiltered sound: resp. 0 and 2
4. run script: script puts textgrids in directory (following path in) 2(if necessary: change names textgrids by deleting “.syllabes” from file name; the next script requires all names of sound files and textgrids to be the same)
5. open all textgrids in Praat and save them as a collection (write to binary file)
34
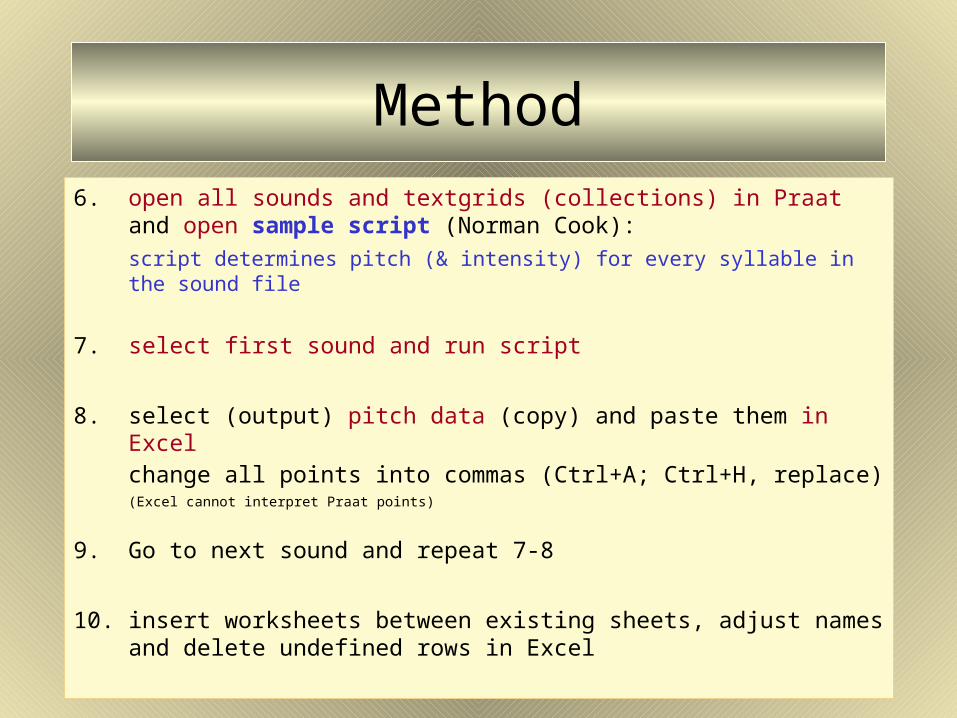
Method6. open all sounds and textgrids (collections) in Praat and
open sample script (Norman Cook): script determines pitch (& intensity) for every syllable in the sound file
7. select first sound and run script
8. select (output) pitch data (copy) and paste them in Excelchange all points into commas (Ctrl+A; Ctrl+H, replace)
(Excel cannot interpret Praat points)
9. Go to next sound and repeat 7-8
10. insert worksheets between existing sheets, adjust names and delete undefined rows in Excel
35
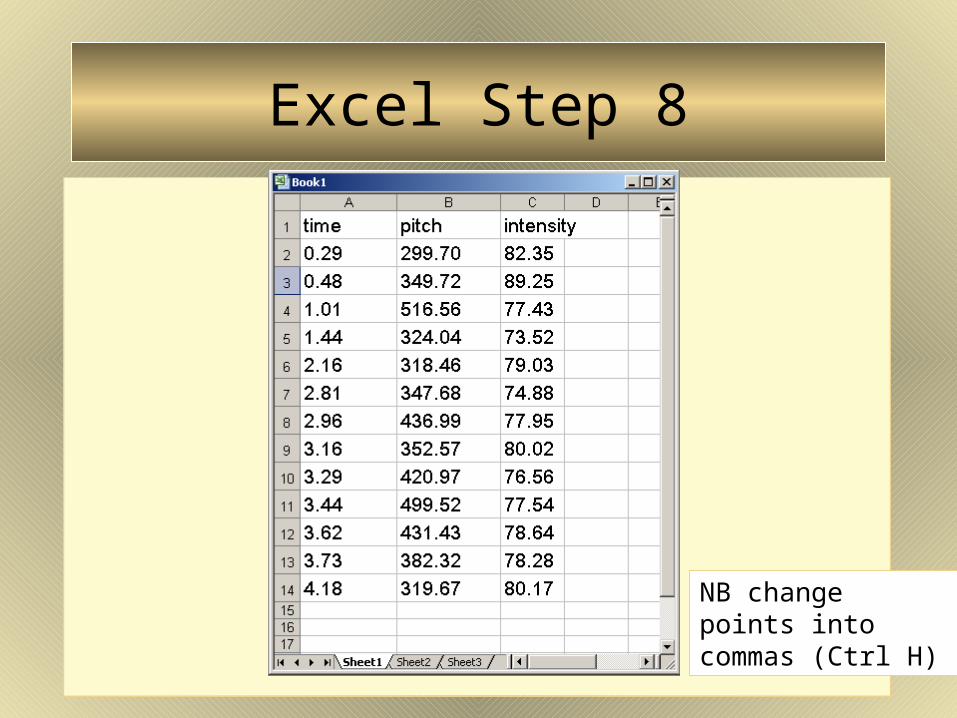
Excel Step 8
NB change points into commas (Ctrl H)

36
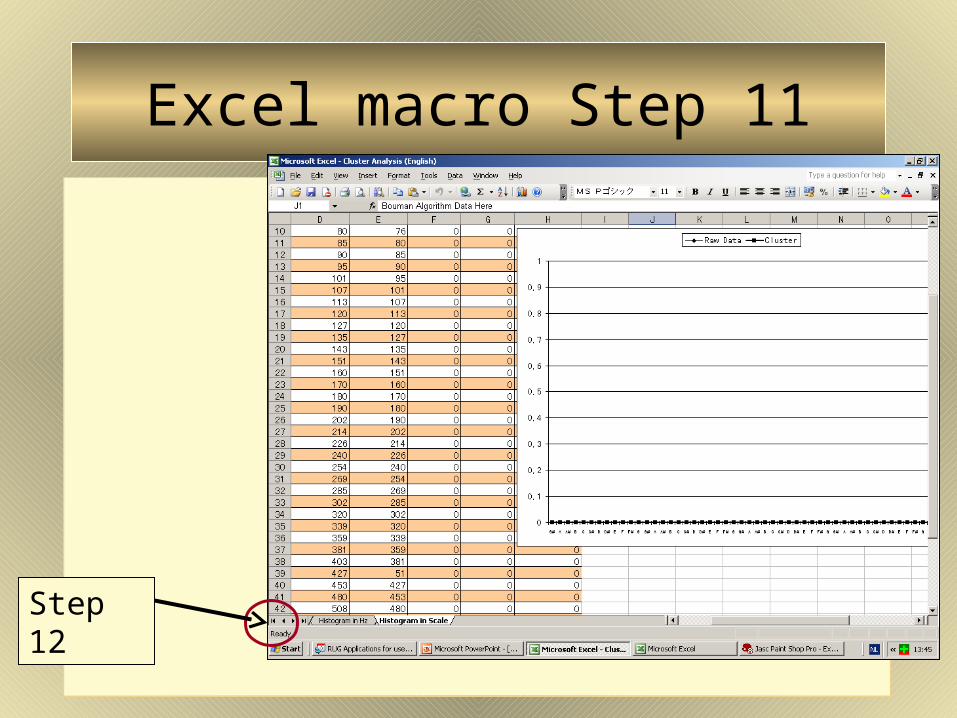
Method 11. open macro (in Excel): (Cluster Analysis English)
macro clusters pitches and achieves histograms showing the most frequent frequencies
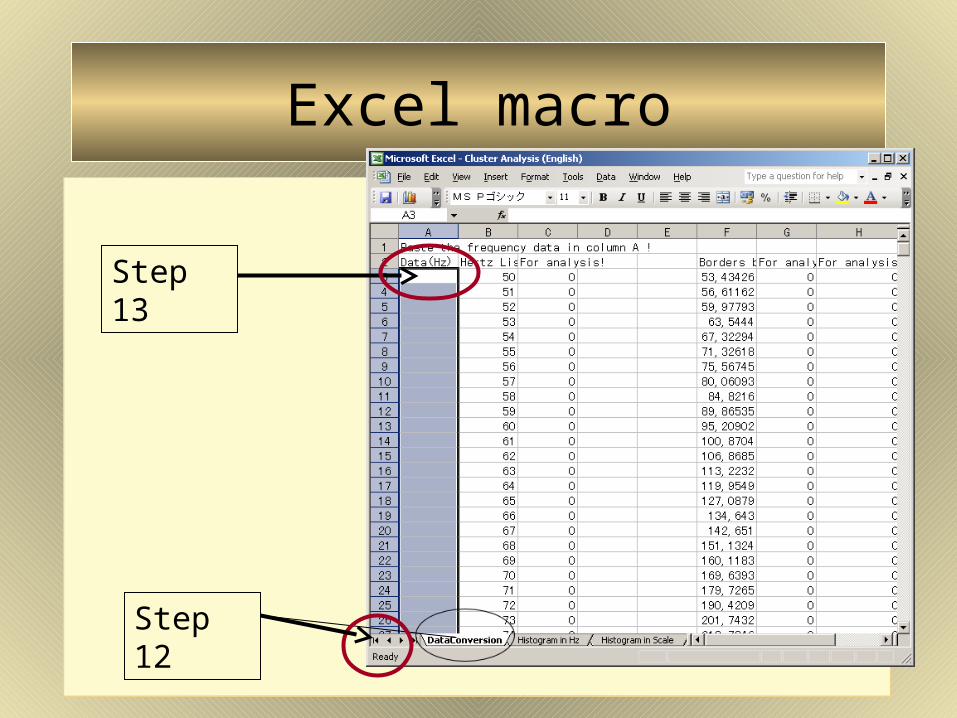
12. Go to most left sheet (|<) (data conversion)
13. paste Excel pitch data in column A (data row 3)(ENTER (only if asked for)
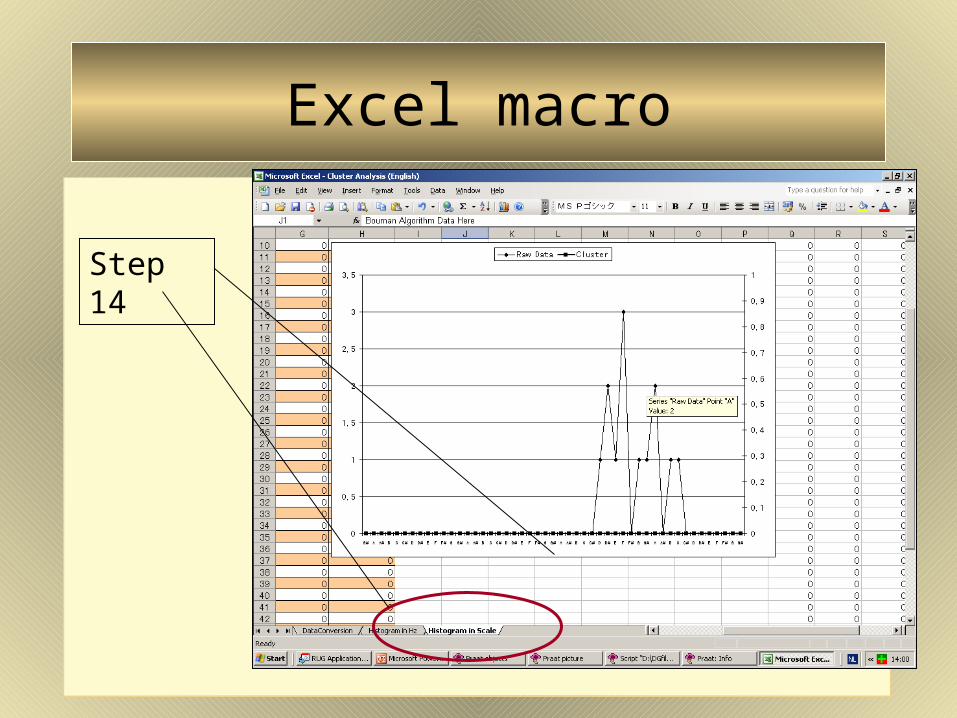
14. copy histograms and paste in Word
15. give name code soundfile for every histogram
37
Excel macro Step 11
Step 12
38
Excel macro
Step 12
Step 13

39
Excel macro
Step 13
40
Excel macro
Step 14