For Peer Review
More evidence on technological catching-up in the
manufacturing sector
Journal: Applied Economics
Manuscript ID: APE-07-0892.R1
Journal Selection: Applied Economics
Date Submitted by the
Author: 03-Feb-2009
Complete List of Authors: Boussemart, Jean-Philippe BRIEC, Walter; University of Perpignan, IAE; University of Perpignan, IAE Tavera, Christophe; Universite de Rennes, Economics
JEL Code:
O33 - Technological Change: Choices and Consequences|Diffusion Processes < O3 - Technological Change|Research and Development < O - Economic Development, Technological Change, and Growth, O40 - General < O4 - Economic Growth and Aggregate Productivity < O - Economic Development, Technological Change, and Growth, O47 - Measurement of Economic Growth|Aggregate Productivity < O4 - Economic Growth and Aggregate Productivity < O - Economic
Development, Technological Change, and Growth
Keywords: Catching-up, TFP change index, Technology adoption, Production Frontier
Editorial Office, Dept of Economics, Warwick University, Coventry CV4 7AL, UK
Submitted Manuscriptpe
er-0
0582
289,
ver
sion
1 -
1 Ap
r 201
1Author manuscript, published in "Applied Economics (2010) 1"
DOI : 10.1080/00036840903166236

For Peer Review
Page 1 of 17
Editorial Office, Dept of Economics, Warwick University, Coventry CV4 7AL, UK
Submitted Manuscript
123456789101112131415161718192021222324252627282930313233343536373839404142434445464748495051525354555657585960
peer
-005
8228
9, v
ersi
on 1
- 1
Apr 2
011

For Peer Review
1
More evidence on technological catching-up
in the manufacturing sector
Jean-Philippe Boussemart, LEM-IESEG School of Management and University of Lille 3,
Walter Briec1, LAMPS-Université de Perpignan Via Domitia,
Christophe Tavéra, CREM-Université de Rennes 1
(January 2009)
Abstract
Production frontiers for the manufacturing sector are estimated to determine a “country specific” catching-up
process of Total Factor Productivity (TFP).TFP gains were aimed at assessing the manufacturing industry’s
productive performances for 14 OECD countries over the period between 1970-2001. Our TFP measure does not
assume technical or allocative efficiency which are inherent drawbacks of usual TFP indices. We show that
catching-up processes can be very different between sub-periods and across countries. A significant catching-up
process was in progress in the manufacturing sector between 1970 and 1986 then it overturned over the period
1987-2001. During the first sub-period, the speed of technological catching-up of the euro-zone countries was
definitely higher than those of the other European or OECD nations whereas the divergence noted in second sub-
period had the same order of magnitude amongst the three groups.
JEL classification: O33; O40; O47
Keywords: Catching-up; TFP change index; Technology adoption; Production Frontier
1 Corresponding author. Address: IAE Université de Perpignan Via Domitia, 52 Avenue Paul Alduy, F-66000 Perpignan. Email: [email protected]
Page 2 of 17
Editorial Office, Dept of Economics, Warwick University, Coventry CV4 7AL, UK
Submitted Manuscript
123456789101112131415161718192021222324252627282930313233343536373839404142434445464748495051525354555657585960
peer
-005
8228
9, v
ersi
on 1
- 1
Apr 2
011
For Peer Review
2
1. Introduction
The productivity catching-up hypothesis put forth by Abramovitz (1986) has recently been
investigated at the disaggregated level of industries by testing for convergence in Total Factor
Productivity (TFP) within sectors across countries2. These studies lead to the same major
finding that services are driving the aggregate convergence result while tradable sectors as
manufacturing showed non significant catching-up process (see for instance Bernard and
Jones, 1996a, 1996b; Hansson and Henrekson, 1997).
While these studies take clearly into account the potential differences between industries in
the technological catching-up process, they suffer from one main drawback. The technology
level is either computed as a Solow-residual indicator of technology or as a traditional
Törnquist index. These choices may then alter or bias the subsequent evaluation of the
catching-up mechanism because they assume technical as well as allocative efficiencies for
each country.
A detailed analysis of the comparative productivity performance at sectoral level, and more
precisely in the manufacturing sector, is a good way to better understand the mechanism
behind the catch-up and convergence process for the economy as a whole. The manufacturing
sector plays an important role in the earlier stages of economic growth due to its increasing
share of the sector in total production and employment, and its rapid increase in productivity.
But it also plays an important role in the later stages when manufacturing becomes less
important in relative terms, as is presently true for most OECD countries, due to its role of
new technology generator and to the associated spill-over effects to other sectors.
Moreover, the industrial manufacturing sector is vast and many of its companies are highly
diversified and so less exposed to falling consumer confidence than companies in other
sectors during low phases of the business cycle. Finally, the manufacturing sector still has a
large positive effect on available income of consumers due to the decreasing price of
manufacturing goods induced by rapid productivity growth in this sector.
Due to the major impact of the manufacturing sector on growth, we propose a re-examination
of the productivity catching-up mechanism across the leading industrial countries in this
sector by using an empirical strategy which avoids the above-mentioned drawback. The
central point of this methodology consists in using a TFP index to determine a parametric-
stochastic world production frontier for OECD countries with data spanning the period 1970-
2 In this study, we follow Abramowitz's distinction between catch-up and convergence. Catch-up is defined as the narrowing of the productivity gap compared to the leading country, whereas the convergence hypothesis supposes that the productivity gaps narrow among the follower countries as well.
Page 3 of 17
Editorial Office, Dept of Economics, Warwick University, Coventry CV4 7AL, UK
Submitted Manuscript
123456789101112131415161718192021222324252627282930313233343536373839404142434445464748495051525354555657585960
peer
-005
8228
9, v
ersi
on 1
- 1
Apr 2
011

For Peer Review
3
2001. We then evaluate the convergence of the estimated technical levels by testing whether
countries with technological delays start a catching-up process by adopting more advanced
production technology from more efficient countries3.
Compared to usual researches on technological adoption, one main methodological
contribution of our research is to develop a panel data procedure that enables us to estimate
individual specific processes concerning direction and magnitude of TFP convergence within
a set or a sub-set of countries.
Empirical results partly confirm previous findings that no (or even a slow) catching-up effect
was in progress in the manufacturing sector. However, our results strongly mitigate this
finding by showing that the catching-up process is not uniform over time and among different
groups of countries. More precisely, while there is strong evidence of the spread of
technology across OECD and other European nations over the period 1970-1986, this process
of technological adoption appears to have been be reversed over the fifteen years following
1986. While within the euro-zone, it was more significant and spread out over a longer period
of time (1970-1997).
The paper is organised as follows. Section 2 lays out the basic framework by providing the
catching-up model and the measures of TFP gaps between countries. Section 3 reports the
empirical results and Section 4 is the conclusion.
2. Production Frontier and Total Factor Productivity Convergence
Since the latter part of the eighties, many empirical studies focusing on international
comparison of Total Factor Productivity (TFP) have shown that differences in technology
may contribute to gaps in TFP levels4. By evaluating the dynamic properties of TFP we can
investigate whether countries are able to catch-up in terms of the highest observed TFP levels
and how income convergence depends on both TFP growth rates and initial TFP levels. In the
same way, we develop a catching-up model based on TFP gaps measured as distances
between national production plans to a production frontier constructed for the OECD
countries.
3 As the analysis is restricted to the case of the main OECD countries, the assumption of technological diffusion appears to be valid since each country in the data set is characterised by rather similar level of “social capabilities” and catch-up potential. 4 See Islam (2001) for a review on different approaches to international comparisons of TFP and the issue of convergence
Page 4 of 17
Editorial Office, Dept of Economics, Warwick University, Coventry CV4 7AL, UK
Submitted Manuscript
123456789101112131415161718192021222324252627282930313233343536373839404142434445464748495051525354555657585960
peer
-005
8228
9, v
ersi
on 1
- 1
Apr 2
011

For Peer Review
4
2.1. TFP catching-up model
Our catching-up model supposes that relative growth rates of productivity in an industry are
determined by specific country catching-up factors. The TFP growth rate of country i at time t
is supposed to be generated by both the lagged technology gap between the desired and
observed level of productivity and the common rate of technical change that shifts the
production frontier simultaneously for all countries:
t
it
dit
iitit gq
qqq +
=−
−
−−
1
11 ln.)ln()ln( λ (1)
where ditq is the desired level of TFP for country i and gt the technical progress at time t. We
can consider that this desired level of TFP may be considered as the leader’s productivity qL,t.
located on the production frontier
According to Abramovitz’s (1986) concept of «social capabilities», countries may differ in
their ability to recognise, incorporate and use available technology. In an attempt to
incorporate this concept in the model at hand, we assume that the speed of the catching-up
process λi is specific to each country5. Obviously, the concept of «social capabilities» may
encompass many economic factors such as the institutional framework, the level of education,
the organisation of firms, international openness, and adjustment costs, so that no single
economic variable may adequately measure countries’ ability to adopt the technology gap. As
suggested by Hultberg et al. (1999), country-specific effects from the production frontier
equation should take into account country heterogeneity due to social capabilities of adopting
available technology.
Equation (1) is rewritten as:
11
1
ln( ) ln( ) .ln itit it i t
Lt
qq q g
qλ −
−−
− = − +
(2)
Finally subtracting equation (2) from equation of productivity dynamics for leading country
L, we obtain:
( )11~ln.)~ln()~ln( −− −=− itiitit qqq λ (3)
where the notation “tilde” indicates a ratio of TFP level in country i to the same variable in
the leading country.
Considering the relationship between long term growth-rates across countries, equation (3)
can be solved to give:
5 In that way, productive inefficiency for each country can be incorporated in our catching-up model (cf. point 2.2).
Page 5 of 17
Editorial Office, Dept of Economics, Warwick University, Coventry CV4 7AL, UK
Submitted Manuscript
123456789101112131415161718192021222324252627282930313233343536373839404142434445464748495051525354555657585960
peer
-005
8228
9, v
ersi
on 1
- 1
Apr 2
011

For Peer Review
5
ii
iiT
q
qq δ=−)~ln(
)~ln()~ln(
0
0 (4)
with ])1(1[ Tii λ−−−=δ .
2.2. TFP growth decomposition
Total Factor Productivity indices are usually used to compare production technologies at the
aggregate level as well as the sector levels. However, these indices measure both technical
and efficiency changes. While technical change shifts the production frontier, the latter
measures the movement of production towards the efficient frontier that can be constructed as
the benchmark for all countries in the sample.
The frontier nature of the production function establishes a link between maximal potential
output quantities and input quantities. This link is able to capture any productive inefficiency
and offers a “benchmarking” perspective. For instance, an economy’s performance can be
evaluated with respect to both its past experience and by the best practice of other countries6.
The production technology of a given sector (manufacturing in this study) is represented by
the production frontier:
),( ,, txgy tiFti = (5)
where Ftiy , is potential output of this sector in country i at time t ( Ii ⋯1= , Tt ⋯1= ), itx is
the k-dimension vector of inputs and t is time.
The effective level of output of country i at time t ( tiy , ) is then supposed to be given by:
itti uit
uFitit etxgeyy ⋅=⋅= ),(, (6)
where tiue , lies in the interval [0 , 1] and measures the efficiency score associated with the
effective level of output ity produced with inputs itx .
Differentiating equation 6 with respect to time then leads to
dt
dug
x
dxg
y
dy itt
it
itx
it
it ++= (7)
6 For a unified discussion of efficiency and productivity from a production frontier approach and its methodological advantages, the reader can consult Fried, Lovell and Schmidt (2008). See also Barros (2008) for advances and applications in this field.
Page 6 of 17
Editorial Office, Dept of Economics, Warwick University, Coventry CV4 7AL, UK
Submitted Manuscript
123456789101112131415161718192021222324252627282930313233343536373839404142434445464748495051525354555657585960
peer
-005
8228
9, v
ersi
on 1
- 1
Apr 2
011

For Peer Review
6
where xg is the elasticity of output with respect to input and tg is the elasticity of output
with respect to time which we assume to be common to all countries.
According to equation (7) production growth includes three distinct components: changes in
input quantities weighted by their respective elasticity ( ( )ititx xdxg ), the shift of the
production frontier over time due to the effect of technical change (tg ) and changes in
productive efficiency ( dtduit ).
Total factor productivity gains ( )qdq are then defined as the amount of output growth not
attributed to the input quantity variations and can be evaluated as the sum of the technical
change effect and of the efficiency change effect:
dt
dug
q
dq itt
it
+=
(8)
With a Cobb-Douglas production frontier specification, equation (6) can be rewritten as:
( ) ( )( )k
1
ln ln K
kit it it
k
y x tα β γ ε=
= + + + ∑ (9)
where ( )′= )()1( ,, Kititit xxx ⋯ and ititit vu +=ε where tiu , is the efficiency effect and tiv , an
usual iid noise process with zero mean and constant variance.
The Time Varying Effect method proposed by Cornwell, Schmidt and Sickles (1990) is then
used to estimate the two components of itε separately. This method allows the inefficiency
component to vary over time by assuming that the efficiency effect itu can be expressed as a
quadratic function of time with country-fixed effects:
(0) (1) (2) 2 it i i iu t tθ θ θ= + + (10)
where )0( iθ is a country-fixed effect, )1( iθ and )2( iθ are the country-specific parameters
measuring efficiency change over time.
Equation (9) added to equation (10) can then be estimated thanks to a generalised within
procedure under the two following constraints ∑ =i
i 0)0(θ and ∑ =i
i 0)1(θ so as to avoid
perfect multi-co-linearity.
Under such a specification, the initial TFP level and its growth rate are estimated as a panel
data model including both a set of national dummies (to control for the inevitable country
heterogeneity due to political and social institutions and to take into account some of
Page 7 of 17
Editorial Office, Dept of Economics, Warwick University, Coventry CV4 7AL, UK
Submitted Manuscript
123456789101112131415161718192021222324252627282930313233343536373839404142434445464748495051525354555657585960
peer
-005
8228
9, v
ersi
on 1
- 1
Apr 2
011

For Peer Review
7
Abramovitz’s ideas of social capabilities) and a set of temporal variables (to control for
technology adoption fluctuations that are specific to each country).
Productive efficiency levels can be computed as maxˆe tit uu
it−=µ (11)
where (0) (1) (2) 2ˆ ˆ ˆˆ it i i iu t tθ θ θ= + + and maxtu is the value of the efficiency effect in the leader
country that is located on the production frontier at time t.
By differentiating equation (10) with respect to time, total factor productivity growth may be
rewritten as a linear function of time adding up technical change and efficiency change
components:
(1) (2) 2i i
it
dqt
qγ θ θ
= + +
(12)
The log of Total Factor Productivity can then be written as:
( ) ( )(0) (1) (2) 2ln +it i i i itq t t vα θ γ θ θ= + + + + (13)
from equation (10), the technological gaps in terms of TFP levels between country i and the
leading country at time T and 0 are measured as follows:
(0) (0) (1) (1) (2) (2) 2ˆ ˆ ˆ ˆ ˆ ˆln( ) ( ) ( ) ( )T T TiT i L i L i Lq T Tθ θ θ θ θ θ= − + − + −ɶ at time T (14a)
and
)ˆˆ()~ln( )0()0(0 0Liiq θθ −= at time 0 (14b)
where )2()1()0( ˆ,ˆ,ˆ
TTT LLL θθθ are estimated coefficients for the leader at time T and )0(
0L̂θ the
logarithmic of the leader’s estimated TFP at time 0.
From equations 4, 14a and 14b, we get iδ and finally an indirect estimate of iλ as:
( ) ( ) ( )( )
0
1/(0) (0) (1) (1) (2) (2) 2
(0) (0)
ˆ ˆ ˆ ˆ ˆ ˆˆ 1 1
ˆ ˆT T T
T
T
L L i L i L
i
i L
T Tθ θ θ θ θ θλ
θ θ
− + − + − = − + −
(15)
A positive speed ( 0ˆ >iλ ) is consistent with the catching-up hypothesis while negative speed
reveals productivity divergence.
Page 8 of 17
Editorial Office, Dept of Economics, Warwick University, Coventry CV4 7AL, UK
Submitted Manuscript
123456789101112131415161718192021222324252627282930313233343536373839404142434445464748495051525354555657585960
peer
-005
8228
9, v
ersi
on 1
- 1
Apr 2
011

For Peer Review
8
3. Empirical results
The sample used in this study consists of annual data from fourteen OECD countries :
Australia (1), Belgium (2), Canada (3), Denmark (4), Finland (5), France (6), Germany (7),
Italy (8), Japan (9), the Netherlands (10), Norway (11), Sweden (12), the United Kingdom
(13) and the United States (14). The data span between 1970-2001 interval was obtained from
the International Sectoral Data Bank (ISDB) and the OECD STAN database for Industrial
Analysis. It comprises added value expressed in international prices (base year 1990) as the
usual proxy for output, labour input measured by total employment and capital stock,
expressed in international prices (base year 1990). We focus on the total manufacturing sector.
Added value is calculated as the difference between production and intermediate inputs and
encompasses labour costs (compensation of employees), consumption of fixed capital, taxes
less subsidies and net operating surplus and mixed income. Labour includes all people
involved in production: entrepreneurs, unpaid family workers of unincorporated units and
home based workers, as well as employees. To gauge productivity levels, labour input for an
industry should be more appropriately measured as the number of hours actually worked
weighted by the relative quality of the various categories of people employed. Unfortunately,
such detailed series are not available at this sector level. Although our reductive measure of
labour does not reflect changes in the quality nor in the average work time per employee,
these effects are implicitly considered in our TFP measures with the country’s specific effects.
In ISDB, capital stock data are used as measures of capital input in the production process,
merging the volume of physical capital assets available in the respective countries. But where
data is missing, estimates have been made using a perpetual inventory model.
3.1. Production frontier regression and TFP growth
The Time Varying Effect method consists in estimating Equation (9) and the two components
of itε thanks to a one step generalised within procedure (cf. 2.2). The results of production
frontier regression under constant returns to scale hypothesis are reported in Table 1. Only
seven out of the thirty six coefficients are non significant at the 5% confidence level. The
output/input elasticities Lβ for labour and Kβ for capital are respectively 0.83 and 0.17.
Thanks to a GMM panel procedure, Hultberg and al. (2004) get an output/capital elasticity of
approximately 0.22, their period being between 1973-1990. Using STAN data base, Harringan
(1999) estimates Kβ over the 1980-1990 period for several detailed manufacturing sectors. His
Page 9 of 17
Editorial Office, Dept of Economics, Warwick University, Coventry CV4 7AL, UK
Submitted Manuscript
123456789101112131415161718192021222324252627282930313233343536373839404142434445464748495051525354555657585960
peer
-005
8228
9, v
ersi
on 1
- 1
Apr 2
011

For Peer Review
9
results vary from 0.71 for the motor vehicles industry to 0.26 for the non electrical machinery
sector. While Harrigan recommends that output elasticities should be estimated
econometrically, Frantzen (2004) prefers to compute TFP levels by imposing an exogenous
given value of these parameters which are approximated by the average revenue shares of
labour and capital across countries. He retains different simulations of Lβ in the interval [0.65,
0.72] on disaggregate manufacturing panel data from STAN over the period 1970-1995. More
recently, using data from STAN on France, the United Kingdom and the United States and
using the same approach as Bernard and Jones (1996a) Khan (2006) computes Lβ as the time-
averaged labour share across all countries rather than using actual labour. Focusing on the
total manufacturing sector, he respectively retained 68% for France and the USA and 76% for
the UK. In the three latter studies implicit assumptions of perfect competition with no
technical as well no allocative inefficiencies are presupposed. Differences between our
output/input elasticity levels and all of these previous results are mainly explained at the same
time by our econometrical panel data procedure allowing productive inefficiency, the number
of countries, the period of observation under study and the degree of details of sector
classification.
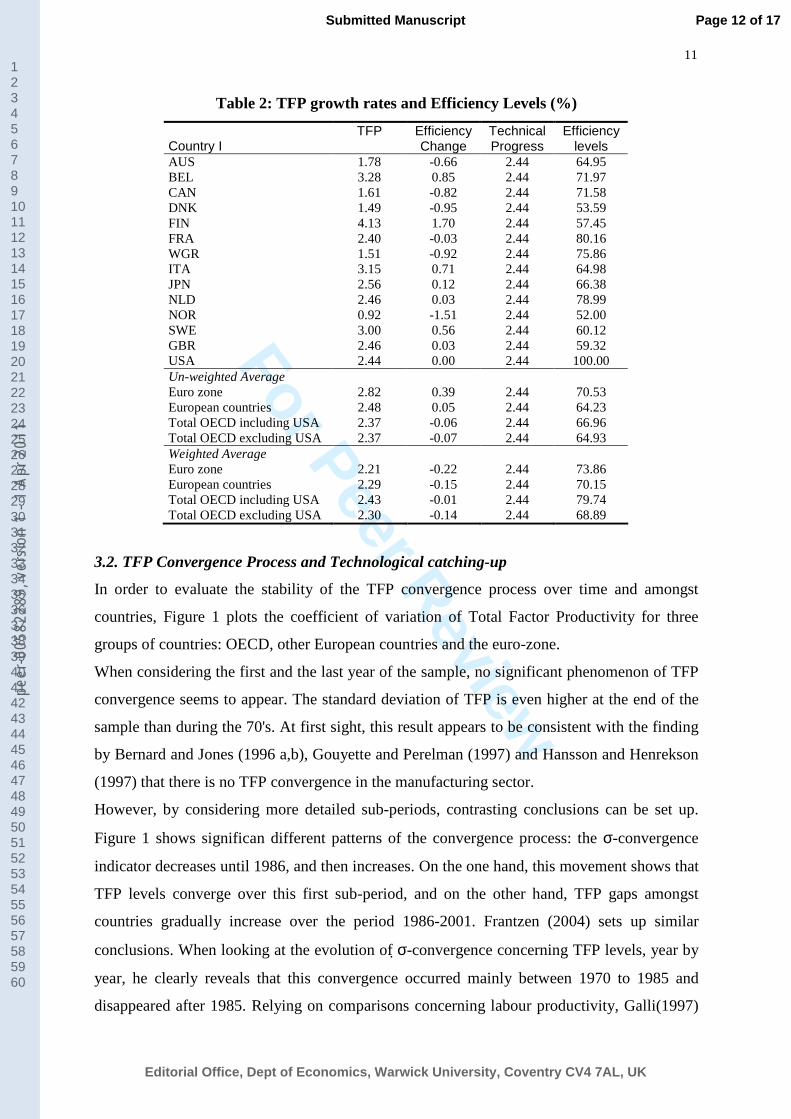
Averages of TFP growth rates estimated with equation (12) for each country and for several
groups of countries are presented in Table 2. On average, TFP growth rates are mainly
explained by the common technical progress component (2.4%). Applying the DEA
methodology and standard Malmquist indices on the same data but covering a shorter period
(1970-1990), Shestalova (2003) found a similar result. She set up that the contribution of
technical progress to TFP growth was about 1.5-2% while the contribution of efficiency
change was modest and even negative in some particular sectors such as the basic metal
industry. Khan (2006) detected quite comparable TFP growth rates for the total manufacturing
industry. Between 1980-2002, time-averaged TFP growth rates were 2.1% for France, 2.7%
for the UK and the USA. Finally, Frantzen (2004) obtained an average annual growth rate of
TFP of approximately around 2.3%.
Finland has the highest growth rate of TFP with an efficiency change close to 1.7% per year.
Within the euro currency zone, five out of six countries (Belgium, Finland, France, Italy and
the Netherlands) achieve a growth rate of TFP exceeding the overall sample average. Based
on the average of individual un-weighted TFPs, this group obtains the best progression.
However, this result is mainly driven by small countries of the overall Euro zone such as
Finland and Belgium. When countries’ TFP average is respectively weighted by size of GDP,
Page 10 of 17
Editorial Office, Dept of Economics, Warwick University, Coventry CV4 7AL, UK
Submitted Manuscript
123456789101112131415161718192021222324252627282930313233343536373839404142434445464748495051525354555657585960
peer
-005
8228
9, v
ersi
on 1
- 1
Apr 2
011

For Peer Review
10
this conclusion is reversed, for example Germany, as the biggest economy of this group,
performs relatively poorly compared to the USA, Japan or the United Kingdom. With similar
data from ISDB based on a shorter period of time (1970-1987), Bernard and Jones (1996a)
also found that Finland and Belgium had a high rate of TFP growth: 3.7% and 5.1%
respectively while West Germany and Norway only achieved 2.4% and 1.7% which are
amongst the smallest performances of the European countries.
With regard to efficiency levels, the euro zone gets the highest average score compared to the
European countries and the OECD group when excluding the USA who are the leader. We
would like to highlight the fact that the United States are the leading country throughout this
period as a number of previous studies concerning cross-country comparisons of TFP levels
for manufacturing in the OECD show. Hultberg and al. (2004) estimate negative efficiencies
(inefficiencies) relative to the United States for all countries and confirm the hypothesis of the
USA as leaders. Harrigan (1997) makes it clear that the USA was either the leader or joint
leader in TFP during the 1980’s in six out of eight manufacturing sectors. Dollar and Wolff
(1993) report TFP for total manufacturing in 1985 using constant wage shares and find that
the USA is the technical leader. From Malmquist indexes using a non parametric approach,
Shestolova (2003) as well Boussemart et al. (2006) conclude that the USA exhibits the highest
level of efficiency in most industries while this country cannot systematically be considered as
the leader.
Table 1: Production Frontier Regressions
Estimated values of the coefficients Country i )0(
iθα + (t-stat) )1(iθγ + (t-stat) )2(
iθ (t-stat)
1 8.24 (19.07) 1.95E-02 (6.21) -5.40E-05 (-0.62) 2 7.99 (18.62) 5.71E-02 (16.13) -7.82E-04 (-9.00) 3 8.43 (19.20) 4.25E-03 (1.35) 3.82E-04 (4.29) 4 8.03 (18.71) 2.75E-02 (8.73) -4.08E-04 (-4.68) 5 7.88 (17.86) 1.45E-02 (4.19) 8.66E-04 (9.75) 6 8.38 (19.22) 2.02E-02 (6.10) 1.25E-04 (1.43) 7 8.41 (19.51) 2.13E-02 (6.89) -1.99E-04 (-2.27) 8 7.95 (18.27) 4.82E-02 (15.06) -5.39E-04 (-6.21) 9 8.09 (19.73) 3.64E-02 (8.83) -3.47E-04 (-3.75) 10 8.27 (18.83) 3.61E-02 (10.55) -3.70E-04 (-4.23) 11 8.16 (18.80) 6.65E-03 (1.73) 8.30E-05 (0.86) 12 8.15 (18.86) -2.88E-03 (-0.98) 1.06E-03 (11.99) 13 8.09 (19.17) 1.63E-02 (4.39) 2.69E-04 (2.91) 14 8.73 (19.57) -5.10E-03 (-1.59) 9.50E-04 (10.85)
Estimated values of the output/input elasticity
β 0.83 (20.59)
Page 11 of 17
Editorial Office, Dept of Economics, Warwick University, Coventry CV4 7AL, UK
Submitted Manuscript
123456789101112131415161718192021222324252627282930313233343536373839404142434445464748495051525354555657585960
peer
-005
8228
9, v
ersi
on 1
- 1
Apr 2
011
For Peer Review
11
Table 2: TFP growth rates and Efficiency Levels (%)
Country I
TFP Efficiency Change
Technical Progress
Efficiency levels
AUS 1.78 -0.66 2.44 64.95 BEL 3.28 0.85 2.44 71.97 CAN 1.61 -0.82 2.44 71.58 DNK 1.49 -0.95 2.44 53.59 FIN 4.13 1.70 2.44 57.45 FRA 2.40 -0.03 2.44 80.16 WGR 1.51 -0.92 2.44 75.86 ITA 3.15 0.71 2.44 64.98 JPN 2.56 0.12 2.44 66.38 NLD 2.46 0.03 2.44 78.99 NOR 0.92 -1.51 2.44 52.00 SWE 3.00 0.56 2.44 60.12 GBR 2.46 0.03 2.44 59.32 USA 2.44 0.00 2.44 100.00 Un-weighted Average Euro zone
2.82
0.39
2.44 70.53
European countries 2.48 0.05 2.44 64.23 Total OECD including USA 2.37 -0.06 2.44 66.96 Total OECD excluding USA 2.37 -0.07 2.44 64.93 Weighted Average Euro zone
2.21
-0.22
2.44 73.86
European countries 2.29 -0.15 2.44 70.15 Total OECD including USA 2.43 -0.01 2.44 79.74 Total OECD excluding USA 2.30 -0.14 2.44 68.89
3.2. TFP Convergence Process and Technological catching-up
In order to evaluate the stability of the TFP convergence process over time and amongst
countries, Figure 1 plots the coefficient of variation of Total Factor Productivity for three
groups of countries: OECD, other European countries and the euro-zone.
When considering the first and the last year of the sample, no significant phenomenon of TFP
convergence seems to appear. The standard deviation of TFP is even higher at the end of the
sample than during the 70's. At first sight, this result appears to be consistent with the finding
by Bernard and Jones (1996 a,b), Gouyette and Perelman (1997) and Hansson and Henrekson
(1997) that there is no TFP convergence in the manufacturing sector.
However, by considering more detailed sub-periods, contrasting conclusions can be set up.
Figure 1 shows significan different patterns of the convergence process: the σ-convergence
indicator decreases until 1986, and then increases. On the one hand, this movement shows that
TFP levels converge over this first sub-period, and on the other hand, TFP gaps amongst
countries gradually increase over the period 1986-2001. Frantzen (2004) sets up similar
conclusions. When looking at the evolution of σ-convergence concerning TFP levels, year by
year, he clearly reveals that this convergence occurred mainly between 1970 to 1985 and
disappeared after 1985. Relying on comparisons concerning labour productivity, Galli(1997)
Page 12 of 17
Editorial Office, Dept of Economics, Warwick University, Coventry CV4 7AL, UK
Submitted Manuscript
123456789101112131415161718192021222324252627282930313233343536373839404142434445464748495051525354555657585960
peer
-005
8228
9, v
ersi
on 1
- 1
Apr 2
011

For Peer Review
12
also finds that from the 1960’s until the 1970’s the European countries were strongly
converging while in the 1990’s they diverged in all sectors. Notice that the patterns of our σ-
convergence indicators are rather similar for the first two country groups, i.e. OECD countries
and other European countries although the TFP levels within the latter group seem to be
slightly more homogenous. However, a particular process can be seen for the countries in the
the euro zone. The differentials of productivity between the latter nations strongly decreased
until 1997 although since 1998, a phenomenon of divergence has reappeared without however
finding standard deviations as high as those noted for the two previous groups. On the whole,
these results lead us to conclude that TFP convergence is rather a cyclical process requiring
recurrent re-assessment.
Figure 1: Coefficient of variation of Total Factor Productivity
(standard deviation/average, Levels of TFP in logarithm)
0.005
0.01
0.015
0.02
0.025
0.03
0.035
0.04
1970
1971
1972
1973
1974
1975
1976
1977
1978
1979
1980
1981
1982
1983
1984
1985
1986
1987
1988
1989
1990
1991
1992
1993
1994
1995
1996
1997
1998
1999
2000
2001
Total OECD
European countries
Euro Zone
Due to the changing patterns in the TFP convergence process observed on Figure 1, the speed
parameter of catching-up towards the technical benchmark given by the performance of the
American leader is calculated with equation (15) for the sub-periods between 1970-1986 and
1986-2001 As the United-States appears to be the leader over the whole period, the
coefficients )(ˆ k
Ltθ in equation (15) are such that
)()( ˆˆ kUSA
kLt
θθ = 2,1,0=∀k and Tt ,0=∀ .
Page 13 of 17
Editorial Office, Dept of Economics, Warwick University, Coventry CV4 7AL, UK
Submitted Manuscript
123456789101112131415161718192021222324252627282930313233343536373839404142434445464748495051525354555657585960
peer
-005
8228
9, v
ersi
on 1
- 1
Apr 2
011

For Peer Review
13
Empirical results concerning the catching-up parameters are reported in Table 3 and add
support to the σ-convergence indicator analysis. During the period 1970-1986, positive and
significant speed is estimated for nearly all countries, suggesting that a catching-up process
was in progress and that technical diffusion was taking place across countries over this period.
The highest speeds were obtained for Belgium, the Netherlands and Italy. All things being
equal, the greater the gap in levels of technical efficiency between the USA and several other
countries in the manufacturing industry, the faster the rate of TFP growth in this country. As
our model does not incorporate any exogenous variables such as measure of R&D or measure
of international trade openness, it is not possible to conclude that this finding is consistent
with both the endogenous growth literature and the micro-econometric literature on R&D and
productivity. However, consistent with the predictions of the theory and empirical results
presented by authors such as Cameron et al. (2005), the further an industry lies behind the
technological frontier, the higher its rate of TFP growth.
Table 3: Average Speed of catching-up by period and by country (annual rate)
1970-1986 1986-2001 1970-2001
Countries λ∗ t value∗ λ∗ t value∗ λ∗ t value∗ AUS 0.020 4.267 -0.043 -10.024 -0.011 -6.076BEL 0.082 15.515 -0.054 -6.783 0.014 6.404CAN 0.001 0.129 -0.042 -8.496 -0.020 -7.008DNK 0.018 5.403 -0.041 -13.790 -0.011 -8.800FIN 0.026 9.201 0.040 6.925 0.031 12.171FRA 0.050 6.127 -0.053 -5.689 -0.001 -0.306WGR 0.032 3.830 -0.077 -9.923 -0.021 -7.753ITA 0.056 14.451 -0.033 -6.469 0.011 6.732JPN 0.045 10.617 -0.041 -7.278 0.002 0.965NLD 0.075 9.320 -0.078 -8.127 0.001 0.259NOR -0.004 -0.955 -0.036 -14.469 -0.020 -12.335SWE 0.007 1.939 0.016 3.376 0.011 5.196GBR 0.019 5.286 -0.017 -4.675 0.000 0.260USA Leader Leader Leader
Average Speed calculated from un-weighted TFPs
Euro Zone 0.053 -0.042 0.006 European countries 0.036 -0.033 0.002
Total OECD including USA 0.033 -0.035 -0.001 Average Speed calculated
from weighted TFPs Euro Zone 0.047 -0.056 -0.006
European countries 0.039 -0.044 -0.002 Total OECD excluding USA 0.037 -0.036 0.000
* We computed the values and estimated covariance matrix for a non linear function of the parameters (cf. equation 15) estimated by the generalised within procedure mentioned in page 6. This delta method linearizes the nonlinear functions around the estimated parameter
values and then uses the standard formulas for the variance and covariance of linear functions of random variables.
Page 14 of 17
Editorial Office, Dept of Economics, Warwick University, Coventry CV4 7AL, UK
Submitted Manuscript
123456789101112131415161718192021222324252627282930313233343536373839404142434445464748495051525354555657585960
peer
-005
8228
9, v
ersi
on 1
- 1
Apr 2
011

For Peer Review
14
This supports the studies by Dollar and Wolff (1988), Miller-Upadhyay (2002) or Hulberg
and al. (2004) that the manufacturing industry shows strong catch-up rates of TFP levels.
Comparing France and the UK to the USA for 14 manufacturing industries, Khan (2006) also
finds that sectors further behind the production frontier exhibit higher productivity growth.
As total factor productivity is the closest measure of technology, TFP convergence during the
period 1970-1986 gives some clues about the characteristics of the technological catching-up
process. Moreover, as income convergence can be the joint outcome of the twin processes of
capital deepening and technological catch-up (Islam, 2003), our previous result suggests that
the income convergence result frequently reported in the literature may be partly explained by
the narrowing of TFP gaps until the mid eighties.
In contrast, the estimated speed turns out to be negative and significant during the period
1986-2001, for all countries with the exception of Sweden and Finland. This result is also
largely consistent with the pattern of the σ-convergence indicator over this period. The same
results are obtained with average speed for both OECD, European and euro-zone country
groups The evidence showing that TFP catching-up in the manufacturing sector was in
progress throughout the period 1970-1986 while TFP divergence occured during the period
1987-2001 is clearly in opposition with the finding by Bernard and Jones (1996 a) and
Dowrick and Duc-Tho Nguyen (1989) that there is no catching-up effect in the manufacturing
sector during the sub-period studied. Decomposing the initial period and evaluating the
catching-up by using a parametric stochastic production frontier allows us to show that a
catching-up reversal appears in the manufacturing sector in the midst 1980s. Moreover while
simple labour productivity indicators (such as added value per hour worked) reveal that all
countries caught up with the USA in terms of labour productivity up to the mid 1970s, our
TFP measure shows that the catching-up process worked until the mid 1980s.
It is difficult to provide an explanation as to why manufacturing industries have behaved so
differently with respect to patterns of productivity catching-up. This result may be partly due
to the rise of manufacturing GDP growth in the United-States, which was substantially higher
between 1987 and 2001 than it was in the previous sub-period between 1970-1986. In contrast
to the rapid growth in the United-States, GDP increased at a slower rate than it had done
previously in other OECD countries (cf. table 4). Further possible explanations of this TFP
catching-up reversal are linked to processes that would contribute to (or abstract from) any
tendency towards convergence if for example, capital or labour mobility was particularly high
in the United-States and not in other countries. Other factors that are likely to have an impact
on convergence include the use of the ‘best practice’ technology. Following Galli (1997), one
Page 15 of 17
Editorial Office, Dept of Economics, Warwick University, Coventry CV4 7AL, UK
Submitted Manuscript
123456789101112131415161718192021222324252627282930313233343536373839404142434445464748495051525354555657585960
peer
-005
8228
9, v
ersi
on 1
- 1
Apr 2
011

For Peer Review
15
can interpret the switch from convergence to divergence as a consequence of a deep-seated
technological change driven by information technology affecting all industrial sectors and
services over the last two decades. It is well known that the Unites States has consistently had
an above average propensity to innovate in the past and especially since the eighties. Thus it is
probable that the United-States has raised and maintained its technological lead irrespective of
any impact that diffusion may have had, and this would alter the process of the TFP gap
narrowing. As a result, divergence began to occur when the USA started to implement this
new technical paradigm while the other OECD countries still using the previous technology
were not able to adopt it at the same time.
Table 4: Annual GDP growth rate for manufacturing industry (%)
1970-1986 1987-2001
Euro zone 2.07 1.33
European countries 1.58 1.38
Total OECD excluding USA 2.27 1.55
USA 1.75 4.43
4. Conclusion
This paper has used an original testing procedure to re-examine the stability of the TFP
catching-up hypothesis in the manufacturing sector across OECD, European and euro-zone
countries over a period of thirty years. Empirical results suggest that contrary to previous
conclusions put forth by authors such as Bernard and Jones (1996), Gouyette and Perelman
(1997) and Hansson and Henrekson (1997), there was a significant movement towards TFP
catching-up during the period 1970-1986 for OECD and European countries. These catching-
up patterns were reversed during the period 1987-2001. This result may indicate that while
structural factors such as the capability to use the "best-practice technology" certainly
constitute one of the main determinants of productivity growth, the characteristics of the
technological catching-up process may be unstable over time.
Page 16 of 17
Editorial Office, Dept of Economics, Warwick University, Coventry CV4 7AL, UK
Submitted Manuscript
123456789101112131415161718192021222324252627282930313233343536373839404142434445464748495051525354555657585960
peer
-005
8228
9, v
ersi
on 1
- 1
Apr 2
011

For Peer Review
16
References
Abramovitz, M., 1986. Catching-up; Forging Ahead, and Falling Behind. Journal of
Economic History, Vol. 46, n° 2, pp. 385-406.
Barros, C.P., 2008. Efficiency Analysis of Hydroelectric Generating Plants: A Case Study for
Portugal. Energy Economics, 30, 59-75.
Bernard, A.B., Jones, C.I., 1996a. Comparing apples to oranges: productivity convergence
and measurement across industries and countries. American Economic Review 86(5): 1216-
1238.
Bernard, A.B., Jones, C.I., 1996b. Productivity across industries and countries: Time series
theory and evidence. Review of Economics and Statistics 78: 135-146
Boussemart J.P., Briec W., Cadoret I., Tavera C., 2006. A re-examination of the technological
catching-up hypothesis across OECD industries. Economic Modelling, 23: 967–977
Cameron G., Proudman J., Redding S., 2005. Technological convergence, R&D, trade and
productivity growth. European Economic Review 49: 775-807.
Cornwell C., Schmidt P., Sickles R.C., 1990. Production Frontier with Cross-Sectional and
Time-Series Variation in Efficiency Levels ”, Journal of Econometrics 46: 185-200.
Dollar D, Wolff E.N., 1988. Convergence of industry labor productivity among advanced
economies, 1963–1982. Review of Economics and Statistics 70:549–558
Dollar D.,Wolff E.N., 1993. Competitiveness, Convergence, and International Specialization.
MIT Press, Cambridge, MA.
Dowrick, S., Nguyen D. T., 1989. OECD comparative economic growth 1950-1985: catch-up
and convergence. American Economic Review, 79/5: 1010-1030.
Frantzen D., 2004. Technological Diffusion and Productivity Convergence: A study for
Manufacturing in the OECD. Southern Economic Journal, 71: 352-376
Fried H.O, Lovell C.A.K. and Schmidt S.S., 2008 - The Measurement of Productive
Efficiency, Oxford University Press, 656 p.
Galli R., 1997. Is There Long Run Industrial Convergence in Europe ? International Review
of Applied Economics, 11/3: 333-368.
Gouyette, C., Perelman, S., 1997. Productivity convergence in OECD services industries.
Structural Change and Economic Dynamics, 8: 279-295.
Page 17 of 17
Editorial Office, Dept of Economics, Warwick University, Coventry CV4 7AL, UK
Submitted Manuscript
123456789101112131415161718192021222324252627282930313233343536373839404142434445464748495051525354555657585960
peer
-005
8228
9, v
ersi
on 1
- 1
Apr 2
011

For Peer Review
17
Hansson, P., Henrekson, M., 1997. Catching-up, social capability, government size and
economic growth, in V. Bergström, eds, Government and Growth, Oxford: Clarendon
Press, 61-126.
Harringan J., 1997. Cross-Country Comparisons of Industry Total Factor Productivity:
Theory and Evidence, Federal Reserve Bank of New York, Research Paper n° 9734, 26 p.
Harringan; J., 1999. Estimation of cross-country differences in industry production functions,
Journal of International Economics, 47: 267-293
Hultberg, P.T., Nadiri, M.I., Sickles, R.C., 1999. An international comparison of technology
adoption and efficiency: a dynamic panel model. Annales d’Economie et de Statistique 55–
56, 449–473.
Hultberg, P.T., Nadiri, M.I., Sickles, R.C., 2004 Cross-country catch-up in the manufacturing
sector: Impacts of heterogeneity on convergence and technology adoption, Empirical
Economics, 29: 753-768.
Islam, N. (2001). Different approaches to international comparison of total factor
productivity. In Hulten, C.R., Dean, E.R. and Harper, M.J (eds), New Developments in
Productivity Analysis. University of Chicago Press, Chicago, 465-502.
Islam, N. 2003. What have we learnt from the convergence debate ? Journal of Economic
Surveys, 17/3: 309-362.
Khan, T.S., 2006. Productivity Growth, Technological Convergence, R&D, Trade, and Labor
Markets: Evidence from the French Manufacturing Sector. IMF Working Paper,
WP/06/230.
Miller S.M., Upadhyay M.P., 2002. Total factor productivity and the convergence hypothesis.
Journal of Macroeconomics, 24: 267-286.
Shestalova V., 2003. Sequential Malmquist Indices of Productivity Growth: An Application
to OECD Industrial Activities. Journal of Productivity Analysis, 19: 211-226.
Page 18 of 17
Editorial Office, Dept of Economics, Warwick University, Coventry CV4 7AL, UK
Submitted Manuscript
123456789101112131415161718192021222324252627282930313233343536373839404142434445464748495051525354555657585960
peer
-005
8228
9, v
ersi
on 1
- 1
Apr 2
011