


Money Never Sleeps Presentation to the Government Investment Officers Association
David Hendler
Head of U.S. Financial Services

2
CreditSights - Fundamental Research
Topical, Strategic, Sector and Company credit research on unsecured bonds, secured bonds, CDS, loans, hybrid securities, and select equities of the major companies in the U.S. and Europe. A newly established research team in Asia is expanding our research coverage in the Asia-Pacific region.
Benefits Independence/Investor pays model
Timely
Quality of research
Unique insight
Focus/Time
Third party verification
Cost

3
CreditSights - Coverage
75 analysts covering 40 industries across 7 broadly defined sectors, plus U.S., European & Asian Credit Strategy
700 companies in core coverage, 1,400 companies with written research
US 495 Companies
European/Asian 205 Companies
High Grade 459 Companies
High Yield 241 Companies
55 Industry Outlooks to be published in early 2011

4
CreditSights - Customers
950 Institutions and 6,000 people
Mutual Funds
Insurance Companies
Investment Advisors
Hedge Funds
Dealers/Banks
Pension Funds
Government Sponsored Entities
Government Regulators
Corporations

5
Policy Time Table Update: 2011
• Financial Stability and Bank Capital Regime> Dodd-Frank Wall Street Reform/Consumer Protection Act (July ’10)
Regulatory interpretations and studies Phase-ins and follow-up regs Fed’s SCAP-2 for dividends & buybacks
> BIS III and IMF Global Financial Stability Study (August ’10) New/higher capital standards/global coordination Loss absorbency regime – write-downs/conversions/bail-ins Huge global infrastructure overlay on top of market mechanisms
• U.S. Mortgage Market Dynamics> Reforming America’s Housing Finance Market (February ‘11)
GSEs est. losses from $200B to $400B Enhanced HAMP released by Obama Administration (March ‘10) Proposed Global Servicing Settlement (Fed and State AGs)
Questions on legality/fairness/loss distribution between 1st and 2nd liens ($20B?)
Republican pushback in favor of banks

6
Dodd-Frank Wall Street Reform & Consumer Protection Act
• Revamps Twin Engines of Financial Growth Over Last 30 Years> Consumer lending business> Capital markets & financial innovation/engineering
• Restricts 3Ls: Leverage, Level 2s, Level 3s• Protects consumer borrower rights • Protects tax payers/gov’t interests, prohibits TBTF funding• Unleashes host of potential unintended consequences
> Restrictive economic/loan impacts> Credit reallocation amongst consumer/commercial spheres> Securitization market impacts> Restricts U.S. financial services global competitiveness> Banks Adaptation/Repositioning
• Congressional Republican pushback across various rulings

7
Dodd-Frank Act Deficiencies
• Credit underwriting: under emphasized, over reliance on capital/liquidity protections
• Automated credit scoring: esp. FICO scores as contributing factor to poor credit underwriting procedures
• Risk management: still needs to be empowered, improvement of credit procedures
• Public-Private Partnership: no formalized forum to debate boundaries of risk & return

8
Key Provision Comments
Fin. Stability Oversight Council (FSOC) Monitors systemic trends; sets stricter capital/liquidity rules
Orderly Liquidation AuthorityFDIC unw inds failing BHC/NBFCs*; Tsy absorbs upfront costs; after-the-fact assessment on BHCs >$50 B, other NBFCs
Consumer Financial Protection Bureau w ithin Fed: ow n budget and director
Proprietary Trading (Volcker Rule) Phase-in prop. trading ban; carve-out: 3% of capital in PE or HF
Derivatives Activities (Lincoln Amend.)IR sw aps and some CDS remain in bank; energy, metals, and ag. commodities move to sep. cap. aff iliates
Capital Regime (Collins Amend.) Tier 1 cap: phase-out Trups over 3 years, beginning in 2013
Banking Regulators OCC oversees savings banks; OTS activities eliminated
Securitizations 5% risk retention; carve-outs for low -risk mortgages
Debit Interchange (Durbin Amend.) Fed sets "reasonable/proportional" debit fees, proposed $0.12 cap
Dodd-Frank Act – Highlights
Source: U.S. government, CreditSights*NBFCs = Non-Bank Financial Companies
9
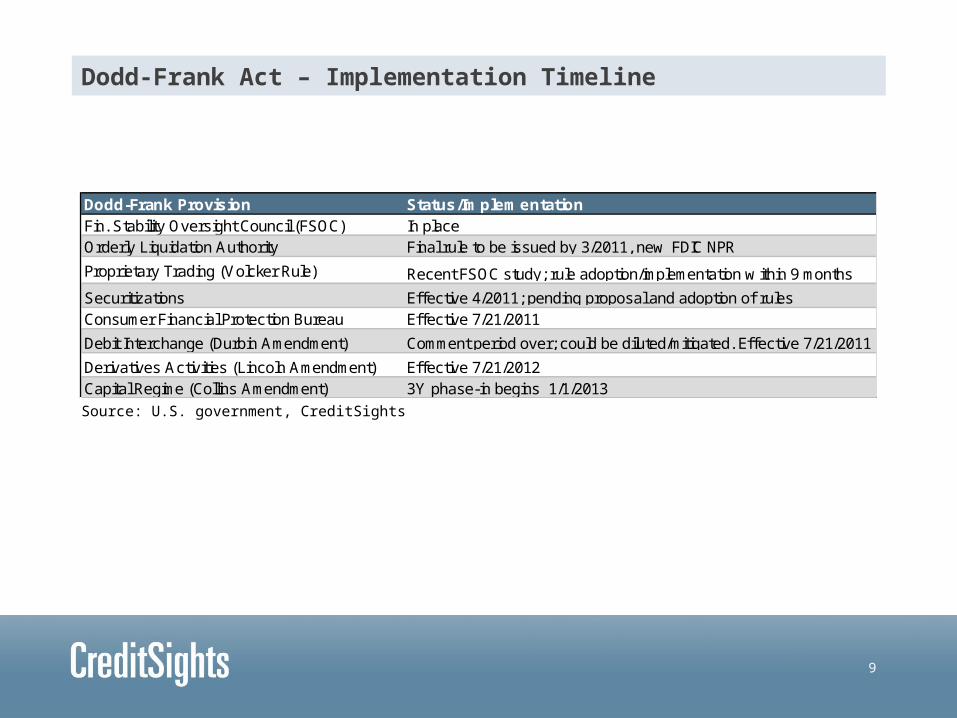
Dodd-Frank Act – Implementation Timeline
Source: U.S. government, CreditSights
Dodd-Frank Provision Status/ImplementationFin. Stability Oversight Council (FSOC) In placeOrderly Liquidation Authority Final rule to be issued by 3/2011, new FDIC NPR
Proprietary Trading (Volcker Rule) Recent FSOC study; rule adoption/implementation w ithin 9 months
Securitizations Effective 4/2011; pending proposal and adoption of rulesConsumer Financial Protection Bureau Effective 7/21/2011
Debit Interchange (Durbin Amendment) Comment period over; could be diluted/mitigated. Effective 7/21/2011
Derivatives Activities (Lincoln Amendment) Effective 7/21/2012Capital Regime (Collins Amendment) 3Y phase-in begins 1/1/2013

10
BIS III Capital StandardsCommon Equity Tier 1 Capital Total Capital
Minimum 4.5% 6.0% 8.0%Conservation Buffer 2.5% 2.5% 2.5%Minimum + Buffer 7.0% 8.5% 10.5%Countercyclical Buffer TBD TBD TBD
BIS III Capital Standards
Source: Basel Committee on Banking Supervision, CreditSights

11
BIS III Phase-in Schedule
Source: Company reports, CreditSights*Range of 0% - 2.5%. Consists of common equity or other fully loss absorbing capital, to be implemented on adiscretionary basis by local regulators when deemed that excess credit growth is resulting in a system-wide build-up of risk** Instruments that no longer qualify as non-common Tier 1 or Tier 2 capital will be phased out over a 10 year period, 1/1/13Cons. = conservation
BIS III - Phase-in Schedule2011 2012 2013 2014 2015 2016 2017 2018 2019
Min. Tier 1 Common - - 3.50% 4.00% 4.50% 4.50% 4.50% 4.50% 4.50%Conservation Buffer - - - - - 0.625% 1.25% 1.875% 2.50%Min. Tier 1 Common + Cons. Buffer - - 3.50% 4.00% 4.50% 5.125% 5.75% 6.375% 7.00%Min. Tier 1 Capital - - 4.50% 5.50% 6.00% 6.00% 6.00% 6.00% 6.00%Min. Tier 1 Capital + Cons. Buffer - - 4.50% 5.50% 6.00% 6.625% 7.25% 7.875% 8.50%Min. Total Capital - - 8.00% 8.00% 8.00% 8.00% 8.00% 8.00% 8.00%Min. Total Capital + Cons. Buffer - - 8.00% 8.00% 8.00% 8.625% 9.25% 9.875% 10.50%Countercyclical Buffer* - -Deductions from Tier 1 Common - - - 20.00% 40.00% 60.00% 80.00% 100.00% 100.00%Recognition of capital instruments** - - 90.00% 80.00% 70.00% 60.00% 50.00% 40.00% 30.00%
Leverage ratioFinal
Adjust.Liquidity coverage ratioNet stable funding ratio Observation Period Minimum Standard
Supervisory Monitoring
Parallel run Disclosure starts Jan 1st, 2015
Pillar 1 migration
Observation Period Minimum Standard
12
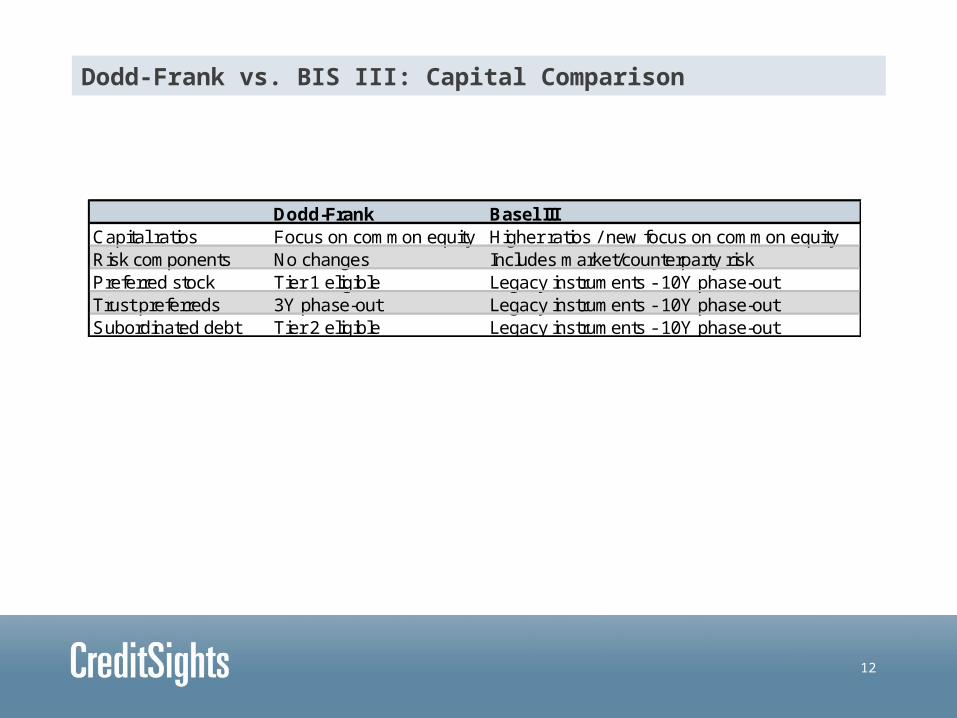
Dodd-Frank Basel IIICapital ratios Focus on common equity Higher ratios / new focus on common equityRisk components No changes Includes market/counterparty riskPreferred stock Tier 1 eligible Legacy instruments - 10Y phase-outTrust preferreds 3Y phase-out Legacy instruments - 10Y phase-outSubordinated debt Tier 2 eligible Legacy instruments - 10Y phase-out
Dodd-Frank vs. BIS III: Capital Comparison

13
0%
10%
20%
30%
40%
50%
60%G
S
MS
NT
RS
BK
ST
T C
BA
C
JP
M
KE
Y
RF
PN
C
FH
N
US
B
CO
F
CM
A
MI
ST
I
ZIO
N
WF
C
AX
P
FIT
B
HB
AN
BB
T
MT
B
U.S. Banks: Liquid Asset Ratio
Source: FFIEC, SNL, CreditSightsAs of 4Q10. Green = Strong, Orange = Borderline, Red = Weak. Bar represents median = 18%Liquid asset ratio: (cash & equivalents + securities + Fed funds & repos + trading account – pledged securities) / total assets

14
Orderly Liquidation Authority: Hope or Hostage?
• Key Takeaway: taxpayer bailout prohibited; capital structure vulnerable
• BIS proposals differ as public monies still available, broader loss sharing to subordinated debt, possibly to senior debt
• Harmonizing global regulation – BIS 3 gravitating to Dodd-Frank
• Investment bank "bail-in" plans now part of BIS proposals
• Market Discipline: priority of claims, bridge banks, loss assessments
15
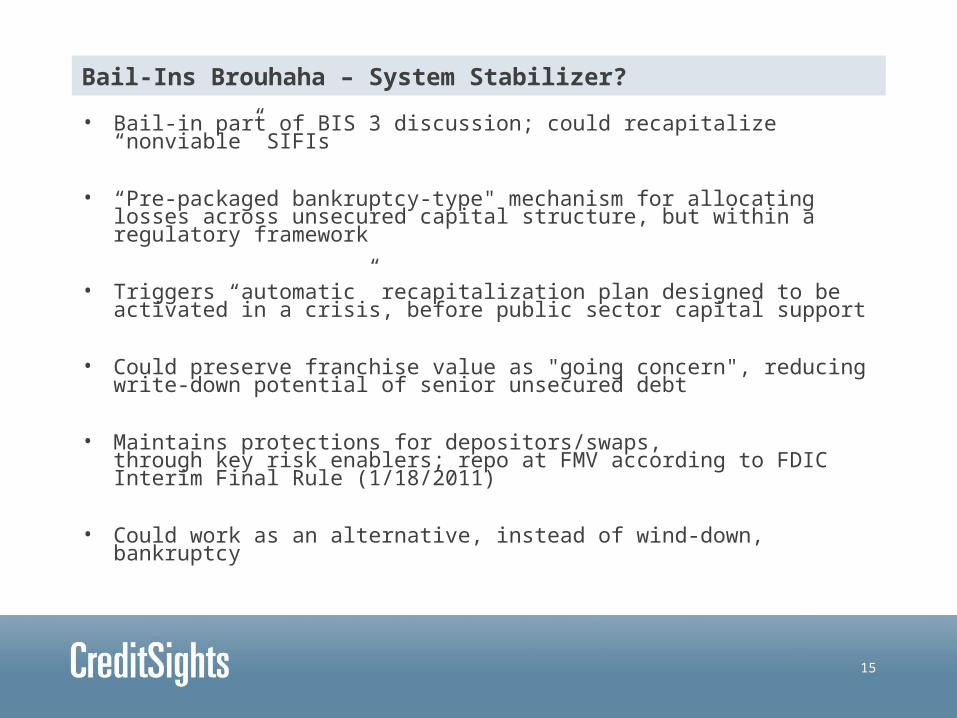
• Bail-in part of BIS 3 discussion; could recapitalize “nonviable” SIFIs
• “Pre-packaged bankruptcy-type" mechanism for allocating losses across unsecured capital structure, but within a regulatory framework
• Triggers “automatic” recapitalization plan designed to be activated in a crisis, before public sector capital support
• Could preserve franchise value as "going concern", reducing write-down potential of senior unsecured debt
• Maintains protections for depositors/swaps, through key risk enablers; repo at FMV according to FDIC Interim Final Rule (1/18/2011)
• Could work as an alternative, instead of wind-down, bankruptcy
Bail-Ins Brouhaha – System Stabilizer?

16
Bail-Ins Brouhaha – System Stabilizer?
For Regulators: Enforces market
discipline with capital structure at risk of
loss upfront; minimizes systemic
risk and political fallout
For Banks: Maintains access
to regulatory capital which has been stymied by credit crisis and
investor confusion on bank
resolutions; could increase cost of
capital
For Investors: More transparent and uniform structures and bond covenants and
triggers; still may raise return hurdles and/or
exclude participation by traditional fixed income
investors - the regulatory desired
investor class
For Investment Bankers: Innovative compromise
solution; preserves largest sector for debt deal flow from global financial institutions;
major underwriting fee revenues driver and could enhance fee potential for
some instruments and overall

17
$0
$5
$10
$15
$20
$25
$30
$35
BACJP
MW
FC C GS
MS
USBPNC
STICO
FBBT
BKFIT
BRF
KEYM
TBSTT
CMANTRS
HBANZIO
N MI
FHN
Contingent Capital Notes – Potential Issuance
Source: SNL, CreditSightsRepresents 2% of risk weighted-assetsAs of 4Q10. In $ billions.

18
Ratings Agencies: Proposed Changes
Source: S&P, Moody’s, CreditSights
• S&P
Places greater emphasis on country, economics, and industry risk
Individual company analysis increases importance of capital/funding
Earnings de-emphasized
Short-term debt: brokers more vulnerable to downgrade to A2
• Moody’s
Reassesses government willingness and capacity for support
Higher likelihood of govt. sharing bailout cost with debt holders
Focused mainly on the ratings impact to bank subordinated debt
Possible negative impact to acquirers of distressed banks

19
Mega-Trends: Banks
Higher operating leverage
- Cards: Convenience vs. Credit
- Basic Capital Markets/Transactions Services
- “Nuts & Bolts Banking” vs. “Casino Royale”
High margin products- C&I Lending (small/middle/large)
- CRE Lending
- Affluent Customers
- Pre-paid cards for non-prime
- Overseas Ops.

20
Mega-Trends: Possible Winners & Divestors
Bank of America
Citigroup
DIVESTORS
Bank of America
Citigroup
JPMorgan
Goldman Sachs
Morgan Stanley
ADAPTORS
FAVORS
Wells Fargo
Bigger Regional Banks
Citigroup
Processor Banks
Asset Managers
21
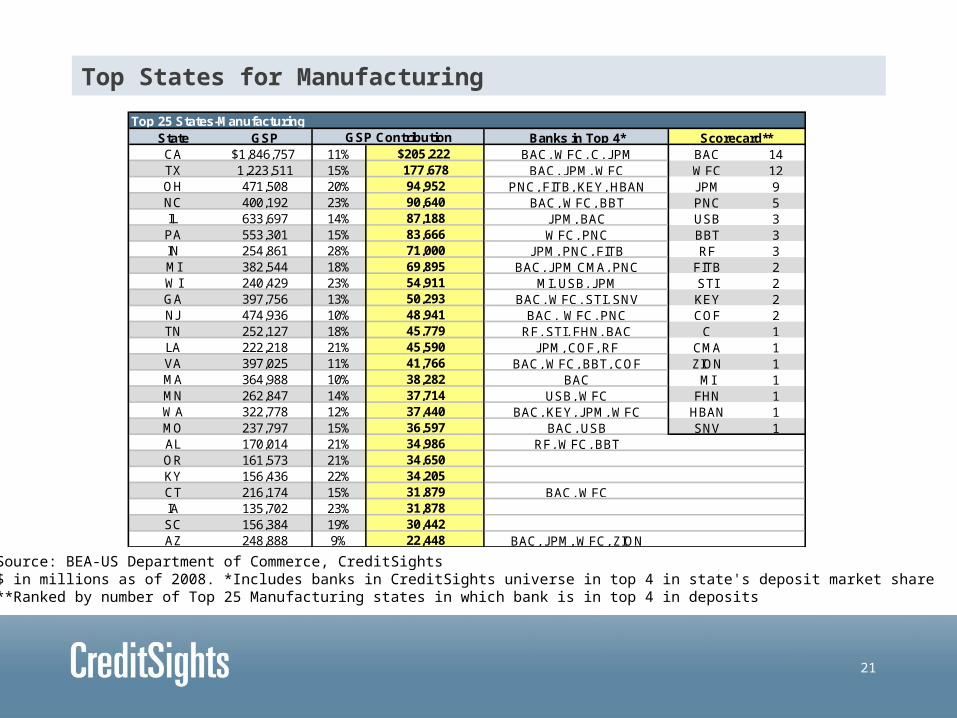
State GSP Banks in Top 4* Scorecard**CA $1,846,757 11% $205,222 BAC, WFC, C, JPM BAC 14TX 1,223,511 15% 177,678 BAC, JPM, WFC WFC 12OH 471,508 20% 94,952 PNC, FITB, KEY, HBAN JPM 9NC 400,192 23% 90,640 BAC, WFC, BBT PNC 5IL 633,697 14% 87,188 JPM, BAC USB 3PA 553,301 15% 83,666 WFC, PNC BBT 3IN 254,861 28% 71,000 JPM, PNC, FITB RF 3MI 382,544 18% 69,895 BAC, JPM CMA, PNC FITB 2WI 240,429 23% 54,911 MI, USB, JPM STI 2GA 397,756 13% 50,293 BAC, WFC, STI, SNV KEY 2NJ 474,936 10% 48,941 BAC, WFC, PNC COF 2TN 252,127 18% 45,779 RF, STI, FHN, BAC C 1LA 222,218 21% 45,590 JPM, COF, RF CMA 1VA 397,025 11% 41,766 BAC, WFC, BBT, COF ZION 1MA 364,988 10% 38,282 BAC MI 1MN 262,847 14% 37,714 USB, WFC FHN 1WA 322,778 12% 37,440 BAC, KEY, JPM, WFC HBAN 1MO 237,797 15% 36,597 BAC, USB SNV 1AL 170,014 21% 34,986 RF, WFC, BBTOR 161,573 21% 34,650KY 156,436 22% 34,205CT 216,174 15% 31,879 BAC, WFCIA 135,702 23% 31,878SC 156,384 19% 30,442AZ 248,888 9% 22,448 BAC, JPM, WFC, ZION
Top 25 States-ManufacturingGSP Contribution
Top States for Manufacturing
Source: BEA-US Department of Commerce, CreditSights$ in millions as of 2008. *Includes banks in CreditSights universe in top 4 in state's deposit market share**Ranked by number of Top 25 Manufacturing states in which bank is in top 4 in deposits

22
GSE Reform: U.S. Treasury Proposals
• Government and GSE role in housing finance likely to lessen, more private sector involvement
• Three Proposals:> Option 1: Limited govt role, privatized system of housing finance
> Option 2: Govt backstop, privatized system of housing finance
> Option 3: Govt reinsurance for MBS, privatized housing finance
• More discussion in 2011, probably punted to next Administration

23
Mortgage Mods: Response vs. Reality
• eHAMP> Obama program provides relief to indebted homeowners> Target of 7-8 million modifications> To date, 1.4 million trial modifications, 500K permanent modifications
• Potential Federal Regulators and State AGs Settlement> Force servicers to offer principal reductions if LTV>100%, subject to NPV test> May levy fines against infractions, fund programs to avoid foreclosures, etc.> Settlement costs could add up to $20B> GOP pushback against government strong arm tactics> Possible proportionate write-downs of 2nd liens
• Bank Initiated> More inclined to extend terms rather than principal reductions> Driven mostly by NPV tests

24
Reps & Warranties Risks: Estimated Capital Impact (BIS III)
Source: Company reports, CreditSightsIn $ millions. As of 3Q10. Assumes tax rate of 35%, and loss rate of 50% for first liens, 100% for second liens.
Bank of America: Estimated Tier 1 Common - 4Q12
2% 4% 6% 8% 10% 12%10% 8.8% 8.8% 8.7% 8.7% 8.7% 8.7%15% 8.8% 8.7% 8.7% 8.7% 8.6% 8.6%20% 8.8% 8.7% 8.7% 8.6% 8.6% 8.5%25% 8.7% 8.7% 8.6% 8.6% 8.5% 8.5%30% 8.7% 8.7% 8.6% 8.5% 8.5% 8.4%35% 8.7% 8.6% 8.6% 8.5% 8.4% 8.3%40% 8.7% 8.6% 8.5% 8.4% 8.3% 8.2%45% 8.7% 8.6% 8.5% 8.4% 8.3% 8.2%50% 8.7% 8.6% 8.5% 8.3% 8.2% 8.1%
Repurchase Requests as % of Remaining Loans
Acc
epta
nce
Rat
e
JPMorgan: Estimated Basel III Tier 1 Common - 4Q12
2% 4% 6% 8% 10% 12%10% 11.8% 11.7% 11.7% 11.7% 11.7% 11.7%15% 11.8% 11.7% 11.7% 11.7% 11.6% 11.6%20% 11.7% 11.7% 11.7% 11.6% 11.6% 11.5%25% 11.7% 11.7% 11.6% 11.6% 11.5% 11.5%30% 11.7% 11.7% 11.6% 11.5% 11.5% 11.4%35% 11.7% 11.6% 11.6% 11.5% 11.4% 11.3%40% 11.7% 11.6% 11.5% 11.4% 11.3% 11.3%45% 11.7% 11.6% 11.5% 11.4% 11.3% 11.2%50% 11.7% 11.6% 11.5% 11.3% 11.2% 11.1%
Repurchase Requests as % of Remaining Loans
Acc
epta
nce
Rat
e

25
Second-lien ExposuresHE Loans LTV >100% LTV >100% / HE Loans
Bank of America $137,981 $46,914 34%JPMorgan ** 88,468 40,873 46%Wells Fargo 117,744 39,086 33%Citigroup * 42,000 20,000 48%
Mortgage Modifications: Underwater Second-lien Loans
Source: Company reports, CreditSights* Estimated. Excludes Canadian, PR and LTSC HE loans'** JPM: >100% incl estimate for PCI loans from WM acquisitionAs of 4Q10. In $ millions

26
Tier 1 Common: Sensitivity to Write-Downs of HE >100% LTVBAC C JPM WFC
0% 7.8% 10.8% 10.0% 10.7%
10% 7.6% 10.7% 9.9% 10.5%
20% 7.5% 10.6% 9.7% 10.3%
30% 7.4% 10.5% 9.5% 10.1%
40% 7.2% 10.5% 9.4% 9.9%
50% 7.1% 10.4% 9.2% 9.7%
60% 7.0% 10.3% 9.1% 9.4%
70% 6.8% 10.2% 8.9% 9.2%
80% 6.7% 10.1% 8.8% 9.0%
90% 6.5% 10.0% 8.6% 8.8%
100% 6.4% 9.9% 8.4% 8.6%Wri
ted
ow
n o
f L
TV
>10
0% 2
nd
s
Mortgage Modifications: Potential Capital Impact – Second-liens
Source: Company reports, CreditSightsEst. impact: Net of estimated reserves, taxes. Includes 2 years of earnings retention.Potential capital impact of write-down of 2nd lien HE CLTV >100%As of 4Q10. Basel III Tier 1 common < 7% in red.

27
Potential Capital Impact from Mortgage Headwinds - BIS III Tier 1 CommonServicer Settlement Repurchases Home Equity Total Pro Forma
Bank of America 0.18% 0.29% 0.59% 1.06% 6.31%Citigroup 0.09% 0.05% 0.42% 0.56% 10.11%JPMorgan 0.15% 0.28% 0.70% 1.13% 8.63%Wells Fargo 0.31% 0.20% 0.95% 1.46% 8.91%Total Cost $16,000 $19,950 $58,749 $94,699
Potential Capital Impact from Mortgage Headwinds
Source: Company reports, CreditSightsEst. impact: net of estimated reserves, taxes. Includes 2 years of earnings retention.Servicer settlement: pro rata based on loans serviced.Repurchases: based on CreditSights’ estimated mid-caseHome equity: 40% write-down of 2nd lien HE CLTV >100%As of 4Q10. Basel III Tier 1 common, 7% requirement, when fully phased-in.

28
5Y CDS Range for Select Sectors
0 bps 25 bps 50 bps 75 bps 100 bps 125 bps 150 bps 175 bps
Big banks/brokers
Equip. Manufacturers
Oil and Gas
Telecos
Utilities
Consumer
Big Banks/Brokers Trade Much Cheaper than Industrials
As of 3/09/11Source: Bloomberg, CreditSightsBig Banks/brokers include: BAC, C, GS, JPM, MS, WFC

29
Bond/ CDS Recommendations
Sector Recommendation OAS* ReturnFIN. SERVICES Overweight -25 bps 1.65% U.S. Banks Overweight -25 bps 1.58% Big Banks** Overweight Regional Banks Overweight Specialty Finance Overweight -25 bps 1.43%ML U.S. Corporate Master -18 bps 1.22%
YTD 2011
Sector Recommendations: U.S. Bonds/ CDS
*YTD OAS for Merrill Lynch indices **Includes BAC, C, GS, JPM, MS, WFCAs of 3/09/11, YTD excess return represents the aggregate daily return vs. treasuries.Source: Bloomberg, CreditSights

30
Big Banks - OverweightOverweight Marketweight Underweight
Merrill Lynch Wells FargoMorgan Stanley U.S. BancorpBank of America JPMorgan
CitigroupGoldman Sachs
Regional and Mid-Sized Banks - OverweightOverweight Marketweight Underweight
Regions Fifth ThirdZions BB&T
M&T Bank PNCSunTrust Bank of New York
Marshall & IlsleyKeyCorp
HuntingtonComerica
Capital One
Specialty Finance - OverweightOverweight Marketweight UnderweightAlly Financial CIT (Shorter*) American Express
American General Finance Discover GATXCIT (Longer**) HSBC Finance H&R Block
Ford Motor Credit ResCap iStarGE CapitalSallie Mae
Credit Relative Value Recommendations
Sorted by ‘cheapest’ according to 5Y CDS relative value; *U.S. Bancorp according to 5Y cashRegionals according to 10Y cash, 5Y cash when applicable. Specialty Finance alphabetical*Shorter-dated bonds include 2013s, 2014s, 2015s. **Longer-dated bonds include 2016s, 2017s
31
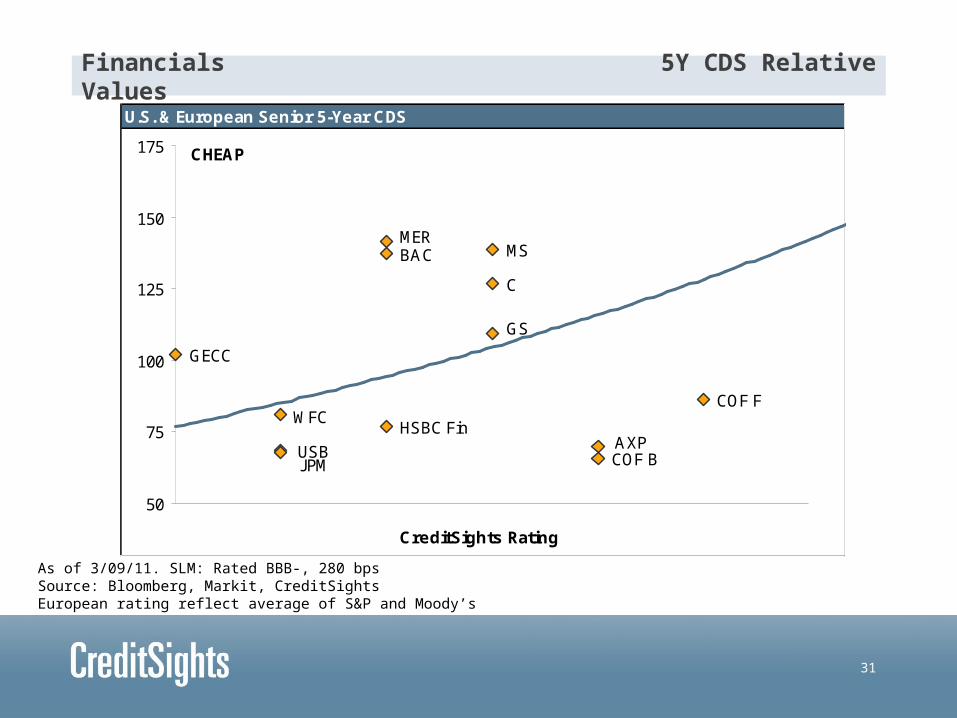
U.S. & European Senior 5-Year CDS
AXPHSBC Fin
GECC
COF F
COF B
MS
GS
JPM
MER
WFC
C
BAC
USB
50
75
100
125
150
175
CreditSights Rating
CHEAP
RICH
AA AA- A+ A A- BBB+ BBB
Financials 5Y CDS Relative Values
As of 3/09/11. SLM: Rated BBB-, 280 bpsSource: Bloomberg, Markit, CreditSightsEuropean rating reflect average of S&P and Moody’s

32
Ten Year Benchmark Bond Fair Value
GECCCOF
AXP
MSMER
GS
WFC
STI
RF
PNC
NCC
KEY
JPM
HBAN
FITB
C
BK
BBT
BAC
0
50
100
150
200
250
300
350
400
CreditSights Rating
Sp
read
to
10Y
Tre
asu
ry (
bp
)
RICH
CHEAP
AA AA- A+ A A- BBB+ BBB BBB- BB+
DFS
U.S. Financials 10Y Cash Relative Values
As of 3/09/11Source: MarketAxess, TRACE, CreditSights

33
Five Year Benchmark Bond Fair Value
GECC
COFAXP
MS
MER
GS
WFCUSB
STI
RF
PNCNCC
KEY
JPMFITB
CMAC
BK
BBT
BAC
0
50
100
150
200
250
300
350
400
450
CreditSights Rating
Sp
read
to
5Y
Tre
asu
ry (
bp
)
RICH
CHEAP
AA AA- A+ A A- BBB+ BBB BBB- BB+
ZION
MI
U.S. Financials 5Y Cash Relative Values
As of 3/09/11Source: MarketAxess, TRACE, CreditSights

34
Trust Preferred Securities: Select OpportunitiesCompany Coupon Price Yield Call Date STC PremiumRegions Financial 8.9% 26.55 8.4% 06/15/13 5.1% 6%Zions Bancorporation 8.0% 25.18 7.9% 09/01/07 7.0% 1%Citigroup 7.9% 26.00 7.6% 12/15/12 4.7% 4%Merrill Lynch (BofA) 7.4% 25.55 7.2% 09/15/12 5.2% 2%Bank of America 7.0% 24.97 7.0% 02/01/07 6.9% 0%Merrill Lynch (BofA) 6.5% 23.83 6.8% 06/15/12 10.1% -5%Fifth Third 7.3% 25.09 7.2% 11/15/12 6.4% 0%JPMorgan 7.0% 25.28 6.9% 01/31/02 5.5% 1%Wells Fargo 7.0% 25.32 6.9% 08/29/06 5.4% 1%
Preferred Stock: Select OpportunitiesCompany Coupon Price Yield Call Date STC PremiumZions Bancorporation 11.0% $27.33 10.1% 06/15/12 2.5% 9%Citigroup 8.5% 25.99 8.2% 06/15/13 5.8% 4%Bank of America 8.2% 26.20 7.8% 05/01/13 5.0% 5%JPMorgan 8.6% 27.74 7.8% 09/01/13 2.4% 11%PNC 8.3% 1,075.00 7.7% 05/21/13 4.3% 8%Wells Fargo 7.5% 1,030.00 7.3% NM NM 3%
Bank Hybrids: Trade Recommendations
Source: SNL, CreditSightsAs of February 22, 2011. Premium to par value. STC: Yield over comparable UST, based on call date.Sorted by yield/company. Most $25 par instruments, except WFC & PNC Pfds. ($1,000)

35
CreditSights’ Equity Recommendations
1Q11 2Q11 3Q11 4Q11 FY 11 Price InvestmentCompany EPS ($) EPS ($) EPS ($) EPS ($) EPS ($) Target ($) RecommendationBank of America 0.33E 0.35E 0.40E 0.45E 1.53E 15.00 MarketweightCitigroup 0.15E 0.15E 0.15E 0.15E 0.60E 5.95 OverweightGoldman Sachs 5.00E 4.75E 4.50E 5.25E 19.50E 195.00 OverweightJPMorgan Chase 1.10E 1.15E 1.20E 1.25E 4.70E 49.00 OverweightMorgan Stanley 0.75E 0.75E 0.75E 0.90E 3.15E 30.00 MarketweightU.S. Bancorp 0.48E 0.53E 0.58E 0.60E 2.19E 31.00 OverweightWells Fargo 0.65E 0.70E 0.75E 0.77E 2.87E 36.00 Overweight

36
U.S. Banks/Brokers: Key Drivers
• Bank of America> Revenue: solid capital markets, slow consumer> Manageable reps and warranties risk> Could increase dividends/repurchases in 2H11, prudent to wait until 2012> Provisions could decline to quarterly run rate of $4B, from $10B in 2009
• Citigroup> Unique international franchise, expand in BRIC+10> Strongest capital among traditional banks> Positioned to return capital, blocked by UST/FDIC TruPS until TLGP ends> Not a major mortgage originator; limited reps and warranties risk
• JPMorgan> Hoping to return capital to shareholders ASAP> Reps and warranties risk to GSEs/private labels manageable; HE overhang> Revenues driven by broad client franchise and capital markets> Expand internationally through wholesale banking strategy

37
U.S. Banks/Brokers: Key Drivers
• Wells Fargo> Reps and warranties manageable: mostly GSE; large HE run-off> Focus on cross-selling; impacted the most by debit interchange> Could look to return capital; capital somewhat lower on BIS III
• Goldman Sachs> More focused on share repurchases than dividends> Revenue helped by broad client franchise in FI, equities, and commodities> Growth strategy focused on BRIC+10
• Morgan Stanley> More work to be done to reach BIS III capital levels> Revenues hampered by underperformance in sales and trading> Asset/Wealth Management stabilizing; growth scarce
• U.S. Bancorp> Hoping to return capital to shareholders ASAP> Focus on growth of fee-generating businesses (processing, wealth mgmt)> Commercial loan growth could become key balance sheet driver

38
Strategic M&A Possibilities
Source: Bloomberg, SNL, CreditSightsRatings impact to target. Bold: Financially attractive
Strategic M&A TargetsBuyer Target EPS Accretion IRR Ratings ImpactU.S. Bancorp Fifth Third 2% 20% +3-4 notches
Regions 3% 16% +5-6 notchesSunTrust 0% 17% +3-4 notchesM&T Bank -7% 14% +2-3 notches
PNC Financial Fifth Third 0% 18% +0-1 notchesRegions 1% 14% +2-3 notchesKeyCorp -2% 11% +0-1 notchesSunTrust -4% 14% +0-1 notchesM&T -12% 11% -1-0 notches
BB&T Regions 7% 16% +4-5 notchesSunTrust 1% 17% +2-3 notches
Comerica Zions 1% 12% +5-6 notchesBMO Financial Fifth Third 7% 19% +4-5 notches
Regions 8% 15% +6-7 notchesKeyCorp 4% 12% +4-5 notches
Royal Bank of Canada
Regions 4% 18% +8-9 notches
Fifth Third 4% 23% +6-7 notchesSunTrust 3% 18% +6-7 notches
Capital One Regions 4% 13% +1-2 notchesSunTrust 0% 15% +0-1 notches

39
Copyright © 2011 CreditSights, Inc. All rights reserved. Reproduction of this report, even for internal distribution, is strictly prohibited. The information in this report has been obtained from sources believed to be reliable. However, neither its accuracy and completeness, nor the opinions based thereon are guaranteed. If you have any questions regarding the contents of this report, contact CreditSights, Inc. at (1) 212 340-3840 in the United States or (44) 20 7429 2080 in Europe. CreditSights Limited is authorised and regulated by The Financial Services Authority. This product is not intended for use in the UK by Private Customers, as defined by the Financial Services Authority.


![The Semantic Web: [You are here] Professor James Hendler hendler Director, Semantic Web and Agent Technologies Maryland Information.](https://static.cupdf.com/doc/110x72/5514e0cd550346b0338b5869/the-semantic-web-you-are-here-professor-james-hendler-httpwwwcsumdeduhendler-director-semantic-web-and-agent-technologies-maryland-information.jpg)


