© Sandhiprakash Bhide
January 31, 2017
Monetizing the Internet of things
Sandhiprakash Bhide
Visionary IOT Leader, CTO/CIO and Strategist

Agenda
1. IOT opportunity and key growth areas
2. IOT value chain
3. IOT business Model and monetization opportunities
4. Challenges to monetization
5. Potential for M&A?
©2014 GERSON LEHRMAN GROUP, INC. ALL RIGHTS RESERVED.
IOT Opportunity & Key Growth Areas
©2014 GERSON LEHRMAN GROUP, INC. ALL RIGHTS RESERVED.
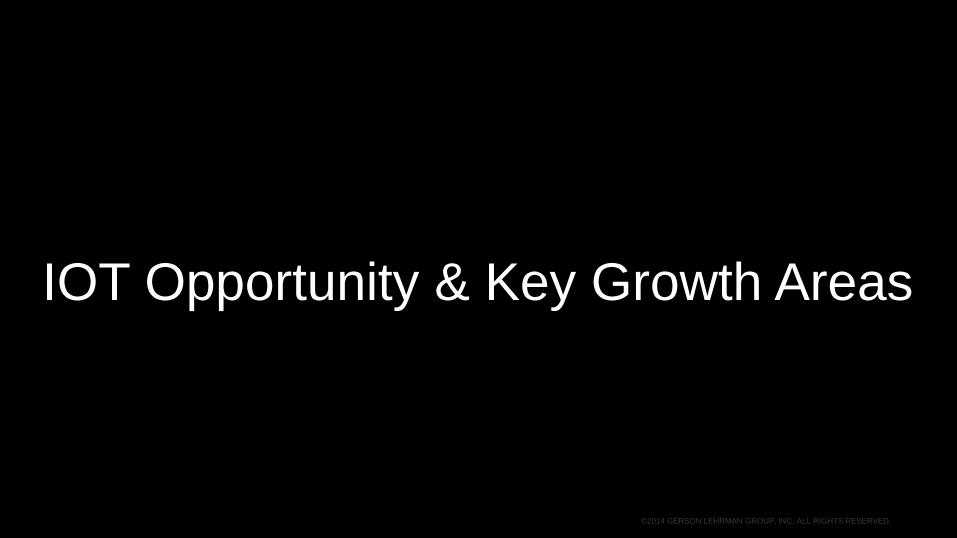
Opportunity is in Homes, Buildings, Offices, Industrial, Infrastructure, Energy,
Healthcare, Automotive, Smart City, Retail, Lighting… virtually everywhere and it
is HUGE! 50B Devices
50B Devices 1T Sensors
+
©2014 GERSON LEHRMAN GROUP, INC. ALL RIGHTS RESERVED.
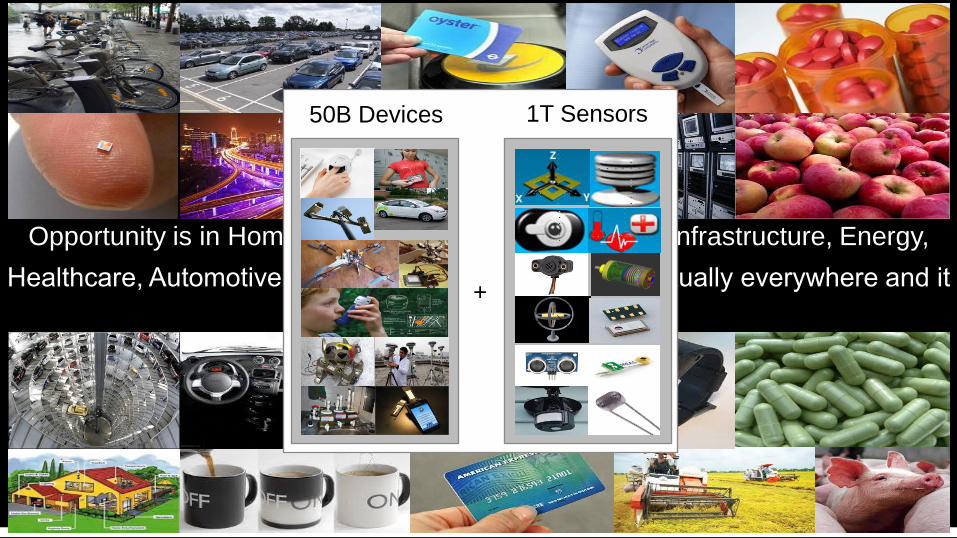
IOT Market is huge
Source: http://www.postscapes.com/internet-of-things-market-size/
Analyst Prediction
Research Nester $724.2B by 2023 13.2% CAGR.
Juniper Connected IoT devices to reach 46B in 2021
Markets & Markets $883.55B by 2022, at 32.4% CAGR
Ericsson 28B connected IOT devices by 2021 at a CAGR of 23%
Cisco 26.3B devices/connections by 2020
IndustryARC Industrial IOT: $123.8B by 2021(CAGR of 21%)
Rockville Research IOT Transportation: Market growth at 18% CAGR by 2020.
Mind Commerce Smart Home: $133B by 2021 (CAGR of 27.2%)
©2014 GERSON LEHRMAN GROUP, INC. ALL RIGHTS RESERVED.
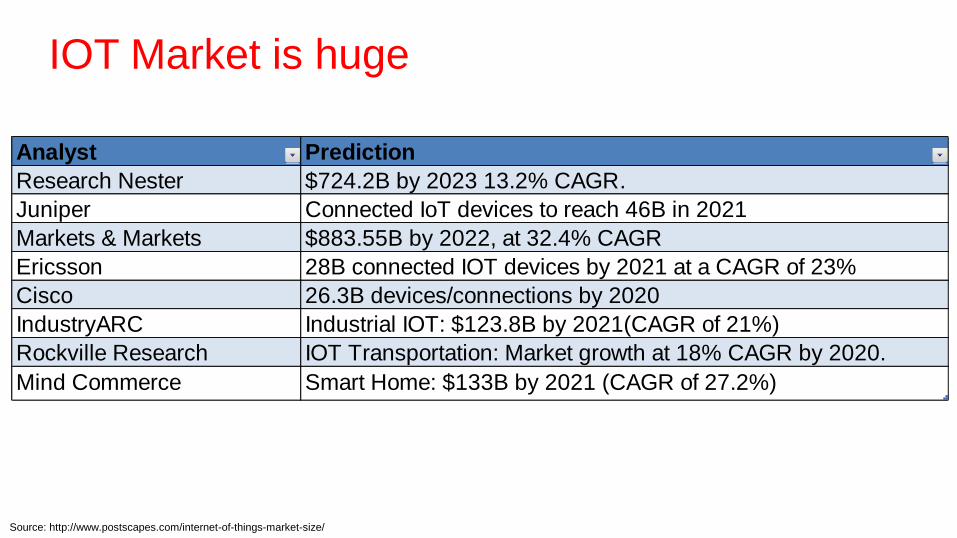
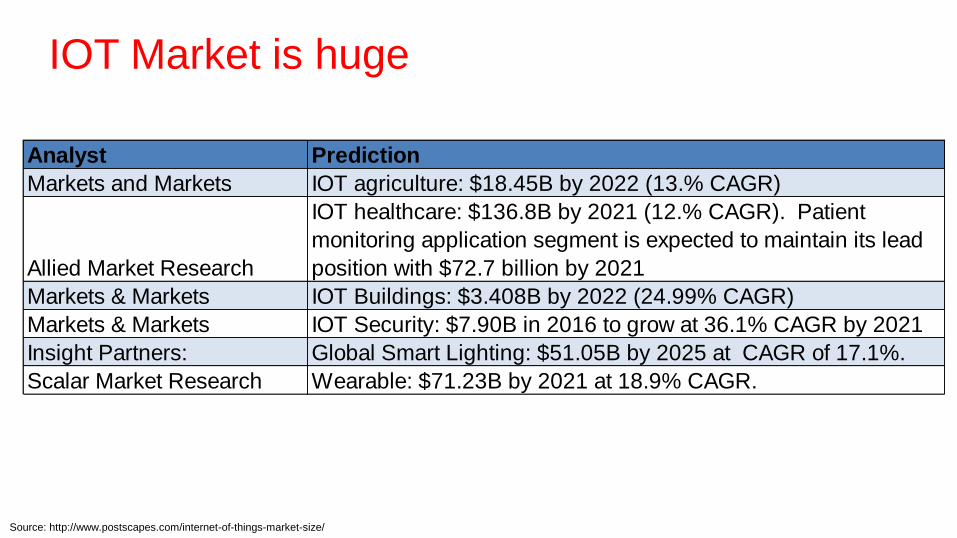
IOT Market is huge
Source: http://www.postscapes.com/internet-of-things-market-size/
Analyst Prediction
Markets and Markets IOT agriculture: $18.45B by 2022 (13.% CAGR)
Allied Market Research
IOT healthcare: $136.8B by 2021 (12.% CAGR). Patient
monitoring application segment is expected to maintain its lead
position with $72.7 billion by 2021
Markets & Markets IOT Buildings: $3.408B by 2022 (24.99% CAGR)
Markets & Markets IOT Security: $7.90B in 2016 to grow at 36.1% CAGR by 2021
Insight Partners: Global Smart Lighting: $51.05B by 2025 at CAGR of 17.1%.
Scalar Market Research Wearable: $71.23B by 2021 at 18.9% CAGR.

Key Growth Areas 1. 40% of the opportunity is in developing and remaining 60% in the developed
2. 2X more value from B2B than consumer
3. Interoperability is required to capture 40% of the value
4. <1% data is currently used, more can be used for optimization/prediction
5. $3.9 trillion–11.1 trillion per year in 2025
Source: The Internet of Things: Mapping the value beyond the hype, McKinsey Global Institute, June 2015

©2014 GERSON LEHRMAN GROUP, INC. ALL RIGHTS RESERVED.
Top 4 Key IOT Growth Areas
Industry 4.0
• Operations management
• Inventory control
• Operator health hazard and safety
• Warehouse management, material flow, fast
stock rotation, order systems, movement for
goods, understanding time in transit
• Security, theft prevention
• Prevention of rotting food, maintain
freshness
• Monitoring, reporting, analysis, prediction,
and prevention
Cities:
• Smart parking
• Structural health of buildings, bridges and
monuments
• Noise map of urban area, traffic congestion,
route optimization for vehicles/pedestrians
• Weather/traffic adaptive smart lightning,
micro-weather mapping,
• Waste management and route optimization
of trash collection routes
• Public health/safety, resource management,
intelligent commuting

©2014 GERSON LEHRMAN GROUP, INC. ALL RIGHTS RESERVED.
Top 4 Key IOT Growth Areas
Healthcare
• Improve wellness, monitoring/managing
illness
• Remote diagnosis/assistance and
continuous monitoring
• Hospital/Memory care patient monitoring
• Visiting hours management
• Early detection of critical signs, emergency
911 calling
• Geriatric patient support - medicine
dosage/timing, Monitoring patient fall
Retail:
• Self checkout
• Safety, gas leak detection, fire detection,
theft prevention
• Customer analysis, hot spots, providing
connectivity to customers.
• Automatic stock ordering, food rotting
prevention, stock rotation, removal of
expired items
• Layout optimization

©2014 GERSON LEHRMAN GROUP, INC. ALL RIGHTS RESERVED.
IOT Value Chain

©2014 GERSON LEHRMAN GROUP, INC. ALL RIGHTS RESERVED.

©2014 GERSON LEHRMAN GROUP, INC. ALL RIGHTS RESERVED.
IOT Value Chain
Accenture
CapGemini
Arrow
GE
Booz Allen
Boeing
Delphi
ATS…
DHS
US DoD
US DoE
AmTrack
GM
BMW,
Olympics
GM
Bonneville
Power
Station
PGE
Indian
Railways
Silicon:
TI
QCOM
Intel
AMD
Broadcom
Freescale
Marvel…
Sensors:
STM
Invensys
Bosch
Murata…
AT&T
Verizon
Sprint
Orange
Vodaphone
DT
BT
Swisscom
KT
NTT
Docomo
Reliance
BSNL…
MSFT
IBM
Oracle
SAP
VMWare
Axeda
Alibaba,
Amazon
Google…
OS:
Linux,
Ostro,
Yocto…
Cisco
HP
Dell
Lenovo
IBM,
Siemens
ABB
Honeywell
GE…
Advantech
Kontron
Radisys
Asustek
Eurotech
Foxconn…
Telit
Sierra
Cinterion
Huawei
ZTE,
Infineon…
IBM
Accenture
BCG
Deloitte
Anderson
TCS
McKinsey
Bain
GE…
Systems
Integrators
End Users
Customer
Component
OEM
Service
Providers
SW OEM,
App, MW,
Analytics
Equipment
OEM
Platform
ODM,
Gateways
Comms
Module
OEM
Consultants
Value chain is complex and symbiotic relationships can be integrated to monetize the IOT Market
~5-10% 15-20% 10-15% 15-20% 30-40%% 5-10% ?
$$$ - Increased Monetization Opportunity or Value

©2014 GERSON LEHRMAN GROUP, INC. ALL RIGHTS RESERVED.
IOT Business Model and
Monetization Opportunities

©2014 GERSON LEHRMAN GROUP, INC. ALL RIGHTS RESERVED.
Monetization Models 1. HW Premium
1. One time charge
2. Ecosystem Building
1. Fixed Fee Model
2. Transaction-based Fee
3. Revenue Share model
3. Data Revenue
4. Service Revenue
1. Subscription (flexibility to customize service options and duration of the service)
2. Pay as you go by usage
3. Pay for results
4. Freemium model (attract customers that are not convinced)
Source: Monetizing the Internet of Things: Extracting Value from the Connectivity Opportunity, CapGemini Consulting

©2014 GERSON LEHRMAN GROUP, INC. ALL RIGHTS RESERVED.
Monetization: Smart End Node integration
….
….
Sensor
package
Sensing
element
Signal
conditioning
Signal
processing
Sensor
package
Sensing
element
Signal
conditioning
Signal
processing
Transient Data
Storage
Transient Data
Storage
Sensor Data
Processing
Sensor
package
Sensing
element
Signal
conditioning
Signal
processing
Communication
Security
Info storage
Data Encryption
Sensor algorithms
Multi-Chip Package (MCP)
HW Premium

©2014 GERSON LEHRMAN GROUP, INC. ALL RIGHTS RESERVED.
Monetization: Energy Harvesting
1mW 100nW 1µW 10µW 100µW 10mW 100mW 1W 10W 100W 10nW
Standby 32 KHz quartz
oscillator Electronic
watch or
calculator
RFID
Tag
Hearing
aid
Miniature FM
Receiver
Transceiver
Bluetooth
PALM,MP3 GSM µP laptop Bicycle
lightning
µP desktop
Scope of Energy Harvesting is usually considered up to maximum power of 5W
Source: http://www.iop.org/resources/energy/, Micropower scale: http://www.cymbet.com/pdfs/Cymbet-EH-Powering-for-WSN-Symposia-Sensors-Expo-2013.pdf
Opportunities for integration:
1. CMOS Integrated PV, solar Cells
2. Thermal: Pyro-electric, thin film standard thermoelectric
3. Mechanical: Vibrational electrostatic/piezoelectric/electromagnetic, pulse
HW Premium
©2014 GERSON LEHRMAN GROUP, INC. ALL RIGHTS RESERVED.
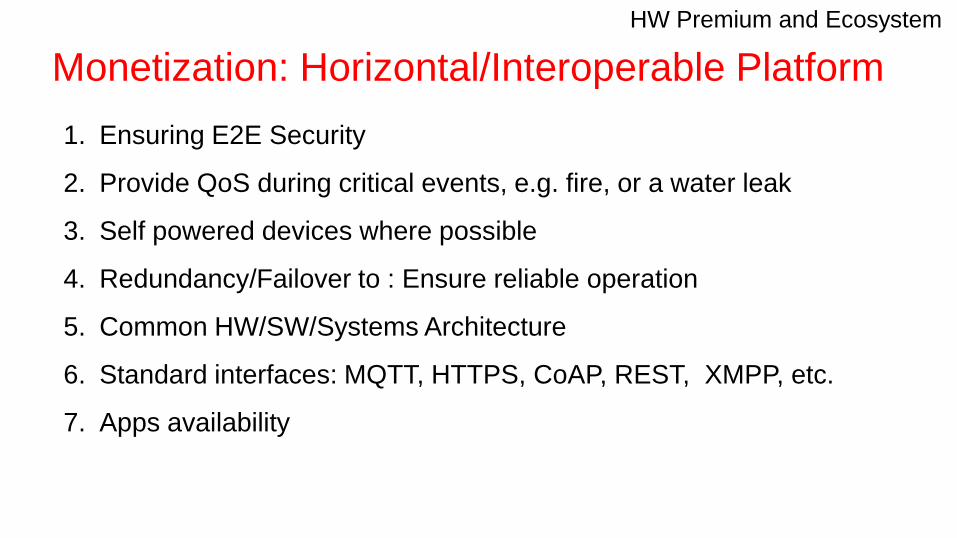
Monetization: Horizontal/Interoperable Platform
1. Ensuring E2E Security
2. Provide QoS during critical events, e.g. fire, or a water leak
3. Self powered devices where possible
4. Redundancy/Failover to : Ensure reliable operation
5. Common HW/SW/Systems Architecture
6. Standard interfaces: MQTT, HTTPS, CoAP, REST, XMPP, etc.
7. Apps availability
HW Premium and Ecosystem

©2014 GERSON LEHRMAN GROUP, INC. ALL RIGHTS RESERVED.
Monetization: Security
1. Data Protection: Data safe
from theft or alteration
2. Privacy: Release of
sensitive/ personal info
without consent
3. Identity: Person remains
anonymous unless opted-in
4. Safety: Does not cause any
harm to people
Ecosystem Building
©2014 GERSON LEHRMAN GROUP, INC. ALL RIGHTS RESERVED.
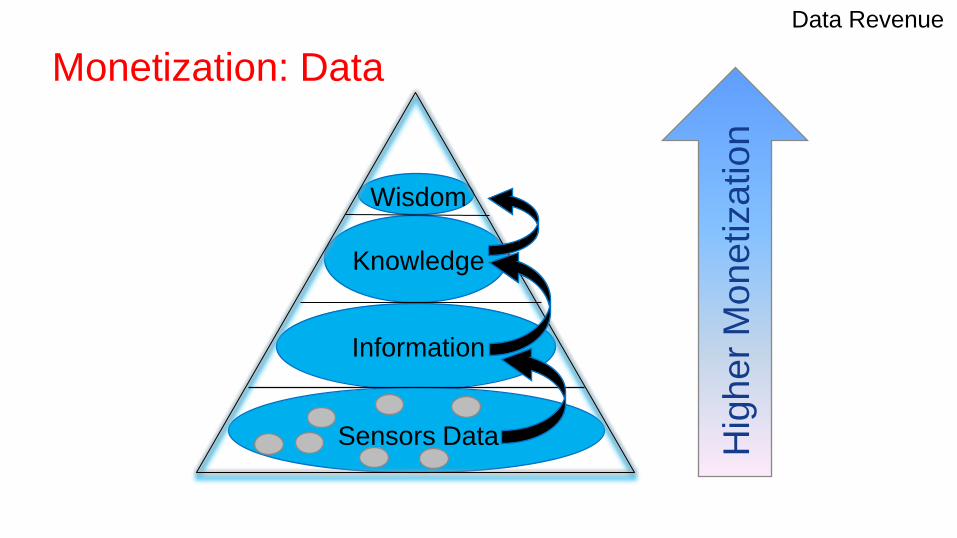
Monetization: Data
Sensors Data
Information
Knowledge
Wisdom
Hig
her
Mon
etiza
tio
n
Data Revenue

©2014 GERSON LEHRMAN GROUP, INC. ALL RIGHTS RESERVED.
Monetization: Analytics
Source: Ray Solnik, Appnomic Systems , http://www.datacenterjournal.com/it/time-analytics-delivers-operations/ Source: Big Data Analytics – Predictive Analytics – Gartner Glossary, www.gartner.com
Data Revenue

©2014 GERSON LEHRMAN GROUP, INC. ALL RIGHTS RESERVED.
Monetization: Service Revenue
1. OTA OS, analytics, firmware updates
2. Ease of upgrade or failure notification
3. Device Manageability/Support: Recognize/fulfill support needs
4. Data Storage retention for future use
5. Use of best communication method to ensure uninterrupted service
6. Human Safety
Service Revenue

©2014 GERSON LEHRMAN GROUP, INC. ALL RIGHTS RESERVED.
New Business Models for Services

©2014 GERSON LEHRMAN GROUP, INC. ALL RIGHTS RESERVED.
Business Models for services 1. Shift from Selling capital goods to selling products as services (outcomes)
2. Charge by usage
3. Service and maintenance by hour or yearly contract
4. Periodic SW updates
5. High CapX/low OpX, or low/zero CapX and long a term contract provides
monthly recurring revenue
6. Finance upfront device costs
7. Deep customer relationships to sell additional products/services
Recurring revenue will be the dominant monetization model for the IoT, hence the
customer experience is of paramount importance.
Service Revenue
©2014 GERSON LEHRMAN GROUP, INC. ALL RIGHTS RESERVED.
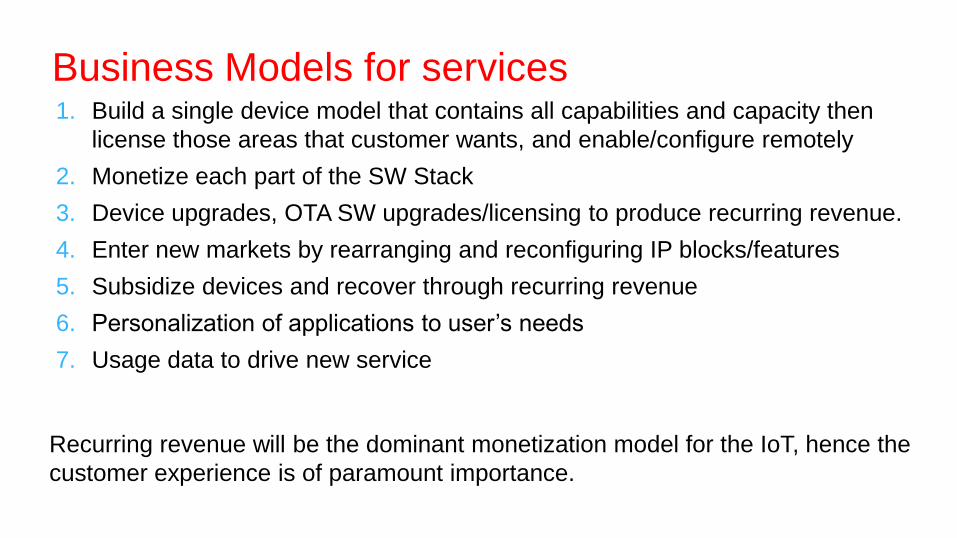
Business Models for services 1. Build a single device model that contains all capabilities and capacity then
license those areas that customer wants, and enable/configure remotely
2. Monetize each part of the SW Stack
3. Device upgrades, OTA SW upgrades/licensing to produce recurring revenue.
4. Enter new markets by rearranging and reconfiguring IP blocks/features
5. Subsidize devices and recover through recurring revenue
6. Personalization of applications to user’s needs
7. Usage data to drive new service
Recurring revenue will be the dominant monetization model for the IoT, hence the
customer experience is of paramount importance.

©2014 GERSON LEHRMAN GROUP, INC. ALL RIGHTS RESERVED.
Challenges for monetization

©2014 GERSON LEHRMAN GROUP, INC. ALL RIGHTS RESERVED.
Challenges to monetization in service creation
1. Need for a critical mass of connected devices
2. Need for a critical mass of devices with an open/standard API
3. The rules of ”open data” are yet to be defined
4. Companies have to adapt to bottom-up value creation
5. System and platform interoperability (many Intranets of Things)
6. Industry standards
7. Mobile network capacity
8. Core hardware energy consumption

©2014 GERSON LEHRMAN GROUP, INC. ALL RIGHTS RESERVED.
Potential for M&A
©2014 GERSON LEHRMAN GROUP, INC. ALL RIGHTS RESERVED.
Potential for M&A
1. Analytics is specialized to solve a specific problem. It is highly unlikely
that two analytics companies will merge.
2. SIs solve similar problems for several customers. To gain efficiencies,
they may acquire analytics supplier in specific domains. Analytics
companies a small with PhDs. If acquired by a company, they are
likely to cash out and start another analytics company.
3. As small 5G winners with IP emerge, they will most likely be likely be
acquired by Silicon vendors.
4. Carrier/SPs with fat pipes need to offer value-added services, and may
see acquisition similar to Verizon’s acquisition of Sensity.

© Sandhiprakash Bhide
Thank you !