Molecular Dynamics Simulations of aSet of Isoniazid Derivatives Bound toInhA, the enoyl-acp Reductase FromM. tuberculosis
KERLY F. M. PASQUALOTO,1 MARCIA M. C. FERREIRA,1
OSVALDO A. SANTOS-FILHO,2 ANTON J. HOPFINGER2
1Department of Physical Chemistry, Laboratory for Theoretical and Applied Chemometrics,Institute of Chemistry, Building H, Room 219, State University of Campinas, UNICAMP,Campinas, SP 13084-971, POB 6154, Brazil2Laboratory of Molecular Modeling and Design (M/C-781), College of Pharmacy, University ofIllinois at Chicago, 833 South Wood Street, Chicago, Illinois 60612-7231, USA
Received 27 December 2005; accepted 15 March 2006Published online 22 June 2006 in Wiley InterScience (www.interscience.wiley.com).DOI 10.1002/qua.21055
ABSTRACT: Ligand-receptor molecular dynamics simulations (MDS) were carried outfor a set of hydrazides bound to the enoyl-acp reductase from M. tuberculosis, InhA (PDBentry code 1zid). The hypothesized active conformations resulting from a previous receptor-independent (RI) 4D-QSAR analysis and related optimum model/alignment were used inthis study. The molecular dynamics simulations (MDS) protocol employed 500000 steps foreach ligand-receptor complex, the step size was 0.001 ps (1 fs), and the simulationtemperature was 310 K, the same temperature used in the biological assay. An outputtrajectory file was saved every 20 simulation steps, resulting in 25,000 conformations. Thehydration shell model was used to calculate the solvation energy of the lowest-energyconformation obtained from each MDS. Structural parameters as well as binding energycontributions were considered in this analysis. The thermodynamic descriptors ELE1,4,ELtors, ELvdW, ELel, and ELel�Hb appear to be more relevant to the biological activity. Thesefindings can be meaningful for developing QSAR studies and for designing newantituberculosis agents. © 2006 Wiley Periodicals, Inc. Int J Quantum Chem 106: 2689–2699, 2006
Key words: hydrazides; enoyl-acp reductase; molecular dynamics simulations;structure-based design; tuberculosis
Correspondence to: K. F. M. Pasqualoto; e-mail: [email protected]
Contract grant sponsors: CNPq; FAPESP.
International Journal of Quantum Chemistry, Vol 106, 2689–2699 (2006)© 2006 Wiley Periodicals, Inc.
Introduction
E nzymes that form the biosynthetic apparatusfor fatty acid production, the fatty acid syn-
thase (FAS), are considered ideal targets for design-ing new antibacterial and antimycobacterial agents.The difference between the molecular organizationof FAS found in most bacteria/mycobacteria andmammals [1–3] is the reason for this assumption.
Enoyl-acp reductase (ENR) is a key regulatorystep in fatty acid elongation and catalyzes theNADH-dependent stereospecific reduction of �,�-unsaturated fatty acids bound to the acyl carrierprotein [4–6].
Biochemical evidence has suggested that isonia-zid (INH), a first-line drug for the treatment oftuberculosis, blocks the mycolic acid biosynthesis inM. tuberculosis. Mycolic acids are high-molecular-weight �-alkyl, �-hydroxy fatty acids, which con-stitute the major components of mycobacterial cellwall [1, 7, 8]. These fatty acids, as well as the keyenzyme responsible for their elongation, are consid-ered attractive targets for the rational design of newantituberculosis agents.
The crystal structure of the M. tuberculosis enoyl-acp reductase, InhA, in complex with cofactor nic-otinamide adenine dinucleotide (NAD) and the in-hibitor INH, was isolated by Rozwarski et al. [9] in1998 (PDB entry code 1zid). These investigatorsshowed that the drug mechanism of action in M.tuberculosis involves a covalent attachment of theactivated form of the drug (isonicotinic acyl anionor radical) to the carbon at position 4 of the nico-tinamide ring of NAD bound within the active siteof InhA, resulting in the formation of an acylpyri-dine/NAD adduct. The crystal structure of thecomplex between isonicotinic acyl/NAD and InhAprovides a basis for designing new antituberculosisagents that inhibit InhA without needing a KatGdrug activation [7, 9].
Previously, we carried out a receptor-indepen-dent (RI) 4D-QSAR analysis of a set of 37 INHderivatives (hydrazides) to determine the optimummodel and alignment for those compounds [10].The hypothesized active conformations resultingfrom (RI) 4D-QSAR analysis can be used as struc-tural design templates, which include their deploy-ment as the molecular geometries of each ligand instructure-based ligand-receptor binding research.Structure-based design (SBD) is the application ofligand-receptor modeling to predict the activity of a
set of molecules that bind to a common receptor forwhich the molecular geometry is available.
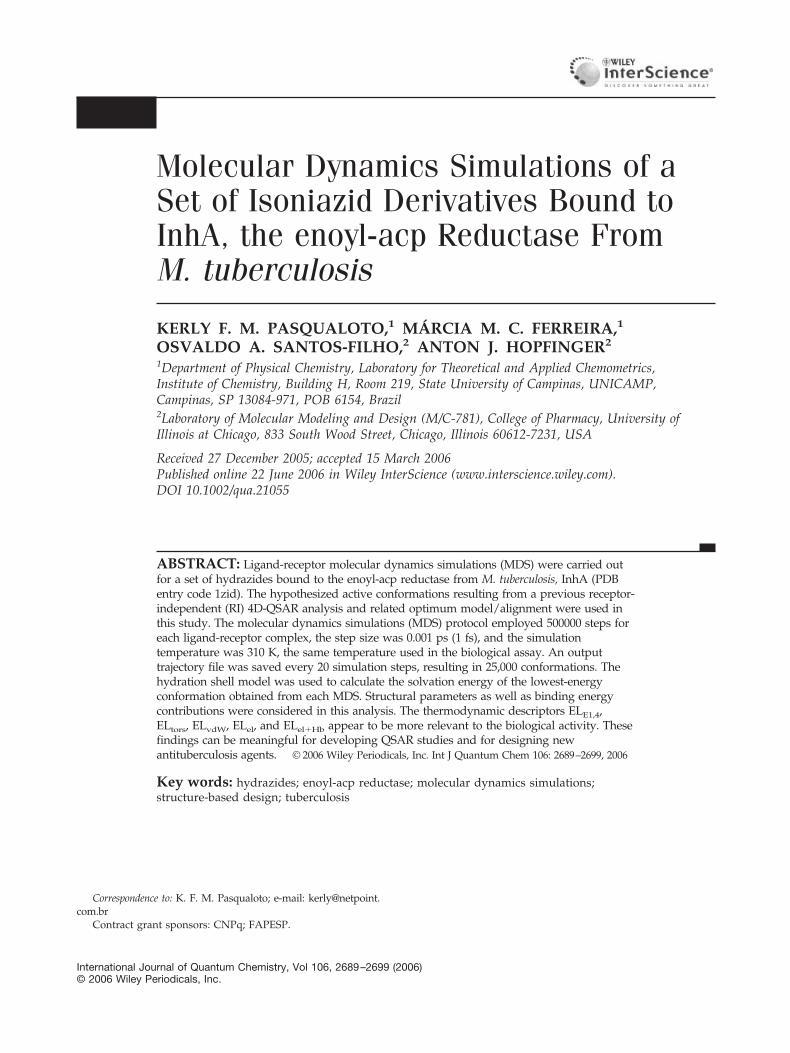
In the present study, we perform ligand-recep-tor (L-R) molecular dynamics simulations (MDS)of a set of 16 hydrazides from Ref. [10], includingINH, bound to the cofactor NAD in the active siteof InhA, the ENR from M. tuberculosis. Two mod-els of each ligand (adduct) were docked in theInhA active site to compare the resulting bindingthermodynamic descriptors: the hypothesized ac-tive conformation from a previous RI 4D-QSARanalysis (set 1a) [10], and the energy-minimizedligand structure without previous treatment (set1b). Four water solvent molecules that participatein L-R interaction were maintained in the activesite during the molecular dynamics (MD) calcu-lations (Fig. 1).
An exploratory data analysis [principal compo-nent analysis (PCA)] [11, 12] was carried out toselect the most relevant descriptors of the biologicalactivity. The central idea of PCA is to reduce thedimensionality of a data set consisting of a largenumber of interrelated variables, while retaining asmuch as possible of the variation present in the dataset [11, 12].
FIGURE 1. Schematic representation of InhA in com-plex with INH/NAD adduct and four water molecules inthe active site (ViewerLite 4.2). �-Helixes are presentedas red cylinders, and � sheets as cyan flat arrows. Theloops are shown as white tubes. The adduct structureis presented in CPK model. Water molecules are shownin stick model. Oxygen atoms are shown in red, nitro-gen in blue, carbon atoms in gray, phosphorus in or-ange, and hydrogen atoms in white. [Color figure canbe viewed in the online issue, which is available atwww.interscience.wiley.com.]
PASQUALOTO ET AL.
2690 INTERNATIONAL JOURNAL OF QUANTUM CHEMISTRY DOI 10.1002/qua VOL. 106, NO. 13
Methodology
BUILDING THE MOLECULES AND ATOMCHARGE ASSIGNMENT
A set of 16 hydrazides were randomly selectedfrom Ref. [10] (Table I). Biological activities wereevaluated as the minimum inhibitory concentra-tion (MIC; �g/mL), against strains of M. tubercu-losis var. bovis at 310 K [13–16]. The MIC of thecompounds was converted to molar units and
then expressed in negative logarithmic units,pMIC (�log MIC). The pMIC values are given inTable I. The range of activity for the analoguespresented in Table I is �5 (0.22– 4.70) pMIC units.The set of 16 isoniazid analogues comprises 6active compounds, including INH [INH, INHd2,INHd43, INHd14, INHd37, INHd15], 5 com-pounds with medium activity [INHd18, INHd25,INHd30, INHd27, INHd22], and 5 inactive com-pounds [INHd47, INHd19, INHd41, INHd48,INHd49].
TABLE I ______________________________________________________________________________________________Structures and biological activities of the 16 hydrazides.*
ROCONHNH2
Compound(active, A) R pMIC
Compound(medium
activity, M) R pMICCompound(inactive, I) R pMIC
INH 4.20
INHd2 3.82 INHd18 1.92 INHd47 1.00
INHd43 3.40 INHd25 1.92 INHd19 0.52
INHd14 3.22 INHd30 1.92 INHd41 0.40
INHd37 2.70 INHd27 1.52 INHd48 0.22
INHd15 2.52 INHd22 1.52 INHd49 0.22
INH, isoniazid; INHd, aromatic, heteroaromatic, and ring substituted hydrazides, isoniazid derivatives.* Activity was measured as the minimum inhibitory concentration (MIC) against strains of M. tuberculosis var. bovis at 310 K andgiven as pMIC (see Refs. [12–15]).
MDS OF ISONIAZID DERIVATIVES BOUND TO InhA FROM M. tuberculosis
VOL. 106, NO. 13 DOI 10.1002/qua INTERNATIONAL JOURNAL OF QUANTUM CHEMISTRY 2691

It was assumed that all compounds would actlike the lead drug INH, forming an adduct withcofactor NAD in the active site of InhA, as re-ported by Rozwarski et al. [9]. The ligands of set1a (the hypothesized active conformations ofeach of 16 analogues from a previous RI 4D-QSAR analysis) were obtained as reported in Ref.[10]. The three-dimensional (3D) structures ofeach of the 16 analogues (Table I) of set 1b in theirneutral forms were constructed using Hy-perChem 7.51 software [17]. The crystallized
structure of the isonicotinic acyl/NAD adduct inthe active site of the enoyl-acp reductase from M.tuberculosis, InhA (PDB entry code 1zid, 2.7Å res-olution), was used as a geometry reference inconstructing all ligands. Each structure was ener-gy-minimized using the HyperChem 7.51 MM�force field without any restriction. The MOLSIM3.0 program [18] was also used for the optimiza-tion of each structure investigated. Partial atomiccharges were computed using the AM1 [19]semiempirical method, also implemented in the
TABLE II ______________________________________________________________________________________________Thermodynamic descriptors from MD simulations and their definitions [22].
Descriptors (Set 1a and 1b) Definitions of the thermodynamics descriptors
�Estre � ELRstre � ELstre � ERstre Change in stretching energy upon binding�Ebend � ELRbend � ELbend � ERbend Change in bending energy upon binding�Etors � ELRtors � ELtors � ERtors Change in torsion energy upon binding�EvdW � ELRvdW � ELvdw � ERvdW Change in van der Waals energy upon binding�Eel � ELRel � ELel � ERel Change in electrostatic energy upon binding�EE1,4 � ELRE1,4 � ELE1,4 � ERE1,4 Change in 1-4 interaction energy upon binding�EHb � ELRHb � ELHb � ERHb Change in hydrogen bonding energy upon binding�Esolv � ELRsolv � ELsolv � ERsolv Change in solvation energy upon binding�Estre�bend � ELRstre�bend � ELstre�bend �
ERstre�bend
Sum of changes in stretching and bending energies
�Estre�bend�tors � ELRstre�bend�tors � ELstre�bend�tors
� ERstre�bend�tors
Sum of changes in stretching, bending, and torsionenergies
�Eel�Hb � ELRel�Hb � ELel�Hb � ERel�Hb Sum of changes in electrostatic and hydrogen bondingenergies
�Eel�Hb�E1,4 � ELRel�Hb�E1,4 � ELel�Hb�E1,4 �ERel�Hb�E1,4
Sum of changes in electrostatic, hydrogen bonding, and1-4 interaction energies
ELR(LL, RR, LR) Ligand-receptor complex energyELR(LR) Intermolecular ligand-receptor energyELR,vdW van der Waals intermolecular ligand-receptor energyELR,el Electrostatic intermolecular ligand-receptor energyELR,Hb Hydrogen bonding intermolecular ligand-receptor energyELR,el�Hb Sum of electrostatic and hydrogen bonding
intermolecular ligand-receptor energiesELR,el�Hb�vdW Sum of electrostatic, hydrogen bonding and van der
Waals intermolecular ligand-receptor energies�EL(LL) � ELR(LL) � EL(LL) Change in intramolecular ligand energy upon bindingELR(LL) Intramolecular energy of bound ligandEL(LL) Intramolecular energy of unbound ligand�ER(RR) � ELR(RR) � ER(RR) Change in intramolecular receptor energy upon bindingELR(RR) Intramolecular energy of bound receptorER(RR) Intramolecular energy of unbound receptorELR(LRM) � ELRsolv Ligand-receptor complex solvation energy�EL(LM) � ELR(LM) � EL(LM) Change in ligand solvation energy upon bindingELR(LM) Bound ligand solvation energyEL(LM) � ELsolv Unbound ligand solvation energy�ER(RM) � ELR(RM) � ER(RM) Change in receptor solvation energy upon bindingELR(RM) Bound receptor solvation energyER(RM) � ERsolv Unbound receptor solvation energy
PASQUALOTO ET AL.
2692 INTERNATIONAL JOURNAL OF QUANTUM CHEMISTRY DOI 10.1002/qua VOL. 106, NO. 13
HyperChem program [17]. The charges were cal-culated using the electrostatic potential [17].
As already mentioned, the X-ray structure of thecomplex InhA-NAD-INH (PDB entry code 1zid, 2.7Å resolution) was selected as the starting model forthe receptor geometry. The 1zid structure has onepolypeptide chain or subunit containing 268 aminoacid residues and a molecular weight of 28,352 Da.Both the N-terminus and C-terminus were modeledas neutral, and the CH3 groups were used as theblock groups. AMBER [20] partial charges wereassigned to all atoms of the enzyme structure, ex-cept the block groups, using the HyperChem 7.51program [17]. The charge state of ionizable residueswas modeled at neutral pH. Lone pair electronswere not modeled explicitly. Only four water sol-vent molecules that participate in the L-R interac-tion [9] were maintained in the InhA active sitemodel. The MOLSIM 3.2 program [18] was used toperform the energy minimization of the modeledInhA–NAD–INH complex. The energy-minimizedstructure of the complex was used as the initialstructure in the MD calculations (item 2).
MOLECULAR DYNAMICS PROCEDURE
Energy minimization and MD calculations wereperformed using the MOLSIM program, version 3.2[18]. The hydration shell model proposed by Hop-finger [21] was included in the force field represen-tation to estimate aqueous solvation energies. Sol-vation energy and hydrogen bonding energycontributions were evaluated only for the lowest-energy structures. The molecular dielectric constantwas set to a value of 3.5. The simulation tempera-ture was 310 K, the same used in the biologicalassay [13–16]. An average temperature of 310 K washeld constant during the simulation by coupling thesystem to a temperature external bath with a relax-ation time of 0.01 ps [22].
The energy-minimized structure of the InhA–NAD–INH complex was used as the initial struc-ture in MD calculations. The MDS [23] protocolemployed 500,000 steps with a step size of 0.001 ps(1 fs) at 310 K. An output trajectory file was savedevery 20 simulation steps, resulting in 25,000 con-formations. The solvation energy of the lowest-en-ergy conformation obtained by MDS was calculatedusing the hydration shell model [20]. The lowest-energy conformation of the InhA–NAD–INHmodel was used to dock the energy-optimizedstructures of all ligands (adducts from the two sets,1a and 1b), employing the optimum model/align-
ment selected in Ref. [10] (HyperChem 7.51). Theenergy-minimized structure of each InhA–NAD–analogue complex (sets 1a and 1b) was used toperform MDS of 500 ps (step size, 1 fs) at 310 K, andan output trajectory file was recorded every 20simulation steps. The solvation energy and hydro-gen bonding energy contributions of the lowest-energy conformation from the MDS of each InhA–NAD–analogue model (sets 1a and 1b) (L-R boundstate) were calculated. At this point, the L-R bound-state thermodynamic descriptors were generated.
The INH/NAD adduct was extracted from thelowest-energy conformation of the InhA–NAD–
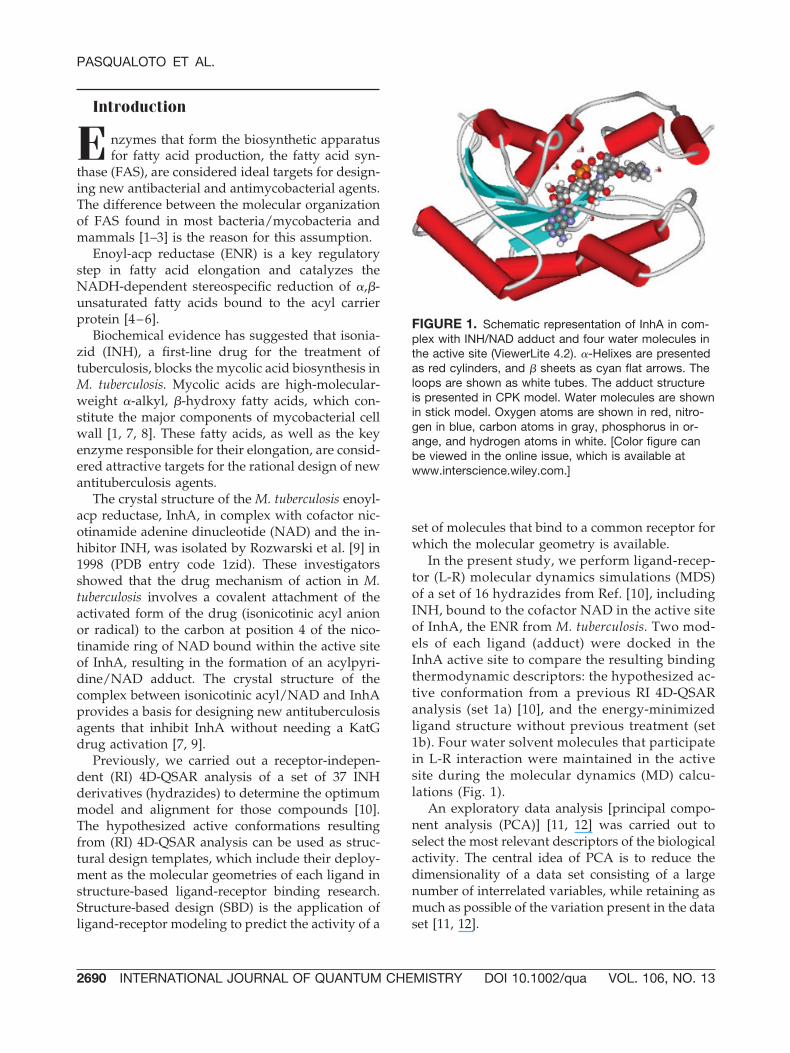
FIGURE 2. (a) Total energy (Etot, kcal/mol) plotted ver-sus time (ps) from MDS of the L-R complexes (set 1a).Etot corresponds to the descriptor ELR(LL, RR, LR).ELR(LL, RR, LR) � ELRstre � ELRbend � ELRtors �ELRE1,4 � ELRvdW � ELRel � ELRvdW�el � ELRHb �ELR(LRM) (Table III). (b) Total energy (Etot, kcal/mol) plot-ted versus time (ps) from MDS of the L-R complexes (set1b). Etot corresponds to the descriptor ELR(LL, RR, LR).ELR(LL, RR, LR) � ELRstre � ELRbend � ELRtors �ELRE1,4 � ELRvdW � ELRel � ELRvdW�el � ELRHb � ELR-
(LRM) (Table V). [Color figure can be viewed in the onlineissue, which is available at www.interscience.wiley.com.]
MDS OF ISONIAZID DERIVATIVES BOUND TO InhA FROM M. tuberculosis
VOL. 106, NO. 13 DOI 10.1002/qua INTERNATIONAL JOURNAL OF QUANTUM CHEMISTRY 2693
TA
BLE
III__
____
____
____
____
____
____
____
____
____
____
____
____
____
____
____
____
____
____
____
____
____
____
____
____
____
____
____
____
____
____
____
_T
herm
od
ynam
icd
escr
ipto
rsfo
und
for
the
L-R
low
est-
ener
gy
conf
orm
atio
ns(s
et1a
)fr
om
500
ps
MD
Sat
310
K.
Com
ple
xL-
RE
LRstr
e(k
cal�
mol
)E
LRb
end
(kca
l�m
ol)
ELR
tors
(kca
l�m
ol)
ELR
E1,4
(kca
l�m
ol)
ELR
vd
W(k
cal�
mol
)E
LRel
(kca
l�m
ol)
ELR
vd
W�
el
(kca
l�m
ol)
ELR
Hb
(kca
l�m
ol)
ELR(L
RM
)(k
cal�
mol
)
ELR(L
L,R
R,
LR)
(kca
l�m
ol)
tb1q
_A14
69.5
427
81.4
021
72.6
948
15.9
2�
2047
.73
�65
99.2
6�
210.
44�
4247
4.01
�13
.26
�40
105.
15tb
2q_A
1522
.07
2759
.81
2154
.09
4753
.68
�20
15.6
0�
6584
.91
�26
8.93
�41
645.
92�
16.6
0�
3934
2.31
tb14
q_A
1500
.04
2823
.15
2154
.49
4868
.65
�19
38.6
6�
6624
.75
�15
3.83
�43
358.
81�
16.1
9�
4074
5.90
tb43
q_A
1470
.41
2836
.84
2156
.84
4881
.32
�20
43.7
8�
6890
.78
�14
6.71
�42
452.
82�
27.3
0�
4021
5.97
tb37
q_A
1471
.59
2847
.20
2166
.10
4817
.33
�20
88.9
9�
6701
.81
�27
8.96
�42
573.
21�
30.2
1�
4037
0.96
tb15
q_A
1413
.49
2907
.01
2213
.36
4754
.11
668.
03�
6725
.55
2518
.88
�42
084.
63�
2.45
�34
337.
76S
D36
.57
51.9
822
.66
54.3
111
01.3
611
4.21
1116
.16
569.
1610
.04
2419
.63
tb18
q_M
1464
.14
2853
.29
2166
.61
5036
.75
�20
55.8
0�
6711
.67
�25
7.30
�43
057.
93�
39.2
8�
4060
1.18
tb25
q_M
2397
.06
2807
.40
2178
.95
4936
.98
�15
40.8
1�
6852
.86
282.
84�
4124
6.37
�27
.00
�37
063.
82tb
30q
_M15
54.5
828
25.0
321
37.7
549
42.7
723
75.9
9�
6804
.59
4293
.50
�41
953.
53�
29.0
4�
3065
7.54
tb22
q_M
1484
.35
2722
.86
2241
.81
4967
.91
�20
46.4
0�
6784
.48
�12
1.81
�42
750.
15�
24.2
7�
4031
0.18
tb27
q_M
1540
.32
2781
.67
2166
.76
4940
.66
�20
24.1
8�
6560
.16
�28
5.67
�42
547.
47�
19.9
5�
4000
8.02
SD
398.
1149
.47
38.5
641
.92
1932
.06
114.
0119
75.9
071
9.01
7.21
4199
.82
tb47
q_I
1506
.48
2823
.75
2200
.46
4929
.07
�20
95.5
8�
6785
.09
�18
2.86
�44
163.
64�
44.5
4�
4181
1.95
tb19
q_I
1397
.92
2771
.69
2193
.55
4908
.63
�20
15.1
1�
6662
.29
�13
6.27
�42
934.
78�
16.3
6�
4049
3.02
tb41
q_I
1517
.90
2767
.99
2160
.66
4957
.61
5383
.59
�65
85.8
872
21.5
4�
4320
0.27
�22
.27
�25
799.
13tb
48q
_I14
82.6
927
95.5
221
74.4
649
89.0
5�
2058
.92
�66
66.2
7�
179.
47�
4177
1.38
�25
.24
�39
259.
56tb
49q
_I14
45.8
028
01.1
321
90.5
348
76.4
4�
2073
.55
�67
63.6
1�
223.
45�
4371
9.60
�30
.99
�41
497.
30S
D48
.91
22.8
716
.13
43.4
533
29.3
681
.54
3310
.44
908.
4410
.70
6766
.93
Com
ple
xL-
RE
LR(L
R)
(kca
l�m
ol)
ELR
,vd
W(k
cal�
mol
)E
LR
,el
(kca
l�m
ol)
ELR
,el�
Hb
(kca
l�m
ol)
ELR
,el�
Hb
�vd
W(k
cal�
mol
)E
LR(L
L)(k
cal�
mol
)E
LR(R
R)
(kca
l�m
ol)
ELR(L
M)
(kca
l�m
ol)
ELR(R
M)
(kca
l�m
ol)
tb1q
_A10
314.
92�
157.
18�
305.
13�
4257
9.14
�42
736.
32�
259.
5611
499.
10�
5.17
�8.
10tb
2q_A
1011
6.17
�14
5.68
�39
1.05
�42
036.
97�
4218
2.65
�27
5.51
1146
5.14
�3.
62�
12.9
8tb
14q
_A11
125.
3351
.88
�16
2.38
�43
521.
19�
4346
9.31
�20
3.50
1154
9.83
�3.
13�
13.0
6tb
43q
_A10
694.
15�
160.
92�
164.
70�
4261
7.52
�42
778.
44�
191.
2511
536.
64�
4.82
�22
.49
tb37
q_A
1055
6.61
�13
9.70
�23
3.10
�42
806.
31�
4247
9.81
�28
5.34
1158
7.55
�5.
02�
25.1
9tb
15q
_A21
805.
0953
63.3
4�
104.
78�
4218
9.41
�36
826.
07�
310.
9911
598.
96�
3.72
1.26
SD
4603
.14
2236
.10
105.
8852
4.16
2447
.50
47.3
551
.23
0.86
9.64
tb18
q_M
1055
6.25
�16
3.08
�31
9.18
�43
377.
11�
4354
0.19
�67
.72
1158
8.49
�9.
14�
30.1
3tb
25q
_M13
445.
5877
6.26
�21
3.66
�41
460.
03�
4068
3.77
155.
6312
164.
75�
3.96
�23
.05
tb30
q_M
2882
8.91
8767
.28
�82
.88
�42
036.
41�
3326
9.13
�96
.96
1155
7.07
�7.
03�
22.0
1tb
22q
_M10
952.
67�
149.
33�
82.8
0�
4283
2.95
�42
982.
28�
113.
3611
530.
29�
4.78
�19
.49
tb27
q_M
1098
2.68
�16
0.54
�62
.82
�42
610.
29�
4277
0.83
�92
.40
1152
1.80
�4.
36�
15.5
7S
D78
40.7
739
07.9
211
0.98
738.
5942
65.2
411
2.21
276.
422.
195.
36
tb47
q_I
1088
7.99
�15
6.32
�12
9.56
�44
293.
20�
4444
9.52
�11
8.54
1157
8.29
�6.
90�
37.6
3tb
19q
_I71
23.7
8�
132.
28�
171.
06�
4310
5.84
�43
238.
12�
82.3
611
570.
86�
8.22
�8.
13tb
41q
_I40
18.0
814
700.
70�
308.
74�
4350
9.01
�28
808.
31�
113.
9711
518.
13�
2.40
�19
.87
tb48
q_I
1126
6.92
�16
8.90
81.5
0�
4168
9.88
�41
858.
78�
71.9
911
513.
71�
4.36
�20
.88
tb49
q_I
1035
6.65
�16
5.08
�31
3.54
�44
033.
14�
4419
8.19
�19
2.85
1150
6.74
�1.
92�
29.0
7S
D13
640.
2666
43.9
716
1.81
1024
.01
6620
.31
47.3
934
.15
2.75
11.0
3
A,a
ctiv
e;M
,med
ium
activ
ity;I
,ina
ctiv
e;q
,lig
and
sfr
om(R
I)4D
-QS
AR
[10]
(ad
duc
tIN
Han
alog
ue/N
AD
);tb
,ant
itub
ercu
losi
sco
mp
lexe
s(In
hA-a
dd
uct
INH
anal
ogue
/NA
D);
SD
,st
and
ard
dev
iatio
nof
the
des
crip
tors
foun
dfo
rth
eL-
Rlo
wes
t-en
ergy
conf
orm
atio
nsfr
omM
DS
,re
gard
ing
the
bio
logi
cala
ctiv
itycl
ass.
PASQUALOTO ET AL.
2694 INTERNATIONAL JOURNAL OF QUANTUM CHEMISTRY DOI 10.1002/qua VOL. 106, NO. 13
INH complex (HyperChem 7.51) [17], and the InhAmodel without the INH/NAD adduct was em-ployed to obtain the thermodynamic descriptors ofthe receptor unbound state (R unbound state). Theenergy-minimized structure of the InhA modelwithout the INH/NAD adduct was used as theinitial structure to perform MDS of 500 ps at 310 K,as already described. The solvation energy and hy-drogen bonding energy contributions of the R low-est-energy conformation obtained from MDS werecalculated, and the R unbound-state thermody-namic descriptors were generated.
Likewise, the thermodynamic descriptors of eachligand (L) (sets 1a and 1b) in its unbound state weregenerated. The lowest-energy conformation of eachInhA–NAD–analogue model from MDS was usedto extract the adduct, analogue/NAD (HyperChem7.51) [17]. The energy-minimized structure of eachadduct model (sets 1a and 1b) was employed asinitial structure to perform MDS of 500 ps at 310 K.The solvation energy and hydrogen bonding en-ergy contributions of each L lowest-energy confor-mation from MDS were calculated.
The thermodynamic descriptors from MD calcu-lations and their respective definitions [24] are pre-sented in Table II. A preliminary PCA [11, 12] was
employed to explore the data considering the mostrelevant descriptors (independent variables) of thebiological activity.
Results and Discussion
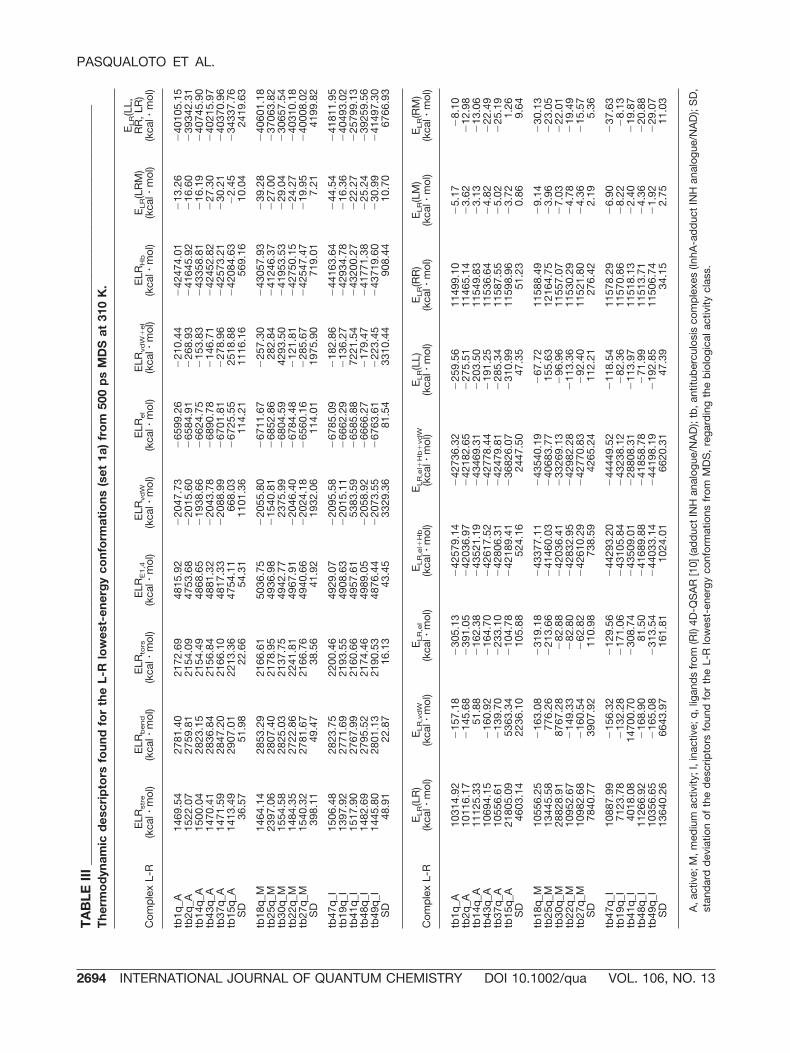
The range of the L-R complex energy [ELR(LL,RR, LR)] from MDS is distinct to four L-R com-plexes of set 1a: tb15q_A, tb25q_M, tb30q_M, andtb41q_I, as represented in Figure 2(a). Otherwise,the L-R complexes of set 1b did not present signif-icant changes in the ELR(LL, RR, LR) range fromMDS [Fig. 2(b)]. ELR(LL, RR, LR) corresponds to thesummation of the following L-R complex energy(ELR) contributions: stretching energy (ELRstre),bending energy (ELRbend), torsion energy (ELRtors),Lennard-Jones or 1,4 interactions energy (ELRE1,4),intramolecular van der Waals energy (ELRvdW), in-tramolecular electrostatic energy (ELRel), sum ofintermolecular van der Waals and electrostatic en-ergies (ELRvdW�el), hydrogen bonding energy(ELRHb), and solvation energy (ELR(LRM)). TheELRvdW�el positive values found for the complexestb15q_A, tb25q_M, tb30q_M, and tb41q_I (see TableIII), can be attributed to the van der Waals intermo-
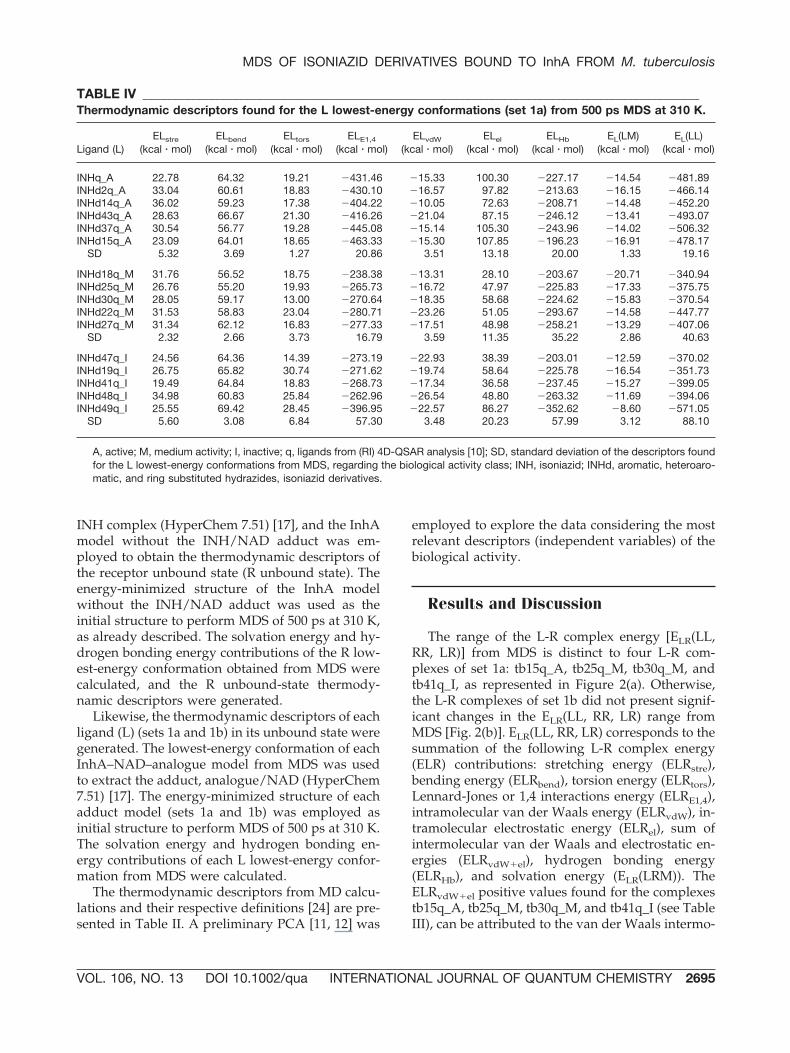
TABLE IV _____________________________________________________________________________________________Thermodynamic descriptors found for the L lowest-energy conformations (set 1a) from 500 ps MDS at 310 K.
Ligand (L)ELstre
(kcal � mol)ELbend
(kcal � mol)ELtors
(kcal � mol)ELE1,4
(kcal � mol)ELvdW
(kcal � mol)ELel
(kcal � mol)ELHb
(kcal � mol)EL(LM)
(kcal � mol)EL(LL)
(kcal � mol)
INHq_A 22.78 64.32 19.21 �431.46 �15.33 100.30 �227.17 �14.54 �481.89INHd2q_A 33.04 60.61 18.83 �430.10 �16.57 97.82 �213.63 �16.15 �466.14INHd14q_A 36.02 59.23 17.38 �404.22 �10.05 72.63 �208.71 �14.48 �452.20INHd43q_A 28.63 66.67 21.30 �416.26 �21.04 87.15 �246.12 �13.41 �493.07INHd37q_A 30.54 56.77 19.28 �445.08 �15.14 105.30 �243.96 �14.02 �506.32INHd15q_A 23.09 64.01 18.65 �463.33 �15.30 107.85 �196.23 �16.91 �478.17
SD 5.32 3.69 1.27 20.86 3.51 13.18 20.00 1.33 19.16
INHd18q_M 31.76 56.52 18.75 �238.38 �13.31 28.10 �203.67 �20.71 �340.94INHd25q_M 26.76 55.20 19.93 �265.73 �16.72 47.97 �225.83 �17.33 �375.75INHd30q_M 28.05 59.17 13.00 �270.64 �18.35 58.68 �224.62 �15.83 �370.54INHd22q_M 31.53 58.83 23.04 �280.71 �23.26 51.05 �293.67 �14.58 �447.77INHd27q_M 31.34 62.12 16.83 �277.33 �17.51 48.98 �258.21 �13.29 �407.06
SD 2.32 2.66 3.73 16.79 3.59 11.35 35.22 2.86 40.63
INHd47q_I 24.56 64.36 14.39 �273.19 �22.93 38.39 �203.01 �12.59 �370.02INHd19q_I 26.75 65.82 30.74 �271.62 �19.74 58.64 �225.78 �16.54 �351.73INHd41q_I 19.49 64.84 18.83 �268.73 �17.34 36.58 �237.45 �15.27 �399.05INHd48q_I 34.98 60.83 25.84 �262.96 �26.54 48.80 �263.32 �11.69 �394.06INHd49q_I 25.55 69.42 28.45 �396.95 �22.57 86.27 �352.62 �8.60 �571.05
SD 5.60 3.08 6.84 57.30 3.48 20.23 57.99 3.12 88.10
A, active; M, medium activity; I, inactive; q, ligands from (RI) 4D-QSAR analysis [10]; SD, standard deviation of the descriptors foundfor the L lowest-energy conformations from MDS, regarding the biological activity class; INH, isoniazid; INHd, aromatic, heteroaro-matic, and ring substituted hydrazides, isoniazid derivatives.
MDS OF ISONIAZID DERIVATIVES BOUND TO InhA FROM M. tuberculosis
VOL. 106, NO. 13 DOI 10.1002/qua INTERNATIONAL JOURNAL OF QUANTUM CHEMISTRY 2695
TA
BLE
V__
____
____
____
____
____
____
____
____
____
____
____
____
____
____
____
____
____
____
____
____
____
____
____
____
____
____
____
____
____
____
____
_T
herm
od
ynam
icd
escr
ipto
rsfo
und
for
the
L-R
low
est-
ener
gy
conf
orm
atio
ns(s
et1b
)fr
om
500
ps
MD
Sat
310
K.
Com
ple
xL-
RE
LRstr
e(k
cal�
mol
)E
LRb
end
(kca
l�m
ol)
ELR
tors
(kca
l�m
ol)
ELR
E1,4
(kca
l�m
ol)
ELR
vd
W(k
cal�
mol
)E
LRel
(kca
l�m
ol)
ELR
vd
W�
el
(kca
l�m
ol)
ELR
Hb
(kca
l�m
ol)
ELR(L
RM
)(k
cal�
mol
)E
LR(L
L,R
R,
LR)
(kca
l�m
ol)
tb1c
_A14
96.2
427
68.9
821
85.4
349
55.9
3�
2047
.09
�67
31.7
2�
163.
27�
4192
7.08
�18
.10
�39
480.
68tb
2c_A
1554
.21
2775
.87
2159
.53
4805
.82
�20
64.8
0�
6604
.33
�32
0.26
�42
148.
44�
45.2
8�
3988
7.68
tb14
c_A
1494
.76
2802
.99
2191
.46
4851
.07
�20
71.4
9�
6690
.76
�25
8.88
�43
125.
22�
40.4
8�
4084
6.55
tb43
c_A
1482
.24
2819
.83
2226
.99
4864
.93
�20
30.9
3�
6807
.01
�27
1.22
�42
782.
13�
13.3
1�
4051
0.61
tb37
c_A
1539
.65
2801
.46
2172
.24
4859
.57
�21
15.7
1�
6825
.60
�20
8.12
�43
265.
21�
28.4
4�
4107
0.16
tb15
c_A
1350
.02
2807
.34
2117
.21
4833
.47
�20
22.1
3�
6472
.55
�23
1.49
�41
720.
14�
53.9
4�
3939
2.21
SD
72.4
119
.55
36.5
250
.85
33.7
513
2.99
54.2
665
0.52
15.9
771
2.62
tb18
c_M
1468
.65
2801
.56
2147
.91
4952
.82
�20
63.1
5�
6607
.80
�36
8.15
�41
949.
42�
32.8
2�
3965
0.40
tb25
c_M
1512
.88
2809
.87
2143
.75
4815
.60
�20
27.4
3�
6694
.18
�31
5.69
�40
788.
36�
26.3
3�
3856
9.89
tb30
c_M
1493
.65
2820
.04
2157
.51
5001
.36
�20
59.2
9�
6813
.41
�14
4.40
�42
057.
54�
11.4
5�
3961
3.52
tb22
c_M
1678
.06
2894
.81
2272
.00
4903
.00
�19
04.0
9�
6716
.90
�21
9.60
�41
678.
00�
15.7
4�
3878
6.46
tb27
c_M
1443
.76
2793
.71
2160
.87
4827
.24
�20
69.5
8�
6712
.03
�22
5.46
�43
134.
18�
34.1
0�
4094
9.76
SD
92.4
340
.78
53.8
979
.83
69.3
673
.20
87.8
184
1.60
10.1
493
6.83
tb47
c_I
1502
.72
2856
.67
2133
.71
4899
.51
�20
50.8
7�
6821
.50
�11
8.38
�43
027.
50�
17.6
7�
4064
3.31
tb19
c_I
1513
.37
2846
.31
2165
.98
4811
.23
�20
42.5
7�
6780
.55
�25
8.32
�41
698.
50�
11.5
6�
3945
4.61
tb41
c_I
1457
.89
2759
.14
2214
.83
4859
.67
�20
49.3
3�
6709
.59
�27
9.74
�42
911.
22�
14.1
3�
4067
2.48
tb48
c_I
1501
.63
2752
.00
2191
.13
4904
.87
�20
05.7
4�
6657
.87
�23
0.54
�40
620.
91�
45.3
7�
3821
0.80
tb49
c_I
2350
.96
2916
.35
2144
.21
4890
.66
�15
82.2
1�
6761
.04
258.
05�
4202
9.74
�50
.56
�37
863.
32S
D38
3.88
69.7
533
.37
38.8
120
4.27
63.6
622
3.40
982.
7518
.57
1317
.08
Com
ple
xL-
RE
LR(L
R)
(kca
l�m
ol)
ELR
,vd
W(k
cal�
mol
)E
LR
,el
(kca
l�m
ol)
ELR
,el�
Hb
(kca
l�m
ol)
ELR
,el�
Hb
�vd
W(k
cal�
mol
)E
LR(L
L)(k
cal�
mol
)E
LR(R
R)
(kca
l�m
ol)
ELR(L
M)
(kca
l�m
ol)
ELR(R
M)
(kca
l�m
ol)
tb1c
_A10
742.
62�
162.
32�
169.
66�
4209
6.74
�42
259.
06�
82.5
411
489.
12�
5.54
�12
.56
tb2c
_A10
221.
11�
143.
98�
393.
17�
4254
1.61
�42
685.
59�
213.
0711
508.
48�
3.79
�41
.48
tb14
c_A
1054
9.72
�18
0.36
�21
4.92
�43
340.
14�
4352
0.50
�20
5.56
1154
5.84
�2.
49�
38.0
0tb
43c_
A10
312.
94�
180.
56�
359.
96�
4314
2.09
�43
322.
65�
201.
6011
595.
58�
5.20
�8.
10tb
37c_
A10
753.
27�
183.
36�
126.
46�
4339
1.67
�43
575.
03�
189.
1811
562.
09�
3.64
�24
.79
tb15
c_A
1008
2.27
�14
8.24
�36
4.64
�42
084.
78�
4223
3.02
�20
5.85
1131
3.88
�5.
04�
48.9
0S
D28
0.61
17.5
011
4.82
604.
1361
8.80
49.8
299
.89
1.17
16.4
8
tb18
c_M
1018
7.64
�18
9.46
�40
2.18
�42
351.
60�
4254
1.06
�17
9.94
1155
0.86
�7.
86�
24.9
5tb
25c_
M10
176.
88�
162.
44�
390.
16�
4117
8.52
�41
340.
96�
207.
1111
489.
19�
4.09
�22
.24
tb30
c_M
1061
4.16
�18
0.18
�24
9.00
�42
306.
54�
4248
6.72
�11
6.89
1158
9.41
�4.
03�
10.0
7tb
22c_
M10
971.
26�
169.
68�
218.
62�
4189
6.62
�42
066.
30�
209.
5911
957.
45�
1.69
�14
.05
tb27
c_M
1052
3.05
�15
4.56
�19
6.70
�43
330.
88�
4348
5.44
�18
2.31
1140
7.88
�7.
76�
26.3
3S
D33
0.71
13.8
797
.58
782.
2878
0.59
37.4
021
1.83
2.67
7.11
tb47
c_I
1071
3.17
�15
7.72
�18
2.00
�43
209.
50�
4336
7.22
�11
4.83
1150
7.44
�8.
85�
8.82
tb19
c_I
1030
3.55
�17
1.10
�34
5.56
�42
044.
06�
4221
5.16
�19
6.81
1153
3.68
�3.
79�
7.76
tb41
c_I
1023
7.32
�13
8.10
�38
9.00
�43
300.
22�
4343
8.32
�22
0.55
1151
2.07
�5.
24�
8.88
tb48
c_I
1054
9.10
�14
6.72
�25
3.54
�40
874.
45�
4102
1.17
�19
1.83
1154
1.45
�7.
49�
37.8
7tb
49c_
I13
798.
9676
6.70
�18
.30
�42
048.
04�
4128
1.34
451.
5411
850.
62�
5.95
�44
.61
SD
1509
.47
411.
6714
6.64
998.
5911
30.1
328
5.66
146.
921.
9718
.10
A,
activ
e;M
,m
ediu
mac
tivity
;I,
inac
tive;
c,lig
and
sb
uilt
from
crys
tallo
grap
hic
stru
ctur
e1z
id[9
]w
ithou
tp
revi
ous
trea
tmen
t(a
dd
uct
INH
anal
ogue
/NA
D);
tb,
antit
uber
culo
sis
com
ple
xes
(InhA
-ad
duc
tIN
Han
alog
ue/N
AD
);S
D,
stan
dar
dd
evia
tion
ofth
ed
escr
ipto
rsfo
und
for
the
L-R
low
est-
ener
gyco
nfor
mat
ions
from
MD
S,
rega
rdin
gth
eb
iolo
gica
lac
tivity
clas
s.
PASQUALOTO ET AL.
2696 INTERNATIONAL JOURNAL OF QUANTUM CHEMISTRY DOI 10.1002/qua VOL. 106, NO. 13
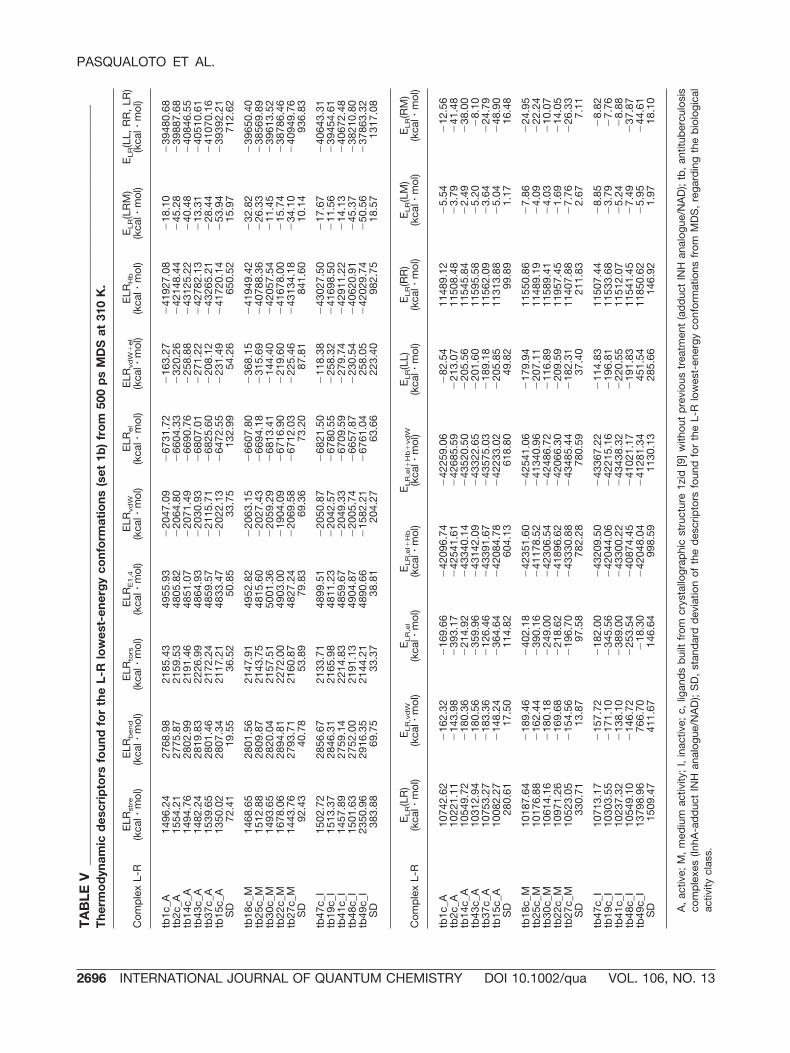
lecular L-R energy (ELR,vdW) rather than to the elec-trostatic intermolecular L-R energy (ELR,el). Thus,the ELR,vdW contribution in ELRvdW�el is probablyresponsible for the difference in the ELR(LL, RR, LR)range observed in Figure 2(a). The ELR(LL, RR, LR)values found for each L-R lowest-energy conforma-tion of sets 1a and 1b are shown in Tables III and V,respectively.
The thermodynamic descriptors of the boundand unbound states found for the set 1a and 1b arepresented in Tables III–VII. As already mentioned,those descriptors were generated for the lowestenergy conformation of each L-R state from MDcalculations (500 ps at 310 K).
Each data set was organized in a matrix formatcomposed of 16 rows (investigated ligands) and 66
columns (independent variables � thermodynamicdescriptors) (see Table II). The correlation coeffi-cients between the independent variables (descrip-tors) from MDS and biological activity data (pMIC)suggest that the following energy contributions areimportant to set 1a: 1-4 interaction energy (Len-nard-Jones) of the complex L-R [ELRE1,4] (�0.62);1-4 bonding energy (Lennard-Jones) of unbound L[ELE1,4] (�0.67); van der Waals bonding energy ofunbound L [ELvdW] (0.60); electrostatic bonding en-ergy of unbound L [ELel] (0.63); and the sum ofelectrostatic and hydrogen bonding energies of un-bound L [ELel�Hb] (0.73). Likewise, the dihedraltorsional energy of unbound L [ELtors] appears tobe relevant to the biological activity in set 1b(�0.62).
TABLE VI _____________________________________________________________________________________________Thermodynamic descriptors found for the L lowest-energy conformations (set 1b) from 500 ps MDS at 310 K.
Ligand (L)ELstre
(kcal � mol)ELbend
(kcal � mol)ELtors
(kcal � mol)ELE1,4
(kcal � mol)ELvdW
(kcal � mol)ELel
(kcal � mol)ELHb
(kcal � mol)EL(LM)
(kcal � mol)EL(LL)
(kcal � mol)
INHc_A 32.31 63.86 16.93 �308.54 �16.44 33.95 �236.92 �14.71 �429.55INHd2c_A 25.97 59.65 17.48 �429.55 �18.31 80.56 �262.39 �13.00 �539.59INHd14c_A 33.19 64.24 17.91 �428.73 �18.49 87.29 �241.25 �13.42 �499.26INHd43c_A 25.04 60.18 15.26 �420.71 �11.80 75.14 �301.76 �12.57 �571.22INHd37c_A 32.20 62.14 17.69 �434.64 �14.90 91.22 �249.35 �15.10 �510.74INHd15c_A 30.67 61.56 15.62 �423.14 �18.24 82.73 �208.38 �15.66 �474.83
SD 3.51 1.87 1.12 48.76 2.64 20.93 31.03 1.25 49.49
INHd18c_M 35.03 73.72 20.48 �386.53 �19.17 73.59 �203.23 �17.92 �424.03INHd25c_M 25.22 64.40 20.08 �392.45 �21.37 92.46 �286.71 �13.20 �511.57INHd30c_M 24.10 62.39 15.58 �277.42 �21.30 49.02 �272.11 �11.50 �431.23INHd22c_M 25.99 59.72 20.30 �406.08 �22.60 64.43 �274.19 �14.75 �547.18INHd27c_M 27.10 63.84 27.38 �383.09 �22.70 81.09 �263.90 �15.00 �485.28
SD 4.36 5.30 4.23 52.00 1.42 16.50 32.78 2.38 52.56
INHd47c_I 33.99 52.62 14.05 �281.55 �24.10 37.93 �213.33 �14.38 �394.76INHd19c_I 35.54 62.16 22.45 �376.59 �11.12 71.42 �232.48 �18.21 �446.83INHd41c_I 25.88 67.78 20.57 �415.06 �19.53 88.32 �285.94 �13.68 �531.66INHd48c_I 28.25 63.01 26.76 �382.75 �20.43 97.29 �288.00 �13.09 �488.97INHd49c_I 24.15 72.18 30.17 �396.50 �23.37 73.85 �259.75 �11.30 �490.57
SD 5.00 7.32 6.16 51.87 5.17 22.67 32.82 2.55 51.92
A, active; M, medium activity; I, inactive; c, ligands built from crystallographic structure 1zid [9] without previous treatment; SD,standard deviation of the descriptors found for the L lowest-energy conformations from MDS, regarding the biological activity class;INH, isoniazid; INHd, aromatic, heteroaromatic, and ring substituted hydrazides, isoniazid derivatives.
TABLE VII ____________________________________________________________________________________________Thermodynamic descriptors found for the R lowest-energy conformation from 500 ps MDS at 310 K.
Receptor (R)ERstre
(kcal � mol)ERbend
(kcal � mol)ERtors
(kcal � mol)ERE1,4
(kcal � mol)ERvdW
(kcal � mol)ERel
(kcal � mol)ERvdW�el
(kcal � mol)ERHb
(kcal � mol)ER(RM)
(kcal � mol)ER(RR)
(kcal � mol)
InhA 1444.53 2716.74 2114.78 5202.71 �2010.33 �6927.25 �46.60 �43175.74 �20.23 �40701.39
InhA model, enoyl-acp reductase from M. tuberculosis.
MDS OF ISONIAZID DERIVATIVES BOUND TO InhA FROM M. tuberculosis
VOL. 106, NO. 13 DOI 10.1002/qua INTERNATIONAL JOURNAL OF QUANTUM CHEMISTRY 2697
Comparing all descriptors obtained for set 1awith the respective descriptors of set 1b, the corre-lation value was 0.9959, which points to the conclu-sion that there is no significant difference betweenthe two data sets. Therefore, in this study, only theresults of exploratory analysis (PCA) found for set1a, which contains the hypothesized active confor-mations from a previous RI 4D-QSAR analysis [10],are discussed.
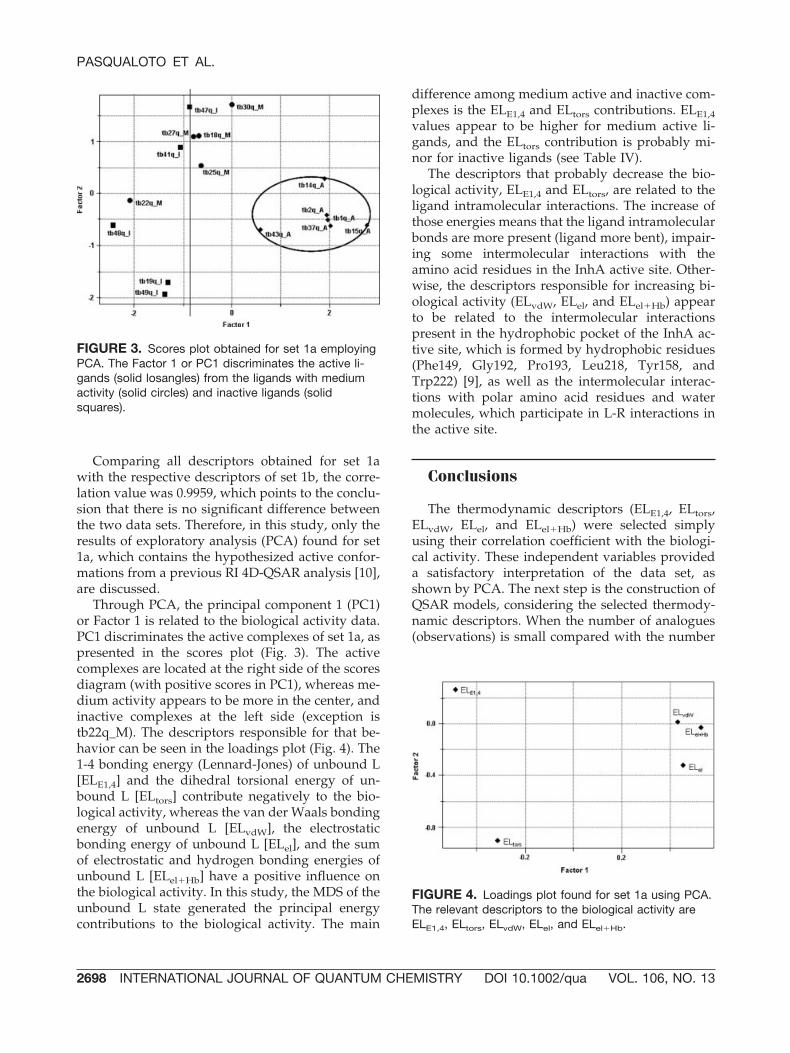
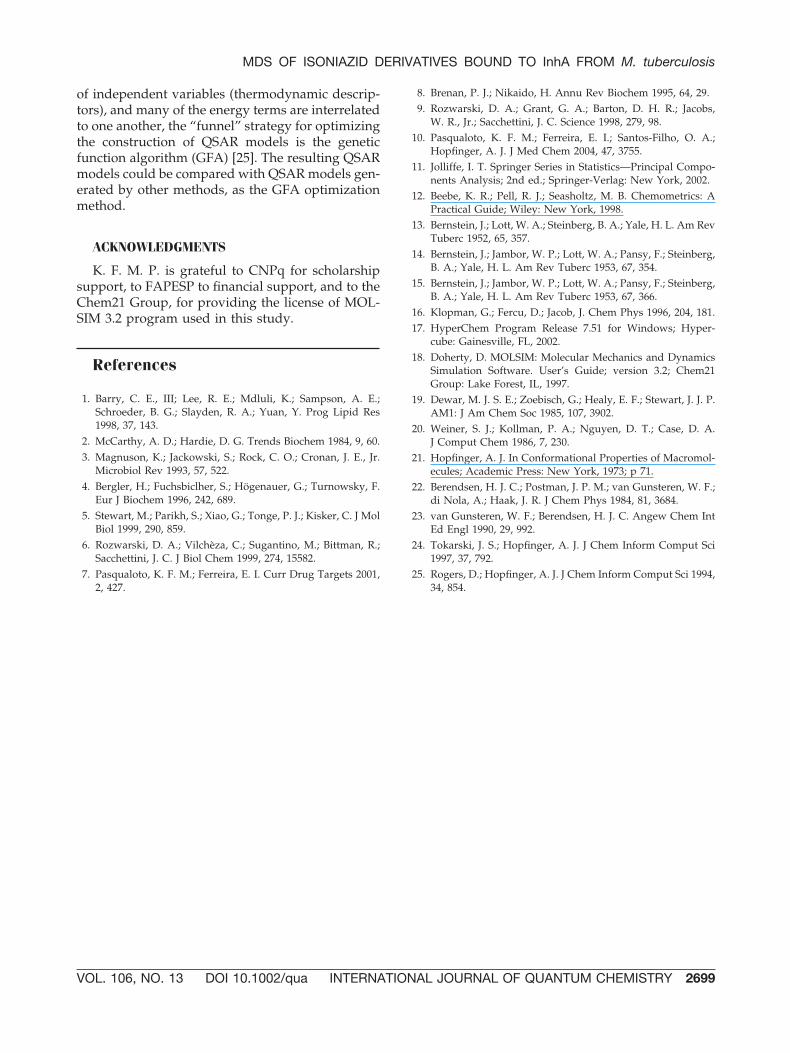
Through PCA, the principal component 1 (PC1)or Factor 1 is related to the biological activity data.PC1 discriminates the active complexes of set 1a, aspresented in the scores plot (Fig. 3). The activecomplexes are located at the right side of the scoresdiagram (with positive scores in PC1), whereas me-dium activity appears to be more in the center, andinactive complexes at the left side (exception istb22q_M). The descriptors responsible for that be-havior can be seen in the loadings plot (Fig. 4). The1-4 bonding energy (Lennard-Jones) of unbound L[ELE1,4] and the dihedral torsional energy of un-bound L [ELtors] contribute negatively to the bio-logical activity, whereas the van der Waals bondingenergy of unbound L [ELvdW], the electrostaticbonding energy of unbound L [ELel], and the sumof electrostatic and hydrogen bonding energies ofunbound L [ELel�Hb] have a positive influence onthe biological activity. In this study, the MDS of theunbound L state generated the principal energycontributions to the biological activity. The main
difference among medium active and inactive com-plexes is the ELE1,4 and ELtors contributions. ELE1,4values appear to be higher for medium active li-gands, and the ELtors contribution is probably mi-nor for inactive ligands (see Table IV).
The descriptors that probably decrease the bio-logical activity, ELE1,4 and ELtors, are related to theligand intramolecular interactions. The increase ofthose energies means that the ligand intramolecularbonds are more present (ligand more bent), impair-ing some intermolecular interactions with theamino acid residues in the InhA active site. Other-wise, the descriptors responsible for increasing bi-ological activity (ELvdW, ELel, and ELel�Hb) appearto be related to the intermolecular interactionspresent in the hydrophobic pocket of the InhA ac-tive site, which is formed by hydrophobic residues(Phe149, Gly192, Pro193, Leu218, Tyr158, andTrp222) [9], as well as the intermolecular interac-tions with polar amino acid residues and watermolecules, which participate in L-R interactions inthe active site.
Conclusions
The thermodynamic descriptors (ELE1,4, ELtors,ELvdW, ELel, and ELel�Hb) were selected simplyusing their correlation coefficient with the biologi-cal activity. These independent variables provideda satisfactory interpretation of the data set, asshown by PCA. The next step is the construction ofQSAR models, considering the selected thermody-namic descriptors. When the number of analogues(observations) is small compared with the number
FIGURE 4. Loadings plot found for set 1a using PCA.The relevant descriptors to the biological activity areELE1,4, ELtors, ELvdW, ELel, and ELel�Hb.
FIGURE 3. Scores plot obtained for set 1a employingPCA. The Factor 1 or PC1 discriminates the active li-gands (solid losangles) from the ligands with mediumactivity (solid circles) and inactive ligands (solidsquares).
PASQUALOTO ET AL.
2698 INTERNATIONAL JOURNAL OF QUANTUM CHEMISTRY DOI 10.1002/qua VOL. 106, NO. 13
of independent variables (thermodynamic descrip-tors), and many of the energy terms are interrelatedto one another, the “funnel” strategy for optimizingthe construction of QSAR models is the geneticfunction algorithm (GFA) [25]. The resulting QSARmodels could be compared with QSAR models gen-erated by other methods, as the GFA optimizationmethod.
ACKNOWLEDGMENTS
K. F. M. P. is grateful to CNPq for scholarshipsupport, to FAPESP to financial support, and to theChem21 Group, for providing the license of MOL-SIM 3.2 program used in this study.
References
1. Barry, C. E., III; Lee, R. E.; Mdluli, K.; Sampson, A. E.;Schroeder, B. G.; Slayden, R. A.; Yuan, Y. Prog Lipid Res1998, 37, 143.
2. McCarthy, A. D.; Hardie, D. G. Trends Biochem 1984, 9, 60.3. Magnuson, K.; Jackowski, S.; Rock, C. O.; Cronan, J. E., Jr.
Microbiol Rev 1993, 57, 522.4. Bergler, H.; Fuchsbiclher, S.; Hogenauer, G.; Turnowsky, F.
Eur J Biochem 1996, 242, 689.5. Stewart, M.; Parikh, S.; Xiao, G.; Tonge, P. J.; Kisker, C. J Mol
Biol 1999, 290, 859.6. Rozwarski, D. A.; Vilcheza, C.; Sugantino, M.; Bittman, R.;
Sacchettini, J. C. J Biol Chem 1999, 274, 15582.7. Pasqualoto, K. F. M.; Ferreira, E. I. Curr Drug Targets 2001,
2, 427.
8. Brenan, P. J.; Nikaido, H. Annu Rev Biochem 1995, 64, 29.9. Rozwarski, D. A.; Grant, G. A.; Barton, D. H. R.; Jacobs,
W. R., Jr.; Sacchettini, J. C. Science 1998, 279, 98.10. Pasqualoto, K. F. M.; Ferreira, E. I.; Santos-Filho, O. A.;
Hopfinger, A. J. J Med Chem 2004, 47, 3755.11. Jolliffe, I. T. Springer Series in Statistics—Principal Compo-
nents Analysis; 2nd ed.; Springer-Verlag: New York, 2002.12. Beebe, K. R.; Pell, R. J.; Seasholtz, M. B. Chemometrics: A
Practical Guide; Wiley: New York, 1998.13. Bernstein, J.; Lott, W. A.; Steinberg, B. A.; Yale, H. L. Am Rev
Tuberc 1952, 65, 357.14. Bernstein, J.; Jambor, W. P.; Lott, W. A.; Pansy, F.; Steinberg,
B. A.; Yale, H. L. Am Rev Tuberc 1953, 67, 354.15. Bernstein, J.; Jambor, W. P.; Lott, W. A.; Pansy, F.; Steinberg,
B. A.; Yale, H. L. Am Rev Tuberc 1953, 67, 366.16. Klopman, G.; Fercu, D.; Jacob, J. Chem Phys 1996, 204, 181.17. HyperChem Program Release 7.51 for Windows; Hyper-
cube: Gainesville, FL, 2002.18. Doherty, D. MOLSIM: Molecular Mechanics and Dynamics
Simulation Software. User’s Guide; version 3.2; Chem21Group: Lake Forest, IL, 1997.
19. Dewar, M. J. S. E.; Zoebisch, G.; Healy, E. F.; Stewart, J. J. P.AM1: J Am Chem Soc 1985, 107, 3902.
20. Weiner, S. J.; Kollman, P. A.; Nguyen, D. T.; Case, D. A.J Comput Chem 1986, 7, 230.
21. Hopfinger, A. J. In Conformational Properties of Macromol-ecules; Academic Press: New York, 1973; p 71.
22. Berendsen, H. J. C.; Postman, J. P. M.; van Gunsteren, W. F.;di Nola, A.; Haak, J. R. J Chem Phys 1984, 81, 3684.
23. van Gunsteren, W. F.; Berendsen, H. J. C. Angew Chem IntEd Engl 1990, 29, 992.
24. Tokarski, J. S.; Hopfinger, A. J. J Chem Inform Comput Sci1997, 37, 792.
25. Rogers, D.; Hopfinger, A. J. J Chem Inform Comput Sci 1994,34, 854.
MDS OF ISONIAZID DERIVATIVES BOUND TO InhA FROM M. tuberculosis
VOL. 106, NO. 13 DOI 10.1002/qua INTERNATIONAL JOURNAL OF QUANTUM CHEMISTRY 2699


![Programme1R[1] - INHA](https://static.cupdf.com/doc/110x72/62b3c82dff311a3a8c0ef049/programme1r1-inha.jpg)