royalsocietypublishing.org/journal/rstb
ResearchCite this article: Kao AB, Couzin ID. 2019
Modular structure within groups causes
information loss but can improve
decision accuracy. Phil. Trans. R. Soc. B 374:
20180378.
http://dx.doi.org/10.1098/rstb.2018.0378
Accepted: 19 January 2019
One contribution of 15 to a theme issue ‘Liquid
brains, solid brains: How distributed cognitive
architectures process information’.
Subject Areas:theoretical biology, computational biology,
behaviour, ecology
Keywords:collective behaviour, collective decision-
making, modular structure, subgrouping,
information correlation
Author for correspondence:Albert B. Kao
e-mail: [email protected]
& 2019 The Authors. Published by the Royal Society under the terms of the Creative Commons AttributionLicense http://creativecommons.org/licenses/by/4.0/, which permits unrestricted use, provided the originalauthor and source are credited.
Electronic supplementary material is available
online at https://dx.doi.org/10.6084/m9.
figshare.c.4441757.
KonstaURL: http://nbn-
Modular structure within groups causesinformation loss but can improvedecision accuracy
Albert B. Kao1 and Iain D. Couzin2,3,4
1Santa Fe Institute, Santa Fe, NM 87501, USA2Department of Collective Behaviour, Max Planck Institute for Ornithology, 78464 Konstanz, Germany3Chair of Biodiversity and Collective Behaviour, Department of Biology, and 4Centre for the Advanced Study ofCollective Behaviour, University of Konstanz, 78457 Konstanz, Germany
ABK, 0000-0001-8232-8365; IDC, 0000-0001-8556-4558
Many animal groups exhibit signatures of persistent internal modular struc-
ture, whereby individuals consistently interact with certain groupmates
more than others. In such groups, information relevant to a collective
decision may spread unevenly through the group, but how this impacts
the quality of the resulting decision is not well understood. Here, we expli-
citly model modularity within animal groups and examine how it affects the
amount of information represented in collective decisions, as well as the
accuracy of those decisions. We find that modular structure necessarily
causes a loss of information, effectively silencing the input from a fraction
of the group. However, the effect of this information loss on collective accu-
racy depends on the informational environment in which the decision is
made. In simple environments, the information loss is detrimental to collec-
tive accuracy. By contrast, in complex environments, modularity tends to
improve accuracy. This is because small group sizes typically maximize col-
lective accuracy in such environments, and modular structure allows a large
group to behave like a smaller group (in terms of its decision-making). These
results suggest that in naturalistic environments containing correlated infor-
mation, large animal groups may be able to exploit modular structure to
improve decision accuracy while retaining other benefits of large group size.
This article is part of the theme issue ‘Liquid brains, solid brains: How
distributed cognitive architectures process information’.
1. IntroductionFrom choosing where to invest time searching for food to deciding whether to
fight or flee from a predator, an animal’s decisions may impact its probability of
survival and reproduction. Animals have therefore evolved mechanisms to
exploit available information in order to improve their decisions. Many organ-
isms do not make such decisions in isolation, however. The social environment
in which many animals live (and make decisions) can also strongly influence
the decision-making abilities of individuals. Indeed, a large and growing
body of theoretical and empirical evidence suggests that making decisions col-
lectively can often improve decision accuracy across a wide range of contexts,
including detecting the presence of predators [1,2], locating the correct direction
in which to migrate [3,4], when climbing environmental gradients [5,6] and dis-
covering energy-efficient travelling routes [7,8]. Similar results have been
obtained in several domains of human decision-making, including forecasting
future events [9], forming medical diagnoses [10] and estimating numerosities
[11–13], suggesting that the mechanisms underlying collective decision-
making may be general and find broad applications across contexts and species.
One such collective decision-making mechanism involves the pooling of infor-
mation across individuals in the group [3,4]. Because each group member
nzer Online-Publikations-System (KOPS) resolving.de/urn:nbn:de:bsz:352-2-dipxose6ed5e9

royalsocietypublishing.org/journal/rstbPhil.Trans.R.Soc.B
374:20180378
2
necessarily occupies a unique position in space, and thereforeexperiences somewhat unique stimuli from the environment,
the information available to the group as a whole can be much
greater than that sensed by any single individual [14,15]. It has
therefore been hypothesized that the collective decision gener-
ated by such a distributed sensory array has the potential to
outperform individual decisions, simply owing to the greater
amount of information available to the group [14].
However, the decision-making benefits of information
pooling require some diversity of information among the indi-
viduals, since there can be no potential for improvement in
decision accuracy if all individuals possess identical infor-
mation. In reality, rather than being completely independent
of each other, the information perceived by animals in a
group will often be correlated to some degree. This can arise
owing to intrinsic spatial correlations in environmental cues
(e.g. odour plumes, sounds or visual stimuli) [16,17]. Another
mechanism by which opinions can be correlated is if individ-
uals can be influenced by the opinions, or behaviour, of
others through social learning [11,18]. Such correlations in
information across individuals have been shown to degrade
collective accuracy generally [19–23], and recent research has
demonstrated that small groups often maximize collective
accuracy in such scenarios [16,18]. Increasing group size
initially allows the individuals to exploit the benefits of infor-
mation pooling, but increasing the size of the group further
causes correlations (either from the environment or from
social influence) to dominate the collective decision-making
and consequently degrade accuracy [16].
Models that seek to explain the benefits of collective
decision-making, whether in relatively simple environments
or scenarios involving correlations, typically assume, either
explicitly or implicitly, that individuals in groups make
decisions through simple majority rule, or a related rule
such as a weighted majority [24] or quorum rule [1,25–28].
Indeed, majority rule can be mapped onto many real
animal decision mechanisms [29–32], and even models of
collective movement, where individuals are typically
assumed to interact only with near neighbours, produce over-
all decisions that closely match majority rule [17,24,33]. In
short, animal groups are often assumed to be well-mixed
over the course of a decision, such that the resulting decision
is well approximated by simple majority rule.
By contrast, however, rather than being well-mixed, many
real animal groups exhibit signatures of persistent modular
structure in the group, whereby individuals interact with cer-
tain other individuals more than others. Early studies of fish
schools in the laboratory and in the field described subsets of
the school moving semi-independently [34–37], often form-
ing appendages at the edges of the school [38] or ‘lacunae’
within the school [39–43]. Distinct subgroups within the
larger school have been observed in a wide range of fish
species, including saithe [39,44], herring [35,45], mackerel
[46], capelin [47] and minnows [42], through the observation
of correlations in movement across individuals, or the detec-
tion of high density regions within a school. In these studies,
for schools ranging in size from 12 to 70 fish, subgroups
tended to consist of two to five individuals [46]. Similarly,
in birds, subgroups have been observed in rock doves [48]
and domains of correlated movement have been identified
in starlings [49].
More broadly, many animal species can form complex
hierarchical structures within a social group, or societies
within a larger population [50]. By characterizing the social
networks of animal groups (e.g. [51,52]) or using other
methods, researchers have identified such complex social
structures across diverse taxa, including primates [53,54],
bats [55], hyenas [56], equids [52], cetaceans [57], elephants
[58] and birds [59]. In such hierarchical structures, a particu-
lar animal often forms close alliances with certain individuals
(such as kin), but maintains relatively looser affiliations with
others, either within the same group, or across distinct
groups. A number of proximate mechanisms, including indi-
vidual recognition and self-sorting (without the need for
individual recognition) [51,60,61] have been found to be
capable of generating persistent non-random associations
between individuals.
Furthermore, many social insects, such as ants [62,63],
honeybees [64], bumblebees [65] and wasps [66], interact
more frequently with certain individuals in the colony than
other individuals. This spatial heterogeneity can strongly
affect how information about food availability or environ-
mental conditions spreads across the colony. However,
because collective decisions in such colonies also use other
mechanisms, such as pheromones [67], waggle dances [68]
and recruitment [69]—often physically embodied outside of
the nest site—in this study we focus on modelling other
animal groups, such as fish schools and bird flocks, rather
than social insects in particular.
In the context of this special issue, animal groups exhibit-
ing some modular structure inhabit an intermediate space
between ‘liquid brains’ (in which the links connecting com-
ponents are highly dynamic) and ‘solid brains’ (in which
the links are static), exhibiting some features of both. Here,
we systematically examine the effect of such intermediate
structure on the quality of collective decision-making by
group-living animals. To facilitate this analysis, we define a
new measure of the information contained within a collective
decision, the effective group size (in analogy to effective popu-
lation size in population genetics, and effective reproduction
number in disease dynamics), which allows for the quantifi-
cation of the effect of modular structure on the quality of a
collective decision. We then analyse the effect of modularity
within simple environments, as well as more naturalistic
scenarios (environments with multiple cues that vary in cor-
relation [16]) to understand how such internal structure may
be strategically exploited by animals in a group to improve
collective decision accuracy.
2. Defining the effective group sizeThe classic Condorcet jury theorem [70] demonstrated that,
given a choice between two options (where one option is
inherently superior to the other but is known imperfectly to
a group of individuals) in which each individual selects the
better option with the same probability r . 0.5, then the opti-
mal method to combine the individual opinions is to select
the more popular option (i.e. simple majority rule) [71].
Doing so allows for a monotonic increase in collective
decision accuracy as group size increases, saturating at per-
fect accuracy as group size grows very large (figure 1a).
Although each individual contributes equally valuable
information to the group (i.e. they all have the same individual
accuracy r), the marginal improvement in collective accuracy
owing to the addition of another individual decreases with

0 20 40 60 80 1000.5
0.6
0.7
0.8
0.9
1.0
0.5 0.6 0.7 0.8 0.9 1.00
20
40
60
80
100(a) (b)
total group size N observed collective accuracy
effe
ctiv
e gr
oup
size
Nef
f
optim
al c
olle
ctiv
e ac
cura
cy(v
ia s
impl
e m
ajor
ity r
ule) r = 0.55
r = 0.60
r = 0.70
r = 0.55
r = 0.60r = 0.70
Figure 1. Defining the effective group size. (a) A group of individuals, each with a probability r of selecting the correct option (out of two available options), canmaximize its collective accuracy by combining the individual opinions through simple majority rule. Shown is the collective accuracy resulting from simple majorityrule as a function of the total group size N. (b) By inverting the relationship in (a), we define a new measure, the effective group size Neff, to describe the infor-mation loss incurred owing to modular structure within the group. The effective group size is the size of the group that, making a decision through simple majorityrule, achieves the same observed accuracy as a (larger) group containing some modular structure.
(a) (b) (c)
t = 2
t = 1
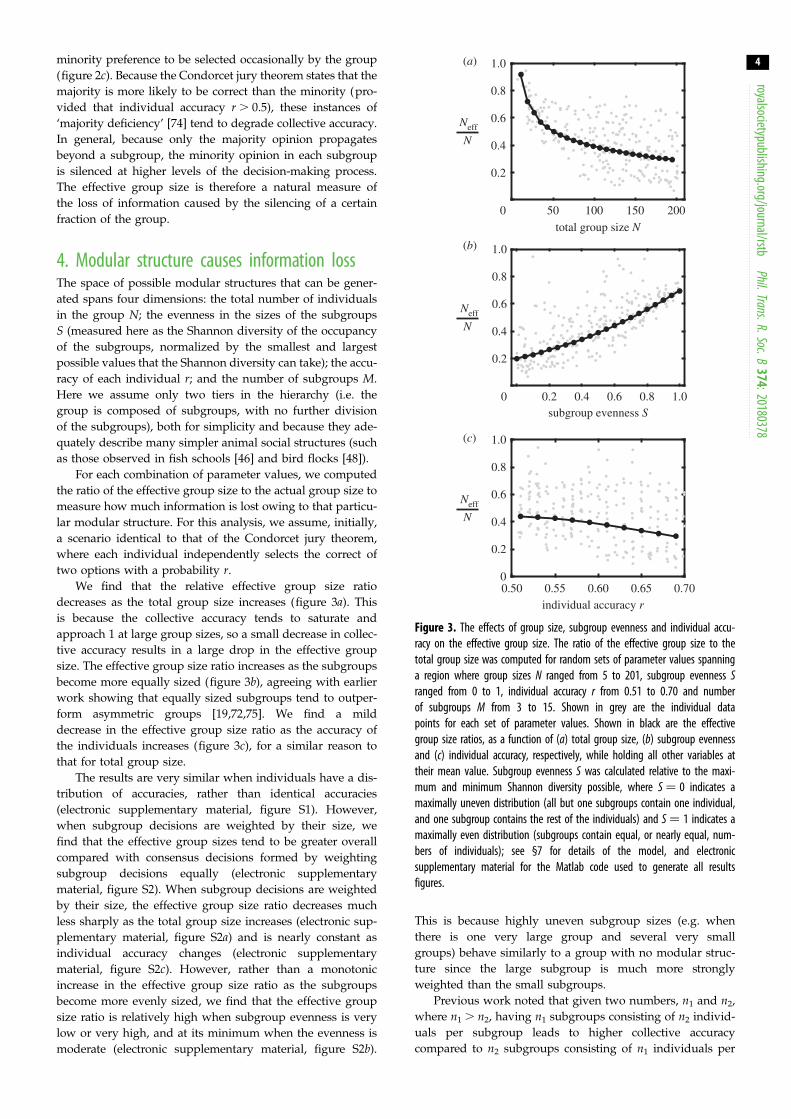
Figure 2. Modelling modular structure in groups. (a) Many group-living animals associate closely (solid lines) with certain individuals, and only interact weakly(dotted lines) with other individuals, which can create persistent subgroups within the larger group. (b) To model such modular structure in animal groups, weassign each individual to a unique subgroup (dotted circles). The individuals within each subgroup form a consensus opinion through simple majority rule (shown intier t ¼ 1). Following this, the decisions of the subgroups are then combined into an overall consensus decision, also through simple majority rule (tier t ¼ 2). Anarbitrary number of subgroups and tiers can be modelled in this framework. (c) An example demonstrating how a minority can determine the collective decisionwhen modularity is present. While a majority (five out of 11) individuals voted for one option (indicated in black), this particular assortment of individuals intosubgroups resulted in a consensus decision for the other option (indicated in white).
royalsocietypublishing.org/journal/rstbPhil.Trans.R.Soc.B
374:20180378
3
group size. This nonlinear relationship between group size
and collective accuracy makes collective accuracy a subopti-
mal measure to quantify the effect of modular structure on
decision accuracy. To counter this, we define a new measure
of information content, the effective group size, by inverting
the relationship illustrated in figure 1a. Thus, for a particular
individual accuracy r, we can map any observed collective
accuracy, arising from any decision-making process or any
internally structured group, to an effective group size Neff,
which is the group size that would achieve the same collective
accuracy if making a decision by simple majority rule (figure
1b). Given that simple majority rule reflects the optimal use of
the available information contained within the individuals in
the group in this context, the effective group size will generally
be smaller than the actual group size. The ratio between the
effective group size Neff and the actual group size N allows
us to quantify how much information is lost owing to the
introduction of internal structure, or other details of the collec-
tive decision-making process.
3. Modelling modular structure within groupsMany animals living in social groups associate strongly with
a subset of the group, and more weakly with other group
members [50,60,61]. As a result, relatively distinct, semi-
independent subgroups can often be detected within the
group [46]. In such groups, information may be shared
among members of a particular subgroup at a relatively fast
time-scale, while information is transferred, and a consensus
formed, between subgroups at a slower time-scale (figure 2a).
To formalize this structure, we consider each individual
to belong to a particular, mutually exclusive subgroup
(figure 2b). A consensus is first formed within each subgroup
through simple majority rule, and then the decisions of the
subgroups are combined to form an overall collective
decision, also through simple majority rule (see §7 for
details). To increase the generality of our results, we addition-
ally tested two modifications to our model. One model does
not assume that individuals have identical accuracies but
rather have accuracies normally distributed around some
value, while the other model assumes that the decisions of
the subgroups are combined not through simple majority
rule but instead are weighted by the size of each subgroup
(see §7 for details). In addition, the structure may be general-
ized from the two-tier system that we examine here, to many
tiers, in which subgroups are further divided into smaller
units.
Previous theoretical work has shown that, in general,
such modular structure causes a loss of information, whereby
decisions made in these systems tend to be less accurate com-
pared to decisions made when all group members vote
directly through majority rule, without any such internal
structure [72–74]. This is because modularity allows the
0.50 0.55 0.60 0.65 0.700
0.2
0.4
0.6
0.8
1.0
0.2 0.4 0.6 0.8 1.00
0.2
0.4
0.6
0.8
1.0
50 100 150 2000
0.2
0.4
0.6
0.8
1.0
total group size N
subgroup evenness S
individual accuracy r
(a)
(b)
(c)
Neff
N
Neff
N
Neff
N
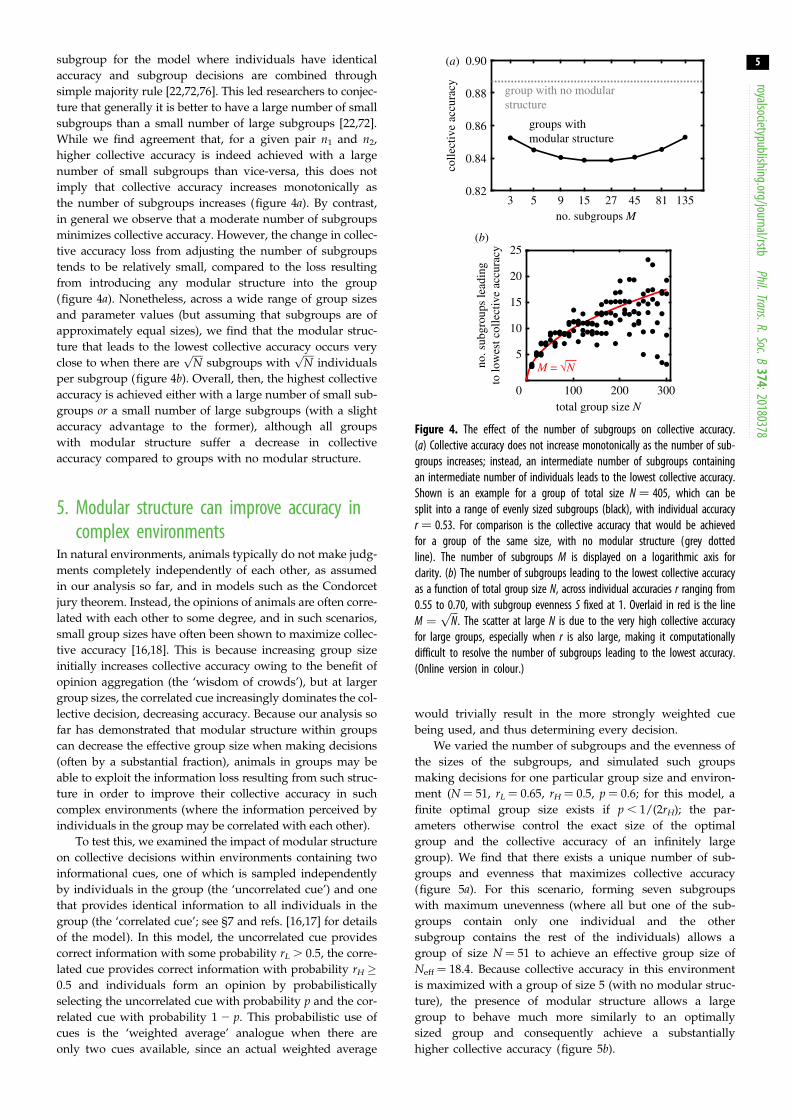
Figure 3. The effects of group size, subgroup evenness and individual accu-racy on the effective group size. The ratio of the effective group size to thetotal group size was computed for random sets of parameter values spanninga region where group sizes N ranged from 5 to 201, subgroup evenness Sranged from 0 to 1, individual accuracy r from 0.51 to 0.70 and numberof subgroups M from 3 to 15. Shown in grey are the individual datapoints for each set of parameter values. Shown in black are the effectivegroup size ratios, as a function of (a) total group size, (b) subgroup evennessand (c) individual accuracy, respectively, while holding all other variables attheir mean value. Subgroup evenness S was calculated relative to the maxi-mum and minimum Shannon diversity possible, where S ¼ 0 indicates amaximally uneven distribution (all but one subgroups contain one individual,and one subgroup contains the rest of the individuals) and S ¼ 1 indicates amaximally even distribution (subgroups contain equal, or nearly equal, num-bers of individuals); see §7 for details of the model, and electronicsupplementary material for the Matlab code used to generate all resultsfigures.
royalsocietypublishing.org/journal/rstbPhil.Trans.R.Soc.B
374:20180378
4
minority preference to be selected occasionally by the group(figure 2c). Because the Condorcet jury theorem states that the
majority is more likely to be correct than the minority (pro-
vided that individual accuracy r . 0.5), these instances of
‘majority deficiency’ [74] tend to degrade collective accuracy.
In general, because only the majority opinion propagates
beyond a subgroup, the minority opinion in each subgroup
is silenced at higher levels of the decision-making process.
The effective group size is therefore a natural measure of
the loss of information caused by the silencing of a certain
fraction of the group.
4. Modular structure causes information lossThe space of possible modular structures that can be gener-
ated spans four dimensions: the total number of individuals
in the group N; the evenness in the sizes of the subgroups
S (measured here as the Shannon diversity of the occupancy
of the subgroups, normalized by the smallest and largest
possible values that the Shannon diversity can take); the accu-
racy of each individual r; and the number of subgroups M.
Here we assume only two tiers in the hierarchy (i.e. the
group is composed of subgroups, with no further division
of the subgroups), both for simplicity and because they ade-
quately describe many simpler animal social structures (such
as those observed in fish schools [46] and bird flocks [48]).
For each combination of parameter values, we computed
the ratio of the effective group size to the actual group size to
measure how much information is lost owing to that particu-
lar modular structure. For this analysis, we assume, initially,
a scenario identical to that of the Condorcet jury theorem,
where each individual independently selects the correct of
two options with a probability r.
We find that the relative effective group size ratio
decreases as the total group size increases (figure 3a). This
is because the collective accuracy tends to saturate and
approach 1 at large group sizes, so a small decrease in collec-
tive accuracy results in a large drop in the effective group
size. The effective group size ratio increases as the subgroups
become more equally sized (figure 3b), agreeing with earlier
work showing that equally sized subgroups tend to outper-
form asymmetric groups [19,72,75]. We find a mild
decrease in the effective group size ratio as the accuracy of
the individuals increases (figure 3c), for a similar reason to
that for total group size.
The results are very similar when individuals have a dis-
tribution of accuracies, rather than identical accuracies
(electronic supplementary material, figure S1). However,
when subgroup decisions are weighted by their size, we
find that the effective group sizes tend to be greater overall
compared with consensus decisions formed by weighting
subgroup decisions equally (electronic supplementary
material, figure S2). When subgroup decisions are weighted
by their size, the effective group size ratio decreases much
less sharply as the total group size increases (electronic sup-
plementary material, figure S2a) and is nearly constant as
individual accuracy changes (electronic supplementary
material, figure S2c). However, rather than a monotonic
increase in the effective group size ratio as the subgroups
become more evenly sized, we find that the effective group
size ratio is relatively high when subgroup evenness is very
low or very high, and at its minimum when the evenness is
moderate (electronic supplementary material, figure S2b).
This is because highly uneven subgroup sizes (e.g. when
there is one very large group and several very small
groups) behave similarly to a group with no modular struc-
ture since the large subgroup is much more strongly
weighted than the small subgroups.
Previous work noted that given two numbers, n1 and n2,
where n1 . n2, having n1 subgroups consisting of n2 individ-
uals per subgroup leads to higher collective accuracy
compared to n2 subgroups consisting of n1 individuals per
100 200 3000
5
10
15
20
25
no. subgroups M
total group size N
colle
ctiv
e ac
cura
cy
no. s
ubgr
oups
lead
ing
to lo
wes
t col
lect
ive
accu
racy
3 5 9 15 27 45 81 1350.82
0.84
0.86
0.88
0.90
group with no modularstructure
groups withmodular structure
(a)
(b)
M = ÷N
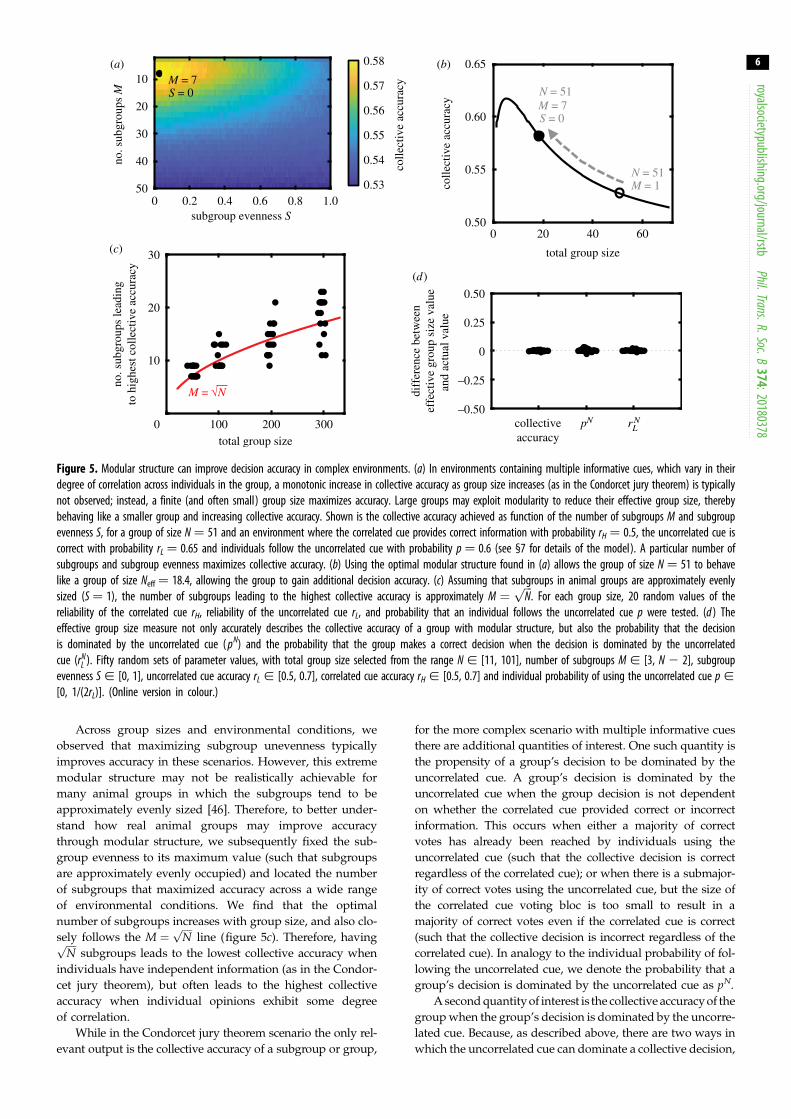
Figure 4. The effect of the number of subgroups on collective accuracy.(a) Collective accuracy does not increase monotonically as the number of sub-groups increases; instead, an intermediate number of subgroups containing
royalsocietypublishing.org/journal/rstbPhil.Trans.R.Soc.B
374:20180378
5
subgroup for the model where individuals have identicalaccuracy and subgroup decisions are combined through
simple majority rule [22,72,76]. This led researchers to conjec-
ture that generally it is better to have a large number of small
subgroups than a small number of large subgroups [22,72].
While we find agreement that, for a given pair n1 and n2,
higher collective accuracy is indeed achieved with a large
number of small subgroups than vice-versa, this does not
imply that collective accuracy increases monotonically as
the number of subgroups increases (figure 4a). By contrast,
in general we observe that a moderate number of subgroups
minimizes collective accuracy. However, the change in collec-
tive accuracy loss from adjusting the number of subgroups
tends to be relatively small, compared to the loss resulting
from introducing any modular structure into the group
(figure 4a). Nonetheless, across a wide range of group sizes
and parameter values (but assuming that subgroups are of
approximately equal sizes), we find that the modular struc-
ture that leads to the lowest collective accuracy occurs very
close to when there areffiffiffiffi
Np
subgroups withffiffiffiffi
Np
individuals
per subgroup (figure 4b). Overall, then, the highest collective
accuracy is achieved either with a large number of small sub-
groups or a small number of large subgroups (with a slight
accuracy advantage to the former), although all groups
with modular structure suffer a decrease in collective
accuracy compared to groups with no modular structure.
an intermediate number of individuals leads to the lowest collective accuracy.Shown is an example for a group of total size N ¼ 405, which can besplit into a range of evenly sized subgroups (black), with individual accuracyr ¼ 0.53. For comparison is the collective accuracy that would be achievedfor a group of the same size, with no modular structure (grey dottedline). The number of subgroups M is displayed on a logarithmic axis forclarity. (b) The number of subgroups leading to the lowest collective accuracyas a function of total group size N, across individual accuracies r ranging from0.55 to 0.70, with subgroup evenness S fixed at 1. Overlaid in red is the lineM ¼
ffiffiffi
Np
. The scatter at large N is due to the very high collective accuracyfor large groups, especially when r is also large, making it computationallydifficult to resolve the number of subgroups leading to the lowest accuracy.(Online version in colour.)
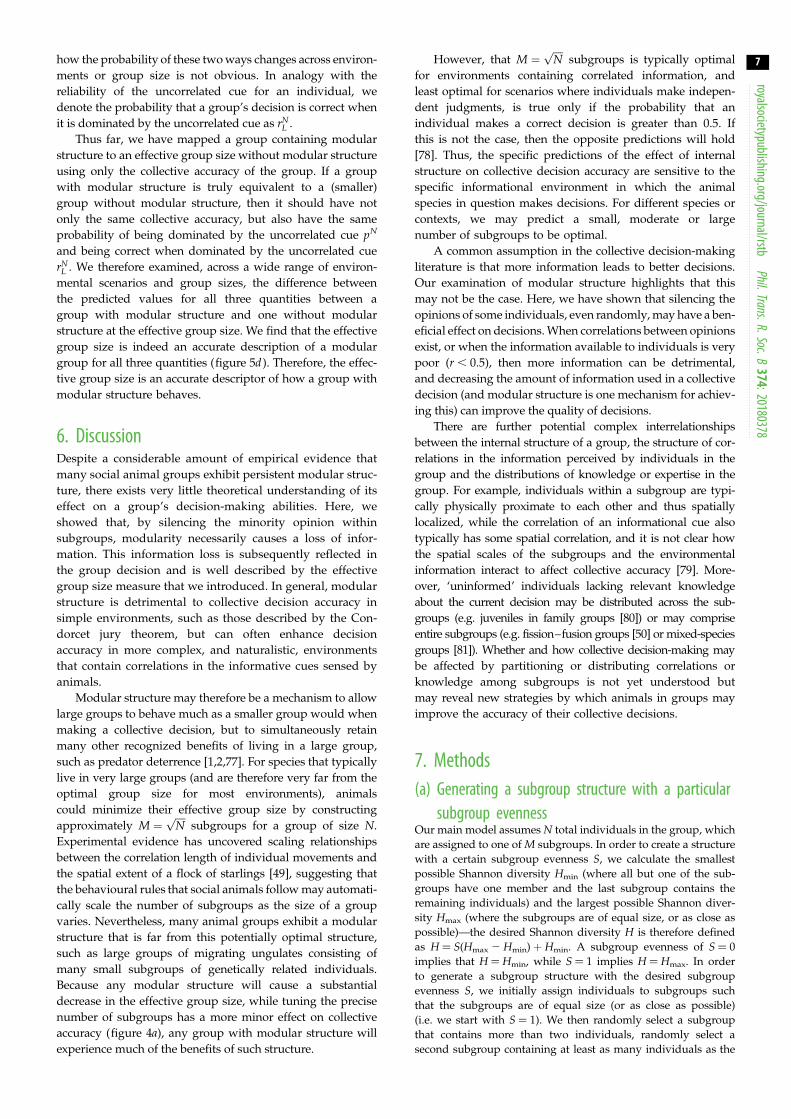
5. Modular structure can improve accuracy incomplex environments
In natural environments, animals typically do not make judg-
ments completely independently of each other, as assumed
in our analysis so far, and in models such as the Condorcet
jury theorem. Instead, the opinions of animals are often corre-
lated with each other to some degree, and in such scenarios,
small group sizes have often been shown to maximize collec-
tive accuracy [16,18]. This is because increasing group size
initially increases collective accuracy owing to the benefit of
opinion aggregation (the ‘wisdom of crowds’), but at larger
group sizes, the correlated cue increasingly dominates the col-
lective decision, decreasing accuracy. Because our analysis so
far has demonstrated that modular structure within groups
can decrease the effective group size when making decisions
(often by a substantial fraction), animals in groups may be
able to exploit the information loss resulting from such struc-
ture in order to improve their collective accuracy in such
complex environments (where the information perceived by
individuals in the group may be correlated with each other).
To test this, we examined the impact of modular structure
on collective decisions within environments containing two
informational cues, one of which is sampled independently
by individuals in the group (the ‘uncorrelated cue’) and one
that provides identical information to all individuals in the
group (the ‘correlated cue’; see §7 and refs. [16,17] for details
of the model). In this model, the uncorrelated cue provides
correct information with some probability rL . 0.5, the corre-
lated cue provides correct information with probability rH �0.5 and individuals form an opinion by probabilistically
selecting the uncorrelated cue with probability p and the cor-
related cue with probability 1 2 p. This probabilistic use of
cues is the ‘weighted average’ analogue when there are
only two cues available, since an actual weighted average
would trivially result in the more strongly weighted cue
being used, and thus determining every decision.
We varied the number of subgroups and the evenness of
the sizes of the subgroups, and simulated such groups
making decisions for one particular group size and environ-
ment (N ¼ 51, rL ¼ 0.65, rH ¼ 0.5, p ¼ 0.6; for this model, a
finite optimal group size exists if p , 1/(2rH); the par-
ameters otherwise control the exact size of the optimal
group and the collective accuracy of an infinitely large
group). We find that there exists a unique number of sub-
groups and evenness that maximizes collective accuracy
(figure 5a). For this scenario, forming seven subgroups
with maximum unevenness (where all but one of the sub-
groups contain only one individual and the other
subgroup contains the rest of the individuals) allows a
group of size N ¼ 51 to achieve an effective group size of
Neff ¼ 18.4. Because collective accuracy in this environment
is maximized with a group of size 5 (with no modular struc-
ture), the presence of modular structure allows a large
group to behave much more similarly to an optimally
sized group and consequently achieve a substantially
higher collective accuracy (figure 5b).
–0.50
–0.25
0
0.25
0.50
0 0.2 0.4 0.6 0.8 1.0
10
20
30
40
50
100 200 3000
10
20
30
0 20 40 600.50
0.55
0.60
0.65
total group size
colle
ctiv
e ac
cura
cy
no. s
ubgr
oups
lead
ing
to h
ighe
st c
olle
ctiv
e ac
cura
cy
total group size
subgroup evenness S
(a) (b)
(c)
(d)
no. s
ubgr
oups
M
collectiveaccuracy
diff
eren
ce b
etw
een
effe
ctiv
e gr
oup
size
val
uean
d ac
tual
val
ue
0.53
0.54
0.55
0.56
0.57
0.58
colle
ctiv
e ac
cura
cy
pN rLN
M = 7S = 0 N = 51
M = 7S = 0
N = 51M = 1
M = ÷N
Figure 5. Modular structure can improve decision accuracy in complex environments. (a) In environments containing multiple informative cues, which vary in theirdegree of correlation across individuals in the group, a monotonic increase in collective accuracy as group size increases (as in the Condorcet jury theorem) is typicallynot observed; instead, a finite (and often small) group size maximizes accuracy. Large groups may exploit modularity to reduce their effective group size, therebybehaving like a smaller group and increasing collective accuracy. Shown is the collective accuracy achieved as function of the number of subgroups M and subgroupevenness S, for a group of size N ¼ 51 and an environment where the correlated cue provides correct information with probability rH ¼ 0.5, the uncorrelated cue iscorrect with probability rL ¼ 0.65 and individuals follow the uncorrelated cue with probability p ¼ 0.6 (see §7 for details of the model). A particular number ofsubgroups and subgroup evenness maximizes collective accuracy. (b) Using the optimal modular structure found in (a) allows the group of size N ¼ 51 to behavelike a group of size Neff ¼ 18.4, allowing the group to gain additional decision accuracy. (c) Assuming that subgroups in animal groups are approximately evenlysized (S ¼ 1), the number of subgroups leading to the highest collective accuracy is approximately M ¼
ffiffiffi
Np
. For each group size, 20 random values of thereliability of the correlated cue rH, reliability of the uncorrelated cue rL, and probability that an individual follows the uncorrelated cue p were tested. (d ) Theeffective group size measure not only accurately describes the collective accuracy of a group with modular structure, but also the probability that the decisionis dominated by the uncorrelated cue ( pN) and the probability that the group makes a correct decision when the decision is dominated by the uncorrelatedcue (rN
L ). Fifty random sets of parameter values, with total group size selected from the range N [ [11, 101], number of subgroups M [ [3, N 2 2], subgroupevenness S [ [0, 1], uncorrelated cue accuracy rL [ [0.5, 0.7], correlated cue accuracy rH [ [0.5, 0.7] and individual probability of using the uncorrelated cue p [[0, 1/(2rL)]. (Online version in colour.)
royalsocietypublishing.org/journal/rstbPhil.Trans.R.Soc.B
374:20180378
6
Across group sizes and environmental conditions, we
observed that maximizing subgroup unevenness typically
improves accuracy in these scenarios. However, this extreme
modular structure may not be realistically achievable for
many animal groups in which the subgroups tend to be
approximately evenly sized [46]. Therefore, to better under-
stand how real animal groups may improve accuracy
through modular structure, we subsequently fixed the sub-
group evenness to its maximum value (such that subgroups
are approximately evenly occupied) and located the number
of subgroups that maximized accuracy across a wide range
of environmental conditions. We find that the optimal
number of subgroups increases with group size, and also clo-
sely follows the M ¼ffiffiffiffi
Np
line (figure 5c). Therefore, havingffiffiffiffi
Np
subgroups leads to the lowest collective accuracy when
individuals have independent information (as in the Condor-
cet jury theorem), but often leads to the highest collective
accuracy when individual opinions exhibit some degree
of correlation.
While in the Condorcet jury theorem scenario the only rel-
evant output is the collective accuracy of a subgroup or group,
for the more complex scenario with multiple informative cues
there are additional quantities of interest. One such quantity is
the propensity of a group’s decision to be dominated by the
uncorrelated cue. A group’s decision is dominated by the
uncorrelated cue when the group decision is not dependent
on whether the correlated cue provided correct or incorrect
information. This occurs when either a majority of correct
votes has already been reached by individuals using the
uncorrelated cue (such that the collective decision is correct
regardless of the correlated cue); or when there is a submajor-
ity of correct votes using the uncorrelated cue, but the size of
the correlated cue voting bloc is too small to result in a
majority of correct votes even if the correlated cue is correct
(such that the collective decision is incorrect regardless of the
correlated cue). In analogy to the individual probability of fol-
lowing the uncorrelated cue, we denote the probability that a
group’s decision is dominated by the uncorrelated cue as pN.
A second quantity of interest is the collective accuracy of the
group when the group’s decision is dominated by the uncorre-
lated cue. Because, as described above, there are two ways in
which the uncorrelated cue can dominate a collective decision,
royalsocietypublishing.org/journal/rstbPhil.Trans.R.Soc.B
374:20180378
7
how the probability of these two ways changes across environ-ments or group size is not obvious. In analogy with the
reliability of the uncorrelated cue for an individual, we
denote the probability that a group’s decision is correct when
it is dominated by the uncorrelated cue as rNL .
Thus far, we have mapped a group containing modular
structure to an effective group size without modular structure
using only the collective accuracy of the group. If a group
with modular structure is truly equivalent to a (smaller)
group without modular structure, then it should have not
only the same collective accuracy, but also have the same
probability of being dominated by the uncorrelated cue pN
and being correct when dominated by the uncorrelated cue
rNL . We therefore examined, across a wide range of environ-
mental scenarios and group sizes, the difference between
the predicted values for all three quantities between a
group with modular structure and one without modular
structure at the effective group size. We find that the effective
group size is indeed an accurate description of a modular
group for all three quantities (figure 5d ). Therefore, the effec-
tive group size is an accurate descriptor of how a group with
modular structure behaves.
6. DiscussionDespite a considerable amount of empirical evidence that
many social animal groups exhibit persistent modular struc-
ture, there exists very little theoretical understanding of its
effect on a group’s decision-making abilities. Here, we
showed that, by silencing the minority opinion within
subgroups, modularity necessarily causes a loss of infor-
mation. This information loss is subsequently reflected in
the group decision and is well described by the effective
group size measure that we introduced. In general, modular
structure is detrimental to collective decision accuracy in
simple environments, such as those described by the Con-
dorcet jury theorem, but can often enhance decision
accuracy in more complex, and naturalistic, environments
that contain correlations in the informative cues sensed by
animals.
Modular structure may therefore be a mechanism to allow
large groups to behave much as a smaller group would when
making a collective decision, but to simultaneously retain
many other recognized benefits of living in a large group,
such as predator deterrence [1,2,77]. For species that typically
live in very large groups (and are therefore very far from the
optimal group size for most environments), animals
could minimize their effective group size by constructing
approximately M ¼ffiffiffiffi
Np
subgroups for a group of size N.
Experimental evidence has uncovered scaling relationships
between the correlation length of individual movements and
the spatial extent of a flock of starlings [49], suggesting that
the behavioural rules that social animals follow may automati-
cally scale the number of subgroups as the size of a group
varies. Nevertheless, many animal groups exhibit a modular
structure that is far from this potentially optimal structure,
such as large groups of migrating ungulates consisting of
many small subgroups of genetically related individuals.
Because any modular structure will cause a substantial
decrease in the effective group size, while tuning the precise
number of subgroups has a more minor effect on collective
accuracy (figure 4a), any group with modular structure will
experience much of the benefits of such structure.
However, that M ¼ffiffiffiffi
Np
subgroups is typically optimal
for environments containing correlated information, and
least optimal for scenarios where individuals make indepen-
dent judgments, is true only if the probability that an
individual makes a correct decision is greater than 0.5. If
this is not the case, then the opposite predictions will hold
[78]. Thus, the specific predictions of the effect of internal
structure on collective decision accuracy are sensitive to the
specific informational environment in which the animal
species in question makes decisions. For different species or
contexts, we may predict a small, moderate or large
number of subgroups to be optimal.
A common assumption in the collective decision-making
literature is that more information leads to better decisions.
Our examination of modular structure highlights that this
may not be the case. Here, we have shown that silencing the
opinions of some individuals, even randomly, may have a ben-
eficial effect on decisions. When correlations between opinions
exist, or when the information available to individuals is very
poor (r , 0.5), then more information can be detrimental,
and decreasing the amount of information used in a collective
decision (and modular structure is one mechanism for achiev-
ing this) can improve the quality of decisions.
There are further potential complex interrelationships
between the internal structure of a group, the structure of cor-
relations in the information perceived by individuals in the
group and the distributions of knowledge or expertise in the
group. For example, individuals within a subgroup are typi-
cally physically proximate to each other and thus spatially
localized, while the correlation of an informational cue also
typically has some spatial correlation, and it is not clear how
the spatial scales of the subgroups and the environmental
information interact to affect collective accuracy [79]. More-
over, ‘uninformed’ individuals lacking relevant knowledge
about the current decision may be distributed across the sub-
groups (e.g. juveniles in family groups [80]) or may comprise
entire subgroups (e.g. fission–fusion groups [50] or mixed-species
groups [81]). Whether and how collective decision-making may
be affected by partitioning or distributing correlations or
knowledge among subgroups is not yet understood but
may reveal new strategies by which animals in groups may
improve the accuracy of their collective decisions.
7. Methods(a) Generating a subgroup structure with a particular
subgroup evennessOur main model assumes N total individuals in the group, which
are assigned to one of M subgroups. In order to create a structure
with a certain subgroup evenness S, we calculate the smallest
possible Shannon diversity Hmin (where all but one of the sub-
groups have one member and the last subgroup contains the
remaining individuals) and the largest possible Shannon diver-
sity Hmax (where the subgroups are of equal size, or as close as
possible)—the desired Shannon diversity H is therefore defined
as H ¼ S(Hmax 2 Hmin) þ Hmin. A subgroup evenness of S ¼ 0
implies that H ¼ Hmin, while S ¼ 1 implies H ¼ Hmax. In order
to generate a subgroup structure with the desired subgroup
evenness S, we initially assign individuals to subgroups such
that the subgroups are of equal size (or as close as possible)
(i.e. we start with S ¼ 1). We then randomly select a subgroup
that contains more than two individuals, randomly select a
second subgroup containing at least as many individuals as the

royalsocietypublishing.org/journal/rstbPhil.Trans.R.Soc.B
374:20180378
8
first subgroup (if one exists) and move two individuals from thesmaller to the larger subgroup (in order to maintain odd-sized
subgroups), thus decreasing the subgroup evenness. We con-
tinue this process of semi-randomly moving individuals across
subgroups until the desired Shannon diversity is achieved.
(b) Making a consensus collective decision in theCondorcet scenario
Each individual casts a vote (which is correct with probability r) and
each subgroup forms a consensus decision by combining the votes
of the individuals assigned to that subgroup through simple
majority rule. An overall group consensus is then formed by com-
bining the decisions of the subgroups, also by simple majority rule.
(c) Making a consensus collective decision in themultiple cues scenario
In this scenario, individuals have access to two sources of infor-
mation; however, the two sources differ in the correlation of the
information provided to each individual. For one source (the
uncorrelated cue), each individual perceives independently
sampled information from that source, which is correct with
probability rL (i.e. each individual flips a biased coin with prob-
ability rL, which determines whether that individual perceives
correct or incorrect information from that source). For the other
source (the correlated cue), all individuals in the group perceive
the same information from this source, which is correct with
probability rH (i.e. the group flips a biased coin with probability
rH once, which determines whether all of the individuals in the
group perceive correct or incorrect information from that source).
Individuals probabilistically select one of the two infor-
mation sources to base their vote on, selecting the uncorrelated
cue with probability p and the correlated cue with probability
1 2 p. These individual votes are then combined within each
subgroup, and the subgroup decisions combined into an overall
group consensus in the same manner as in the Condorcet
scenario.
(d) Modelling a distribution of individual accuraciesIn this model, we assume that individuals may have different
probabilities of voting correctly. The model is identical to the
Condorcet scenario, except that the individual accuracies may
be different for each individual. We assume that individual accu-
racies are drawn from a normal distribution with a certain
population mean and a standard deviation of 0.05.
(e) Modelling weighted average decision-makingamong subgroups
In this model, we assume that larger subgroups are more influ-
ential to the overall collective decision compared to smaller
subgroups. The model is identical to the Condorcet scenario,
with one difference: instead of the subgroup decisions combined
into an overall group consensus through simple majority rule
(where each subgroup carries the same weight), the subgroup
decisions are instead weighted by the size of each subgroup.
Data accessibility. This article has no additional data.
Competing interests. We declare we have no competing interests.
Funding. A.B.K. acknowledges support from a Baird Scholarship andan Omidyar Fellowship from the Santa Fe Institute, and a Postdoc-toral Fellowship Award in Studying Complex Systems from theJames S. McDonnell Foundation. I.D.C. acknowledges support fromthe NSF (IOS-1355061), the ONR (N00014-14-1-0635), the ARO(W911NF-14-1-0431), the ‘Struktur-und Innovationsfonds fur die For-schung (SI-BW)’ of the State of Baden-Wurttemberg, the Max PlanckSociety, and the DFG Center of Excellence 2117 ‘Center for theAdvanced Study of Collective Behaviour’ (ID: 422037984).
References
1. Ward AJW, Herbert-Read JE, Sumpter DJT,Krause J. 2011 Fast and accurate decisionsthrough collective vigilance in fish shoals. Proc.Natl Acad. Sci. USA 108, 2312 – 2315. (doi:10.1073/pnas.1007102108)
2. Handegard NO, Boswell KM, Ioannou CC, Leblanc SP,Tjøstheim DB, Couzin ID. 2012 The dynamics ofcoordinated group hunting and collective informationtransfer among schooling prey. Curr. Biol. 22,1213– 1217. (doi:10.1016/j.cub.2012.04.050)
3. Berdahl AM, Kao AB, Flack A, Westley PAH, CodlingEA, Couzin ID, Dell AI, Biro D. 2018 Collective animalnavigation and migratory culture: from theoreticalmodels to empirical evidence. Phil. Trans, R. Soc. B373, 20170009. (doi:10.1098/rstb.2017.0009)
4. Simons AM. 2004 Many wrongs: the advantage ofgroup navigation. Trends Ecol. Evol. 19, 453 – 455.(doi:10.1016/j.tree.2004.07.001)
5. Berdahl A, Torney CJ, Ioannou CC, Faria JJ, CouzinID. 2013 Emergent sensing of complexenvironments by mobile animal groups. Science339, 574 – 576. (doi:10.1126/science.1225883)
6. Grunbaum D. 1998 Schooling as a strategy for taxisin a noisy environment. Evol. Ecol. 12, 503 – 522.(doi:10.1023/A:1006574607845)
7. Flack A, Nagy M, Fiedler W, Couzin ID, Wikelski M.2018 From local collective behavior to globalmigratory patterns in white storks. Science 360,911 – 914. (doi:10.1126/science.aap7781)
8. Nagy M, Couzin ID, Fiedler W, Wikelski M, Flack A.2018 Synchronization, coordination and collectivesensing during thermalling flight of freely migratingwhite storks. Phil. Trans, R. Soc. B 373, 20170011.(doi:10.1098/rstb.2017.0011)
9. Satopaa VA, Baron J, Foster DP, Mellers BA, TetlockPE, Ungar LH. 2014 Combining multiple probabilitypredictions using a simple logit model.Int. J. Forecast. 30, 344 – 356. (doi:10.1016/j.ijforecast.2013.09.009)
10. Kurvers RHJM, Herzog SM, Hertwig R, Krause J,Carney PA, Bogart A, Argenziano G, Zalaudek I,Wolf M. 2016 Boosting medical diagnostics bypooling independent judgments. Proc. Natl Acad.Sci. USA 113, 8777 – 8782. (doi:10.1073/pnas.1601827113)
11. Kao AB, Berdahl AM, Hartnett AT, Lutz MJ, Bak-Coleman JB, Ioannou CC, Giam X, Couzin ID. 2018Counteracting estimation bias and social influenceto improve the wisdom of crowds. J. R. Soc.Interface 15, 20180130. (doi:10.1098/rsif.2018.0130)
12. Jayles B, Kim HR, Escobedo R, Cezerax R,Blanchet A, Kameda T, Sire C, Theraulaz G. 2017How social information can improve estimationaccuracy in human groups. Proc. Natl Acad. Sci.USA 144, 12 620 – 12 625. (doi:10.1073/pnas.1703695114)
13. Becker J, Brackbill D, Centola D. 2017 Networkdynamics of social influence in the wisdom ofcrowds. Proc. Natl Acad. Sci. USA 114,E5070 – E5076. (doi:10.1073/pnas.1615978114)
14. Couzin I. 2007 Collective minds. Nature 445, 715.(doi:10.1038/445715a)
15. Couzin ID. 2009 Collective cognition in animalgroups. Trends Cogn. Sci. 13, 36 – 43. (doi:10.1016/j.tics.2008.10.002)
16. Kao AB, Couzin ID. 2014 Decision accuracy incomplex environments is often maximized by smallgroup sizes. Proc. R. Soc. B 281, 20133305. (doi:10.1098/rspb.2013.3305)
17. Kao AB, Miller N, Torney C, Hartnett A, Couzin ID.2014 Collective learning and optimal consensusdecisions in social animal groups. PLoS Comput. Biol.10, 1 – 11. (doi:10.1371/journal.pcbi.1003762)
18. Vicente-Page J, Perez-Escudero A, de Polavieja GG.2018 Dynamic choices are most accurate in small

royalsocietypublishing.org/journal/rstbPhil.Trans.R.Soc.B
374:20180378
9
groups. Theor. Ecol. 11, 71 – 81. (doi:10.1007/s12080-017-0349-9)19. Ladha KK, Miller G. 1996 Political discourse,factions, and the general will: correlated voting andCondorcet’s jury theorem. In Collective decision-making: social choice and political economy (ed. NSchofield), pp. 393 – 410. Berlin, Germany: Springer.
20. Ladha KK. 1992 The Condorcet jury theorem, freespeech, and correlated votes. Am. J. Pol. Sci. 36,617 – 634. (doi:10.2307/2111584)
21. Ladha KK. 1995 Information pooling throughmajority-rule voting: Condorcet’s jury theorem withcorrelated votes. J. Econ. Behav. Organ. 26,353 – 372. (doi:10.1016/0167-2681(94)00068-P)
22. Boland PJ. 1989 Majority systems and the Condorcetjury theorem. J. R. Stat. Soc. D 38, 181 – 189.(doi:10.2307/2348873)
23. Boland PJ, Proschan F, Tong YL. 1989 Modellingdependence in simple and indirect majoritysystems. J. Appl. Probab. 26, 81 – 88. (doi:10.2307/3214318)
24. Couzin ID, Ioannou CC, Demirel G, Gross T, TorneyCJ, Hartnett A, Conradt L, Levin SA, Leonard NE.2011 Uninformed individuals promote democraticconsensus in animal groups. Science 334,1578 – 1580. (doi:10.1126/science.1210280)
25. Ward AJW, Sumpter DJT, Couzin ID, Hart PJB, KrauseJ. 2008 Quorum decision-making facilitatesinformation transfer in fish shoals. Proc. Natl Acad.Sci. USA 105, 6948 – 6953. (doi:10.1073/pnas.0710344105)
26. Ward AJW, Krause J, Sumpter DJT. 2012 Quorumdecision-making in foraging fish shoals. PLoS ONE 7,1 – 8. (doi:10.1371/journal.pone.0032411)
27. Sumpter DJ, Krause J, James R, Couzin ID, WardAJ. 2008 Consensus decision making by fish. Curr.Biol. 18, 1773 – 1777. (doi:10.1016/j.cub.2008.09.064)
28. Marshall JA, Kurvers RH, Krause J, Wolf M. 2018Quorums enable optimal pooling of independentjudgements. (http://arxiv.org/abs/394460)
29. Arganda S, Perez-Escudero A, de Polavieja GG. 2012A common rule for decision making in animalcollectives across species. Proc. Natl Acad. Sci. USA109, 20 508 – 20 513. (doi:10.1073/pnas.1210664109)
30. Perez-Escudero A, De Polavieja GG. 2011 Collectiveanimal behavior from bayesian estimation andprobability matching. PLoS Comput. Biol. 7, 1 – 14.(doi:10.1371/journal.pcbi.1002282)
31. Conradt L, Roper TJ. 2005 Consensus decisionmaking in animals. Trends Ecol. Evol. 20, 449 – 456.(doi:10.1016/j.tree.2005.05.008)
32. Conradt L, Roper TJ. 2003 Group decision-making inanimals. Nature 421, 155 – 158. (doi:10.1038/nature01294)
33. Couzin ID, Krause J, Franks NR, Levin SA. 2005Effective leadership and decision-making in animalgroups on the move. Nature 433, 513 – 516.(doi:10.1038/nature03236)
34. Breder Jr CM. 1951 Studies on the structure of thefish schools. Bull. Am. Mus. Nat. Hist. 98, 3 – 27.
35. Shaw E. 1978 Schooling fishes: the school, a trulyegalitarian form of organization in which allmembers of the group are alike in influence,offers substantial benefits to its participants. Am.Sci. 66, 166 – 175. (doi:10.1371/journal.pone.0038404)
36. Shaw E. 1970 Schooling in fishes: critique andreview. In Development and evolution of behavior(eds LR Aronson, E Tobach, DS Lehrman, JSRosenblatt), pp. 452 – 480. San Francisco, CA:Freeman.
37. Hemelrijk CK, Hildenbrandt H. 2012 Schools of fishand flocks of birds: their shape and internalstructure by self-organization. Interface Focus 2,726 – 737. (doi:10.1098/rsfs.2012.0025)
38. Radakov DV 1973 Schooling in the ecology of fish.New York, NY: J. Wiley.
39. Pitcher TJ, Partridge BL. 1979 Fish school densityand volume. Mar. Biol. 54, 383 – 394. (doi:10.1007/BF00395444)
40. Parr AE. 1927 A contribution to the theoreticalanalysis of the schooling behavior of fishes. Occas.Pap. Bingham Oceanogr. Coll. 1, 1 – 32.
41. Breder CM. 1954 Equations descriptive of fishschools and other animal aggregations. Ecology 35,361 – 370. (doi:10.2307/1930099)
42. Pitcher T. 1973 The three-dimensional structure ofschools in the minnow, Phoxinus phoxinus (l.).Anim. Behav. 21, 673 – 686. (doi:10.1016/S0003-3472(73)80091-0)
43. Cushing D. 1977 Observations on fish shoals withthe ARL Scanner. Rapport et Proees Verbaux desReunions. Conseil International pour l’Exploration dela Mer 170, 15 – 20.
44. Partridge BL. 1981 Internal dynamics and theinterrelations of fish in schools. J. Comp. Physiol.144, 313 – 325. (doi:10.1007/BF00612563)
45. Misund OA. 1993 Dynamics of moving masses:variability in packing density, shape, and sizeamong herring, sprat, and saithe schools. ICESJ. Mar. Sci. 50, 145 – 160. (doi:10.1006/jmsc.1993.1016)
46. Pavlov D, Kasumyan A. 2000 Patterns andmechanisms of schooling behavior in fish: a review.J. Ichthyol. 40, S163 – S231.
47. Serebrov L. 1984 The structure and somecharacteristics of group interactions in groups ofcapelin Mallotus villosus villosus (Muller)(Osmeridae). Vopr. Ikhtiol 24, 472 – 480.
48. Pomeroy H, Heppner F. 1992 Structure of turning inairborne rock dove (Columba livia) flocks. The Auk109, 256 – 267. (doi:10.2307/4088194)
49. Cavagna A, Cimarelli A, Giardina I, Parisi G,Santagati R, Stefanini F, Viale M. 2010 Scale-freecorrelations in starling flocks. Proc. Natl Acad. Sci.USA 107, 11 865 – 11 870. (doi:10.1073/pnas.1005766107)
50. Couzin ID, Laidre ME. 2009 Fission – fusionpopulations. Curr. Biol. 19, R633 – R635. (doi:10.1016/j.cub.2009.05.034)
51. Croft DP, James R, Ward AJW, Botham MS,Mawdsley D, Krause J. 2005 Assortative interactions
and social networks in fish. Oecologia 143,211 – 219. (doi:10.1007/s00442-004-1796-8)
52. Sundaresan SR, Fischhoff IR, Dushoff J, RubensteinDI. 2007 Network metrics reveal differences in socialorganization between two fission – fusion species,Grevy’s zebra and onager. Oecologia 151, 140 – 149.(doi:10.1007/s00442-006-0553-6)
53. Kummer H 1997 In quest of the sacred baboon:a scientist’s journey. Princeton, NJ: PrincetonUniversity Press.
54. Farine DR, Strandburg-Peshkin A, Berger-Wolf T,Ziebart B, Brugere I, Li J, Crofoot MC. 2016 Bothnearest neighbours and long-term affiliates predictindividual locations during collective movement inwild baboons. Sci. Rep. 6, 27704. (doi:10.1038/srep27704)
55. Storz JF, Bhat HR, Kunz TH. 2000 Social structure ofa polygynous tent-making bat, Cynopterus sphinx(Megachiroptera). J. Zool. 251, 151 – 165. (doi:10.1111/jzo.2000.251.issue-2)
56. Holekamp KE, Smith JE, Strelioff CC, Van Horn RC,Watts HE. 2012 Society, demography and geneticstructure in the spotted hyena. Mol. Ecol. 21,613 – 632. (doi:10.1111/j.1365-294X.2011.05240.x)
57. Christal J, Whitehead H, Lettevall E. 1998 Spermwhale social units: variation and change.Can. J. Zool. 76, 1431 – 1440. (doi:10.1139/z98-087)
58. Wittemyer G, Douglas-Hamilton I, Getz W. 2005 Thesocioecology of elephants: analysis of the processescreating multitiered social structures. Anim. Behav. 69,1357 – 1371. (doi:10.1016/j.anbehav.2004.08.018)
59. Nagy M, Akos Z, Biro D, Vicsek T. 2010 Hierarchicalgroup dynamics in pigeon flocks. Nature 464,890 – 893. (doi:10.1038/nature08891)
60. Couzin ID, Krause J, James R, Ruxton GD, Franks NR.2002 Collective memory and spatial sorting inanimal groups. J. Theor. Biol. 218, 1 – 11. (doi:10.1006/jtbi.2002.3065)
61. Couzin I, Krause J. 2003 Self-organization andcollective behavior in invertebrates. Adv. Stud. Behav.32, 1 – 75. (doi:10.1016/S0065-3454(03)01001-5)
62. Mersch DP, Crespi A, Keller L. 2013 Trackingindividuals shows spatial fidelity is a key regulatorof ant social organization. Science 340, 1090 – 1093.(doi:10.1126/science.1234316)
63. Pinter-Wollman N, Wollman R, Guetz A, Holmes S,Gordon DM. 2011 The effect of individual variationon the structure and function of interactionnetworks in harvester ants. J. R. Soc. Interface 8,1562 – 1573. (doi:10.1098/rsif.2011.0059)
64. Gernat T, Rao VD, Middendorf M, Dankowicz H,Goldenfeld N, Robinson GE. 2018 Automatedmonitoring of behavior reveals bursty interactionpatterns and rapid spreading dynamics inhoneybee social networks. Proc. Natl Acad. Sci.USA 115, 1433 – 1438. (doi:10.1073/pnas.1713568115)
65. Crall JD, Gravish N, Mountcastle AM, Kocher SD,Oppenheimer RL, Pierce NE, Combes SA. 2018 Spatialfidelity of workers predicts collective response todisturbance in a social insect. Nat. Commun. 9, 1201.(doi:10.1038/s41467-018-03561-w)

royalsocietypublishing.org/journal/rstbPhil.Trans.R.Soc.B
3
10
66. Naug D. 2009 Structure and resilience of the socialnetwork in an insect colony as a function of colonysize. Behav. Ecol. Sociobiol. 63, 1023 – 1028. (doi:10.1007/s00265-009-0721-x)67. Holldobler B, Wilson EO. 1990 The ants. Cambridge,MA: Harvard University Press.
68. Seeley TD. 2010 Honeybee democracy. Princeton, NJ:Princeton University Press.
69. Pratt SC, Mallon EB, Sumpter DJ, Franks NR. 2002Quorum sensing, recruitment, and collectivedecision-making during colony emigration by theant Leptothorax albipennis. Behav. Ecol. Sociobiol.52, 117 – 127. (doi:10.1007/s00265-002-0487-x)
70. Condorcet M. 1785 Essai sur l’application del’analyse a la probabilite des decisions rendues a lapluralite des voix. Paris, France: Imprimerie Royale.
71. King AJ, Cowlishaw G. 2007 When to use socialinformation: the advantage of large group size inindividual decision making. Biol. Lett. 3, 137 – 139.(doi:10.1098/rsbl.2007.0017)
72. Berg S. 1997 Indirect voting systems: Banzhafnumbers, majority functions and collectivecompetence. Eur. J. Polit. Econ. 13, 557 – 573.(doi:10.1016/S0176-2680(97)00014-1)
73. Berg S, Paroush J. 1998 Collective decision makingin hierarchies. Math. Soc. Sci. 35, 233 – 244. (doi:10.1016/S0165-4896(97)00047-4)
74. Berg S, Maranon A. 2001 Collective decisional skilland decisive voting games—some results. GroupDecis. Negot. 10, 389 – 403. (doi:10.1023/A:1011831413677)
75. Sekiguchi T. 2016 Optimal group composition forefficient division of labor. Theory Decis. 81,601 – 618. (doi:10.1007/s11238-016-9552-1)
76. Berg S. 2001 On small coalitions, hierarchic decisionmaking and collective competence. In Power indicesand coalition formation (eds MJ Holler, G Owen),pp. 203 – 214. Berlin, Germany: Springer.
77. Ioannou CC, Guttal V, Couzin ID. 2012 Predatoryfish select for coordinated collective motion in
virtual prey. Science 337, 1212 – 1215. (doi:10.1126/science.1218919)
78. Galesic M, Barkoczi D, Katsikopoulos K. 2018 Smallercrowds outperform larger crowds and individuals inrealistic task conditions. Decision 5, 1 – 15. (doi:10.1037/dec0000059)
79. Pinter-Wollman N, Penn A, Theraulaz G, FioreSM. 2018 Interdisciplinary approaches foruncovering the impacts of architecture oncollective behaviour. Phil. Trans. R. Soc. B 373,20170232. (doi:10.10.1098/rstb.2017.0232)
80. Mueller T, O’Hara RB, Converse SJ, Urbanek RP,Fagan WF. 2013 Social learning of migratoryperformance. Science 341, 999 – 1002. (doi:10.1126/science.1237139)
81. Farine DR, Garroway CJ, Sheldon BC. 2012Social network analysis of mixed-species flocks:exploring the structure and evolution of interspecificsocial behaviour. Anim. Behav. 84, 1271 – 1277.(doi:10.1016/j.anbehav.2012.08.008)
7
4:2 0180378