Modeling Optimal Gene Regulatory Networkssupervisor: Professor Jerzy Tiuryn
Andrzej [email protected]
Faculty of Mathematics, Informatics, and MechanicsWarsaw University
Institute of Fundamental Technological Research
Polish Academy of Sciences
Andrzej Mizera Modeling Optimal Gene Regulatory Networks

Outline
1 Biological introductionGene regulatory networksDNA Microarray technology
2 Bayesian NetworksDynamic Bayesian NetworksLearning Bayesian Networks
3 Modeling gene regulatory networksThe basic algorithmImplemented extensions
4 Results and conclusionsTests based on artificial networks
Andrzej Mizera Modeling Optimal Gene Regulatory Networks

Biological introductionBayesian Networks
Modeling gene regulatory networksResults and conclusions
Gene regulatory networksDNA Microarray technology
Definitiongene regulatory network - a collection of DNA segments in a cell which interact with each other and with othersubstances in the cell, thereby governing the rates at which genes in the network are transcribed into mRNA.
gene b
gene a
+
gene c
mRNA b
mRNA c
-
mRNA a
+
-
D
A D
C
B
A
Legend
promotor
gene
- transcription
+- activation
-- inhibition
coding
region
- proteinX
- translation
- complex
creation
Andrzej Mizera Modeling Optimal Gene Regulatory Networks

Biological introductionBayesian Networks
Modeling gene regulatory networksResults and conclusions
Gene regulatory networksDNA Microarray technology
The Central Dogma of Molecular Biology
DNA
mRNA
PROTEIN
transcriptiontranslation
Characteristics
The central dogma of molecular biology dealswith the transfer of sequential information.
It states that such information cannot betransferred from protein to either protein ornucleic acid.
Three groups of transfers:general transfers (believed to occurnormally in most cells),special transfers (known to occur,but only under abnormal conditions),unknown transfers (believed neverto occur).
The general transfers describe the normalflow of biological information: DNAinformation can be copied into mRNA andproteins can be synthesized using theinformation in mRNA as a template.
Andrzej Mizera Modeling Optimal Gene Regulatory Networks

Biological introductionBayesian Networks
Modeling gene regulatory networksResults and conclusions
Gene regulatory networksDNA Microarray technology
The Central Dogma of Molecular Biology
DNA
mRNA
PROTEIN
transcriptiontranslation
cDNA
+ reversetranscriptase
Characteristics
The central dogma of molecular biology dealswith the transfer of sequential information.
It states that such information cannot betransferred from protein to either protein ornucleic acid.
Three groups of transfers:general transfers (believed to occurnormally in most cells),special transfers (known to occur,but only under abnormal conditions),unknown transfers (believed neverto occur).
The general transfers describe the normalflow of biological information: DNAinformation can be copied into mRNA andproteins can be synthesized using theinformation in mRNA as a template.
Andrzej Mizera Modeling Optimal Gene Regulatory Networks

Biological introductionBayesian Networks
Modeling gene regulatory networksResults and conclusions
Gene regulatory networksDNA Microarray technology
DNA Microarray
Description
A) Isolation of mRNA (the cells have grown andascertained which genes had to be activatedor repressed in order fot the cell to survive).
wild type test type
B) Synthesis of cDNA from mRNA with reversetranscriptase.
C) Labeling cDNA by fluorescent dye (wild type- red, test type - green).
D) DNA microarray (DNA chip) consists of spots.Each spot is made of gene specific DNA thatcan base pair with cDNA fragments.
...TCAG...
...TCAG...
...TCAG...
gene #4324 gene #6734
...ACCG...
...ACCG...
...ACCG...
gene #154
...GGTC...
...GGTC...
...GGTC...
E) cDNA hybridization to DNA Microarray spots.
F) Scanning with a green and then a red laser inorder to detect the bounded cDNA.
G) Image marging (computer analysis).
wild type concentration > testtype concentration (repression)wild type concentration = testtype concentrationwild type concentration < testtype concentration (activation)
Andrzej Mizera Modeling Optimal Gene Regulatory Networks

Biological introductionBayesian Networks
Modeling gene regulatory networksResults and conclusions
Dynamic Bayesian NetworksLearning Bayesian Networks
Definition
Bayesian network B = 〈G, Θ〉 is a representation of a joint probabilitydistribution over a set of random variables X . It consists of twocomponents:
G – a directed acyclic graph whose vertices correspond to randomvariables and edges indicate conditional dependence relations,
Θ – a family of conditional distributions for each variable, given itsparents in the graph.
Example
Bayesian network (structure + conditionalprobability table (CPT))
4
5
1 2
3
ΘX4Pr(X4 = 0|X1 = 0, X2 = 0) = 0.30Pr(X4 = 1|X1 = 0, X2 = 0) = 0.70Pr(X4 = 0|X1 = 0, X2 = 1) = 0.76Pr(X4 = 1|X1 = 0, X2 = 1) = 0.24Pr(X4 = 0|X1 = 1, X2 = 0) = 0.12Pr(X4 = 1|X1 = 1, X2 = 0) = 0.88Pr(X4 = 0|X1 = 1, X2 = 1) = 0.95Pr(X4 = 1|X1 = 1, X2 = 1) = 0.05
Andrzej Mizera Modeling Optimal Gene Regulatory Networks
Biological introductionBayesian Networks
Modeling gene regulatory networksResults and conclusions
Dynamic Bayesian NetworksLearning Bayesian Networks
Joint probability distribution
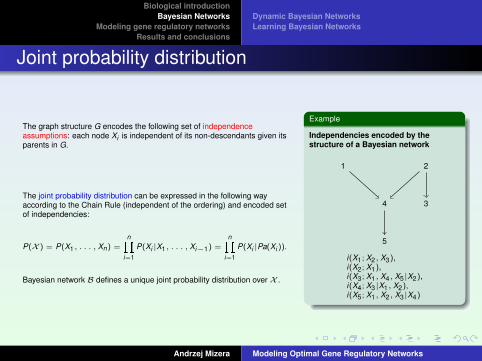
The graph structure G encodes the following set of independenceassumptions: each node Xi is independent of its non-descendants given itsparents in G.
The joint probability distribution can be expressed in the following wayaccording to the Chain Rule (independent of the ordering) and encoded setof independencies:
P(X ) = P(X1, . . . , Xn) =nY
i=1
P(Xi |X1, . . . , Xi−1) =nY
i=1
P(Xi |Pa(Xi )).
Bayesian network B defines a unique joint probability distribution over X .
Example
Independencies encoded by thestructure of a Bayesian network
4
5
1 2
3
i(X1; X2, X3),i(X2; X1),i(X3; X1, X4, X5|X2),i(X4; X3|X1, X2),i(X5; X1, X2, X3|X4)
Andrzej Mizera Modeling Optimal Gene Regulatory Networks
Biological introductionBayesian Networks
Modeling gene regulatory networksResults and conclusions
Dynamic Bayesian NetworksLearning Bayesian Networks
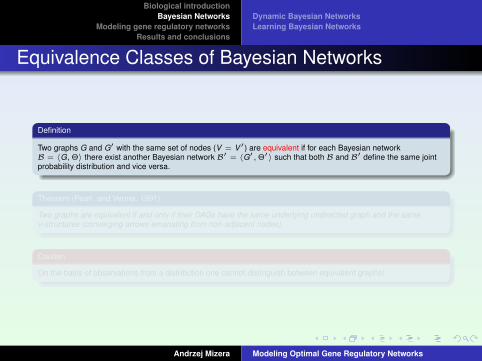
Equivalence Classes of Bayesian Networks
Definition
Two graphs G and G′ with the same set of nodes (V = V ′) are equivalent if for each Bayesian networkB = 〈G, Θ〉 there exist another Bayesian network B′ = 〈G′, Θ′〉 such that both B and B′ define the same jointprobability distribution and vice versa.
Theorem (Pearl, and Verma, 1991)
Two graphs are equivalent if and only if their DAGs have the same underlying undirected graph and the samev-structures (converging arrows emanating from non-adjacent nodes).
Caution
On the basis of observations from a distribution one cannot distinguish between equivalent graphs!
Andrzej Mizera Modeling Optimal Gene Regulatory Networks

Biological introductionBayesian Networks
Modeling gene regulatory networksResults and conclusions
Dynamic Bayesian NetworksLearning Bayesian Networks
Drawbacks of standard Bayesian Networks
Existence of equivalence classes of Bayesian networkscreates problems in assigning direction of causation to aninteraction.Due to the mathematical properties of the joint probabilitydistribution Bayesian networks have to be acyclic. Thisrestriction causes problems in applications of thisformalism in biology, because feedback loops are acommon biological feature.
Both of these limitations can be overcome by using DynamicBayesian Networks.
Andrzej Mizera Modeling Optimal Gene Regulatory Networks

Biological introductionBayesian Networks
Modeling gene regulatory networksResults and conclusions
Dynamic Bayesian NetworksLearning Bayesian Networks
The formalism of Dynamic Bayesian Networks (DBNs)
Description
Dynamic Bayesian Networks are directed graphical models ofstochastic processes.
Represented process is assumed to satisfy the Markoviancondition, i.e.
P(X (t)|X (0),X (1), . . . ,X (t − 1)) = P(X (t)|X (t − 1))
and to be time homogenous, i.e.
P(X (t)|X (t − 1))
are independent of t .
A Dynamic Bayesian Network consists of a graph G and a family ofparameters Θ which characterise the conditional probabilitydistributions P(Xi (t)|Pa(Xi )(t − 1)), where Xi ∈ X .
Example
1
2
A
1
2
1
2
1
2
t = 1 t = 2 t = 3
An example of a Dynamic BayesianNetwork (left figure) and the same networkunwrapped in time (right figure). Theunwrapped network is acyclic.
Andrzej Mizera Modeling Optimal Gene Regulatory Networks

Biological introductionBayesian Networks
Modeling gene regulatory networksResults and conclusions
Dynamic Bayesian NetworksLearning Bayesian Networks
Statement of the problem
Problem Statement
Given a training set D = {x1, . . . , xN} of independent instances of X , find a network B′ = 〈G, Θ〉 that bestmatches D (more precisely, the equivalence class of networks that best matches D).
Experiments: 1 2 3 4 5 6X1 −1 1 0 1 0 0X2 0 −1 0 1 0 −1X3 0 1 −1 1 0 −1
Andrzej Mizera Modeling Optimal Gene Regulatory Networks

Biological introductionBayesian Networks
Modeling gene regulatory networksResults and conclusions
Dynamic Bayesian NetworksLearning Bayesian Networks
Solution
Introduce a statistically motivated scoring function that evaluates each network with respect to the trainingdata.A commonly used scoring is the Bayesian score:
Score(G, D) = log P(G|D) = log P(D|G) + log P(G) + C,
where C is a constant independent of G and
P(D|G) =
ZP(D|G, Θ)P(Θ|G)dΘ.
Learning amounts to finding the structure G that maximizes or minimizes the score.
The Bayesian score class of functions realises the Maximum a posteriori rule - the graph G that maximizesP(G|D) is chosen.
This problem is NP-hard - usually heuristic methods are used.
The decomposition ot the score is crucial for this optimization problem.
Andrzej Mizera Modeling Optimal Gene Regulatory Networks
Biological introductionBayesian Networks
Modeling gene regulatory networksResults and conclusions
Dynamic Bayesian NetworksLearning Bayesian Networks
Definition
A score function is decomposable if it can be rewritten as the sum
Score(G, D) =X
i
ScoreContribution(Xi , Pa(Xi ), D),
where the contribution of every variable Xi to the total network score depends only on its own value and the valuesof its parents in G.
Andrzej Mizera Modeling Optimal Gene Regulatory Networks

Biological introductionBayesian Networks
Modeling gene regulatory networksResults and conclusions
The basic algorithmImplemented extensions
The algorithm
S. Ott, S. Imoto, and S. MiyanoFinding Optimal Models for Small Gene Networks.Pacific Symposium on Biocomputing, 9:557-567, 2004.
Algorithm – the idea
part I: for each gene g ∈ G
for each potential parent set Pa of g
compute the local score for g and Pa
part II: on the basis of previous computations choose the parent set for each gyielding the optimal score of the whole network
Andrzej Mizera Modeling Optimal Gene Regulatory Networks
Biological introductionBayesian Networks
Modeling gene regulatory networksResults and conclusions
The basic algorithmImplemented extensions
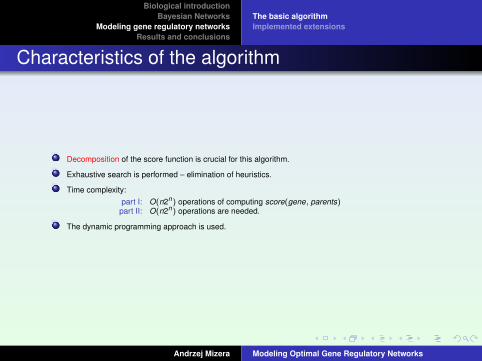
Characteristics of the algorithm
Decomposition of the score function is crucial for this algorithm.
Exhaustive search is performed – elimination of heuristics.
Time complexity:part I: O(n2n) operations of computing score(gene, parents)
part II: O(n2n) operations are needed.
The dynamic programming approach is used.
Andrzej Mizera Modeling Optimal Gene Regulatory Networks
Biological introductionBayesian Networks
Modeling gene regulatory networksResults and conclusions
The basic algorithmImplemented extensions
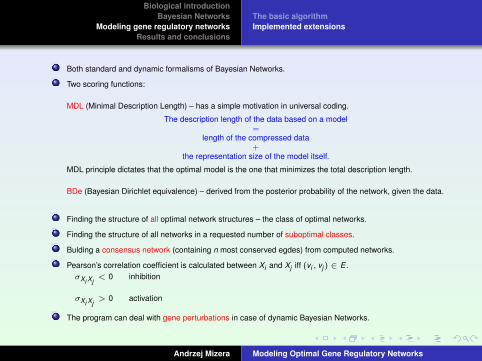
Both standard and dynamic formalisms of Bayesian Networks.
Two scoring functions:
MDL (Minimal Description Length) – has a simple motivation in universal coding.
The description length of the data based on a model=
length of the compressed data+
the representation size of the model itself.
MDL principle dictates that the optimal model is the one that minimizes the total description length.
BDe (Bayesian Dirichlet equivalence) – derived from the posterior probability of the network, given the data.
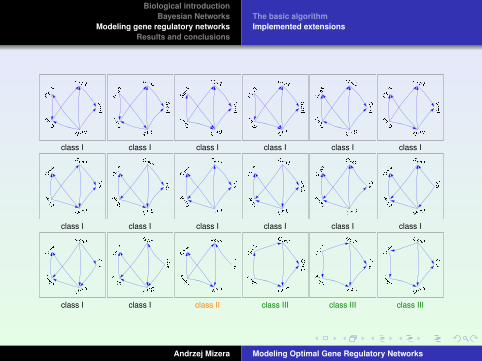
Finding the structure of all optimal network structures – the class of optimal networks.
Finding the structure of all networks in a requested number of suboptimal classes.
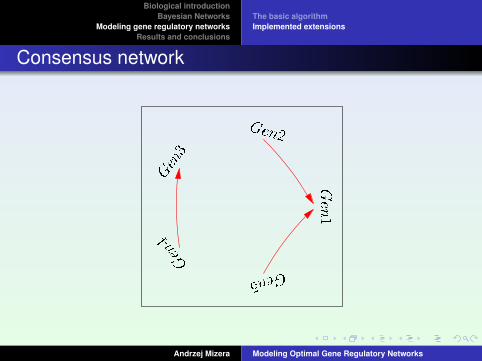
Bulding a consensus network (containing n most conserved egdes) from computed networks.
Pearson’s correlation coefficient is calculated between Xi and Xj iff (vi , vj ) ∈ E .σXi Xj
< 0 inhibition
σXi Xj> 0 activation
The program can deal with gene perturbations in case of dynamic Bayesian Networks.
Andrzej Mizera Modeling Optimal Gene Regulatory Networks
Biological introductionBayesian Networks
Modeling gene regulatory networksResults and conclusions
The basic algorithmImplemented extensions
� �� �
������ �����
����
����
� �� �
������ �����
����
����
� �� �
������ �����
����
����
� �� �
������ �����
����
����
� �� �
������ �����
����
����
� �� �
������ �����
����
����
class I class I class I class I class I class I
� �� �
������ �����
����
����
� �� �
������ �����
����
����
� �� �
������ �����
����
����
� �� �
������ �����
����
����
� �� �
������ �����
����
����
� �� �
������ �����
����
����
class I class I class I class I class I class I
� �� �
������ �����
����
����
� �� �
������ �����
����
����
� �� �
������ �����
����
����
� �� �
������ �����
����
����
� �� �
������ �����
����
����
� �� �
������ �����
����
����
class I class I class II class III class III class III
Andrzej Mizera Modeling Optimal Gene Regulatory Networks
Biological introductionBayesian Networks
Modeling gene regulatory networksResults and conclusions
The basic algorithmImplemented extensions
Consensus network
� �� �
������ �����
����
����
Andrzej Mizera Modeling Optimal Gene Regulatory Networks
Biological introductionBayesian Networks
Modeling gene regulatory networksResults and conclusions
Tests based on artificial networks
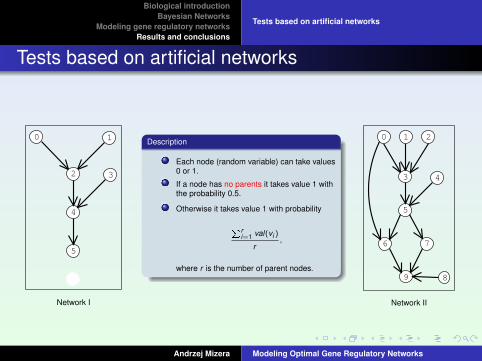
Tests based on artificial networks
2
0 1
4
3
5
Network I
Description
Each node (random variable) can take values0 or 1.
If a node has no parents it takes value 1 withthe probability 0.5.
Otherwise it takes value 1 with probability
Pri=1 val(vi )
r,
where r is the number of parent nodes.
3
0 1
5
4
6
2
7
9 8
Network II
Andrzej Mizera Modeling Optimal Gene Regulatory Networks
Biological introductionBayesian Networks
Modeling gene regulatory networksResults and conclusions
Tests based on artificial networks
Number of networks in the optimal class
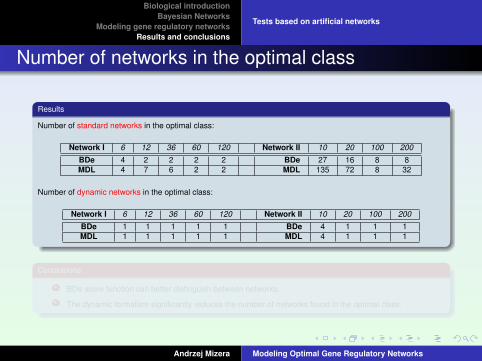
Results
Number of standard networks in the optimal class:
Network I 6 12 36 60 120 Network II 10 20 100 200
BDe 4 2 2 2 2 BDe 27 16 8 8MDL 4 7 6 2 2 MDL 135 72 8 32
Number of dynamic networks in the optimal class:
Network I 6 12 36 60 120 Network II 10 20 100 200
BDe 1 1 1 1 1 BDe 4 1 1 1MDL 1 1 1 1 1 MDL 4 1 1 1
Conclusions
BDe score function can better distinguish between networks.
The dynamic formalism significantly reduces the number of networks found in the optimal class.
Andrzej Mizera Modeling Optimal Gene Regulatory Networks

Biological introductionBayesian Networks
Modeling gene regulatory networksResults and conclusions
Tests based on artificial networks
Number of networks in the optimal class
Results
Number of standard networks in the optimal class:
Network I 6 12 36 60 120 Network II 10 20 100 200
BDe 4 2 2 2 2 BDe 27 16 8 8MDL 4 7 6 2 2 MDL 135 72 8 32
Number of dynamic networks in the optimal class:
Network I 6 12 36 60 120 Network II 10 20 100 200
BDe 1 1 1 1 1 BDe 4 1 1 1MDL 1 1 1 1 1 MDL 4 1 1 1
Conclusions
BDe score function can better distinguish between networks.
The dynamic formalism significantly reduces the number of networks found in the optimal class.
Andrzej Mizera Modeling Optimal Gene Regulatory Networks

Biological introductionBayesian Networks
Modeling gene regulatory networksResults and conclusions
Tests based on artificial networks
True-positive vs. false-positive edges
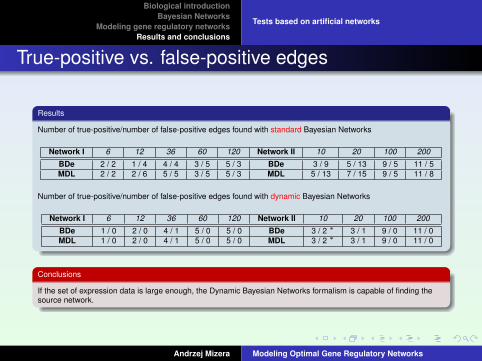
Results
Number of true-positive/number of false-positive edges found with standard Bayesian Networks
Network I 6 12 36 60 120 Network II 10 20 100 200
BDe 2 / 2 1 / 4 4 / 4 3 / 5 5 / 3 BDe 3 / 9 5 / 13 9 / 5 11 / 5MDL 2 / 2 2 / 6 5 / 5 3 / 5 5 / 3 MDL 5 / 13 7 / 15 9 / 5 11 / 8
Number of true-positive/number of false-positive edges found with dynamic Bayesian Networks
Network I 6 12 36 60 120 Network II 10 20 100 200
BDe 1 / 0 2 / 0 4 / 1 5 / 0 5 / 0 BDe 3 / 2 ∗ 3 / 1 9 / 0 11 / 0MDL 1 / 0 2 / 0 4 / 1 5 / 0 5 / 0 MDL 3 / 2 ∗ 3 / 1 9 / 0 11 / 0
Conclusions
If the set of expression data is large enough, the Dynamic Bayesian Networks formalism is capable of finding thesource network.
Andrzej Mizera Modeling Optimal Gene Regulatory Networks
Biological introductionBayesian Networks
Modeling gene regulatory networksResults and conclusions
Tests based on artificial networks
True-positive vs. false-positive edges
Results
Number of true-positive/number of false-positive edges found with standard Bayesian Networks
Network I 6 12 36 60 120 Network II 10 20 100 200
BDe 2 / 2 1 / 4 4 / 4 3 / 5 5 / 3 BDe 3 / 9 5 / 13 9 / 5 11 / 5MDL 2 / 2 2 / 6 5 / 5 3 / 5 5 / 3 MDL 5 / 13 7 / 15 9 / 5 11 / 8
Number of true-positive/number of false-positive edges found with dynamic Bayesian Networks
Network I 6 12 36 60 120 Network II 10 20 100 200
BDe 1 / 0 2 / 0 4 / 1 5 / 0 5 / 0 BDe 3 / 2 ∗ 3 / 1 9 / 0 11 / 0MDL 1 / 0 2 / 0 4 / 1 5 / 0 5 / 0 MDL 3 / 2 ∗ 3 / 1 9 / 0 11 / 0
Conclusions
If the set of expression data is large enough, the Dynamic Bayesian Networks formalism is capable of finding thesource network.
Andrzej Mizera Modeling Optimal Gene Regulatory Networks

Bibliography
S. Ott, S. Imoto, and S. MiyanoFinding Optimal Models for Small Gene Networks.Pacific Symposium on Biocomputing, 9:557-567, 2004.
Nir Friedman and Moises GoldszmidtLearning Bayesian Networks with Local Structure.Twelfth Conference on Uncertainty in Artificial Intelligence, 252-262, 1996.
Gregory F. Cooper and Edward HerskovitsA Bayesian Method for the Induction of Probabilistic Networks from Data.Machine Learning, 9:309-347, 1992.
Hidde de JongModeling and Simulation of Genetic Regulatory Systems: A Literature Review.Journal of Computational Biology, 9:67-103, 2002.
S. Ott, A. Hansen, S.-Y. Kim, and S. MiyanoSuperiority of network motifs over optimal networks and an application to the revelation of gene networkevolution.Bioinformatics, 21:227-238, 2005.
Norbert Dojer, Anna Gambin, Andrzej Mizera, Bartek Wilczynski, and Jerzy TiurynApplying dynamic Bayesian networks to perturbed gene expression data.BMC Bioinformatics, 7:249, 2006.
Andrzej Mizera Modeling Optimal Gene Regulatory Networks

Bibliography
Nir Friedman, Michal Linial, Iftach Nachman, and Dana Pe’erUsing Bayesian networks to analyze expression data.Journal of Computational Biology, 7:601-620, 2000.
Daniel E. Zak, Francis J. Doyle III, Gregory E. Gonye, and James S. SchwaberSimulation studies for the identification of genetic networks from cDNA array and regulatory activity data.Proceedings of the Second International Conference on Systems Biology, 231-238, 2001.
David Heckerman, Dan Geiger, and David M. ChickeringLearning Bayesian networks: The combination of knowledge and statistical data.Machine Learning, 20:197-243, 1995.
Thomas Verma, and Judea PearlEquivalence and synthesis of causal models.Proceedings of the Sixth Annual Conference on Uncertainty in Artificial Intelligence, 220-227, 1990.
D. M. ChickeringLearning bayesian networks is NP-complete.Learning from Data: Artificial Intelligence and Statistics V, Springer-Verlag, 1996.
J. RissanenModelling by shortest data description.Automatica, 14:465-471, 1978.
Andrzej Mizera Modeling Optimal Gene Regulatory Networks

Thank you for your attention!
Andrzej Mizera Modeling Optimal Gene Regulatory Networks