Model Validation across geographic
areas
Factoring in local variations to ensure accuracy of
assumptions
Nic Talbot-Jenkins

Typical Company Organisation
Global
Overview/Strategy
International US Europe
Local Markets/Affiliates/Operating Companies
To many ‘international’ companies, ‘Global’ can be
synonymous with ‘US’
Clear voice needs to be heard from the regions at
a global level

Central vs Local Forecasting
Why not forecast centrally?
Pros:
– one version of forecast & model, one keeper
– time-efficient (?)
Cons:
– miss local variation
– highly sensitive to the skill of the forecaster (errors are
amplified throughout the reach of the model)
– remote perspective
– may not reflect what is achievable in the market-place

Local vs Centralised Forecasting Why forecast locally or at a regional level?
Pros:
– closer to the market
– capture key market variations
– engage & encourage the local markets
– more robust forecast
– commercially viable/endorsed figures
Cons:
– can require extensive organisation
– time-consuming, takes time to achieve final result

The main issue - Creating a European Voice to be heard Globally………..
‘Aligned’ position needs to be fed to Global
Constant struggle for funds, resource, data etc
Understanding of EU diversity to provide robust
regional voice which represents the best business
interests for Europe

Managing Diversity Across
Europe

European Diversity
Regions & countries vary immensely
Difficult concept for Global to understand
sometimes as US is a main comparator
Diversity needs to be understood & captured in
order to provide a comprehensive view for Europe
Diabetes & the Oral Antidiabetic market as a
working example

Forecasting…………...
Forecasting is difficult enough, let alone with over
20 different markets to consider!
Patient based vs script driven
Either method needs local consideration
What needs to be considered and how can that be
managed?

Considerations - 1. Population / Patients
Epidemiology
– varies from country to country
Variances can be caused by a number of factors
– cultural variations
– demographic differences
– genetic predisposition
Different numbers of eligible patients in different
countries

Population Variance Example:
Data from UN population database (units - 000s)
0
1000
2000
3000
4000
5000
6000
7000
0-4
10-
14
20-
24
30-
34
40-
44
50-
54
60-
64
70-
74
80-
84
France
Germany
Italy
Spain
UK
Poland

Demographic Impact
Impact on disease - age-related conditions,
increase in availability of patients for treatment
Accounts for some variation in disease prevalence
Important to take into account when forecasting
across Europe
Eg. Diabetes type 2
Type 2 Diabetes:
If we took a flat rate of disease & applied to an EU
population indiscriminately…………
However, if we take a more robust process & apply
local data by age-cohort…………….

What’s Happening Demographically...
0
1000
2000
3000
4000
5000
6000
7000
8000
0-4
10-
14
20-
24
30-
34
40-
44
50-
54
60-
64
70-
74
80-
84
2001
2005
2010
2013
Data from UN population database (units - 000s). Data shown is for
Germany

Population Variance through (miss) Calculation
3500
3600
3700
3800
3900
4000
4100
4200
2001
2002
2003
2004
2005
2006
2007
2008
2009
2010
2011
2012
2013
Point Value
Age Mapped
Cumulative Difference ~ 2.8M
Overall
prevalence
rate of 5%
applied in
both
scenarios!!

Prevalence Calculations
Through this example we can see the benefit of
proper demographic modelling of populations.
This method should ideally be used in all countries.
Same age-cohort prevalence rates can be used in
this way, overall calculated prevalence is then tied
into the demographic map of the market.
You may find that this resolves issues with
divergent epidemiological data!

Considerations - 2. Market Variations - Products & Usage As well as population & cultural differences there
are vast differences across Europe in terms of
products & competitors
Germany - wide use of herbal remedies
Italy - OAD market consists of combination
products (not widely seen elsewhere in Europe)
Consideration of local competitors is key to
unlocking market potential
Has knock-on effects on product positioning &
marketing

Product Usage Variations - OAD Market
Difference in packs available in some markets
Tablet strengths
Key competitors vary
– Germany - mainstay of treatment are the SUs
– UK - Metformin becoming drug of choice first line
Strategy clearly needs to be very different to sell
against the SUs vs metformin (different modes of
action etc)
Impact on Patient Turnover
1st line therapy will affect the rate of turnover of the patient pool
SUs - not sustainable long term for 1st line use, patients will fail to be maintained quicker & progress to 2nd line
Metformin - patients maintained for far longer, slower to reach 2nd line therapy
Important for the TZD class as they are indicated as 2nd line combination therapy
Country market potential will vary hugely depending on the treatment paradigm
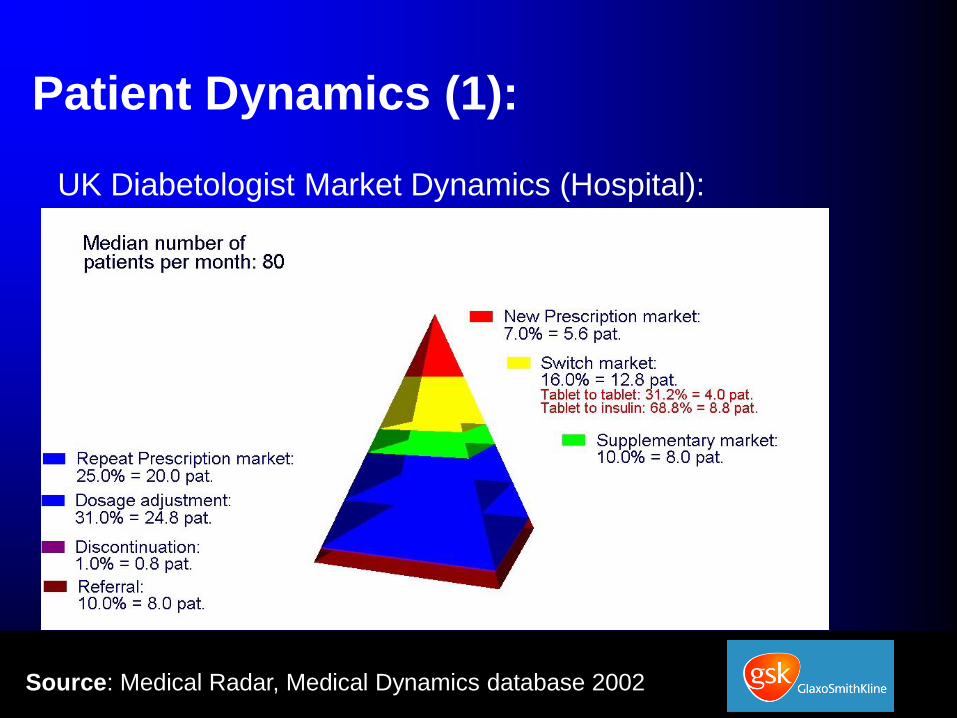
Patient Dynamics (1):
Source: Medical Radar, Medical Dynamics database 2002
UK Diabetologist Market Dynamics (Hospital):

Patient Dynamics (2):
German Diabetologist Market Dynamics (Hospital):

Considerations - 3. Healthcare Access
Very different access methods for healthcare
across Europe
France - free access to specialists & medications
UK - GP ‘gatekeepers’, patients need referral to
specialist
Reimbursement of medications - partial
reimbursement of some medications in various
markets (e.g. Sweden - % of price, Germany - 3 co-
payment bands depending on pack size)

Considerations - 4. Reimbursement
Reimbursement issues vary by market
– political (Germany - positive list - TZDs are absent,
only access to private patients)
– legal (EU legislation advises member states to take
measures to control their own healthcare spend,
Finland - no reimbursement available to products <1
on market)
– environmental (GDP in country & ability to pay for
healthcare/medications)
Considerations - 5. Pricing
Price levels - no uniform price across Europe
(although a price corridor exists)
Lower prices in Europe than in US (price often
overestimated by Global colleagues)
Reference pricing - markets reference internally,
externally or both to set prices for new products
– Internal - review of similar products in similar
classes to set price
– External - review of neighbouring markets to set
prices

Internal & External Reference Pricing Austria Notification of the price of the product in other EU
CountriesBelgium Notification of the price of the product in other EU
countriesDenmark Average of prices of all European Economic Area (EEA)
countries except Greece, Luxembourg, Portugal andSpain
Finland Notification of the price of the product in other EUcountries
France No external referencing
Germany No external referencing
Greece Lowest price in all EU countries
Ireland Denmark, France, Germany, Netherlands, UK
Italy Average European price
Netherlands Belgium, France, Germany, UK
Norway Average of the three lowest prices of 9 EEA countries(Austria, Belgium, Denmark, Finland, Germany, Ireland,Netherlands, Sweden and U.K.)
Portugal France, Italy, Spain
Spain Notification of the price of the product in other EUcountries
Sweden Notification of the price of the product in other EUcountries
Switzerland Denmark, Germany, The Netherlands, U.K.
U.K. No external referencing

Cost-Containment Measures by Markets
Fra
nce
Ge
rma
ny
Gre
ece
Hu
ng
ry
Ita
ly
Th
e
Ne
the
rla
nd
s
No
rwa
y
Sp
ain
Sw
ed
en
Sw
itze
rla
nd
UK
Control ex-man. Price X X X X X X X X
Ctrl reimburs. Entry X X
Cross-country comp. X X
Reference pricing X X X X X X
Payback/contracts X X X X X X
Profit control X X X X X X X X X
Promotional spent ctrl X X X X X X X X
Prescribing budgets X X X X X X X X
Pharmacoecon. Evid. X X X X X X
Fixed wholesale margin X X X
Fixed pharmacy margin
Generic substitution X X X X X
Patient co-payment X
Control of OTC price X X X X X X X X X
Control of hospital price X X X X X X X X

Product Launch Sequence
Vital in Europe to get the launch sequence right
Highest price markets should obtain a price first
Reference markets to high price markets can then
achieve the price they want (within the EU pricing
corridor)
If low price markets launch first, will mean a lower
average price for the product across Europe

Examples:
Greece - have to take the lowest average EU price
available to them at time of launch.
France - aggressive negotiations to lower new
product prices. E.g. if France launch with a low
price it will be very difficult for Germany to achieve
a higher price.
Germany & UK (so-called free price markets)
should ideally be the first countries to launch a new
product in Europe

Market Access & Impact on Launch Time
Due to market access restrictions, there is no
uniform launch date across Europe
Germany & UK tend to launch first, followed by
Spain, Italy and finally France (~12 months)
Again, this needs to be included at a country level
before forecasts can be rolled together

Considerations - 6. Patent Life/Protection Issues are coming to the fore regarding patent & data
exclusivity (Fosamax weekly in UK)
Spain - limited data exclusivity period
Large chunk of revenue may disappear due to the knock-on effects of price erosion (through reference pricing)
E.g. Fosamax weekly goes generic in UK, lowers the price of the M5B oral class
– Downward pressure in other EU markets which use external referencing, especially for Fosamax
– Any new entrants will be forced to price in a market where genericisation has occurred
– Lower prices will be awarded to new bisphosphonates in UK, as internal referencing to the M5B class

How to Practically Manage &
Forecast the Diversity

One Successful Approach……
Central template disseminated to markets - which
includes all necessary tools to assist the markets in
providing a solid, robust forecast
European initiatives
– educate markets in forecasting
– prepare & engage their focus on the product,
therapy area
– provide a European ‘owner’ to work with markets
– challenge markets on assumptions & rationale
– password-protect the Excel workbook template!!!

Or Alternatively………..
Forecast at a European level
Provide markets with a list of assumptions & a
forecast
Ask for them to validate the figures & sign off at a
local level (GM or equivalent)
Either process should end up with a robust,
validated local & regional forecast to be integrated
into the global business plans