Ministry of Agriculture, Livestock and
Fisheries
AGRICULTURAL SECTOR DEVELOPMENT SUPPORT
PROGRAMME
END TERM EVALUATION
REPORT
MARCH, 2017
ii
FOREWORD
Agriculture is the key driver for delivering 10% annual economic growth rate under the Economic Pillar of Vision 2030 whose focus is to make the country “A globally competitive and prosperous nation by 2030”. The Agricultural Sector draws its Vision, “A food secure and prosperous nation” from Vision 2030 as articulated in the Agriculture Sector Development Strategy.
In accordance with the sector’s Mission to have “An innovative, commercially oriented and modern agriculture”, the Ministry has concentrated its efforts towards ensuring producers, processors and marketers of agricultural produce employ the most contemporary methods and technologies that enable agricultural enterprises function as commercial entities that
produce food, generate income and consequently contribute to eradication of poverty.
The Agricultural Sector Strategy Support Programme (ASDSP) is a key programme in the Ministry. It has provided the framework for stimulating, guiding and directing inclusive agricultural growth and development over the last 4 years. The main technical focus of ASDSP was in line with the Sector vision. The Programme supported actors along Value Chains (VCs) in strengthening capacities with food security and nutrition, environmental sustainability, climate change resilience and inclusion of women and youth as key considerations that are integral to the commercialization process.
This End of Term Evaluation (ETE) report presents an assessment of the performance of ASDSP as implemented by the national and county governments; key lessons learnt and
provides a basis for improvements in Phase II of the Programme. I am happy to note that service provision in VCs under the Programme increased considerably leading to higher levels of food security and household incomes.
The Programme has provided a strong foundation for achieving the Sector vision and Mission which should be replicated in more value chains. I take this opportunity to express my appreciation to the Government of Sweden for providing substantial financial support to the Programme and to stakeholders for the various roles they performed in implementation of the Programme.
HON. WILLY BETT,
CABINET SECRETARY,
MINISTRY OF AGRICULTURE, LIVESTOCK AND FISHERIES

iii
PREFACE
ASDSP was a five year Programme, 2012-2016, implemented by the Government of Kenya in collaboration with stakeholders to realise the strategies identified in the ASDS 2010–2020 and the Comprehensive Africa Agricultural Development Programme (CAADP) Kenya Compact. The Programme, which was implemented in all the 47 counties, was jointly financed by the Governments of Kenya and Sweden.
The overall Programme goal was: “to support the transformation of Kenya’s Agricultural Sector into an innovative, commercially oriented, competitive and modern industry that contributes to poverty reduction and improved food security in rural and urban Kenya”. The Programme purpose was: “to increase equitable income, employment and improved food
security of male and female target groups as a result of improved production and productivity in the rural smallholder farm and off-farm sectors”. ASDSP consequently contributed to the realization of Kenya’s wider development goals expressed in the Vision 2030 and Kenya’s Constitution.
The Programme had three major outcome areas: development of a transparent system for improved Agricultural Sector coordination and harmonization and an enabling policy and institutional environment for the realization of ASDS; strengthening of environmental resilience and social inclusion of VCs and promotion of viable and equitable commercialization of the Agricultural Sector through VCD.
These outcome areas refer to the two strategic thrusts defined in the ASDS, namely
increasing productivity, commercialization and competitiveness of agricultural commodities and enterprises, and developing and managing key factors of production.
This ETE report is a reflection of the performance of the Programme since its inception in 2012. The evaluation covered all counties. It targeted all the Sector stakeholders with emphasis on VCAs and service providers tempered with gender and youth considerations.
The evaluation covered: the broad objectives of the Sector as well as the extent to which the Programme responded to the changed implementation context to achieve its objectives, the impacts of the Programme among the stakeholders and the overall Programme performance and lessons learnt for future improvements. It examined coherence of portfolios in line with ASDSP’s objectives and national priorities, organizational context,
procedures, governance structures and management issues including Programme management as well as strategic partnerships.
The overall findings of the evaluation are encouraging as they indicate positive change among VCAs in terms of access to services, productivity, market access, overall incomes, increased awareness of natural resource management and higher levels of inclusivity.
The evaluation points out areas that fell short of expectation and has proposed improvement that includes strengthening of partnerships as well as incorporating emerging high value opportunities and priorities such as those that address mainstreaming of gender, poverty and environmental issues. We urge stakeholders to take note of the findings for improvement of the next phase of the Programme.

iv
We wish to thank and acknowledge the Government of Sweden, the Programme and all the stakeholders who were involved in implementation of the Programme for their valuable inputs that aided the country in achieving part of its goals.
DR. RICHARD LESIYAMPE, PHD, CBS
PRINCIPAL SECRETARY,
AGRICULTURE
DR. ANDREW TUIMUR, CBS
PRINCIPAL SECRETARY,
LIVESTOCK
PROF. MICHENI NTIBA, CBS
PRINCIPAL SECRETARY,
FISHERIES AND THE BLUE ECONOMY

v
ACKNOWLEDGEMENTS
ASDSP commenced in 2012 with baseline surveys as a basis for measuring success. The objective of
the End Term Evaluation was to assess the changes the Programme created among stakeholders and
to identify areas of improvement in ASDSP Phase II. This report presents findings of the evaluation
carried out between November 2016 and March 2017.
I wish to thank the Cabinet Secretary, Ministry of Agriculture, Livestock and Fisheries (MoALF) under
the leadership of Mr. Willy Bett and the Principal Secretaries, Dr. Richard Lesiyampe, Dr. Andrew
Tuimur and Prof. Micheni Ntiba, for their candid assessment of the Programme and guidance during
the evaluation. The contribution of county governments through the County Executive Committee
Members; Chief Officers and County Directors in charge of agriculture; Value Chain Platforms; Value
Chain Organizations and partners is appreciated. The Technical Directors, Intergovernmental
Secretariat and staff from MoALF are also recognized for their contribution in this evaluation.
I sincerely thank the Swedish International Development Agency, SIDA and other Development
Partners in the Sector who took time to provide information and valuable inputs during the
evaluation. Valuable inputs from Programme stakeholders at all levels especially during data
collection and feedback through participation in group discussions and key informant interviews and
the national validation workshop are highly appreciated.
Finally, I acknowledge and appreciate the tireless efforts and commitment demonstrated by the
Ministerial Internal Evaluation Team under the leadership of Mr. James K. Tendwa. The Chair was
supported by a team comprising of Mr. Bernard Mwangangi, Dr. Charles Ochodo, Mr. David Nyamai,
Dr. Diana S. Mobagi, Mrs. Judith Amadiva, Mrs. Mary Nduru, Dr. Michael Obora, Mr. Patrick M.
Mwanyumba, Mrs. Rosemary Magambo and Mr. Vincent Githinji. I also wish to appreciate the
support from Mr. Alex Mwaniki in the analysis of household survey data, Mrs. Josephine Mogere for
compiling the case studies and NIRAS Natura for providing technical advice throughout the process
of evaluation.
MS. PHOEBE ODHIAMBO,
PROGRAMME COORDINATOR,
AGRICULTURAL SECTOR DEVELOPMENT SUPPORT PROGRAMME

vi
EXECUTIVE SUMMARY
A. Background
ASDSP was borne out of the realization that Kenya’s economy predominantly relies on agriculture
either directly or indirectly yet agricultural value chains are largely subsistence thus affording little
income to farmers and other Value Chain Actors. Formulated between 2010 and 2011, ASDSP’s
implementation started in 2012 at both the national and county governments and was to cover a
period of five years ending in December 2016. However, implementation was extended, through a
no cost Agreement, to June 2017. ASDSP was designed as a sector-wide national Programme to be
implemented in all the counties of Kenya under the coordination of the national government. It was
intended to transform agriculture into a modern and commercially viable sector in line with the
goals of ASDS (2010-2020) alongside contributing to achievement of part of the Millennium
Development Goals, namely eradication of extreme poverty and hunger; promotion of gender
equality and empowering women and ensuring environmental sustainability.
B. The Programme
ASDSP was financed by the Governments of Kenya (GoK) and Sweden together with other
development partners. The Government of Sweden’s contribution was KES 3.854 billion while GoK
gave KES 1.0 billion to the Programme. Thus the total cost spread over a five year period was KES
4.854 Billion. The purpose of ASDSP was “increased and equitable incomes, more employment
opportunities and improved food security of the target groups as a result of enhanced production
and productivity in the rural smallholder farm and off-farm sector”.
C. Programme Outcomes
The Programme had three outcomes viz. development of a transparent system for improved
agricultural sector coordination and harmonization and an enabling policy and institutional
environment for the realization of ASDS; strengthening of environmental resilience and social
inclusion of value chains and promotion of viable and equitable commercialization of the Agricultural
Sector through Value Chain Development.
To achieve its objectives ASDSP applied carefully considered strategies including inter-sectoral focus
in sector coordination and Value Chain Development (VCD); demand-driven and stakeholder-led
VCD; partnership-based investment and implementation; harmonization with government structures
and procedures; commercial and ‘pull-focused’ Value Chain Development; rights-based integration
of smallholders, women and youth in VCD; resilience-focused approach to VCD and a viable exit
strategy based on realized capacity of Value Chain Actors and service providers in expectation of
their turn to manage value chains at the end of the Programme.
The Programme was designed to undergo two evaluations: the Mid Term Review that took place in
2014 and, among other suggestions, recommended that the Programme concentrates on sector
coordination as it supported devolution of agriculture and the End Term Evaluation (ETE) which is
the subject of this report.
D. Evaluation Objectives and Methodology
The ETE of ASDSP was conducted in a period of 60 days between November 2016 and March 2017
with an objective of establishing the Programme’s impacts by analyzing its achievements, challenges
and implementation mechanism. Twenty counties were purposively selected to represent the
country. Selection was done on the basis of regional balance, value chain types and the predominant

vii
agro-ecological zone. Secondary data was collected from all the 47 counties through desk reviews of
reports and documents. Primary data was collected by trained data collectors from 2,406 randomly
selected ASDSP Value Chain Actors (VCAs) and at least 240 other VCAs who did not benefit from the
Programme, a structured questionnaire whose development was mainly guided by the Programme
log frame was used. Focus Group Discussions and Key Informant Interviews which applied to Value
Chain Organizations and similar special interest groups were carried out by the ETE Team. Data entry
and analysis was accomplished through Microsoft Excel 2010 and the Statistical Package for Social
Sciences (SPSS) version 20 and presented as descriptive statistics outlining the Programme’s
relevance, effectiveness, efficiency, impacts and sustainability.
E. Main Evaluation Findings
Relevance: The Programme supported establishment of coordination structures that were found
useful by the national and county governments. The national Transformation Initiative and the
County Steering Committees, Value Chain Platforms and Value Chain Core Groups had particular
relevance in strengthening the broad involvement of stakeholders including the private sector in
agriculture. The intergovernmental consultation structures provided an opportunity for the national
and the county governments to work together towards a common objective of realizing the goals of
the Sector. At least 88.4% of the Programme Value Chain Actors indicated that agriculture was their
first source of income thus confirming its importance in the national economy as expressed in the
ASDS.
The Programme developed a Monitoring and Evaluation system that yielded reports used by the
counties in planning and decision making. Similarly, developed policies provided a basis for planning
including preparation of County Integrated Development Plans. ASDSP emphasized inclusion of
women and youth in Value Chain Development to promote their economic empowerment. The
Programme’s acceptability and ownership at the lowest level was ensured through Value Chain
Actors’ prioritization of value chains through agreed criteria while involvement of partners in VCD
leveraged funds that supported more Programme achievements.
The design of the Programme was originally contemplated prior to promulgation of the Constitution
2010 and therefore did not take into consideration the resulting devolution of agriculture. Thus
national government managed the Programme at the counties contrary to expectations of the
Constitution and county governments.
Effectiveness and efficiency: the extent to which the Programme realized its 3 outcomes was critical
in the assessment of its effectiveness and efficiency. ASDSP partly achieved sector coordination
through establishment, strengthening and operationalization of key ASDS institutions and support to
the Transformation Initiative, County Steering Committees, joint sector programming and financing
and Development Partners’ adherence to the Code of Conduct. Linkages between key sector
stakeholders improved while sector-wide M&E systems and appropriate policies, strategies and
regulations were developed.
The Programme worked towards achieving environmental resilience among Value Chain Actors
through enhancement of: awareness and knowledge of the importance of environmental
sustainability, NRM and the causes and effects of climate change; Participatory Scenario Planning
approach in VCD; capacity for equitable engagement in local planning for Natural Resource
Management (NRM) and climate change and improved access to and use of appropriate NRM and
climate change technologies and services, particularly for women, youth and vulnerable groups.
viii
Social inclusion was determined by conditions that enabled vulnerable groups to engage in VCD,
improved their access to social protection services and enhanced community action capability.
Participation of women and youth in VCD was achieved through deliberate efforts to increase their
involvement in production and other value chain activities and improvement of their access to
productive assets. The Programme had an outreach of close to 500,000 VCAs of whom 46%, 36% and
18% were male, female and youth respectively. On the whole, the Programme was not effective in
integrating environmental resilience and social inclusion concerns in VCD.
Efforts to promote viable and equitable commercialization of the Agricultural Sector through VCD
concentrated on: developing inclusive Value Chain Organizations; improving vertical and horizontal
linkages along the value chains; strengthening value chain organizations’ advocacy and lobbying
capacity; enhancing VCAs’ business management skills and increasing public and private investments
in value chains. Other efforts centred on: increasing VCAs’ investments; improving access to market;
boosting technical capacity for pre and post production management; enhancing access to
affordable financial and insurance services for VCAs and up-scaling and out-scaling innovative and
inclusive value chains and value chain technologies.
Impacts: the Programme had 3 outcome areas, namely development of a transparent system for
realizing Agricultural Sector coordination and harmonization and an enabling institutional
environment for the realization of ASDS; strengthening environmental resilience and social inclusion
of promoted value chains and promotion of viable and equitable commercialization of the
Agricultural Sector.
ASDP secured funding towards sector coordination from various stakeholders including the national
government, county governments and development partners. Joint planning and implementation
with partners provided additional synergy and generated leverage funding. Such leverage funds
benefitted implementation of extended concepts on coordination among others. Through this
mechanism ASDSP together with partners was able to coordinate and facilitate capacity building,
policy formulation and preparation of the sector wide Monitoring and Evaluation and Institutional
reform Framework. The Intergovernmental Secretariat improved linkage between the national and
county governments. Horizontal and vertical outreach of ASDSP coordination was achieved through
the establishment and operationalization of national management and decision making organs
including the National Programme Secretariat and its attendant Programme Steering Committee and
the 47 County Coordinating Units and their aligned County Steering committees.
In regard to environmental resilience, 75% of VCAs trained on Natural Resource Management (NRM)
were enabled to apply NRM practices in their agricultural enterprises by 2016 compared to 41% in
2013. In the same context, up to 45% of VCAs had applied climate change related risk training in
agricultural enterprises by 2016 compared to 63% in 2013. Response capacity of households to
climate change related risks improved as evidenced by 40% of VCAs who used at least one or
multiple responses compared to 33% in 2013.
Social inclusion mainly involved integrating women and youth in VCD. Land and other production
assets were more accessible to both women and youth in 2016 as compared to 2013. Close to 20%
of all VCAs received social protection services. The most received social protection service was
subsidized inputs followed by relief food and hunger safety net. Men, women and youth were
equally involved in decision making at the local level.
ix
As concerns viability and equitability of commercialisation of the Agricultural Sector, it is noteworthy
that the turnover from traded agricultural commodities increased from the baseline of Ksh 495,247
to Ksh 2,858,396 in the year 2017. Income for male household heads increased by 78% by 2016 as
compared to the baseline. Income for female headed households increased by 25% over the same
period while that of youth increased by 15%.
There was improvement in food security across gender divides as demonstrated by the reduced
proportion of male, female and youth headed households that had less food to meet their needs in
2016. The overall proportion of households that ate 3 meals per day slightly increased from 86.1% to
87.4% between 2014 and 2016 among ASDSP VCAs. There was a marginal change in asset
ownership. More VCAs, 14.7%, acquired gas cookers in 2014 up from 9.8% in the baseline period,
2013, but this reduced slightly to 12% in 2016. The proportion of respondents who acquired bicycles
reduced steadily from 2013 to 2016 but this was offset by acquisition of motorcycles which steadily
increased from 7.6% in 2013 to 11.9% in 2016.
There was no appreciable change in on-farm employment. A majority of the households (75.1%),
retained the same employees they had since 2014. The same trend was reported in off-farm
employment where (92.3%) where the same employees employed in 2014 had been retained.
Sustainability: at the national level, the Programme enhanced management and technical capacities
and supported development of a sector wide M&E framework and policies that will continue to be
used within the Sector. Many structures were developed at the county level including County
Steering Committees (CSCs), Value Chain Platforms (VCPs) and Value Chain Core Groups (VCCGs).
Some counties had already mainstreamed some of these structures in 2016 however, the many
structures may not be sustained beyond ASDSP. Sustainability would require a much leaner structure
that is perceived as most valuable by stakeholders in the counties. For example, a county-level
Agriculture Sector Development Forum which is already in existence in some counties.
Implementation of the Programme was mainly partner-based and capacity was developed among
VCAs. Gains in VCD are likely to be sustained due to partnerships that the Programme established
with diverse community organizations and service providers including financial institutions. County
governments and the private sector invested in support of value chains. This is expected to continue
and should enhance financial stability and contribute to sustainability. On the other hand, VCPs and
VCCGs were found to be county-specific and had limited capacity in business and market orientation
and minimal private sector engagement yet marketing is the most important reason for the
formation of agricultural groups accounting for 37% of all groups formed. The VCPs and VCCGs are
therefore unlikely to be sustained beyond ASDSP.
Replicability of the Programme will, most likely, be aided by value chain approaches that are based
on causal models which focus on addressing critical bottlenecks, constraints and opportunities in
selected value chains. Value chain approaches are coordinated and systematic and involve actors
undertaking specific functions.
F. Conclusions
i. The objectives of ASDSP are valid considering that there is increasing food insecurity, low
incomes and under and unemployment. ASDSP’s objectives were relevant to the goals and
objectives of Kenya’s ASDS, SDGs and were in agreement with the Swedish Government’s
“Strategy for development cooperation with Kenya, 2009-2013”

x
ii. The activities and outputs of ASDSP are consistent with the overall goal and the attainment of
its objectives. There is a link between the activities of the programme and the outputs and
subsequently with the overall goal and attainment of the objectives, however realization of
impacts will require deepened activities and longer time period.
iii. The original design of the programme had to change with the advent of the Constitution 2010
that ushered in a new ministry structure with a narrower sector wide focus and new
governance.
iv. The Programme steering and coordination structures were found useful by the national and
county governments. The TI, the CSC, the VCP and VCCCGs had particular relevance in
strengthening the broad involvement of stakeholders including the private sector in
agriculture. The intergovernmental consultation structures provided an opportunity for the
national and the county governments to work together towards a common objective of
realizing the goals of the Sector
v. The overall performance of the programme is satisfactory and has achieved certain results and
targets in accordance with the program document. The key factors contributing to
performance include establishment, strengthening and operationalization of key ASDS
institutions, enhancing social inclusion, inclusive and effective VCO; enhancing VCAs’
business management skills and increasing investments in value chains. Environmental
resilience and adaptation to climate change however were not sufficiently taken up by VCAs
vi. The Programme developed a M&E system that yielded reports used by the counties in
planning and decision making. The annual work planning process provides a platform for
ensuring activities are aligned to objectives. M&E tools and approaches included semi-
annual and annual reports; semi-annual field visits; two bilateral review field visits and
meetings per year; two Steering Committee field visits per year and four Steering Committee
meetings and un-scheduled visits according to county demands.
vii. Technical Assistance mainly focused on assisting the Programme in consolidating
implementation of field level activities in the prioritized value chains, audit, initiating efforts
to support sector coordination initiatives and supporting the TI.
viii. Joint planning and implementation with partners provided additional synergy and generated
leverage funding. Such leverage funds benefitted implementation of extended concepts on
coordination among others.
ix. Implementation of the Programme was mainly partner-based and capacity was developed
among VCAs. Gains in VCD are likely to be sustained due to partnerships that the
Programme established with diverse community organizations and service providers
including financial institutions. County governments and the private sector invested in
support of value chains.
x. Replicability of the Programme will be aided by value chain approaches that are based on
causal models which focus on addressing critical bottlenecks, constraints and opportunities
in selected value chains.
G. Recommendations
The impact evaluation makes five specific recommendations for consideration in the design and
implementation of the second phase of ASDSP:

xi
1. Strengthen interdepartmental and inter-ministerial interactions and enhance participation of
non-state actors;
2. Strengthen business and market orientation and particularly the ability to engage the private
sector to ensure institutional sustainability of VCPs and VCCGs;
3. Promote youth participation in Value Chain Development;
4. Improve access to financial services to enhance uptake of technologies and increase
productivity; and
5. Strengthen capacities in Natural Resource Management planning among Value Chain Actors.

xii
TABLE OF CONTENTS
EXECUTIVE SUMMARY ....................................................................................................................................... VI
ABBREVIATIONS AND ACRONYMS .................................................................................................................... XIV
DEFINITION OF TERMS .................................................................................................................................... XVIII
1. INTRODUCTION ....................................................................................................................................... 1
2. COUNTRY CONTEXT ................................................................................................................................. 1
2.1 SOCIO-ECONOMIC CONTEXT ......................................................................................................................... 1
2.2 AGRICULTURAL SECTOR ............................................................................................................................... 2
2.3 THE AGRICULTURAL SECTOR DEVELOPMENT SUPPORT PROGRAMME ................................................................... 3
2.4 EVALUATION ............................................................................................................................................. 4
3. METHODOLOGY ...................................................................................................................................... 5
3.1 STUDY AREA .............................................................................................................................................. 5
3.2 SAMPLING ................................................................................................................................................ 5
3.3 DATA COLLECTION ...................................................................................................................................... 6
3.4 DATA ANALYSIS AND PRESENTATION ............................................................................................................... 7
3.5 LIMITATIONS AND ASSUMPTIONS OF THE EVALUATION ....................................................................................... 7
4. FINDINGS ................................................................................................................................................. 8
4.1 PREPARATION, DESIGN AND IMPLEMENTATION ................................................................................................. 8
4.2 RELEVANCE ............................................................................................................................................. 13
4.3 RESULTS ................................................................................................................................................. 15
4.4 EFFECTIVENESS AND EFFICIENCY .................................................................................................................. 31
4.5 IMPACT .................................................................................................................................................. 32
4.6 SUSTAINABILITY AND REPLICABILITY .............................................................................................................. 45
5. CONCLUSIONS, LESSONS LEARNT AND RECOMMENDATIONS................................................................ 48
5.1 CONCLUSIONS ......................................................................................................................................... 48
10.1 LESSONS LEARNT ...................................................................................................................................... 49
10.2 RECOMMENDATIONS ................................................................................................................................ 50
LIST OF TABLES
Table 1.1: Kenya economy data .................................................................................................................................. 2
Table 3.1: Proportionate sample sizes per county ...................................................................................................... 6
Table 4.1: Funding for Transformation Initiative aligned coordination activities ...................................................... 16
Table 4.2: Funding for county sector coordination initiatives ................................................................................... 17
Table 4.3: Number and Category of staff in institutions of relevance to ASDSP ....................................................... 18
Table 4.4: No of capacity development plans implemented ..................................................................................... 19
Table 4.5: Proportion (%) of VCAs mainly accessing agriculture-related services by gender .................................... 19
Table 4.6: Proportion (%) of VCAs adopting technologies by gender ........................................................................ 20
Table 4.7: No. of sector programmes integrating operations ................................................................................... 21
Table 4.8: No of TWGs established ............................................................................................................................ 21

xiii
Table 4.9: Policies, strategies and regulations prepared and rolled out ................................................................... 22
Table 4.10: Service providers involved in training VC actors on NRM and CC related risks ...................................... 23
Table 4.11: No. of VC actors trained on NRM and CC – related risks by gender ....................................................... 23
Table 4.12: VC actors trained as early warning agents disaggregated by gender ..................................................... 24
Table 4.13: VC actors accessing to weather, seasonal forecasting and/or climate scenarios information: .............. 24
Table: 4.14: Value chain actors using climate smart technology inputs and /or land management resources. ....... 24
Table 4.15: VCAs involved in climate risk management plans development at local level ....................................... 25
Table 4.16: Women and youth actors using social protection services .................................................................... 25
Table 4.17: Types of social protection services accessed by the VCAs by gender ..................................................... 25
Table 4.18: Number and Type of VCO ....................................................................................................................... 27
Table 4.19: Number of Actors Linked to VCO ............................................................................................................ 27
Table 4.20: Number of VCAs Implementing Business Plans ...................................................................................... 28
Table 4.21: Implementation of business plans by VC Node ...................................................................................... 28
Table 4.22: Number and type and coverage of infrastructure projects established under PPP ................................ 28
Table 4.23: No and type of coverage of projects by VCAs ......................................................................................... 29
Table 4.24: No of VC actors using market information ............................................................................................. 29
Table 4.25: No. of VC actors undertaking value added initiatives ............................................................................. 29
Table 4.26: No. of VCA using improved pre and post production management practices........................................ 30
Table 4.27: No of VC actors using financial services .................................................................................................. 30
Table 4.28: Source, use and affordability of financial services .................................................................................. 30
Table 4.29: Type, use and affordability of insurance services ................................................................................... 31
Table 4.30: Number of VCAs using insurance services .............................................................................................. 31
Table 4.31: VCAs applying climate change related risks training by gender ............................................................. 34
Table 4.32: Access to production resources by women and youth ........................................................................... 35
Table 4.33: Commodities traded ............................................................................................................................... 36
Table 4.34: On- farm employment ............................................................................................................................ 37
Table 4.35: Off-farm employment ............................................................................................................................. 37
Table 4.36: Increase in number and types of agro-enterprises ................................................................................. 38
Table 4.37: On farm incomes by gender ................................................................................................................... 39
Table 4.38: Value chain incomes for men, women and youth .................................................................................. 39
Table 4.39: Increase in off farm incomes (in KES) ..................................................................................................... 40
Table 4.40: Gender disparities in on-farm incomes................................................................................................... 40
Table 4.41: Household head gender disparities in on-farm incomes ........................................................................ 41
Table 4.42: Meals eaten by households per day ....................................................................................................... 41
Table 4.43: Meals taken by households per day, by gender ..................................................................................... 41
Table 4.44: Proportion of household heads that lacked food by gender .................................................................. 42
Table 4.45: Change in Dietary Diversity Index by gender .......................................................................................... 43
Table 4.46: Variation in types of food eaten ............................................................................................................. 43
Table 4.47: Productivity trends ................................................................................................................................. 44
LIST OF FIGURES
Figure 1: Map of selected counties .....................................................................................................................xvii
Figure 2: Trends in % Customer satisfaction with services offered by ASDSP and its stakeholders ..................... 18
Figure 3: Social protection and security services providers .................................................................................. 26
Figure 4: Number of VCOs with functional linkages ............................................................................................. 27

xiv
Figure 5: Asset acquisition among ASDSP VCAs.................................................................................................... 45
List of annexes
ANNEX 1: PROGRAMME LOGFRAME .............................................................................................................. 52
ANNEX 2: EVALUATION TOOLS ...................................................................................................................... 63
ANNEX 3: TOR FOR THE END TERM EVALUATION OF ASDSP .......................................................................... 64
ANNEX 4: WORK PLAN - END OF TERM EVALUATION OF ASDSP .................................................................... 68
ANNEX 5: LIST OF EVALUATION TEAM MEMBERS .......................................................................................... 69
ANNEX 6: LIST OF PERSONS MET.................................................................................................................... 70
ABBREVIATIONS AND ACRONYMS
ASALs - Arid and Semi-Arid Lands
ASCU - Agricultural Sector Coordination Unit
ASDS - Agricultural Sector Development Strategy
ASDSP - Agricultural Sector Development Support Programme
BAE - Bilateral Associate Expert
CAADP - Comprehensive Africa Agricultural Development Programme
CBO - Community Based Organization
CCU - County Coordinating Units
CEC - County Executive Committee
CG - County Governments
CIG - Common Interest Group
CO - Chief Officers
CoC - Code of Conduct
CoG - Council of Governors
CoGCAL - Council of Governors Committee on Agriculture and Lands
CPF - Common Programme Framework
CSC - County Steering Committee
DP - Development Partner
ETE - End Term Evaluation
EU - European Union
FBO - Faith Based Organization
FGD - Focus Group Discussion
GDP - Gross Domestic Product
GoK - Government of Kenya
IGS - Inter-Governmental Secretariat
ITWG - Intergovernmental Thematic Working Group
KES - Kenya Shilling

xv
KII - Key Informant Interview
KIT - Knowledge, Information and Technology
KJAS - Kenya Joint Agricultural Strategy
M&E - Monitoring and Evaluation
MIS - Management Information System
MoALF - Ministry of Agriculture, Livestock and Fisheries
MTP II - Medium Term Plan II
MTR - Mid Term Review
NAFIS - National Farmers Information Service
NASPF - National Agriculture Sector Partners’ Forum
NGO - Non-Governmental Organization
NPS - National Program Secretariat
NRM - Natural Resource Management
PS - Principal Secretary
PSC - Program Steering Committee
SAGA - Semi-Autonomous Government Agency
SCA - Sector Coordination Advisor
SIDA - Swedish International Development Agency
SWAP - Sector-Wide Approach
TA - Technical Assistant
TI - Transformation Initiative
ToC - Theory of Change
ToR - Terms of Reference
TS - Transformation Secretariat
TWG - Thematic Working Group
VC - Value Chain
VCA - Value Chain Actor
VCCG - Value Chain Core Group
VCD - Value Chain Development
VCF - Value Chain Forum
VCO - Value Chain Organization
VCP - Value Chain Platform
WB - World Bank

xvi
MAP OF COUNTIES SELECTED FOR THE HOUSEHOLD SURVEY

xvii
Figure 1: Map of selected counties

xviii
DEFINITION OF TERMS
Female-Headed Household: This is a household whose main decision maker on agricultural
production, marketing and consumption is a female person aged 36 years and above.
Food Security: According to FAO (1996) refers to “all people, at all times, having physical and
economic access to sufficient, safe and nutritious food to meet their dietary needs and food
preferences for an active and healthy life”. A food-secure household was defined as one whose
calorie supply per Adult Equivalent is greater than or equal to the minimum daily calorie
requirement of 2,260 kcal for an adult.
Gender: Categorizes people in terms of their roles and responsibilities as provided by the social and
customary considerations of a given society. Gender does not refer to sex of an individual. For this
study, four gender categories were used: Adult males (men aged 36 years. and above); Adult females
(women aged 36 years and above.), Male youth (men aged 18-35. years of age), and female youth
(women aged 18-35 years of age).
Household: This is a collection of persons who depend on a common store. The persons may not
necessarily be members of the same family. They often make common production, marketing and
consumption decisions.
Male-Headed Household: This is a household whose main decision maker on agricultural
production, marketing and consumption is a male person aged 36 years and above.
Non-farm Income: Refers to income derived from other sources apart from farming activities by
household members. Examples include salaried employment, business etc.
Off-farm Income: Refers to income derived from farming activities undertaken outside the
household farm setting. The activities could be farming or non-farming in nature. Examples include
farm wage labour, marketing of produce that is not of the household.
Productivity: This is production per unit of resource. The term is applied to crop / livestock
production per unit of land or animal (yield) within a specified time period (day, season or year) in
this study.
Social protection: Refers to affirmative action taken by Government, Development Partners or other
agencies to assist the vulnerable such as the elderly, incapacitated and those with terminal diseases,
food insecure, poor to cushion them from livelihood challenges they face.
Technology: This refers to a process or technique that enhances crop or livestock productivity.
Examples include use of improved seed, fertilizer etc.
Value addition: Refers to any activity or process that enhances the value of a product through a
number of ways; by increasing its shelf-life or improving accessibility / ease of sale of product, etc.
with or without transforming the original product.
Vulnerability: Is a state of inadequacy. A household member is vulnerable when he/she lacks
adequate resources to meet their basic human wants: food, shelter, clothing etc.
Youth-Headed Household: This is a household whose main decision maker on agricultural
Production, marketing and consumption is a male or female person aged between 18 and 35 years
irrespective of sex or marital status.

xix
1
1. INTRODUCTION
ASDSP was a five year Programme, 2012-2016, implemented by the Government of Kenya in
collaboration with stakeholders in all the 47 counties to “support the transformation of Kenya’s
Agricultural Sector into an innovative, commercially oriented, competitive and modern industry that
contributes to poverty reduction and improved food security in rural and urban Kenya”. The
Programme had three major outcome areas based on the two strategic thrusts defined in the ASDS,
namely increasing productivity, commercialization and competitiveness of agricultural commodities
and enterprises, and developing and managing key factors of production.
This End Term Evaluation (ETE) report is a reflection of the performance of the Programme since its
inception in 2012. It covers the broad objectives of the Sector as well as the extent to which the
Programme responded to the changed implementation context to achieve its objectives, the impacts
of the Programme among the stakeholders and the overall Programme performance and lessons
learnt for future improvements. The ETE was conducted within 60 days between early November,
2016 and March 2017. The Evaluation report comprises of the following chapters:
Chapter 2 introduces the ASDSP, the policy and institutional context under which it operated
and the objective of the End Term Evaluation;
Chapter 3 describes the methodology used in the Evaluation including the selection of sample
of counties and respondents for the HH questionnaire, the data collection tools; the analysis
of data and the limitations and assumptions of the evaluation;
Chapter 4 provides an assessment of the findings of programme design, implementation,
relevance, results, effectiveness, efficiency, sustainability and analysis of the impacts of the
programme; and
Chapter 5 presents the conclusions of the evaluation, the key lessons learnt and
recommendations.
The Programme Logframe, the Evaluation Tools, the Terms of Reference, the Work Programme, the
Evaluation Team and Persons met are presented in Annexes 1, 2, 3, 4, 5 and 6 respectively.
2. COUNTRY CONTEXT
2.1 Socio-economic context
Kenya has shown resilient growth over the last 6 years and its economy remains one of the fastest-
growing in the region. The growth rate is expected to improve from 5.6% in 2015 and 5.9% in 2016
to 6% in 20171. This positive outlook is attributed to low oil prices, good agricultural performance,
supportive monetary policy and ongoing infrastructure investments. Kenya experienced strong
economic performance in 2015 and has exceeded the average growth for Sub-Saharan Africa
countries consistently since 2009 (Table 1.1). Although significant structural and economic reforms
that have contributed to sustained growth in the past decade have been realized, Kenya still faces
substantial internal development challenges including poverty, inequality and vulnerability of the
economy to internal and external shocks.
1 WB, Kenya Economic Update, March 2016.

2
Table 1.1: Kenya economy data
Indicator 2012 2013 2014 2015
Population (million) 40.7 41.8 42.9 44.1
GDP per capita (USD) 1,243 1,318 1,424 1,340
GDP (USD Bn.) 50.6 55.1 61.1 63.4
Economic Growth (GDP, annual variation in %) 4.6 5.7 5.3 5.6
Public Debt (% of GDP) 42.1 44.6 46.3 51.3
Inflation Rate (CPI, annual variation in %) 9.4 5.7 6.9 6.6
Policy Interest Rate (%) 11.00 8.50 8.50 11.50
Exports (USD billion) 6.1 5.9 6.1 5.9
Imports (USD billion) 16.3 16.4 18.5 15.9
International Reserves (USD Bn. ) 5.7 6.6 7.9 7.6
External Debt (% of GDP) 23.2 24.8 26.5 -
Source: Focus Economics 2016
Devolution from the August 2010 Constitution ushered in a new political and economic governance
system that is transformative and has strengthened public service delivery at local levels. The
government’s agenda is to deepen implementation of devolution and strengthen governance
institutions while addressing other challenges including land reforms and security to improve
economic and social outcomes, accelerate growth and equity in distribution of resources, reduce
extreme poverty and increase youth employment.
While Kenya is on the path to economic growth, poverty alleviation remains a challenge; 45.9% of
the country's 43 million people and 49.1% of the rural population live below the poverty line (less
than USD 1.9 per day) and are unable to meet their daily nutritional requirements. Poverty and food
insecurity are acute in the country's Arid and Semi-Arid Lands which have been severely affected by
recurrent droughts. Rural poverty in Kenya is also strongly linked to environmental concerns,
especially catchment degradation, poor water management, soil erosion, declining soil fertility and
land degradation. Climate change, which is one of the many challenges facing the Kenyan economy,
could undermine the resource base and contribute to declining agricultural yields. Droughts and
floods have increased in frequency and intensity over the last decade.
Kenya has one of the world's highest rates of population growth. In 2013 it was estimated at 2.7%.
The population has tripled in the past 35 years increasing pressure on the country's resources and
leaving young people particularly vulnerable to poverty. Other aspects of inequality include income
disparity between men and women, life expectancy variation among regions, education dissimilarity,
and inequality in access to water between rural and urban areas, healthcare inequality between
regions, child mortality inequality, and poverty inequality between rural and urban areas and among
regions. Rural women are vulnerable as well, because they do not have equal access to social and
economic assets and subsistence farming is their primary source of livelihood. Women and young
people have great capacities for contributing to economic development and social progress if they
are able to fulfil their potential.
2.2 Agricultural Sector
The Agricultural Sector comprises of crops, livestock and fisheries subsectors. Kenya’s Vision 2030,
emphasize the importance of the agriculture sector. Agriculture contributes 26% of the GDP directly
3
(2010) and another 25% indirectly. It accounts for 65% of Kenya’s total exports and provides more
than 18 % of the country’s formal employment and over 70% of informal employment in the rural
areas.
The Agricultural Sector in Kenya is diverse and complex. There are subsistence and commercial
farmers with small, medium and large scale farms. The most common and economically important
farming systems are the small scale mixed farms (crops/ animals/ trees) of 0.2-3 hectares in size.
These farms account for 75 % of the total agricultural output and 70 % of the marketed agricultural
produce in the country. Kenya’s agro-ecological diversity enables production of a wide range of
temperate, tropical and subtropical products. However, areas with adequate rainfall for crop
production occupy only 16 % of the land area; the remaining 84 % is of low or non-existing potential
for rain-fed crop production (arid and semi-arid lands).
The Agricultural Sector Development Strategy (ASDS) 2010 – 2020 based on Vision 2030 has the
overall objective of achieving an agricultural growth rate of 7% per year. ASDS has two strategic
thrusts namely increasing productivity, commercialization and competitiveness of the agricultural
commodities and enterprises and developing and managing key factors of production.
2.3 The Agricultural Sector Development Support Programme
The Agricultural Sector Development Support Programme (ASDSP) was formulated during 2010 to
2011 and its implementation started in 2012. It was aligned to ASDS that was launched together
with the CAADP Compact in July 2010. It was designed for a five-year period ending December 2016.
However, in early 2016, the Programme was extended by six months at no-cost to June 2017. ASDSP
was designed as a broad Sector-Wide Programme to be implemented at both levels of government.
The Programme was financed by the Governments of Kenya and Sweden. The Government of
Sweden’s contribution was KES 3.854 billion (SEK 350 M) and KES 1.2 billion as credit guarantee in
partnership with USAID and managed by USAID appointed agents. The Government of Kenya’s
contribution was KES 1.0 billion excluding staff salaries, office accommodation, utilities and staff
training among others. The Programme’s total cost spread over a five year period was KES 4.854
Billion.
The overall goal of ASDSP was the same as that of ASDS: “to transform Kenya’s agricultural sector
into an innovative, commercially oriented, competitive and modern industry that will contribute to
poverty reduction, improved food security and equity in rural and urban Kenya”.
The specific purpose of ASDSP was “increased and equitable incomes, employment and food security
of the target groups as a result of improved production and productivity in the rural smallholder
farm and off-farm sector”.
The Programme had three components: development of a transparent system for improved
Agricultural Sector coordination and harmonisation and an enabling policy and institutional
environment for the realization of ASDS; strengthening of environmental resilience and social
inclusion of vulnerable groups in Value Chain Development and promotion of viable and equitable
commercialization of the Agricultural Sector through Value Chain Development.
The main strategy for ASDSP’s implementation was “demand driven, stakeholder led and
partnership based”. The Programme had a wide range of stakeholders including the broad sector
ministries, all administrative tiers in the Sector, parastatal agents; private sector agribusiness actors;
4
civil society organizations particularly farmer organizations and bilateral and multilateral
Development Partners.
ASDSP supported the two main strategic thrusts of ASDS. The focus of the Programme was to
facilitate demand-driven, stakeholder led and coordinated efforts by relevant public and non-public
sector actors especially private sector agents to strengthen critical value chains of local and national
importance. This was with a view to: making the prioritized value chains commercially viable;
ensuring that value chains are environmentally resilient and accessible to poor and vulnerable
farming constituencies and contributing towards improved food security, income generation and
employment creation.
2.4 Evaluation
The Programme envisaged two evaluations, the Mid Term Review (MTR) and the End Term
Evaluation (ETE). The MTR was carried out in 2014 while the End Term Evaluation was conducted
within 60 days between early November, 2016 and March 2017 on the basis of a broad ToR. The
broad objective of the study was to establish the impacts of ASDSP by analysing its achievements,
challenges and the implementation mechanism applied during the last five years. The specific
objectives of the evaluation were to: establish the outreach of the Programme; establish the
Programme impacts; establish Programme outcomes and sub-outcomes; establish Programme
outputs and identify and document Programme case studies and processes.
5
3. METHODOLOGY
The evaluation was conducted by a Team of experts from the Agricultural Sector Ministries who
were not involved in the actual implementation of ASDSP. The Team used field survey, focus group
discussions and key informant interviews to determine the performance of the Programme based on
five evaluation criteria namely relevance, effectiveness, efficiency, impact and sustainability.
3.1 Study area
The counties of Kenya were grouped into 10 clusters according to geographical regions. Out of each
cluster, 2 counties, at least 30% of the counties in that cluster, were purposively selected on the
basis of regional balance, value chain types and predominant agro-ecological zones. Consequently,
the following 20 counties were selected: Machakos; Makueni; Taita-Taveta; Kilifi; Garissa; Wajir;
Kisumu; Kisii; Bungoma; Busia; Nyeri; Kiambu; Isiolo; Embu; Uasin Gishu; West Pokot; Bomet;
Nakuru; Kajiado; and Narok (Figure 1).
3.2 Sampling
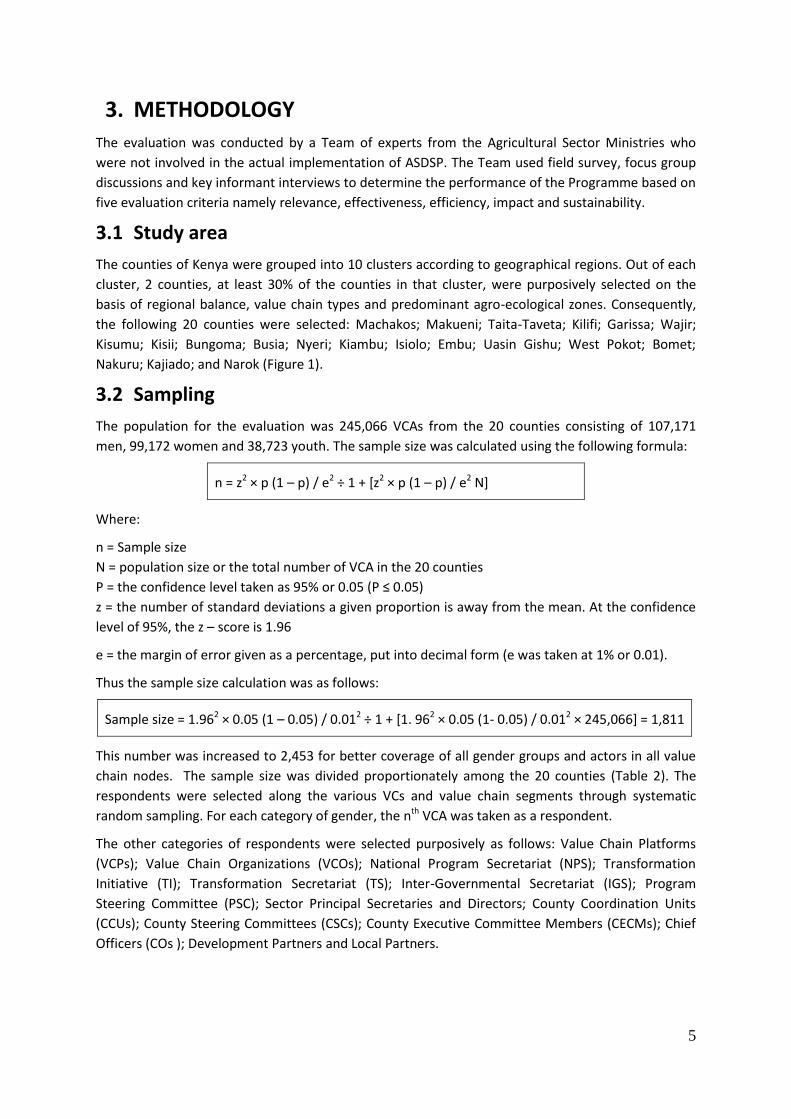
The population for the evaluation was 245,066 VCAs from the 20 counties consisting of 107,171
men, 99,172 women and 38,723 youth. The sample size was calculated using the following formula:
n = z2 × p (1 – p) / e2 ÷ 1 + [z2 × p (1 – p) / e2 N]
Where:
n = Sample size
N = population size or the total number of VCA in the 20 counties
P = the confidence level taken as 95% or 0.05 (P ≤ 0.05)
z = the number of standard deviations a given proportion is away from the mean. At the confidence
level of 95%, the z – score is 1.96
e = the margin of error given as a percentage, put into decimal form (e was taken at 1% or 0.01).
Thus the sample size calculation was as follows:
Sample size = 1.962 × 0.05 (1 – 0.05) / 0.012 ÷ 1 + [1. 962 × 0.05 (1- 0.05) / 0.012 × 245,066] = 1,811
This number was increased to 2,453 for better coverage of all gender groups and actors in all value
chain nodes. The sample size was divided proportionately among the 20 counties (Table 2). The
respondents were selected along the various VCs and value chain segments through systematic
random sampling. For each category of gender, the nth VCA was taken as a respondent.
The other categories of respondents were selected purposively as follows: Value Chain Platforms
(VCPs); Value Chain Organizations (VCOs); National Program Secretariat (NPS); Transformation
Initiative (TI); Transformation Secretariat (TS); Inter-Governmental Secretariat (IGS); Program
Steering Committee (PSC); Sector Principal Secretaries and Directors; County Coordination Units
(CCUs); County Steering Committees (CSCs); County Executive Committee Members (CECMs); Chief
Officers (COs ); Development Partners and Local Partners.

6
Individuals who did not take part in the Programme were interviewed as controls. They were
purposively selected at the ratio of 1 household to 10 Value Chain Actors interviewed in each
county.
Table 3.1: Proportionate sample sizes per county
No. County Total number of VCAs VCAs by gender Total sample sizes
Men Women Youth
1. Kisumu 12,924 44 44 41 129
2. Kisii 12,478 70 42 13 125
3. Bungoma 21,910 97 63 59 219
4. Busia 10,632 36 60 11 107
5. West Pokot 7,565 32 27 17 76
6. Uasin Gishu 11,267 52 52 9 113
7. Bomet 25,006 122 93 35 250
8. Nakuru 12,275 53 47 23 123
9. Narok 16,524 70 59 36 165
10. Kajiado 7,651 40 29 8 77
11. Embu 15,590 85 58 13 156
12. Isiolo 2,888 7 12 10 29
13. Machakos 13,291 63 57 13 133
14. Makueni 9,486 37 50 8 95
15. Garissa 16,376 74 72 18 164
16. Wajir 6,150 24 24 14 62
17. Nyeri 5,628 27 20 9 56
18. Kiambu 20,273 84 95 24 203
19. Taita Taveta 9,552 39 42 14 95
20. Kilifi 7,600 18 46 12 76
Totals 245,066 1,074 992 387 2,453
3.3 Data collection
Secondary data was collected from all the 47 counties through a desk review of national and sector
documents and Programme reports including the Programme Document, Mid-Term Review report,
baseline reports, annual reports, M&E reports and the Strategic Environmental Assessment report.
Primary data was collected from the selected 20 counties using Face-to-Face questionnaires that
were completed online by trained data collectors. The data collectors were youth possessing
university level education with ICT and agriculture related skills. In addition, Focus Group Discussions
(FGD), Key Informant Interviews (KII) and direct observations were conducted. Focus Group
Discussion was applied to Value Chain Platform (VCP) and Value Chain Organization (VCO) officials,
National Program Secretariat (NPS), County Coordinating Units (CCUs) and County Steering
Committees (CSC). Key Informant Interviews were applied to the Transformation Initiative (Inter-
Governmental Secretariat and Transformation Secretariat), Programme Steering Committee,
Development Partners and Local Partners. Both Focus Group Discussions and Key Informant
Interviews were administered by the Evaluation Team according to prepared checklists. Similarly,
direct observations were done by members of the Team.

7
3.4 Data analysis and presentation
Data entry and analysis were done by a qualified data analyst using Microsoft Excel 2010 and the
Statistical Package for Social Sciences (SPSS) version 20 and presented as descriptive statistics. The
FGD and KII data were interpreted by the Evaluation Team with reference to the study objectives
and the stated M&E log-frame indicators. Through these analysis methods the Team determined the
outreach of the Programme in its various manifestations, the Programme impacts, outcomes, sub-
outcomes and outputs. The Team then compiled an End Term Evaluation report that was further
validated at a national workshop and shared with stakeholders.
3.5 Limitations and assumptions of the evaluation
Due to paucity of resources, field survey, Focus Group Discussions and Key Informant Interviews
could not be conducted in the whole country. It is therefore assumed that the sample selected
adequately represented the rest of the counties. In addition, secondary data was collected for all
counties in the country. Some target personnel for Key Informant Interviews were not met in the
counties. In their place, those who were acting on their behalf were interviewed. It is assumed that
these people gave the factual account of ASDSP as requested by the Evaluation Team.
8
4. FINDINGS
This chapter analyses the demography in the project area and assesses the design, implementation,
relevance, results, effectiveness, efficiency, sustainability and analyses the impacts of the
programme
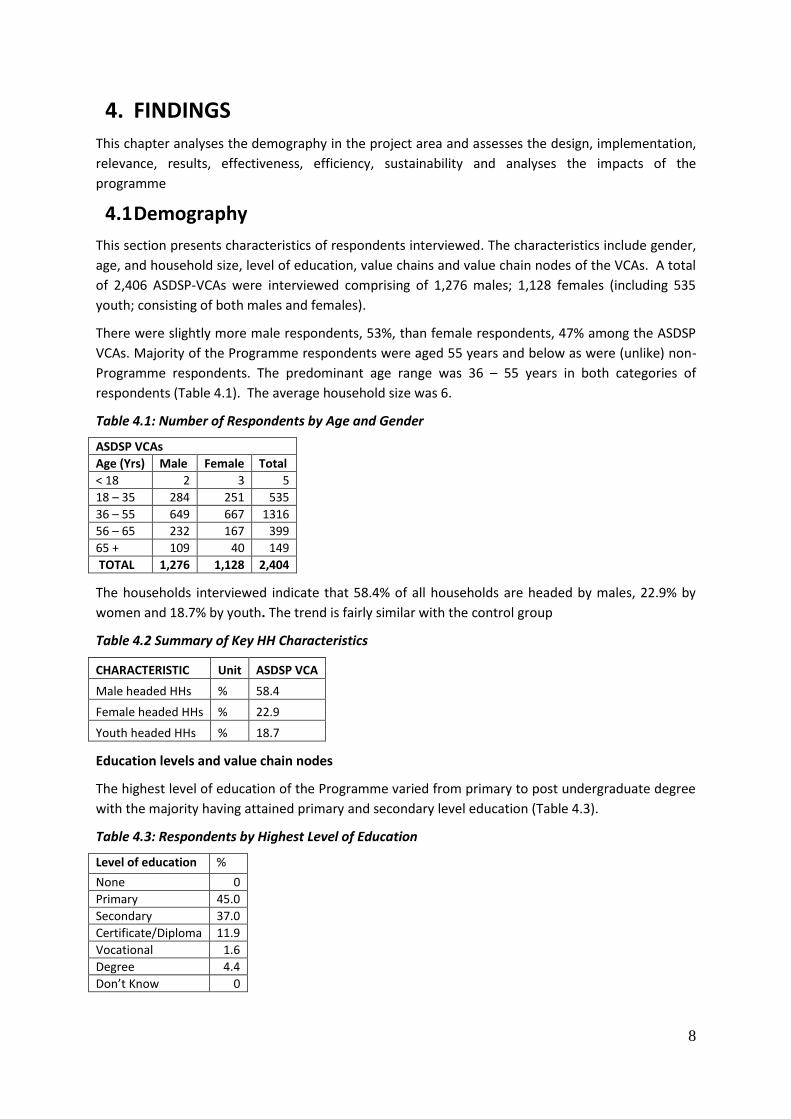
4.1 Demography
This section presents characteristics of respondents interviewed. The characteristics include gender,
age, and household size, level of education, value chains and value chain nodes of the VCAs. A total
of 2,406 ASDSP-VCAs were interviewed comprising of 1,276 males; 1,128 females (including 535
youth; consisting of both males and females).
There were slightly more male respondents, 53%, than female respondents, 47% among the ASDSP
VCAs. Majority of the Programme respondents were aged 55 years and below as were (unlike) non-
Programme respondents. The predominant age range was 36 – 55 years in both categories of
respondents (Table 4.1). The average household size was 6.
Table 4.1: Number of Respondents by Age and Gender
ASDSP VCAs
Age (Yrs) Male Female Total
˂ 18 2 3 5
18 – 35 284 251 535
36 – 55 649 667 1316
56 – 65 232 167 399
65 + 109 40 149
TOTAL 1,276 1,128 2,404
The households interviewed indicate that 58.4% of all households are headed by males, 22.9% by
women and 18.7% by youth. The trend is fairly similar with the control group
Table 4.2 Summary of Key HH Characteristics
CHARACTERISTIC Unit ASDSP VCA
Male headed HHs % 58.4
Female headed HHs % 22.9
Youth headed HHs % 18.7
Education levels and value chain nodes
The highest level of education of the Programme varied from primary to post undergraduate degree
with the majority having attained primary and secondary level education (Table 4.3).
Table 4.3: Respondents by Highest Level of Education
Level of education %
None 0
Primary 45.0
Secondary 37.0
Certificate/Diploma 11.9
Vocational 1.6
Degree 4.4
Don’t Know 0

9
Most of the respondents belonged to the producer node followed by the trader node. On the other
hand, input supplier, processor and transporter nodes had the least numbers of VCAs (Table 4.4).
Table 4.4: Respondents by Value Chain Node
Beneficiary
Node Freq. %
Producer 2134 88.7
Input Supplier 41 1.7
Transporter 53 2.2
Processor 64 2.7
Trader 242 10.1
Service Provider 13 .5
Other 10 .4
TOTAL 2,557 106.3
4.2 Preparation, design and implementation
Preparation
Kenya and Sweden has had a history of development cooperation in the agricultural sector. Before
2012, GOK was implementing the National Agriculture and Livestock Extension Programme (NALEP).
This was an extension program and as it was coming to an end, there was the realization that to
transform agriculture, there was need to focus on value chain development. Moreover, and by
coincidence, the sector had formulated a 20 year strategy (ASDS) whose objective was to
commercialize agriculture. This therefore was an opportunity for the MOALF whose mandate is to
develop agriculture, seek further support from government of Sweden to implement the strategy.
A concept paper was first developed by a multidisciplinary team of specialists from the ministry and
late subjected to a structured consultation process involving different stakeholders at multilevel of
the sector arrangements at the national, regional and county (then districts) level and with different
multidiscipline. The preparation is assessed to have been participatory involving relevant
stakeholders cutting across the duty bearers and claim holders (agribusiness policy and service
providers and direct beneficiaries, the value chain actors). Technical meetings between Sida and
GOK were held after the development of the draft programme leading to a final programme. This
evaluation did establish that the programme was appraised by Sida Appraisal Committee before it
was agreed upon. The programme did not go through nay appraisal review at either the ministry nor
at Treasury because no such committees exists. A concept was first done and after consultations, it
was upgraded to a programme proposal that was finally approved by GOK and discussed with GOS
leading to an agreement between the two governments to support and implement the intervention.
Design
ASDSP was borne out of the realization that Kenya’s economy predominantly relies on agriculture
either directly or indirectly yet agricultural value chains are largely subsistence thus affording little
income to farmers and other Value Chain Actors. Another factor that informed the design of the
programme was the documented lessons learnt in the implementation of NALEP (NALEP MTR and
NALEP ETR). The design difference between NALEP and ASDSP is that whereas NALEP was an
extension programme and implemented by the MOALF, ASDSP is a facilitative programme for
stakeholders to commercialize VCs. The design of ASDSP was based on six strategies and are
assessed as appropriate for delivering on results These includes: Government execution, Aligned and
harmonized Programme governance, management and funding, Transparency and accountability,
10
Broad sector focus and partnership-based, Demand-driven and stakeholder-led VC needs
identification and gap-filling, and Rights-based approach to gender, equity, diversity and socio-
economic inclusion
Agriculture is a broad sector that requires a multidisciplinary approach to address many varied issues
and interests from the multi-levels and multilayers of stakeholders. These strategies were therefore
appropriate in the design and although some did not work well, the results discussed in Sections 4.3
and 4.4 would not have been realized if these strategies were not applied. In particular, the demand
driven value chain approach, rights-based approach to gender, equity, diversity and socio-economic
inclusion and transparency and accountability are assessed to have contributed more to the
reported achievement
An important aspect of the design that is also considered important in the achievement of results is
the result orientation where there is a close link between inputs, activities, outputs, sub-outcomes,
outcomes and impact. The results framework is however assessed to have many indicators that
provided challenges in monitoring and information management.
Although these strategies were all applied during implementation and contributed to the findings
discussed in this report, not all of them worked as designed resulting in not full realization of their
potential. For example, the partnership strategy was expected to enhance the participation of
business actors in the value chain but this was not successful as noted in the achievements even
despite the recommendation by midterm review mission.
Implementation
Implementation of the Programme was expected to start in January 2012 with inception activities
for six months but these activities delayed actual implementation to January 2013. This delay was
due to the need to: establish institutions, hire and capacity build Programme staff both at the
national and county levels and transit from NALEP. Baseline surveys that were meant to be started
and concluded in 2012 did not take place until 2013 and the resulting reports were only completed
in 2014. Hence, actual implementation of the Programme started towards the end of 2013 and
covered four years rather than the envisaged five. At the end of the Programme period in December
2016, an attempt was made to remedy the loss of time through a no-cost extension to June 2017.
Sector wide approach: Implementation was based on the sector-wide approach (SWAp) that was
intended to improve aid effectiveness. The application of SWAp was expected to enable the wider
sector have a shared vision, facilitate priority setting and provide the framework for coordinated
responses to policy initiatives and development of a harmonized M&E. Implementation was to take
place in all the 47 counties where three priority value chains were selected based on con a
predetermined criteria. Implementation was also to take place at the national level where there
were specific national based activities within the three result areas. Implementation was triggered
by activity based workplans that had specified targets and approved by both GOK and GOS. All
counties and the national level implemented the programme as planned but devolution brought
about by the constitution affected organizational structure at the national and county government
levels. This change continued to be a challenge throughout the implementation phase with
programme managers putting mitigation measures as things unfolded.
Technical Assistance: The ministry put in place adequate human capacity for the implementation
and because of the nature of the design where partnership was factored in the implementation, it is
assessed that there was adequate human capacity and inadequate technical and managerial

11
capacity that may have affected implementation. A noted big capacity need is the business
orientation in value chain development. An external technical assistance facility was one of the
mitigation measures incorporated in the programme design. The procurement of TA was composed
of two components, the technical and the audit provided by Niras Natura and Pricewaterhouse
respectively. Technical Assistance mainly focused on assisting the Programme in consolidating
implementation of field level activities in the prioritized value chains, initiating efforts to support
sector coordination initiatives by county governments and supporting the MoALF Transformation
Initiative. The long-term Programme Advisor supported the overall management of the Programme.
Special focus was directed to value chain interventions in the counties as well as various partnership
arrangements.
The Sector Coordination Advisor (SCA) supported the MoALF Transformation Initiative which
constituted the main channel for delivery of sector coordination results under Component 1. The
SCA acted as the lead Technical Assistant (TA) to the Intergovernmental Secretariat (IGS) and in this
capacity supported operationalization of the Intergovernmental Thematic Working Groups (ITWG)
and various IGS activities including conceptualization and initiation of the process to formulate an
intergovernmental communication strategy.
The Bilateral Associate Expert (BAE) seconded by SIDA, contributed to formulation and setting up of
an expert group on agriculture in collaboration with SIANI to develop policy briefs on agricultural
commercialization informed by the Programme baseline survey findings. BAE also supported
communication through documentation of success stories, development of information material and
initiation of a panel study to assess development of the prioritised value chains.
Besides the long-term advisors and International Consultants, technical assistance was also carried
out by National. This gives an indication that capacity has been built both among the National
Consultants as well as among ASDSP technical staff. The latter have in turn built capacity among
Value Chain Actors and other beneficiaries pointing towards the trickle down of capacity.
Audit: The Audit TA (PriceWaterhouse) complimented KENAO in auditing of the programme
resources but adopted a more intensive approach as the auditors visited each spending station at
least two times per year. These audits did not only look at receipts but also considered
disbursement and absorption of funds. The audit system was in place from the start to the end of
the Programme. The audits assisted in reduction of expenditure queries. For example, the 2015-16
Financial Year report was unqualified, an indication that contribution of the two systems, private
audit firms and public helped management of the Programme resources.
Programme Financing: The Programme cost consisted of KES 1 billion from GoK and KES 3.854
billion from the Government of Sweden. In addition, GoK provided staff and facilities like office
space, vehicles, computers, photocopiers and printers. The Programme also benefited from a credit
guarantee of KES 1,200 million that was a joint support between Sida and USAID. This facility was
managed by USAID appointed agent and implemented by Kenya Commercial Bank, Kenya Women
Finance Trust and Small and Medium Enterprises and Micro Africa Ltd (Letshego) as the beneficiary
financial institutions that were to led to value chain actors across board.
There was no detailed activity budget at the design phase as it was assumed that annual work plans
will be more detailed in costing of the activities.
From 2012 – 2016 GoK disbursed KES xx million while SIDA disbursed KEs XX billion. Components
one, two and three absorbed KES xx billion, KES xx million and KES xx million respectively. This

12
represented a total expenditure of KES xx billion. According to the original budget, the distribution of
these funds was to be 31.9% for component one, 21.7% for component two and 46.1% for
component three. It is assessed that the planned distribution on the utilisation of programme funds
were met. Detailed disbursement and absorption per component per year is provided in Table *.*.
Table *.*: xxxxxxxxxxxxxx
Million KES 2012/13 2013/14 2014/15 2015/16 31st
Dec 2016/17
Cumulative
Receipts (SIDA) 1,017 1,000 950 1,000 680 4,647
Receipts (GoK)
Total Receipts
Expenditure Planned % Utilis.
Achieved % Utilisation
Comp. 1 GoK
Comp. 1 Sida
Total comp 1
Comp. 2
Comp. 3
TA Advisory Services
Total Expenditure
% Absorption
Procurement: The Programme planned to procure goods and services during implementation. The
procurement was to be based on the national procurement act and the regulations. There was no
procurement plan in the Programme Document, because of the nature of the Programme design.
However procurement was done based on the arising needs during implementation of specific
activities. Annual Procurement Plans were prepared to facilitate the procurement of programme TA
services, vehicles; computers; office furniture; communication technologies and programme
consumables such as stationery and training venues. There were however challenges in the
procurement as manifested in documented delays due to long Government procurement processes.
Monitoring and Evaluation: Another major implementation consideration in the design was the
establishment of a robust M&E framework as well as support to a sector M&E. ASDSP has developed
a functional M&E and information system with the aim of increasing stakeholders’ access to
Programme M&E services for various uses, including planning and decision making. By the end of the
Programme period in December 2016, a draft Sector M&E implementation framework had been
developed. Monitoring and Evaluation tools and approaches included semi-annual and annual
reports; semi-annual field visits; two bilateral review field visits and meetings per year; two Steering
Committee field visits per year and four Steering Committee meetings and un-scheduled visits
according to county demands. Preparation of reports and all field visits and meetings took place as
planned. At mid-term, there was a Mid Term Review and at the end of the Programme period an
End-Term Evaluation was conducted. Topical assessment studies were also carried out.
An electronic M&E data management system, the Web Based system, was developed as a
Management Information System (MIS) in line with the Programme indicators of the 3 components.
Although the M&E Framework was developed at the Programme inception stage, it was not fully
used until one year after the start of the Programme with some aspects of the system only

13
implemented during the fourth year of implementation. Its development continued to the end of
the Programme. The log frame of the Programme was complex as it had up to 94 indicators.
4.3 Relevance
In evaluating the relevance of the objective of ASDSP, the validity of the project objectives; the
consistency of the activities and outputs to the programme objective and its attainment; and the
consistency of the activities and outputs to impacts and effects were assessed.
Validity of the programme objectives
The objectives of ASDSP are valid considering that there is increasing food insecurity associated with
declining house hold production, low HH on and off-farm incomes and under and unemployment.
The programme objectives are addressing the needs of the beneficiaries – VCAs. As the results and
impact section of this report show, benefits were realized by both claim holders (service receivers)
and duty bearers (service providers). The increasing frequency of climate variability and degradation
of the environment and natural resources continue to affect productivity along all the value chain
nodes but worse at the primary production, the farmer node. In addition, the uncoordinated and
inadequate participation of relevant stakeholders in the sector is also another obstacle to service
provision. Therefore by addressing these interrelated issues, the programme was timely in
enhancing the capacity among stakeholders to participate effectively in solving problems that
affected their livelihoods.
ASDSP’s objectives were relevant to the goals and objectives of Kenya’s agricultural sector
development because it was designed with the objective of implementing the Agricultural Sector
Development Strategy (ASDS). ASDS; 2010 – 2020 is based on Vision 2030 and has an overall
objective of achieving an agricultural growth rate of 7% per year. In July 2010 Kenya signed a CAADP2
Compact, a strategic document that commits the government to implement the common vision of
the sector as described in the ASDS. The priority investment areas within the five strategic thrusts
are: increasing productivity and promoting commercialization and competitiveness;, increasing
market access through development of cooperative and agribusinesses; developing and managing
national water resources, land resources, forestry and wildlife in a sustainable manner; reforming
agricultural services, credit, regulatory, processing and manufacturing institutions for effectiveness
and efficiency; and promoting private sector participation in all aspects of agricultural development.
The project objective is relevant to Kenya’s Vision 2030 and MTP II. Vision 2030 goal is to transform
Kenya into a newly industrializing middle income country providing high quality life to all its citizens
by 2030 while MTP II prioritizes “Transforming Kenya: Pathway to Devolution, Socio-Economic
Development, Equity and National Unity”. Three of ASDSP’s strategies namely government
execution; broad sector focus and partnership-based, demand-driven and stakeholder-led VC needs
identification and gap-filling; and rights-based approach to gender, equity, diversity and socio-
economic inclusion is in tandem with these MTP II objectives. The programme has spent resources in
trying to support devolution efforts of the agricultural sectior through the coordination activities.
The programme objectives are also a means to implementing the Kenyan trade policy that is aimed
at “facilitating evolution of an efficient domestic market and export-led globally competitive
economy through a competitive export-led approach”. ASDSP implementation activities are geared
2 Comprehensive African Agricultural development programme

14
towards commercializing agriculture by linking VCAs to markets and attendant market services that
are a means to realizing trade policy objectives.
The design of ASDSP took into consideration the priorities of the Swedish Government’s support to
Kenya as expressed in the “Strategy for development cooperation with Kenya, 2009-2013”. The
Strategy focused on three areas: democratic governance, natural resources and the environment
and urban development. It articulated three thematic areas namely democracy and human rights,
climate and environment and gender that encompassed women’s role in development and
mainstreaming gender issues in all sector programmes from the earliest planning stages to
monitoring and evaluation.
ASDSP’s objectives resonates well with SDGs Goal No. 1 on ending poverty in all its forms
everywhere; Goal 2 on ending hunger, achieve food security and improved nutrition, and promote
sustainable agriculture; Goal 8 on promoting sustained, inclusive and sustainable economic growth,
full and productive employment and decent work for all; Goal 12 on ensuring sustainable
consumption and production patterns; Goal 13 on taking urgent action to combat climate change
and its impacts; Goal 14 on conserving and sustainably use the oceans, seas and marine resources
for sustainable development; Goal 15 on protecting, restoring and promoting sustainable use of
terrestrial ecosystems, sustainably manage forests, combat desertification, and halt and reverse land
degradation and halt biodiversity loss; and Goal 17 on strengthening the means of implementation
and revitalizing the global partnership for sustainable development. The programmes strategy of
value chain development provided a fertile ground for the integration of these global objectives into
the programme implementation framework.
Consistency of the activities and outputs to the project objective and its attainment
It is assessed that the activities and outputs of ASDSP are consistent with the overall goal and the
attainment of its objectives. There is a link between the activities of the programme and the outputs
and subsequently with the overall goal and attainment of the objectives. The activities are specific
and with targets. The implementation plan and approach is consistent with similar projects and
would lead to attainment of the outputs whose target indicators are also specific. For example, one
of the outputs is that at the end of the project period, 500,000 VCAs will have participated in
agribusiness at any of the nodes of the prioritized VCs. By focusing activities clinically to the actors
within the VC node is a sure way of ensuring those activities will lead to a specific output that is lined
to an objective. Being a results oriented programme, the activities are well linked to objectives. The
annual work planning process provides a platform for ensuring activities are aligned to objectives.
Semi and annual reports are other mechanisms for checking whether activities are in line with
objectives.
It is however assessed that although some of the activities were linked well to the outputs, these
outputs were not likely linked to objectives. Process oriented activities including development of the
steering documents, organized internal workshops and other meetings were not logically linked to
programme objectives. It is also assessed that some of the activities were not linked to any of the
outputs in the results framework. It was also noted that some of the activities expected to be
undertaken as planned in the data tool were not accomplished and may have affected achievement
of some of the output indicators.
15
However, looking at the appropriateness of the approaches used in the implementation and the
achievement of the targets of all the activities, it is concluded that the realization of these targets on
the activities and outputs will partially result in the attainment of the programme objective.
Consistency of the activities and outputs to effects (outcomes) and impacts
Whereas the activities and outputs of the programme are consistent with the intended outcomes
and impact, on their own, they cannot contribute to the realization of impacts and effects beyond
the targeted beneficiaries. The impacts and effects at the VCA level at any node are only realized at
the individual level as analyzed in this report and not among all the VC actors in the node. This is one
of the reasons why this impact evaluation was based on beneficiary households and not on the
entire agribusiness population. The impact at the individual VCA level is realizable only when the
recommendations pertaining to that individual node actor have been undertaken. A bigger scale and
longer term period is however required if the programme were to significantly create impacts and
effects at the macro level or even among the agribusiness population.
Although the assessment is that there is consistency of activities and outputs to effects and impacts,
it is noted that some of the activities and outputs were not generated due to the complexity of
partnerships in service delivery. Where some of the services were not available or not appropriate,
impacts were not fully realized and they would require more time for changes to be realized. Most
of these activities were foundation in nature and are expected to generate outputs whose outcomes
will lead to attainment of impacts. This means more time is required for the expected changes.
4.4 Results
According to the programme logical framework, ASDSP had three major result areas and 12
expected outcomes. The assessment of the programme achievements is therefore done according to
each of the outcomes and the corresponding planned outputs
Component one: Sector coordination and harmonization
Under this component the programme set out to develop a transparent system for improved
agricultural sector coordination and harmonization and an enabling policy and institutional
environment for the realization of the ASDS through: improving sector wide coordination and joint
programming ; strengthening sector institutions and capacities ; improving linkages between key
sector stakeholders; developing sector-wide M&E information systems and supporting development
of appropriate sector-wide policies, strategies and regulations
Outcome 1.1 Sector-wide coordination and joint programming improved
The evaluation found that the programme was instrumental in strengthening ASDS institutional
structures and mandates to coordinate the sector to improve sector coordination for efficient
investment in the sector. This was achieved through following outputs:
ASDS coordination institutions established: By the end of the programme, the planned five ASDS
coordination institutions at the national level including MoALF Transformation Initiative (TI)
comprising of the Transformation Secretariat (TS) and the Intergovernmental Secretariat (IGS); and
Intergovernmental Thematic Working Groups (ITWGs) had been established to coordinate the
sector. At the county level the planned three coordination structure including; the CEC-Caucus;
Agricultural Forum; County Consultative Forum (CCF) had been established.

16
Establishing joint sector programming and financing mechanisms: With support from ASDSP, the TI
was expected to develop financing mechanisms for soliciting funds for ASDS coordination and for
coordination of programmes and projects across the sector. At the programme three joint sector
programming and financing mechanism were established. These were the Common Programming
Framework (CPF), the Code of Conduct (COC) and the Annual Workplan and Budget for TI. After the
establishment of these mechanisms there was an increase in the level of funding for ASDS. Table 4.1
shows the funds solicited for both national and county sector coordination initiatives. The main
funding for Sector coordination initiatives at the national level came from SIDA, EU and GIZ.
However, additional ARD partners and the two levels of government provided additional funding for
programmes in counties worth KES 1.3 billion out of a targeted KES 1.7 billion reflecting a 76%
achievement (Table 4.2).
Table 4.1: Funding for Transformation Initiative aligned coordination activities
Funding source FY 2014-15 in KES FY 2015-16 in KES
Target Achieved Target Achieved
County Government 56,131,340 42,328,937 588,178,494 67,082,820
DPs 13,050,000 14,905,000 20,118,410 1,131,500
National government 23,596,834 9,622,596 55,550,166 46,444,635
Other Programmes 9,370,000 8,550,000 14,675,400 10,934,600
Total 102,148,174 85,406,533 678,522,470 125,593,555

17
Table 4.2: Funding for county sector coordination initiatives
Source Total
Target Achieved
Counties 1,432,047,412 1,079,084,980
DPs 102,389,411 45,659,516
National government 148,809,475 139,591,111
Other programmes 29,052,000 26,774,600
Total 1,712,298,298 1,291,110,207
ASDSP coordinating structures established and operationalized: This output aimed to establish
ASDSP steering, coordination and management structures that were functioning in accordance with
sector-wide approach and to develop operational procedures and guidelines reflecting ASDSP’s
sector-wide approach. The evaluation established that all the four structure planned to be
established and operationalized were in place. These were NPS and PSC at national level and 47
CCUs and similar number of CSCs. Sector coordination partnership guidelines among other
guidelines were available at both levels of government
ASDS supported in strengthening DP adherence with Code of Conduct: The aim of this objective
was to enhance mutual accountability in ASDS implementation. The evaluation established that the
Agriculture and Rural Development Partner Group (AfDB, EU, FAO, Finland, GIZ, JICA, UNDP, USAID,
World Bank) were adhering to the CoC. As a result of this, the development budget for the sector
from the group increased from XX in 2013 to XXX in 2017 an increase of Y%.
Outcome 1.2: Sector institutions and capacities strengthened
The main focus of this sub-component was to improve the capacities of ASDSP stakeholders and sector
institutions of relevance to implement the programme.
Capacity of ASDSP coordinating structures strengthened: The aim of this output was to provide
operational support for enhancing capacity of ASDSP structures. The evaluation found that the ASDSP
had 444 staff in post against planned establishment of 485 (91%); about 92 % of the programme
staff had been trained. A total of 93 vehicles were available for use in the programme against the
required 107 budgetary support for the office operations in the 48 implementation stations with
counties receiving over 65% of the total budget. The ETE also noted that customer perception
trends on services offered by ASDSP and its stakeholder fluctuated with time as shown in Figure 1.
Capacity of selected sector institutions of relevance to ASDSP mandate strengthened: The objective
of this output was to support appropriate mechanisms for enhancing capacity of sector institutions of
relevance to ASDSP Including the staff working with ASDS and the institutional capacity plans being
implemented. The evaluation found out the programme enhanced the capacity of sector institutions such
as the Department of Meteorology, the Kenya Agricultural Research Organisation, Breeders Organisations,
among others. This enable the institutions improve service delivery such as PSPs, AI Services among others.
However a satisfaction survey of the stakeholder organisations was not undertaken periodically.

18
0 20 40 60 80 100 120 140
Research institutions
Agric insurance
Agric programmes
Agri based regulators
Apex organisations
Extension
Financial
Policy & Research
FY2015/16
FY2014/15
FY2013/14
FY2012/13
Figure 2: Trends in % Customer satisfaction with services offered by ASDSP and its stakeholders
The other indicator of the achievement of this objective is the posts filled by qualified staff. Table 4.3
shows the trend of the number and category of staff in the institutions of relevance to ASDSP that were
filled.
The third indicator to show whether this objective was achieved is the number of institutional capacity
development plans being implemented. Table 4.4 below shows an average achievement of 91% of capacity
development plans implemented.
Table 4.3: Number and Category of staff in institutions of relevance to ASDSP
2012/2013 2013/2014 2014/2015 2015/2016
Target Achieved Target Achieved Target Achieved Target Achieved
Administration staff
205 201 347 235 608 604 2,333 2,003
Coordinators 201 172 417 345 503 410 779 579
Support Staff 160 163 339 231 519 436 2,287 1,905
Technical Staff 659 502 1,435 1,264 2,334 1,698 5,646 5,904
Others 4 5 8 8 14 15 19 18

19
Table 4.4: No of capacity development plans implemented
2012/2013 2013/2014 2014/2015 2015/2016
Target Achieved Target Achieved Target Achieved Target Achieved
Agricultural programs 25 23 49 45 86 81 115 110
Apex organizations 12 14 28 24 102 92 125 72
Extension services 44 43 94 73 432 431 474 436
Total 81 80 171 142 620 604 714 618
Outcome 1.3: Improving Linkages between key sector stakeholders
The purpose of this sub-component was to strengthen and create platforms for coordination among
programmes and a broad range of value chain (VC) actors at sector level leading to improvement in
agricultural production and food security through supporting of Issued-based partnerships,
development of appropriate technologies and establishment of Collaboration between key sector
agencies and programmes.
Issued-based partnerships supported: This output seeks to establish functional issue based
partnerships with the aim to improve access to agricultural services and infrastructure by value chain
actors. At the time of evaluation 570 against the 475 targeted partnerships were operational.
Another key achievement noted was the formation of National Agricultural Sector Partners’ Forum
(NASPF) to facilitate implementation of collaboration between partners through sector agencies and
programmes alongside integration of operations including joint studies, planning and M&E.
Over and above the establishment of the partnerships there was an increase of VCAS accessing
public and or private agricultural services and infrastructure compared to the baseline (Table 4.5)
Table 4.5: Proportion (%) of VCAs mainly accessing agriculture-related services by gender
Types of institution 2016 (%) Baseline 2013(%)
Male Female Youth Overall Male Female Youth Overall
Public 79.7 76.7 79.4 78.6 54.6 54.5 54.8 54.9
Private 70.4 78.5 77.7 75.5 45.4 45.5 45.2 45.1
Appropriate Technologies Developed: This output seeks to develop appropriate technologies to
increase adoption of technological packages by value chain actors. By the end of the programme
about 73% of the 769 promoted technological packages were adopted. Table 4.6 summarises the
type of technologies adopted by gender.

20
Table 4.6: Proportion (%) of VCAs adopting technologies by gender
Technologies
2014 (%) 2015 (%) 2016 (%)
M F Y M F Y M F Y
Artificial Insemination 31.1 21.9 19.4 31.8 24.0 20.4 33.4 25.5 22.4
Improved seeds 46.9 46.5 43.9 49.0 48.5 48.3 50.8 48.9 48.5
Improved fish seeds 4.3 2.9 2.4 3.6 1.8 1.7 3.7 1.7 1.9
Fertilizer 50.5 49.5 43.9 54.0 52.3 47.2 54.0 52.3 48.0
Conservation agriculture 39.9 35.7 31.7 42.2 38.8 34.8 43.5 39.4 38.3
Stall feeding 25.3 22.6 14.4 27.2 24.1 17.0 28.7 25.5 16.9
Grazing management plans 22.0 16.7 17.4 23.1 17.5 19.8 24.1 17.9 18.9
Chaff cutter 14.3 9.5 8.5 16.5 10.4 9.4 17.0 11.4 10.2
Improved bee hives 2.7 1.7 2.8 2.9 1.6 2.8 2.9 1.9 3.1
Improved fish production/ fishing 2.2 1.0 1.1 2.2 1.0 2.6 2.5 1.1 2.8
Mechanized agriculture 15.4 11.3 13.0 17.0 13.9 13.9 18.4 14.6 15.7
Animal-based plough 20.7 22.0 24.1 23.1 23.2 23.7 24.1 24.4 24.6
Electronic marketing 4.7 3.0 5.1 5.1 3.0 6.6 5.5 4.0 8.6
Electronic extension 4.5 3.6 5.8 5.8 4.6 7.9 7.3 6.0 9.4
Others 0.6 0.2 0.8 1.4 0.1 0.4 1.2 0.6 0.6
Key: M – male; F – female; Y – youth
Technologies related to fertilizer were the most used with an increasing trend across the years
regardless of gender. These were followed by use of improved seeds, conservation agriculture and
Artificial Insemination. Improved fish production and fishing method technologies were among the
least used averaging 2.0%. Electronic extension, electronic marketing, improved bee hives and fish
feed technologies use ranged between 1-5% across the years. Stall-feeding, grazing management
plans, chaff cutter, mechanized agriculture and animal-based ploughs were used by 8.5 – 28.7 % of
ASDP VCAs between 2014 and 2016.
ASDSP VCAs were generally aware of new technologies. The level of awareness being 40.1%, 37.1%
and 22.7% for men, women and youth among ASDSP VCAs respectively. On the other hand, 30.4%,
33.9% and 30.9% of ASDSP value chain men, women and youth had joined new value chains
respectively.
Collaboration between key sector agencies and programmes established and strengthened: This
output sought to improve the Collaboration between key sector agencies and programmes through
integration of operations, development of partnership, and development of functioning TWG. Table
4.7 outlines the trend of sector programmes integrating operations and TWGs established within the
programme period. The evaluation established that integration of operations increased by an
average of 80% during the period. The number of TWGs established and functioning during period
amounted to 87% of the target.

21
Table 4.7: No. of sector programmes integrating operations
Category 2012/2013 2013/2014 2014/2015 2015/2016
Target Ach Target Ach Target Ach Target Ach
Feasibility Studies/Impact 9 6 29 21 50 36 55 42
Joint M&E 17 13 58 46 92 78 105 88
Joint Planning 27 20 68 57 90 89 112 100
Joint Reporting 17 14 44 29 74 54 89 73
TOTAL 70 53 199 153 306 257 361 303
Table 4.8: No of TWGs established
Category 2012/2013 2013/2014 2014/2015 2015/2016
Target Ach Target Ach Target Ach Target Ach
Agribusiness 18 9 35 29 20 27 24 29
M&E 20 12 39 35 23 27 21 25
NRM 20 12 41 34 24 26 21 20
Policy 19 7 29 21 21 19 24 20
R&E 22 11 39 33 23 24 25 25
Total 99 51 183 152 111 123 115 119
Sub Outcome 1.4: Sector-wide M&E and information management systems developed and supported
The objective of this subcomponent was to have functional sector and programme M&E systems and
functional communication mechanisms in place to provide sector and programme information
Establishment of sector-wide M&E and information systems: Five milestones had been planned
towards the completion of establishment of Functional sector-wide M&E and information system.
However the ETE found that only the consultation and development of draft M&E framework had
been accomplished. This was considered a significant achievement noting that the there was no
sector framework before the introduction of ASDSP as noted in the policy baseline report, 2014
ASDSP M&E system: The ETE found that the M&E and information system development milestones
had been achieved as planned and a functional framework was in place as evidenced by the
following:
i. M&E framework outlining the M&E procedures, functions and activities;
ii. M&E unit composed of a national M&E specialist and an Officer in each of the 47 counties
assigned to carry out the M&E mandate. The Unit members had gone intensive course on
M&E certification programme in addition to other trainings;
iii. Reports on comprehensive baseline surveys conducted at the programme inception;
iv. M&E plans for each of the 47 counties;
v. Computerized work plan and budgeting tool, data tool for data collection and reporting tool;
and
vi. Periodic analyzed progress reports, monitoring reports.
Analysis of the annual budget by the ETE noted that about 5% of the budget was reserved for M&E
activities. For strengthening the M&E system, ASDSP had an elaborate Management Information
System (MIS) based on the results- based management strategy of project monitoring and
evaluation (planning, budgeting, monitoring, reporting and evaluation). The MIS was web-based and

22
therefore allowed the tracking of these indicators in real time and online. The end of term
evaluation found this system very valuable in the provision of the needed data from the many
reports that were county specific. Discussion with VCAS and other stakeholder revealed an
significant level of satisfaction with the programme M&E services.
Selected sector information management systems strengthened: This output aims at putting in
place functional communication mechanisms including interactive ICT platforms to provide
programme information. This evaluation found that the programme had facilitated development of
various information systems for enhancing stakeholder’s access to the programme information as
outlined below;
National Farmers Information Service (NAFIS); a comprehensive web-based information
service providing agricultural information on value chains, service providers, is also an
interactive ICT platform. In 2016 the system recorded about 400,000 hits.
Other systems in use included the programme website, web-based MIS for M&E, and VCP
WhatsApp and Facebook groups which were found to be popular among value chain group
across the counties.
The Programme also supported development of e-extension by the MoALF for rolling out to
the counties under devolved E-extension services.
Sub Outcome 1.5: Agricultural Sector policies, laws and strategies
This sub-component aims to support the establishment of an enabling policy environment for
environmentally sustainable and socially inclusive value chain development. The evaluation found
out that out of a target of 2,058, 532 (20%) policies, strategies and regulations had been prepared
and rolled. Out of the total prepared and rolled those within productivity and commercialization
(146) was the highest (27%), while Private Sector Investment (57) was the least at 11% (Table 4.9).
Table 4.9: Policies, strategies and regulations prepared and rolled out
Types Policies Strategies Regulations Total
Target Ach Target Ach Target Ach Target Ach
Effective coordination and implementation 82 21 88 18 74 19 244 58
Extension services and research 125 32 113 29 94 26 332 87
Market access and trade 113 28 118 33 105 31 336 92
Private Sector Investment 85 20 85 20 65 17 235 57
Productivity and Commercialization 235 53 181 50 141 43 557 146
Sustainable land and NRM 151 33 124 35 79 24 354 92
TOTAL 791 187 709 185 558 160 2,058 532
Component 2: Environmental Resilience and Social Inclusion of Value Chains
This component was designed to ensure that the priority value chains that would be supported in
the context of Component 3 are environmentally sound and resilient to climate fluctuations, and
that women, youth and economically and socially vulnerable groups had access to productive assets
to enable them participate effectively in and benefit from the improved value chains
ASDSP I’s efforts to enhance environmental resilience for value chain actors and social inclusion in
value chains has been reasonably effective in achieving outputs. This includes ensuring appropriate
representation of women, youth and representatives of marginalized groups in the VCDs, and the

23
effort to mainstream the Participatory Scenario Planning approach. However, overall the
programme was not effective in integrating these concerns and issues into its VCD efforts. The
separation of Component 2 and 3 organizationally and with respect to result measurement
hampered the Programme’s ability to achieve a reasonable level of integration. This could be
realized through identification of their interests and the unique constraints they face when engaging
in agricultural value chains and through promotion of commercially viable value chain solutions that
benefit women and youth
Outcome 2.1: Strengthening Environmental resilience for value chain actors
This Sub-component was intended to support interventions aimed at ensuring that efforts to
strengthen priority value chains are environmentally sound and resilient to climate fluctuations. The
programme achieved this through enhancement of: awareness and knowledge on the importance of
environmental sustainability, NRM and the causes and effects of climate change; capacity for
equitable engagement in local planning for natural resource management and climate change; and
improved access to and use of appropriate NRM and climate change technologies and services,
particularly for women and youth.
Awareness on natural resource management and climate change risks: To achieve this output, it
was planned that each of the 47 counties would identify and involve public and private service
providers in training value chain actors. The evaluation found out that cumulatively, 6,507 service
providers (58% of whom were public) were involved in training VC actors on NRM and CC related
risks against a target of 7,417 which resulted to achievement of 88% of service providers involved in
training (Table 4.10)
Table 4.10: Service providers involved in training VC actors on NRM and CC related risks
2012/2013 2013/2014 2014/2015 2015/2016 Grand Total
Target Achieved Target Achieved Target Achieved Target Achieved Target Achieved
Public 303 228 769 730 1,501 1,400 1,581 1,419 4,154 3,777
Private 205 166 622 558 1,148 996 1,288 1,010 3,263 2,730
Total 508 394 1391 1288 2,649 2,396 2,869 2,429 7,417 6,507
The evaluation found out that 85% of the targeted 511,317 VCAs (56% adult females and youth)
were trained on NRM and CC related risks since the inception of the programme (Table 4.11).
Table 4.11: No. of VC actors trained on NRM and CC – related risks by gender
VC actors
2012/2013 2013/2014 2014/2015 2015/2016 Grand Total
(baseline)
Target Achieved Target Achieved Target Achieved Target Achieved/
half year Target Achieved
Male 2,709 1,332 17,141 17,579 70,957 67,379 149,459 105,595 240,266 191,885
Female 2,416 1,476 15,037 15,717 78,434 73,441 114,382 93,556 210,269 184,190
Youth 1,325 615 6,655 6,751 20,488 17,511 32,314 32,664 60,782 57,541
Total 6,450 3,423 38,833 40,047 169,879 158,331 296,155 231,815 511,317 433,616
The evaluation found out that 212,451 VCA out of a target of 233,523 (achievement of 91%) were
trained as early warning agents (Table 4.12).
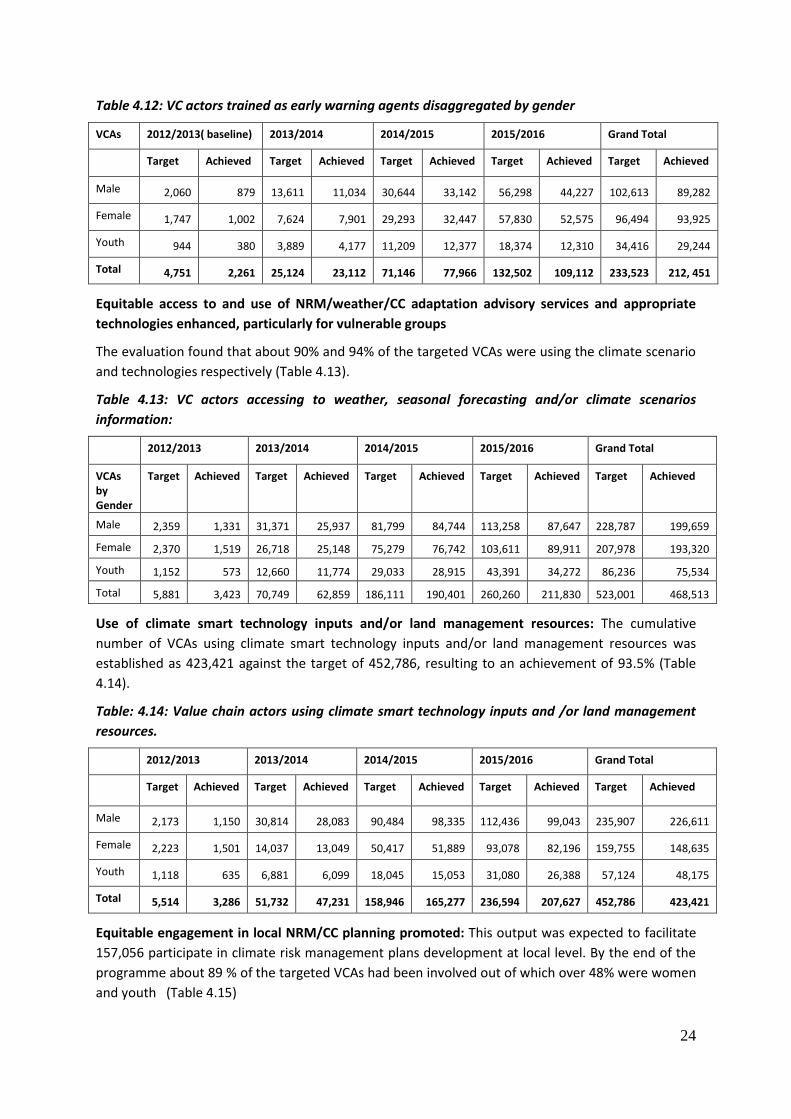
24
Table 4.12: VC actors trained as early warning agents disaggregated by gender
VCAs 2012/2013( baseline) 2013/2014 2014/2015 2015/2016 Grand Total
Target Achieved Target Achieved Target Achieved Target Achieved Target Achieved
Male 2,060 879 13,611 11,034 30,644 33,142 56,298 44,227 102,613 89,282
Female 1,747 1,002 7,624 7,901 29,293 32,447 57,830 52,575 96,494 93,925
Youth 944 380 3,889 4,177 11,209 12,377 18,374 12,310 34,416 29,244
Total 4,751 2,261 25,124 23,112 71,146 77,966 132,502 109,112 233,523 212, 451
Equitable access to and use of NRM/weather/CC adaptation advisory services and appropriate
technologies enhanced, particularly for vulnerable groups
The evaluation found that about 90% and 94% of the targeted VCAs were using the climate scenario
and technologies respectively (Table 4.13).
Table 4.13: VC actors accessing to weather, seasonal forecasting and/or climate scenarios
information:
2012/2013 2013/2014 2014/2015 2015/2016 Grand Total
VCAs by Gender
Target Achieved Target Achieved Target Achieved Target Achieved Target Achieved
Male 2,359 1,331 31,371 25,937 81,799 84,744 113,258 87,647 228,787 199,659
Female 2,370 1,519 26,718 25,148 75,279 76,742 103,611 89,911 207,978 193,320
Youth 1,152 573 12,660 11,774 29,033 28,915 43,391 34,272 86,236 75,534
Total 5,881 3,423 70,749 62,859 186,111 190,401 260,260 211,830 523,001 468,513
Use of climate smart technology inputs and/or land management resources: The cumulative
number of VCAs using climate smart technology inputs and/or land management resources was
established as 423,421 against the target of 452,786, resulting to an achievement of 93.5% (Table
4.14).
Table: 4.14: Value chain actors using climate smart technology inputs and /or land management
resources.
2012/2013 2013/2014 2014/2015 2015/2016 Grand Total
Target Achieved Target Achieved Target Achieved Target Achieved Target Achieved
Male 2,173 1,150 30,814 28,083 90,484 98,335 112,436 99,043 235,907 226,611
Female 2,223 1,501 14,037 13,049 50,417 51,889 93,078 82,196 159,755 148,635
Youth 1,118 635 6,881 6,099 18,045 15,053 31,080 26,388 57,124 48,175
Total 5,514 3,286 51,732 47,231 158,946 165,277 236,594 207,627 452,786 423,421
Equitable engagement in local NRM/CC planning promoted: This output was expected to facilitate
157,056 participate in climate risk management plans development at local level. By the end of the
programme about 89 % of the targeted VCAs had been involved out of which over 48% were women
and youth (Table 4.15)

25
Table 4.15: VCAs involved in climate risk management plans development at local level
2012/2013 2013/2014 2014/2015 2015/2016 Grand Total
VCAs involved
Target Achieved Target Achieved Target Achieved Target Achieved Target Achieved
Male 1,261 454 7,817 7,213 35,974 35,062 34,777 28,036 79,829 70,765
Female 1,019 561 5,089 4,838 21,613 21,291 21,623 21,961 49,344 48,651
Youth 717 303 3,849 3,343 9,311 6,156 14,006 11,004 27,883 20,806
Total 2,997 1318 16,755 15,394 66,898 62,509 70,406 61,001 157,056 140,222
Outcome 2.2: Conditions that enable vulnerable groups to engage in VCD strengthend
The sub-component aims at supporting the provision of basic socio – economic services to enable
the resource poor and other vulnerable producers to become economic agents in value chain
development. The objectives of the sub component are to improve access to social protection and
security services by the vulnerable groups and enhance community action capability
Access to Social Protection and Security Services by the Vulnerable Groups Improved: This output
seeks to increase use of social protection services by the women and youth groups for increased
engagement in value chain development. The evaluation established that about 80% of the targeted
actors have used social protection services since programme inception (Table 4.16). The most
prevalent social protection service received was subsidized input (60%) followed by relief food (21%)
and hunger safety net (14%) as shown in Table 4.17.
Table 4.16: Women and youth actors using social protection services
2012/2013 2013/2014 2014/2015 2015/2016 Grand Total
VCAs Target Achieved Target Achieved Target Achieved Target Achieved Target Achieved
Females 1360 920 11,093 9,319 24,230 18,998 28,579 23,174 65,262 52,411
Youth 675 403 7,751 5,855 11,883 9,081 14,376 11,283 34,685 26,622
Total 2035 1323 18844 15174 36113 28079 42955 34457 99947 79,033
Table 4.17: Types of social protection services accessed by the VCAs by gender
Social protection services Male% Female % Youth %
Subsidized inputs 62.2 60.9 59.3
Tax relief 5.5 5.1 4.3
Food for assets 3.9 5.1 5.9
Hunger Safety Net 17.9 13.1 10.9
Old age cash transfer 13.9 6.5 6.7
Grants 5 7.6 8.5
Relief food 28.9 25.4 38.7
The evaluation found out that public institutions and civil societies were the major social protection
services (Figure 3).

26
0
100
200
300
400
500
600Ta
rget
Ach
ieve
d
Targ
et
Ach
ieve
d
Targ
et
Ach
ieve
d
Targ
et
Ach
ieve
d
2012/2013 2013/2014 2014/2015 2015/2016
Civil Societies
Others
Private Institutions
Public Institutions
SP and SS providers
Figure 3: Social protection and security services providers
Component 3: Value Chain Development
Promotion of viable and equitable commercialization of the agricultural sector through value
chain development: This component was the main thrust of the programme with the other two
components designed to support its development The component was expected to play a key role in
improving on and off farm production and productivity for increased and equitable incomes,
employment and food security through the following five inter-related sub components/outcomes;
1. Developing inclusive value chain organization;
2. Increasing public and private investment in value chain development;
3. Increasing equitable access to market;
4. Increasing access to affordable financial and insurance services for VCAs; and
5. Up scaled and out scaling innovative and inclusive VCs and Value Chain technologies.
Outcome 3.1: Inclusive value chain organizations developed
The overall aim of this subcomponent was to increase actors’ participation in value chains by
supporting the development of self-sustained, stakeholder driven value chain organizations such as
farmer organizations, trader organizations, value chain platforms etc. and any other organizations
that have been formed along the value chains.
Inclusive linkages along the VCs improved: The aim of this output was to provide strong
organisations for sustaining and increasing actor’s participation in VCs. The evaluation found out
that of the targeted 17,623, the programme managed to achieve 16,978 VCOs which is 96%. Out of
the organisations formed, agro producers were the majority at 66% followed by agro retailers with
13% (Table 4.18).
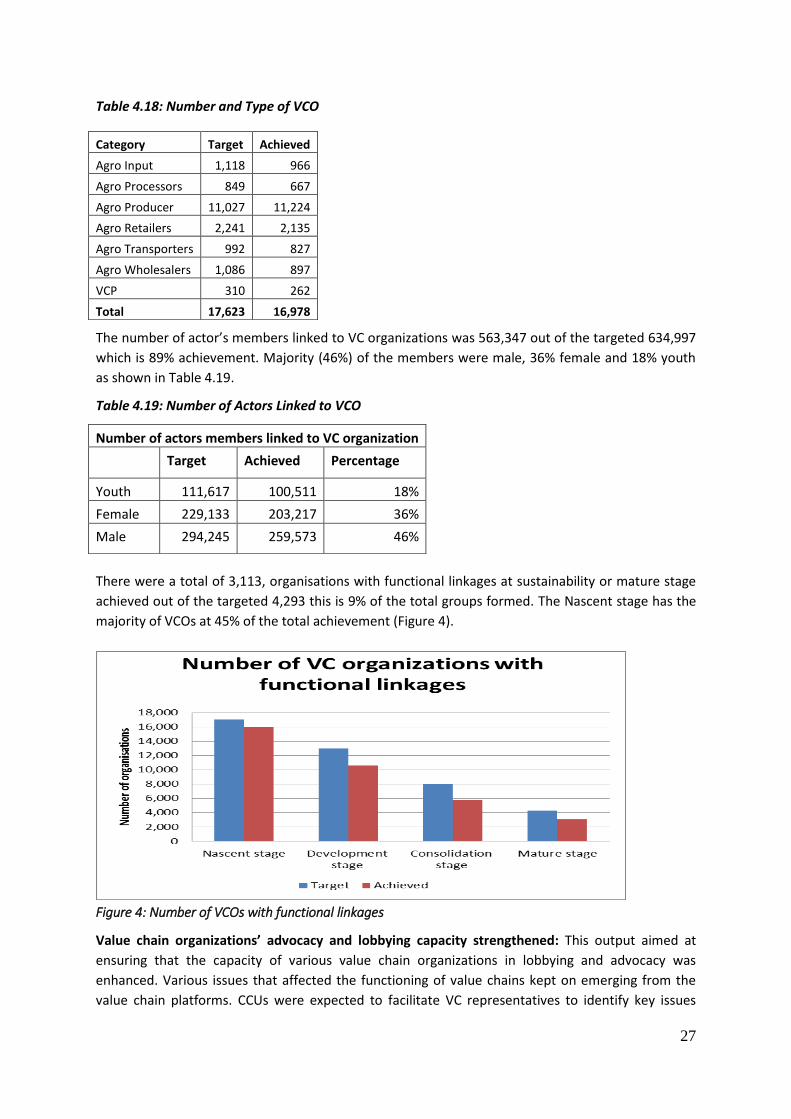
27
Table 4.18: Number and Type of VCO
The number of actor’s members linked to VC organizations was 563,347 out of the targeted 634,997
which is 89% achievement. Majority (46%) of the members were male, 36% female and 18% youth
as shown in Table 4.19.
Table 4.19: Number of Actors Linked to VCO
There were a total of 3,113, organisations with functional linkages at sustainability or mature stage
achieved out of the targeted 4,293 this is 9% of the total groups formed. The Nascent stage has the
majority of VCOs at 45% of the total achievement (Figure 4).
Figure 4: Number of VCOs with functional linkages
Value chain organizations’ advocacy and lobbying capacity strengthened: This output aimed at
ensuring that the capacity of various value chain organizations in lobbying and advocacy was
enhanced. Various issues that affected the functioning of value chains kept on emerging from the
value chain platforms. CCUs were expected to facilitate VC representatives to identify key issues
Category Target Achieved
Agro Input 1,118 966
Agro Processors 849 667
Agro Producer 11,027 11,224
Agro Retailers 2,241 2,135
Agro Transporters 992 827
Agro Wholesalers 1,086 897
VCP 310 262
Total 17,623 16,978
Number of actors members linked to VC organization
Target Achieved Percentage
Youth 111,617 100,511 18%
Female 229,133 203,217 36%
Male 294,245 259,573 46%

28
along the agro input supply, production, transportation, processing and marketing functions of the
value chain for inclusion in county plans, budgets, policies and regulations. During the programme
period, a total of 3,230 issues from the VC platforms were addressed in form of policies, regulations,
plans and budgets issues out of a target of 4,265.
VC actors’ business management skills enhanced: The objective here was to improve the business
capabilities of value chain organizations and their members. Towards the end of the programme, the
number of groups implementing viable business plans was 14,343 out of 19,650 which transform to
(73%) targeted. The numbers of VC actors implementing viable business plans were at 76%
achievement distributed as in Table 4.20 where men were the majority with 55% of the business
plans and youth the list with 21%.
Table 4.20: Number of VCAs Implementing Business Plans
Target Achieved Percentage
Male 109,133 81,012 45%
Female 77,782 59,400 33%
Youth 46,522 37,801 21%
Groups 19,650 14,343 73%
The survey results shows that implementation of business plans was highest for the production
node, where men implementwd 74.6%; women, 75.1% and youth 61.0%. Table 4.21 shows the
different nodes where business plans were utilised.
Table 4.21: Implementation of business plans by VC Node
Implemented Business plans
ASDSP VCAs, %
Men Women Youth
Production 74.6 75.1 61.0
Processing 3.6 3.6 4.4
Input services 3.6 2.3 3.4
Trade/ marketing 11.0 13.8 13.0
Other 7.2 5.2 8.4
Outcome 3.2: Public and private investment in VC development increased
The programme aimed at increasing investments in VCs by the actors through development of public
private partnerships and enhancing VC actors’ investment capacity.
PPPs developed: A total of 993 infrastructure projects were undertaken under PPP arrangement
which was an achievement of 43% (Table 4.22). Most of these projects where on production (31%)
followed closely by marketing (28%) while processing had the least projects established (19%).
Table 4.22: Number and type of infrastructure projects established under PPP
Type Target Achieved Percent
Marketing 521 274 28%
Processing 369 184 19%
Production 677 309 31%
Transportation 752 226 23%
Total 2,319 993 43%

29
VC actors’ investment increased: A total of 3,617 investment projects by VC actors were
implemented out of a target of 5,726. This translates to 63% achievement. Producers had the
highest achievement at 25% of projects implemented followed by retailers (22%) and the least was
VCP with a paltry 7% as indicated in Table 4.23.
Table 4.23: No and type of coverage of projects by VCAs
Target Achieved Percentage
Agro Input 722 475 13%
Agro Processors 567 469 13%
Agro Producers 2095 897 25%
Agro Retailers 1028 812 22%
Agro Transporters 502 347 10%
Agro Wholesalers 510 376 10%
VCP 302 241 7%
Total 5,726 3,617 63%
Outcome 3.3: Equitable access to market increased
Increased market access was realised through support to “soft “market access interventions. The
areas of focus were to provide value chain actors with linkages to market information and, improve
technical capacity of value chains actors on pre and post production management (food standards,
reduction of post-harvest losses etc.)
Access to market information improved: During the period under review a total of 531,350 (88%)
VC actors (30% and 16% women and youth respectively) were using market information out of a
target of 605,487 (Table 4.24).
Table 4.24: No of VC actors using market information
Indicator Target Achieved
Male 281,423 267,210
Female 208,868 170,719
Youth 115,196 93,421
Groups 45,417 35,325
A total of 35,325 VC actors (77%) were participating in formal market arrangement out of 45,417
targeted. In the same period, another 365,936 value chain actors (90%) out of the targeted 406,763
were undertaking value added initiatives (Table 4.25)
Table 4.25: No. of VC actors undertaking value added initiatives
Indicator Target Achieved
Male 181,826 173,483
Female 142,513 123,297
Youth 82,424 69,156
Technical capacity for pre and post production management improved: The objective of this
output was to improve VCAs inclusive participation in formal market arrangement. The evaluation

30
found out that out of the targeted 497,073 VCAs 449,344 (90%) of VC actors (51% women and
youth) were using improved pre and post production management practices (Table 4.26).
Table 4.26: No. of VCA using improved pre and post production management practices
Indicator Target Achieved
Male 228,904 219,518
Female 172,316 149,740
Youth 95,853 80,086
Outcome 3.4: Access to affordable financial and insurance services for value chain actors improved
ASDSP was expected to facilitate access to financial services by value chain actors. This was to be
achieved by deepening VC actors (especially women and youth) access to financial and insurance
services by collaborating with innovative service providers.
Improving access to financial services: The objective is to improve the range and accessibility of
financial services and products for VC actors with a view of improving utilization of financial services
products. During the reporting period the numbers of VC actors (category from MIS) using financial
services were 394,488(84%) with women at 32% women and youth at 17%; out of the targeted
467,510. During the reporting period, the numbers of financial service providers rendering services
to VC actors were 2,974 (84%) out of the targeted 3,543 (Table 4.27).
Group table banking was the most widely used financial service in 2014. Credit from AFC was the
most affordable financial service to ASDSP VCAs compared to the rest of the service providers in
2016. Asset, livestock and crop insurance were the least used services (Table 4.27). Credit from
formal banks was the most used financial service by men in 2016 at 17.1%. Table banking was the
most used service by females, 61.6% in the same period. Group banking was mostly used by the
youth, 39% in 2016 (Table 4.28).
Table 4.27: No of VC actors using financial services
Grand Total
Indicator Target Achieved
Male 218,199 201,460
Female 163,906 127,935
Youth 85,405 65,093
Table 4.28: Source, use and affordability of financial services
Financial service 2014 2016
Use (%) Affordable (%) Use (%) Affordable (%)
Credit from AFC 2.5 26.7 2.5 16.4
Credit from SACCOs 7.5 33.3 - -
Credit from formal banks 13.9 13.5 15.6 9.5
Group Table banking 15.9 9.7 16.1 6.1
Improving access to insurance services: The objective was to support activities that lead to up
scaling of existing agro insurance product. During the reporting period the numbers of VC actors
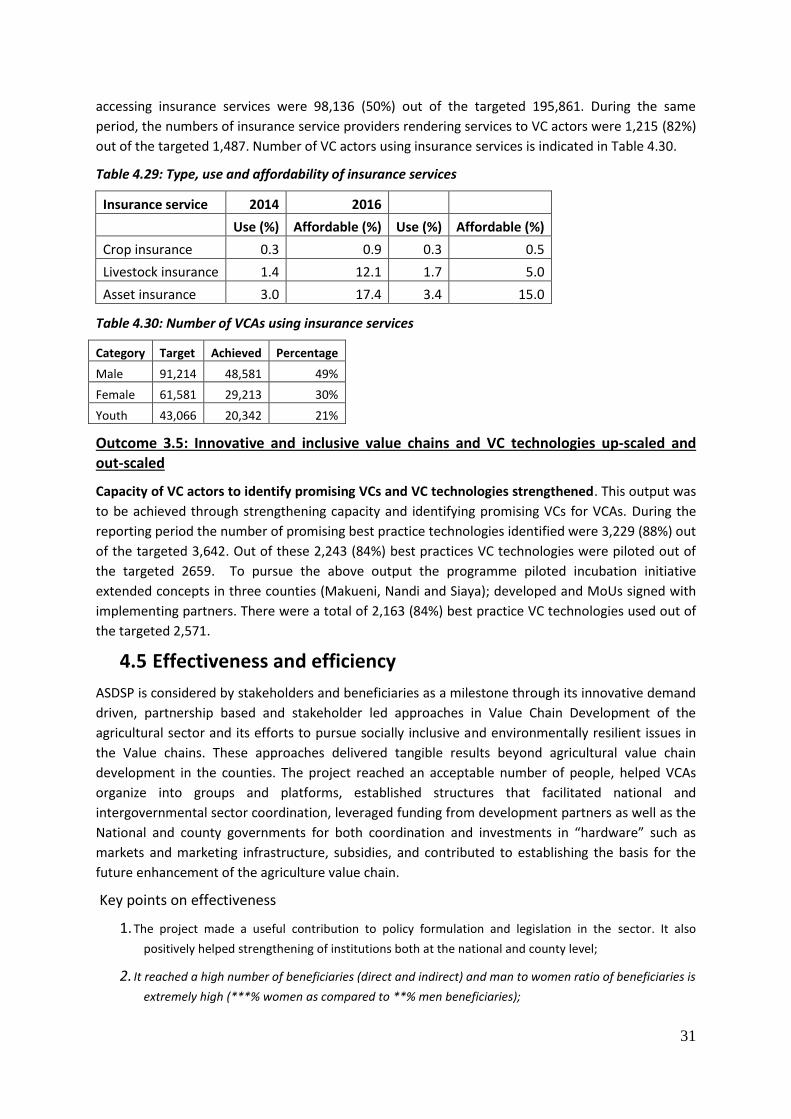
31
accessing insurance services were 98,136 (50%) out of the targeted 195,861. During the same
period, the numbers of insurance service providers rendering services to VC actors were 1,215 (82%)
out of the targeted 1,487. Number of VC actors using insurance services is indicated in Table 4.30.
Table 4.29: Type, use and affordability of insurance services
Insurance service 2014 2016
Use (%) Affordable (%) Use (%) Affordable (%)
Crop insurance 0.3 0.9 0.3 0.5
Livestock insurance 1.4 12.1 1.7 5.0
Asset insurance 3.0 17.4 3.4 15.0
Table 4.30: Number of VCAs using insurance services
Category Target Achieved Percentage
Male 91,214 48,581 49%
Female 61,581 29,213 30%
Youth 43,066 20,342 21%
Outcome 3.5: Innovative and inclusive value chains and VC technologies up-scaled and out-scaled
Capacity of VC actors to identify promising VCs and VC technologies strengthened. This output was
to be achieved through strengthening capacity and identifying promising VCs for VCAs. During the
reporting period the number of promising best practice technologies identified were 3,229 (88%) out
of the targeted 3,642. Out of these 2,243 (84%) best practices VC technologies were piloted out of
the targeted 2659. To pursue the above output the programme piloted incubation initiative
extended concepts in three counties (Makueni, Nandi and Siaya); developed and MoUs signed with
implementing partners. There were a total of 2,163 (84%) best practice VC technologies used out of
the targeted 2,571.
4.5 Effectiveness and efficiency
ASDSP is considered by stakeholders and beneficiaries as a milestone through its innovative demand
driven, partnership based and stakeholder led approaches in Value Chain Development of the
agricultural sector and its efforts to pursue socially inclusive and environmentally resilient issues in
the Value chains. These approaches delivered tangible results beyond agricultural value chain
development in the counties. The project reached an acceptable number of people, helped VCAs
organize into groups and platforms, established structures that facilitated national and
intergovernmental sector coordination, leveraged funding from development partners as well as the
National and county governments for both coordination and investments in “hardware” such as
markets and marketing infrastructure, subsidies, and contributed to establishing the basis for the
future enhancement of the agriculture value chain.
Key points on effectiveness
1. The project made a useful contribution to policy formulation and legislation in the sector. It also
positively helped strengthening of institutions both at the national and county level;
2. It reached a high number of beneficiaries (direct and indirect) and man to women ratio of beneficiaries is
extremely high (***% women as compared to **% men beneficiaries);

32
3. Effectiveness was promoted by contributions from key stakeholders both at the national and county
levels as well as development partners;
4. Through the VCD approach, the programme aimed at promoting a viable and equitable
commercialisation of the agricultural sector. Data from both primary and secondary sources confirm
that while there is evidence of some successes the level of commercialisation is still very low.
5. Access by VCAs to services however both from public and private providers was high and satisfactory.
The programme facilitated access to technologies and this led to increase in engagement of new VCs
by VCAs and use of new technologies
6. The programmes effort to enhance environmental resilience for value chain actors and social inclusion
in value chains has been reasonably effective in achieving outputs. There has been acceptable
representation of women, youth and representatives of marginalized groups in the VCDs, and the
effort to mainstream the Participatory Scenario Planning approach.
7. The Monitoring and Evaluation System enhanced feedback mechanisms that were useful in making
changes as need arose to ensure the programme remains on target
8. The focus on 3 value chains contributed allowed concentration of efforts by stakeholders
9. The inception period allowed stakeholders to familiarize, understand the programme design and
develop steering structures that were important in the delivery of results
10. The programme took advantage of available capacity from previous Swedish supported programmes
in the form of human resource and capacity and equipment.
11. The Technical Assistance procurement at the beginning of the programme provided the needed
technical capacity for implementation of the programme seamlessly while at the same time impacting
skill to implementers
12. ASDSP’s demand-driven, stakeholder-led and partnership-based intervention strategies proved to be
very effective and key to the Programme’s success in engaging VCAs in value chains and creating
stakeholder ownership of value chain interventions. Specifically, they resulted in an increasing degree
of co-financing of value chain interventions by stakeholders thus leveraging resources.
13. Flexibility in the implementation including revision of annual workplans and budgets
4.6 Impact
This section presents the findings of impact generated by ASDSP at the major outcomes and project
objective levels.
Results from both secondary and primary data indicate that the level of commercialisation of the
agriculture sector in the largely smallholder farming community is low. Associated with this is the
low productivity of most agricultural enterprises which contributes to a low level of competitiveness.
In addition the challenge of climate change and increasing frequency of the associated
consequences of droughts, floods, diseases among others provided major challenges to the VCs.
In spite of these, the programme has been able to achieve some success in some areas of its
interventions. For example in the area of productivity of key food crops, there were increases for
bananas, Irish potato, maize, groundnuts, water melon, cow milk, fish, indigenous chicken and eggs
value chains through the programme implementation period as compared to the baseline data.
Further there was increased use of technologies and improved access to financial services across all

33
gender groups. Moreover there was increase in VCAs applying climate change related risk and
Natural Resource Management training in agricultural enterprises as compared to baseline data. The
study findings also show that access to productive assets was high for all gender groups thereby
facilitating participation in promoted value chains.
The findings of the study show that the sector received increasing levels of funding from members,
County Governments, National Government, development partners and NGOs through strategic
partnerships facilitated by ASDSP for marketing facilities such as milk coolers, slaughter houses and
processing facilities. Actors in the marketing node also showed an increased trend of use of these
plans over the study period. Due to interventions by the program, there was better engagement of
program beneficiaries in formal marketing arrangements.
These developments indicate that the basic foundation for contribution to increased productivity,
commercialisation, increased incomes, and increased food security are just becoming apparent.
Considering the short duration of implementation, impacts were not fully realised. However it is
assessed that a strong foundation and momentum for generation of impacts has been established.
Impact at major outcomes level
The Programme three major outcome areas: development of a transparent system for improved
Agricultural Sector coordination and harmonization and an enabling policy and institutional
environment for the realization of ASDS; strengthening of environmental resilience and social
inclusion of VCs and promotion of viable and equitable commercialization of the Agricultural Sector
through VCD display varied levels of performance.
Outcome 1: A transparent system for realizing agricultural sector coordination and harmonization and an enabling institutional environment for the realization of ASDS developed
i) Indicator: Public spending on agriculture as a percentage of GDP from the Agricultural Sector.
The allocation for the Sector from the national budget showed a decline from 6% in 2014-2015 to 2%
in 2015-2016 and declined further to 1.33% in the 2016-2017 Financial Year. These reductions were
national level allocations arising from devolution of agricultural functions to the counties. It is
estimated that currently county budget allocation to the Sector ranges between 3-14%3 of county
budgets. Total allocations to the Sector including county budgets and contributions from
Development Partners which are not factored in the national budget were significant and
consequently allocations to the Sector should reflect all sources. This notwithstanding, the objective
of attaining the 10% allocation of funding from the national budget to the Agriculture Sector was not
attained.
The Programme was able to secure funding towards sector coordination from various stakeholders
including the national government, county governments and development partners. Over the study
period total target contribution amounted to KES 102,148,174 in 2014/2015 while contributions
amounted to KES 85,406.553 (83.6% of target). In the FY 2015/2016 the target was KES 678,522,470
and amount realised was KES 125,593,555 (18.5% of target). All funding sources showed increase in
absolute term in contributions over the years to TI aligned activities with the exception of
Development Partners whose contribution declined by KES 13,773,500 (92%). 3 Commission for Revenue Allocation report 2013/2014

34
These contributions facilitated joint sector programming and financing and operations of the
Transformation Initiative. Through this mechanism ASDSP together with partners was able to
coordinate and facilitate capacity building, policy formulation and preparation of the sector-wide
M&E and institutional reform framework. In addition, links between the national and county
governments were improved and four Intergovernmental Thematic Working Groups (ITWGs)
formed. At the county level, this facilitated enactment of sector regulations and strategies that were
important for new institutions.
Overall, the low level of funding of the sector has the effect of reducing the effectiveness of service
provision due to the lack of operational funds and low level of human resources. Low funding also is
an indicator of limited investment in priority infrastructure for the sector and consequently low
levels of productivity for most enterprises. The realisation of the potential within the sector may
remain out of reach in the foreseeable future unless the sector is accorded the priority it deserves.
Outcome 2: Environmental resilience and social inclusion of promoted value chains strengthened.
This outcome had two indicators measuring firstly the improved capacity by VCAs to respond to
climate change related risks and secondly the improved ability by vulnerable groups to engage in
VCs.
i) Indicator: Percentage increase in households who state that their response capacity to
climate-related risks has improved, by gender and vulnerability.
.
Responses to all climate change related risks
The Programme improved the response capacity of households to climate change related risks. Up
to 40% of VCAs used at least one or multiple responses compared to 33% in 2013. This is an increase
of 7% of those who responded to climate change related risks. The predominant response by ASDSP
actors in the producer node in all value chains across the three years was purchase of feed and
water. The proportion of the respondents who undertook this response was 42.3% in 2014, 39.1% in
2015 and 38.9% in 2016. The average was 40.1% over the three years. Migration of livestock,
undertaken by 2.6%, 1.5%, and 2.6% of ASDSP actors in 2014, 2015 and 2016 respectively, was the
least used response. The same trend was observed among different gender. Training and other
capacity building initiatives provided by the Programme enabled households and VCAs to apply and
practice NRM and climate change measures.
The percentage of VCAs applying climate change related risk training in agricultural enterprises
ranged from 83.3% for floods to 92.6% for pests and diseases (Table 4.31). Analysis of gender based
data showed high and equal application of knowledge on climate change risks by all gender.
Table 4.31: VCAs applying climate change related risks training by gender
Climate change related risks
Risk
Users
Adult males Adult females Youth
% % %
Drought 90.8 86.9 83.2
Floods 84.7 83.5 80.9
Forage Scarcity 85.6 92.7 84.2

35
Water Scarcity 91.4 90.8 87.6
Famine 91.3 89.0 89.6
Pests and diseases 93.0 91.6 93.3
The use of sustainable land management practices and other practices as provided for in the training
is key to not only in enhancing resilience to CC shocks but will also will translate into increased
production and productivity along the Value Chain.
ii) Indicator: Proportion of vulnerable groups who state that they are able to engage in value chains
The proportion of women and youth who were engaged in VCs was xx% and XXX% respectively. The
main production asset is land, and this was accessible to both women and youth. There was a slight
increase in access from 2013 to 2016 for all production assets, with access to livestock by youth
being the highest increasing from 60% in 2013 to 68.7% in 2016. Women’s access to beehives
increased from 1.9% in 2013 to 3.3% in 2016 (Table 4.32).
Table 4.32: Access to production resources by women and youth
Assets Percentage access 2013 Percentage access 2016
Women Youth Women Youth
Land for Crops 83.0 80.1 84.4 80.7
Land for Livestock 77.8 74.9 78.7 77.9
Water source including wells & water pans 55.7 55.7 60.0 60.0
Livestock 62.4 60.2 66.9 68.7
Milking Equipment 11.0 7.2 11.9 8.9
Maize Sheller 7.3 9.3 8.2 9.9
Beehives 1.9 5.8 3.3 6.6
All gender were involved in the value chains, with more men and women in production while youth
were more in the transportation nodes. Youth productivity for all value chains was generally lower
than that of women and men for the same value chains. There were value chains that women
predominantly engaged in, these included indigenous chicken, camel milk and cassava. All
categories of gender had employment in the Programme proportionate to their membership.
Access to production resources is key towards enabling the women and youth improve on yields and
production. This ultimately contributes to improved HH food security since women especially spend
a proportionally higher level of their income on food for the household. In addition improved access
to resources translates into ability to make decisions and also more productive use of time and
improved returns from the use of labour.
Outcome 3: A viable and equitable commercialization of the Agricultural Sector promoted
This outcome had four indicators measuring turnover from traded commodities, increase in on farm
employment, increase in off farm employment and finally increase in number and types of agro
enterprises in VCs.
Commodities Traded
i) Indicator: Turnover from traded agricultural commodities increased by 10% by 2017
During the period under assessment, turnover from traded agricultural commodities increased from the baseline of Ksh 495,247 to Ksh 1,328,084 in the year 2017. This is an increase of 152% showing that the indicator was surpassed. ;

36
Honey had the most significant increment, Ksh. 150,646, followed by the cow milk value chain,
Ksh. 111,467 and fish, Ksh. 83,462. African Bird’s Eye Chili, Ksh 3283 and Cassava, Ksh 5,247
declined in absolute turnover during the same period;
There was a significant variation between sales in year 1 as compared to the baseline data.
Between year 1 and year 2 there was a general decrease in most commodities traded with
marked declines for beef, cassava and fish. There were however increases in bananas, camel
milk, groundnuts and indigenous chicken traded.
Between year 1 as the baseline and year 3, there were sustained increases for bananas, camel
milk, water melon, passion fruit and indigenous chicken but declines occurred in cassava,
African bird eye chili and fish value chains. The best performing commodities were bananas,
camel milk, water melon, passion fruit and indigenous chicken.
The inconsistency in performance of most commodities is a probable reflection of the drought of
2015/2016 and possibly variations in in input as well as commodity prices. The low figures may also
be an indication that the level of commercialisation in the sector is still very low.
Table 4.33: Commodities traded
Value Chain Value of Marketed Commodities in Ksh
ASDSP Supported Value Chains Non-ASDSP Value Chains
2014 2015 2016 2014 2015 2016
African Bird-Eye Chili 18,206 15,197 2,664
Bananas 56,740 75,807 73,420
Beef* 1,564,617 406,306 1,448,773
Camel Milk 102,627 151,920 174,248
Cassava 18,282 5,100 735
Cotton 23,008 22,297 22,317
Cow Milk 163,040 174,453 166,430
Fish* 702,483 212,158 163,373
Goat Meat 36,659 29,554 27,824
Green Grams 23,921 26,269 11,897
Groundnuts 8,625 15,620 8,093
Honey 293,712 313,889 174,306
Indigenous Chicken 53,942 89,867 69,876
Irish Potatoes 104,790 82,710 61,004
Maize 88,575 92,242 80,147
Mangoes 21,669 22,840 17,533
Passion 78,415 91,360 93,745
Pyrethrum 26,222 33,611 34,167
Tomatoes 116,004 118,230 102,142
Water Melon 93,647 122,235 126,682
* These figures are outliers therefore not used for computation
Overall, the indicator on traded agricultural commodities has been surpassed.
Employment at household Level

37
Total household employment consists of on-farm employment from agricultural-related activities
within the farm and off-farm employment from agriculture related activities.
ii) Indicator: On farm employment increase by 5% per annum by 2017 disaggregated by gender and vulnerability
Households interviewed (2,406) reported having a total of 4,462 employees, an average of 1.8
employees per household as compared to 0.6 employees per household. This is an increase of 1.2
employees per household which translates to 50% per annum. Percentage of family labour
remained higher than non-family labour.
Family labour was prominent, 54.3% and non-family labour, 45.7% for ASDSP supported VCAs while
it was 54.3% for family labour and non-family labour. More male were employed, 61%, than women,
39%, by household heads. There was no major difference in employment by gender.
At household level, there was a significant employment of people under the age of 18, majority of
the VCAs (55.2%) were youth between the ages of 18-35 years. For job security, majority of the
households (75.1%), retained the employees they had since 2014 (Table 4.34).
Table 4.34: On- farm employment
N(4462) ASDSP Supported VCA %
N(4462)
Type of Worker in 2014 Family 54.3
Non-Family 45.7
Gender in 2014 Male 61
Female 39
Age of Worker in 2014
< 18 6
18-35 55.2
36-55 31.4
56-65 6.1
65+ 1.3
Did you have the same worker in 2016? No 24.9
Yes 75.1
Overall the indicator in increase on farm employment was surpassed.
Off-farm employment:
iii) Indicator: Off farm employment increased by 6% per annum by 2017, disaggregated by gender and vulnerability.
The households interviewed, 2,406, had a total of 1,184 employees which translates to 0.5
employees per household compared with the baseline of 0.1 employee per household in 2013. This
is an increase of 0.4 employees. This is an increase of 100%. More male were employed (63%), than
their female counterparts, 36.8%, by household heads for the ASDSP VCAs.
At the household level, there was a high employment of people under the age of 18 years. Majority
of the employees in the VCAs (54.1%) were youth between the ages of 18-35 years. Employees
between the ages of 18-55 years formed the bulk at 87.4%. Majority of the respondents in the value
chains, (92.3%) category retained the same employees they had n 2014 (Table 4.35)
Table 4.35: Off-farm employment
Off-farm employment Age ASDSP Supported VCA%
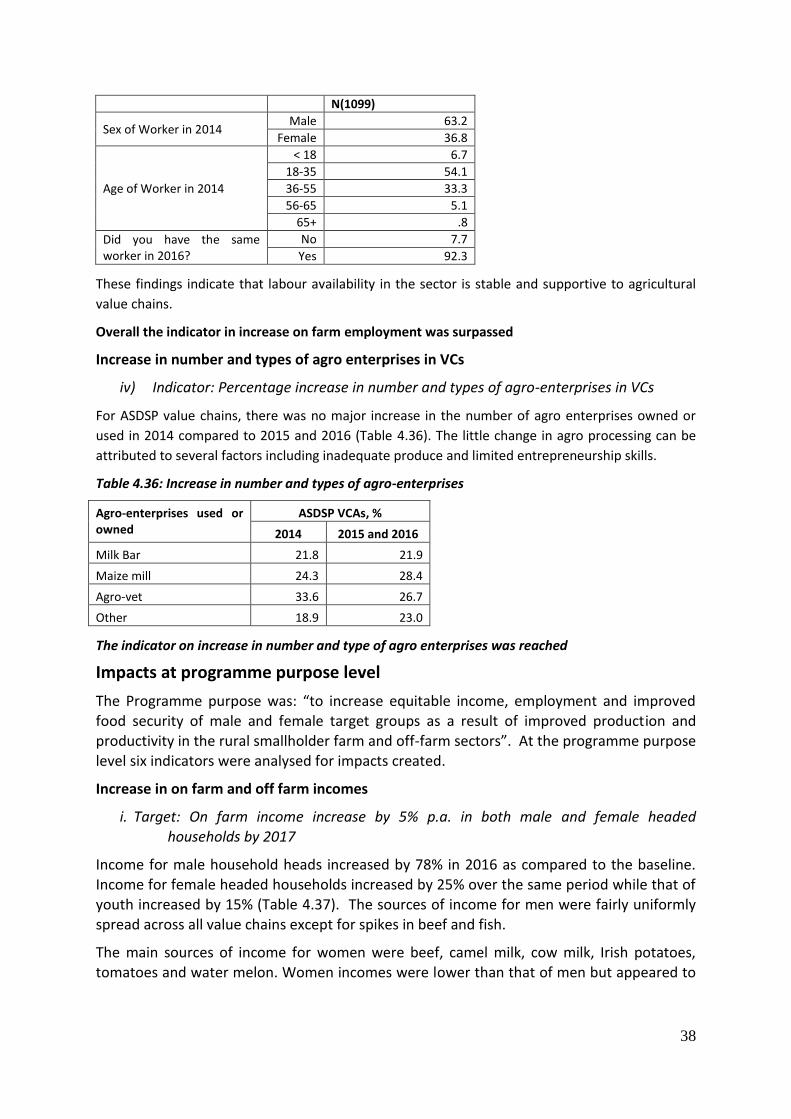
38
N(1099)
Sex of Worker in 2014 Male 63.2
Female 36.8
Age of Worker in 2014
< 18 6.7
18-35 54.1
36-55 33.3
56-65 5.1
65+ .8
Did you have the same worker in 2016?
No 7.7
Yes 92.3
These findings indicate that labour availability in the sector is stable and supportive to agricultural
value chains.
Overall the indicator in increase on farm employment was surpassed
Increase in number and types of agro enterprises in VCs
iv) Indicator: Percentage increase in number and types of agro-enterprises in VCs
For ASDSP value chains, there was no major increase in the number of agro enterprises owned or
used in 2014 compared to 2015 and 2016 (Table 4.36). The little change in agro processing can be
attributed to several factors including inadequate produce and limited entrepreneurship skills.
Table 4.36: Increase in number and types of agro-enterprises
Agro-enterprises used or owned
ASDSP VCAs, %
2014 2015 and 2016
Milk Bar 21.8 21.9
Maize mill 24.3 28.4
Agro-vet 33.6 26.7
Other 18.9 23.0
The indicator on increase in number and type of agro enterprises was reached
Impacts at programme purpose level
The Programme purpose was: “to increase equitable income, employment and improved
food security of male and female target groups as a result of improved production and productivity in the rural smallholder farm and off-farm sectors”. At the programme purpose level six indicators were analysed for impacts created.
Increase in on farm and off farm incomes
i. Target: On farm income increase by 5% p.a. in both male and female headed households by 2017
Income for male household heads increased by 78% in 2016 as compared to the baseline. Income for female headed households increased by 25% over the same period while that of youth increased by 15% (Table 4.37). The sources of income for men were fairly uniformly
spread across all value chains except for spikes in beef and fish.
The main sources of income for women were beef, camel milk, cow milk, Irish potatoes, tomatoes and water melon. Women incomes were lower than that of men but appeared to

39
be higher in some value chains such as camel milk and cow milk. Women got losses in the fish value chain in all the Programme period.
Table 4.37: On farm incomes by gender
Mean incomes
Baseline Mean income by year Year by year changes in incomes Overall change,
baseline to 2016 2014 2015 2016 2014 2015 2016
Men 81,263 196,953 69,102 145,005 142% -65% 110% 78%
Women 59,288 66,822 60,495 74,107 13% -9% 23% 25%
Youth 61,130 74,473 72,007 69,837 22% -3% -3% 14%
Youth appeared to be deeply involved in all value chains except cassava, cotton, groundnuts, and
honey. Their level of income was lower than that of men but higher than women’s in 2014 and 2015.
All gender incomes in all the Programme years were higher than the baseline (Table 4.38). The high
overall increase may also be attributed especially to men on a few VCs especially the beef value
chain.
The indicator on increase in on farm incomes was reached
Table 4.38: Value chain incomes for men, women and youth
Value
chain/income
(KSh)
Overall Men Women Youth
2013 2014 2015 2016 2014 2015 2016 2014 2015 2016
*ABEC 2,974 22,465 16,950 4,342 12,030 8,285 3,723 39,500 24,300 5,375
Bananas 31,000 64,157 97,145 78,645 25,320 24,854 28,225 71,050 61,087 45,176
Beef - 2,314,824 - 2,110,728 320,362 410,864 633,441 70,623 76,513 111,245
Camel Milk - 59,378 99,684 127,791 121,603 114,116 155,576 28,850 151,000 121,671
Cassava 2,991 11,417 21,500 9,000 20,310 6,379 1,813 10,000 8,250 0
Cotton 8,750 - - 3,633 6,620 11,525 8,625 10,000 10,000 10,000
Cow Milk 27,482 92,199 84,335 85,554 118,652 124,973 122,212 106,765 113,500 105,208
Fish 39,956 1,178,755 163,624 99,947 -120,359 -133,519 -49,673 241,957 172,281 70,319
Goat Meat - 42,593 22,613 25,512 13,187 -247 3,128 29,631 27,574 26,966
Green Grams 1,388 12,877 12,089 14,575 21,362 24,681 21,704 45,875 28,967 17,217
Ground Nuts 1,970 5,507 11,653 7,050 4,745 4,341 6,765 6,775 8,475 375
Honey 11,830 - 119,613 123,833 22,000 22,000 11,000 -16,400 4,250 3,875
Indi. Chicken 12,433 39,579 112,891 48,600 39,037 23,286 28,598 45,270 37,360 37,079
Irish Potatoes 13,543 50,154 43,922 35,131 99,180 51,507 70,599 44,941 34,355 52,969
Maize 766 57,293 77,734 75,178 38,605 37,693 41,661 57,644 62,906 59,684
Passion Fruits 40,015 169,215 127,250 105,067 -119,600 36,667 140,667 67,377 68,445 136,425
Pyrethrum 1,080 26,738 30,842 -1,343 70,500 35,950 16,417 0 23,800 21,000
Tomatoes 27,804 89,101 74,524 68,134 118,893 114,710 88,369 51,410 72,598 66,445
Water Melon 17,220 36,444 42,528 72,875 43,000 51,120 66,244 33,750 44,650 33,800
Mangoes 8,395 22,585 20,627 15,758 15,732 12,696 12,176 19,677 21,769 22,414
*ABEC – African Bird’s Eye Chili
ii. Off farm incomes increase by 6% in both male and female headed households by 2017

40
Off farm incomes show significant increases between 2014 and 2016 for remittances. Income
increases arising from employment show a modest increase of 5% between 2014 and 2016. Income
from other off sources also a significant increase over the same period.
Table 4.39: Increase in off farm incomes (in KES)
Source of Off Farm Incomes 2014 2015 2016 Change % change
Employment 181,303 188,252 190,458 9,155 5%
Remittances 31,008 32,139 36,747 5,738 19%
Shares 19,156 21,229 22,140 2,983 16%
Pension 90,256 92,657 96,459 6,203 7%
Other 101,460 108,733 119,192 17,733 17%
The increase in remittances by 19% over the same period is a reflection of increasing dependency
among specific households on children, relatives and friends. The other substantial increase is
income from shares which is a reflection of a growing level of participation in informal rural savings
and lending organisations which can act as alternative sources of finance for sustaining agricultural
interventions and meeting other HH cash requirements. The benefits that accrue to communities
and beneficiaries will create an incentive to maintain investments. Participation in such informal
groups in the long run may provide a basis for formation of Community based savings and loan
associations.
Overall, the indicator on increase in off farm incomes was reached
Reduction in gender disparities
iii. Gender disparities in on farm and off farm incomes reduced by 20% by 2017
Income disparities that favoured women over men and men over youth along the value chain nodes
were clearly noted if beef and fish value chains were not used to calculate the disparities. The
trends show that the disparity at 109% for women over men and 120% for youth over men in 2014
(Table 4.40). By 2016, this disparity had risen to 157 % for women over men and 105% for youth
over men. Men featured more strongly in the processors node in the value chain, this was also
accompanied by high incomes, for the period running from 2014 to 2016. On the other hand women
dominated the marketing node while the contribution of youth was more notable as input suppliers
in the value chains during the same period.
Table 4.40: Gender disparities in on-farm incomes
Mean incomes
Baseline income
Disparities
Mean incomes (2016)
Disparities
Change in disparities
Men 40,085 44,966.75
Women 43,558 109% (cf men) 70,563.50 157% 48%
Youth 48,234 120% (cf men) 47,362.15 105% 15%
Male and female household heads earned more than those who were not household heads (Table
4.41). Incomes in the years fluctuated slightly for all categories. Income for male household heads
increased by 12.8% from 2014 to 2016 and that of female household heads by 31%. Overall, annual
income for men and women were higher in all the study years than during the 2013 baseline when
incomes were reported to be KES 81,263, KES 59,288, and KES 63,130 for male adults, female adults
and youth respectively.

41
The indicator on gender disparities on off-farm incomes was not established.
Table 4.41: Household head gender disparities in on-farm incomes
Household Head (HHH) gender Incomes (KSh)
2014 2015 2016
Male HHH Yes 183,051 165,734 206,568
Female HHH Yes 170,286 220,752 223,731
Overall the indicator on gender disparities in on-farm incomes reduced was surpassed.
Food and nutrition security
iv. Food and nutrition security level increased by 10% in both male and female headed households by 2017
The results indicate that MAHFP index among ASDSP beneficiaries increased by 19% by the end of
the Programme period. This was illustrated by the reduced proportion of male, female and youth
headed households who had less food to meet their needs in 2016 i.e. 32.8% of male, 38% of female
and 42% of youth as compared to 61% of male, 58% of female and 61% of youth-headed households
as reported in the baseline study. The study also showed that more youth headed households on
average had less food as compared to the adult male and female households. Food and nutrition
security were evaluated under the following areas, food availability, seasonality of food supply and
dietary diversity.
This positive change could be attributed to Programme interventions. To assess whether the
improved MAHFP index elicited a corresponding increase in household dietary diversity, dietary
diversity index for the two periods (baseline and end term) were analyzed and compared. As
indicated in Table 4.45, the average household dietary diversity index increased by 120% among
Programme beneficiary households. However, the End Term data was not collected by gender hence
the inability to compare the changes along the gender divide
Food availability
In general terms three meals a day is a measure of food availability in Kenya. A meal can be
breakfast, lunch or supper. The overall proportion of households that ate 3 meals per day increased
from 86.1% to 87.4% between 2014 and 2016 among ASDSP VCAs. By 2016, only a few households
ate 1 meal in a day (Table 4.42).
Table 4.42: Meals eaten by households per day
Meals per day 2014 (%) 2016 (%)
3 86.1 87.4
2 10.9 9.7
1 0.5 0.2
Among the ASDSP VCAs, 88.1% of male-headed; 86.6% of female-headed and 87.4% of youth-
headed households had 3 meals per day in 2016 (Table 4.43)
Table 4.43: Meals taken by households per day, by gender
Meals Per day Males (%) Females (%) Youth (%)
2014 2016 2014 2016 2014 2016
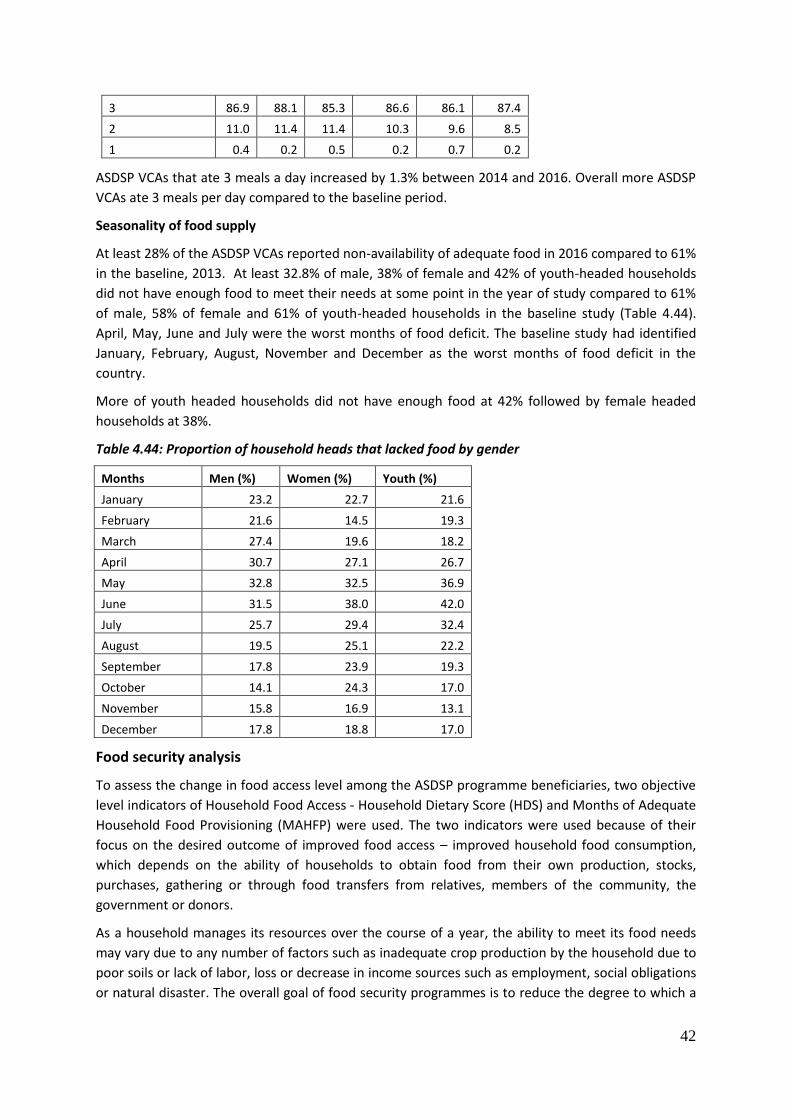
42
3 86.9 88.1 85.3 86.6 86.1 87.4
2 11.0 11.4 11.4 10.3 9.6 8.5
1 0.4 0.2 0.5 0.2 0.7 0.2
ASDSP VCAs that ate 3 meals a day increased by 1.3% between 2014 and 2016. Overall more ASDSP
VCAs ate 3 meals per day compared to the baseline period.
Seasonality of food supply
At least 28% of the ASDSP VCAs reported non-availability of adequate food in 2016 compared to 61%
in the baseline, 2013. At least 32.8% of male, 38% of female and 42% of youth-headed households
did not have enough food to meet their needs at some point in the year of study compared to 61%
of male, 58% of female and 61% of youth-headed households in the baseline study (Table 4.44).
April, May, June and July were the worst months of food deficit. The baseline study had identified
January, February, August, November and December as the worst months of food deficit in the
country.
More of youth headed households did not have enough food at 42% followed by female headed
households at 38%.
Table 4.44: Proportion of household heads that lacked food by gender
Months Men (%) Women (%) Youth (%)
January 23.2 22.7 21.6
February 21.6 14.5 19.3
March 27.4 19.6 18.2
April 30.7 27.1 26.7
May 32.8 32.5 36.9
June 31.5 38.0 42.0
July 25.7 29.4 32.4
August 19.5 25.1 22.2
September 17.8 23.9 19.3
October 14.1 24.3 17.0
November 15.8 16.9 13.1
December 17.8 18.8 17.0
Food security analysis
To assess the change in food access level among the ASDSP programme beneficiaries, two objective
level indicators of Household Food Access - Household Dietary Score (HDS) and Months of Adequate
Household Food Provisioning (MAHFP) were used. The two indicators were used because of their
focus on the desired outcome of improved food access – improved household food consumption,
which depends on the ability of households to obtain food from their own production, stocks,
purchases, gathering or through food transfers from relatives, members of the community, the
government or donors.
As a household manages its resources over the course of a year, the ability to meet its food needs
may vary due to any number of factors such as inadequate crop production by the household due to
poor soils or lack of labor, loss or decrease in income sources such as employment, social obligations
or natural disaster. The overall goal of food security programmes is to reduce the degree to which a

43
household is vulnerable to any factor that results in insufficient food or to enhance community
resilience and livelihood capacities in the face of shocks. ASDSP activities could have reduced this
vulnerability in any number of ways.
Table 4.45: Change in Dietary Diversity Index by gender
Household Head (HHH) Baseline ETE % change
Average for all HHH 2.03 4.47 120
Average for male HHH 2.03 120
Average for female HHH 2.00 124
Average for youth HHH 2.05 118
The study assessed changes in % of households eating various food categories to identify those
eaten by increased proportions of households. The finding shows that % of households eating the
food categories within which various value chains supported by ASDSP Programme fell, increased by
between 17% and 57% (Table 4.46). The change could be attributed to the interventions that were
rolled out by the Programme e.g. capacity building of VCAs which enabled households to produce or
purchase different food types.
Table 4.46: Variation in types of food eaten
Food items Baseline (%) ETE (%) Variance
Cereals 58 92 34
Roots and tubers 34 73 39
Vegetables 65 95 30
Fruits 31 75 44
Meat 42 88 46
Pulses 39 96 57
Milk 60 94 34
Fat and oil 74 91 17
Fish 3.5 35 31.5
Slightly more than 81% of the households consumed less than three food groups in one week. The
implication is that the households in the country had a low food diversity comprising a maximum of
two food groups within the study year. Slightly more than 81% of the households consumed less
than three food groups in one week. Thus households in the country had a low food diversity
comprising a maximum of two food groups in 2016.
More ASDSP VCAs ate 3 meals a day compared to the baseline period. A lower proportion reported
non availability of food to meet their needs at some point in the year of study compared to the
baseline, an indication of reduced food insufficiency over the years. The months of April, May, June
and July were the worst in food deficit. Poor diversification of food sources is the major cause of
malnutrition among households. Only about 19% consumed more diverse diets comprising of 3 or
more food groups in a week. On average, 50.7% of the ASDSP VCAs were food secure compared to
39% in the baseline.
Value chain production and productivity
v. Productivity of major food commodities increased by 10% by 2017

44
Productivity of the prioritized value chains had different experiences with some increasing or fluctuating while others decreased in the Programme implementation period. There was increase in productivity for banana, Irish potatoes, maize, groundnut, water melon, cow milk, fish, and indigenous chicken and egg value chains during the Programme implementation period compared to the baseline. All these had an annual increase of more than 5% with banana having an increase of 31%, maize - 29%, cow milk - 23%, Irish potatoes - 12.5% and groundnut - 14%. However, other value chains like camel milk and cotton, mango, groundnut, pyrethrum and cassava fluctuated, while African Bird’s Eye Chilli, passion fruit and tomato decreased in in the same period (Table 4.47).
Table 4.47: Productivity trends
Overall the indicator on increased productivity on major value chains was surpassed
Asset ownership
vi. Household asset index increased for women, youth and vulnerable groups
Assets owned by households are mainly determined by the levels of income and asset acquisition
can therefore be used to gauge income. Assets considered were gas cookers, bicycles, motorcycles,
cars and type of house. More respondents, 14.7%, acquired gas cookers in 2014 up from 9.8% in the
baseline period, 2013, but this reduced slightly to 12% in 2016 (Figure5).
Crops Unit 2013 2014 2015 2016
African Bird Chilli Kg/Acre - 184 126 95
Bananas Kg/acre 1,721 2,509 2,936 3,248
Cassava Kg/acre 5,680 1,981 2,788 639
Cotton Kg/acre 200 446 426 271
Green Grams Kg/acre 345 228 258 380
Groundnuts Kg/acre 150 - 350 400
Irish Potatoes Kg/acre 2,518 3,008 3,030 3,218
Maize Kg/acre 1,115 1,562 1,557 2,015
Mangoes Kg/acre 2,793 1,997 1,846 2,161
Passion Kg/acre 3,413 2,941 1,926
Pyrethrum Kg/acre 48 37 38 46
Tomatoes Kg/acre 8,129 9,271 4,309 3,174
Water Melon Kg/acre 4,720 12,307 14,646
Livestock Unit 2013 2014 2015 2016
Cow Milk Litres/cow/day 4.9 7.1 6.7 8.8
Camel Litres/camel/day 2.9 4.0 1.8 2.0
Indigenous Chicken No/HH 90 207 351 429
Eggs Trays/year 77 144 336 372
Fish Kg/ M2 0.6 - - 1.0
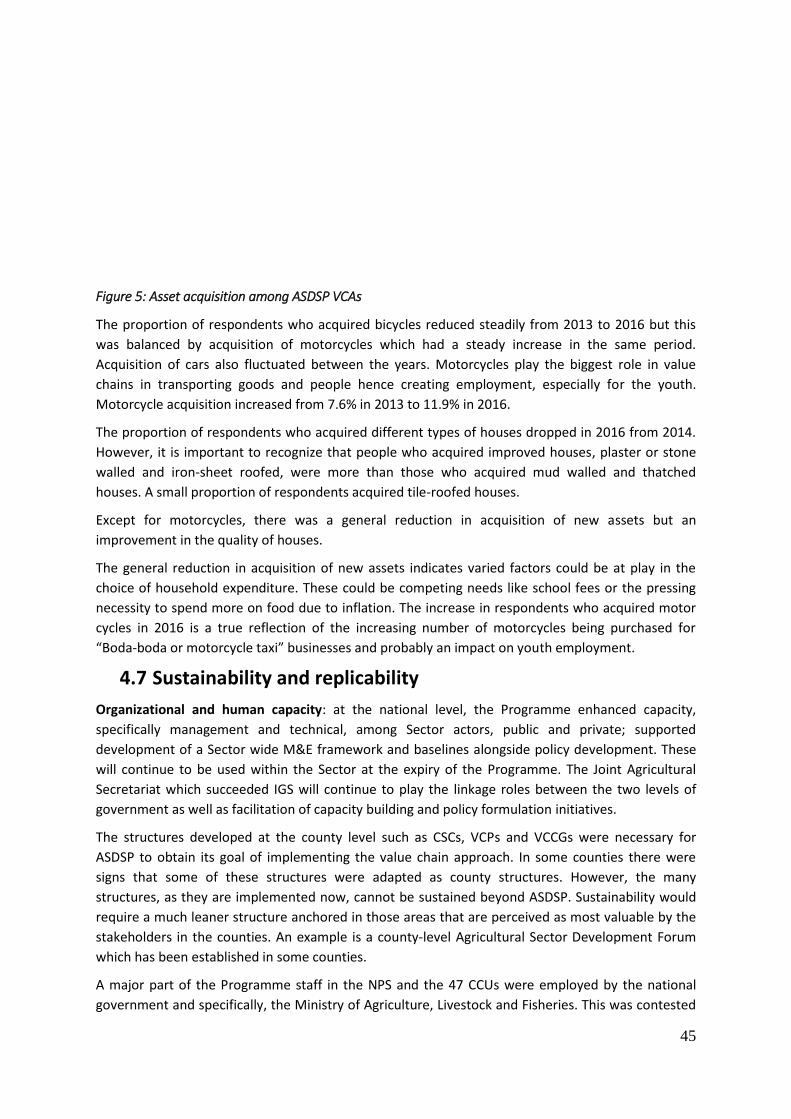
45
Figure 5: Asset acquisition among ASDSP VCAs
The proportion of respondents who acquired bicycles reduced steadily from 2013 to 2016 but this
was balanced by acquisition of motorcycles which had a steady increase in the same period.
Acquisition of cars also fluctuated between the years. Motorcycles play the biggest role in value
chains in transporting goods and people hence creating employment, especially for the youth.
Motorcycle acquisition increased from 7.6% in 2013 to 11.9% in 2016.
The proportion of respondents who acquired different types of houses dropped in 2016 from 2014.
However, it is important to recognize that people who acquired improved houses, plaster or stone
walled and iron-sheet roofed, were more than those who acquired mud walled and thatched
houses. A small proportion of respondents acquired tile-roofed houses.
Except for motorcycles, there was a general reduction in acquisition of new assets but an
improvement in the quality of houses.
The general reduction in acquisition of new assets indicates varied factors could be at play in the
choice of household expenditure. These could be competing needs like school fees or the pressing
necessity to spend more on food due to inflation. The increase in respondents who acquired motor
cycles in 2016 is a true reflection of the increasing number of motorcycles being purchased for
“Boda-boda or motorcycle taxi” businesses and probably an impact on youth employment.
4.7 Sustainability and replicability
Organizational and human capacity: at the national level, the Programme enhanced capacity,
specifically management and technical, among Sector actors, public and private; supported
development of a Sector wide M&E framework and baselines alongside policy development. These
will continue to be used within the Sector at the expiry of the Programme. The Joint Agricultural
Secretariat which succeeded IGS will continue to play the linkage roles between the two levels of
government as well as facilitation of capacity building and policy formulation initiatives.
The structures developed at the county level such as CSCs, VCPs and VCCGs were necessary for
ASDSP to obtain its goal of implementing the value chain approach. In some counties there were
signs that some of these structures were adapted as county structures. However, the many
structures, as they are implemented now, cannot be sustained beyond ASDSP. Sustainability would
require a much leaner structure anchored in those areas that are perceived as most valuable by the
stakeholders in the counties. An example is a county-level Agricultural Sector Development Forum
which has been established in some counties.
A major part of the Programme staff in the NPS and the 47 CCUs were employed by the national
government and specifically, the Ministry of Agriculture, Livestock and Fisheries. This was contested
46
by the county governments on the basis that agriculture is a devolved function therefore resources
including staff should be devolved. The CCUs as currently constituted can therefore not be expected
to be sustained post the Programme. However, if the present staff are absorbed and retained in the
Programme by the county governments, then Programme activities will proceed with minimal
disruption.
Sustainability in terms of human capacity was based on the principle of implementation by partner
organisations and the development of Value Chain Platforms, where capacity was developed among
Value Chain Actors and partners. This is expected to be sustained beyond the Programme period.
Most counties have weak fora for Sector stakeholders and in others there is lack of consistency in
representation in CSCs and other meetings that require attention. This means that the quality of
participation and the speed of making decisions are affected negatively. Moreover the depth of
participation and representation in the Programme is not adequate and in the long run sustainability
of the CSCs cannot be guaranteed. Therefore the Programme needs to review the selection of
participants in CSCs and support initiatives that strengthen structures such as county stakeholder
fora for sustainability.
Marketing is the most important reason for the formation of agricultural groups and accounts for
over 37% of groups formed. This therefore means that access to marketing information is critical to
sustainability of most groups. As currently structured, VCPs and VCCGs are county specific and have
limited capacity in business and market orientation and minimal private sector engagement. They
are therefore unlikely to be sustained beyond ASDSP. There is therefore need to build capacity of
VCPs and VCCGs in these areas and formulate clear exit strategies on how they can become self-
sustaining. This may include expanding the platforms across counties.
Partnerships and funding stability: sustainability of impacts, especially Value Chain Development is
likely to be achieved as a result of the strong public support that the Programme has built through
enhanced capacity of Value Chain Actors. Specifically, gains in Value Chain Development are likely to
be sustained due to partnerships that the Programme established with diverse community
organizations and service providers including financial institutions. These gains are also likely to be
sustained due to the shift from male domination of value chain activities to inclusion of women and
youth and their enhanced ownership of productive assets. Further, increased use of technologies
and improved access to financial services would ensure sustainability.
It is assessed that county governments and the private sector are investing more in support of value
chains where it is demonstrated that one shilling invested by the Programme leverages three
shillings. This will enhance financial stability and contribute to sustainability.
In spite of the possible risks, the long term sustainability of the Programme would be better
achieved through its devolution to the counties. Issues of governance and accountability can be best
handled through appropriate safeguards and required measures on a case by case basis.
Replicability
There is potential for replicability of ASDSP and this is likely to be aided by the Programme’s focus on
partnerships and improvement of the business environment through the value chain approach.
Focus on partnerships is likely to aid replicability due to its potential in building synergy and reducing
duplication of efforts. This is against the background that the Agricultural Sector in Kenya is large
and complex with a multitude of public, non-governmental and private actors. These actors include
47
sector ministries and all tiers; private sector agribusiness actors; civil society organizations
particularly farmer organizations and bilateral and multilateral Development Partners.
Replicability is likely to be aided by value chain approaches because these are based on causal
models that focus on addressing critical bottlenecks, constraints and opportunities in a selected
value chain. The expectation is that this will foster increased competitiveness, sustained access to
business development services, increased micro- and small-enterprise incomes and overall value
chain growth. Value chain approaches are built upon coordinated, systematic and systemic
methodologies and work with actors undertaking specific functions along a particular chain and
actors providing support services, as opposed to strengthening one particular actor.
However, focus on software, as opposed to hardware may impede or enhance replicability
depending on priorities of implementing partners and targeted beneficiaries.
48
5. CONCLUSIONS, LESSONS LEARNT AND RECOMMENDATIONS
5.1 Conclusions
1. The objectives of ASDSP are valid considering that there is increasing food insecurity, low incomes
and under and unemployment. ASDSP’s objectives were relevant to the goals and objectives
of Kenya’s ASDS and pursued SDGs such as ending poverty, ending hunger, achieving food
security and improved nutrition, promoting sustainable agriculture, achieving full and
productive employment and combating climate change and its impacts. It was also in
agreement with the Swedish Government’s “Strategy for development cooperation with
Kenya, 2009-2013” specifically in the area of natural resources and the environment and
gender
2. The activities and outputs of ASDSP are consistent with the overall goal and the attainment of its
objectives. There is a link between the activities of the programme and the outputs and
subsequently with the overall goal and attainment of the objectives. Some activities and
outputs were not generated due to the complexity of partnerships in service delivery. Where
some of the services were not available or not appropriate, impacts were not realized and they
would require more time for changes to be realized. A ever a bigger scale and longer term
period is however required for the programme to significantly create impacts and effects at
the macro level and among the agribusiness population
3. The original design of the programme had to change with the advent of the Constitution 2010
that ushered in a new ministry structure with a narrower sector wide focus and new
governance. Although the programme adapted to these changes it encountered challenges in
coordination between the national and county governments to the extent that the programme
specific activities were affected. The programme along with other development partners
supported the Transformation Initiative while at the county level, 47 CCUs and their aligned
CSC. ASDSP structures and activities at the county level were established. These are generally
accepted by the County Governments (CGs) and are also being seen venues through which the
CG can coordinate the agricultural sector at that level. These changes enabled ASDSP remain
relevant in design including programme goals and objectives as well as the overall internal
logic of the programme. The programme specific intervention strategies remained relevant
and realistic.
4. The Programme steering and coordination structures were found useful by the national and
county governments. The TI, the CSC, the VCP and VCCCGs had particular relevance in
strengthening the broad involvement of stakeholders including the private sector in
agriculture. The intergovernmental consultation structures provided an opportunity for the
national and the county governments to work together towards a common objective of
realizing the goals of the Sector
5. The overall performance of the programme is satisfactory and has achieved certain results and
targets in accordance with the program document and according to the approaches and

49
strategies of the programme. The key factors contributing to performance include
establishment, strengthening and operationalization of key ASDS institutions, enhancing social
inclusion through participation of women and youth, developing inclusive and effective VCO;
enhancing VCAs’ business management skills and increasing public and private investments in
value chains. On the other hand environmental resilience and adaptation to climate change
were not sufficiently taken up by VCAs, this increased vulnerability to drought resulting in
lower than anticipated production. Groups hardly held together for long, group cohesion was a
problem that affected membership. Some farmers did not like engaging in groups and
preferred the individual approach. This affected group cohesiveness and negatively impacted
value chains.
6. The programme had an elaborate M&E system developed during the implementation period.
Some elements of the system should have been there at the beginning e.g. the baseline data,
the data tools and the MIS. There was also inadequate capacity among the implementers
including stakeholders to utilize the MIS system at both the national and county levels.
7. The Technical Assistance procured by the ministry was useful in the deepening of knowledge
among the implementers. The co-owned of these services depending on the needs was very
effective. However there were challenges in balancing in channeling the TA to strategic needs
at the expense of operational activities. The role of the rolling audit was crucial in ensuring
transparency and accountability mechanisms in resource utilization.
8. Joint planning and implementation with partners provided additional synergy and generated
leverage funding. Such leverage funds benefitted implementation of extended concepts on
coordination among others although in some cases commitments were not forthcoming.
9. The programme laid strong foundations for VCD with VCOs being established in all the counties.
This was very useful in formalization of VCOs and associations but there is need to link VCPs
and VCCGs inter county and strengthen then capacity in business and market orientation.
10. The Value chain approach has been replicated in some counties and by some programmes.
5.2 Lessons Learnt
1. The extended concept model was useful in harnessing resources from partners that helped in
addressing the prioritized VC bottlenecks identified by stakeholders. This enhanced VC
commercialisation.
2. For VCAs to make business from VCD activities there is need to focus on maximizing productivity
where net incomes should be benchmarked on the poverty levels of the HH and the attainment
of upper middle level income.
3. National programme whose services fall within the devolved functions to ensure there are proper
integration mechanisms that are owned and supported by the two levels of Government.
4. The value chain structures that were created by the program at county level created ownership
and are critical for the sustainability of the VCs.
50
5. Partnerships in value chains and other aspects of agricultural development promote synergy,
reduce duplication, address staff shortages and increase access to services. Partners fund
certain critical activities and foster linkages to potential clients.
6. The Programme promoted stakeholder – led activities in VCD and addressed the uniqueness of
each county. This will be a positive factor in sustainability of the value chains.
7. Some lead agents or partners who were public sector employees were, in many instances, not
available and accountable to VCAs.
8. Participatory Scenario Planning is an important tool in bringing public and private service
providers together in assessing weather and climate related risks and dissemination of weather
advisories. Integration of environmental and climate change resilience into value chains is key to
VCD.
9. The baseline surveys carried out early in the Programme implementation and other programme
initiated surveys proved useful not only to the Programme but to other sector actors at national
and county level for decision making.
10. The County level coordination structures, namely CCUs and CSCs have reduced bureaucracy and
improved administrative decision making. There is quicker implementation of action plans.
11. Use of ICT both by implementers and beneficiaries has enhanced the effectiveness of delivery of
services and information sharing.
10.1 Recommendations
The impact evaluation makes five specific recommendations for consideration in the design and
implementation of the second phase of ASDSP:
1. Strengthen interdepartmental and inter-ministerial interactions and enhance participation of
non-state actors in the Ministry of Agriculture, Livestock and Fisheries through establishment of
thematic groups to handle issues of cross sectional importance such as:
i. Policy formulation and implementation;
ii. Coordination of implementation of capacity building initiatives for counties;
iii. Inadequate and delayed preparation and responses to disasters including drought, floods and
diseases;
iv. Evaluation of the contribution of para-state agencies to the mission and goals of the Ministry;
v. Ineffective and inadequate agriculture research agenda setting and
vi. Sector data collection, analysis and management.
2. Strengthen business and market orientation and particularly the ability to engage the private
sector to ensure institutional sustainability of VCPs and VCCGs. As currently structured, many of
these bodies are unlikely to be sustained beyond ASDSP because sustainability would require a
leaner structure. There is need to formulate clear exit strategies and understanding of how the
structures can become self-sustaining. Marketing is the most important reason for the formation of

51
agricultural groups accounting for over 37% of groups formed. This therefore means that access to
marketing information is critical to sustainability of most groups.
3. Promote youth participation in VCD. Although there were deliberate efforts through the Programme
to include women and youth in Value Chain Development, there is need to also enhance
engagement of youth in VCD. Youth productivity for all value chains was generally lower than that of
women and men for the same value chains. A more deliberate and targeted effort for involvement
of youth through identification of their interests and the unique constraints they face when
engaging in agricultural value chains is necessary. Commercially viable value chain solutions that
benefit youth should be promoted.
4. Improve access to financial services to enhance uptake of technologies and increase productivity.
Access to financial services remains a key impediment to transformation of the Sector. The
perception of high cost of financial services hinders investments in new technologies and expansion
of enterprises. Uptake of technologies remained low through the Programme period; this was
reflected in low productivity of most of the value chains.
Support for proposal writing (financing business plans) for access to financial services from micro-finance
institutions and commercial banks;
Creation of savings and credit associations to offer affordable financial services on a cost-effective basis to
cover a large number of the cooperative membership, provide an alternative system for securing credit
instead of utilizing the formal collateral system.
5. Strengthen capacities in NRM planning among Value Chain Actors. VCAs did not participate
sufficiently in local planning for Natural Resource Management and development of climate risk
management plans despite the training they received.
6. As a national programme whose services are devolved, there is need for proper integration in the
respective counties and need for establishment for coordination and partnerships that are owned by
the two levels.
7. In view of the perception of the stakeholders that the programme did not factor in hardware and
that capacity enhancement (software) alone is not enough to generate results, there is need for the
sector to make an analysis and make recommendations.
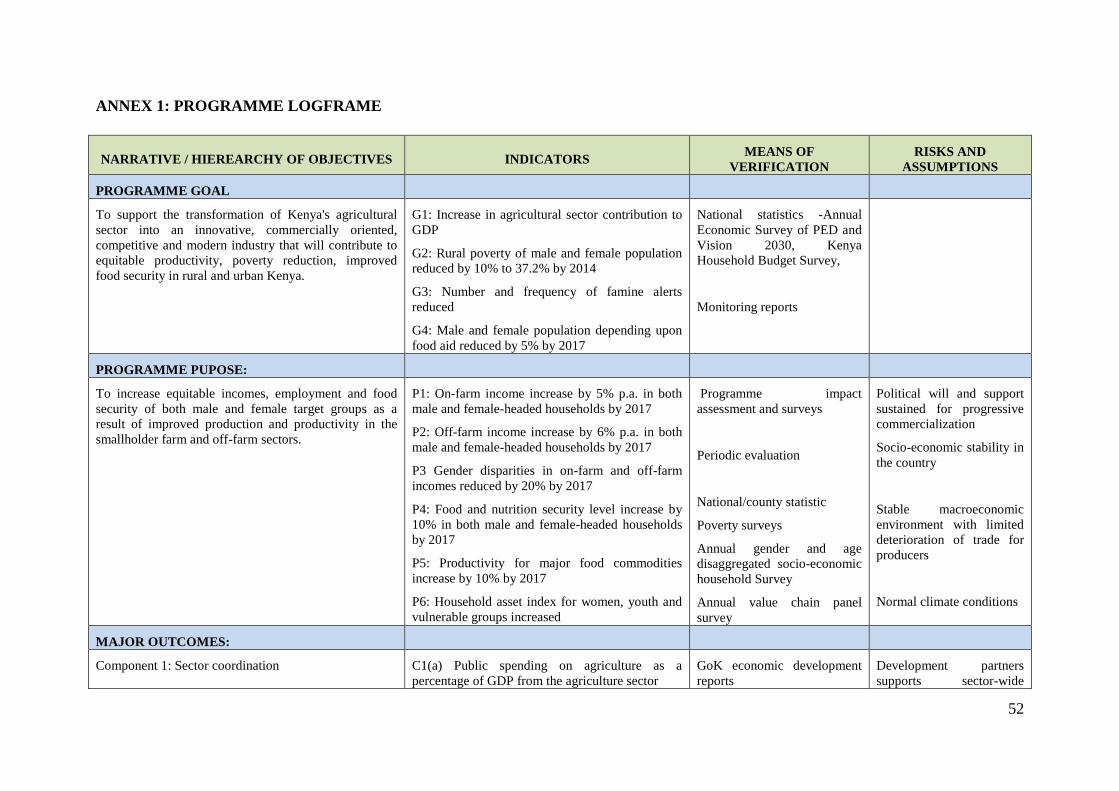
52
ANNEX 1: PROGRAMME LOGFRAME
NARRATIVE / HIEREARCHY OF OBJECTIVES INDICATORS MEANS OF
VERIFICATION
RISKS AND
ASSUMPTIONS
PROGRAMME GOAL
To support the transformation of Kenya's agricultural
sector into an innovative, commercially oriented,
competitive and modern industry that will contribute to
equitable productivity, poverty reduction, improved
food security in rural and urban Kenya.
G1: Increase in agricultural sector contribution to
GDP
G2: Rural poverty of male and female population
reduced by 10% to 37.2% by 2014
G3: Number and frequency of famine alerts
reduced
G4: Male and female population depending upon
food aid reduced by 5% by 2017
National statistics -Annual
Economic Survey of PED and
Vision 2030, Kenya
Household Budget Survey,
Monitoring reports
PROGRAMME PUPOSE:
To increase equitable incomes, employment and food
security of both male and female target groups as a
result of improved production and productivity in the
smallholder farm and off-farm sectors.
P1: On-farm income increase by 5% p.a. in both
male and female-headed households by 2017
P2: Off-farm income increase by 6% p.a. in both
male and female-headed households by 2017
P3 Gender disparities in on-farm and off-farm
incomes reduced by 20% by 2017
P4: Food and nutrition security level increase by
10% in both male and female-headed households
by 2017
P5: Productivity for major food commodities
increase by 10% by 2017
P6: Household asset index for women, youth and
vulnerable groups increased
Programme impact
assessment and surveys
Periodic evaluation
National/county statistic
Poverty surveys
Annual gender and age
disaggregated socio-economic
household Survey
Annual value chain panel
survey
Political will and support
sustained for progressive
commercialization
Socio-economic stability in
the country
Stable macroeconomic
environment with limited
deterioration of trade for
producers
Normal climate conditions
MAJOR OUTCOMES:
Component 1: Sector coordination C1(a) Public spending on agriculture as a
percentage of GDP from the agriculture sector
GoK economic development
reports
Development partners
supports sector-wide

53
NARRATIVE / HIEREARCHY OF OBJECTIVES INDICATORS MEANS OF
VERIFICATION
RISKS AND
ASSUMPTIONS
A transparent system for realizing agricultural sector
coordination and harmonisation and an enabling
institutional environment for the realisation of ASDS
developed
Vision2030/ASDS progress
reports
ASCU sector progress reports
institutions
Ministries in the sector
cooperate for sector
coordination
Other actors in the sector
join the coordination
Political and socio-
economic stability is
sustained in the country
Component 2: Environmental resilience and social
inclusion
Environmental resilience and social inclusion of
promoted in value chains strengthened
C2 (a) % increase in households who states that
their response capacity to climate-related risks has
improved, by gender and vulnerability
C2(b) Proportion of vulnerable groups who states
that they are able to engage in VCs
ASDSP/CCU Progress
Reports
NRM / CC adaption /
mitigation adoption reports
Qualitative and Quantitative
Gender Assessment Reports
VCD Reports
Diversity disaggregated data
(gender, economic, age and
other social stratification)
Qualitative surveys
NRM institutions and
partners collaborate fully in
the NRM / CC awareness
building.
Technologies suitable for
the most vulnerable and the
poorest of the poor can be
developed and introduced.
Community groups and
CIG’s can act in concert
Component 3: Value chain development
Viable and equitable commercialisation of the
agricultural sector promoted
C3(a): Turnover from traded agricultural
commodities increase by 10% by 2017
C3(b) On farm employment increase by 5% p.a.
by 2017, disaggregated by gender and
vulnerability
C3(c) Off farm employment increase by 6%
p.a.by 2017, disaggregated by gender and
vulnerability
C3 (d) % increase in number and types of agro-
Baseline survey and M&E
reports
Published yields and price
data
Agro-industry and market
surveys
Household surveys
Annual value-chain panel
Government policy
supports/ favours the
emergence of strong value
chain organizations
The market price of
agricultural inputs and fuel
remains stable
Access to finance for VC
actors progressively grows
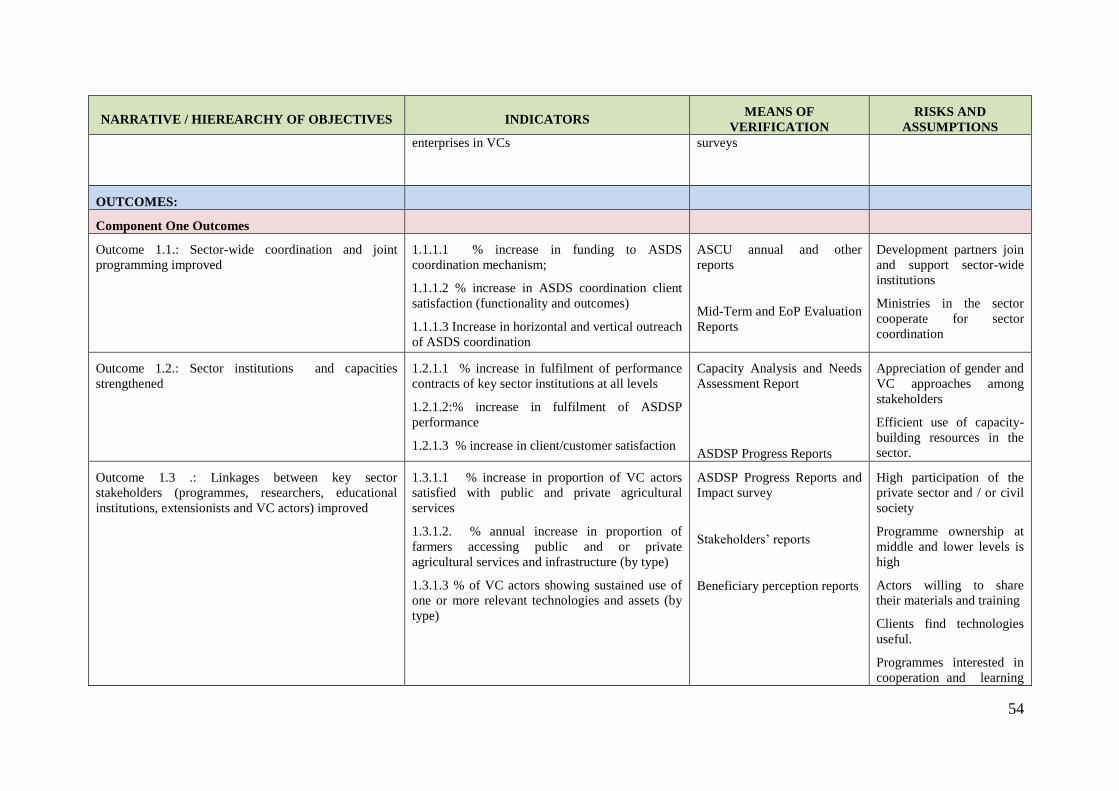
54
NARRATIVE / HIEREARCHY OF OBJECTIVES INDICATORS MEANS OF
VERIFICATION
RISKS AND
ASSUMPTIONS
enterprises in VCs surveys
OUTCOMES:
Component One Outcomes
Outcome 1.1.: Sector-wide coordination and joint
programming improved
1.1.1.1 % increase in funding to ASDS
coordination mechanism;
1.1.1.2 % increase in ASDS coordination client
satisfaction (functionality and outcomes)
1.1.1.3 Increase in horizontal and vertical outreach
of ASDS coordination
ASCU annual and other
reports
Mid-Term and EoP Evaluation
Reports
Development partners join
and support sector-wide
institutions
Ministries in the sector
cooperate for sector
coordination
Outcome 1.2.: Sector institutions and capacities
strengthened
1.2.1.1 % increase in fulfilment of performance
contracts of key sector institutions at all levels
1.2.1.2:% increase in fulfilment of ASDSP
performance
1.2.1.3 % increase in client/customer satisfaction
Capacity Analysis and Needs
Assessment Report
ASDSP Progress Reports
Appreciation of gender and
VC approaches among
stakeholders
Efficient use of capacity-
building resources in the
sector.
Outcome 1.3 .: Linkages between key sector
stakeholders (programmes, researchers, educational
institutions, extensionists and VC actors) improved
1.3.1.1 % increase in proportion of VC actors
satisfied with public and private agricultural
services
1.3.1.2. % annual increase in proportion of
farmers accessing public and or private
agricultural services and infrastructure (by type)
1.3.1.3 % of VC actors showing sustained use of
one or more relevant technologies and assets (by
type)
ASDSP Progress Reports and
Impact survey
Stakeholders’ reports
Beneficiary perception reports
High participation of the
private sector and / or civil
society
Programme ownership at
middle and lower levels is
high
Actors willing to share
their materials and training
Clients find technologies
useful.
Programmes interested in
cooperation and learning

55
NARRATIVE / HIEREARCHY OF OBJECTIVES INDICATORS MEANS OF
VERIFICATION
RISKS AND
ASSUMPTIONS
exchange with TWGs
Outcome 1.4.: Gender and vulnerability sensitive sector-
wide M&E information systems developed and
supported
1.4.1.1 % annual increase in proportion of
stakeholders (by type) accessing sector-wide
M&E services for various uses, including decision
making
1.4.1.2 % of stakeholders showing sustained use
of one or more sector-wide M&E services
1.4.1.3 % increase in proportion of stakeholders
satisfied with sector-wide M&E services
Sector and ASDSP M&E
reports
ASDSP Progress Report
Beneficiary perception reports
Data collection, analysis
and reporting system of
M&E/ICT platforms
adapted to reflect
capacities of input
providers
The technical content and
market information is
valuable for a wide range
of stakeholders in very
different conditions
Outcome 1.5: Appropriate sector-wide policies,
strategies and regulations developed (VC,
NRM/CC/social protection)
1.5.1.1 Sector policies, strategies and regulations
in use
Sector and ASDSP M&E
reports
ASDSP progress Reports
Policy-makers and
Parliament promulgate
policies
Component Two Outcomes
Outcome 2.1 Environmental resilience for value chain
actors, including vulnerable groups promoted
2.1.1 % increase in VC actors taking appropriate
response measures on climate-related information,
disaggregated by gender and vulnerability
Outcome 2.2 Enabling conditions that enable vulnerable
groups to engage in value chain development
strengthened
2.2.1 % change in productive asset access,
disaggregated by gender and vulnerability
2.2.2 % of vulnerable groups who states that
existing community organizations enhances their
engagement in VCs
Capacity building
programmes for VC
organizations emphasizes
governance
Capacity building
programme for VC
organizations involves
accompanying the VC
organizations for the long
term
Component Three Outcomes

56
NARRATIVE / HIEREARCHY OF OBJECTIVES INDICATORS MEANS OF
VERIFICATION
RISKS AND
ASSUMPTIONS
3.4.1: Inclusive value chain organizations developed 3.4.1.1 % increase in number of actors who are
members of VC organizations, by gender and
vulnerability
3.4.1.2 Proportion of horizontal VC organizations
capable of meeting the production and marketing
needs of their members by gender and
vulnerability
ASDSP / CCU Progress
Reports
MOA reports
Service providers/Operators
reports
3.2.1: Public and private investment in VC development
increased
3.2.1 increase in number and types of investments
under PPP and by VC actors
ASDSP M&E/Progress Report
Beneficiary perception reports
Private sector responds to
opportunities and
incentives provided by
government for
agribusiness
3.2.1: Equitable access to market increased 3.2.1.1 Quantity and Value of agricultural
products marketed
ASDSP / CCU Progress
Reports
Service providers/Operators
reports
Household surveys
Entities created for such
aspects as sanitary,
phytosanitary and food
safety systems are
operating well with
adequate supporting
legislations
3.3.1: Access to affordable financial and insurance
services for value chain actors improved(including
women, youth and other vulnerable groups)
3.3.1.1 % increase in VC actors using financial
services by type, gender and vulnerability
3.3.1.2 % increase in proportion of enterprises
using financial and insurance services of formal
financial institutions
3.3.1.3 % increase in lending portfolio to
agricultural value chain actors
ASDSP / CCU Progress
Reports
Service providers/Operators
reports
Household surveys
3.5.1 Innovative and inclusive value chains and VC
technologies up-scaled and out-scaled.
3.5.1.1 % increase in VC actors engaging in new
VCs and using new VC technologies
ASDSP/CCU Progress
Reports

57
NARRATIVE / HIEREARCHY OF OBJECTIVES INDICATORS MEANS OF
VERIFICATION
RISKS AND
ASSUMPTIONS
OUTPUTS:
Sub-Component 1.1: Sector-wide coordination and
joint programming improved
1.1.1 ASDS coordination institutions strengthened
1.1.2 ASCU supported in soliciting funding for
operation of ASDS coordination mechanism
1.1.3 ASCU supported in establishing joint sector
programming and financing mechanisms
1.1.4 ASCU supported in strengthening DP adherence
with Code of Conduct
1.1.1.1 Functional operational mandates and
procedures exist for NF, ICC, TC, TWG and
ASCU
1.1.2.1 % increase in funding allocated to ASDS
coordination from GoK and DP sources
1.1.3.1 Joint sector programming and financing
mechanism in place
1.1.3.2 No. of DPs funding ASDSP
1.1.4.1 % increase in programmes adhering to
CoC
ASCU Annual Reports
ASCU agrees to do
functional review and
“system strengthening”
DPs willing to support
ASDS-CM and joint
programming
Output 1.1.5: ASDSP coordinating structures
established and operationalized
ASDSP steering, coordination and management
structures in place and functioning in accordance
with sector-wide approach (PSC, CSC, NPS,
CCU)
Operational procedures and guidelines reflecting
ASDSP’s sector-wide approach applied
Technical and operational capacity
ASDSP Progress Reports
Sub-Component 1.2:.Sector institutions and
capacities at all levels strengthened
Output 1.2.1 Capacity of ASDSP coordinating
structures strengthened (individual /Organizational/
Contextual)
1.2.1.1 % ASDSP stakeholders expressing
satisfaction with programme performance
1.2.1.2 Ratio of posts filled by qualified staff
ASDSP / CCU Progress
Reports
Output 1.2.2: Capacity of selected sector institutions of
relevance to ASDSP mandate strengthened (individual
1.2.2.1 % of institutions’ stakeholders expressing
satisfaction with the institutions’ performance
ASDSP / CCU Progress
Reports

58
NARRATIVE / HIEREARCHY OF OBJECTIVES INDICATORS MEANS OF
VERIFICATION
RISKS AND
ASSUMPTIONS
/Organizational/ Contextual) 1.2.2.2 Ratio of posts filled by qualified staff
1.2.2.3 No of institutional capacity plans being
implemented
Capacity survey reports
Beneficiary perception reports
Sub-Component 1.3: Linkages between sector
stakeholders improved
Output 1.3.1: Issued-based partnerships supported
Output 1.3.2: Appropriate technologies developed
1.3.1.1 No. and types of functional partnerships
1.3.2.1. No. of technological packages adopted by
VC actors
ASDSP / CCU Progress
reports.
R/E mapping and gap analysis
report
R/E stakeholders interested
in strengthening of
horizontal and vertical
linkages
Output 1.3.3: Collaboration between key sector agencies
and programmes established
1.3.3.1 No. and types of partnerships
1.3.3.2 No. of sector programmes integrating
operations
1.3.2.3Functioning of TWGs
ASDSP / CCU Progress
reports.
Sub-Component 1.4: Sector-wide M&E and
information management systems developed and
supported
Output 1.4.1: ASCU’s establishment of sector-wide
M&E and information systems supported.
1.4.1.1 Functional sector-wide M&E system and
information systems in use
ASDSP Progress Reports
ICT inventory and gap
analysis report
ASDSP website
ASCU and sector
stakeholders actively
pursue establishment and
usage of sector M&E and
information systems
Output 1.4.2: ASDSP M&E and information system
established
1.4.2.1 Functional ASDSP M&E information
system in use
ASDSP Progress Reports
ASDSP information & M&E
system usage data
Output 1.4.3 Selected sector information management
systems strengthened
1.4.3.1 Functional communication mechanisms
including interactive ICT platforms to provide
agricultural information in use
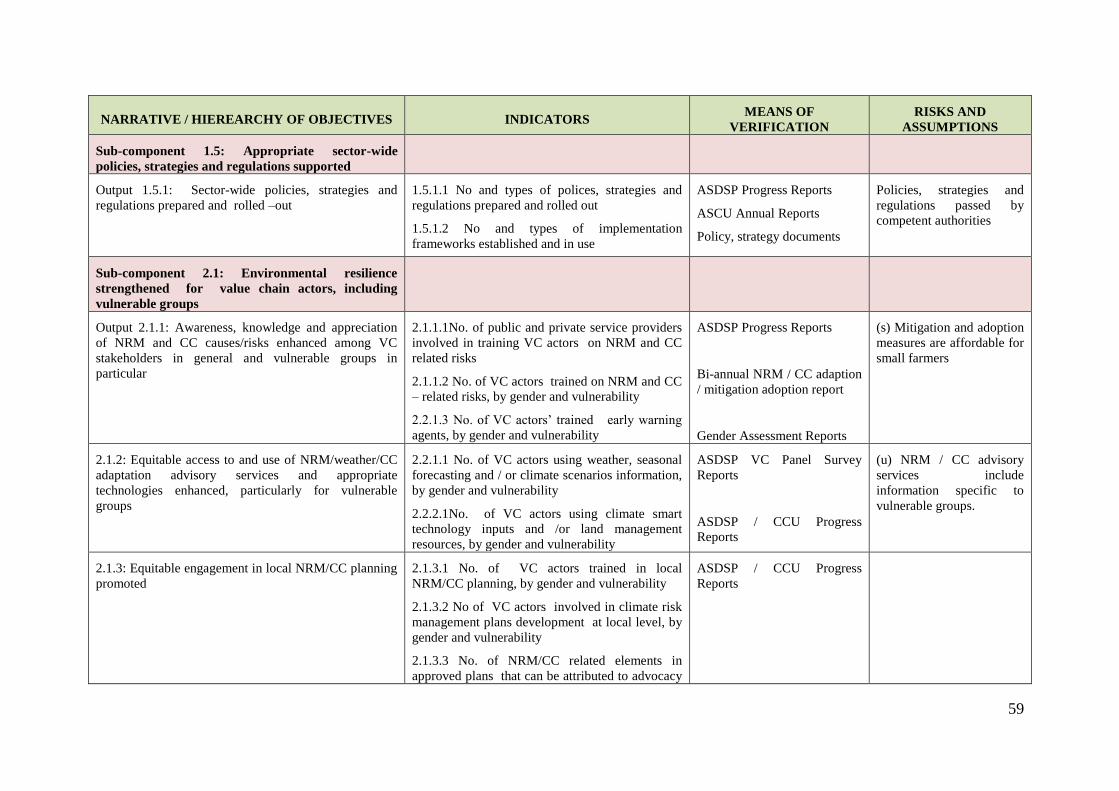
59
NARRATIVE / HIEREARCHY OF OBJECTIVES INDICATORS MEANS OF
VERIFICATION
RISKS AND
ASSUMPTIONS
Sub-component 1.5: Appropriate sector-wide
policies, strategies and regulations supported
Output 1.5.1: Sector-wide policies, strategies and
regulations prepared and rolled –out
1.5.1.1 No and types of polices, strategies and
regulations prepared and rolled out
1.5.1.2 No and types of implementation
frameworks established and in use
ASDSP Progress Reports
ASCU Annual Reports
Policy, strategy documents
Policies, strategies and
regulations passed by
competent authorities
Sub-component 2.1: Environmental resilience
strengthened for value chain actors, including
vulnerable groups
Output 2.1.1: Awareness, knowledge and appreciation
of NRM and CC causes/risks enhanced among VC
stakeholders in general and vulnerable groups in
particular
2.1.1.1No. of public and private service providers
involved in training VC actors on NRM and CC
related risks
2.1.1.2 No. of VC actors trained on NRM and CC
– related risks, by gender and vulnerability
2.2.1.3 No. of VC actors’ trained early warning
agents, by gender and vulnerability
ASDSP Progress Reports
Bi-annual NRM / CC adaption
/ mitigation adoption report
Gender Assessment Reports
(s) Mitigation and adoption
measures are affordable for
small farmers
2.1.2: Equitable access to and use of NRM/weather/CC
adaptation advisory services and appropriate
technologies enhanced, particularly for vulnerable
groups
2.2.1.1 No. of VC actors using weather, seasonal
forecasting and / or climate scenarios information,
by gender and vulnerability
2.2.2.1No. of VC actors using climate smart
technology inputs and /or land management
resources, by gender and vulnerability
ASDSP VC Panel Survey
Reports
ASDSP / CCU Progress
Reports
(u) NRM / CC advisory
services include
information specific to
vulnerable groups.
2.1.3: Equitable engagement in local NRM/CC planning
promoted
2.1.3.1 No. of VC actors trained in local
NRM/CC planning, by gender and vulnerability
2.1.3.2 No of VC actors involved in climate risk
management plans development at local level, by
gender and vulnerability
2.1.3.3 No. of NRM/CC related elements in
approved plans that can be attributed to advocacy
ASDSP / CCU Progress
Reports

60
NARRATIVE / HIEREARCHY OF OBJECTIVES INDICATORS MEANS OF
VERIFICATION
RISKS AND
ASSUMPTIONS
by ASDSP supported VC groups
Sub-component 2.2 Conditions that enable
vulnerable groups to engage in value chain
development strengthened
Output 2.2.1: Access to social protection and security
services by vulnerable groups improved
2.2.1.1 No. of VC actors using social protection
services, disaggregated by gender and
vulnerability
2.2.1.2 No. of service providers providing social
protection and security services
2.2.1.3 No. and range of social protection
services/products provided
ASDSP / CCU Progress
Reports
Output 2.2.3: Community action capability enhanced
through support to establishment and functioning of
community groups/links to local CS agents
2.2.3.1 No. of VC actors involved in decision-
making at local level , by gender and vulnerability
2.2.3.2 No. of functional producer CIGs linked to
VCs
2.2.3.2 No. of community organizations with
internal governance systems
ASDSP / CCU Progress
Reports
Sub-component 3.1: Inclusive value chain
organizations developed
Output 3.1.1: Inclusive linkages along the VCs
improved (vertical and horizontal)
3.1.1.1 No. and types of VC organizations
3.1.1.2 Number of actors who are members of VC
organizations, by gender and vulnerability
3.1.1.3 Number of VC organizations with
functional linkages
CCU Progress Reports
County VC Reports
Output 3.1.2: Value chain organizations’ advocacy and
lobbying capacity strengthened
3.1.2.1 No. and types of issues from the VC
platforms addressed in regulations, plans and
budgets
ASDSP / CCU Progress
Reports
County VC Reports

61
NARRATIVE / HIEREARCHY OF OBJECTIVES INDICATORS MEANS OF
VERIFICATION
RISKS AND
ASSUMPTIONS
Output 3.1.4: VC actors’ business management skills
enhanced.
3.1.4.1 Number of VC actors implementing viable
business plans, by gender and vulnerability
ASDSP Progress reports
County VC Reports
Sub-component 3.2: Public and private investment
in VC development increased
Output 3.2.1: PPPs developed 3.2.1.1 No., type and coverage of infrastructure
projects established under PPP
Output 3.2.2: VC actors’ investment increased 3.2.2.1 No., type and coverage of projects by VC
actors
Sub-component 3.3: Equitable access to market
increased
Output 3.3.1: Access to market information improved 3.3.1.1 No. of VC actors using market
information, by gender and vulnerability
3.3.1.1 No. of VC actors participating in formal
market arrangement
Output 3.3.2 Technical capacity for pre- and post-
production management improved
3.3.2.2 No. of VC actors undertaking value added
initiatives, by gender and vulnerability
3.2.4 No. of VC actors using improved post
production management practices, by gender and
vulnerability
Sub-component 3.4: Access to affordable financial
and insurance services for value chain actors
improved
Output 3.4.1: Access to socially inclusive financial
services strengthened
3.4.1.1 Number of VC actors using financial
services, by gender and vulnerability
3.4.1.2 Number of financial service providers and
type of products
CCU / County VC report
Credit Institution Reports
CCU Progress Reports
Banking sector responds to
opportunities and
incentives provided
through the programme

62
NARRATIVE / HIEREARCHY OF OBJECTIVES INDICATORS MEANS OF
VERIFICATION
RISKS AND
ASSUMPTIONS
Output 3.4.2: Access to agricultural insurance services
strengthened
3.4.2.1 Number of VC actors using insurance
services
3.4.2.2 Number of agricultural insurance service
providers and type of products
CCU Progress Reports
County VC report
Sub-component 3.5: Innovative and inclusive value
chains and VC technologies up-scaled and out-scaled
Output 3.5.1: Capacity of VC actors to identify
promising VCs and VC technologies strengthened
3.5.1.1 No. of promising VCs and best-practice
VC technologies identified
ASDSP Progress Reports
Output 3. 5.2 : Support mechanism for up-scaling and
out-scaling established
3.5.2.1 No. of VCs and best-practice VC
technologies piloted
3.5.2.2 No. and type of VCs and best-practice VC
technologies used

63
ANNEX 2: EVALUATION TOOLS
1. Face to face administered questionnaire
2. Focus Group Discussion Guides for National Level
a. National Programme Secretariat
b. Programme Steering Committee
c. Intergovernmental Secretariat
d. Transformation Secretariat
3. Focus Group Discussion Guides for County Level
a. County Steering Committee
b. County Coordination Unit
c. Value Chain Platform
d. Value Chain Organization
4. Key Informant Interview Guides for National Level
a. Principal Secretary
b. National Programme Coordinator
c. Programme Advisor
d. Development Partners
e. Project Coordinators in MALF
5. Key Informant Interview Guides for County Level
a. County Executive Committee Member
b. County Directors (Agriculture, Livestock, Fisheries, Environment and Natural
Resources)
c. Local Partners

64
ANNEX 3: TOR FOR THE END TERM EVALUATION OF ASDSP
1. AGRICULTURAL SECTOR DEVELOPMENT SUPPORT PROGRAMME
1.1 Background and context
Agriculture is one of the most important economic activity in Kenya contributing 30% to the
Gross Domestic Product. In addition, it accounts for 27% of GDP through manufacturing,
distribution and service sectors, accounts for 65% of the total export earnings and employs
80% of rural workforce and 18% of the formal employment. On the other hand, the economies
of most of Kenya’s 47 counties depend on agriculture. A 2015 World Bank Policy Working
Paper indicates that the average agriculture GDP for all the 47 counties is 51% with Mandera
accounting for the highest proportion at 94%. The crops, livestock and fisheries subsectors
are the main components of the Agricultural sector contributing 72%, 18% and 3% of the
Agricultural GDP respectively.
The importance of the sector is recognized in Vision 2030 as one of the key elements of the
economic pillar that is expected to deliver the vision of a globally competitive and prosperous
nation with a high quality of life. The sector is faced with many challenges and in order to
address these, the government in 2010 developed a road map called the Agricultural Sector
Development Strategy (ASDS) whose mission is to have an “Innovative, Commercially
oriented and Modern Agriculture” by increasing productivity, commercialization and
competitiveness of agricultural commodities and enterprises; and, developing and managing
the key factors of production. The ministry of agriculture then developed programmes and
project that were to deliver on this strategy. One of these major programmes developed in
2012 is the Agricultural Sector Development Support Programme financed by Government of
Kenya and Government of Sweden and implemented in all 47 counties.
1.2 Agricultural Sector Development Support Programme (ASDSP)
ASDSP is a five year programme implemented by the Government of Kenya, with the
assistance of the Government of Sweden for an initial 5 year period running from January
2012 to December 2016. Although the programme is a national programme, it is implemented
in all 47 counties and involves other stakeholders in the implementation of activities.
The overall goal of the programme is to transform Kenya’s agricultural sector into an
innovative, commercially oriented and modern industry that will contribute to poverty
reduction, improved food security and equity. The programme purpose is to ‘increase
equitable income, employment and improved food security of male and female target groups
as a result of improved production and productivity in the rural smallholder farm and off-
farm sectors’. The programme planned to use three strategies in order to realize the objective.
These strategies are also referred to as programme components:
i. Development of a transparent system for improved agricultural sector coordination and
harmonization and an enabling policy and institutional environment for the realization of the
ASDS
ii. Strengthening of the environmental resilience and social inclusion in VCs
iii. Promotion of viable and equitable commercialization of the agricultural sector through VCD
Under each of the strategies, the programme was to carry out specific activities that were
expected to produce outputs, sub-outcomes and outcomes. Moreover, an institutional setup for

65
the management of the programme implementation was put in place where the National
programme Steering Committee was constituted to give the overall implementation direction.
At the national level, a programme secretariat composed of competent experts responsible for
the different components was set up while a coordinating unit with adequate and competent
staff was established in each of the 47 counties.
The programme was to adopt a results-based implementation approach that entails monitoring
the implementation of programme activities under the three components and linking them with
the component outcome and sub-outcome indicators and intervention objective as detailed in
the programme log frame. A monitoring and evaluation system was also part of the tools to be
developed by the programme to enhance programme efficiency and effectiveness. This
included the development of a Monitoring and information system to enhance management of
the information generated so as to enable the programme managers to routinely track the
progress and performance of components over time in a uniform way across all the counties
and priority VCs.
A midterm review of the programme was carried out in 2014/15 with the programme
responding by putting up a response plan on the more serious issues that were seen to be
important in programmes roadmap to realization of objectives.
The programme is coming to an end in December 2016 (but there are plans to extend it to June
2017 to allow for the completion of the activities that resulted from delayed start and changes
in the institutional set up in the sector brought about by devolution) and there is a need to
carry out and end of term evaluation as part of the fulfilment of the agreement and more
importantly for accountability purposes.
2. PURPOSE AND TARGET AUDIENCE
The overall objective of the end of term evaluation is to assess the changes the programme has
created among the stakeholders with a view to gaining a better understanding of its
performance, and to identify areas for improvement in the succeeding future programmatic
action. It is therefore important for ASDSP partners including the GoK, SIDA, and
stakeholders to establish what results have been achieved with the funds and efforts invested.
Lessons and recommendations from the findings will also be used to improve the focus and to
deepen Phase II programming. The primary users of the findings will be ASDSP, relevant
project partners, the national and county governments’ agriculture stakeholders, the
Evaluation Team, SIDA and development partners.
2.1 Objective and Scope of evaluation
Objective: The objective of the evaluation is to establish the impacts the programme has
created by analysing the implementation mechanism applied during the last five years.
Scope: The evaluation will focus on the period between Jan 2012 to October 2016with a focus
on a holistic programmatic approach. It will examine programmatic aspects such as coherence
of the portfolio in line with ASDSP’s objectives and national priorities, organizational
context, procedures, governance structures and management issues, including
programme/project cycle management, as well as strategic partnerships. It is also expected
that the evaluation will propose potential areas and partnerships in the counties, as well as
emerging high value opportunities and priorities such as those that address mainstreaming of
gender, poverty and environmental issues. The evaluation will also assess a critical sample of

66
ASDSP project aspects across each of its strategic objectives, to inform the overall
performance of the programme. It will therefore cover all counties through sampling of
counties based firstly on geographical location and secondly based on common VCs. The
evaluation shall target all the stakeholders with emphasis on VCAs and service providers
tempered with gender and youth considerations. The evaluation shall, within the framework of
the three components:
i. Establish the programme outreach in all the programme manifestation;
ii. Establish the programme impacts;
iii. Establish programme outcomes and sub-outcomes (immediate); and
iv.Establish programme outputs
3. METHODOLOGY
The exercise will entail a combination of typical evaluation combined with beneficiary
assessment with special focus on the changes that the programme has created on the
beneficiaries. The approach will therefore be a combination of desk review of available
documentation and data, and interviews with different programme stakeholders with special
emphasis to beneficiaries and implementers. A representative sample of relevant stakeholders
at national level as well as counties will be used. The desk review on the other hand will look
at the programme documents, logframe, progress reports, studies, monitoring data and reports
from the programme. During desk review, other relevant documentation such as ASDS and
sector policies and other documents relevant to programme shall be reviewed. The evaluation
will:
i. Review the programme documents with a view to developing samples that will be used to evaluate
various aspects of the scope of evaluation.
ii. Develop suitable criteria for selection of sample counties in consultation with NPS
iii. Develop suitable criteria for selection of interviewees for each of the specific objectives
iv.Develop a suitable data collection tool (questionnaire)
v.Use focus group discussions
vi.Use individual interviews
vii. Make direct observations
viii. Review documented evidence from interviews
ix.Document case studies on evaluated outcomes
x.Develop criteria for selecting interviewers
xi.Conduct analysis of relevant stakeholders
xii. Hold stakeholder workshops to validate the findings
4. TEAM COMPOSITION
Considering ASDSP is a rural development programme, there is need to have specialists in the
following fields;
i.Monitoring and evaluation experts – two in number
ii. Policy and institutional experts – two
iii. Value chain development expert –two
iv.Social development specialist with experience in youth and gender mainstreaming in programmes -
two
v.Interviewers –team to determine depending on the sample counties these could include an M&E
expert, VCD expert and a community mobilizer and any other relevant expert.
5. EXPECTED DELIVERABLES

67
Although the final product is an evaluation report, the exercise entails development of tools
for evaluation that will be reviewed by the task steering team. The following information shall
be developed and discussed with the steering team.
i. Inception Report (and Work plan) – include consult with Steering committee
ii. Samples established for the evaluation
iii. Criteria for the selection of interviewees
iv.List of interviewees
v.Checklist for collection of information from all sources
vi.Data collection and analysis tools
vii. Report outline
viii. Draft report for stakeholder validation
ix.Final report
x.Slide presentation of major evaluation findings –max 20 slides
xi.At least six documented case studies as separate reports (1 per component, rest on VCs)
6. DURATION OF EVALUATION
The exercise will take 45 days starting in early November 2016 and ending late January 2017.
45 days will be allocated as follows
Planning -10 days
Field work -15 days
Data analysis and reporting -20 days
7. MANAGEMENT ARRANGEMENTS
A steering committee composed of representative from the CEC caucus and Project Steering
Committee will provide the overall oversight of the evaluation exercise. An evaluation task
team of 9 experts will be formed drawn from the departments of MAOLF monitoring units as
well from other directorates. This will be the team that will be responsible for the evaluation.
As an internal evaluation, the Evaluation Team will select interviewers in the sampled
counties who will be sensitized and do the data collection at the respective counties. ASDSP
will provide all logistical support as well as liaison between oversight team, the evaluation
team and CCUs sampled. ASDSP to second a specialist to the evaluation team.
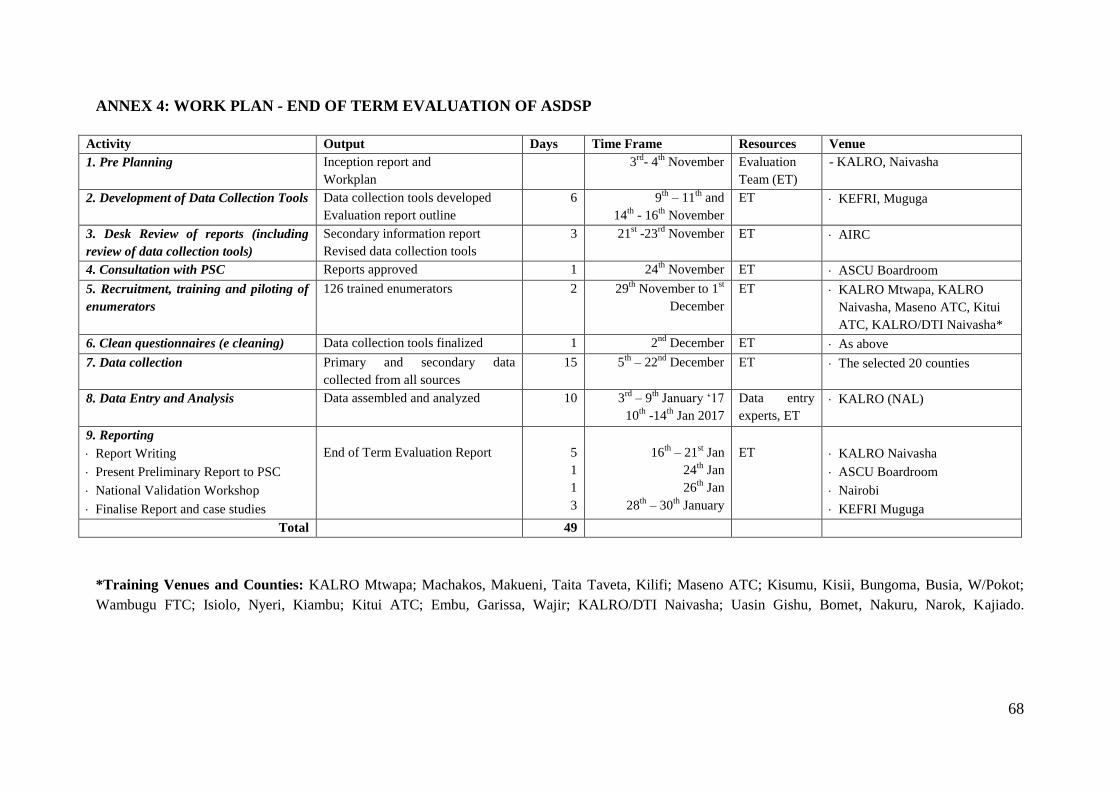
68
ANNEX 4: WORK PLAN - END OF TERM EVALUATION OF ASDSP
Activity Output Days Time Frame Resources Venue
1. Pre Planning
Inception report and
Workplan
3rd
- 4th
November Evaluation
Team (ET)
- KALRO, Naivasha
2. Development of Data Collection Tools Data collection tools developed
Evaluation report outline
6 9th
– 11th
and
14th
- 16th
November
ET KEFRI, Muguga
3. Desk Review of reports (including
review of data collection tools)
Secondary information report
Revised data collection tools
3 21st -23
rd November ET AIRC
4. Consultation with PSC Reports approved 1 24th
November ET ASCU Boardroom
5. Recruitment, training and piloting of
enumerators
126 trained enumerators
2 29th
November to 1st
December
ET KALRO Mtwapa, KALRO
Naivasha, Maseno ATC, Kitui
ATC, KALRO/DTI Naivasha*
6. Clean questionnaires (e cleaning) Data collection tools finalized 1 2nd
December ET As above
7. Data collection
Primary and secondary data
collected from all sources
15 5th
– 22nd
December
ET The selected 20 counties
8. Data Entry and Analysis Data assembled and analyzed 10 3rd
– 9th
January ‘17
10th
-14th
Jan 2017
Data entry
experts, ET
KALRO (NAL)
9. Reporting
Report Writing
Present Preliminary Report to PSC
National Validation Workshop
Finalise Report and case studies
End of Term Evaluation Report
5
1
1
3
16th
– 21st Jan
24th
Jan
26th
Jan
28th
– 30th
January
ET
KALRO Naivasha
ASCU Boardroom
Nairobi
KEFRI Muguga
Total 49
*Training Venues and Counties: KALRO Mtwapa; Machakos, Makueni, Taita Taveta, Kilifi; Maseno ATC; Kisumu, Kisii, Bungoma, Busia, W/Pokot;
Wambugu FTC; Isiolo, Nyeri, Kiambu; Kitui ATC; Embu, Garissa, Wajir; KALRO/DTI Naivasha; Uasin Gishu, Bomet, Nakuru, Narok, Kajiado.

69
ANNEX 5: LIST OF EVALUATION TEAM MEMBERS
1. Mr. James Tendwa; Team Leader, Project Management, Monitoring and
Evaluation
2. Dr. Charles Ochodo; Agriculture policy and research methods, Data Analyst
3. Dr. Diana Mobagi; Environmental Expert and Research methods
4. Mr. Vincent Githinji; Value Chains
5. Ms. Judith Amadiva; Social Development Expert, Youth and Gender Issues
6. Mr. David Nyamai; Agricultural Economist, Data Analyst
7. Mr. Bernard Mwangangi, Agricultural Economist
8. Dr. Patrick M. Mwanyumba; Monitoring and Evaluation Expert, Production
Systems Expert
9. Ms. Mary Nduru; Agricultural advisory services and partnerships
10. Dr. Michael Obora; Agricultural Policy and research methods
11. Ms. Rosemary Magambo; Monitoring and Evaluation Expert, Gender Expert,
Liaison Officer.

70
ANNEX 6: LIST OF PERSONS MET
NATIONAL LEVEL
NAME OF RESPONDENT INSTITUTION/ORGANIZATION DESIGNATION/POSITION
Dr. Richard Lesiyampe State Department for Agriculture Principal Secretary
Professor Japheth Micheni Ntiba State Department of Fisheries and the Blue Economy
Principal Secretary
Dr. Andrew Tuimur State Department for Livestock Principal Secretary
Lucy Muchoki Kenya Agribusiness and Agro-industry Alliance Chief Executive Officer
Phoebe Odhiambo ASDSP National Programme Coordinator
Mikael Segeross ASDSP Programme Advisor
Francis Muthami KAPAP National Project Coordinator
Duncan Marigi SIDA
Rymer Sikobe NAAIAP Deputy Project Coordinator
Daniel Keter Smallholder Dairy Commercialization Programme SADLP/SDL
Elias Kahla UNDP
Andrea Ferrero EU
Shadrack Mutavi GIZ
Moses Abukari IFAD
Beatrice Akunga Transformation Secretariat Coordinator
Henry Ngeno Transformation Secretariat Representative, SDL
David Njogu Intergovernmental Secretariat Representative, SDL
David Ojigo Intergovernmental Secretariat Representative, SDL
Rosemary Magambo ASDSP Monitoring and Evaluation Specialist
Shadrack Kipkemoi ASDSP Natural Resource Management Specialist
Maren Bwana ASDSP Partnerships Development Specialist
Kennedy Olwasi ASDSP
Bernard Mwangangi ASDSP
Rosemary Ndunge ASDSP Value Chain Development Specialist
Monica Olala ASDSP Social Inclusion Specialist
BOMET COUNTY
David Korir CCU/CSC Member
Job Sitienei CCU/CSC Member
Agnes C. Ngeno CCU/CSC Member
Moses Morindat CCU/CSC Member
Josephat Kereto CCU/CSC Member
Sogu Serem CCU/CSC Member
Everlyne C. Mwangani CCU/CSC Member
David Korir CCU/CSC Member
JenifferNgeny Value Chain Platform Member
Joel Koskei Value Chain Platform Member
Daisy Rutoh Value Chain Platform Member

71
Henry Kimi Value Chain Platform Member
Edwin Chelule Value Chain Platform Member
Wesley Langat Value Chain Platform Member
Wesley Martin Value Chain Platform Member
Zephaniaf K Korir Value Chain Platform Member
Philiph K. Mosonik Value Chain Platform Member
Cherotich E. Mwangange Value Chain Platform Member
Job Sitieney Value Chain Platform Member
David Korir Value Chain Platform Member
Koech Victor Kenneth Value Chain Platform Member
Robert Ngeno County Government DDA
Joylene Koskei County Government DD Coop
Cosmas Korir County Government Director Vallue Addition
Stanley Martim County Government CO
Beatrice Kirui County Government CES
Josephat Kereto ASDSP Coordinator
BUNGOMA COUNTY
Laurian K. Kollikho County Government CEC Member for Agriculture, Livestock, Fisheries, Irrigation and Crops
Constantine Khundu Khisa Chebukwa Agro vet (Agro input supplier) Proprietor
Maurice Juma Kenya Integrated Agricultural Initiatives Manager
CPA Kalawanga Mwalati County Government Deputy Director of Revenue, Ministry of Finance and Economic Planning
James Shamala Agricultural Finance Corporation Branch Manager
Godfrey Wanjala DAPOS Dairy Youth Group (Value Chain Organization - Producer, Processor and Trader)
Coordinator
Isaya K. Masinde County Coordination Unit and County Steering Committee
Member
Nassir Wekesa CCU/CSC Member
Kennedy Ochieng’ CCU/CSC Member
Vincent Wechabe CCU/CSC Member
Beatrice Azegele CCU/CSC Member
Johnston Nyongesa CCU/CSC Member
Eric Nabwana CCU/CSC Member
David Nyanyende CCU/CSC Member
Moses Munialo CCU/CSC Member
Samson Kunyu CCU/CSC Member
Fedrick Wotia CCU/CSC Member
I.K. Chepkwony CCU/CSC Member
Beatrice Kololi Value Chain Platform Member
Jomo Masai Value Chain Platform Member
Harrison Maina Value Chain Platform Member
Plantine Mwelu Value Chain Platform Member
Violet Nasimiyu Value Chain Platform Member
Hellen Muyobo Value Chain Platform Member
Fred Mamboleo Value Chain Platform Member

72
Anne Ombwayo Value Chain Platform Member
Arthur Aduvaga Value Chain Platform Member
BUSIA COUNTY
Moses Osia Mwanje County Government CEC Agriculture, Livestock and Fisheries
James Miring’u Hand in Hand, Eastern Africa Branch Manager, Busia
Dennis Chirande County Government Principal Environment and Natural Resources Officer
John Ohato County Government County Director of Veterinary Services
Francis Onyango Busia Fish Traders Multipurpose Cooperative Society
Chairman
Patrick Odunga CCU/CSC Member
Benjamin Bahati CCU/CSC Member
Benedict Musumba CCU/CSC Member
Betty Sakwa CCU/CSC Member
Jane Were CCU/CSC Member
Tasisi Odongo CCU/CSC Member
Enock Tallam CCU/CSC Member
Nasaka Wekesa CCU/CSC Member
Wellington Ollinga CCU/CSC Member
Fredrick Obonyo Kuku Self Help Group (VCO - Traders) Member/Chairman
Vincent Adungo As above Member/Secretary
Batholomew Mulu As above Member/Treasurer
Fredrick Irari Value Chain Platform Member
Alex Ouma Abwao Value Chain Platform Member
Roselyne Agutu Value Chain Platform Member
Godrick Opaiw Ouma Value Chain Platform Member
Philemon Imoo Imojer Value Chain Platform Member
Silas Ichelai Value Chain Platform Member
Pius W. Okomba Value Chain Platform Member
Julie Marungu Value Chain Platform Member
Florence Imodo Value Chain Platform Member
EMBU COUNTY
Julius M'Jtonga County Coordination Unit Member
Alvan Gatumo County Coordination Unit Member
Patrick Mutiiria County Coordination Unit Member
Dr. J. Wanganga County Veterinary services County Head of Veterinary services
Justin I Nyaga County Fisheries County Head of Fisheries
Augustus M' Kiema County Livestock- Dairy cow VC Project Management Team
Member
Hezekiah Nyaga SSDMF- Dairy cow VC Project Management Team Member
Susan Gicheha Equity Bank Embu-Value chain Platform Member
Dr. J. N. Kamau County Coordination Unit Member
John N. Nyaga County Head of Agriculture- Value chain Platform Member
John Nguyo Director Kenya Meteorological services-Value chain Platform
Member
Joan Nyakowa Kenya Dairy Board- Value chain Platform Member

73
Catherine Muriithi KALRO- Value chain Platform Member
Peter Ihuthia County Coordination Unit ASDSP-Coordinator
A. M Kanyotu County Livestock- Dairy cow VC Project Management Team
Member
Lydia Karimi Njeru Manyatta Agrovet-Value chain Platform Member
Charles Kinyua Njagi Mkulima Bora Dairy Cooperative society Producer-Value chain Platform
Member
Esther Ruguru Njeru Emanuel Dairy Processors-r-Value chain Platform Member
Halima Wachuka Makengi Dairy Producer-Value chain Platform Member
James Njeru Youth Pride Processor-Value chain Platform Member
Eunice Mukami Mugo Runyenjes Agrovet-Value chain Platform Member
GARISSA COUNTY
Pius K.Mang’ee County Coordination Unit VCDO
Kimemia David County Coordination Unit ERSIO
Okon A. Guhad County Steering Committee Member
Dola Mohamed Beef Value Chain Platform Member
Yussuf M. Abdille Camel milk Value Chain Platform Member
Gabow Hassan Adan Tomato Value Chain Platform Member
Abdikadir Abdi County Livestock Marketing Council (Beef VC) Program Officer-local partner
Dahir Dubat Tomato Value Chain Platform Member
Ahmed A. Hassan County Coordination Unit Coordinator
Khalif Hassan Unique Camel Milk Products (UCP Ltd) Director
Amina Abdi Tomato Value Chain Platform Member
Abdullahi Noor Beef Value Chain Platform Member
Jonah Mburu County Coordination Unit M&EO
Yustur Farah Camel Milk Value Chain Platform Member
Hawa Dekow Ali Community Owned Financial Initiatives (COFI) SACCO LTD- Supports Beef & Camel Milk VCs
Program Officer-local partner
Dubat A. Amey County Steering Committee Vice Chair
Bashir A. Muhumed Department of Agriculture-County Government of Garissa
Chief officer
Robert Masyara County Coordination Unit ICDO
ISIOLO COUNTY
Ali Dima County Chief Officer, MALF, Isiolo County
Jamal Abdulaziz Pastoralist Capacity Development Program (PACDEP)-
Hassan Abdikadir Chairman, County Livestock Marketing Council
David Chege Mbui Public Health Officer
Dr. Joseph N Githinji CCU/CSC Member
Florence Mwangangi CCU/CSC Member
Steve Machan CCU/CSC Member
Mohamed Dokata CCU/CSC Member
Miriti JM CCU/CSC Member
Sadia Mohamed CCU/CSC Member
Simon Leiroya CCU/CSC Member
Mohamed Noor Somo CCU/CSC Member

74
SeclasoTuke CCU/CSC Member
Ismail Tarso CCU/CSC Member
Steve Machan CCU/CSC Member
Mamuna Mohamed CCU/CSC Member
Bokoo Wako CCU/CSC Member
Quresho Hassan CCU/CSC Member
Sofia Kullow CCU/CSC Member
Amina Ibrahim CCU/CSC Member
CeciliahKinyua CCU/CSC Member
Hussein Halake CCU/CSC Member
KAJIADO COUNTY
Leonard Ritei County Government Chief Officer, MALF
Jane Karanja County Government County Commissioner of Cooperatives
Eric Ahenda County Government County Range Officer
Faith Mpoke Plan International Project Coordinator
Paul Gicheru SACDEP Program Coordinator
Fredrick O Ndiga CCU/CSC Member
DrMigwi F K CCU/CSC Member
Daniel Nyagaka CCU/CSC Member
Elisha Kiura CCU/CSC Member
Duncan Swiwa CCU/CSC Member
Samuel Wanganga CCU/CSC Member
Peter Nyakundi CCU/CSC Member
Halima Nenkari CCU/CSC Member
Hillary Chege CCU/CSC Member
Shaban Barasa CCU/CSC Member
Miriam Pushati Value Chain Platform, Masaai Kjd W Co-op Member
David Ole Nchavi Value Chain Platform, OrmaaKajiado Co-operative Member
Lawrence Tilikia - Member
Jeremiah Rombo Value Chain Platform, B/V Chain Member
RacholSantamo Value Chain Platform, Kule Dairy Co-op Society Member
Philip Patinan Value Chain Platform, MYEP Member
Paul Gicheru Value Chain Platform, SACDEP-Kenya Member
Moses Ole Kinaya Value Chain Platform, Beef Value Chain Member
LengenNdula Value Chain Platform, MWD Member
Fredrick N Kariuki Value Chain Platform, Namanga Dairy Co-op Member
KIAMBU COUNTY
John Njenga County Government County Chief Officer, MALF
Paul Marutit Hand-in-Hand Field Officer
Ruth Mbitu Micro-Finance, K-Unity Head,
Annastacia Vyalu County Government County Environment Officer, NEMA
Charles Mundia Value Chain Platform, Banana Value Chain Member
Joan Gathoni Dorothy Value Chain Platform, Banana Value Chain Member

75
Godfrey Kinyanjui Value Chain Platform, Indigenous Chick Hatchers Member
Lydia Mariga Value Chain Platform, PMT-DCMRC Member
Paul Njoroge M Value Chain Platform, Githunguri Dairy Member
Faith W Kariuki Value Chain Platform, ALF/Banana VC PMT Member
Raphael ChegeWaweru Value Chain Platform, Mangu Processing Dairy Farmers
Member
Oliver WambuiNjoroge As above Member
Gabriel KariukiNju As above Member
Daniel NgureKabubi As above Member
Phyllis W Gitau As above Member
Michael NdunguGithua As above Member
Annie Koimburi CCU/CSC Member
Regina Ciira CCU/CSC Member
Michael Oyugah CCU/CSC Member
Thomas N Chege CCU/CSC Member
EphrahimMathenge CCU/CSC Member
Dr. David Irungu CCU/CSC Member
Abigail Taabu CCU/CSC Member
KILIFI COUNTY
Baha Nguma Department of Agriculture, Livestock and Fisheries Chief Officer
Elina Vidzo Shehe ABEC VCO Member
Lydia Mwaka Mwasambu ABEC VCO Member
Llian Dama Ziro ABEC VCO Member
Onesmus K. Saleh ABEC VCO Member
Peter Janaro ABEC VCO Member
Edward Charo Imarika SACCO Local partner
Mercy Rewe CSC Member
Ngugi Ticha CCU Member
Onesmus Mwanzau CCU Coordinator
Margaret K. Jefwa CSC Member
Caroline N. Farra CCU M&E Officer
Paul Mwadime CCU Member
Gideon Wambua CSC Member
Dr. Donald M. Kitti CSC Member
Leonard M. Kioko Indigenous chicken - VCP Member
Godwin M. Mugira Cassava - VCP Member
Regina Chishenga Indigenous chicken - VCP Member
Jane M. Kanamu Cassava - VCP Member
KISII COUNTY
Vincent Sagwe County Government CEC Agriculture, Livestock, Fisheries and Cooperative Development
John Ndege County Government County Director of Livestock Production
Robin Oyugi Equity Bank Entrepreneurship, Literacy and Agribusiness Trainer

76
Nathan Soire County Government County Director of Agriculture
John Ndege County Government County Director of Livestock Production
Charlotte Mwende Value Chain Platform Member
Bernard Ondieki Value Chain Platform Member
Alice Magoba Value Chain Platform Member
Ruth Mwango Nyanchiri Value Chain Platform Member
Dominic Simbe Value Chain Platform Member
Julius Khisa CCU/CSC Member
David O. Mayanya CCU/CSC Member
George Bosire CCU/CSC Member
Protus W. Khisa CCU/CSC Member
Edwin Muga CCU/CSC Member
John W. Wairia CCU/CSC Member
George Magoba Nyamwansu Banana Growers Self Help Group (VCO – Producers and Traders)
Member/Chairman
Richard Mang’era Abiero As Above Member/Vice Secretary
Herber Abuya As Above Member/Secretary
Theresa Muro As Above Member
Alice Magoba As Above Member
Edwin Mayaka As Above Member
KISUMU COUNTY
Christine Otieno Value Chain Platform Member
Christine Okode Value Chain Platform Member
Fred Odudo Value Chain Platform Member
Beatrice Odongo Value Chain Platform Member
Drin Abuto Value Chain Platform Member
Isaac O. Dawo CCU/CSC Member
Jonam R. Etyang CCU/CSC Member
M. N. Makori CCU/CSC Member
Alfred Ajulu CCU/CSC Member
Odhiambo GE CCU/CSC Member
Sylvester Oketh CCU/CSC Member
Benjamin anger CCU/CSC Member
Abisai Nandi Farmways K Ltd Director
Peter Oduor Endelevu Community Dev Service (ECODS) Programme Director
Antony Saisi Aura NEMA County Director of Environment
Arthur Oduor KALRO Technical Officer
Dr. Eunice Ogola AWAPH Chief Exective Officer
MACHAKOS COUNTY
Dr. Waweru D.E.M Veterinary Section County Veterinary Officer
Malo Nzioka KALRO Researcher
Onesmus Musyoki UTS
Silas Muthuri ICRAF
D. Mativo Department of Agriculture, Livestock and Fisheries Chief Officer
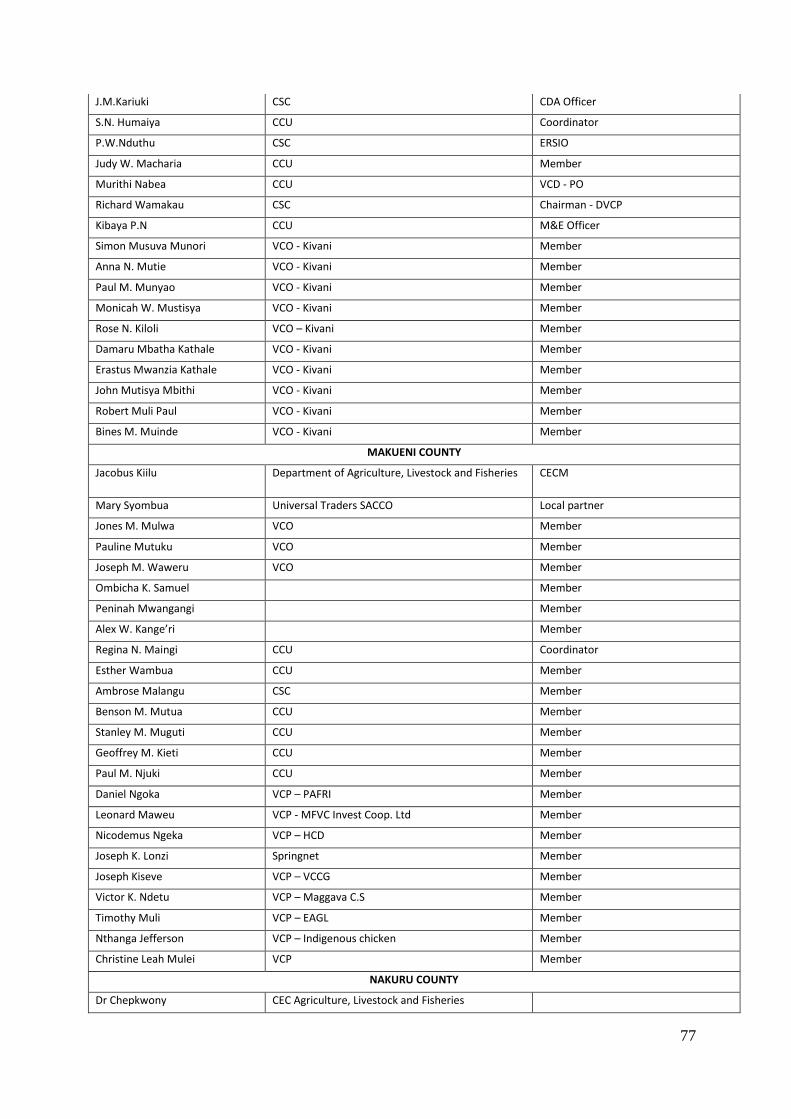
77
J.M.Kariuki CSC CDA Officer
S.N. Humaiya CCU Coordinator
P.W.Nduthu CSC ERSIO
Judy W. Macharia CCU Member
Murithi Nabea CCU VCD - PO
Richard Wamakau CSC Chairman - DVCP
Kibaya P.N CCU M&E Officer
Simon Musuva Munori VCO - Kivani Member
Anna N. Mutie VCO - Kivani Member
Paul M. Munyao VCO - Kivani Member
Monicah W. Mustisya VCO - Kivani Member
Rose N. Kiloli VCO – Kivani Member
Damaru Mbatha Kathale VCO - Kivani Member
Erastus Mwanzia Kathale VCO - Kivani Member
John Mutisya Mbithi VCO - Kivani Member
Robert Muli Paul VCO - Kivani Member
Bines M. Muinde VCO - Kivani Member
MAKUENI COUNTY
Jacobus Kiilu Department of Agriculture, Livestock and Fisheries CECM
Mary Syombua Universal Traders SACCO Local partner
Jones M. Mulwa VCO Member
Pauline Mutuku VCO Member
Joseph M. Waweru VCO Member
Ombicha K. Samuel Member
Peninah Mwangangi Member
Alex W. Kange’ri Member
Regina N. Maingi CCU Coordinator
Esther Wambua CCU Member
Ambrose Malangu CSC Member
Benson M. Mutua CCU Member
Stanley M. Muguti CCU Member
Geoffrey M. Kieti CCU Member
Paul M. Njuki CCU Member
Daniel Ngoka VCP – PAFRI Member
Leonard Maweu VCP - MFVC Invest Coop. Ltd Member
Nicodemus Ngeka VCP – HCD Member
Joseph K. Lonzi Springnet Member
Joseph Kiseve VCP – VCCG Member
Victor K. Ndetu VCP – Maggava C.S Member
Timothy Muli VCP – EAGL Member
Nthanga Jefferson VCP – Indigenous chicken Member
Christine Leah Mulei VCP Member
NAKURU COUNTY
Dr Chepkwony CEC Agriculture, Livestock and Fisheries

78
Grace Kirui CCU/CSC Member
Dr. Alice Wanjama CCU/CSC Member
Isaac Saitoti CCU/CSC Member
Peter M.Kimani CCU/CSC Member
Caleb Kisienye CCU/CSC Member
Mary W. Kanyi CCU/CSC Member
George O. Ogola CCU/CSC Member
Peter Waweru Sustainable Practical Programme for Africa (SUPPA) Chief Executive Officer
Mary W. Kaigi Kenya Livestock Breeders Organization Data Clerk
Alex KaranjahKirikah Value Chain Organization (Wanyororo Dairy Producers Cooperative Society)
Memeber
Florence Macharia As above Memeber
Samwel Mwangi As above Memeber
Francis Wanyama As above Chairman
Harun Ndegwa As above Manager
NAROK COUNTY
Collins K. Lepisoo ASDSP Value Chain Development Officer
Agnes J. Chepkorir KDB Dairy Inspector
Peter K. Runanu ASDSP County Director
Vincent O Ogembo ASDSP DCDA Agribusiness
Anthony Munyao ASDSP Coordinator
Shem Okora CCU/CSC Member
Amos Chelule CCU/CSC Member
Grace Mugo CCU/CSC Member
Eunice Kioni CCU/CSC Member
Joseph Mutinda CCU/CSC Member
Peter Karani CCU/CSC Member
Joyce MIyogo CCU/CSC Member
Maurice Suji CCU/CSC Member
Evans Nyanumba CCU/CSC Member
Vincent 1 Kinyua CCU/CSC Member
BenardNjau CCU/CSC Member
Anthony Munyao CCU/CSC Member
Hoseah Ole Nkolee Value Chain Platform Member
NicksonSabaya Value Chain Platform Member
Fredrick Saitoti Value Chain Platform Member
Simon Ole Poror Value Chain Platform Member
Joseph Masikonote Value Chain Platform Member
John KoilekenSepele Value Chain Platform Member
Joseph O. Ayieko Value Chain Platform Member
Francis Kunyanga Value Chain Platform Member
Sylvia Muthama Value Chain Platform Member
NYERI COUNTY
Robert Thuo County Government CEC MALF
Eric Muita Agricultural Finance Corporation Branch Manager

79
Paul Mwangi Kieni West Broker
Moffat Mugo Kamau Systemic Consultants Managing Director,
S M Mutuota CCU/CSC Member
John N Karuma CCU/CSC Member
Caroline W M CCU/CSC Member
Rebecca W Mwitu CCU/CSC Member
Lucy Chege CCU/CSC Member
Teresa Kinyungu CCU/CSC Member
Francis Njiru CCU/CSC Member
Alice Mosritu CCU/CSC Member
Francis Nguatah CCU/CSC Member
Peter Nduginya CCU/CSC Member
James King’ori CCU/CSC Member
EutipasKabui CCU/CSC Member
Allan Wahome CCU/CSC Member
Virbiwin W Chege CCU/CSC Member
Alice N Kiberenge CCU/CSC Member
Teresa Kinyungu CCU/CSC Member
Wamani R N CCU/CSC Member
Lucy Chege CCU/CSC Member
TAITA TAVETA COUNTY
UASIN GISHU COUNTY
Victoria Tarus County Government Chief Officer, Ministry of Agriculture, Livestock and Fisheries
Nicholas Rop University of Eldoret Chairman, Department of Seed, Crop and Horticultural Sciences
Stanley Kimutai Sang Kapteldon Horticultural Farmers (VCO - Producers) Member/Chairman
Hosea Kimutai As Above Member/Secretary
Linah Koech As Above Member
Elizabeth Idoros As Above Member
Rael Chumba As Above Member
Agnes Kosgei As Above Member
J. Korir As Above Member
Samuel Kisorio As Above Member
Godwin Sang As Above Member
Roda Arusei As Above Member
Anna Kerich As Above Member
Emmanuela Sang As Above Member
Kennedy Kirui Value Chain Platform Member
Samuel Kiptoo Misoi Value Chain Platform Member
Simon Sorgok Value Chain Platform Member
James Nyambane Value Chain Platform Member
Moses Keitany Value Chain Platform Member

80
Soy Cherotich Value Chain Platform Member
Isaak Bwambok Value Chain Platform Member
Elizabeth Yegon CCU/CSC Member
Ali Ramtu CCU/CSC Member
Eliud Makhoha CCU/CSC Member
John Kemei CCU/CSC Member
Peter Rop CCU/CSC Member
Peter Shitoga CCU/CSC Member
Leah Boit CCU/CSC Member
Rael Kirui CCU/CSC Member
WEST POKOT COUNTY
William Lokira County Government CEC Agriculture, Livestock, Fisheries and Irrigation
Philippine Chepkoech Kidul Jitokeze – Partner, Nongovernmental organization Director
Emmanuel Lomwatum County Livestock Marketing Council Programme Assistant
William Lokira County Government CEC Agriculture, Livestock, Fisheries and Irrigation
Philippine Chepkoech Kidul Jitokeze – Partner, Nongovernmental organization Director
Emmanuel Lomwatum County Livestock Marketing Council Programme Assistant
Nancy Burini CCU/CSC Member
Victor Namboka CCU/CSC Member
Lazarus Wanjala CCU/CSC Member
Isaac Yarapuo CCU/CSC Member
Caroline Misiko CCU/CSC Member
John Maina CCU/CSC Member
Peter Odhiambo Owoko CCU/CSC Member
Michael Yaratudo Yangatasapon Self Help Group (Value Chain Organization – Producers, Traders)
Member/Chairman
Emmanuel Loriso As Above Member/Secretary
Hillary Kalicheche As Above Member
Christopher Mertaker As Above Member
Roselyne Cheyech As Above Member
Wilson Kutto As Above Member
Philip Chepisen As Above Member
Ambrose Kiprop As Above Member
Elizabeth Ngimor Value Chain Platform Member
William Morei Value Chain Platform Member
Esther Maiywo Value Chain Platform Member
Abraham Tireno Value Chain Platform Member
Michael Yaratudo Value Chain Platform Member
Musa Lelterit Value Chain Platform Member
Joseph Kalicheche Value Chain Platform Member
Isaac Yarapuo Value Chain Platform Member