PROFITABLE | SUSTAINABLE | STAKEHOLDERS | GROWTH
MINERAL RESOURCES AND MINERAL RESERVES REPORTfor the year ended 30 June 2017
PAR Mr&MR FULL report FA.indd APAR Mr&MR FULL report FA.indd A 2017/10/27 1:43 PM2017/10/27 1:43 PM
B | PAN AFRICAN RESOURCES MINERAL RESOURCES AND MINERAL RESERVES REPORT 2017
PAR Mr&MR FULL report FA.indd BPAR Mr&MR FULL report FA.indd B 2017/10/27 1:43 PM2017/10/27 1:43 PM
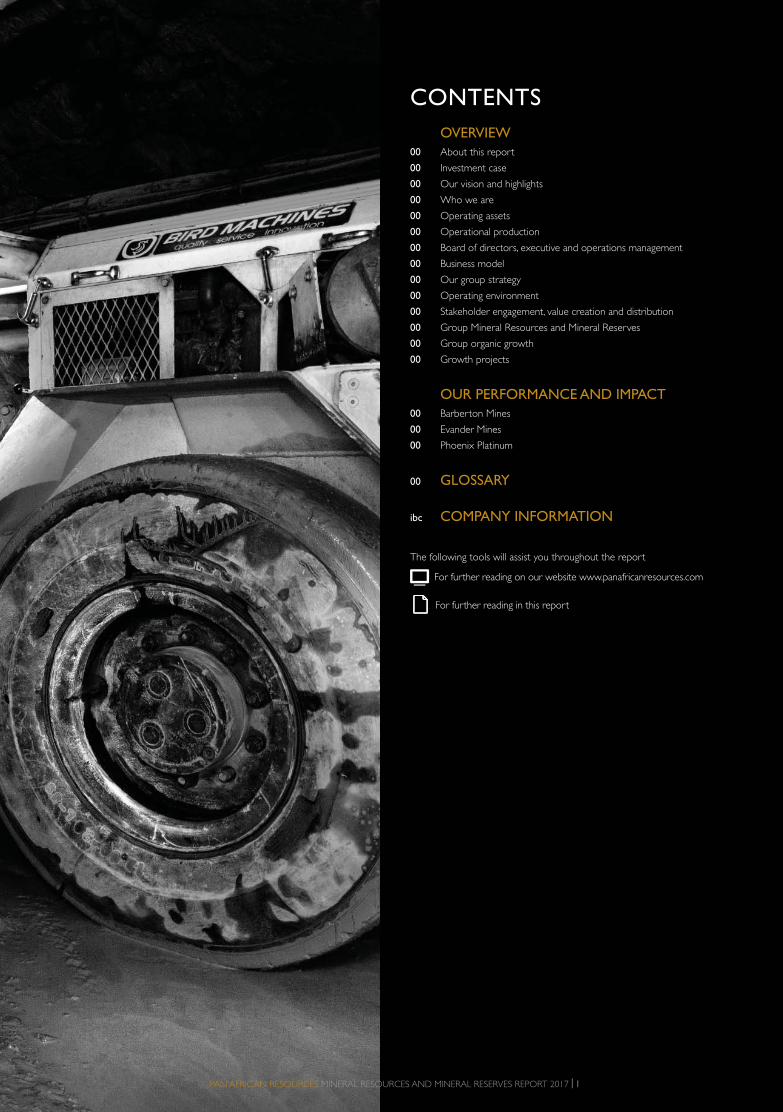
CONTENTS
OVERVIEW
00 About this report
00 Investment case
00 Our vision and highlights
00 Who we are
00 Operating assets
00 Operational production
00 Board of directors, executive and operations management
00 Business model
00 Our group strategy
00 Operating environment
00 Stakeholder engagement, value creation and distribution
00 Group Mineral Resources and Mineral Reserves
00 Group organic growth
00 Growth projects
OUR PERFORMANCE AND IMPACT
00 Barberton Mines
00 Evander Mines
00 Phoenix Platinum
00 GLOSSARY
ibc COMPANY INFORMATION
The following tools will assist you throughout the report
For further reading on our website www.panafricanresources.com
For further reading in this report
PAN AFRICAN RESOURCES MINERAL RESOURCES AND MINERAL RESERVES REPORT 2017 | 1
PAR Mr&MR FULL report FA.indd 1PAR Mr&MR FULL report FA.indd 1 2017/10/27 1:43 PM2017/10/27 1:43 PM
2 | PAN AFRICAN RESOURCES MINERAL RESOURCES AND MINERAL RESERVES REPORT 2017
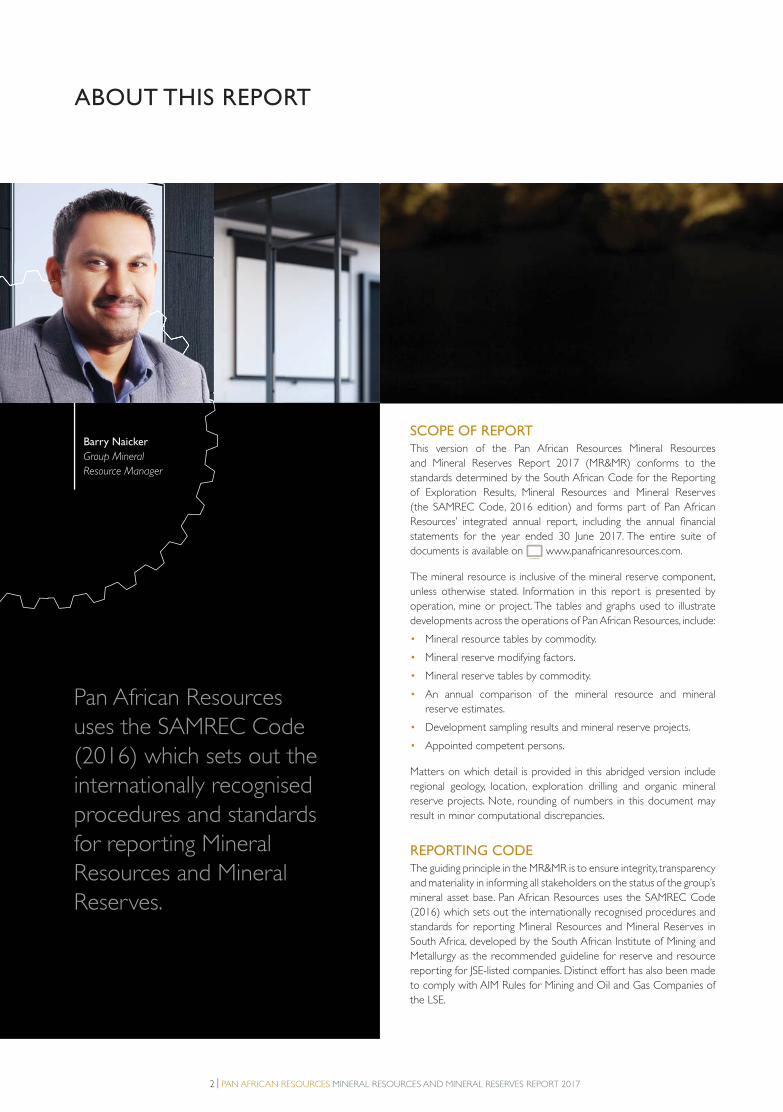
ABOUT THIS REPORT
SCOPE OF REPORTThis version of the Pan African Resources Mineral Resources
and Mineral Reserves Report 2017 (MR&MR) conforms to the
standards determined by the South African Code for the Reporting
of Exploration Results, Mineral Resources and Mineral Reserves
(the SAMREC Code, 2016 edition) and forms part of Pan African
Resources’ integrated annual report, including the annual financial
statements for the year ended 30 June 2017. The entire suite of
documents is available on www.panafricanresources.com.
The mineral resource is inclusive of the mineral reserve component,
unless otherwise stated. Information in this report is presented by
operation, mine or project. The tables and graphs used to illustrate
developments across the operations of Pan African Resources, include:
• Mineral resource tables by commodity.
• Mineral reserve modifying factors.
• Mineral reserve tables by commodity.
• An annual comparison of the mineral resource and mineral
reserve estimates.
• Development sampling results and mineral reserve projects.
• Appointed competent persons.
Matters on which detail is provided in this abridged version include
regional geology, location, exploration drilling and organic mineral
reserve projects. Note, rounding of numbers in this document may
result in minor computational discrepancies.
REPORTING CODEThe guiding principle in the MR&MR is to ensure integrity, transparency
and materiality in informing all stakeholders on the status of the group’s
mineral asset base. Pan African Resources uses the SAMREC Code
(2016) which sets out the internationally recognised procedures and
standards for reporting Mineral Resources and Mineral Reserves in
South Africa, developed by the South African Institute of Mining and
Metallurgy as the recommended guideline for reserve and resource
reporting for JSE-listed companies. Distinct effort has also been made
to comply with AIM Rules for Mining and Oil and Gas Companies of
the LSE.
Pan African Resources
uses the SAMREC Code
(2016) which sets out the
internationally recognised
procedures and standards
for reporting Mineral
Resources and Mineral
Reserves.
Barry Naicker
Group Mineral
Resource Manager
PAR Mr&MR FULL report FA.indd 2PAR Mr&MR FULL report FA.indd 2 2017/10/27 1:43 PM2017/10/27 1:43 PM
PAN AFRICAN RESOURCES MINERAL RESOURCES AND MINERAL RESERVES REPORT 2017 | 3
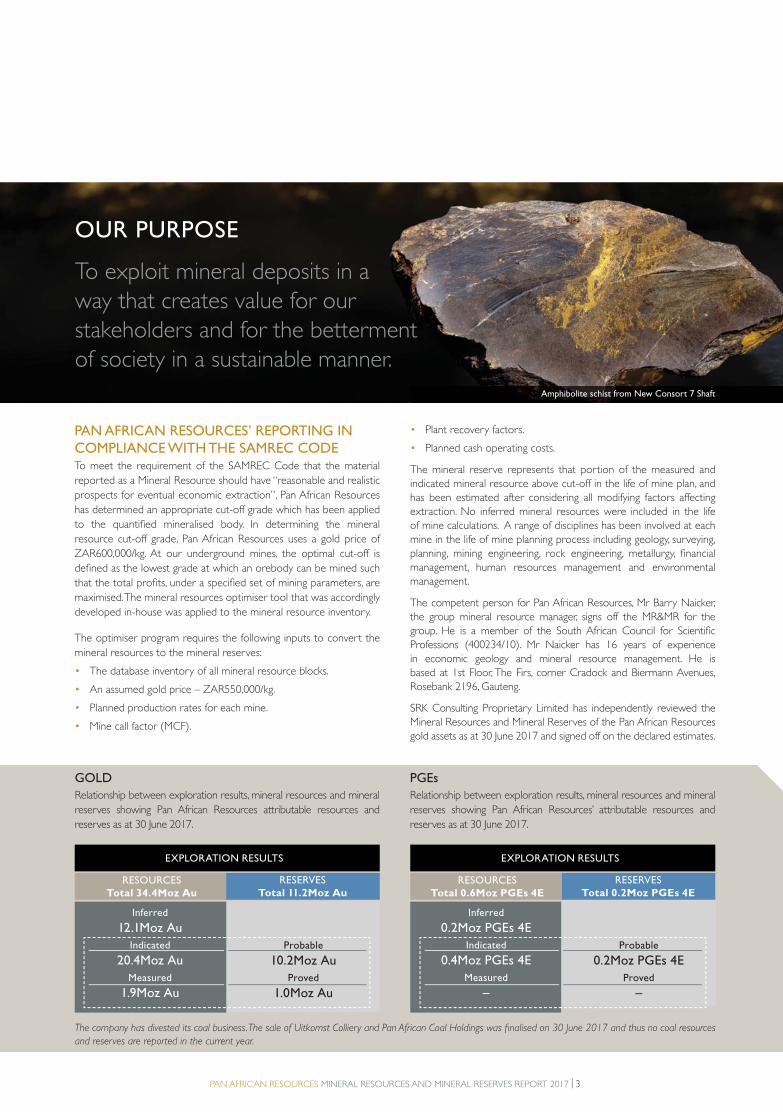
PGEs
Relationship between exploration results, mineral resources and mineral
reserves showing Pan African Resources’ attributable resources and
reserves as at 30 June 2017.
GOLD
Relationship between exploration results, mineral resources and mineral
reserves showing Pan African Resources attributable resources and
reserves as at 30 June 2017.
RESOURCES
Total 34.4Moz Au
RESOURCES
Total 0.6Moz PGEs 4E
Inferred
12.1Moz Au
Indicated
20.4Moz Au
Measured
1.9Moz Au
Inferred
0.2Moz PGEs 4E
Indicated
0.4Moz PGEs 4E
Measured
–
EXPLORATION RESULTS EXPLORATION RESULTS
RESERVES
Total 11.2Moz Au
RESERVES
Total 0.2Moz PGEs 4E
Probable
10.2Moz Au
Proved
1.0Moz Au
Probable
0.2Moz PGEs 4E
Proved
–
PAN AFRICAN RESOURCES’ REPORTING IN COMPLIANCE WITH THE SAMREC CODETo meet the requirement of the SAMREC Code that the material
reported as a Mineral Resource should have “reasonable and realistic
prospects for eventual economic extraction”, Pan African Resources
has determined an appropriate cut-off grade which has been applied
to the quantified mineralised body. In determining the mineral
resource cut-off grade, Pan African Resources uses a gold price of
ZAR600,000/kg. At our underground mines, the optimal cut-off is
defined as the lowest grade at which an orebody can be mined such
that the total profits, under a specified set of mining parameters, are
maximised. The mineral resources optimiser tool that was accordingly
developed in-house was applied to the mineral resource inventory.
The optimiser program requires the following inputs to convert the
mineral resources to the mineral reserves:
• The database inventory of all mineral resource blocks.
• An assumed gold price – ZAR550,000/kg.
• Planned production rates for each mine.
• Mine call factor (MCF).
• Plant recovery factors.
• Planned cash operating costs.
The mineral reserve represents that portion of the measured and
indicated mineral resource above cut-off in the life of mine plan, and
has been estimated after considering all modifying factors affecting
extraction. No inferred mineral resources were included in the life
of mine calculations. A range of disciplines has been involved at each
mine in the life of mine planning process including geology, surveying,
planning, mining engineering, rock engineering, metallurgy, financial
management, human resources management and environmental
management.
The competent person for Pan African Resources, Mr Barry Naicker,
the group mineral resource manager, signs off the MR&MR for the
group. He is a member of the South African Council for Scientific
Professions (400234/10). Mr Naicker has 16 years of experience
in economic geology and mineral resource management. He is
based at 1st Floor, The Firs, corner Cradock and Biermann Avenues,
Rosebank 2196, Gauteng.
SRK Consulting Proprietary Limited has independently reviewed the
Mineral Resources and Mineral Reserves of the Pan African Resources
gold assets as at 30 June 2017 and signed off on the declared estimates.
The company has divested its coal business. The sale of Uitkomst Colliery and Pan African Coal Holdings was finalised on 30 June 2017 and thus no coal resources
and reserves are reported in the current year.
Amphibolite schist from New Consort 7 Shaft
To exploit mineral deposits in a
way that creates value for our
stakeholders and for the betterment
of society in a sustainable manner.
OUR PURPOSE
PAR Mr&MR FULL report FA.indd 3PAR Mr&MR FULL report FA.indd 3 2017/10/27 1:43 PM2017/10/27 1:43 PM
4 | PAN AFRICAN RESOURCES MINERAL RESOURCES AND MINERAL RESERVES REPORT 2017
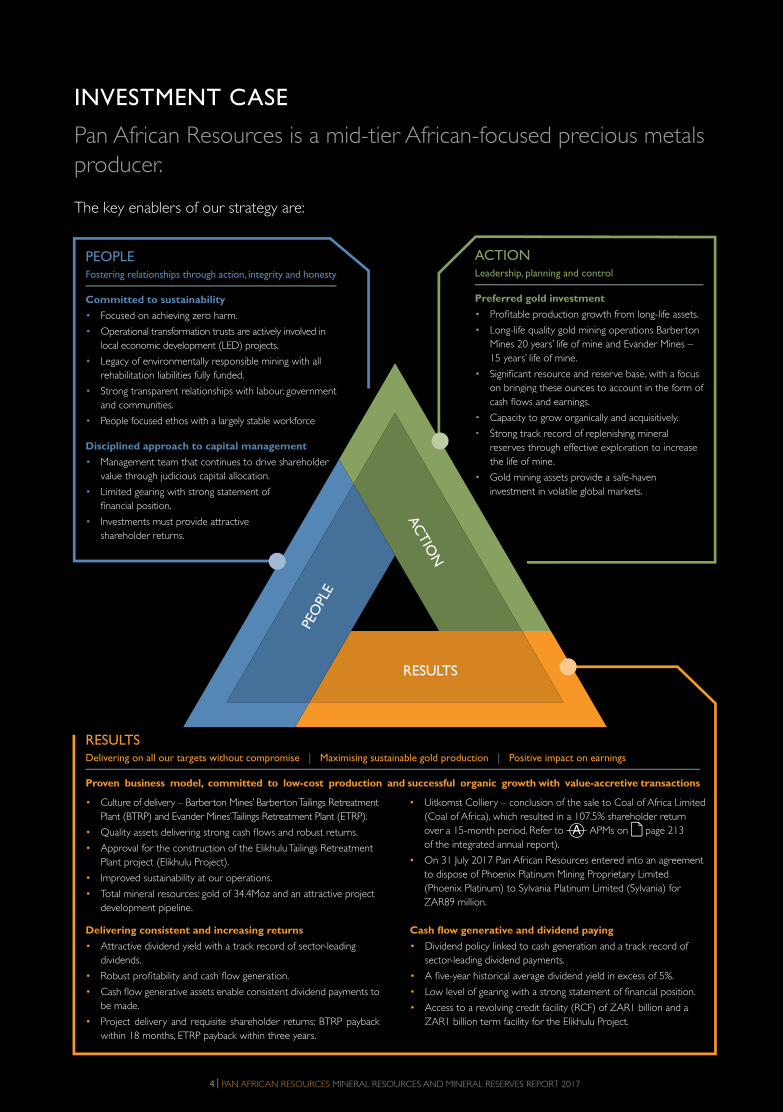
PEOPLEFostering relationships through action, integrity and honesty
Committed to sustainability
• Focused on achieving zero harm.
• Operational transformation trusts are actively involved in
local economic development (LED) projects.
• Legacy of environmentally responsible mining with all
rehabilitation liabilities fully funded.
• Strong transparent relationships with labour, government
and communities.
• People focused ethos with a largely stable workforce.
Disciplined approach to capital management
• Management team that continues to drive shareholder
value through judicious capital allocation.
• Limited gearing with strong statement of
financial position.
• Investments must provide attractive
shareholder returns.
RESULTSDelivering on all our targets without compromise | Maximising sustainable gold production | Positive impact on earnings
Proven business model, committed to low-cost production and successful organic growth with value-accretive transactions
ACTIONLeadership, planning and control
Preferred gold investment
• Profitable production growth from long-life assets.
• Long-life quality gold mining operations Barberton
Mines 20 years’ life of mine and Evander Mines –
15 years’ life of mine.
• Significant resource and reserve base, with a focus
on bringing these ounces to account in the form of
cash flows and earnings.
• Capacity to grow organically and acquisitively.
• Strong track record of replenishing mineral
reserves through effective exploration to increase
the life of mine.
• Gold mining assets provide a safe-haven
investment in volatile global markets.
y p g
es fully funded.
elationships with labour, government
s with a largely stable workforce.
h to capital management
hat continues to drive shareholder
ous capital allocation.
strong statement of
ovide attractive
• Significant resource and reserve
on bringing these ounces to acc
cash flows and earnings.
• Capacity to grow organically and
• Strong track record of replenish
reserves through effective explo
the life of mine.
• Gold mining assets provide a saf
investment in volatile global mar
PEO
PLE
AC
TIO
N
RESULTS
INVESTMENT CASE
Pan African Resources is a mid-tier African-focused precious metals
producer.
The key enablers of our strategy are:
• Culture of delivery – Barberton Mines’ Barberton Tailings Retreatment
Plant (BTRP) and Evander Mines’ Tailings Retreatment Plant (ETRP).
• Quality assets delivering strong cash flows and robust returns.
• Approval for the construction of the Elikhulu Tailings Retreatment
Plant project (Elikhulu Project).
• Improved sustainability at our operations.
• Total mineral resources: gold of 34.4Moz and an attractive project
development pipeline.
• Uitkomst Colliery – conclusion of the sale to Coal of Africa Limited
(Coal of Africa), which resulted in a 107.5% shareholder return
over a 15-month period. Refer to APMs on page 213
of the integrated annual report).
• On 31 July 2017 Pan African Resources entered into an agreement
to dispose of Phoenix Platinum Mining Proprietary Limited
(Phoenix Platinum) to Sylvania Platinum Limited (Sylvania) for
ZAR89 million.
Delivering consistent and increasing returns
• Attractive dividend yield with a track record of sector-leading
dividends.
• Robust profitability and cash flow generation.
• Cash flow generative assets enable consistent dividend payments to
be made.
• Project delivery and requisite shareholder returns: BTRP payback
within 18 months, ETRP payback within three years.
Cash flow generative and dividend paying
• Dividend policy linked to cash generation and a track record of
sector-leading dividend payments.
• A five-year historical average dividend yield in excess of 5%.
• Low level of gearing with a strong statement of financial position.
• Access to a revolving credit facility (RCF) of ZAR1 billion and a
ZAR1 billion term facility for the Elikhulu Project.
PAR Mr&MR FULL report FA.indd 4PAR Mr&MR FULL report FA.indd 4 2017/10/27 1:43 PM2017/10/27 1:43 PM

To continue to build a precious metals business in Africa by
remaining focused on our four strategic pillars.
OUR VISION
In the context of achieving our vision, the MR&MR report
encompasses our four strategic pillars as below:
HIGHLIGHTS
PAN AFRICAN RESOURCES MINERAL RESOURCES AND MINERAL RESERVES REPORT 2017 | 5
Mineral Resources
Gold 34.4Moz
down 1.4%
PGEs 0.6Moz
Elikhulu resource
declared at 2.0Moz
Organic growth
projects
Barberton Mines
– Fairview sub-vertical
shaft project – MRC
orebody
– Royal Sheba orebody
Evander Mines
– 2010 Pay Channel
surface drilling
– Elikhulu soil resource
Brownfield
projects
Barberton Mines
– New Consort Bullion
orebody
– Sheba ZK orebody
extension
Evander Mines
– Rolspruit
– Evander 9 Shaft
A Block
– Evander South
Barberton Mines 9.8g/t
Evander Mines 5.7g/t
Phoenix Platinum 2.4g/t
Mineral Reserves
Gold up 12%
11.2Moz
PGEs
0.2Moz
Elikhulu
1.7Moz
Life of mine
Barberton Mines
20 years
Evander Mines
15 years
Phoenix Platinum
7 years
BTRP
14 years
ETRP
15 years
Elikhulu
14 years
Mineral tenure
Longevity in operations
Organised labour
Stakeholder engagement
Communities
STAKEHOLDERSKEHOLD
GROWTH SUSTAINABLE
PROFITABLE
BTRP 2.3g/t
ETRP 0.3g/t
High grade/low cost producer
PAR Mr&MR FULL report FA.indd 5PAR Mr&MR FULL report FA.indd 5 2017/10/27 1:43 PM2017/10/27 1:43 PM
6 | PAN AFRICAN RESOURCES MINERAL RESOURCES AND MINERAL RESERVES REPORT 2017
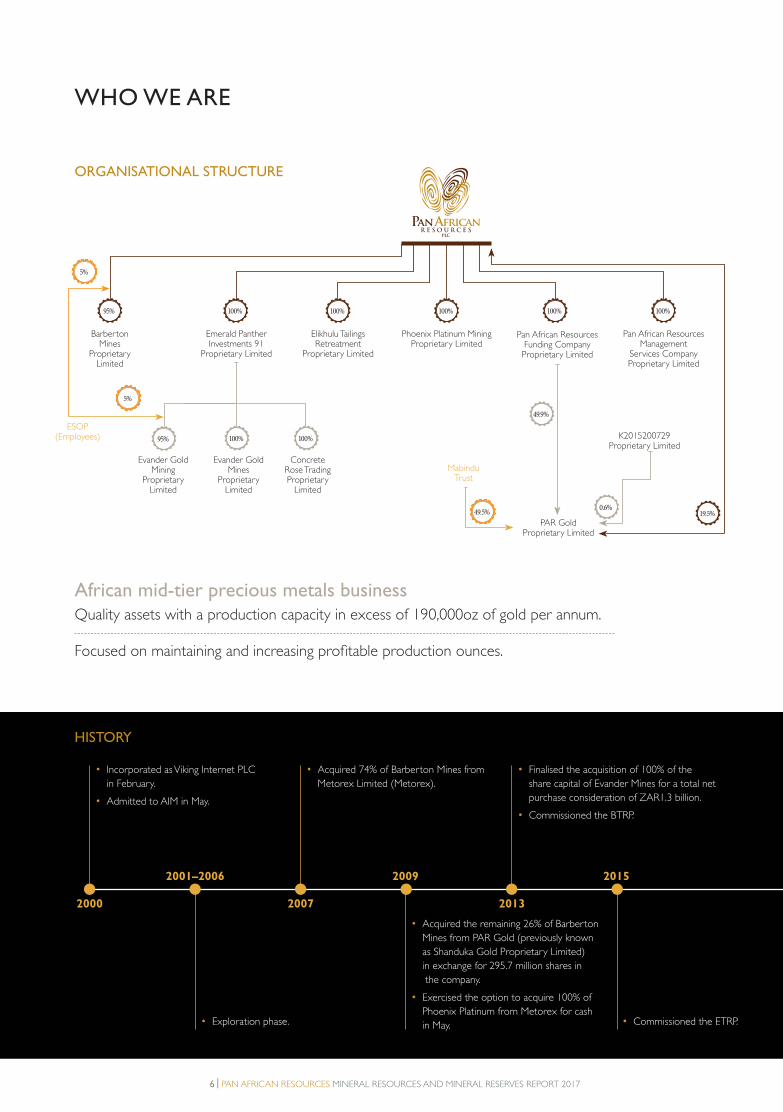
ORGANISATIONAL STRUCTURE
Emerald Panther Investments 91
Proprietary Limited
Barberton Mines
ProprietaryLimited
ESOP(Employees)
100%100%95%
100%100%
Evander Gold Mining
ProprietaryLimited
Evander Gold Mines
ProprietaryLimited
Concrete Rose Trading Proprietary
Limited
95%
5%
49.5%
5%
Elikhulu Tailings Retreatment
Proprietary Limited
Phoenix Platinum Mining Proprietary Limited
Pan African Resources Management
Services Company Proprietary Limited
PAR GoldProprietary Limited
MabinduTrust
K2015200729Proprietary Limited
100% 100% 100%
Pan African Resources Funding Company Proprietary Limited
19.5%0.6%
49.9%
African mid-tier precious metals businessQuality assets with a production capacity in excess of 190,000oz of gold per annum.
Focused on maintaining and increasing profitable production ounces.
HISTORY
• Exploration phase.
• Acquired the remaining 26% of Barberton
Mines from PAR Gold (previously known
as Shanduka Gold Proprietary Limited)
in exchange for 295.7 million shares in
the company.
• Exercised the option to acquire 100% of
Phoenix Platinum from Metorex for cash
in May. • Commissioned the ETRP.
• Incorporated as Viking Internet PLC
in February.
• Admitted to AIM in May.
• Acquired 74% of Barberton Mines from
Metorex Limited (Metorex).
• Finalised the acquisition of 100% of the
share capital of Evander Mines for a total net
purchase consideration of ZAR1.3 billion.
• Commissioned the BTRP.
2000 2007 2013
2001–2006 2009 2015
WHO WE ARE
PAR Mr&MR FULL report FA.indd 6PAR Mr&MR FULL report FA.indd 6 2017/10/27 1:43 PM2017/10/27 1:43 PM

PAN AFRICAN RESOURCES MINERAL RESOURCES AND MINERAL RESERVES REPORT 2017 | 7
OUR OPERATIONS
Zeerust
Potchefstroom
Klerksdorp
Taung
Kuruman
Vryburg
NORTH WEST PROVINCE
Phoenix Platinum
Rustenburg
BOTSWANA
FREE STATERTHERN CAPE
Dolphin CoastPietermaritzburg
Richards Bay
St Lucia
Hluhluwe
KWAZULU-NATAL
Uitkomst CollieryNewcastle
Ladysmith
Vryheid
LIMPOPO
SWAZILAN
Uitkomst Co
Kruger National
ParkNelspruit
BarbertonMiddelburg
Witbank
Secunda Ermelo
MPUMALANGA
Evander Mines
ETRP
Barberton Mines
BTRP
Significant growth projectsGold resources base of 34.4Moz.
• Approval received for the Elikhulu Project at a cost of
ZAR1.74 billion – venture to yield over 56,000 ounces of gold per
annum over a 13-year project life, boosting group production.
• Raised equity and secured debt financing to fund construction of
Elikhulu.
• Disposed of the Uitkomst Colliery effective 30 June 2017 for a
consideration of ZAR277.6 million to Coal of Africa.
• Concluded a conditional agreement to dispose of Phoenix Platinum
for a total cash consideration of ZAR89.0 million after year-end.
• Acquired the Uitkomst Colliery on 31 March for a cash consideration of ZAR148 million.
• Acquired shares in PAR Gold held by Standard Bank of South Africa Limited
and the shares held by Jadeite Limited. Pan African Resources acquired the stake for
ZAR546.9 million, a significant discount to the prevailing market price at the time. The
transaction was funded from Pan African Resources’ operational cash flows and a vendor
consideration placement through an issue of shares.
2016
2017
Dual listed on London’s AIM
and South Africa’s JSE
Market capitalisation at 30 June 2017 of
ZAR5.3 billion (2016: ZAR7.3 billion).
Diversified shareholder base of major South
African and international institutions.
PAR Gold Proprietary Limited
(PAR Gold) is the empowerment partner
with a 19.53% direct shareholding. The group’s
BEE ownership for purposes of the Mineral
and Petroleum Resources Development Act
(MPRDA) equates to approximately 26%
of the gold mining operations by applying
the flow through principles of excluding
state-controlled entities (such as the Public
Investment Corporation SOC Limited (PIC)
and governmental pension funds) and including
the operations employee share ownership
programmes of 5%.
Elikhulu
PAR Mr&MR FULL report FA.indd 7PAR Mr&MR FULL report FA.indd 7 2017/10/27 1:43 PM2017/10/27 1:43 PM
8 | PAN AFRICAN RESOURCES MINERAL RESOURCES AND MINERAL RESERVES REPORT 2017
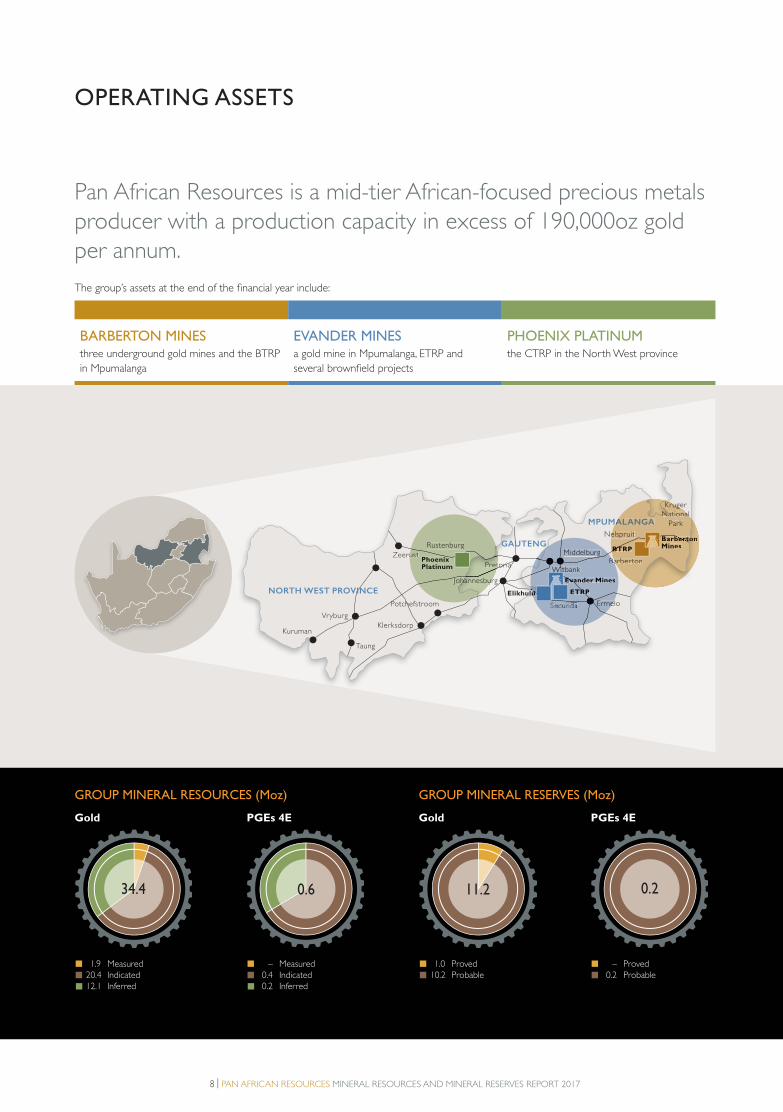
OPERATING ASSETS
Pan African Resources is a mid-tier African-focused precious metals
producer with a production capacity in excess of 190,000oz gold
per annum.
The group’s assets at the end of the financial year include:
BARBERTON MINES three underground gold mines and the BTRP
in Mpumalanga
EVANDER MINES a gold mine in Mpumalanga, ETRP and
several brownfield projects
PHOENIX PLATINUM the CTRP in the North West province
Kruger
National
Park
Nelspruit
BarbertonMiddelburg
Pretoria
Johannesburg
Zeerust
Rustenburg
Potchefstroom
Klerksdorp
Taung
Kuruman
Vryburg
Witbank
Ermelo
NORTH WEST PROVINCE
GAUTENG
MPUMALANGA
Evander Mines
Barberton Mines
Phoenix Platinum Pret
hannesburJohahaJ
ust
Rustenburg
PhoenixPlatinum
BTRP
Kruge
NNational N
Park
elspruit
arberton
ALANGA
on bertooBarbertbertMinesBTRPBT
Elikhulu ETRP
BaMiddelburgg
Witbanki
Erme
Evander MinesEva
uuu ETRPRP
GROUP MINERAL RESOURCES (Moz)
Gold PGEs 4E PGEs 4E
GROUP MINERAL RESERVES (Moz)
Gold
1.9 Measured20.4 Indicated 12.1 Inferred
– Measured 0.4 Indicated 0.2 Inferred
1.0 Proved 10.2 Probable
– Proved 0.2 Probable
34.4 0.6 11.2 0.2
PAR Mr&MR FULL report FA.indd 8PAR Mr&MR FULL report FA.indd 8 2017/10/27 1:43 PM2017/10/27 1:43 PM
PAN AFRICAN RESOURCES MINERAL RESOURCES AND MINERAL RESERVES REPORT 2017 | 9
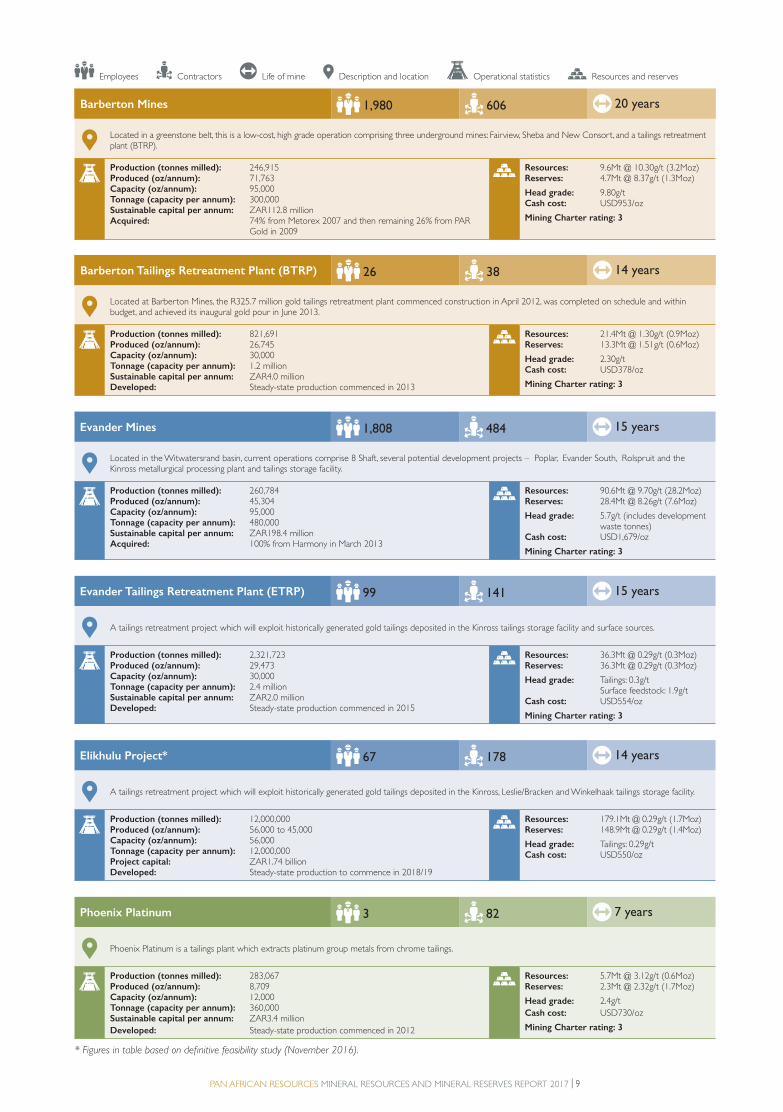
Barberton Mines 1,980
606
20 years
Located in a greenstone belt, this is a low-cost, high grade operation comprising three underground mines: Fairview, Sheba and New Consort, and a tailings retreatment plant (BTRP).
Production (tonnes milled): 246,915Produced (oz/annum): 71,763 Capacity (oz/annum): 95,000 Tonnage (capacity per annum): 300,000 Sustainable capital per annum: ZAR112.8 millionAcquired: 74% from Metorex 2007 and then remaining 26% from PAR
Gold in 2009
Resources: 9.6Mt @ 10.30g/t (3.2Moz)Reserves: 4.7Mt @ 8.37g/t (1.3Moz)
Head grade: 9.80g/tCash cost: USD953/oz
Mining Charter rating: 3
Phoenix Platinum 3
82
7 years
Phoenix Platinum is a tailings plant which extracts platinum group metals from chrome tailings.
Production (tonnes milled): 283,067Produced (oz/annum): 8,709 Capacity (oz/annum): 12,000 Tonnage (capacity per annum): 360,000 Sustainable capital per annum: ZAR3.4 million
Developed: Steady-state production commenced in 2012
Resources: 5.7Mt @ 3.12g/t (0.6Moz)Reserves: 2.3Mt @ 2.32g/t (1.7Moz)
Head grade: 2.4g/t
Cash cost: USD730/oz
Mining Charter rating: 3
Barberton Tailings Retreatment Plant (BTRP) 26
38
14 years
Located at Barberton Mines, the R325.7 million gold tailings retreatment plant commenced construction in April 2012, was completed on schedule and within budget, and achieved its inaugural gold pour in June 2013.
Production (tonnes milled): 821,691Produced (oz/annum): 26,745 Capacity (oz/annum): 30,000 Tonnage (capacity per annum): 1.2 million Sustainable capital per annum: ZAR4.0 millionDeveloped: Steady-state production commenced in 2013
Resources: 21.4Mt @ 1.30g/t (0.9Moz)Reserves: 13.3Mt @ 1.51g/t (0.6Moz)
Head grade: 2.30g/tCash cost: USD378/oz
Mining Charter rating: 3
Employees Contractors Life of mine Description and location Operational statistics Resources and reserves
Evander Mines 1,808
484
15 years
Located in the Witwatersrand basin, current operations comprise 8 Shaft, several potential development projects – Poplar, Evander South, Rolspruit and the Kinross metallurgical processing plant and tailings storage facility.
Production (tonnes milled): 260,784Produced (oz/annum): 45,304 Capacity (oz/annum): 95,000 Tonnage (capacity per annum): 480,000 Sustainable capital per annum: ZAR198.4 millionAcquired: 100% from Harmony in March 2013
Resources: 90.6Mt @ 9.70g/t (28.2Moz)Reserves: 28.4Mt @ 8.26g/t (7.6Moz)
Head grade: 5.7g/t (includes development waste tonnes)
Cash cost: USD1,679/oz
Mining Charter rating: 3
Evander Tailings Retreatment Plant (ETRP) 99
141
15 years
A tailings retreatment project which will exploit historically generated gold tailings deposited in the Kinross tailings storage facility and surface sources.
Production (tonnes milled): 2,321,723Produced (oz/annum): 29,473 Capacity (oz/annum): 30,000 Tonnage (capacity per annum): 2.4 million Sustainable capital per annum: ZAR2.0 millionDeveloped: Steady-state production commenced in 2015
Resources: 36.3Mt @ 0.29g/t (0.3Moz)Reserves: 36.3Mt @ 0.29g/t (0.3Moz)
Head grade: Tailings: 0.3g/t Surface feedstock: 1.9g/t
Cash cost: USD554/oz
Mining Charter rating: 3
Elikhulu Project* 67
178
14 years
A tailings retreatment project which will exploit historically generated gold tailings deposited in the Kinross, Leslie/Bracken and Winkelhaak tailings storage facility.
Production (tonnes milled): 12,000,000Produced (oz/annum): 56,000 to 45,000 Capacity (oz/annum): 56,000 Tonnage (capacity per annum): 12,000,000Project capital: ZAR1.74 billionDeveloped: Steady-state production to commence in 2018/19
Resources: 179.1Mt @ 0.29g/t (1.7Moz)Reserves: 148.9Mt @ 0.29g/t (1.4Moz)
Head grade: Tailings: 0.29g/t Cash cost: USD550/oz
* Figures in table based on definitive feasibility study (November 2016).
PAR Mr&MR FULL report FA.indd 9PAR Mr&MR FULL report FA.indd 9 2017/10/27 1:43 PM2017/10/27 1:43 PM

10 | PAN AFRICAN RESOURCES MINERAL RESOURCES AND MINERAL RESERVES REPORT 2017
OPERATIONAL PRODUCTION
GOLD OPERATIONS
Underground and
surface operations Tailings operations Total continuing operations
Year
ended
30 June Units
Barberton
Mines
Evander
Mines Total BTRP ETRP Elikhulu
Barberton
Mines
total
Evander
Mines
total
Group
total
Tonnes milled –
underground
2017 (t) 246,915 260,784 507,699 – – – 246,915 260,784 507,699
2016 (t) 258,405 408,281 666,686 – – – 258,405 408,281 666,686
Tonnes milled – surface 2017 (t) – – – – – – – – –
2016 (t) 9,978 – 9,978 – – – 9,978 – 9,978
Tonnes milled – total
underground and surface
2017 (t) 246,915 260,784 507,699 – – – 246,915 260,784 507,699
2016 (t) 268,383 408,281 676,664 – – – 268,383 408,281 676,664
Tonnes processed –
tailings
2017 (t) – – – 821,691 1,854,113 – 821,691 1,854,113 2,675,804
2016 (t) – – – 959,215 1,445,044 – 959,215 1,445,044 2,404,259
Tonnes processed –
surface feedstock
2017 (t) – – – – 467,610 – – 467,610 467,610
2016 (t) – – – – 396,942 – – 396,942 396,942
Tonnes processed –
total tailings and surface
feedstock
2017 (t) – – – 821,691 2,321,723 – 821,691 2,321,723 3,143,414
2016 (t) – – – 959,215 1,841,986 – 959,215 1,841,986 2,801,201
Tonnes milled and
processed – total
2017 (t) 246,915 260,784 507,699 821,691 2,321,723 – 1,068,606 2,582,507 3,651,113
2016 (t) 268,383 408,281 676,664 959,215 1,841,986 – 1,227,598 2,250,267 3,477,865
Head grade –
underground
2017 (g/t) 9.8 5.7 7.7 – – – 9.8 5.7 7.7
2016 (g/t) 11.0 5.7 7.8 – – – 11.0 5.7 7.8
Head grade – surface 2017 (g/t) – – – – – – – – –
2016 (g/t) 1.2 – 1.2 – – – 1.2 – 1.2
Head grade – total
underground and surface
2017 (g/t) 9.8 5.7 7.7 – – – 9.8 5.7 7.7
2016 (g/t) 10.7 5.7 7.7 – – – 10.7 5.7 7.7
Head grade – tailings 2017 (g/t) – – – 2.3 0.3 – 2.3 0.3 0.9
2016 (g/t) – – – 1.7 0.3 – 1.7 0.3 0.9
Head grade – surface
feedstock
2017 (g/t) – – – – 1.9 – – 1.9 1.9
2016 (g/t) – – – – 1.3 – – 1.3 1.3
Head grade – total
tailings and surface
feedstock
2017 (g/t) – – – 2.3 0.6 – 2.3 0.6 1.1
2016 (g/t) – – – 1.7 0.5 – 1.7 0.5 0.9
Head grade – total 2017 (g/t) 9.8 5.7 7.7 2.3 0.6 – 4.0 1.2 2.0
2016 (g/t) 10.7 5.7 7.7 1.7 0.5 – 3.7 1.5 2.2
Recovered grade 2017 (g/t) 9.0 5.4 7.2 1.0 0.4 – 2.9 0.9 1.5
2016 (g/t) 9.8 5.6 7.3 0.9 0.3 – 2.9 1.3 1.8
Overall recovery –
underground operations
2017 (%) 92 94 93 – – – 92 94 93
2016 (%) 92 98 95 – – – 92 98 95
Overall recovery –
tailings operations
2017 (%) – – – 44 41 – 44 41 44
2016 (%) – – – 54 46 – 54 46 52
Gold production –
underground operations
2017 (oz) 71,763 45,304 117,067 – – – 71,763 45,304 117,067
2016 (oz) 84,428 73,496 157,924 – – – 84,428 73,496 157,924
Gold production –
surface operations
2017 (oz) – – – – – – – – –
2016 (oz) 262 – 262 – – – 262 – 262
Gold production –
tailings operations
2017 (oz) – – – 26,745 8,113 – 26,745 8,113 34,858
2016 (oz) – – – 28,591 6,724 – 28,591 6,724 35,315
Gold production –
surface feedstock
2017 (oz) – – – – 21,360 – – 21,360 21,360
2016 (oz) – – – – 11,427 – – 11,427 11,427
Gold sold 2017 (oz) 71,763 45,304 117,067 26,745 29,473 – 98,508 74,777 173,285
2016 (oz) 84,690 73,496 158,186 28,591 18,151 – 113,281 91,647 204,928
Average ZAR gold price
received
2017 (ZAR/kg) 550,028 535,730 544,495 542,761 535,944 – 548,055 535,815 542,773
2016 (ZAR/kg) 544,618 539,202 542,102 547,862 541,483 – 545,437 539,654 542,850
PAR Mr&MR FULL report FA.indd 10PAR Mr&MR FULL report FA.indd 10 2017/10/27 1:43 PM2017/10/27 1:43 PM

PAN AFRICAN RESOURCES MINERAL RESOURCES AND MINERAL RESERVES REPORT 2017 | 11
Underground and
surface operations Tailings operations Total continuing operations
Year
ended
30 June Units
Barberton
Mines
Evander
Mines Total BTRP ETRP Elikhulu
Barberton
Mines
total
Evander
Mines
total
Group
total
Average USD gold price
received
2017 (USD/oz) 1,259 1,226 1,246 1,242 1,227 – 1,254 1,226 1,242
2016 (USD/oz) 1,167 1,156 1,162 1,174 1,161 – 1,169 1,156 1,164
ZAR cash cost 2017 (ZAR/kg) 416,356 733,664 539,148 165,088 242,049 – 348,127 539,850 430,863
2016 (ZAR/kg) 323,799 445,078 380,150 147,162 273,965 – 279,226 411,168 338,242
ZAR all-in sustaining cost 2017 (ZAR/kg) 501,330 914,841 661,351 171,480 242,260 – 411,762 649,683 514,435
2016 (ZAR/kg) 413,422 526,817 466,109 155,080 275,661 – 348,231 477,044 405,847
ZAR all-in cost (note 3) 2017 (ZAR/kg) 526,053 959,976 693,974 198,830 242,260 – 437,199 677,024 540,693
2016 (ZAR/kg) 418,628 529,438 470,114 164,168 275,661 – 354,417 479,145 410,206
USD cash cost 2017 (USD/oz) 953 1,679 1,234 378 554 – 797 1,236 986
2016 (USD/oz) 694 954 815 315 587 – 599 881 725
USD all-in sustaining cost 2017 (USD/oz) 1,147 2,094 1,514 392 554 – 942 1,487 1,177
2016 (USD/oz) 886 1,129 999 332 591 – 746 1,023 870
USD all-in cost (note 3) 2017 (USD/oz) 1,204 2,197 1,588 455 554 – 1,001 1,549 1,237
2016 (USD/oz) 897 1,135 1,008 352 591 – 760 1,027 879
ZAR cash cost per tonne
(note 1)
2017 (ZAR/t) 3,764 3,964 3,866 167 96 – 998 486 636
2016 (ZAR/t) 3,178 2,492 2,764 136 84 – 801 521 620
Capital expenditure 2017 (ZAR
million)
167.1 222.2 389.3 26.4 – 175.5 193.5 397.7 591.2
2016 (ZAR
million)
131.6 153.8 285.4 8.1 – – 139.7 153.8 293.5
Revenue 2017 (ZAR
million)
1,227.7 754.9 1,982.6 451.5 491.3 – 1,679.2 1,246.2 2,925.4
2016 (ZAR
million)
1,434.6 1,232.6 2,667.2 487.2 305.7 – 1,921.8 1,538.3 3,460.1
Cost of production 2017 (ZAR
million)
929.3 1,033.7 1,963.0 137.4 222.0 – 1,066.7 1,255.7 2,322.4
2016 (ZAR
million)
852.9 1,017.4 1,870.3 130.8 154.8 – 983.7 1,172.2 2,155.9
All-in sustainable cost of
production
2017 (ZAR
million)
1,119.0 1,289.0 2,408.0 142.7 222.2 – 1,261.7 1,511.2 2,772.9
2016 (ZAR
million)
1,089.0 1,204.3 2,293.3 137.9 155.7 – 1,226.9 1,360.0 2,586.9
All-in cost of production 2017 (ZAR
million)
1,174.2 1,352.6 2,526.8 165.4 222.2 – 1,339.6 1,574.8 2,914.4
2016 (ZAR
million)
1,102.7 1,210.3 2,313.0 145.9 155.7 – 1,248.6 1,366.0 2,614.6
Adjusted EBITDA
(note 2)
2017 (ZAR
million)
408.6 (334.0) 74.6 267.6 276.4 – 676.2 (57.6) 618.6
2016 (ZAR
million)
422.4 204.3 626.7 307.4 153.3 – 729.8 357.6 1,087.4
Average exchange rate 2017 (ZAR/USD) 13.59 13.59 13.59 13.59 13.59 13.59 13.59 13.59 13.59
2016 (ZAR/USD) 14.51 14.51 14.51 14.51 14.51 14.51 14.51 14.51 14.51
RIFR 2017 Rate – – – – – – 0.58 2.49 1.53
2016 Rate – – – – – – 0.62 3.31 2.04
LTIFR 2017 Rate – – – – – – 2.04 4.98 3.51
2016 Rate – – – – – – 1.86 4.96 3.50
Life of mine 2017 Years 20 15 20 14 15 14 20 15 20
2016 Years 22 16 22 15 16 – 22 16 22
Note 1: Split between ETRP and surface feedstock cost per tonne is ZAR38.54/t and ZAR286.34/t respectively, averaging at ZAR91/t.
Note 2: Adjusted EBITDA is represented by earnings before interest, taxation, depreciation and amortisation and impairments.
Note 3: Excluding Elikhulu capital expenditure.
PAR Mr&MR FULL report FA.indd 11PAR Mr&MR FULL report FA.indd 11 2017/10/27 1:43 PM2017/10/27 1:43 PM

12 | PAN AFRICAN RESOURCES MINERAL RESOURCES AND MINERAL RESERVES REPORT 2017
PGE OPERATIONS
Year ended 30 June Units
Tailings operations
Phoenix Platinum
Tonnes processed – tailings 2017 (t) 283,067
2016 (t) 248,981
Head grade – tailings 2017 (g/t) 2.43
2016 (g/t) 3.08
Overall recovery 2017 (%) 52
2016 (%) 43
PGE sold 2017 (oz) 8,709
2016 (oz) 8,339
Average ZAR PGE price received 2017 (oz) 9,441
2016 (oz) 8,952
Average USD PGE price received 2017 (USD/oz) 695
2016 (USD/oz) 617
ZAR cash cost 2017 (ZAR/oz) 9,919
2016 (ZAR/oz) 8,890
ZAR all-in sustaining cash cost 2017 (ZAR/kg) 10,957
2016 (ZAR/kg) 10,113
ZAR all-in cost 2017 (ZAR/kg) 11,184
2016 (ZAR/kg) 10,600
USD cash cost 2017 (USD/oz) 730
2016 (USD/oz) 613
USD all-in sustaining cash cost 2017 (USD/oz) 806
2016 (USD/oz) 697
USD all-in cost 2017 (USD/oz) 823
2016 (USD/oz) 731
ZAR cash cost per tonne 2017 (ZAR/t) 305
2016 (ZAR/t) 298
Capital expenditure 2017 (ZAR million) 5.4
2016 (ZAR million) 6.8
Revenue 2017 (ZAR million) 82.2
2016 (ZAR million) 74.7
Cost of production 2017 (ZAR million) 86.4
2016 (ZAR million) 74.1
All-in sustainable cost of production 2017 (ZAR million) 95.4
2016 (ZAR million) 84.3
All-in cost of production 2017 (ZAR million) 97.4
2016 (ZAR million) 88.4
EBITDA (note 1) 2017 (ZAR million) (8.6)
2016 (ZAR million) (5.4)
Average exchange rate 2017 (ZAR/USD) 13.59
2016 (ZAR/USD) 14.51
RIFR 2017 Rate –
2016 Rate –
LTIFR 2017 Rate –
2016 Rate –
Life of mine 2017 Years 7
2016 Years 9
Note 1: Adjusted EBITDA is represented by earnings before interest, taxation, depreciation and amortisation and impairments.
OPERATIONAL PRODUCTION continued
PAR Mr&MR FULL report FA.indd 12PAR Mr&MR FULL report FA.indd 12 2017/10/27 1:43 PM2017/10/27 1:43 PM

PAN AFRICAN RESOURCES MINERAL RESOURCES AND MINERAL RESERVES REPORT 2017 | 13
PAR Mr&MR FULL report FA.indd 13PAR Mr&MR FULL report FA.indd 13 2017/10/27 1:43 PM2017/10/27 1:43 PM
14 | PAN AFRICAN RESOURCES MINERAL RESOURCES AND MINERAL RESERVES REPORT 2017
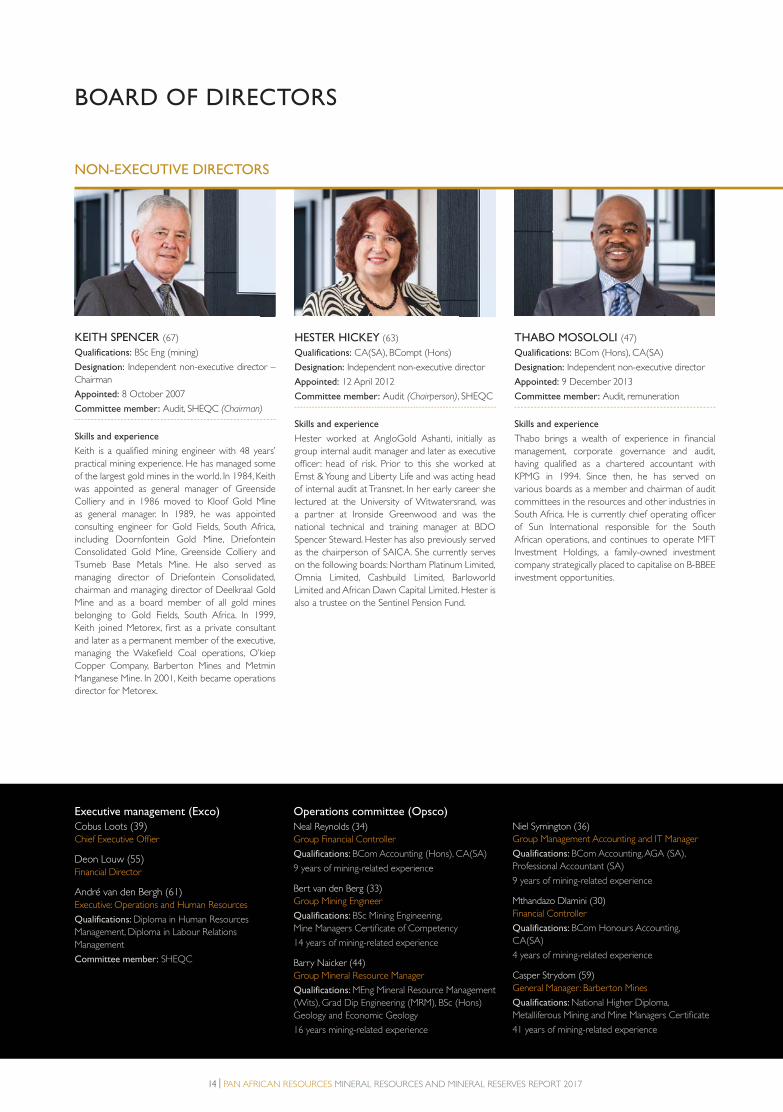
KEITH SPENCER (67)
Qualifications: BSc Eng (mining)
Designation: Independent non-executive director –
Chairman
Appointed: 8 October 2007
Committee member: Audit, SHEQC (Chairman)
Skills and experience
Keith is a qualified mining engineer with 48 years’
practical mining experience. He has managed some
of the largest gold mines in the world. In 1984, Keith
was appointed as general manager of Greenside
Colliery and in 1986 moved to Kloof Gold Mine
as general manager. In 1989, he was appointed
consulting engineer for Gold Fields, South Africa,
including Doornfontein Gold Mine, Driefontein
Consolidated Gold Mine, Greenside Colliery and
Tsumeb Base Metals Mine. He also served as
managing director of Driefontein Consolidated,
chairman and managing director of Deelkraal Gold
Mine and as a board member of all gold mines
belonging to Gold Fields, South Africa. In 1999,
Keith joined Metorex, first as a private consultant
and later as a permanent member of the executive,
managing the Wakefield Coal operations, O’kiep
Copper Company, Barberton Mines and Metmin
Manganese Mine. In 2001, Keith became operations
director for Metorex.
THABO MOSOLOLI (47)
Qualifications: BCom (Hons), CA(SA)
Designation: Independent non-executive director
Appointed: 9 December 2013
Committee member: Audit, remuneration
Skills and experience
Thabo brings a wealth of experience in financial
management, corporate governance and audit,
having qualified as a chartered accountant with
KPMG in 1994. Since then, he has served on
various boards as a member and chairman of audit
committees in the resources and other industries in
South Africa. He is currently chief operating officer
of Sun International responsible for the South
African operations, and continues to operate MFT
Investment Holdings, a family-owned investment
company strategically placed to capitalise on B-BBEE
investment opportunities.
HESTER HICKEY (63)
Qualifications: CA(SA), BCompt (Hons)
Designation: Independent non-executive director
Appointed: 12 April 2012
Committee member: Audit (Chairperson), SHEQC
Skills and experience
Hester worked at AngloGold Ashanti, initially as
group internal audit manager and later as executive
officer: head of risk. Prior to this she worked at
Ernst & Young and Liberty Life and was acting head
of internal audit at Transnet. In her early career she
lectured at the University of Witwatersrand, was
a partner at Ironside Greenwood and was the
national technical and training manager at BDO
Spencer Steward. Hester has also previously served
as the chairperson of SAICA. She currently serves
on the following boards: Northam Platinum Limited,
Omnia Limited, Cashbuild Limited, Barloworld
Limited and African Dawn Capital Limited. Hester is
also a trustee on the Sentinel Pension Fund.
NON-EXECUTIVE DIRECTORS
Executive management (Exco)
Cobus Loots (39)Chief Executive Offier
Deon Louw (55)Financial Director
André van den Bergh (61)Executive: Operations and Human Resources
Qualifications: Diploma in Human Resources
Management, Diploma in Labour Relations
Management
Committee member: SHEQC
Operations committee (Opsco)
Neal Reynolds (34)
Group Financial Controller
Qualifications: BCom Accounting (Hons), CA(SA)
9 years of mining-related experience
Bert van den Berg (33)
Group Mining Engineer
Qualifications: BSc Mining Engineering,
Mine Managers Certificate of Competency
14 years of mining-related experience
Barry Naicker (44)
Group Mineral Resource Manager
Qualifications: MEng Mineral Resource Management
(Wits), Grad Dip Engineering (MRM), BSc (Hons)
Geology and Economic Geology
16 years mining-related experience
Niel Symington (36)
Group Management Accounting and IT Manager
Qualifications: BCom Accounting, AGA (SA),
Professional Accountant (SA)
9 years of mining-related experience
Mthandazo Dlamini (30)
Financial Controller
Qualifications: BCom Honours Accounting,
CA(SA)
4 years of mining-related experience
Casper Strydom (59)
General Manager: Barberton Mines
Qualifications: National Higher Diploma,
Metalliferous Mining and Mine Managers Certificate
41 years of mining-related experience
BOARD OF DIRECTORS
PAR Mr&MR FULL report FA.indd 14PAR Mr&MR FULL report FA.indd 14 2017/10/27 1:43 PM2017/10/27 1:43 PM
PAN AFRICAN RESOURCES MINERAL RESOURCES AND MINERAL RESERVES REPORT 2017 | 15
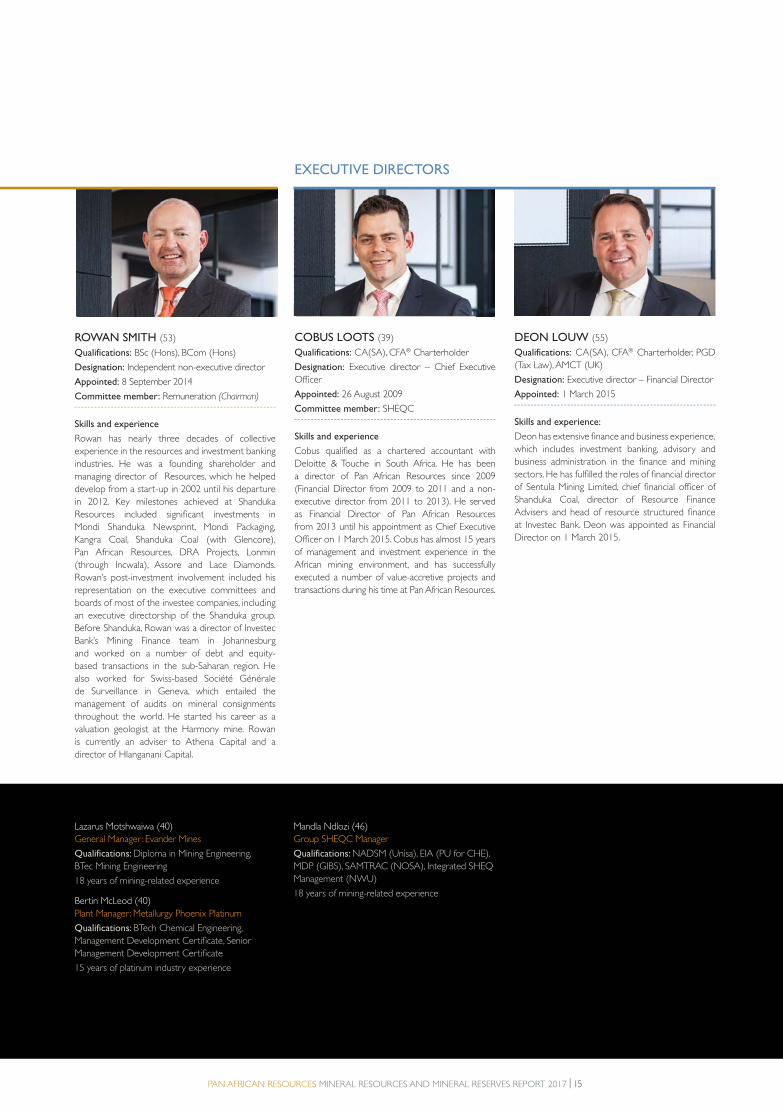
ROWAN SMITH (53)
Qualifications: BSc (Hons), BCom (Hons)
Designation: Independent non-executive director
Appointed: 8 September 2014
Committee member: Remuneration (Chairman)
Skills and experience
Rowan has nearly three decades of collective
experience in the resources and investment banking
industries. He was a founding shareholder and
managing director of Resources, which he helped
develop from a start-up in 2002 until his departure
in 2012. Key milestones achieved at Shanduka
Resources included significant investments in
Mondi Shanduka Newsprint, Mondi Packaging,
Kangra Coal, Shanduka Coal (with Glencore),
Pan African Resources, DRA Projects, Lonmin
(through Incwala), Assore and Lace Diamonds.
Rowan’s post-investment involvement included his
representation on the executive committees and
boards of most of the investee companies, including
an executive directorship of the Shanduka group.
Before Shanduka, Rowan was a director of Investec
Bank’s Mining Finance team in Johannesburg
and worked on a number of debt and equity-
based transactions in the sub-Saharan region. He
also worked for Swiss-based Société Générale
de Surveillance in Geneva, which entailed the
management of audits on mineral consignments
throughout the world. He started his career as a
valuation geologist at the Harmony mine. Rowan
is currently an adviser to Athena Capital and a
director of Hlanganani Capital.
COBUS LOOTS (39)
Qualifications: CA(SA), CFA® Charterholder
Designation: Executive director – Chief Executive
Officer
Appointed: 26 August 2009
Committee member: SHEQC
Skills and experience
Cobus qualified as a chartered accountant with
Deloitte & Touche in South Africa. He has been
a director of Pan African Resources since 2009
(Financial Director from 2009 to 2011 and a non-
executive director from 2011 to 2013). He served
as Financial Director of Pan African Resources
from 2013 until his appointment as Chief Executive
Officer on 1 March 2015. Cobus has almost 15 years
of management and investment experience in the
African mining environment, and has successfully
executed a number of value-accretive projects and
transactions during his time at Pan African Resources.
DEON LOUW (55)
Qualifications: CA(SA), CFA® Charterholder, PGD
(Tax Law), AMCT (UK)
Designation: Executive director – Financial Director
Appointed: 1 March 2015
Skills and experience:
Deon has extensive finance and business experience,
which includes investment banking, advisory and
business administration in the finance and mining
sectors. He has fulfilled the roles of financial director
of Sentula Mining Limited, chief financial officer of
Shanduka Coal, director of Resource Finance
Advisers and head of resource structured finance
at Investec Bank. Deon was appointed as Financial
Director on 1 March 2015.
EXECUTIVE DIRECTORS
Lazarus Motshwaiwa (40)
General Manager: Evander Mines
Qualifications: Diploma in Mining Engineering,
BTec Mining Engineering
18 years of mining-related experience
Bertin McLeod (40)
Plant Manager: Metallurgy Phoenix Platinum
Qualifications: BTech Chemical Engineering,
Management Development Certificate, Senior
Management Development Certificate
15 years of platinum industry experience
Mandla Ndlozi (46)
Group SHEQC Manager
Qualifications: NADSM (Unisa), EIA (PU for CHE),
MDP (GIBS), SAMTRAC (NOSA), Integrated SHEQ
Management (NWU)
18 years of mining-related experience
PAR Mr&MR FULL report FA.indd 15PAR Mr&MR FULL report FA.indd 15 2017/10/27 1:43 PM2017/10/27 1:43 PM
16 | PAN AFRICAN RESOURCES MINERAL RESOURCES AND MINERAL RESERVES REPORT 2017
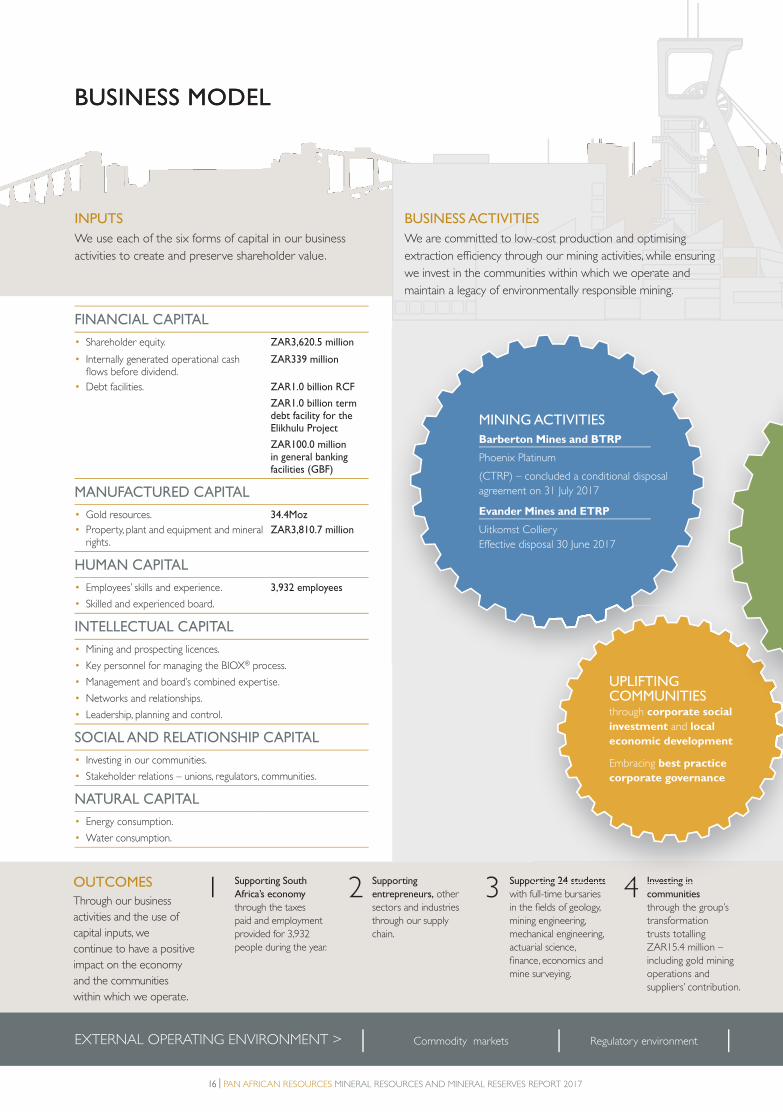
BUSINESS MODEL
INPUTS
We use each of the six forms of capital in our business
activities to create and preserve shareholder value.
FINANCIAL CAPITAL
• Shareholder equity. ZAR3,620.5 million
• Internally generated operational cash flows before dividend.
ZAR339 million
• Debt facilities. ZAR1.0 billion RCF
ZAR1.0 billion term debt facility for the Elikhulu Project
ZAR100.0 million in general banking facilities (GBF)
MANUFACTURED CAPITAL
• Gold resources. 34.4Moz
• Property, plant and equipment and mineral rights.
ZAR3,810.7 million
HUMAN CAPITAL
• Employees’ skills and experience.
• Skilled and experienced board.
3,932 employees
INTELLECTUAL CAPITAL
• Mining and prospecting licences.
• Key personnel for managing the BIOX® process.
• Management and board’s combined expertise.
• Networks and relationships.
• Leadership, planning and control.
SOCIAL AND RELATIONSHIP CAPITAL
• Investing in our communities.
• Stakeholder relations – unions, regulators, communities.
NATURAL CAPITAL
• Energy consumption.
• Water consumption.
1 Supporting South
Africa’s economy
through the taxes
paid and employment
provided for 3,932
people during the year.
2 Supporting
entrepreneurs, other
sectors and industries
through our supply
chain.
3 Supporting 24 students
with full-time bursaries
in the fields of geology,
mining engineering,
mechanical engineering,
actuarial science,
finance, economics and
mine surveying.
4 Investing in
communities
through the group’s
transformation
trusts totalling
ZAR15.4 million –
including gold mining
operations and
suppliers’ contribution.
Commodity markets Regulatory environment EXTERNAL OPERATING ENVIRONMENT >
orting 24 students 4 Investing in
MINING ACTIVITIES
Barberton Mines and BTRP
Phoenix Platinum
(CTRP) – concluded a conditional disposal
agreement on 31 July 2017
Evander Mines and ETRP
Uitkomst Colliery
Effective disposal 30 June 2017
UPLIFTING COMMUNITIES
through corporate social
investment and local
economic development
Embracing best practice
corporate governance
BUSINESS ACTIVITIES
We are committed to low-cost production and optimising
extraction efficiency through our mining activities, while ensuring
we invest in the communities within which we operate and
maintain a legacy of environmentally responsible mining.
BUSINESS MODEL
OUTCOMES
Through our business
activities and the use of
capital inputs, we
continue to have a positive
impact on the economy
and the communities
within which we operate.
PAR Mr&MR FULL report FA.indd 16PAR Mr&MR FULL report FA.indd 16 2017/10/27 1:43 PM2017/10/27 1:43 PM

PAN AFRICAN RESOURCES MINERAL RESOURCES AND MINERAL RESERVES REPORT 2017 | 17
OUTPUTS
Our outputs support our vision to continue to build a precious metals
business in Africa by remaining focused on our four strategic pillars:
profitable, sustainable, stakeholders and growth.
FINANCIAL CAPITALFINANCIAL CAPITAL• • Revenues generatedRevenues generated
– Gold.– Gold.– PGE.– PGE.– Coal.– Coal.
ZAR2,925.3 millionZAR2,925.3 millionZAR82.2 million ZAR82.2 million ZAR432.8 millionZAR432.8 million
• • Profit after taxation.Profit after taxation. ZAR309.9 millionZAR309.9 million
• • Internally generated operational cash flows after Internally generated operational cash flows after dividend.dividend.
ZAR106.5 millionZAR106.5 million
• • Dividends paid to shareholders.Dividends paid to shareholders. ZAR300 millionZAR300 million
• • Interest payments to debt funders.Interest payments to debt funders. ZAR47.5 millionZAR47.5 million
• • Reinvestment in infrastructure.Reinvestment in infrastructure. ZAR613.1 millionZAR613.1 million
• • Government taxes and royalties paid.Government taxes and royalties paid. ZAR141.0 millionZAR141.0 million
MANUFACTURED CAPITALMANUFACTURED CAPITAL• • Reserves.Reserves. Gold 11.2MozGold 11.2Moz
PGE 0.2MozPGE 0.2Moz
• • Resources.Resources. Gold 34.4MozGold 34.4Moz
PGE 0.6MozPGE 0.6Moz
• • Production.Production. Gold 173,285oz per annumGold 173,285oz per annum
PGE 8,709oz per annumPGE 8,709oz per annum
HUMAN CAPITALHUMAN CAPITAL
• • Three fatalities.Three fatalities.
• • Skills development and training.Skills development and training. ZAR32.1 millionZAR32.1 million
• • Employee remuneration.Employee remuneration. ZAR1,119.0 millionZAR1,119.0 million
INTELLECTUAL CAPITAL INTELLECTUAL CAPITAL
• • Mining and prospecting licences.Mining and prospecting licences.
SOCIAL AND RELATIONSHIP CAPITALSOCIAL AND RELATIONSHIP CAPITAL
• • Corporate social investment and local economic Corporate social investment and local economic development.development.
ZAR24.3 millionZAR24.3 million
• • Stakeholder relations – unions, regulators, Stakeholder relations – unions, regulators, communities.communities.
Mining Indaba, community Mining Indaba, community and regular union meetings.and regular union meetings.
NATURAL CAPITALNATURAL CAPITAL
• • Energy consumption.Energy consumption. 1,521,811Gj1,521,811Gj
• • Water consumption.Water consumption. 25,395m25,395m33
• • Carbon emissions.Carbon emissions. 0.12CO0.12CO22e/t millede/t milled
5 Producing
precious metals
in support of
increased investor
demand as they
seek protection
against economic
and currency
volatility.
6 Creating
employment and
skills development
opportunities
to communities
through initiatives
such as Umjindi
Jewellery and the
Sinqobile Life Skills
Centre.
7 Limiting
environmental
degradation.
8 Minimising the
occurrence of
illegal mining.
9 Creating
shareholder value
through dividend
distributions.
10 Supporting
South Africa’s
transformation
goals.
Capital and foreign exchange markets Labour and communities Energy costs
OTHER ACTIVITIESGrowing the business through organic
and acquisitive opportunities such as:
• Elikhulu Project.
• Evander Mines’ 2010 Pay Channel.
• Evander South.
• Rolspruit.
Stakeholder engagement with
shareholders, investors, employees,
unions, regulators, communities, suppliers,
customers.
PAR Mr&MR FULL report FA.indd 17PAR Mr&MR FULL report FA.indd 17 2017/10/27 1:43 PM2017/10/27 1:43 PM
18 | PAN AFRICAN RESOURCES MINERAL RESOURCES AND MINERAL RESERVES REPORT 2017
OUR GROUP STRATEGY
Pan African Resources has an exceptional mineral asset base with
attractive organic growth opportunities, in both established projects
and brownfield exploration prospects.
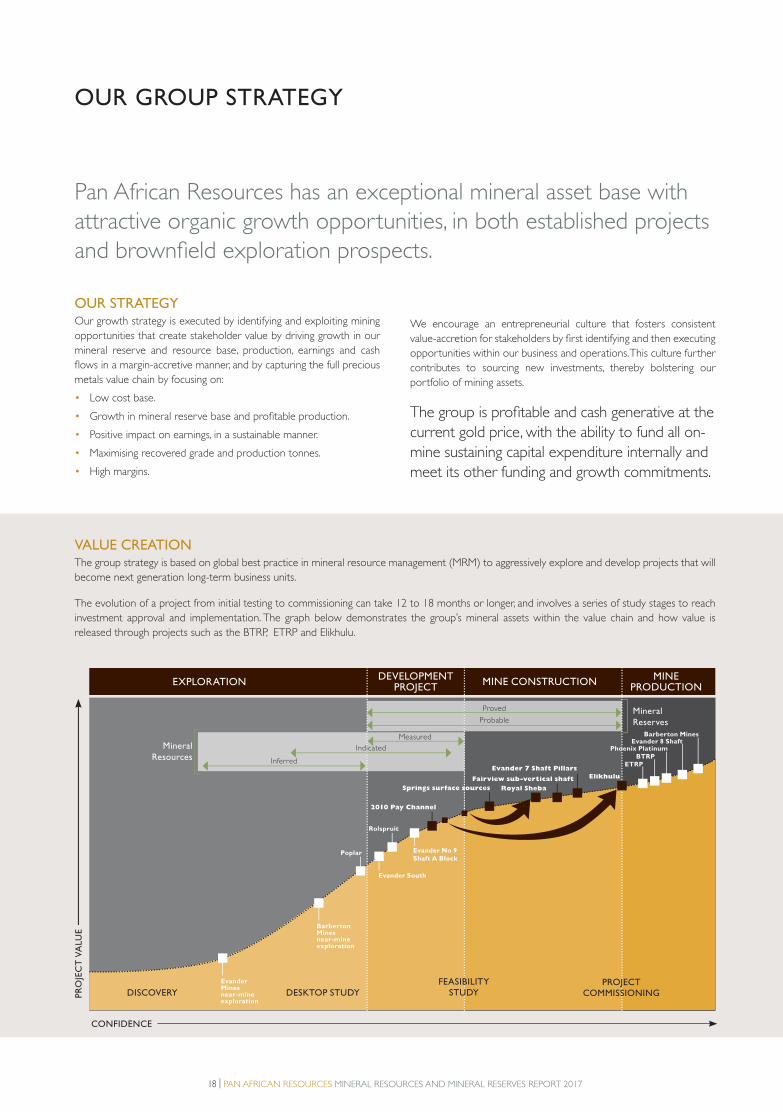
VALUE CREATIONThe group strategy is based on global best practice in mineral resource management (MRM) to aggressively explore and develop projects that will
become next generation long-term business units.
The evolution of a project from initial testing to commissioning can take 12 to 18 months or longer, and involves a series of study stages to reach
investment approval and implementation. The graph below demonstrates the group’s mineral assets within the value chain and how value is
released through projects such as the BTRP, ETRP and Elikhulu.
OUR STRATEGYOur growth strategy is executed by identifying and exploiting mining
opportunities that create stakeholder value by driving growth in our
mineral reserve and resource base, production, earnings and cash
flows in a margin-accretive manner, and by capturing the full precious
metals value chain by focusing on:
• Low cost base.
• Growth in mineral reserve base and profitable production.
• Positive impact on earnings, in a sustainable manner.
• Maximising recovered grade and production tonnes.
• High margins.
We encourage an entrepreneurial culture that fosters consistent
value-accretion for stakeholders by first identifying and then executing
opportunities within our business and operations. This culture further
contributes to sourcing new investments, thereby bolstering our
portfolio of mining assets.
The group is profitable and cash generative at the
current gold price, with the ability to fund all on-
mine sustaining capital expenditure internally and
meet its other funding and growth commitments.
2010 Pay Channel
EXPLORATIONDEVELOPMENT
PROJECT
DESKTOP STUDYDISCOVERY
CONFIDENCE
PR
OJE
CT
VA
LU
E
MINE PRODUCTION
MINE CONSTRUCTION
Mineral
Resources
Mineral
Reserves
Evander South
Poplar
Inferred
Probable
Proved
Rolspruit
Barberton Mines near-mine exploration
Evander Mines near-mine exploration
Springs surface sources Royal Sheba
Measured
Indicated
Evander No 9
Shaft A Block
Evander 7 Shaft Pillars
Fairview sub-vertical shaft
Barberton MinesEvander 8 Shaft
BTRPETRP
Phoenix Platinum
PROJECT COMMISSIONING
FEASIBILITY STUDY
Elikhulu
PAR Mr&MR FULL report FA.indd 18PAR Mr&MR FULL report FA.indd 18 2017/10/27 1:43 PM2017/10/27 1:43 PM
PAN AFRICAN RESOURCES MINERAL RESOURCES AND MINERAL RESERVES REPORT 2017 | 19
OPERATING ENVIRONMENT
Pan African Resources’ sustainability and response to its operating
environment is guided by its vision and purpose – to build and grow
a mid-tier precious metal producer, while creating shareholder value
and advancing society. Good governance and sound ethics form the
foundation of our business and our experienced leadership and high-
performance culture ensures resilience in a challenging and constantly
changing operating environment. We currently only operate in South
Africa and have developed skills to operate sustainably, with the view
to increasing investor appetite for mining investment in our country.
Operating in South Africa has many advantages, which include access
to technical skills, expertise and support, a well-trained, experienced
workforce, excellent road, power and other infrastructure and more
than a century of deep-level and general mining experience. Despite
these benefits, the current in-country political instability and economic
challenges cannot be ignored, and will have to be addressed if South
Africa is to attract investment and successfully grow its economy.
We appreciate that, in general, we cannot control or predict our
operating environment, but we continue to focus on those factors we
can control or influence positively, such as gold production, the cost of
production and delivering into value-accretive opportunities.
GLOBAL AND LOCAL ECONOMY DYNAMICSThe world has become more uncertain with increasing risks,
including geopolitical tensions, political dissonance, weak governance,
corruption, extreme weather conditions, terrorism and security
concerns. Global trade relations also continue to worsen as countries
focus inwardly on their economies, creating more inequality and fewer
growth opportunities.
South Africa’s economy has become more precarious due to an
unexpected political reorganisation by President Jacob Zuma and
severe political instability and infighting. This situation has not only
resulted in ratings downgrades but also civil society reacting strongly
with several public protests, as citizens expressed their concerns of
facing limited job opportunities, the rising cost of essential foods and
stagnating salaries. Positively, the Rand was relatively stable over the
2017 financial year but remains vulnerable due to continued political
discord and global economic turmoil.
The dynamics of the global economy will continue to impact and
influence the South African economy as well as the group. Local
ideological and regulatory dogmatism are particularly concerning
as they threaten Pan African Resources’ South African local growth
potential, due to the erosion of investor sentiment. For this reason,
diversification is a strategic objective, thereby reducing our sovereign
risk and capitalising further opportunities to enhance shareholder
value. Diversification can however not be at all costs – any new
investment by the group will have to demonstrate the requisite
returns to shareholders.
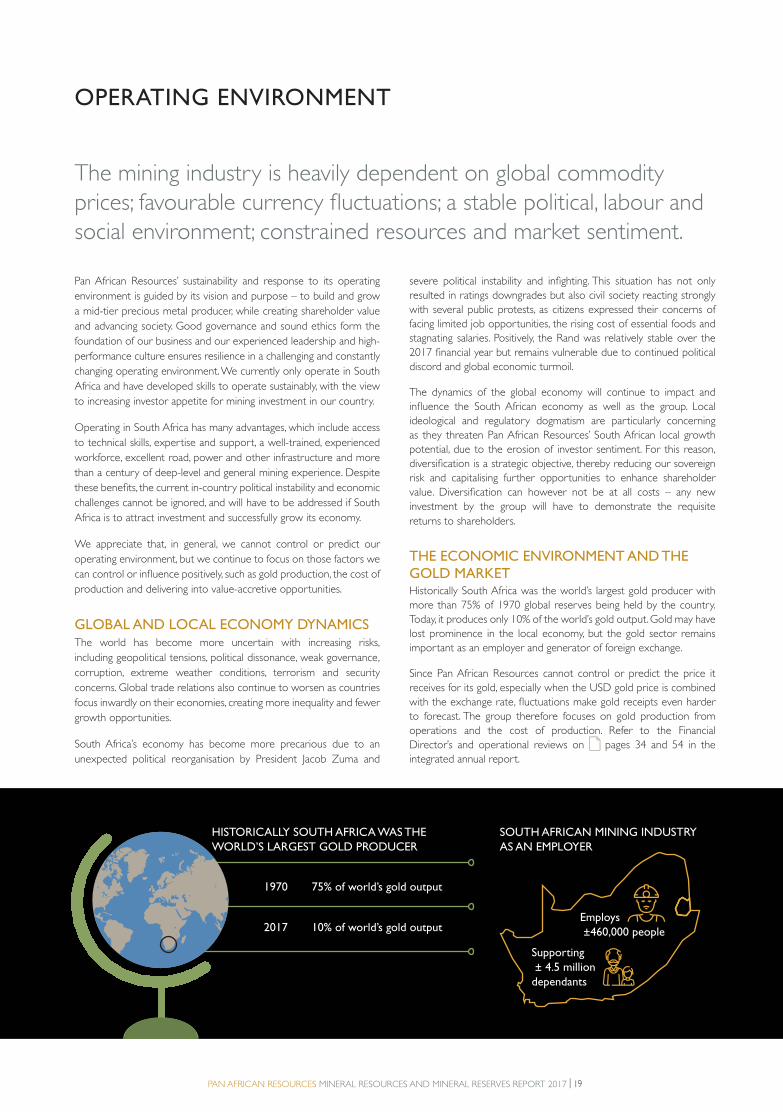
THE ECONOMIC ENVIRONMENT AND THE GOLD MARKETHistorically South Africa was the world’s largest gold producer with
more than 75% of 1970 global reserves being held by the country.
Today, it produces only 10% of the world’s gold output. Gold may have
lost prominence in the local economy, but the gold sector remains
important as an employer and generator of foreign exchange.
Since Pan African Resources cannot control or predict the price it
receives for its gold, especially when the USD gold price is combined
with the exchange rate, fluctuations make gold receipts even harder
to forecast. The group therefore focuses on gold production from
operations and the cost of production. Refer to the Financial
Director’s and operational reviews on pages 34 and 54 in the
integrated annual report.
The mining industry is heavily dependent on global commodity
prices; favourable currency fluctuations; a stable political, labour and
social environment; constrained resources and market sentiment.
2017 10% of world’s gold output
1970 75% of world’s gold output
Employs
±460,000 people
HISTORICALLY SOUTH AFRICA WAS THE
WORLD’S LARGEST GOLD PRODUCER
SOUTH AFRICAN MINING INDUSTRY
AS AN EMPLOYER
Supporting
± 4.5 million
dependants
PAR Mr&MR FULL report FA.indd 19PAR Mr&MR FULL report FA.indd 19 2017/10/27 1:43 PM2017/10/27 1:43 PM
20 | PAN AFRICAN RESOURCES MINERAL RESOURCES AND MINERAL RESERVES REPORT 2017
AN EVOLVING REGULATORY ENVIRONMENTThe mining industry is highly regulated, chiefly by the DMR, with the
Mine Health and Safety Inspectorate executing the statutory mandate
of the DMR, to safeguard the health and safety of mine employees and
communities affected by mining operations. Pan African Resources
continues to proactively engage with the DMR, with the common goal
of achieving zero harm.
Another important act, which continues to evolve, is the MPRDA.
The MPRDA’s strategic intent is to streamline licensing processes to
improve the ease of doing business in the industry and contribute
towards national development imperatives. It aims to integrate and
align the mining, environmental and water authorisation processes
with the National Environment Management Authority and the
National Water Act. The MPRDA aims to enhance provisions relating
to the regulation and implementation of SLPs, entrenching and
embedding transformation, and providing for enforcement of housing
and living conditions standards for mineworkers. Amendments to the
MPRDA have introduced some onerous requirements, with enhanced
sanctions for non-compliance. In addition, uncertainties around these
amendments run the risk of increased investor dissonance. Pan African
Resources continues to monitor these developments.
A new draft of the Mining Charter (the charter), gazetted in June
2017, proposed certain provisions of concern to the mining industry,
including raising black ownership from 26% to 30% in a manner that
avoids dilution and appears to conflict with other legislation; and a
requirement that 70% of all mining goods and 80% of all services
in the mining industry must be procured from black economic
empowerment (BEE) entities, when the number of possible suppliers
is very limited. The proposed new charter also provides that all
new mining rights are subject to a 1% revenue payment to BEE
shareholders prior to any shareholder distribution and a minimum
annual vesting of the BEE shareholding. After the Chamber of Mines’
urgent interdict to prevent the revised charter’s implementation, the
charter was suspended, pending judgment in the Chamber of Mines
urgent interdict. Pan African Resources welcomes the robust debate
around the revised charter and is committed to finding a sustainable
empowerment model for the industry. We continue to closely
monitor developments on the revised Mining Charter and remain
committed to transformation and compliance with the current Mining
Charter and our operations’ agreed SLPs.
The group has and will proactively implement several initiatives to
increase its empowerment shareholding, which include the current
employee share ownership schemes at Barberton Mines and Evander
Mines, as well as the current PAR Gold shareholding in the group.
These initiatives should reduce future dilution to other shareholders.
The group remains mindful of the Davies Commission on Tax, which is
still investigating the appropriateness of the current mining tax regime.
There remains a risk that revised tax legislation may negatively impact
the mining industry’s returns.
OPERATING ENVIRONMENT continued
A SOCIAL LICENCE TO OPERATEMining depends on its employees and the surrounding communities.
Ongoing community and employee relations are vital to ensure
a harmonious working environment. The group’s operations are
controlled by mining rights and each operation’s SLPs are submitted
to the DMR annually for approval.
The Chamber of Mines plays a critical role in negotiating with the
unions and bargaining on basic wages and conditions of employment
takes place on behalf of its members (certain South African mining
companies), while bargaining on organisational, operational and
workplace issues are conducted at mine or company level. Evander
Mines operation secured a wage agreement for three years, ending
2018. Barberton Mines is not a member of the Chamber of Mines but
is aware of the Chamber of Mines’ policies. Barberton is negotiating a
new wage agreement in 2017.
Illegal mining continues to pose a major challenge for the South
African mining industry. These miners typically access both abandoned
and operating mines, without the requisite logistical support, safety
equipment and ventilation. These activities negatively affect the
surrounding communities and deprive the state of material amounts
of tax and royalties from the gold illegally extracted. Pan African
Resources manages the risk of illegal miners by conducting regular
security operations in cooperation with law enforcement, the
appropriate access controls at its operations and other measures to
deter illegal miners.
RESPECTING NATURAL RESOURCESMining involves the use of various natural resources, most notably
land, water and energy, all of which must be used with circumspection
given the vulnerability of these resources. All Pan African Resources’
operations hold valid water-use licences and our carbon footprint is
monitored at all our operations and, where appropriate, we implement
energy-saving initiatives. Although South Africa’s power supply has
stabilised, the increased cost of electricity remains a challenge for both
the mining industry and the country as a whole.
Contamination of water sources is one of the highest environmental
risks at our operations and regular testing of boreholes is conducted
to monitor water quality. The recently commissioned cyanide
destruction plant at Barberton Mines will materially reduce the risk
of ground water pollution. See further details in the environmental
review on page 72 in the integrated annual report.
Regarding land rehabilitation, the group has fully provided for such
future costs by means of funds held in a dedicated rehabilitation trust
with available funds at 30 June 2017 of ZAR320.6 million (2016:
ZAR321.5 million).
PAR Mr&MR FULL report FA.indd 20PAR Mr&MR FULL report FA.indd 20 2017/10/27 1:43 PM2017/10/27 1:43 PM
PAN AFRICAN RESOURCES MINERAL RESOURCES AND MINERAL RESERVES REPORT 2017 | 21PAN AFRICAN RESOURCES MINERAL RESOURCES AND MINERAL RESERVES REPORT 2017 | 21
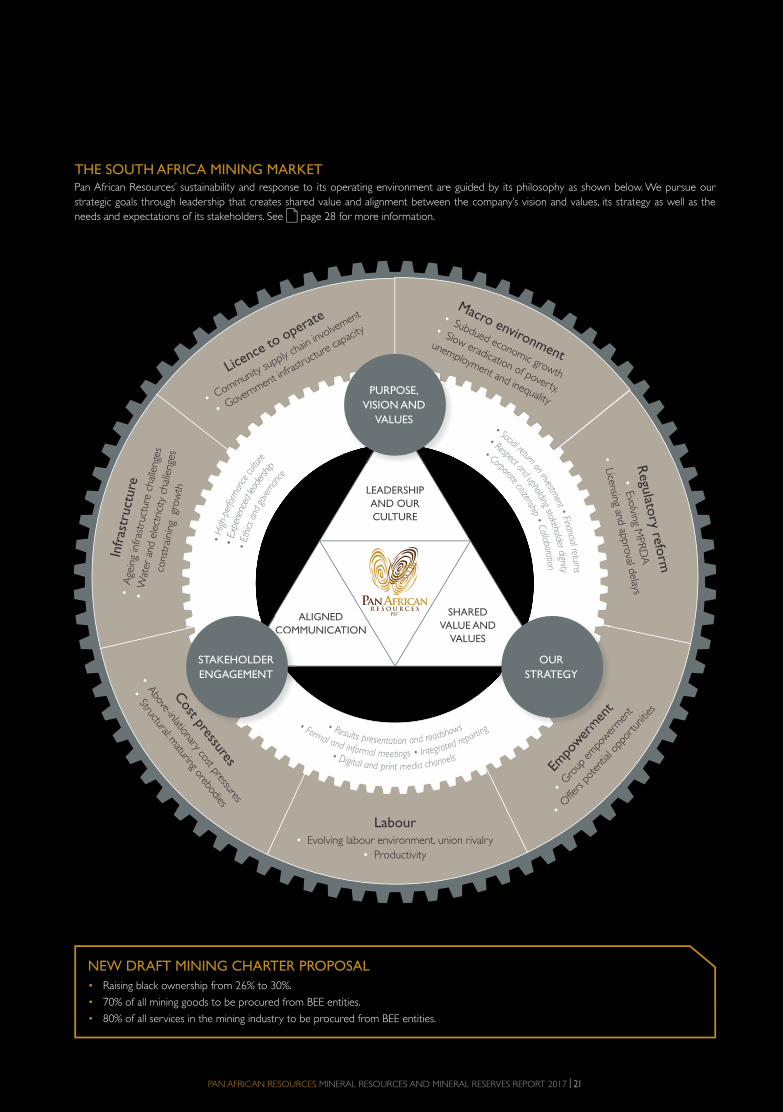
THE SOUTH AFRICA MINING MARKETPan African Resources’ sustainability and response to its operating environment are guided by its philosophy as shown below. We pursue our
strategic goals through leadership that creates shared value and alignment between the company’s vision and values, its strategy as well as the
needs and expectations of its stakeholders. See page 28 for more information.
Labour• Evolving labour environment, union rivalry
• Productivity
Empo
wer
men
t
• Gro
up em
power
men
t
• O
ffers p
oten
tial o
ppor
tunitie
s
Regu
latory refo
rm
• Evolving M
PR
DA
• Licensing and ap
pro
val delays
Macro environment
• Subdued economic growth
• Slow eradication of poverty,
unemployment and inequality
Licence to
operate
• Community
supply chain
involve
ment
• Government in
frastr
ucture ca
pacity
Infr
astr
uct
ure
• A
gein
g in
fras
truc
ture
cha
lleng
es
• W
ater
and
ele
ctrici
ty c
halle
nges
co
nstr
aini
ng gr
ow
th
Cost pressures
• Above-inlationary cost pressures
• Structural: maturing orebodies
LEADERSHIP
AND OUR
CULTURE
ALIGNED
COMMUNICATION
SHARED
VALUE AND
VALUES
emp
PURPOSE,
VISION AND
VALUES
Cost pr
COMC
STAKEHOLDER
ENGAGEMENT
men
t
OUR
STRATEGY
•
Exp
erien
ced
leade
rship
• Raising black ownership from 26% to 30%.
• 70% of all mining goods to be procured from BEE entities.
• 80% of all services in the mining industry to be procured from BEE entities.
NEW DRAFT MINING CHARTER PROPOSAL
PAR Mr&MR FULL report FA.indd 21PAR Mr&MR FULL report FA.indd 21 2017/10/27 1:43 PM2017/10/27 1:43 PM

22 | PAN AFRICAN RESOURCES MINERAL RESOURCES AND MINERAL RESERVES REPORT 201722 | PAN AFRICAN RESOURCES MINERAL RESOURCES AND MINERAL RESERVES REPORT 2017
STAKEHOLDER ENGAGEMENT, VALUE CREATION
AND DISTRIBUTION
Pan African’s stakeholders are integral to the group’s growth, value
creation and sustainability. They have been identified as one of
our four key strategic pillars which include: profitable, sustainable,
stakeholders and growth. Stakeholder feedback and concerns
are carefully considered when reviewing and refining strategy,
which fosters realistic perceptions by and expectations from our
stakeholders of our business, decisions and performance.
OUR KEY STAKEHOLDERS
Employees:Permanent and
contractors
Suppliers
Communities
Customers:Refineries, banks and communities
Listing exchangesUnions:
NUM, UASA and AMCU
Government and regulators:
DMR and municipalities
Providers of capital:Investors,
shareholders and banks
Constructive dialogue and engagement
Ongoing engagement
Informing strategy
Stakeholder feedback
PAR Mr&MR FULL report FA.indd 22PAR Mr&MR FULL report FA.indd 22 2017/10/27 1:43 PM2017/10/27 1:43 PM

PAN AFRICAN RESOURCES MINERAL RESOURCES AND MINERAL RESERVES REPORT 2017 | 23
STAKEHOLDER ENGAGEMENT APPROACHStakeholder engagement is important to the group as it fosters
transparent communication channels to share information and
proactively resolve concerns, while at the same time balancing the
expectations of shareholders and other stakeholders. It is essential in
shaping our strategy, better managing risks, identifying opportunities
and managing our reputation.
Stakeholder engagement takes place centrally at the corporate office
and operationally at all the operations. The Chief Executive Officer
assumes responsibility at a corporate office level and is supported by
the Financial Director as they engage with investors and analysts, the
Executive: Human Resources who engages with labour unions and
employees and the operational management who engages with the
DMR on health and safety issues. At an operational level, stakeholder
engagement is the responsibility of the general and human resources
managers. The board also engages with shareholders at the AGM and
on an ad hoc basis, when required.
Concerns raised operationally are governed by the management
committee and at a board level the SHEQC committee oversees
stakeholder concerns.
KEY STAKEHOLDERSThe group’s operations impact various stakeholder groups, some more
materially than others, depending on the nature of the engagement.
In determining and prioritising our stakeholders we consider, inter alia,
the following factors:
• How the stakeholder impacts our business from a strategic and
reputational perspective.
• The risk we are exposed to should the group not actively engage
with the stakeholder.
• The opportunities realised in actively engaging with the stakeholder.
• What impact the stakeholder has on our operational performance.
• How the stakeholder informs our material issues.
• Corporate and social responsibility towards specific stakeholders.
STAKEHOLDERS’ KEY CONCERNS DURING FY2017The table below shows the key concerns raised by stakeholders during the year under review and how Pan African Resources responded to each
concern.
Key concern Stakeholders impacted Pan African Resources response
Reference to
further input
Three fatalities
– one at Evander
Mines and two at
Barberton Mines
Employee injuries
and safety concerns
• Employees.
• Government and
regulatory body –
DMR.
• The group continues to dedicate considerable effort to achieve
and maintain zero harm and processes have been introduced to
further improve the group’s safety measures to reduce the risk
of future incidents, such as the shaft infrastructure upgrade at
Evander Mines.
• Safety awareness campaigns were improved and made more
practical. A priority going forward is to improve the learnings
from potential incidents, as a preventative tool in improved
performance.
• A key focus is on the behavioural component of our safety
strategy and reinforcement of frontline supervision.
• The group’s safety dashboard system continues to manage and
monitor all operations’ safety systems.
Page 70 of
the integrated
annual report
628 Evander Mines
employees were
retrenched following
a restructure and
retrenchment
programme
• Employees.
• Unions.
• Providers of capital –
debt and equity.
• Management actively engaged with affected employees and
organised labour and a retrenchment agreement was reached
with NUM and UASA.
• A steering committee between Evander Mines, the community
and municipality was established to drive various job
opportunities and entrepreneurship prospects, once the Elikhulu
Project commences construction.
Page 10 of
the integrated
annual report
Increase in DMR
section 54 stoppages
at both Barberton
Mines and Evander
Mines
• Employees.
• Government and
regulatory body –
DMR.
• Providers of capital –
debt and equity.
• DMR section 54 stoppages impact on the morale of employees
and on operational performance, however we consistently
review the effective safety controls that we have implemented
to support and demonstrate good employee practices.
• The group continues to engage in an active and transparent
manner with the DMR inspectorate to strive for a zero-harm
working environment.
Page 9 of the
integrated
annual report
PAR Mr&MR FULL report FA.indd 23PAR Mr&MR FULL report FA.indd 23 2017/10/27 1:43 PM2017/10/27 1:43 PM
24 | PAN AFRICAN RESOURCES MINERAL RESOURCES AND MINERAL RESERVES REPORT 2017
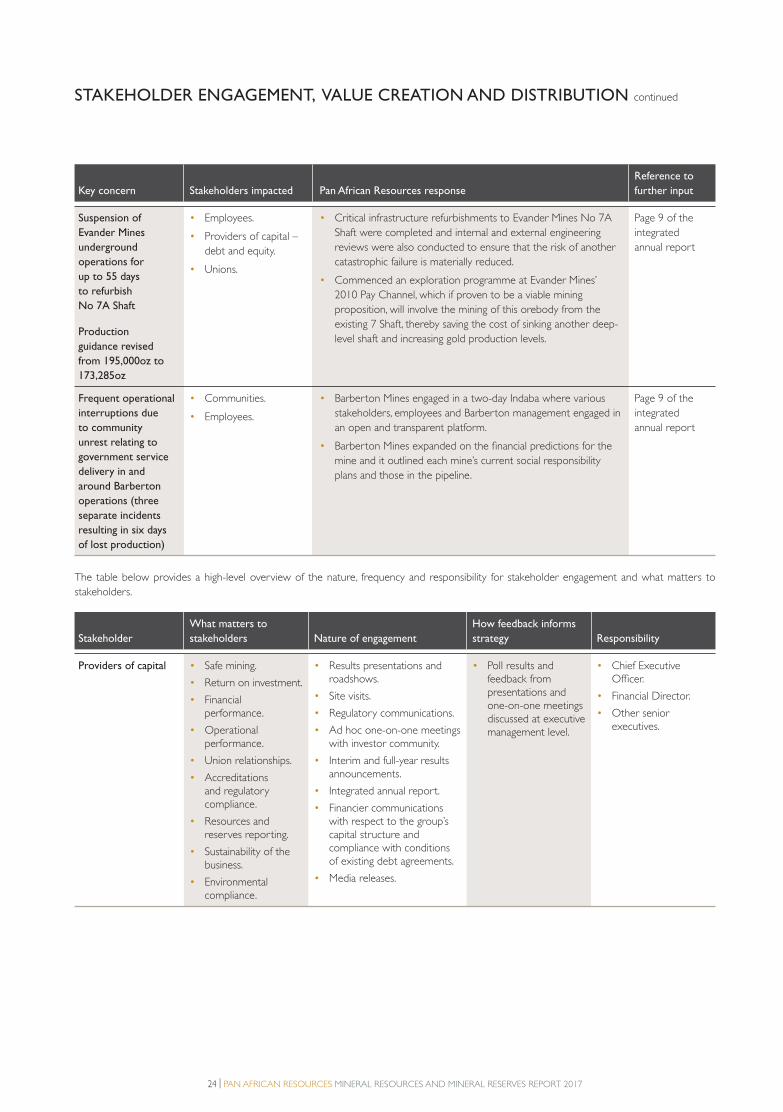
STAKEHOLDER ENGAGEMENT, VALUE CREATION AND DISTRIBUTION continued
Key concern Stakeholders impacted Pan African Resources response
Reference to
further input
Suspension of
Evander Mines
underground
operations for
up to 55 days
to refurbish
No 7A Shaft
Production
guidance revised
from 195,000oz to
173,285oz
• Employees.
• Providers of capital –
debt and equity.
• Unions.
• Critical infrastructure refurbishments to Evander Mines No 7A
Shaft were completed and internal and external engineering
reviews were also conducted to ensure that the risk of another
catastrophic failure is materially reduced.
• Commenced an exploration programme at Evander Mines’
2010 Pay Channel, which if proven to be a viable mining
proposition, will involve the mining of this orebody from the
existing 7 Shaft, thereby saving the cost of sinking another deep-
level shaft and increasing gold production levels.
Page 9 of the
integrated
annual report
Frequent operational
interruptions due
to community
unrest relating to
government service
delivery in and
around Barberton
operations (three
separate incidents
resulting in six days
of lost production)
• Communities.
• Employees.
• Barberton Mines engaged in a two-day Indaba where various
stakeholders, employees and Barberton management engaged in
an open and transparent platform.
• Barberton Mines expanded on the financial predictions for the
mine and it outlined each mine’s current social responsibility
plans and those in the pipeline.
Page 9 of the
integrated
annual report
The table below provides a high-level overview of the nature, frequency and responsibility for stakeholder engagement and what matters to
stakeholders.
Stakeholder
What matters to
stakeholders Nature of engagement
How feedback informs
strategy Responsibility
Providers of capital • Safe mining.
• Return on investment.
• Financial performance.
• Operational performance.
• Union relationships.
• Accreditations and regulatory compliance.
• Resources and reserves reporting.
• Sustainability of the business.
• Environmental compliance.
• Results presentations and roadshows.
• Site visits.
• Regulatory communications.
• Ad hoc one-on-one meetings with investor community.
• Interim and full-year results announcements.
• Integrated annual report.
• Financier communications with respect to the group’s capital structure and compliance with conditions of existing debt agreements.
• Media releases.
• Poll results and feedback from presentations and one-on-one meetings discussed at executive management level.
• Chief Executive Officer.
• Financial Director.
• Other senior executives.
PAR Mr&MR FULL report FA.indd 24PAR Mr&MR FULL report FA.indd 24 2017/10/27 1:43 PM2017/10/27 1:43 PM

PAN AFRICAN RESOURCES MINERAL RESOURCES AND MINERAL RESERVES REPORT 2017 | 25
Stakeholder
What matters to
stakeholders Nature of engagement
How feedback informs
strategy Responsibility
Employees • Safety.
• Transformation.
• Job security.
• Reward and incentives.
• Holistic and occupational health.
• Skills development and training.
• Environmental exposure.
• Bargaining council forums.
• Shaft committees.
• Health and safety structures.
• Supervisory and disciplinary structures.
• Social media.
• Publicity and posters.
• Policy and procedure documents.
• One-on-one supervision.
• Contract negotiations.
• Performance assessments.
• Future forum meetings.
• Discussed at operational, executive and board level.
• Operational human resource managers.
• Group Executive Human Resources.
• Group SHEQC manager.
• Other senior executives.
Suppliers • Group financial performance.
• Payment track record.
• Growth project pipeline.
• Loyalty.
• One-on-one meetings. • Discussed at operational and executive management level.
• General managers and financial managers.
• Group procurement manager.
Communities • Job creation.
• Corporate social investment.
• Environmental conservation/ protection.
• Community meetings and forums.
• Media.
• Discussed at the SHEQC committee, Exco and board level.
• General managers.
• Community liaison managers at each operation.
• CSI officers at each operation.
Unions • Health and safety.
• Transformation.
• Job security.
• Fair remuneration and reward.
• Employee committees.
• Branch committees.
• Shaft committees.
• Mine committees.
• Discussions between union and management occur on the mines and the outcomes are conveyed to the corporate office.
• Discussed at operational, executive and board level.
• Group Executive: Human Resources.
• Shaft/mine/ branch committees.
Government and
regulators
• Transformation.
• Mining Charter
compliance.
• Job creation.
• Safe mining.
• Profitable mining.
• Regular and frequent
communication with
Departments: DMR, Labour,
Water Affairs, Education
and Public Works and local
municipalities’ independent
development plans.
• Discussed
at executive
management and
board level.
• General managers.
• Chief Executive
Officer.
• Other senior
executives.
Customers • Quality.
• Timeous delivery.
• Price.
• Volumes.
• One-on-one meetings with
the refinery.
• Discussed
at executive
management and
board level.
• General managers.
• Metallurgical
managers.
Listing exchanges • Compliance with
listing requirements.
• Sponsor (JSE) and Nomad
(AIM) review and oversight.
• Panel reviews of reported
information.
• Discussed at board
and executive
directors level.
• Chief Executive
Officer.
• Financial Director.
• Other senior
executives.
PAR Mr&MR FULL report FA.indd 25PAR Mr&MR FULL report FA.indd 25 2017/10/27 1:43 PM2017/10/27 1:43 PM

26 | PAN AFRICAN RESOURCES MINERAL RESOURCES AND MINERAL RESERVES REPORT 2017
STAKEHOLDER ENGAGEMENT, VALUE CREATION AND DISTRIBUTION continued
Pan African Resources remains committed to creating value for all stakeholders and
recognises that all its capital resources are interconnected – as one capital resource is
increased or created, another is depleted. To ensure future sustainability, it is important
to balance the use of these capital resources.
As depicted in the group’s business model on page 6 of the integrated annual
report, capital inputs are used in its mining activities to create value, which is
distributed to various stakeholders by way of payment for services and goods, salaries
and wages, corporate social investment, taxes and dividends. The mining industry is
heavily dependent on various factors to sustain value creation, some of which are
beyond its control.
The group is cognisant of the need to explore and crystallise other opportunities,
either through organic or acquisitive growth, to ensure it can sustain and enhance
the value it creates. Opportunities currently under development include the Elikhulu
Project (see page 11 of the integrated annual report) and the 2010 Pay Channel
(see page 11 of the integrated annual report). In addition to organic and acquisitive
growth, the group reinvested ZAR518.1 million (2016: ZAR771.3 million), which is
14.6% (2016: 21.2%) of the total value created, to sustain its existing operations.
Creating value for employees is important to ensure the group attracts and retains
its talent. The group has 3,932 permanent employees (2016: 4,441) and distributed
ZAR950.6 million (2016: ZAR891.5 million) in salaries and other remuneration during
the year under review, which in turn positively impacts the communities within which
these employees reside – as well as the broader economy where their salaries are
spent. In addition, the group has implemented employee share ownership schemes,
which seek to align the aspirations of the group’s employees at its operations with that
of management and shareholders. These employee share ownership schemes enable
employees to participate directly in the value created at their respective operations.
Further detail on the employee share ownership programme is shown on page 78
of the integrated annual report.
Distributions to suppliers for the provision of services and goods totalled
ZAR1,626.2 million (2016: ZAR1,458.7 million), which has a direct and broad
economic impact on the manufacturing, engineering and chemical sectors.
The group strives to uplift, both economically and socially, the communities within
which it operates. The social value created is driven through the respective operations’
SLPs, which include relevant social upliftment projects based on the needs of these
communities. The group distributed ZAR24.3 million (2016: ZAR21.0 million) through
its corporate social investment and local economic development initiatives.
The group’s contribution to the fiscus was ZAR141.0 million (2016:
ZAR269.6 million). These taxes contribute to the infrastructure development,
educational needs, health, social and various other services rendered by the
government in pursuit of the economic and social upliftment of South Africa.
Shareholder value, measured as total shareholder returns, is determined by share
price performance and dividend declarations. The group’s sector-leading dividend and
track record of sustained dividend payments is a key differentiating factor relative to
its peer group. Over the past five years, the group’s total dividends paid amounted to
ZAR1,008.3 million or GBP65.4 million (2016: ZAR803.9 million or GBP46.7 million).
VALUE CREATION AND
DISTRIBUTION
40.0% Suppliers24.4% Employees 21.2% Reinvested 5.8% Shareholders 7.1% Taxation 0.9% Finance costs 0.6% Corporate social investment and local economic development
2016
45.9% Suppliers26.8% Employees 14.6% Reinvested 6.6% Shareholders 4.0% Taxation 1.4% Finance costs 0.7% Corporate social investment and local economic development
2017
Using our financial, human, manufactured and natural capital resources, Pan African Resources endeavours to create value and positively
impact all stakeholders with whom it interacts, including communities, employees, government, shareholders and suppliers. During the year
under review, the group created ZAR1,915.1 million in value (2016: ZAR2,183.6 million), which was distributed to our various stakeholders.
STAKEHOLDER VALUE CREATION AND DISTRIBUTION
PAR Mr&MR FULL report FA.indd 26PAR Mr&MR FULL report FA.indd 26 2017/10/27 1:43 PM2017/10/27 1:43 PM

PAN AFRICAN RESOURCES MINERAL RESOURCES AND MINERAL RESERVES REPORT 2017 | 27
The mineral resources and mineral reserves underpin the enterprise value of Pan African Resources,
and the group’s position on its mineral resources and mineral reserves is presented below.
GOLD
Group mineral resourcesThe total mineral resources for the group decreased from 34.9 million ounces (Moz) in
June 2016 to 34.4Moz in June 2017 – a gross annual decrease of 0.5Moz, or 1.4%.
Contained gold
As at 30 June 2017 Category
Tonnes
million
Grade
g/t Tonnes Moz
Mineral Resources Measured 5.3 10.94 57.6 1.9
Indicated 262.2 2.43 636.2 20.4
Inferred 70.4 5.35 376.5 12.1
Resources Total 337.9 3.17 1 070.3 34.4
Group Mineral ReservesPan African Resources’ mineral reserves increased from 10.0Moz in June 2016 to 11.2Moz in
June 2017 – a gross annual increase of 1.2Moz, or 12.0%.
Contained gold
As at 30 June 2017 Category
Tonnes
million
Grade
g/t Tonnes Moz
Mineral Reserves Proved 4.1 7.19 29.8 1.0
Probable 227.7 1.40 317.9 10.2
Reserves Total 231.8 1.50 347.7 11.2
The increase can primarily be attributed to the conversion of the Elikhulu Project mineral
resouces to mineral reserves.
PGEs
Group Mineral ResourcesThe group’s total mineral resource PGEs did not change materially for the year under review.
Contained PGEs 4E
As at 30 June 2017 Category
Tonnes
million
Grade
g/t Tonnes Moz
Mineral Resources Measured
Indicated 2.3 2.32 5.4 0.2
Inferred 3.4 3.67 12.5 0.4
Resources Total 5.7 3.12 17.9 0.6
Group Mineral ReservesPan African Resources’ mineral reserve PGEs did not change materially for the year under review.
Contained PGEs 4E
As at 30 June 2017 Category
Tonnes
million
Grade
g/t Tonnes Moz
Mineral Reserves Proved
Probable 2.3 2.32 5.4 0.2
Reserves Total 2.3 2.32 5.4 0.2
GROUP MINERAL RESOURCES AND MINERAL RESERVES
GROUP GOLD %
CHANGES DURING 2017
GROUP – PGEs 2016 (%)
Mineral Reserves
12.0%
Mineral Resources
1.4%
Mineral Reserves
Mineral Resources
0%
0%
Increase attributed to conversion
of Elikhulu to mineral reserves
PAR Mr&MR FULL report FA.indd 27PAR Mr&MR FULL report FA.indd 27 2017/10/27 1:43 PM2017/10/27 1:43 PM

28 | PAN AFRICAN RESOURCES MINERAL RESOURCES AND MINERAL RESERVES REPORT 2017
The operations’ robust life of mine plans support the group business plans. Current exploration drilling as well as activities to access and develop
our orebodies were aggressively maintained during the year. The strategy of converting mineral resources to mineral reserves was progressed by
moving organic projects further up the mining value chain towards feasibility or production. The tables below reflect the progress of near-mine
growth projects that have contributed ounces to the mineral resources for the year.
EXPLORING THE OREBODY: EXPLORATION DRILLING
Operation
Total
metres
Number
of
boreholes
Average
channel
width
cm
Number
of
intersections
above
cut-off
Average
grade
g/t
Total
expenditure
ZAR million
Barberton Mines 8,793 106 136 34 17 4.7
Evander Mines 783 14 31 6 28 1.4
ACCESSING THE OREBODY: ON-REEF DEVELOPMENT
Operation
Total
on-reef
development
metres
Average
grade
g/t
Barberton Mines 2,533 6.20
Evander Mines 245 28.86
DEVELOPING THE OREBODY: CAPITAL ORE RESERVE PROJECTS – BARBERTON MINES
Project
2017
metres
2016
metres
2015
metres
Potential
resource
target
oz
Sheba – pillar development 450 540 824 10,101
Sheba – Edwin Bray to Thomas and Joe’s Luck area 8 27 5 18,701
Fairview – 11 Level Royal Reef – Equipping Equipping 826
Fairview – 1# one reserve opening 71 131 84 13,958
Fairview – No 3 Shaft deepening 171 64 26 22,943
Fairview – (64 – 68) Level 451 581 447 851,562
New Consort – (33 – 45) PC 265 387 258 10,000
New Consort – MMR pillar development 8 – – 66,309
New Consort – No 3 Shaft – 17 327 5,969
Royal Sheba 143 189 165 309,180
Sheba Western Cross 4 133 295 25,143
CAPITAL ORE RESERVE PROJECTS: EVANDER MINES
Project
2017
metres
2016
metres
2015
metres
Potential
resource
target
oz
No 2 Decline 24 – 25 Level 73 356 9041,200,000
25 A block ventilation 222 87 10
GROUP ORGANIC GROWTH
PAR Mr&MR FULL report FA.indd 28PAR Mr&MR FULL report FA.indd 28 2017/10/27 1:43 PM2017/10/27 1:43 PM
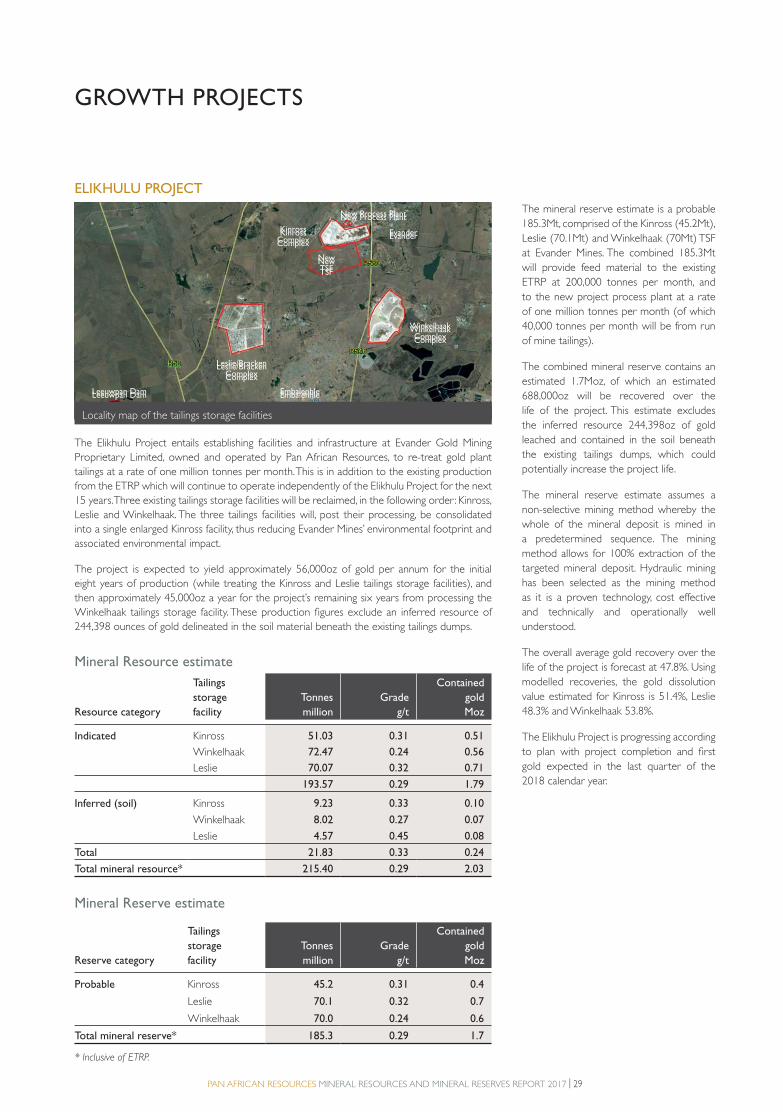
PAN AFRICAN RESOURCES MINERAL RESOURCES AND MINERAL RESERVES REPORT 2017 | 29
ELIKHULU PROJECT
Locality map of the tailings storage facilities
New Process Plant
Evander
EmbalenhleLeeuwpan Dam
Winkelhaak
Complex
Leslie/Bracken
Complex
Kinross
Complex
New
TSF
The Elikhulu Project entails establishing facilities and infrastructure at Evander Gold Mining
Proprietary Limited, owned and operated by Pan African Resources, to re-treat gold plant
tailings at a rate of one million tonnes per month. This is in addition to the existing production
from the ETRP which will continue to operate independently of the Elikhulu Project for the next
15 years. Three existing tailings storage facilities will be reclaimed, in the following order: Kinross,
Leslie and Winkelhaak. The three tailings facilities will, post their processing, be consolidated
into a single enlarged Kinross facility, thus reducing Evander Mines’ environmental footprint and
associated environmental impact.
The project is expected to yield approximately 56,000oz of gold per annum for the initial
eight years of production (while treating the Kinross and Leslie tailings storage facilities), and
then approximately 45,000oz a year for the project’s remaining six years from processing the
Winkelhaak tailings storage facility. These production figures exclude an inferred resource of
244,398 ounces of gold delineated in the soil material beneath the existing tailings dumps.
Mineral Resource estimate
Resource category
Tailings
storage
facility
Tonnes
million
Grade
g/t
Contained
gold
Moz
Indicated Kinross 51.03 0.31 0.51
Winkelhaak 72.47 0.24 0.56
Leslie 70.07 0.32 0.71
193.57 0.29 1.79
Inferred (soil) Kinross 9.23 0.33 0.10
Winkelhaak 8.02 0.27 0.07
Leslie 4.57 0.45 0.08
Total 21.83 0.33 0.24
Total mineral resource* 215.40 0.29 2.03
Mineral Reserve estimate
Reserve category
Tailings
storage
facility
Tonnes
million
Grade
g/t
Contained
gold
Moz
Probable Kinross 45.2 0.31 0.4
Leslie 70.1 0.32 0.7
Winkelhaak 70.0 0.24 0.6
Total mineral reserve* 185.3 0.29 1.7
* Inclusive of ETRP.
GROWTH PROJECTS
The mineral reserve estimate is a probable
185.3Mt, comprised of the Kinross (45.2Mt),
Leslie (70.1Mt) and Winkelhaak (70Mt) TSF
at Evander Mines. The combined 185.3Mt
will provide feed material to the existing
ETRP at 200,000 tonnes per month, and
to the new project process plant at a rate
of one million tonnes per month (of which
40,000 tonnes per month will be from run
of mine tailings).
The combined mineral reserve contains an
estimated 1.7Moz, of which an estimated
688,000oz will be recovered over the
life of the project. This estimate excludes
the inferred resource 244,398oz of gold
leached and contained in the soil beneath
the existing tailings dumps, which could
potentially increase the project life.
The mineral reserve estimate assumes a
non-selective mining method whereby the
whole of the mineral deposit is mined in
a predetermined sequence. The mining
method allows for 100% extraction of the
targeted mineral deposit. Hydraulic mining
has been selected as the mining method
as it is a proven technology, cost effective
and technically and operationally well
understood.
The overall average gold recovery over the
life of the project is forecast at 47.8%. Using
modelled recoveries, the gold dissolution
value estimated for Kinross is 51.4%, Leslie
48.3% and Winkelhaak 53.8%.
The Elikhulu Project is progressing according
to plan with project completion and first
gold expected in the last quarter of the
2018 calendar year.
Locality map of the tailings storage facilities
New Process Plant
Evander
EmbalenhleLeeuwpan Dam
Winkelhaak
Complex
Leslie/Bracken
Complex
Kinross
Complex
New
TSF
PAR Mr&MR FULL report FA.indd 29PAR Mr&MR FULL report FA.indd 29 2017/10/27 1:43 PM2017/10/27 1:43 PM

30 | PAN AFRICAN RESOURCES MINERAL RESOURCES AND MINERAL RESERVES REPORT 2017
BARBERTON MINES SUB-VERTICAL SHAFT PROJECT AT FAIRVIEW MINE
Fairview sub-vertical shaft design
Proposed sub-vertical shaft
Ventilation raise-bore
Fairview No 3 decline
Proposed mine design
No 11-block
MRC orebody @30g/t
MRC
ore
body
ext
ension
Contained gold
As at 30 June 2017 Category
Tonnes
million
Grade
g/t Tonnes Moz
Mineral Resources Measured 1.08 10.92 11.26 0.38
Indicated 1.06 14.13 14.97 0.48
Inferred 2.68 14.90 39.93 1.28
Resources Total 4.82 13.79 66.16 2.14
Contained gold
As at 30 June 2017 Category
Tonnes
million
Grade
g/t Tonnes Moz
Mineral Reserves Proved 0.51 10.05 6.68 0.21
Probable 1.50 13.89 18.28 0.58
Reserves Total 2.01 12.42 24.96 0.79
GROWTH PROJECTS continued
The Fairview mining operation is currently
restricted by the hoisting capacity of its
No 3 Decline, which is used to access
workings below 42 Level. This decline is
currently used to transport employees
and material, and for rock hoisting. The
11-block, or MRC, orebody has an average
grade of 31.3g/t and current life of mine of
20 years. With no intervention, future
mining at depth will result in increased
travelling distance, reduce employee face
time and cause a lack of capacity to ensure
both ore replacement and exploration
development.
Pan African Resources, with the assistance
of DRA Projects SA Proprietary Limited
(DRA), has completed a feasibility study
on the construction of a raise-bored, sub-
vertical shaft from Fairviews’ 42 Level to
64 Level, with the potential of continuing
the vertical shaft to 68 Level in future. This
sub-vertical shaft will be used to transport
employees and material to the working
areas, which will allow the No 3 Decline
to be used exclusively for rock hoisting,
increasing overall capacity and production
from this mining area.
DRA has reviewed the technical and
commercial aspects of the project and
the supporting feasibility study has
yielded very positive results. The estimated
capital expenditure for the project,
including contingencies, is approximately
ZAR105 million, to be incurred over a two-
year period. The productivity improvements
for Fairview are estimated to yield an
additional 7,000oz of gold per annum,
which can be optimised further to more
than 10,000oz per annum.
PAR Mr&MR FULL report FA.indd 30PAR Mr&MR FULL report FA.indd 30 2017/10/27 1:43 PM2017/10/27 1:43 PM
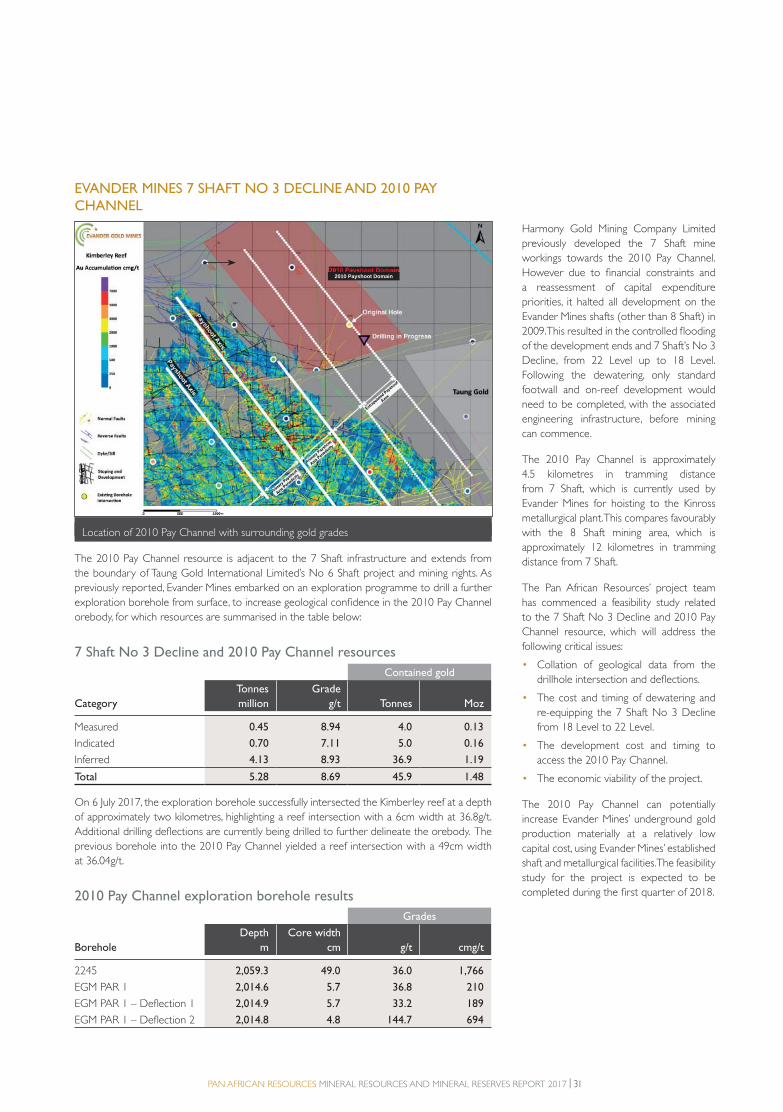
PAN AFRICAN RESOURCES MINERAL RESOURCES AND MINERAL RESERVES REPORT 2017 | 31
EVANDER MINES 7 SHAFT NO 3 DECLINE AND 2010 PAY CHANNEL
Location of 2010 Pay Channel with surrounding gold grades
2010 Payshoot Domain
The 2010 Pay Channel resource is adjacent to the 7 Shaft infrastructure and extends from
the boundary of Taung Gold International Limited’s No 6 Shaft project and mining rights. As
previously reported, Evander Mines embarked on an exploration programme to drill a further
exploration borehole from surface, to increase geological confidence in the 2010 Pay Channel
orebody, for which resources are summarised in the table below:
7 Shaft No 3 Decline and 2010 Pay Channel resources
Contained gold
Category
Tonnes
million
Grade
g/t Tonnes Moz
Measured 0.45 8.94 4.0 0.13
Indicated 0.70 7.11 5.0 0.16
Inferred 4.13 8.93 36.9 1.19
Total 5.28 8.69 45.9 1.48
On 6 July 2017, the exploration borehole successfully intersected the Kimberley reef at a depth
of approximately two kilometres, highlighting a reef intersection with a 6cm width at 36.8g/t.
Additional drilling deflections are currently being drilled to further delineate the orebody. The
previous borehole into the 2010 Pay Channel yielded a reef intersection with a 49cm width
at 36.04g/t.
2010 Pay Channel exploration borehole results
Grades
Borehole
Depth
m
Core width
cm g/t cmg/t
2245 2,059.3 49.0 36.0 1,766
EGM PAR 1 2,014.6 5.7 36.8 210
EGM PAR 1 – Deflection 1 2,014.9 5.7 33.2 189
EGM PAR 1 – Deflection 2 2,014.8 4.8 144.7 694
Harmony Gold Mining Company Limited
previously developed the 7 Shaft mine
workings towards the 2010 Pay Channel.
However due to financial constraints and
a reassessment of capital expenditure
priorities, it halted all development on the
Evander Mines shafts (other than 8 Shaft) in
2009. This resulted in the controlled flooding
of the development ends and 7 Shaft’s No 3
Decline, from 22 Level up to 18 Level.
Following the dewatering, only standard
footwall and on-reef development would
need to be completed, with the associated
engineering infrastructure, before mining
can commence.
The 2010 Pay Channel is approximately
4.5 kilometres in tramming distance
from 7 Shaft, which is currently used by
Evander Mines for hoisting to the Kinross
metallurgical plant. This compares favourably
with the 8 Shaft mining area, which is
approximately 12 kilometres in tramming
distance from 7 Shaft.
The Pan African Resources’ project team
has commenced a feasibility study related
to the 7 Shaft No 3 Decline and 2010 Pay
Channel resource, which will address the
following critical issues:
• Collation of geological data from the
drillhole intersection and deflections.
• The cost and timing of dewatering and
re-equipping the 7 Shaft No 3 Decline
from 18 Level to 22 Level.
• The development cost and timing to
access the 2010 Pay Channel.
• The economic viability of the project.
The 2010 Pay Channel can potentially
increase Evander Mines’ underground gold
production materially at a relatively low
capital cost, using Evander Mines’ established
shaft and metallurgical facilities. The feasibility
study for the project is expected to be
completed during the first quarter of 2018.
Location of 2010 Pay Channel with surrounding gold grades
2010 Payshoot Domain
PAR Mr&MR FULL report FA.indd 31PAR Mr&MR FULL report FA.indd 31 2017/10/27 1:43 PM2017/10/27 1:43 PM
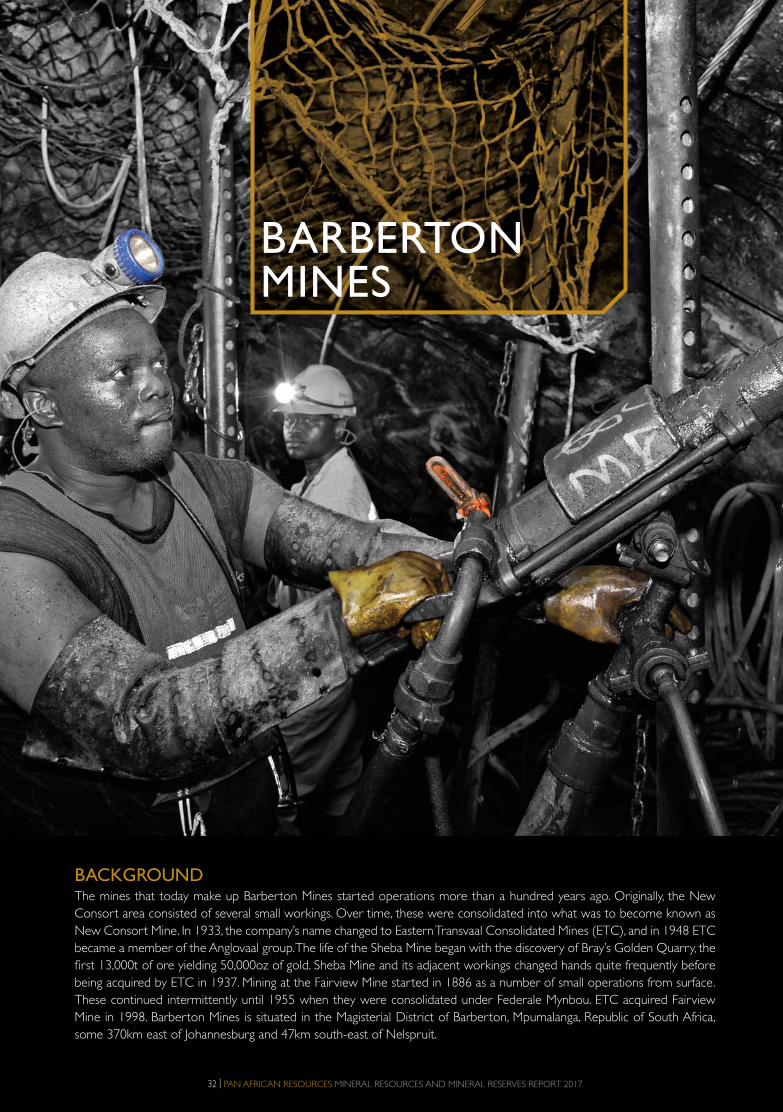
BARBERTON MINES
32 | PAN AFRICAN RESOURCES MINERAL RESOURCES AND MINERAL RESERVES REPORT 2017
BACKGROUNDThe mines that today make up Barberton Mines started operations more than a hundred years ago. Originally, the New
Consort area consisted of several small workings. Over time, these were consolidated into what was to become known as
New Consort Mine. In 1933, the company’s name changed to Eastern Transvaal Consolidated Mines (ETC), and in 1948 ETC
became a member of the Anglovaal group. The life of the Sheba Mine began with the discovery of Bray’s Golden Quarry, the
first 13,000t of ore yielding 50,000oz of gold. Sheba Mine and its adjacent workings changed hands quite frequently before
being acquired by ETC in 1937. Mining at the Fairview Mine started in 1886 as a number of small operations from surface.
These continued intermittently until 1955 when they were consolidated under Federale Mynbou. ETC acquired Fairview
Mine in 1998. Barberton Mines is situated in the Magisterial District of Barberton, Mpumalanga, Republic of South Africa,
some 370km east of Johannesburg and 47km south-east of Nelspruit.
PAR Mr&MR FULL report FA.indd 32PAR Mr&MR FULL report FA.indd 32 2017/10/27 1:43 PM2017/10/27 1:43 PM
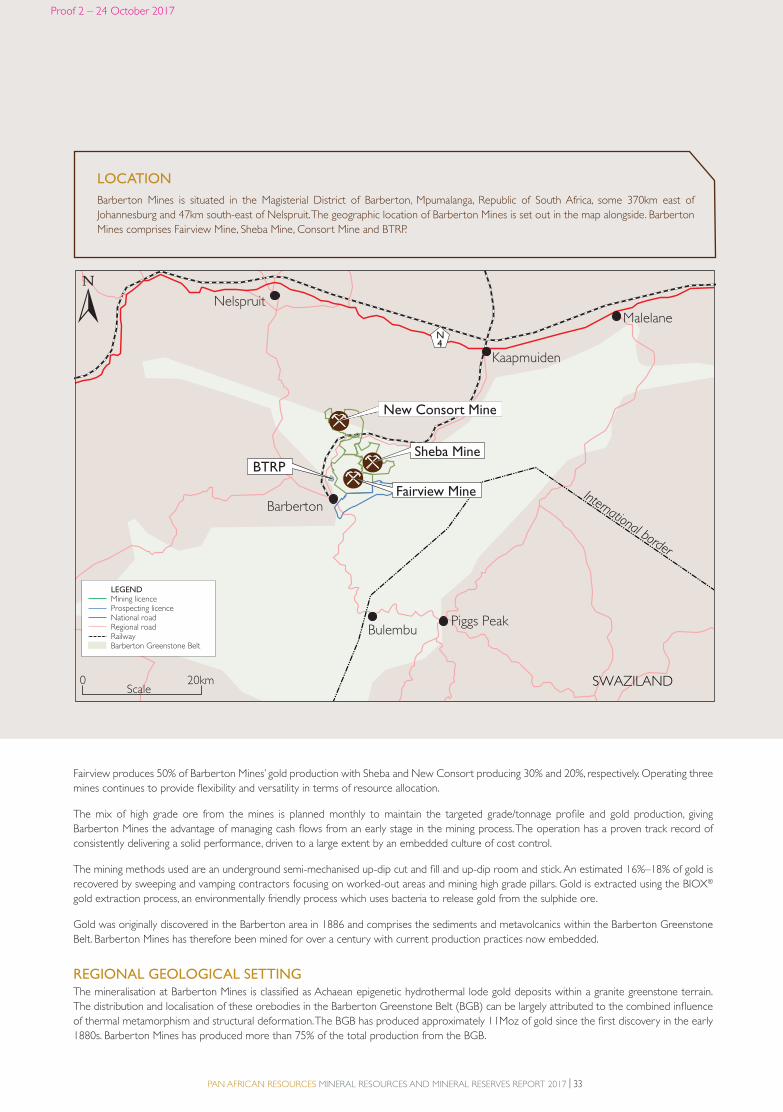
PAN AFRICAN RESOURCES MINERAL RESOURCES AND MINERAL RESERVES REPORT 2017 | 33
Fairview produces 50% of Barberton Mines’ gold production with Sheba and New Consort producing 30% and 20%, respectively. Operating three
mines continues to provide flexibility and versatility in terms of resource allocation.
The mix of high grade ore from the mines is planned monthly to maintain the targeted grade/tonnage profile and gold production, giving
Barberton Mines the advantage of managing cash flows from an early stage in the mining process. The operation has a proven track record of
consistently delivering a solid performance, driven to a large extent by an embedded culture of cost control.
The mining methods used are an underground semi-mechanised up-dip cut and fill and up-dip room and stick. An estimated 16%–18% of gold is
recovered by sweeping and vamping contractors focusing on worked-out areas and mining high grade pillars. Gold is extracted using the BIOX®
gold extraction process, an environmentally friendly process which uses bacteria to release gold from the sulphide ore.
Gold was originally discovered in the Barberton area in 1886 and comprises the sediments and metavolcanics within the Barberton Greenstone
Belt. Barberton Mines has therefore been mined for over a century with current production practices now embedded.
REGIONAL GEOLOGICAL SETTINGThe mineralisation at Barberton Mines is classified as Achaean epigenetic hydrothermal lode gold deposits within a granite greenstone terrain.
The distribution and localisation of these orebodies in the Barberton Greenstone Belt (BGB) can be largely attributed to the combined influence
of thermal metamorphism and structural deformation. The BGB has produced approximately 11Moz of gold since the first discovery in the early
1880s. Barberton Mines has produced more than 75% of the total production from the BGB.
SWAZILAND20km0Scale
N4
Nelspruit
Barberton
Piggs PeakBulembu
Kaapmuiden
Malelane
International border
BTRP
New Consort Mine
Sheba Mine
Fairview Mine
LEGENDMining licenceProspecting licenceNational roadRegional roadRailwayBarberton Greenstone Belt
Barberton Mines is situated in the Magisterial District of Barberton, Mpumalanga, Republic of South Africa, some 370km east of
Johannesburg and 47km south-east of Nelspruit. The geographic location of Barberton Mines is set out in the map alongside. Barberton
Mines comprises Fairview Mine, Sheba Mine, Consort Mine and BTRP.
LOCATION
Proof 2 – 24 October 2017
PAR Mr&MR FULL report FA.indd 33PAR Mr&MR FULL report FA.indd 33 2017/10/27 1:43 PM2017/10/27 1:43 PM

34 | PAN AFRICAN RESOURCES MINERAL RESOURCES AND MINERAL RESERVES REPORT 2017
BARBERTON MINES continued
BullionA B
G H
BTRP
Lilly Fault
X+
40,0
00
X+
45,0
00
X+
50,0
00
Y-15,000Y-10,000Y-5,000
Margaret, Mamba and Eureka
Fairview slimes dam
Barberton Mines
Barberton Mines ® Metallurgical PlantBIOX
Sheba slimes dams
0 2km
Infrastructure
Main roadTownShaft
Mine Authorisation Boundary
New Order Prospecting Area
Nelspruit SuiteKaap Vallei TonaliteOnverwacht GroupJameson Schist BeltMoodies GroupFig Tree GroupZwartkoppies FormationFault
Geology
LEGEND
N
L
M
K
Sheba Fault
Ulundi Syncline
Barbrook Fault
Thomas and Joe’s Luck
Florence
and Devonian
To Nelspruit
New Consort slimes dam
Sheba Mine
Fairview Mine
Royal Sheba Mine
Clutha Mine
Eagles Nest Mine
To Kaapmuiden
Eureka Syncline
New Consort Mine
Geological setting (sections are illustrated on the map along the mines to depict the mineralised geological structures)
GENESIS OF THE ORE IN BARBERTONMetamorphic devolatisation of the mafic and ultra-mafic Onverwacht lava at the transition from greenschist to amphibolite facies triggers the
process by which fluid is released. These low-salinity fluids, which transport gold as a reduced sulphur complex containing H2O, CO2 and H2S, are
released, form mineral crystal structures and can transport gold in solution to favourable depositional sites. It is calculated that a lava volume of ten
cubic kilometres is sufficient to have produced all the known gold mineralisation in the BGB. The Onverwacht Group consists of approximately four
thousand eight hundred cubic kilometres of potential parent material lava. The stability fields of most of the common sulphides in the Barberton
Mines ore (pyrite, arsenopyrite and pyrrhotite) indicate that the gold complex in the transport fluid is Au(HS)2.
To facilitate metal deposition from the hydrothermal fluid, the pressure, temperature or chemical conditions need to change. Most greenstone gold
deposits form as a result of the mineralised fluid coming into contact with an iron-bearing host rock. The Barberton Mines host lithologies are not
PAR Mr&MR FULL report FA.indd 34PAR Mr&MR FULL report FA.indd 34 2017/10/27 1:43 PM2017/10/27 1:43 PM

PAN AFRICAN RESOURCES MINERAL RESOURCES AND MINERAL RESERVES REPORT 2017 | 35
high in iron content, so the ore deposition occurred due to a drop in
fluid pressure. Pressure shadows, which form during dilating, faulting
and folding, create low-pressure zones, effectively sucking the fluids
into these spaces and releasing pressure. When pressure is released,
H2S (the ligand that makes gold soluble) is driven off, resulting in gold
precipitation.
The Barberton ores are thus mineralised shears with gold occluded in
sulphide minerals. The sulphides often occur as massive assemblages
in the shear structure. Lower ore grade disseminations of sulphide
minerals in the wall rock form as a result of the alteration process
during fluid flow. A late stage of gold mineralisation occurred when
quartz veins formed in brittle fractures. These quartz veins often
contain free gold in visible clusters.
GEOLOGICAL/RESOURCE ESTIMATION
METHODOLOGY
The resource was classified according to guidelines compliant with
the South African Code for Reporting of Exploration Results, Mineral
Resources and Mineral Reserves (the SAMREC Code, 2016).
Geological modelling
The grade and the structure in the ore shoots are highly erratic in
nature, and most of the data for evaluating resource blocks is derived
from development adjacent to the mining blocks and from the
position of the present mining areas. The continuity of grade values
within the ore shoots is derived primarily from short-range statistical
projections, based on experience that has been gained from historic
mining of the orebody and from the study of its tectonic structure.
The tectonic structure and orebody geometry has been modelled
using the Lynx orebody modelling system. This system allows the
three-dimensional structure of the mineralised volume to be viewed
graphically. This is used as a tool for visualising grade continuity and is
an aid for mine planning.
Resource estimationFor both diamond-cored drill hole and underground sampling, a
minimum sampling width of 230cm is used in the case of mechanical
mining, and 100cm for conventional scraper-type stoping. Where the
reef width is less than this value, hangingwall and footwall samples are
included.
Measured reserve blocks are generally 20m on strike and 10m in the
dip direction. Where blocks are defined adjacent to a development
end only, the grade and true width of the reef in the block are
estimated by calculating the arithmetic mean or ‘stretch average’ of
the samples along the development end. If the sample spacing is at
the standard 3m, the block value is derived by calculating the average
value of the samples. If the sample interval is variable, the block is
assigned the length-weighted arithmetic mean of the strip averages.
If the resource block is surrounded by sampling, either by previous
stope sampling or development sampling, the block is assigned values
based on the mean of the surrounding sample stretches. In each case,
one mean value is determined for each channel sampling section first
and the means are then averaged.
Exploration drill hole values are weighted by the inverse of the
distance from the sampling to the centre of indicated and inferred
blocks.
Where an individual sample value is greater than 100g/t, the grade is
capped at 100g/t. It has been found historically that if sample values
over 100g/t are capped, these abnormally high sample grade values
will not lead to over-valuation of the mean value of the stretch
samples, which are used to assign values to nearby resource blocks.
All samples are submitted to SGS Laboratories CC. The laboratories
are accredited by the South African National Accreditation System
(Facility No T0565); additionally the facility is accredited in accordance
with the recognised international standard. Samples are fire assayed
with gravimetric finish (Standard Specifications Equipment/Technique
used M701). A detailed account of the sampling, QA/QC and assaying
methods can be obtained from the competent person report
available on www.panafricanresources.com.
MINING RIGHTS The mineral rights pertaining to Barberton Mines were issued by the Department of Mineral Resources in terms of Item 7 of Schedule II
of the Minerals and Petroleum Resources Development Act, 2002 (No. 28 of 2002) (MPRDA).
Mineral rights to Barberton Mines comprise three separate mining rights for the three different mining operations. All three operations’ old order
rights were converted to the sole and exclusive right to mine on 28 April 2011. The description of the mining area of all these mines is situated
in the Mpumalanga Magisterial District of Barberton and the commodity is gold. All three of these mining rights will continue to be in force for
a period of 10 years, ending on 27 April 2021. Due process will be undertaken to maintain and renew these mining rights for the life of mine of
each mine.
Mine name Mining licence Mining area Area (ha) Expiry date
New Consort Mine
MP 30/5/1/2/2/190MR
Portions of the farms Dublin 302JU, Tinto 300JU, Segalla 306JU, Whitwick 301JU and Barberton Nature Reserve 964JU
2,520.81 27 April 2021
Fairview Mine
MP 30/5/1/2/2/191 MR
Portions of the farms Sheba 940JU, Worral 352JU, Hayward 310JU, Bramber East 314JU and Bickenhall 346JU
3,033.86 27 April 2021
Sheba Mine MP 30/5/1/2/2/189 MR
Portions of the farms Camelot 320JU, Sheba 940JU and Sheba Siding 939JU
1,705.06 27 April 2021
PAR Mr&MR FULL report FA.indd 35PAR Mr&MR FULL report FA.indd 35 2017/10/27 1:43 PM2017/10/27 1:43 PM
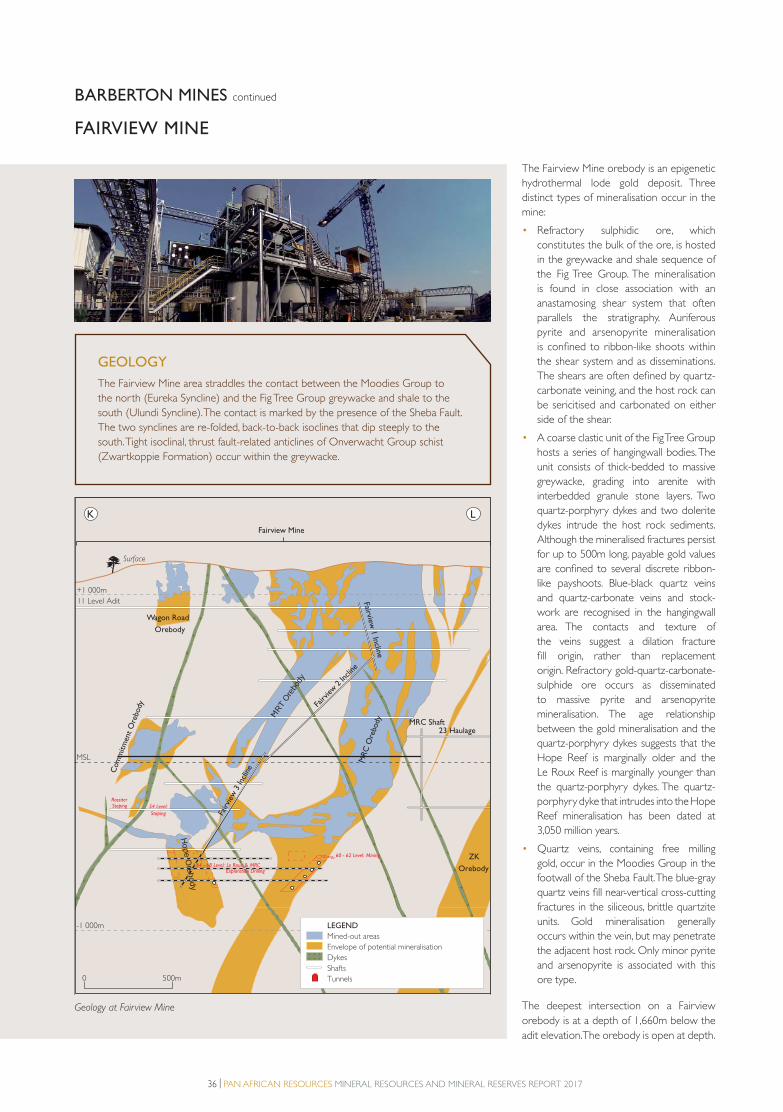
36 | PAN AFRICAN RESOURCES MINERAL RESOURCES AND MINERAL RESERVES REPORT 2017
The Fairview Mine orebody is an epigenetic
hydrothermal lode gold deposit. Three
distinct types of mineralisation occur in the
mine:
• Refractory sulphidic ore, which
constitutes the bulk of the ore, is hosted
in the greywacke and shale sequence of
the Fig Tree Group. The mineralisation
is found in close association with an
anastamosing shear system that often
parallels the stratigraphy. Auriferous
pyrite and arsenopyrite mineralisation
is confined to ribbon-like shoots within
the shear system and as disseminations.
The shears are often defined by quartz-
carbonate veining, and the host rock can
be sericitised and carbonated on either
side of the shear.
• A coarse clastic unit of the Fig Tree Group
hosts a series of hangingwall bodies. The
unit consists of thick-bedded to massive
greywacke, grading into arenite with
interbedded granule stone layers. Two
quartz-porphyry dykes and two dolerite
dykes intrude the host rock sediments.
Although the mineralised fractures persist
for up to 500m long, payable gold values
are confined to several discrete ribbon-
like payshoots. Blue-black quartz veins
and quartz-carbonate veins and stock-
work are recognised in the hangingwall
area. The contacts and texture of
the veins suggest a dilation fracture
fill origin, rather than replacement
origin. Refractory gold-quartz-carbonate-
sulphide ore occurs as disseminated
to massive pyrite and arsenopyrite
mineralisation. The age relationship
between the gold mineralisation and the
quartz-porphyry dykes suggests that the
Hope Reef is marginally older and the
Le Roux Reef is marginally younger than
the quartz-porphyry dykes. The quartz-
porphyry dyke that intrudes into the Hope
Reef mineralisation has been dated at
3,050 million years.
• Quartz veins, containing free milling
gold, occur in the Moodies Group in the
footwall of the Sheba Fault. The blue-gray
quartz veins fill near-vertical cross-cutting
fractures in the siliceous, brittle quartzite
units. Gold mineralisation generally
occurs within the vein, but may penetrate
the adjacent host rock. Only minor pyrite
and arsenopyrite is associated with this
ore type.
The deepest intersection on a Fairview
orebody is at a depth of 1,660m below the
adit elevation. The orebody is open at depth.
BARBERTON MINES continued
Surface
Fairview Mine
K L
23 Haulage
Fairview 1
Inclin
e
Fairv
iew 2 In
cline
Fairvi
ew 3
Incl
ine
MR
C O
rebo
dy
MRT
Orebo
dy
ZK
Orebody
Wagon Road
Orebody
Hope O
rebody
Com
mitm
ent
Ore
body
11 Level Adit
60 - 62 Level: Mining
64 - 68 Level: Le Roux & MRC Exploration Drilling
54 Level:
Stoping
+1 000m
MSL
-1 000m
MRC Shaft
RossiterStoping
0 500m
LEGEND
Mined-out areas
Envelope of potential mineralisation
Dykes
Shafts
Tunnels
FAIRVIEW MINE
The Fairview Mine area straddles the contact between the Moodies Group to
the north (Eureka Syncline) and the Fig Tree Group greywacke and shale to the
south (Ulundi Syncline). The contact is marked by the presence of the Sheba Fault.
The two synclines are re-folded, back-to-back isoclines that dip steeply to the
south. Tight isoclinal, thrust fault-related anticlines of Onverwacht Group schist
(Zwartkoppie Formation) occur within the greywacke.
GEOLOGY
Geology at Fairview Mine
PAR Mr&MR FULL report FA.indd 36PAR Mr&MR FULL report FA.indd 36 2017/10/27 1:43 PM2017/10/27 1:43 PM

PAN AFRICAN RESOURCES MINERAL RESOURCES AND MINERAL RESERVES REPORT 2017 | 37
MINERAL RESOURCES
Contained gold
As at 30 June 2017 Category
Tonnes
million
Grade
g/t Moz
Measured 1.08 10.92 0.38
Indicated 1.06 14.13 0.48
Measured and Indicated 2.14 12.51 0.86
Fairview Mine Inferred 2.68 14.90 1.28
Notes:
1. Resources are reported above cut-offs of 1.2, 1.74 and 1.98 g/t
2. RD of in situ ore material is 2.7t/m3 and for TSFs this is 1.375 t/m3.
MINERAL RESERVES MODIFYING FACTOR
As at 30 June 2017
Gold
price
ZAR/kg
Cut-off
value
g/t Au
Cut-off
value
cmg/t
Stoping
width
cm
Dilution
%
MCF
%
PRF
%
Fairview Mine 550,000 3.73 373 100 5 100.0 91.00
MINERAL RESERVES
Contained gold
As at 30 June 2017 Category
Tonnes
million
Grade
g/t Moz
Proved 0.51 10.05 0.21
Probable 1.50 13.89 0.59
Fairview Mine Total 2.01 12.42 0.80
0
200,000
400,000
600,000
800,000
1,000,000
1,200,000
1,400,000
1,600,000
1,800,000
2,000,000
Tonnage Grade
0.00
Tonn
es
0
5
10
15
20
25
30
35
40
45
50
Grade (g/t)
5.00 10.00 15.00 20.00 25.00 30.00 35.00 40.00 45.00 50.00
FAIRVIEW MINE
Grade/tonnage curve
PAR Mr&MR FULL report FA.indd 37PAR Mr&MR FULL report FA.indd 37 2017/10/27 1:43 PM2017/10/27 1:43 PM

38 | PAN AFRICAN RESOURCES MINERAL RESOURCES AND MINERAL RESERVES REPORT 2017
BARBERTON MINES continued
Vantage – Goldfields Mining Area Royal Sheba MineSheba Mine
Proposed future
development
M N
Sheba ZK Shaft
27 Sub
-Incli
ne Sha
ft
Thomas and Joe’s Luck Development
ZK
Orebody
Into
mbi
Ore
body
Royal Sheba
Shaft
Bonanza Mine
ZK
Ore
body
F
G
H
0 500m
LEGEND
Mined-out areas
Envelope of potential mineralisation
Dykes
Shafts
Tunnels
SHEBA MINE
The Sheba section area straddles the contact between the Moodies Group to the north (Eureka Syncline) and the Fig Tree Group
greywacke and shale to the south (Ulundi Syncline). The contact is marked by the presence of the Sheba Fault. The two synclines are
re-folded, back-to-back isoclines that dip steeply to the south. Tight isoclinal, thrust fault-related anticlines of Onverwacht Group schist
(Zwartkoppie Formation) occur within the greywacke.
GEOLOGY
The Sheba orebody is an epigenetic hydrothermal lodegold deposit. Three distinct types of mineralisation occur in the mine:
• Refractory sulphidic ore (MRC Section), which constitutes the bulk of the ore, is hosted in the greywacke and shale sequence of the Fig
Tree Group. The mineralisation is found in close association with a shear system in the immediate hangingwall of greenschist anticlines of the
Zwartkoppie Formation. Auriferous pyrite and arsenopyrite mineralisation occurs as massive replacement veins within the shear system and
as disseminations.
• In the Zwartkoppie Section, visible gold and disseminated pyrite in the greenschist is the prominent mineralisation, in association with shear
and fracture hosted smoky and white quartz veins.
• The Royal Sheba mineralisation occurs within the Sheba Fault mylonite and shear zone in the footwall of a banded chert-carbonate shale unit
of the Fig Tree Group.
The deepest orebody intersection on Sheba is 1,200m below shaft collar elevation. The orebody is open at depth.
Geology at Sheba Mine
PAR Mr&MR FULL report FA.indd 38PAR Mr&MR FULL report FA.indd 38 2017/10/27 1:43 PM2017/10/27 1:43 PM

PAN AFRICAN RESOURCES MINERAL RESOURCES AND MINERAL RESERVES REPORT 2017 | 39
MINERAL RESOURCES
Contained gold
As at 30 June 2017 Category
Tonnes
million
Grade
g/t Moz
Measured 0.96 6.75 0.21
Indicated 1.66 4.81 0.26
Measured and Indicated 2.62 5.53 0.47
Sheba Mine Inferred 1.41 7.36 0.33
Notes:
1. Resources are reported above cut-offs of 1.69 and 2.18 g/t
2. RD of in situ ore material is 2.7t/m3 and for TSFs this is 1.375 t/m3.
MINERAL RESERVES MODIFYING FACTOR
As at 30 June 2017
Gold
price
ZAR/kg
Cut-off
value
g/t Au
Cut-off
value
cmg/t
Stoping
width
cm
Dilution
%
MCF
%
PRF
%
Sheba Mine 550,000 4.06 406 100 5 100 92.0
MINERAL RESERVES
Contained gold
As at 30 June 2017 Category
Tonnes
million
Grade
g/t Moz
Proved 0.43 7.08 0.10
Probable 1.83 4.83 0.29
Sheba Mine Total 2.27 5.29 0.39
0
50,000
100,000
150,000
200,000
250,000
300,000
Tonnage Grade
0.00
Tonn
es
0
5
10
15
20
25
30
35
40
45
50
Grade (g/t)
5.00 10.00 15.00 20.00 25.00 30.00 35.00 40.00 45.00 50.00
SHEBA MINE
Grade/tonnage curve
PAR Mr&MR FULL report FA.indd 39PAR Mr&MR FULL report FA.indd 39 2017/10/27 1:43 PM2017/10/27 1:43 PM

40 | PAN AFRICAN RESOURCES MINERAL RESOURCES AND MINERAL RESERVES REPORT 2017
CONSORT MINEThe New Consort orebody is an epigenetic hydrothermal lode gold
deposit. Gold mineralisation at the New Consort section is associated
with the contact between the underlying schist of the Onverwacht
Group and the overlying metapelite of the Fig Tree Group. This contact
is marked by the presence of the Consort ‘bar’, a highly siliceous
banded chert. The Consort bar is thought to be a silicified mylonite
occupying the contact. A series of north-dipping tabular pegmatites,
termed the MR pegmatites, displace the south-dipping Consort
contact and the mineralised shoots. Some scheelite mineralisation has
been recorded, associated with the pegmatites. A lenticular body of
fine-grained siliceous amphibolite, termed the ‘footwall lens’, occurs
on the northern limb of the Top Section syncline and is host to the
mineralisation in the PC and MMR shoots. Mineralisation consists
of arsenopyrite and visible gold associated with fractures in the
footwall lens. The Consort bar is host to mineralisation in the 7 Shaft,
No 3 Shaft and Ivaura areas.
The deepest intersection of a New Consort orebody is 1,450m
below adit elevation. The orebody is open at depth.
BARBERTON MINES continued
50 Level
Sub-Incline21Sub-Incline 22
PC
Shaf
t
10 Level
MM
R In
clin
e Sh
aft
22 Level
Prospective
Paytrends
37 Level
45 Level
40 Level
PC Adit3 Shaft
7 Shaft
MMR Payshoot
MMR
Proposed Future
Development
B/G
3 Shaft Payshoot
37 Level: Capital Development
MMR Exploration Drilling
37 Sub-incline Shaft
LEGEND
Mined-out areasEnvelope of Potential MineralisationPegmatitesShafts
+ +++ ++
0 500m
3 Shaft Payshoot
7 Sh
aft Paysh
oot
7 Sh
aft Paysh
oot
PC Shaft Payshoot
49 Sub-Vertical Shaft
Current Stoping
Exploration Drilling
Current Stoping
Current Stoping
Current Stoping
Current Stoping
CONSORT MINE
The New Consort area can be divided into two distinctive synclinal structures, termed the Three Shaft syncline and the Top Section
syncline. The Shires structure, which is a prominent north-south striking shear zone dividing these two synclines, is intruded by a pegmatite.
GEOLOGY
Geology at Consort Mine
PAR Mr&MR FULL report FA.indd 40PAR Mr&MR FULL report FA.indd 40 2017/10/27 1:43 PM2017/10/27 1:43 PM
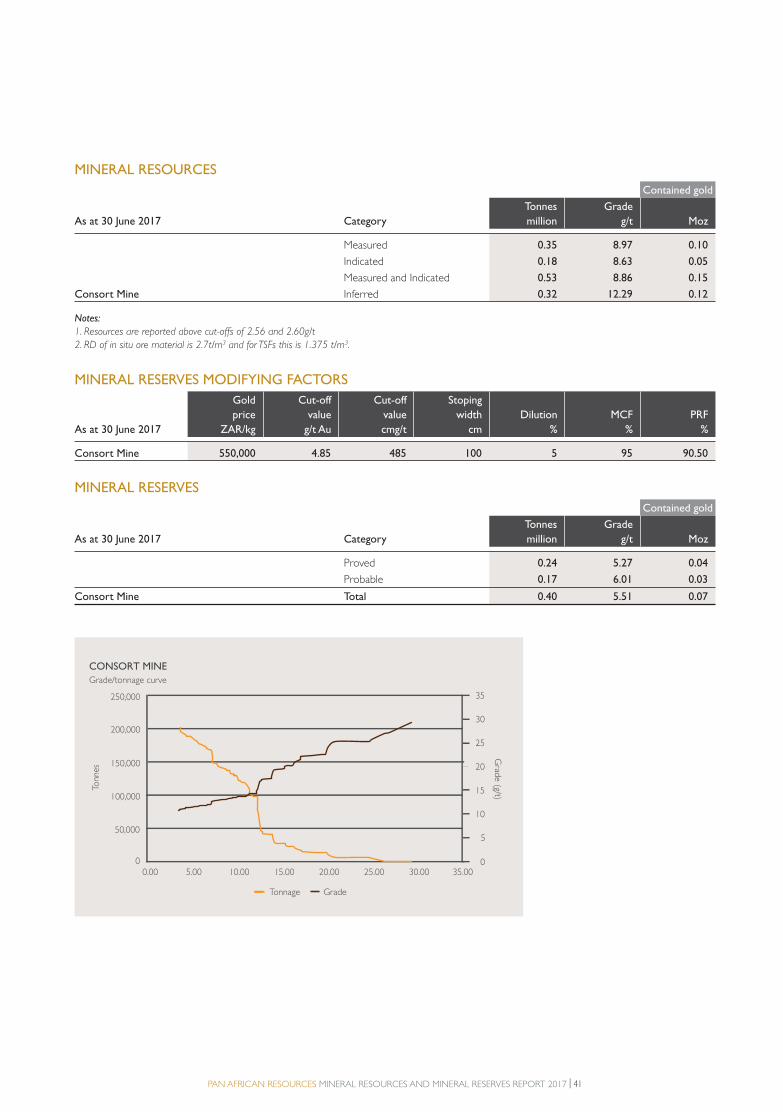
PAN AFRICAN RESOURCES MINERAL RESOURCES AND MINERAL RESERVES REPORT 2017 | 41
MINERAL RESOURCES
Contained gold
As at 30 June 2017 Category
Tonnes
million
Grade
g/t Moz
Measured 0.35 8.97 0.10
Indicated 0.18 8.63 0.05
Measured and Indicated 0.53 8.86 0.15
Consort Mine Inferred 0.32 12.29 0.12
Notes:
1. Resources are reported above cut-offs of 2.56 and 2.60g/t
2. RD of in situ ore material is 2.7t/m3 and for TSFs this is 1.375 t/m3.
MINERAL RESERVES MODIFYING FACTORS
As at 30 June 2017
Gold
price
ZAR/kg
Cut-off
value
g/t Au
Cut-off
value
cmg/t
Stoping
width
cm
Dilution
%
MCF
%
PRF
%
Consort Mine 550,000 4.85 485 100 5 95 90.50
MINERAL RESERVES
Contained gold
As at 30 June 2017 Category
Tonnes
million
Grade
g/t Moz
Proved 0.24 5.27 0.04
Probable 0.17 6.01 0.03
Consort Mine Total 0.40 5.51 0.07
0
50,000
100,000
150,000
200,000
250,000
Tonnage Grade
0.00
Tonn
es
0
5
10
15
20
25
30
35
Grade (g/t)
5.00 10.00 15.00 20.00 25.00 30.00 35.00
CONSORT MINE
Grade/tonnage curve
PAR Mr&MR FULL report FA.indd 41PAR Mr&MR FULL report FA.indd 41 2017/10/27 1:43 PM2017/10/27 1:43 PM
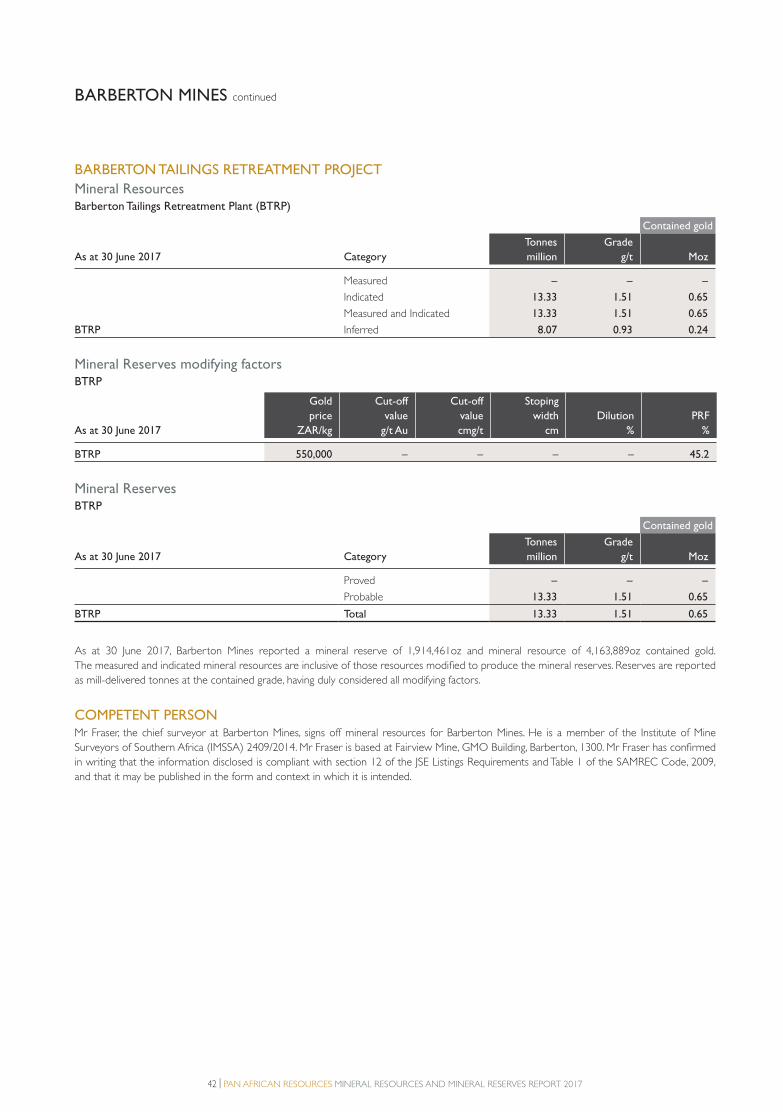
42 | PAN AFRICAN RESOURCES MINERAL RESOURCES AND MINERAL RESERVES REPORT 2017
BARBERTON TAILINGS RETREATMENT PROJECT
Mineral ResourcesBarberton Tailings Retreatment Plant (BTRP)
Contained gold
As at 30 June 2017 Category
Tonnes
million
Grade
g/t Moz
Measured – – –
Indicated 13.33 1.51 0.65
Measured and Indicated 13.33 1.51 0.65
BTRP Inferred 8.07 0.93 0.24
Mineral Reserves modifying factorsBTRP
As at 30 June 2017
Gold
price
ZAR/kg
Cut-off
value
g/t Au
Cut-off
value
cmg/t
Stoping
width
cm
Dilution
%
PRF
%
BTRP 550,000 – – – – 45.2
Mineral ReservesBTRP
Contained gold
As at 30 June 2017 Category
Tonnes
million
Grade
g/t Moz
Proved – – –
Probable 13.33 1.51 0.65
BTRP Total 13.33 1.51 0.65
As at 30 June 2017, Barberton Mines reported a mineral reserve of 1,914,461oz and mineral resource of 4,163,889oz contained gold.
The measured and indicated mineral resources are inclusive of those resources modified to produce the mineral reserves. Reserves are reported
as mill-delivered tonnes at the contained grade, having duly considered all modifying factors.
COMPETENT PERSONMr Fraser, the chief surveyor at Barberton Mines, signs off mineral resources for Barberton Mines. He is a member of the Institute of Mine
Surveyors of Southern Africa (IMSSA) 2409/2014. Mr Fraser is based at Fairview Mine, GMO Building, Barberton, 1300. Mr Fraser has confirmed
in writing that the information disclosed is compliant with section 12 of the JSE Listings Requirements and Table 1 of the SAMREC Code, 2009,
and that it may be published in the form and context in which it is intended.
BARBERTON MINES continued
PAR Mr&MR FULL report FA.indd 42PAR Mr&MR FULL report FA.indd 42 2017/10/27 1:43 PM2017/10/27 1:43 PM

PAN AFRICAN RESOURCES MINERAL RESOURCES AND MINERAL RESERVES REPORT 2017 | 43
MINERAL RESOURCE COMPARISON
Contained gold
As at 30 June 2017 Category
Tonnes
million
%
change
Grade
g/t Moz
%
change
Measured 2.39 8.95 0.69
Indicated 16.61 2.78 1.43
Measured and Indicated 19.00 3.56 2.12
Barberton Mines Inferred 12.60 4.96 1.98
Total 31.60 4.2 4.13 4.10 6.2
Contained gold
As at 30 June 2016 Category
Tonnes
million
Grade
g/t Moz
Measured 4.11 7.42 0.98
Indicated 16.09 3.16 1.64
Measured and Indicated 20.20 4.02 2.62
Barberton Mines Inferred 10.13 3.87 1.26
Total 30.33 3.97 3.86
MINERAL RESERVE COMPARISON
Contained gold
As at 30 June 2017 Category
Tonnes
million
%
change
Grade
g/t Moz
%
change
Proved 1.50 8.27 0.40
Probable 16.67 2.83 1.51
BTRP Total 18.17 (1.0) 3.28 1.91 (7.7)
Contained gold
As at 30 June 2016 Category
Tonnes
million
Grade
g/t Moz
Proved 2.54 7.63 0.62
Probable 15.82 2.84 1.45
BTRP Total 18.36 3.51 2.07
RECONCILIATION OF MINERAL RESOURCES AND MINERAL RESERVESBarberton Mines mineral resources and mineral reserves inventory posted the following changes for 2017:
• Barberton Mines mineral resources increased by 292,343oz contained gold.
The increase can be attributable to the re-evaluation of:
– Royal Sheba at Sheba Mine
– Hope Reef at Fairview Mine
– Clutha and reminent pillars at remnant pillars at New Consort Mine.
• Barberton Mines mineral reserves decreased by 157,728oz contained gold.
The decrease can be attributable to depletion from underground mining and processing of tailings.
PAR Mr&MR FULL report FA.indd 43PAR Mr&MR FULL report FA.indd 43 2017/10/27 1:43 PM2017/10/27 1:43 PM
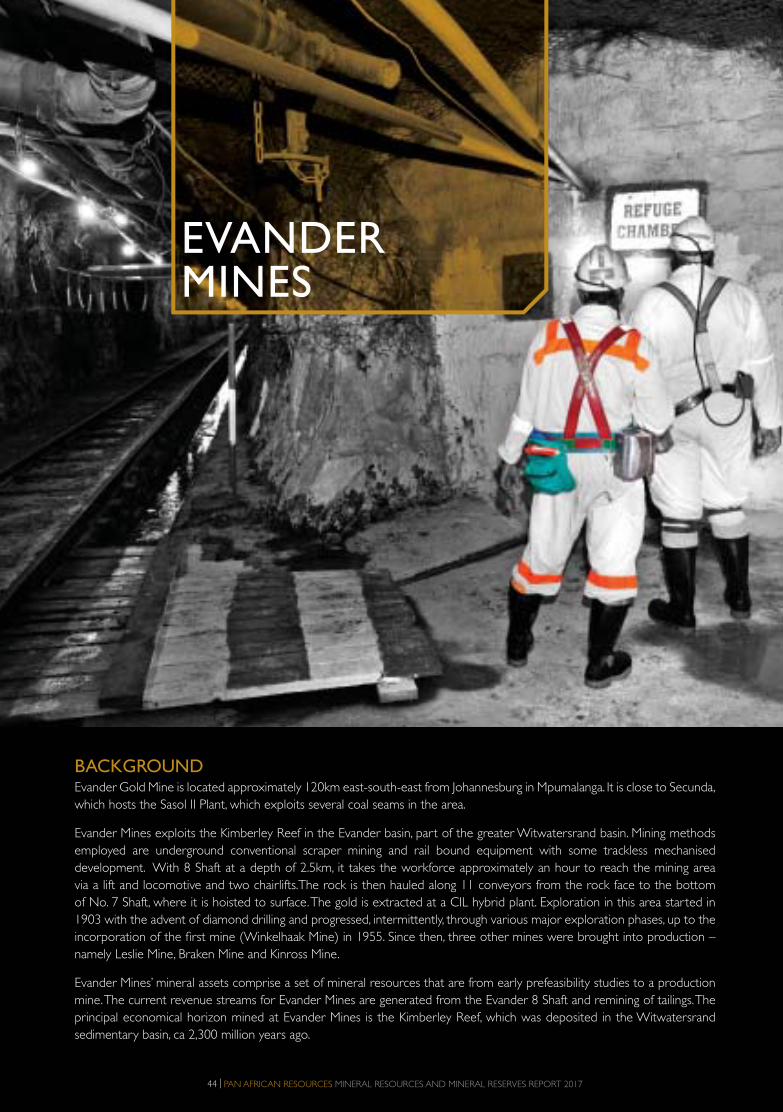
EVANDER MINES
BACKGROUNDEvander Gold Mine is located approximately 120km east-south-east from Johannesburg in Mpumalanga. It is close to Secunda,
which hosts the Sasol II Plant, which exploits several coal seams in the area.
Evander Mines exploits the Kimberley Reef in the Evander basin, part of the greater Witwatersrand basin. Mining methods
employed are underground conventional scraper mining and rail bound equipment with some trackless mechanised
development. With 8 Shaft at a depth of 2.5km, it takes the workforce approximately an hour to reach the mining area
via a lift and locomotive and two chairlifts.The rock is then hauled along 11 conveyors from the rock face to the bottom
of No. 7 Shaft, where it is hoisted to surface. The gold is extracted at a CIL hybrid plant. Exploration in this area started in
1903 with the advent of diamond drilling and progressed, intermittently, through various major exploration phases, up to the
incorporation of the first mine (Winkelhaak Mine) in 1955. Since then, three other mines were brought into production –
namely Leslie Mine, Braken Mine and Kinross Mine.
Evander Mines’ mineral assets comprise a set of mineral resources that are from early prefeasibility studies to a production
mine. The current revenue streams for Evander Mines are generated from the Evander 8 Shaft and remining of tailings. The
principal economical horizon mined at Evander Mines is the Kimberley Reef, which was deposited in the Witwatersrand
sedimentary basin, ca 2,300 million years ago.
44 | PAN AFRICAN RESOURCES MINERAL RESOURCES AND MINERAL RESERVES REPORT 2017
PAR Mr&MR FULL report FA.indd 44PAR Mr&MR FULL report FA.indd 44 2017/10/27 1:43 PM2017/10/27 1:43 PM
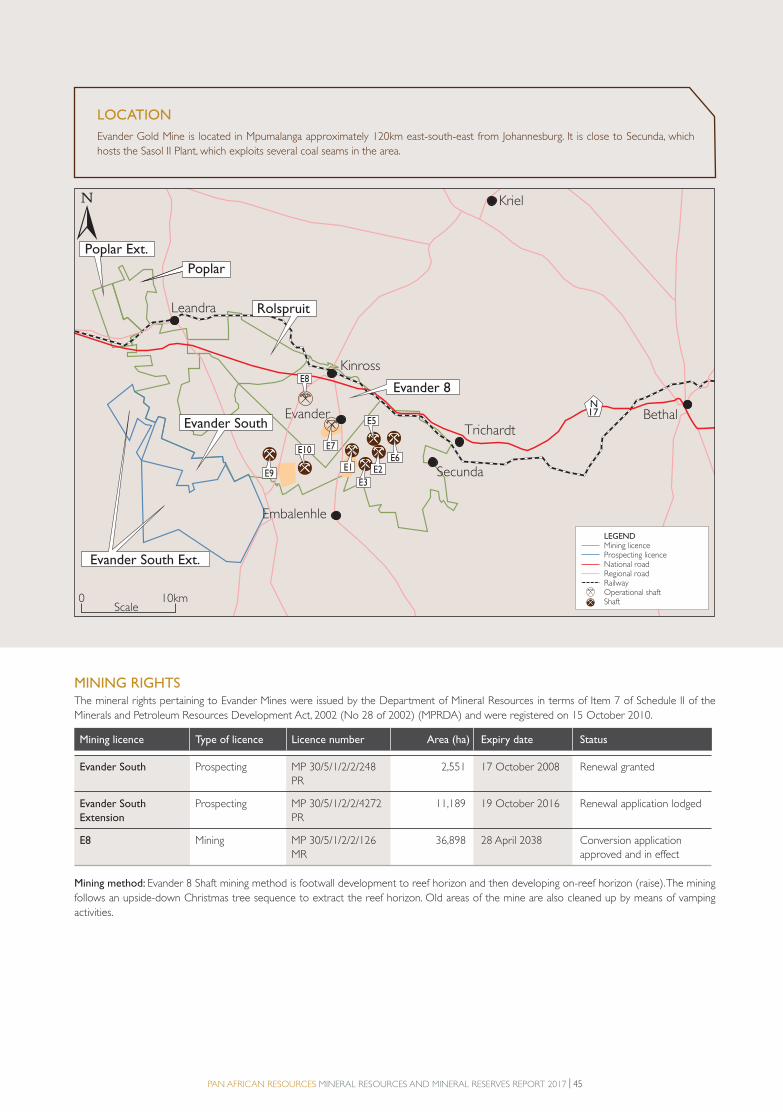
PAN AFRICAN RESOURCES MINERAL RESOURCES AND MINERAL RESERVES REPORT 2017 | 45
MINING RIGHTS The mineral rights pertaining to Evander Mines were issued by the Department of Mineral Resources in terms of Item 7 of Schedule II of the
Minerals and Petroleum Resources Development Act, 2002 (No 28 of 2002) (MPRDA) and were registered on 15 October 2010.
Mining licence Type of licence Licence number Area (ha) Expiry date Status
Evander South Prospecting MP 30/5/1/2/2/248
PR
2,551 17 October 2008 Renewal granted
Evander South
Extension
Prospecting MP 30/5/1/2/2/4272
PR
11,189 19 October 2016 Renewal application lodged
E8 Mining MP 30/5/1/2/2/126
MR
36,898 28 April 2038 Conversion application
approved and in effect
Mining method: Evander 8 Shaft mining method is footwall development to reef horizon and then developing on-reef horizon (raise). The mining
follows an upside-down Christmas tree sequence to extract the reef horizon. Old areas of the mine are also cleaned up by means of vamping
activities.
Evander Gold Mine is located in Mpumalanga approximately 120km east-south-east from Johannesburg. It is close to Secunda, which
hosts the Sasol II Plant, which exploits several coal seams in the area.
LOCATION
10km0Scale
N17
Leandra
Kinross
EvanderTrichardt
Secunda
Embalenhle
Kriel
Bethal
Evander 8
Evander South
Evander South Ext.
Poplar
Rolspruit
Poplar Ext.
E8
E7
E9
E10
E1
E3
E2 E6
E5
LEGENDMining licenceProspecting licenceNational roadRegional roadRailwayOperational shaftShaft
PAR Mr&MR FULL report FA.indd 45PAR Mr&MR FULL report FA.indd 45 2017/10/27 1:43 PM2017/10/27 1:43 PM
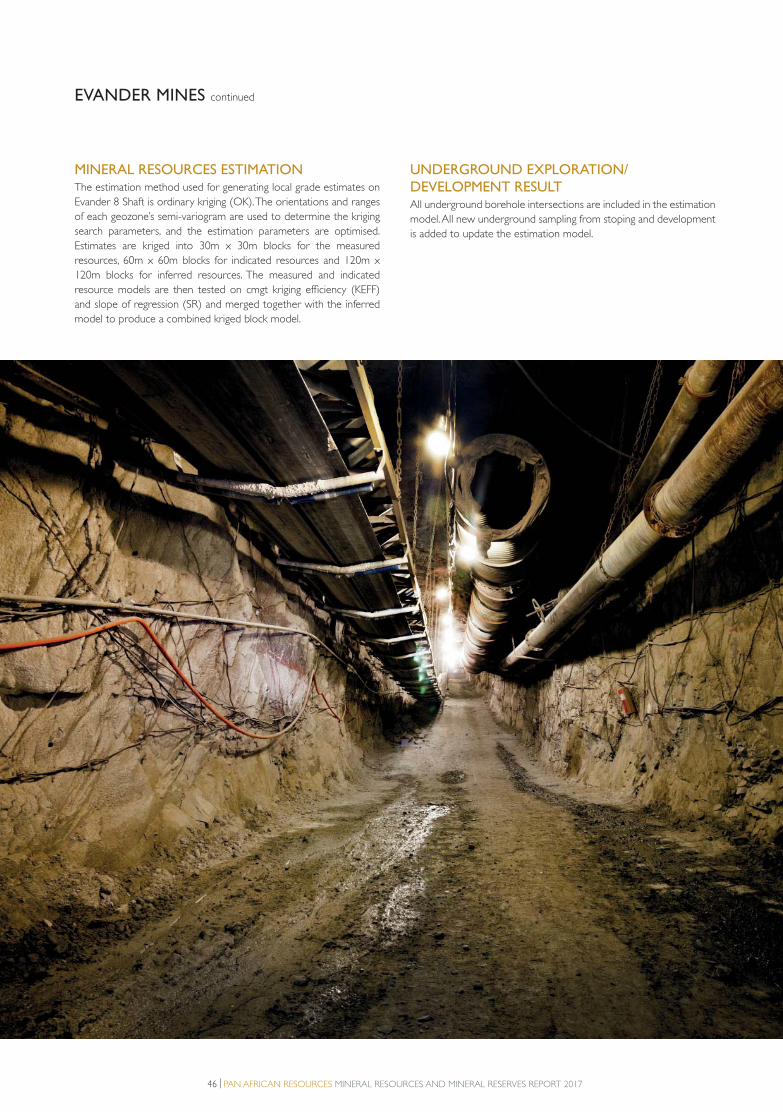
46 | PAN AFRICAN RESOURCES MINERAL RESOURCES AND MINERAL RESERVES REPORT 2017
MINERAL RESOURCES ESTIMATIONThe estimation method used for generating local grade estimates on
Evander 8 Shaft is ordinary kriging (OK). The orientations and ranges
of each geozone’s semi-variogram are used to determine the kriging
search parameters, and the estimation parameters are optimised.
Estimates are kriged into 30m x 30m blocks for the measured
resources, 60m x 60m blocks for indicated resources and 120m x
120m blocks for inferred resources. The measured and indicated
resource models are then tested on cmgt kriging efficiency (KEFF)
and slope of regression (SR) and merged together with the inferred
model to produce a combined kriged block model.
EVANDER MINES continued
UNDERGROUND EXPLORATION/DEVELOPMENT RESULTAll underground borehole intersections are included in the estimation
model. All new underground sampling from stoping and development
is added to update the estimation model.
PAR Mr&MR FULL report FA.indd 46PAR Mr&MR FULL report FA.indd 46 2017/10/27 1:43 PM2017/10/27 1:43 PM
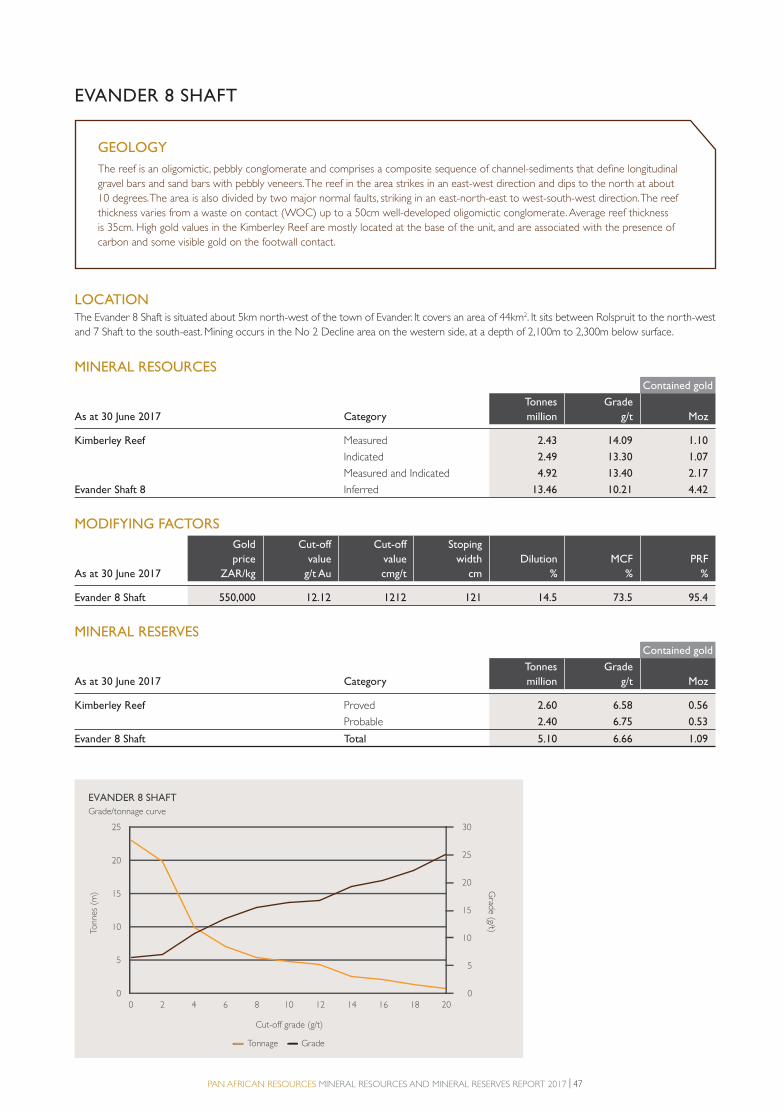
PAN AFRICAN RESOURCES MINERAL RESOURCES AND MINERAL RESERVES REPORT 2017 | 47
LOCATIONThe Evander 8 Shaft is situated about 5km north-west of the town of Evander. It covers an area of 44km2. It sits between Rolspruit to the north-west
and 7 Shaft to the south-east. Mining occurs in the No 2 Decline area on the western side, at a depth of 2,100m to 2,300m below surface.
MINERAL RESOURCES
Contained gold
As at 30 June 2017 Category
Tonnes
million
Grade
g/t Moz
Kimberley Reef Measured 2.43 14.09 1.10
Indicated 2.49 13.30 1.07
Measured and Indicated 4.92 13.40 2.17
Evander Shaft 8 Inferred 13.46 10.21 4.42
MODIFYING FACTORS
As at 30 June 2017
Gold
price
ZAR/kg
Cut-off
value
g/t Au
Cut-off
value
cmg/t
Stoping
width
cm
Dilution
%
MCF
%
PRF
%
Evander 8 Shaft 550,000 12.12 1212 121 14.5 73.5 95.4
MINERAL RESERVES
Contained gold
As at 30 June 2017 Category
Tonnes
million
Grade
g/t Moz
Kimberley Reef Proved 2.60 6.58 0.56
Probable 2.40 6.75 0.53
Evander 8 Shaft Total 5.10 6.66 1.09
EVANDER 8 SHAFT
GEOLOGY
The reef is an oligomictic, pebbly conglomerate and comprises a composite sequence of channel-sediments that define longitudinal
gravel bars and sand bars with pebbly veneers. The reef in the area strikes in an east-west direction and dips to the north at about
10 degrees. The area is also divided by two major normal faults, striking in an east-north-east to west-south-west direction. The reef
thickness varies from a waste on contact (WOC) up to a 50cm well-developed oligomictic conglomerate. Average reef thickness
is 35cm. High gold values in the Kimberley Reef are mostly located at the base of the unit, and are associated with the presence of
carbon and some visible gold on the footwall contact.
0
Tonn
es (
m)
Tonnage Grade
Grade (g/t)
2 4 6 8 10 12 14 16 18 200
5
10
15
20
25
0
5
10
15
20
25
30
Cut-off grade (g/t)
EVANDER 8 SHAFT
Grade/tonnage curve
PAR Mr&MR FULL report FA.indd 47PAR Mr&MR FULL report FA.indd 47 2017/10/27 1:43 PM2017/10/27 1:43 PM

48 | PAN AFRICAN RESOURCES MINERAL RESOURCES AND MINERAL RESERVES REPORT 2017
The Evander 7 Shaft is located south-east of 8 Shaft (approximately 3km apart) and hoists 8 Shaft’s ore to surface. Due to the increased gold price
over the last few years, an opportunity arose to investigate the viability to reclaim ore via vamping operations at 7 Shaft. Other organic growth
projects include the 2010 Pay Channel at the No 3 Decline at 7 Shaft
MINERAL RESOURCES
Contained gold
As at 30 June 2017 Category
Tonnes
million
Grade
g/t Moz
Kimberley Reef Measured – – –
Indicated 0.08 1.98 0.01
Measured and Indicated 0.08 1.98 0.01
Evander 7 Shaft vamping Inferred – – –
MODIFYING FACTOR
As at 30 June 2017
Gold
price
ZAR/kg
Cut-off
value
g/t Au
Cut-off
value
cmg/t
Stoping
width
cm
Dilution
%
MCF
%
PRF
%
Evander 7 Shaft vamping 550,000 85 96.4
EVANDER 7 SHAFT
EVANDER MINES continued
PAR Mr&MR FULL report FA.indd 48PAR Mr&MR FULL report FA.indd 48 2017/10/27 1:43 PM2017/10/27 1:43 PM

PAN AFRICAN RESOURCES MINERAL RESOURCES AND MINERAL RESERVES REPORT 2017 | 49
EVANDER PROJECTS
O28 55’E
O29 00’E
O29 05’E
O29 10’E
O26
35’S
O26
30’S
O26
25’S
O26
20’S
4km0Scale
P opla r
Evander 8
Poplar
Rolspruit
Poplar Ext.
Evander South Ext.
LEGENDShaftsOperational ShaftsMined-out areas
Mineral ResourcesMeasuredIndicatedInferred
Mineral ReservesProven and Probable
E8
E7
E10
E1
E5
E3
E9 E2
E6
Evander South
2010 Pay Channel
Elikhulu
The Evander gold assets also consist of exploration projects that are at varying stages of exploration and development. The individual projects and
level of study are summarised below and illustrated in the map below.
Pan African Resources (PAR) remains focused on creating shareholder value through unlocking the value of its organic surface and brownfields
exploration projects.
PAR Mr&MR FULL report FA.indd 49PAR Mr&MR FULL report FA.indd 49 2017/10/27 1:43 PM2017/10/27 1:43 PM
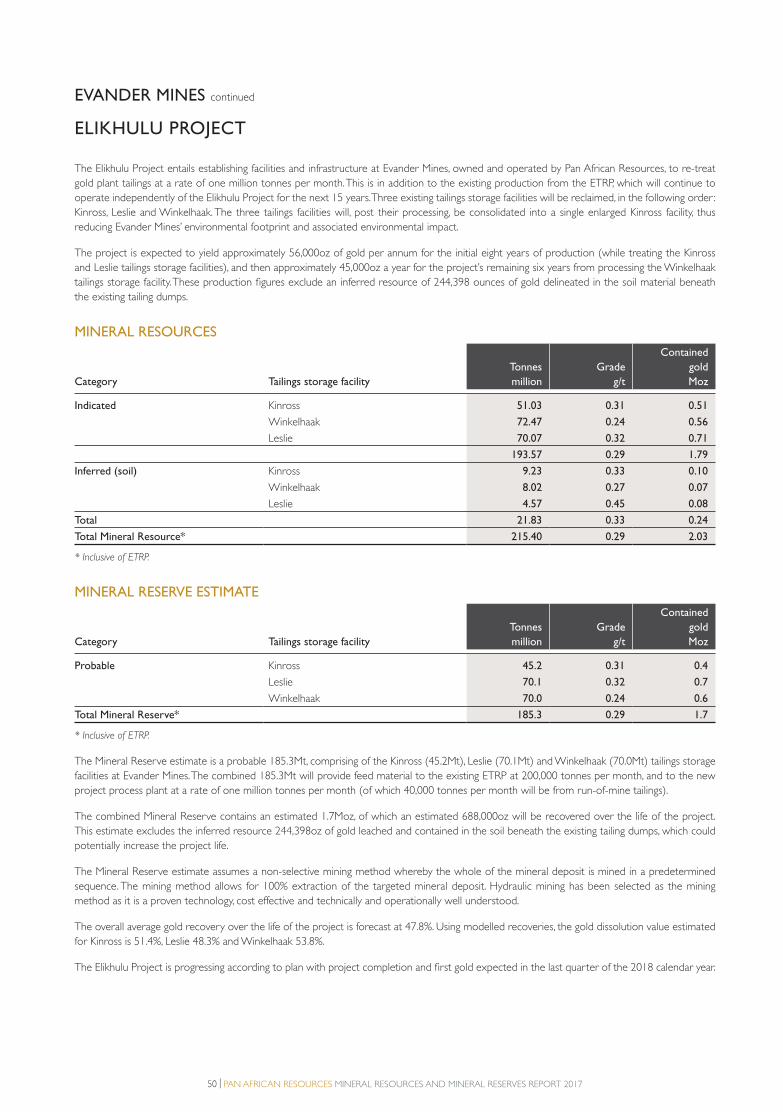
50 | PAN AFRICAN RESOURCES MINERAL RESOURCES AND MINERAL RESERVES REPORT 2017
ELIKHULU PROJECT
The Elikhulu Project entails establishing facilities and infrastructure at Evander Mines, owned and operated by Pan African Resources, to re-treat
gold plant tailings at a rate of one million tonnes per month. This is in addition to the existing production from the ETRP, which will continue to
operate independently of the Elikhulu Project for the next 15 years. Three existing tailings storage facilities will be reclaimed, in the following order:
Kinross, Leslie and Winkelhaak. The three tailings facilities will, post their processing, be consolidated into a single enlarged Kinross facility, thus
reducing Evander Mines’ environmental footprint and associated environmental impact.
The project is expected to yield approximately 56,000oz of gold per annum for the initial eight years of production (while treating the Kinross
and Leslie tailings storage facilities), and then approximately 45,000oz a year for the project’s remaining six years from processing the Winkelhaak
tailings storage facility. These production figures exclude an inferred resource of 244,398 ounces of gold delineated in the soil material beneath
the existing tailing dumps.
MINERAL RESOURCES
Category Tailings storage facility
Tonnes
million
Grade
g/t
Contained
gold
Moz
Indicated Kinross 51.03 0.31 0.51
Winkelhaak 72.47 0.24 0.56
Leslie 70.07 0.32 0.71
193.57 0.29 1.79
Inferred (soil) Kinross 9.23 0.33 0.10
Winkelhaak 8.02 0.27 0.07
Leslie 4.57 0.45 0.08
Total 21.83 0.33 0.24
Total Mineral Resource* 215.40 0.29 2.03
* Inclusive of ETRP.
MINERAL RESERVE ESTIMATE
Category Tailings storage facility
Tonnes
million
Grade
g/t
Contained
gold
Moz
Probable Kinross 45.2 0.31 0.4
Leslie 70.1 0.32 0.7
Winkelhaak 70.0 0.24 0.6
Total Mineral Reserve* 185.3 0.29 1.7
* Inclusive of ETRP.
The Mineral Reserve estimate is a probable 185.3Mt, comprising of the Kinross (45.2Mt), Leslie (70.1Mt) and Winkelhaak (70.0Mt) tailings storage
facilities at Evander Mines. The combined 185.3Mt will provide feed material to the existing ETRP at 200,000 tonnes per month, and to the new
project process plant at a rate of one million tonnes per month (of which 40,000 tonnes per month will be from run-of-mine tailings).
The combined Mineral Reserve contains an estimated 1.7Moz, of which an estimated 688,000oz will be recovered over the life of the project.
This estimate excludes the inferred resource 244,398oz of gold leached and contained in the soil beneath the existing tailing dumps, which could
potentially increase the project life.
The Mineral Reserve estimate assumes a non-selective mining method whereby the whole of the mineral deposit is mined in a predetermined
sequence. The mining method allows for 100% extraction of the targeted mineral deposit. Hydraulic mining has been selected as the mining
method as it is a proven technology, cost effective and technically and operationally well understood.
The overall average gold recovery over the life of the project is forecast at 47.8%. Using modelled recoveries, the gold dissolution value estimated
for Kinross is 51.4%, Leslie 48.3% and Winkelhaak 53.8%.
The Elikhulu Project is progressing according to plan with project completion and first gold expected in the last quarter of the 2018 calendar year.
EVANDER MINES continued
PAR Mr&MR FULL report FA.indd 50PAR Mr&MR FULL report FA.indd 50 2017/10/27 1:44 PM2017/10/27 1:44 PM
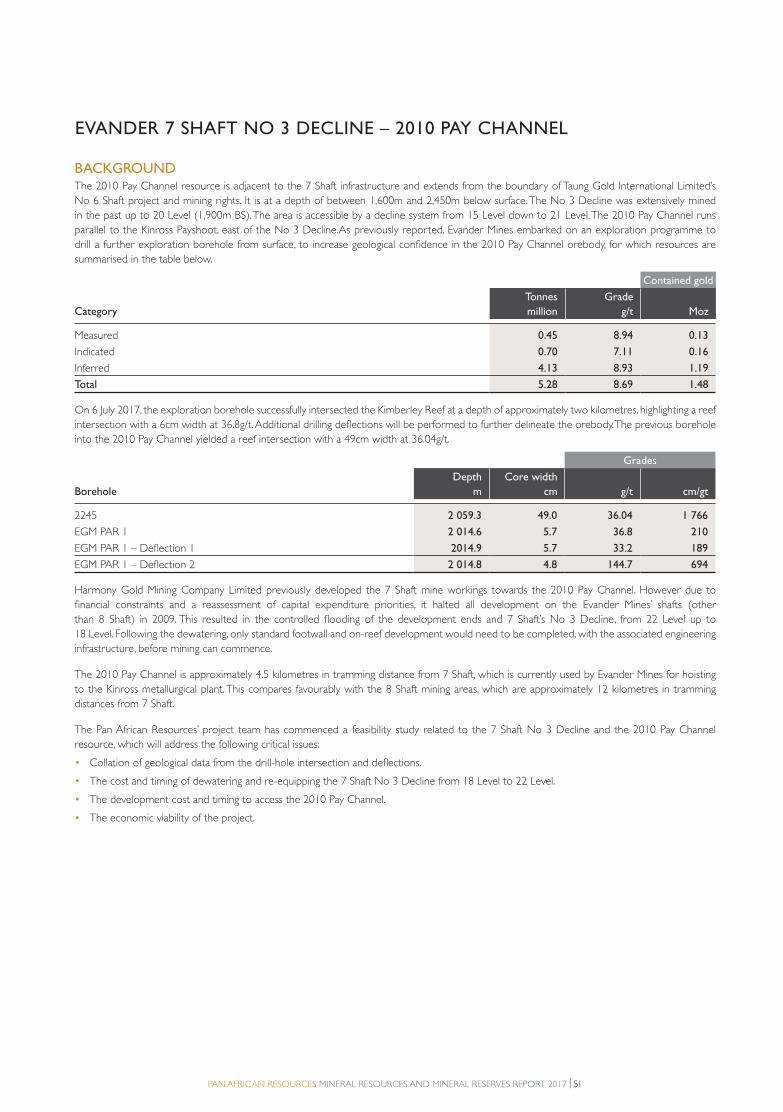
PAN AFRICAN RESOURCES MINERAL RESOURCES AND MINERAL RESERVES REPORT 2017 | 51
BACKGROUNDThe 2010 Pay Channel resource is adjacent to the 7 Shaft infrastructure and extends from the boundary of Taung Gold International Limited’s
No 6 Shaft project and mining rights. It is at a depth of between 1,600m and 2,450m below surface. The No 3 Decline was extensively mined
in the past up to 20 Level (1,900m BS). The area is accessible by a decline system from 15 Level down to 21 Level. The 2010 Pay Channel runs
parallel to the Kinross Payshoot, east of the No 3 Decline.As previously reported, Evander Mines embarked on an exploration programme to
drill a further exploration borehole from surface, to increase geological confidence in the 2010 Pay Channel orebody, for which resources are
summarised in the table below.
Contained gold
Category
Tonnes
million
Grade
g/t Moz
Measured 0.45 8.94 0.13
Indicated 0.70 7.11 0.16
Inferred 4.13 8.93 1.19
Total 5.28 8.69 1.48
On 6 July 2017, the exploration borehole successfully intersected the Kimberley Reef at a depth of approximately two kilometres, highlighting a reef
intersection with a 6cm width at 36.8g/t. Additional drilling deflections will be performed to further delineate the orebody. The previous borehole
into the 2010 Pay Channel yielded a reef intersection with a 49cm width at 36.04g/t.
Grades
Borehole
Depth
m
Core width
cm g/t cm/gt
2245 2 059.3 49.0 36.04 1 766
EGM PAR 1 2 014.6 5.7 36.8 210
EGM PAR 1 – Deflection 1 2014.9 5.7 33.2 189
EGM PAR 1 – Deflection 2 2 014.8 4.8 144.7 694
Harmony Gold Mining Company Limited previously developed the 7 Shaft mine workings towards the 2010 Pay Channel. However due to
financial constraints and a reassessment of capital expenditure priorities, it halted all development on the Evander Mines’ shafts (other
than 8 Shaft) in 2009. This resulted in the controlled flooding of the development ends and 7 Shaft’s No 3 Decline, from 22 Level up to
18 Level. Following the dewatering, only standard footwall and on-reef development would need to be completed, with the associated engineering
infrastructure, before mining can commence.
The 2010 Pay Channel is approximately 4.5 kilometres in tramming distance from 7 Shaft, which is currently used by Evander Mines for hoisting
to the Kinross metallurgical plant. This compares favourably with the 8 Shaft mining areas, which are approximately 12 kilometres in tramming
distances from 7 Shaft.
The Pan African Resources’ project team has commenced a feasibility study related to the 7 Shaft No 3 Decline and the 2010 Pay Channel
resource, which will address the following critical issues:
• Collation of geological data from the drill-hole intersection and deflections.
• The cost and timing of dewatering and re-equipping the 7 Shaft No 3 Decline from 18 Level to 22 Level.
• The development cost and timing to access the 2010 Pay Channel.
• The economic viability of the project.
EVANDER 7 SHAFT NO 3 DECLINE – 2010 PAY CHANNEL
PAR Mr&MR FULL report FA.indd 51PAR Mr&MR FULL report FA.indd 51 2017/10/27 1:44 PM2017/10/27 1:44 PM
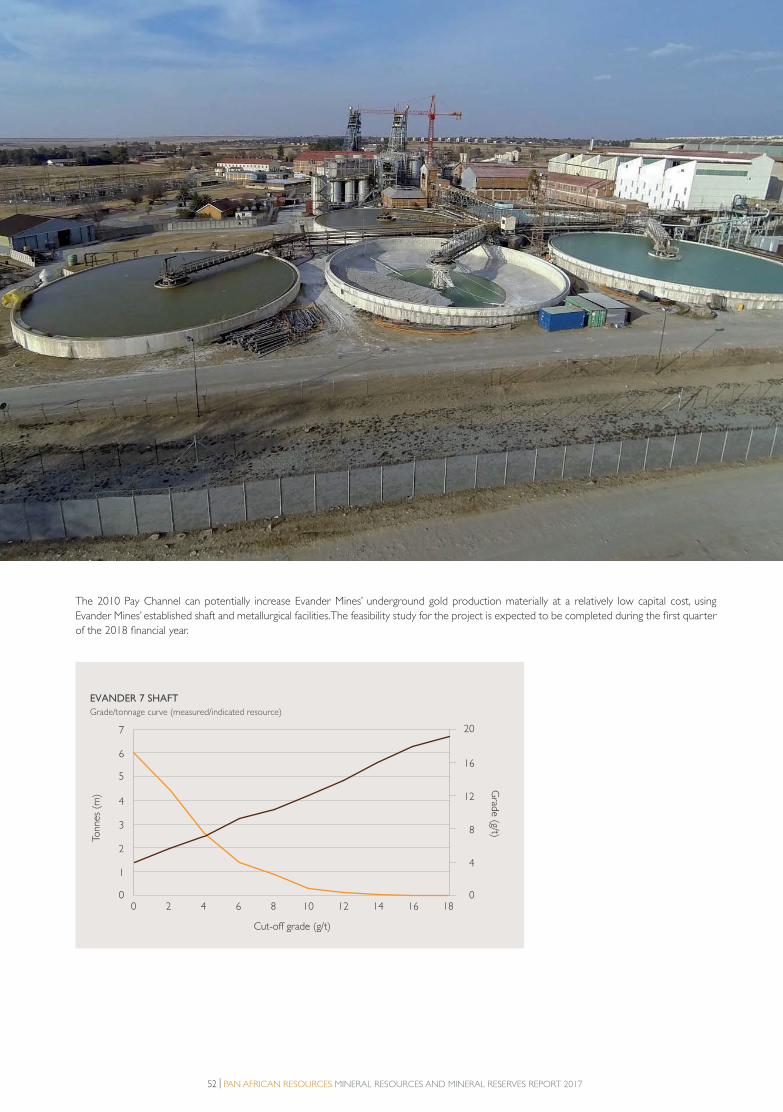
52 | PAN AFRICAN RESOURCES MINERAL RESOURCES AND MINERAL RESERVES REPORT 2017
0
Tonn
es (
m)
Grade (g/t)
2 4 6 8 10 12 14 16 180
1
2
3
4
5
6
7
0
4
8
12
16
20
Cut-off grade (g/t)
EVANDER 7 SHAFT
Grade/tonnage curve (measured/indicated resource)
The 2010 Pay Channel can potentially increase Evander Mines’ underground gold production materially at a relatively low capital cost, using
Evander Mines’ established shaft and metallurgical facilities. The feasibility study for the project is expected to be completed during the first quarter
of the 2018 financial year.
PAR Mr&MR FULL report FA.indd 52PAR Mr&MR FULL report FA.indd 52 2017/10/27 1:44 PM2017/10/27 1:44 PM
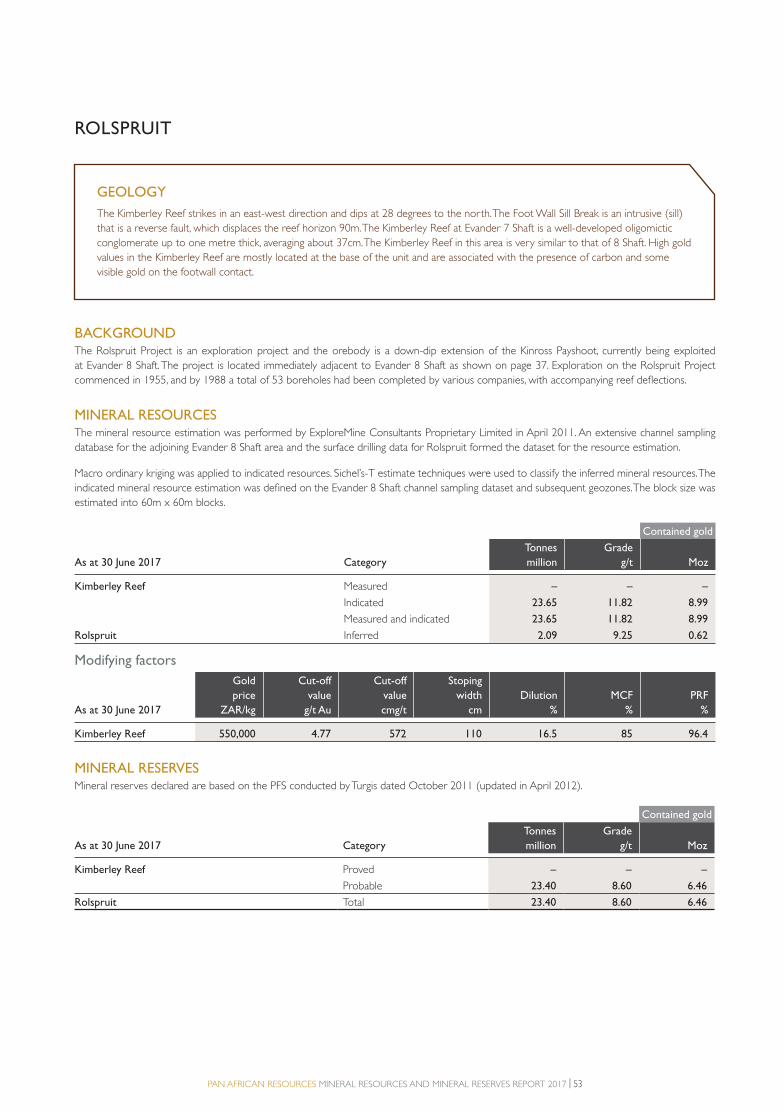
PAN AFRICAN RESOURCES MINERAL RESOURCES AND MINERAL RESERVES REPORT 2017 | 53
ROLSPRUIT
The Kimberley Reef strikes in an east-west direction and dips at 28 degrees to the north. The Foot Wall Sill Break is an intrusive (sill)
that is a reverse fault, which displaces the reef horizon 90m. The Kimberley Reef at Evander 7 Shaft is a well-developed oligomictic
conglomerate up to one metre thick, averaging about 37cm. The Kimberley Reef in this area is very similar to that of 8 Shaft. High gold
values in the Kimberley Reef are mostly located at the base of the unit and are associated with the presence of carbon and some
visible gold on the footwall contact.
GEOLOGY
BACKGROUNDThe Rolspruit Project is an exploration project and the orebody is a down-dip extension of the Kinross Payshoot, currently being exploited
at Evander 8 Shaft. The project is located immediately adjacent to Evander 8 Shaft as shown on page 37. Exploration on the Rolspruit Project
commenced in 1955, and by 1988 a total of 53 boreholes had been completed by various companies, with accompanying reef deflections.
MINERAL RESOURCESThe mineral resource estimation was performed by ExploreMine Consultants Proprietary Limited in April 2011. An extensive channel sampling
database for the adjoining Evander 8 Shaft area and the surface drilling data for Rolspruit formed the dataset for the resource estimation.
Macro ordinary kriging was applied to indicated resources. Sichel’s-T estimate techniques were used to classify the inferred mineral resources. The
indicated mineral resource estimation was defined on the Evander 8 Shaft channel sampling dataset and subsequent geozones. The block size was
estimated into 60m x 60m blocks.
Contained gold
As at 30 June 2017 Category
Tonnes
million
Grade
g/t Moz
Kimberley Reef Measured – – –
Indicated 23.65 11.82 8.99
Measured and indicated 23.65 11.82 8.99
Rolspruit Inferred 2.09 9.25 0.62
Modifying factors
As at 30 June 2017
Gold
price
ZAR/kg
Cut-off
value
g/t Au
Cut-off
value
cmg/t
Stoping
width
cm
Dilution
%
MCF
%
PRF
%
Kimberley Reef 550,000 4.77 572 110 16.5 85 96.4
MINERAL RESERVESMineral reserves declared are based on the PFS conducted by Turgis dated October 2011 (updated in April 2012).
Contained gold
As at 30 June 2017 Category
Tonnes
million
Grade
g/t Moz
Kimberley Reef Proved – – –
Probable 23.40 8.60 6.46
Rolspruit Total 23.40 8.60 6.46
PAR Mr&MR FULL report FA.indd 53PAR Mr&MR FULL report FA.indd 53 2017/10/27 1:44 PM2017/10/27 1:44 PM
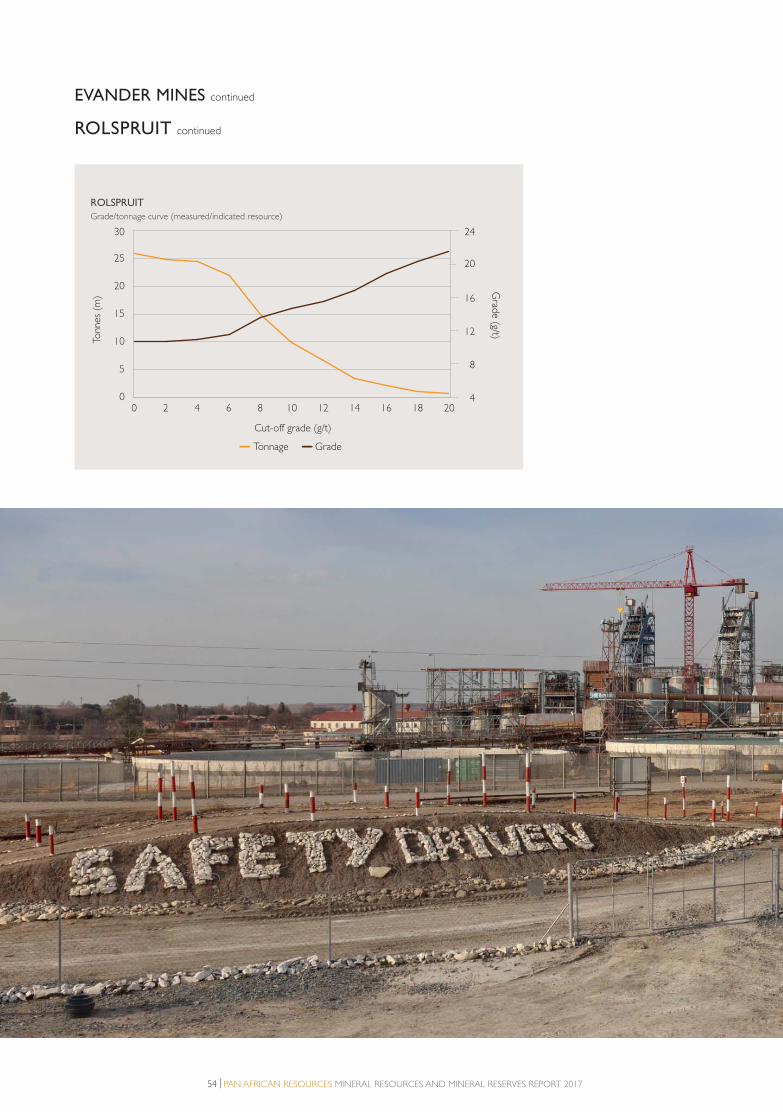
54 | PAN AFRICAN RESOURCES MINERAL RESOURCES AND MINERAL RESERVES REPORT 2017
EVANDER MINES continued
ROLSPRUIT continued
0
Tonn
es (
m)
Tonnage Grade
Grade (g/t)
2 4 6 8 10 12 14 16 18 200
5
10
15
20
25
30
4
8
12
16
20
24
Cut-off grade (g/t)
ROLSPRUIT
Grade/tonnage curve (measured/indicated resource)
PAR Mr&MR FULL report FA.indd 54PAR Mr&MR FULL report FA.indd 54 2017/10/27 1:44 PM2017/10/27 1:44 PM

PAN AFRICAN RESOURCES MINERAL RESOURCES AND MINERAL RESERVES REPORT 2017 | 55
POPLAR
BACKGROUNDThe Poplar Project is situated in the north-western limb of the Evander Basin, west of the town of Leandra. Exploration on the Poplar Project
commenced in the mid-1950s and has been the subject of several studies. A total of 104 boreholes were drilled in the project area, which includes
146 deflections. A total of 46 boreholes were drilled by Harmony from 2007 to 2010.
MINERAL RESOURCES
Contained gold
As at 30 June 2017 Category
Tonnes
million
Grade
g/t Moz
Kimberley Reef Measured – – –
Indicated 14.62 7.98 3.75
Measured and indicated 14.62 7.98 3.75
Poplar Inferred 7.53 7.00 1.70
0
Tonn
es (
m)
Tonnage Grade
Grade (g/t)
2 4 6 8 10 12 14 160
5
10
15
20
25
30
4
6
8
10
12
14
16
18
Cut-off grade (g/t)
POPLAR
Grade/tonnage curve (measured/indicated resource)
GEOLOGY
The Kimberley Reef occurs at a depth below surface of between 500m in the west and 1,200m in the east. The reef strikes north-
south and dips nine degrees to 24 degrees to the east. The Kimberley Reef comprises a sequence of fluvial, channel sediments that
were deposited in a braided stream environment. Deposition of the reef was influenced by the footwall lithologies. The Kimberley Reef
horizon has a channel width of approximately 30cm, generally thin reef hosting high gold grades. The reef has north-east-south-west
trending payshoots, which is evident in other parts of the Evander Basin.
A series of seven major, sub-parallel and fairly evenly spaced faults traverse the property. These are all orientated in a roughly north-
northeast – south-southwest direction. Throws of these faults vary between 50m and 400m.
PAR Mr&MR FULL report FA.indd 55PAR Mr&MR FULL report FA.indd 55 2017/10/27 1:44 PM2017/10/27 1:44 PM
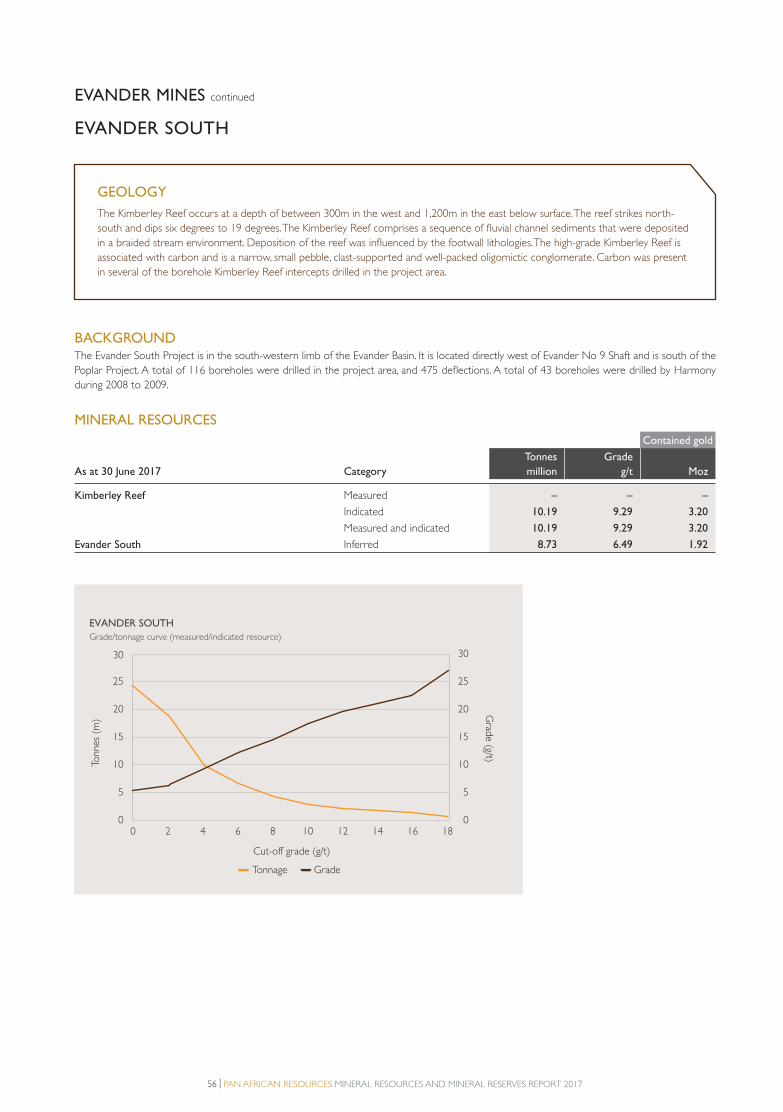
56 | PAN AFRICAN RESOURCES MINERAL RESOURCES AND MINERAL RESERVES REPORT 2017
BACKGROUNDThe Evander South Project is in the south-western limb of the Evander Basin. It is located directly west of Evander No 9 Shaft and is south of the
Poplar Project. A total of 116 boreholes were drilled in the project area, and 475 deflections. A total of 43 boreholes were drilled by Harmony
during 2008 to 2009.
MINERAL RESOURCES
Contained gold
As at 30 June 2017 Category
Tonnes
million
Grade
g/t Moz
Kimberley Reef Measured – – –
Indicated 10.19 9.29 3.20
Measured and indicated 10.19 9.29 3.20
Evander South Inferred 8.73 6.49 1.92
EVANDER MINES continued
EVANDER SOUTH
The Kimberley Reef occurs at a depth of between 300m in the west and 1,200m in the east below surface. The reef strikes north-
south and dips six degrees to 19 degrees. The Kimberley Reef comprises a sequence of fluvial channel sediments that were deposited
in a braided stream environment. Deposition of the reef was influenced by the footwall lithologies. The high-grade Kimberley Reef is
associated with carbon and is a narrow, small pebble, clast-supported and well-packed oligomictic conglomerate. Carbon was present
in several of the borehole Kimberley Reef intercepts drilled in the project area.
GEOLOGY
0
Tonn
es (
m)
Tonnage Grade
Grade (g/t)
2 4 6 8 10 12 14 16 180
5
10
15
20
25
30
0
5
10
15
20
25
30
Cut-off grade (g/t)
EVANDER SOUTH
Grade/tonnage curve (measured/indicated resource)
PAR Mr&MR FULL report FA.indd 56PAR Mr&MR FULL report FA.indd 56 2017/10/27 1:44 PM2017/10/27 1:44 PM

PAN AFRICAN RESOURCES MINERAL RESOURCES AND MINERAL RESERVES REPORT 2017 | 57
TOTAL MINERAL RESOURCES AND MINERAL RESERVES FOR EVANDER MINES
Total Mineral Resources
Contained
gold
As at 30 June 2017 Category
Tonnes
million
%
change
Grade
g/t Moz
%
change
Kimberley Reef Measured 2.88 13.29 1.23
Indicated 245.63 2.40 18.97
Measured and indicated 248.33 2.52 20.13
Inferred 57.78 5.43 10.09
Evander Mines Total 306.29 0.0 3.08 30.29 (2.5)
Contained gold
As at 30 June 2016 Category
Tonnes
million
Grade
g/t Moz
Kimberley Reef Measured 2.48 15.46 1.20
Indicated 245.20 2.38 18.73
Inferred 59.23 5.85 11.15
Evander Mines Total 306.92 3.15 31.08
Total Mineral Reserves
Contained gold
As at 30 June 2017 Category
Tonnes
million
%
change
Grade
g/t Moz
%
change
Proved 2.64 6.58 0.56
Probable 211.05 1.28 8.70
Evander Mines Total 213.69 233.1 1.35 9.26 16.5
Contained gold
As at 30 June 2016 Category
Tonnes
million
Grade
g/t Moz
Proved 2.62 7.88 0.66
Probable 61.52 3.69 7.29
Evander Mines Total 64.14 3.86 7.95
RECONCILIATION OF MINERAL RESOURCES AND MINERAL RESERVESEvander’s Mines mineral resource and mineral reserve inventory posted the following changes for 2017:
• Total Evander mines mineral resource decreased by 801,000oz contained gold.
• Total Evander mines mineral reserve increased by 1,308,000oz contained gold.
As at 30 June 2017, Evander reported a mineral reserve of 9,262,000oz and mineral resource of 30,220,000oz contained gold. The measured and
indicated mineral resources are inclusive of those resources modified to produce the mineral reserves. Reserves are reported as mill-delivered
tonnes at the headgrade, having duly considered all modifying factors.
COMPETENT PERSONThe competent person for Evander Mines, Mr Barry Naicker, the Group Mineral Resource Manager, signs off the mineral resources for Evander.
He is a member of the South African Council for Scientific Professions (400234/10). Mr Naicker has a Master’s degree in mineral resource
management from Witwatersrand University and a Bachelor of Science (Honours) in economic geology. Mr Naicker has 16 years of experience
in economic geology and mineral resource management. Mr Naicker is based at First Floor, The Firs, cnr Cradock Avenue and Biermann Avenue,
Rosebank, 2196, Gauteng.
PAR Mr&MR FULL report FA.indd 57PAR Mr&MR FULL report FA.indd 57 2017/10/27 1:44 PM2017/10/27 1:44 PM

PHOENIX PLATINUM
BACKGROUNDEvander Gold Mine is located approximately 120km east-south-east from Johannesburg in Mpumalanga. It is close to Secunda,
which hosts the Sasol II Plant, which exploits several coal seams in the area.
Pan African Resources acquired 100% of Phoenix Platinum from Metorex Limited (Metorex) on 21 May 2009.
Phoenix Platinum recovers PGEs 6E from old tailings and current arisings through mineral rights agreements from the IFM
Lesedi Mine dams and current arisings, the Elandskraal dumps and pits, and the Kroondal dump.
These tailings are covered through various agreements with Phoenix Platinum to be the feed source for a 240ktpa chrome
tailings retreatment plant (CTRP).
58 | PAN AFRICAN RESOURCES MINERAL RESOURCES AND MINERAL RESERVES REPORT 2017
PAR Mr&MR FULL report FA.indd 58PAR Mr&MR FULL report FA.indd 58 2017/10/27 1:44 PM2017/10/27 1:44 PM

PAN AFRICAN RESOURCES MINERAL RESOURCES AND MINERAL RESERVES REPORT 2017 | 59
BUFFELSFONTEIN (IFM LESEDI MINE DAMS AND CURRENT ARISINGS)IFM operates a chromite ore beneficiation plant that feeds a number
of chromite furnaces on its property to produce ferrochrome. The
chromite ore beneficiation plant rejects gangue minerals in the form
of tailings (current arisings) to the tailings dams.
The bulk mass of the tailings is made up of pyroxenites, some
unrecovered chromite and PGEs 6E minerals associated with
pyroxenites. Historically, IFM mined mainly the MG1 seam, with lesser
amounts of MG2 included. The PGEs 4E mineral rights in the IFM
tailings dams, and current arisings situated on the farm Buffelsfontein,
were acquired in 2008.
The IFM tailings dams were constructed in 2006 and, to date, have
been used for the deposition of tailings material from the IFM chrome
beneficiation plant.
ELANDSKRAALThe tailings in the pits was created by historic mining of the MG1 and
MG2 orebodies by Samancor and Hernic mining operations. In 2003,
Minco purchased the operations from Hernic and started chromite
reclamation from the dumps. Phoenix Platinum has an agreement
with Minco to process the Elandskraal dumps and pits.
KROONDALMetorex acquired the Kroondal resource from the joint venture
between GB Mining and Exploration SA Proprietary Limited and
Aquarius Platinum SA Proprietary Limited in 2008. This dump was
generated by tailings from the mining of the LG6 chromitite layer of
the Bushveld Igneous Complex at the Xstrata Kroondal operations.
REGIONAL GEOLOGYThe Buffelsfontein, Elandskraal and Kroondal mineral resources
originate from the mining of the Bushveld Igneous Complex. The
chromitite layers in the Western Limb of the Bushveld Igneous
Complex are confined to the critical zone of the layered complex
and are grouped from the bottom upwards, into lower, middle and
upper groups. The middle group consists of four chromitite seams
of which the sixth seam – numbered from bottom (MG1) to top
(MG4) – is being mined. The mining that took place at Elandskraal and
is still taking place at Buffelsfontein (IFM Lesedi Mine) are the MG1
and MG2 seams. The MG1 seam sits in the Lower Critical Zone of
the Bushveld Igneous Complex, whereas MG2 is in the Upper Critical
Zone of the Bushveld Igneous Complex. Both MG1 and MG2 dip at
approximately 12 degrees to the north.
Located in the North-West Province of South Africa. Situated in the town of Mooinooi, on the lease area of the IFM Lesedi Mine.
LOCATION
10km0Scale
N4
Rustenburg
Mooinooi
Bapong
Kroondal
Elandskraal
Buffelsfontein
Magaliesberg ProtectedNatural Environment
LEGENDFarm boundaryNational roadRegional roadRailway
PAR Mr&MR FULL report FA.indd 59PAR Mr&MR FULL report FA.indd 59 2017/10/27 1:44 PM2017/10/27 1:44 PM
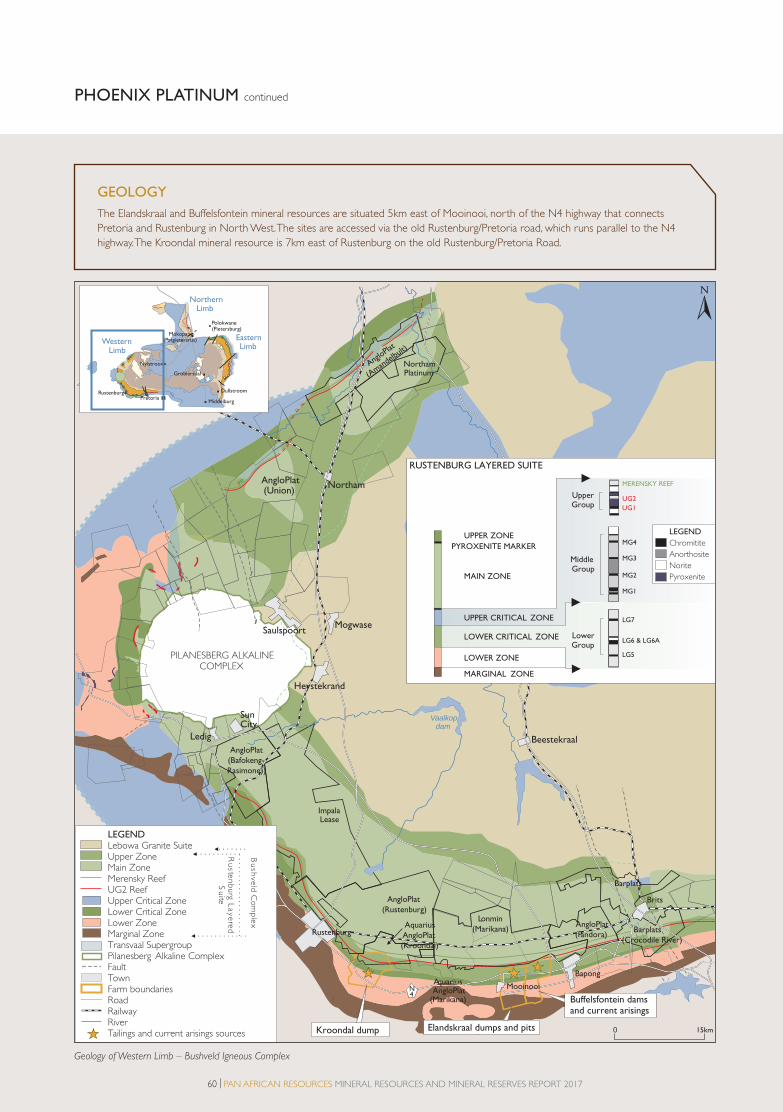
60 | PAN AFRICAN RESOURCES MINERAL RESOURCES AND MINERAL RESERVES REPORT 2017
PILANESBERG ALKALINE COMPLEX
P
Vaalkopdam
R565
N4
15km0
Atlanta
RustenburgPretoria
Western Limb
Northern Limb
Middelburg
Nylstroom
Groblersdal
Dullstroom
Polokwane (Pietersburg)
EasternLimb
Mokopane(Potgietersrus)
Northam
Saulspoort
Heystekrand
Mogwase
Ledig
Sun City
Beestekraal
Mooinooi
Rustenburg
Bapong
Brits
RUSTENBURG LAYERED SUITE
MERENSKY REEF
UG2
UG1
MG4
MG3
MG2
MG1
LG7
LG6 & LG6A
LG5
Upper Group
MiddleGroup
Lower Group
PYROXENITE MARKER
MAIN ZONE
UPPER CRITICAL ZONE
LOWER CRITICAL ZONE
LOWER ZONE
MARGINAL ZONE
UPPER ZONE LEGEND
Chromitite
Anorthosite
Norite
Pyroxenite
LEGENDLebowa Granite SuiteUpper ZoneMain ZoneMerensky ReefUG2 ReefUpper Critical ZoneLower Critical ZoneLower ZoneMarginal ZoneTransvaal SupergroupPilanesberg Alkaline Complex FaultTownFarm boundariesRoadRailwayRiverTailings and current arisings sources
xel
pm
oC
dle
vh
su
B
der
ey
aL
gru
bn
ets
uR
eti
uS
N4
AngloPlat(Union)
AngloPla
t
(Aman
delbu
lt)
ImpalaLease
Barplats
Lonmin
(Marikana)
AquariusAngloPlat
(Marikana)
AngloPlat
(Rustenburg)
Aquarius
AngloPlat
(Kroondal)
AngloPlat
(Bafokeng-
Rasimone))
NorthamPlatinum
AngloPlat
(Pandora)Barplats
(Crocodile River)
Kroondal dump
Buffelsfontein dams and current arisings
Elandskraal dumps and pits
R
Geology of Western Limb – Bushveld Igneous Complex
PHOENIX PLATINUM continued
The Elandskraal and Buffelsfontein mineral resources are situated 5km east of Mooinooi, north of the N4 highway that connects
Pretoria and Rustenburg in North West. The sites are accessed via the old Rustenburg/Pretoria road, which runs parallel to the N4
highway. The Kroondal mineral resource is 7km east of Rustenburg on the old Rustenburg/Pretoria Road.
GEOLOGY
PAR Mr&MR FULL report FA.indd 60PAR Mr&MR FULL report FA.indd 60 2017/10/27 1:44 PM2017/10/27 1:44 PM

PAN AFRICAN RESOURCES MINERAL RESOURCES AND MINERAL RESERVES REPORT 2017 | 61
DEPOSIT TYPESMineralisation at Phoenix is classified as tailings dumps. The tailings
from the various chromite mines are deposited onto a dump, which is
then re-treated by Phoenix Platinum to recover the PGEs 6E.
MINERAL RESOURCE ESTIMATION METHODOLOGY
BuffelsfonteinQuantities
Dumps: The Buffelsfontein dumps were surveyed to obtain the in
situ volumes. The tailings dams occupied 321,067.5m3. A bulk density
of 1.54t/m3 was determined in a laboratory from dump samples,
and this was used in the tonnage calculation for declaration of the
resource. Tailings from the CTRP were added as an inferred resource;
this was calculated using plant flow meters, densitometers and daily
assays.
Current arisings: Following IFM being placed in business rescue, the
PGEs 4E mineral resource was categorised as inferred.
Grade
Resource determination was done by
drilling the resource dams on a grid pattern of 8m x 8m where
possible. A composite sample of the drill hole was created and then
analysed for the PGEs 4E content at a minerals analysis laboratory. An
inverse distance estimation technique was used to derive the mineral
resource grade.
ElandskraalQuantities
Resource volumes were determined by drilling the resource dumps,
dams and pits on a grid pattern where possible. The grids at Elandskraal
were less straight than at Buffelsfontein, due to the roughness of the
terrain that made up the resource. Information from this drilling
process was modelled three-dimensionally by mineral resource
specialists to obtain accurate resource tonnage determinations, which
would form part of a SAMREC-compliant resource.
Grade
The information from the sampling process was analysed and the
average grade for the dam and pits was determined, using an inverse
distance estimation technique.
KroondalAs at June 2013, the Kroondal resource was split into three areas:
• Farm Kroondal 304JQ dump
• Wonderkop non-processed dumps
• Wonderkop processed dump.
Quantities
A volumetric survey was conducted on farm Kroondal 304JQ and
on the Wonderkop non-processed dumps. Due to vegetation on
Wonderkop processed dump, a volumetric survey in 2013 was not
undertaken, and the resource was thus reclassified as an indicated
resource. A bulk density of 2.04 t/m was used.
Grade
The area consists of the LG6 tailings dump at the dormant Kroondal
Mine. A detailed competent person’s report was completed in
2003 by Craton Resources CC, and the grade determined was 2g/t
PGEs 6E.
PRILL SPLIT
Element %
Pt 62.3
Pd 22.4
Au 0.3
Rh 15.0
PAR Mr&MR FULL report FA.indd 61PAR Mr&MR FULL report FA.indd 61 2017/10/27 1:44 PM2017/10/27 1:44 PM
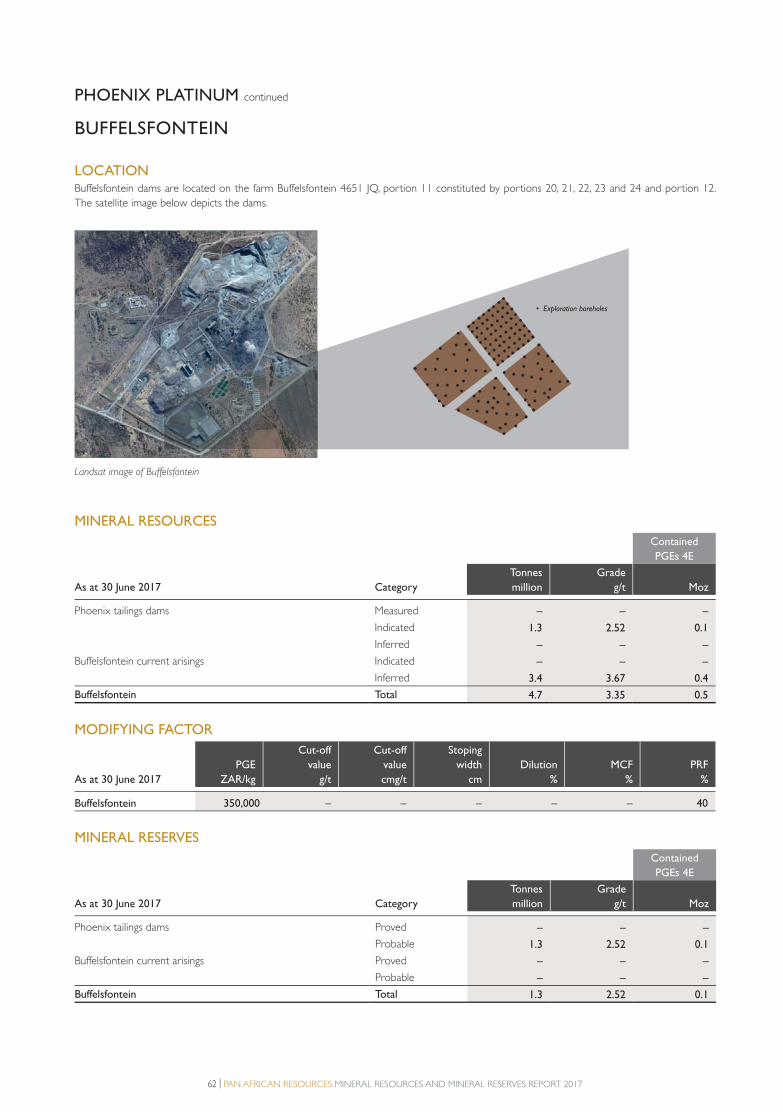
62 | PAN AFRICAN RESOURCES MINERAL RESOURCES AND MINERAL RESERVES REPORT 2017
PHOENIX PLATINUM continued
LOCATIONBuffelsfontein dams are located on the farm Buffelsfontein 4651 JQ, portion 11 constituted by portions 20, 21, 22, 23 and 24 and portion 12.
The satellite image below depicts the dams.
MINERAL RESOURCES
Contained
PGEs 4E
As at 30 June 2017 Category
Tonnes
million
Grade
g/t Moz
Phoenix tailings dams Measured – – –
Indicated 1.3 2.52 0.1
Inferred – – –
Buffelsfontein current arisings Indicated – – –
Inferred 3.4 3.67 0.4
Buffelsfontein Total 4.7 3.35 0.5
MODIFYING FACTOR
As at 30 June 2017
PGE
ZAR/kg
Cut-off
value
g/t
Cut-off
value
cmg/t
Stoping
width
cm
Dilution
%
MCF
%
PRF
%
Buffelsfontein 350,000 – – – – – 40
MINERAL RESERVES
Contained
PGEs 4E
As at 30 June 2017 Category
Tonnes
million
Grade
g/t Moz
Phoenix tailings dams Proved – – –
Probable 1.3 2.52 0.1
Buffelsfontein current arisings Proved – – –
Probable – – –
Buffelsfontein Total 1.3 2.52 0.1
BUFFELSFONTEIN
Landsat image of Buffelsfontein
• Exploration boreholes
PAR Mr&MR FULL report FA.indd 62PAR Mr&MR FULL report FA.indd 62 2017/10/27 1:44 PM2017/10/27 1:44 PM
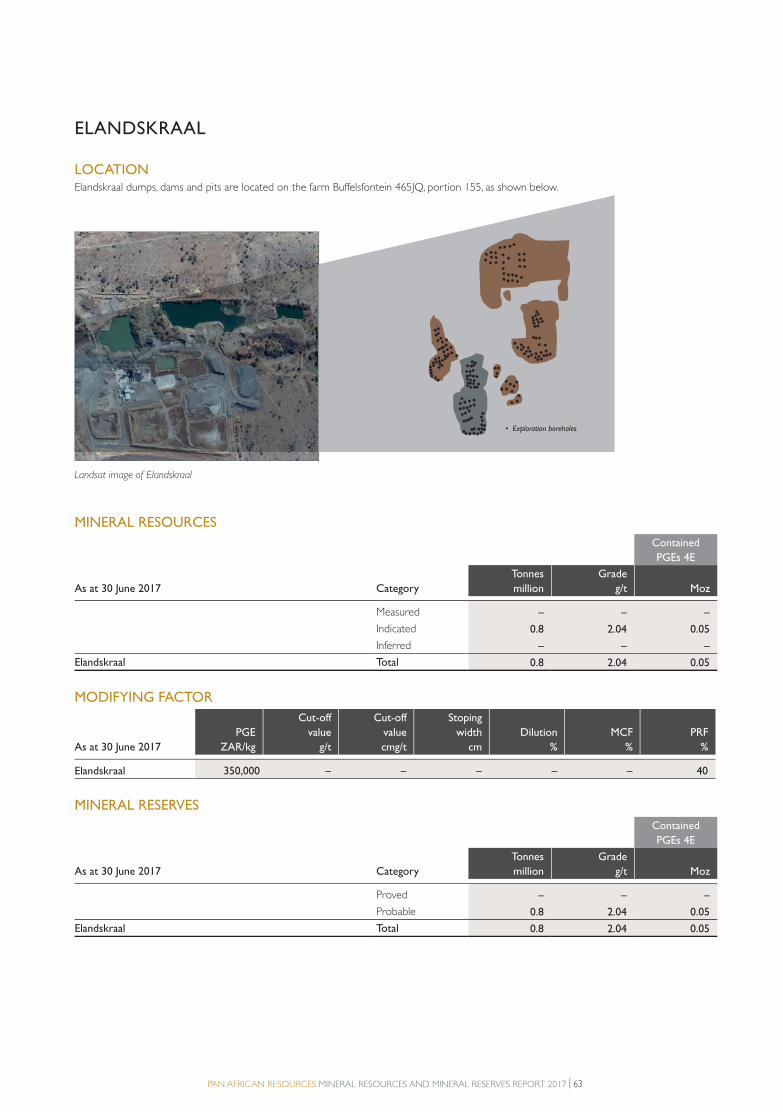
PAN AFRICAN RESOURCES MINERAL RESOURCES AND MINERAL RESERVES REPORT 2017 | 63
LOCATIONElandskraal dumps, dams and pits are located on the farm Buffelsfontein 465JQ, portion 155, as shown below.
MINERAL RESOURCES
Contained
PGEs 4E
As at 30 June 2017 Category
Tonnes
million
Grade
g/t Moz
Measured – – –
Indicated 0.8 2.04 0.05
Inferred – – –
Elandskraal Total 0.8 2.04 0.05
MODIFYING FACTOR
As at 30 June 2017
PGE
ZAR/kg
Cut-off
value
g/t
Cut-off
value
cmg/t
Stoping
width
cm
Dilution
%
MCF
%
PRF
%
Elandskraal 350,000 – – – – – 40
MINERAL RESERVES
Contained
PGEs 4E
As at 30 June 2017 Category
Tonnes
million
Grade
g/t Moz
Proved – – –
Probable 0.8 2.04 0.05
Elandskraal Total 0.8 2.04 0.05
ELANDSKRAAL
Landsat image of Elandskraal
• Exploration boreholes
PAR Mr&MR FULL report FA.indd 63PAR Mr&MR FULL report FA.indd 63 2017/10/27 1:44 PM2017/10/27 1:44 PM
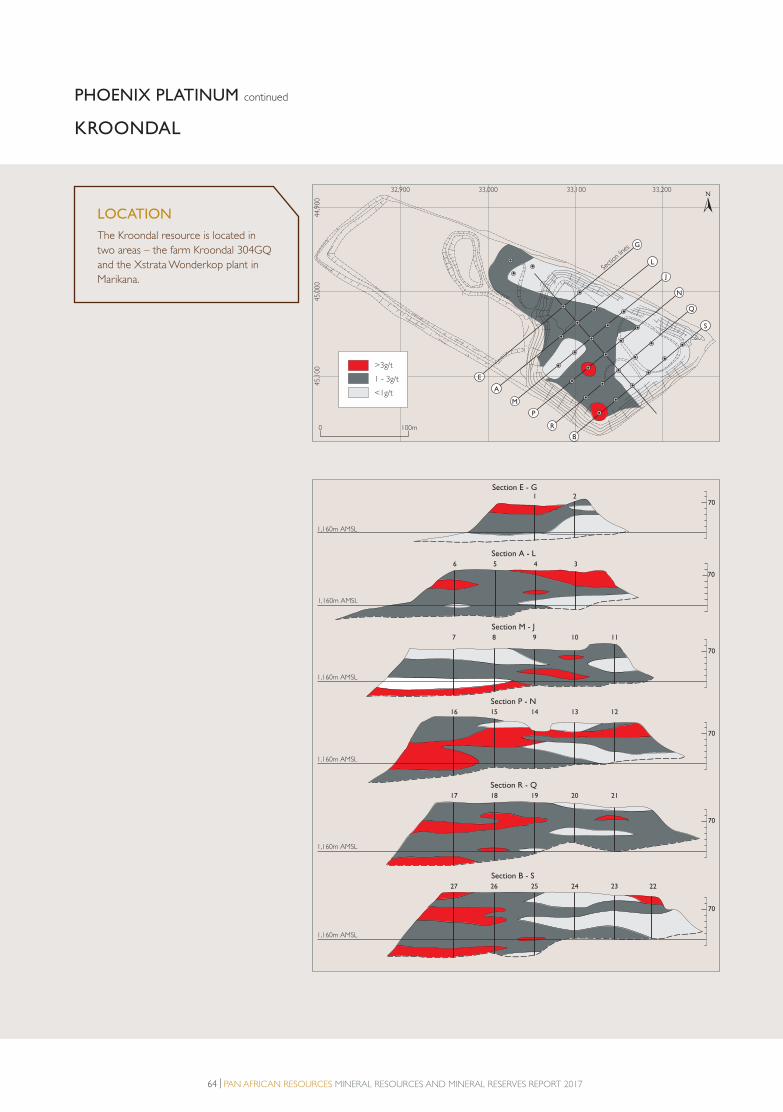
64 | PAN AFRICAN RESOURCES MINERAL RESOURCES AND MINERAL RESERVES REPORT 2017
PHOENIX PLATINUM continued
KROONDAL
The Kroondal resource is located in
two areas – the farm Kroondal 304GQ
and the Xstrata Wonderkop plant in
Marikana.
LOCATION
1,160m AMSL
1 2Section E - G
70
1,160m AMSL
7 8 9 10 11
Section M - J
70
1,160m AMSL
16 15 14 13 12
Section P - N
70
1,160m AMSL
3456
Section A - L
70
27 26 25 24 23 22
Section B - S
70
1,160m AMSL
17 18 19 20 21
Section R - Q
70
1,160m AMSL
E
A
M
P
G
B
L
J
N
Q
S
R
Secti
on lin
es
32,900 33,000 33,100 33,200
44,9
00
45,0
00
45,1
00 >3g/t
1 - 3g/t
<1g/t
0 100m
PAR Mr&MR FULL report FA.indd 64PAR Mr&MR FULL report FA.indd 64 2017/10/27 1:44 PM2017/10/27 1:44 PM
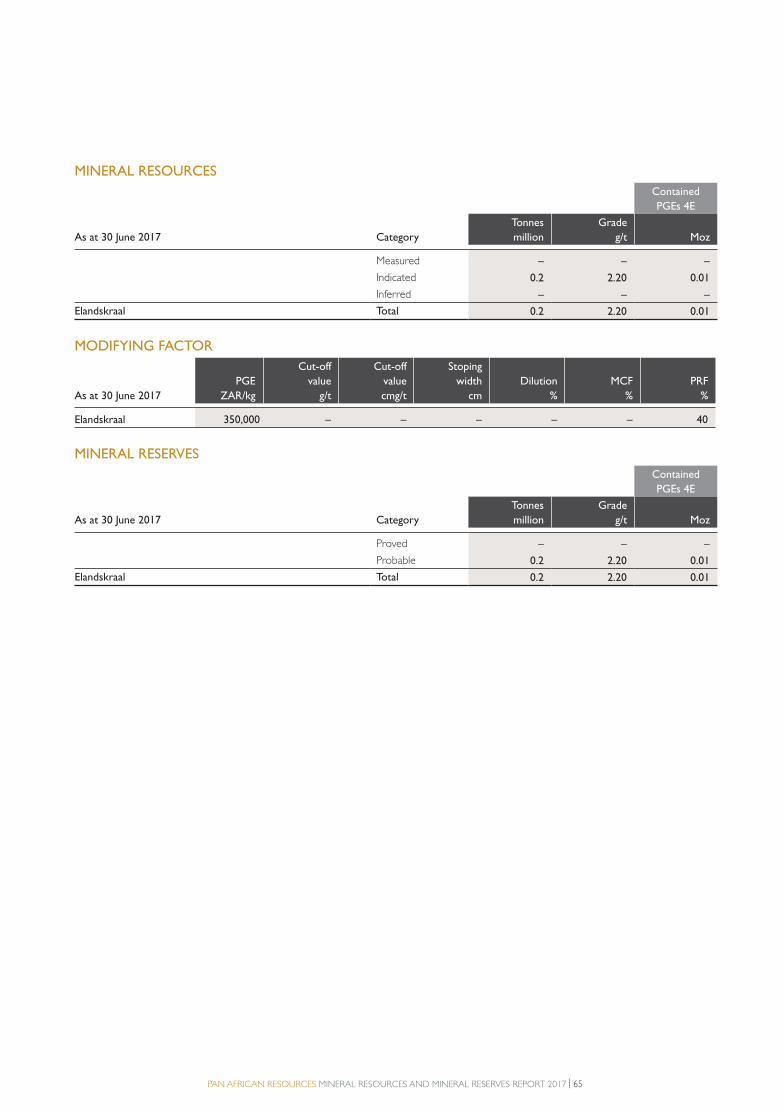
PAN AFRICAN RESOURCES MINERAL RESOURCES AND MINERAL RESERVES REPORT 2017 | 65
MINERAL RESOURCES
Contained
PGEs 4E
As at 30 June 2017 Category
Tonnes
million
Grade
g/t Moz
Measured – – –
Indicated 0.2 2.20 0.01
Inferred – – –
Elandskraal Total 0.2 2.20 0.01
MODIFYING FACTOR
As at 30 June 2017
PGE
ZAR/kg
Cut-off
value
g/t
Cut-off
value
cmg/t
Stoping
width
cm
Dilution
%
MCF
%
PRF
%
Elandskraal 350,000 – – – – – 40
MINERAL RESERVES
Contained
PGEs 4E
As at 30 June 2017 Category
Tonnes
million
Grade
g/t Moz
Proved – – –
Probable 0.2 2.20 0.01
Elandskraal Total 0.2 2.20 0.01
PAR Mr&MR FULL report FA.indd 65PAR Mr&MR FULL report FA.indd 65 2017/10/27 1:44 PM2017/10/27 1:44 PM
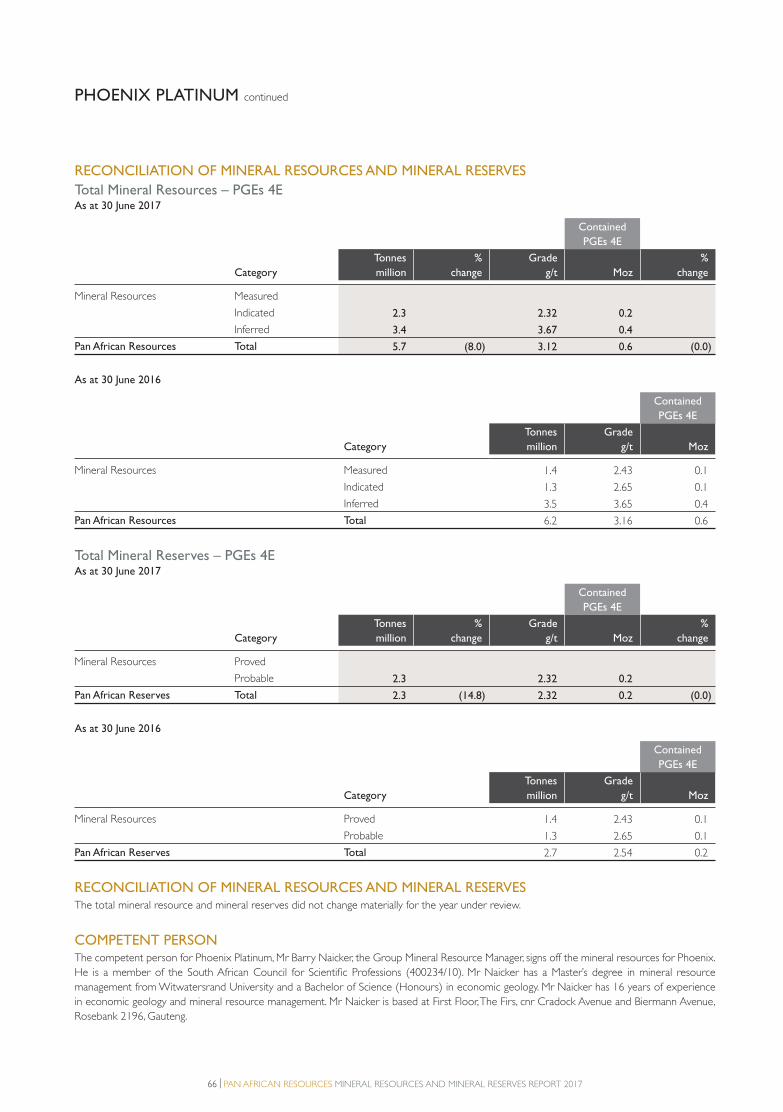
66 | PAN AFRICAN RESOURCES MINERAL RESOURCES AND MINERAL RESERVES REPORT 2017
PHOENIX PLATINUM continued
RECONCILIATION OF MINERAL RESOURCES AND MINERAL RESERVES
Total Mineral Resources – PGEs 4EAs at 30 June 2017
Contained
PGEs 4E
Category
Tonnes
million
%
change
Grade
g/t Moz
%
change
Mineral Resources Measured
Indicated 2.3 2.32 0.2
Inferred 3.4 3.67 0.4
Pan African Resources Total 5.7 (8.0) 3.12 0.6 (0.0)
As at 30 June 2016
Contained
PGEs 4E
Category
Tonnes
million
Grade
g/t Moz
Mineral Resources Measured 1.4 2.43 0.1
Indicated 1.3 2.65 0.1
Inferred 3.5 3.65 0.4
Pan African Resources Total 6.2 3.16 0.6
Total Mineral Reserves – PGEs 4EAs at 30 June 2017
Contained
PGEs 4E
Category
Tonnes
million
%
change
Grade
g/t Moz
%
change
Mineral Resources Proved
Probable 2.3 2.32 0.2
Pan African Reserves Total 2.3 (14.8) 2.32 0.2 (0.0)
As at 30 June 2016
Contained
PGEs 4E
Category
Tonnes
million
Grade
g/t Moz
Mineral Resources Proved 1.4 2.43 0.1
Probable 1.3 2.65 0.1
Pan African Reserves Total 2.7 2.54 0.2
RECONCILIATION OF MINERAL RESOURCES AND MINERAL RESERVESThe total mineral resource and mineral reserves did not change materially for the year under review.
COMPETENT PERSONThe competent person for Phoenix Platinum, Mr Barry Naicker, the Group Mineral Resource Manager, signs off the mineral resources for Phoenix.
He is a member of the South African Council for Scientific Professions (400234/10). Mr Naicker has a Master’s degree in mineral resource
management from Witwatersrand University and a Bachelor of Science (Honours) in economic geology. Mr Naicker has 16 years of experience
in economic geology and mineral resource management. Mr Naicker is based at First Floor, The Firs, cnr Cradock Avenue and Biermann Avenue,
Rosebank 2196, Gauteng.
PAR Mr&MR FULL report FA.indd 66PAR Mr&MR FULL report FA.indd 66 2017/10/27 1:44 PM2017/10/27 1:44 PM
PAN AFRICAN RESOURCES MINERAL RESOURCES AND MINERAL RESERVES REPORT 2017 | 67
GLOSSARY
PAR Mr&MR FULL report FA.indd 67PAR Mr&MR FULL report FA.indd 67 2017/10/27 1:44 PM2017/10/27 1:44 PM

68 | PAN AFRICAN RESOURCES MINERAL RESOURCES AND MINERAL RESERVES REPORT 2017
GLOSSARY
Aids Acquired Immune Deficiency Syndrome
AIM Alternative Investment Market, the London Stock Exchange’s international market for smaller growing companies
APMs Alternative Performance Measures
B-BBEE Broad-based black economic empowerment
Barberton Mines Barberton Mines Proprietary Limited
BIOX The Biological Oxidation (BIOX®) gold extraction process was developed at Barberton Mines. It is an
environmentally friendly process of releasing gold from the sulphide that surrounds it by using bacteria
the board The board of directors of Pan African Resources, as set out on pages 82 and 83
Bramber tailings TSF located at Fairview which the BTRP treated historically
Brownfield project Project based on prior work or rebuilt from a previous one
BTRP Barberton Tailings Retreatment Plant, a gold recovery tailings plant owned by Barberton Mines, which
commenced production in FY2014
Business rescue A process which gives a company in financial distress the opportunity to restructure and reorganise its affairs
under the supervision of a business rescue practitioner
CEO Pan African Resources’ Chief Executive Officer is Cobus Loots
CIL Carbon-in-leach
Companies Act South African Companies Act 71 of 2008 (SA Companies Act)
CSI Corporate social investment
CTRP Chrome tailings retreatment plant
Deloitte Deloitte LLP and Deloitte SA
DMR Department of Mineral Resources
Earnings-accretive acquisition An acquisition which increases earnings per share
Elikhulu Elikhulu Tailings Retreatment Plant project in Mpumalanga province that will enhance the group’s production
profile
Eskom Electricity Supply Commission, South African electricity supplier
ETRP Evander Tailings Retreatment Plant, commissioned in October 2015
Evander Mines Evander Gold Mines Limited and Evander Gold Mining Proprietary Limited
Exco Executive committee of Pan African Resources
FD Pan African Resources’ Financial Director is Deon Louw
g/t Grams/tonne
GRI Global Reporting Initiatives
Harmony Harmony Gold Mining Company Limited
HDSA Historically disadvantaged South African
HIV Human Immunodeficiency Virus
HR Human Resources
IAS International Accounting Standards
IBC Inside back cover (of this integrated annual report)
IFL International Ferro Metals (SA) Proprietary Limited, Phoenix Platinum concluded a formal CTRP agreement
with IFL and operates from its Lesedi Mine
IFMSA South African subsidiary, International Ferro Metals (SA) Proprietary Limited
IFRS International Financial Reporting Standards
IIRC International Integrated Reporting Council
ISO International Standards Organisation
PAR Mr&MR FULL report FA.indd 68PAR Mr&MR FULL report FA.indd 68 2017/10/27 1:44 PM2017/10/27 1:44 PM

PAN AFRICAN RESOURCES MINERAL RESOURCES AND MINERAL RESERVES REPORT 2017 | 69
JSE JSE Limited incorporating the Johannesburg Securities Exchange, the main bourse in South Africa
King IV Report or King IV King Report on Corporate Governance for South Africa, 2016
km Kilometres
KPIs Key performance indicators – a set of quantifiable measures that a company or industry uses to gauge or
compare performance in terms of meeting their strategic and operational goals
LSE London Stock Exchange
LTIFR Lost-time injury frequency rate
MCF Mine call factor
Metanza Mineral Processors, a BEE company which operates the CTRP at Phoenix Platinum plant under contract to
Pan African Resources
Mining Charter Charter to facilitate the sustainable transformation and development of the South African mining industry
Moz Million ounces
MPRDA Mineral and Petroleum Resources Development Act
MR&MR Mineral Resources and Mineral Reserves
MRM Mineral resource management
Mt Million tonnes
NIHL Noise-induced hearing loss
Nomad Nominated Adviser appointed in accordance with the London Stock Exchange’s AIM Rules for Companies
NUM National Union of Mineworkers
Opsco Operations committee
Pan African Resources PLC Holding company – Pan African Resources
PAR Gold Proprietary Limited Pan African Resources’ black empowerment partner, which has a 19.53% stake in the group
PGE Platinum group elements, namely platinum, palladium, rhodium and gold
Phoenix Platinum Phoenix Platinum Mining Proprietary Limited, a subsidiary of Pan African Resources
Prescribed officers Anyone who fulfils the role of a director but is operating under a different designation
RCF Revolving credit facility
Remchannel Internet-based remuneration survey providing data across a wide variety of industries in South Africa
Remco Remuneration committee of Pan African Resources
RIFR Reportable injury frequency rate
ROM Run-of-mine
SA South Africa
SAICA South African Institute of Chartered Accountants
SAMREC SAMREC South African Code for Reporting of Mineral Resources and Mineral Reserves
Section 54 safety stoppages In terms of section 54 of the Mine Health and Safety Act 29 of 1996, if an inspector of mines believes that an
occurrence, practice or condition at a mine endangers or may endanger the health or safety of people at the
mine, the inspector may give any instruction necessary to protect the health or safety of people at the mine,
including instructing that operations at the mine or a part of the mine be halted
SHEQC Safety, health, environment, quality and community
SLP Social and labour plan
Sporotrichosis A disease caused by a fungus infection
t Tonnes
TB Tuberculosis
TSF Tailings storage facility
PAR Mr&MR FULL report FA.indd 69PAR Mr&MR FULL report FA.indd 69 2017/10/27 1:44 PM2017/10/27 1:44 PM

70 | PAN AFRICAN RESOURCES MINERAL RESOURCES AND MINERAL RESERVES REPORT 2017
GLOSSARY continued
the current year or the year
under review
The year ended 30 June 2017
the group or the company or
Pan African Resources
Pan African Resources PLC, listed on the LSE’s AIM and on the JSE in the ‘Gold Mining’ sector
the previous year The year ended 30 June 2016
the UK Code UK Corporate Governance Code which sets out standards of good practice in relation to board leadership
TIFR Total injury frequency rate
UASA United Association of South Africa
UK United Kingdom
UK Companies Act 2006 An Act of the Parliament of the United Kingdom which forms the primary source of UK company law
PAR Mr&MR FULL report FA.indd 70PAR Mr&MR FULL report FA.indd 70 2017/10/27 1:44 PM2017/10/27 1:44 PM

PAN AFRICAN RESOURCES MINERAL RESOURCES AND MINERAL RESERVES REPORT 2017 | 71
COMPANY INFORMATION
CORPORATE OFFICEThe Firs Office Building
1st Floor, Office 101
Cnr. Cradock and Biermann Avenues
Rosebank, Johannesburg
South Africa
Office: +27 (0) 11 243 2900
Facsimile: +27 (0) 11 880 1240
REGISTERED OFFICESuite 31 Second Floor
107 Cheapside
London EC2V 6DN
United Kingdom
Office: +44 (0) 20 7796 8644
Facsimile: +44 (0) 20 7796 8645
DIRECTORSCobus Loots
Pan African Resources
Chief Executive Officer
Office: +27 (0) 11 243 2900
Deon Louw
Pan African Resources
Financial Director
Office: +27 (0) 11 243 2900
COMPANY SECRETARYPhil Dexter/Jane Kirton
St James’s Corporate Services Limited
Office: +44 (0) 20 7796 8644
www.panafricanresources.com
JSE SPONSORSholto Simpson
One Capital
Office: +27 (0) 11 550 5009
NOMINATED ADVISER AND JOINT BROKERJohn Prior/Paul Gillam
Numis Securities Limited
Office: +44 (0) 20 7260 1000
JOINT BROKERSMatthew Armitt/Ross Allister
Peel Hunt LLP
Office: +44 (0) 20 7418 8900
Jeffrey Couch/Neil Haycock/Thomas Rider
BMO Capital Markets Limited
Office: +44 (0) 20 7236 1010
PUBLIC AND INVESTOR RELATIONS SAJulian Gwillim
Aprio Strategic Communications
Office: +27 (0)11 880 0037
PUBLIC AND INVESTOR RELATIONS UKBobby Morse/Chris Judd
Buchanan Communications
Office: +44 (0) 207 466 5000
PAR Mr&MR FULL report FA.indd 71PAR Mr&MR FULL report FA.indd 71 2017/10/27 1:44 PM2017/10/27 1:44 PM

www.panafricanresources.com
PAR Mr&MR FULL report FA.indd 72PAR Mr&MR FULL report FA.indd 72 2017/10/27 1:44 PM2017/10/27 1:44 PM