


Meteorological, hydrological Meteorological, hydrological
and drought indicatorsand drought indicators
Célia Gouveia
Instituto Dom Luiz, Faculdade Ciências Universidade de Lisboa, Portugal

Outline
� Drought Complexity
� Drought impacts
� Drought Assessment� Vegetation Indices
� Drought indicators: PDSI
� Drought indicators: SPI
� Drought indicators: SPEI
� Drought Severity and Warming
� Dryness and shrubland degradation
20-05-2014 2

Drought Complexity
Drought is challenging to identify over space and time
Quantification of droughts include intensity, magnitude, duration and surface extent. This quantification is an hard job!
There is no a variable that we can use to measure drought droughts are identified by means of impacts
20-05-2014 3

Drought Impacts
Drought is the most damaging meteorological hazard affecting large areas.
20-05-2014 4
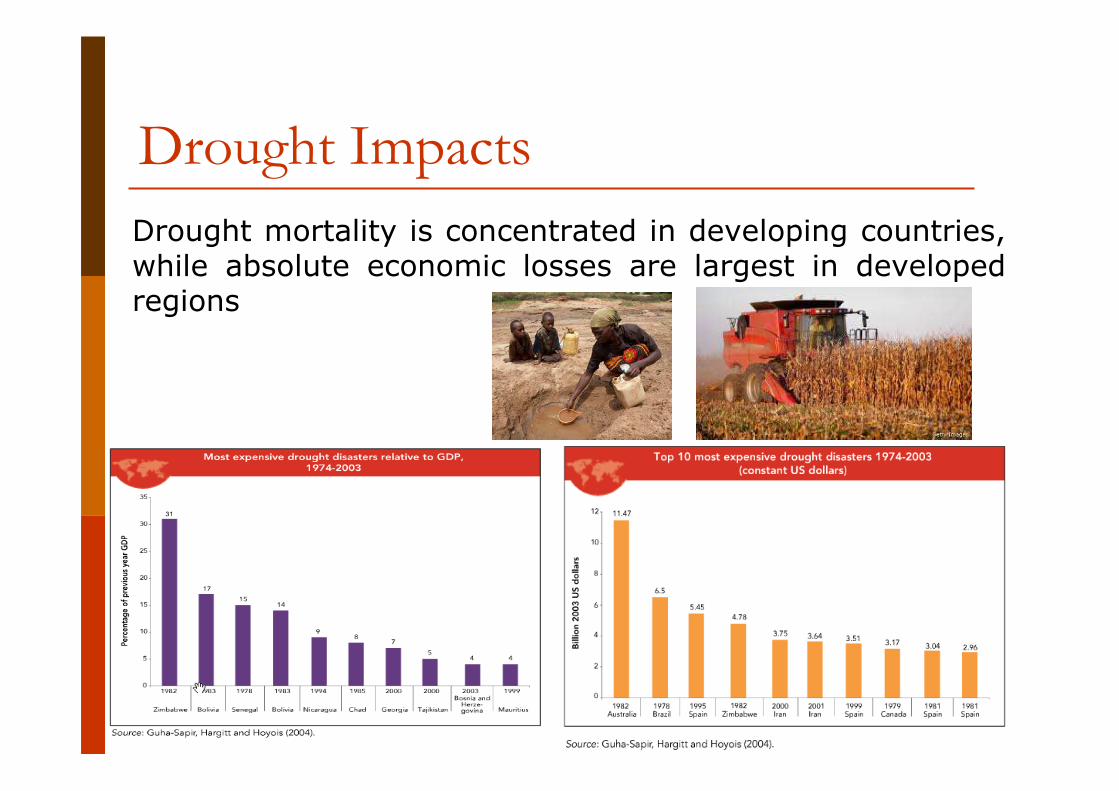
Drought Impacts
Drought mortality is concentrated in developing countries, while absolute economic losses are largest in developed regions
20-05-2014 5

Drought Impacts
Droughts also cause several environmental impacts: forest decline, forest fires, soil degradation, wetland degradation, desertification
20-05-2014 6

Drought impacts: Mediterranean area
Climatic droughts are frequent in Iberian Peninsula, as well as in all the Mediterranean region, as a consequence of the large temporal variability of precipitation.
The strong dependence of vegetation dynamics on water availability has been for long recognized in the Mediterranean regions.
20-05-2014 7
Drought Impacts
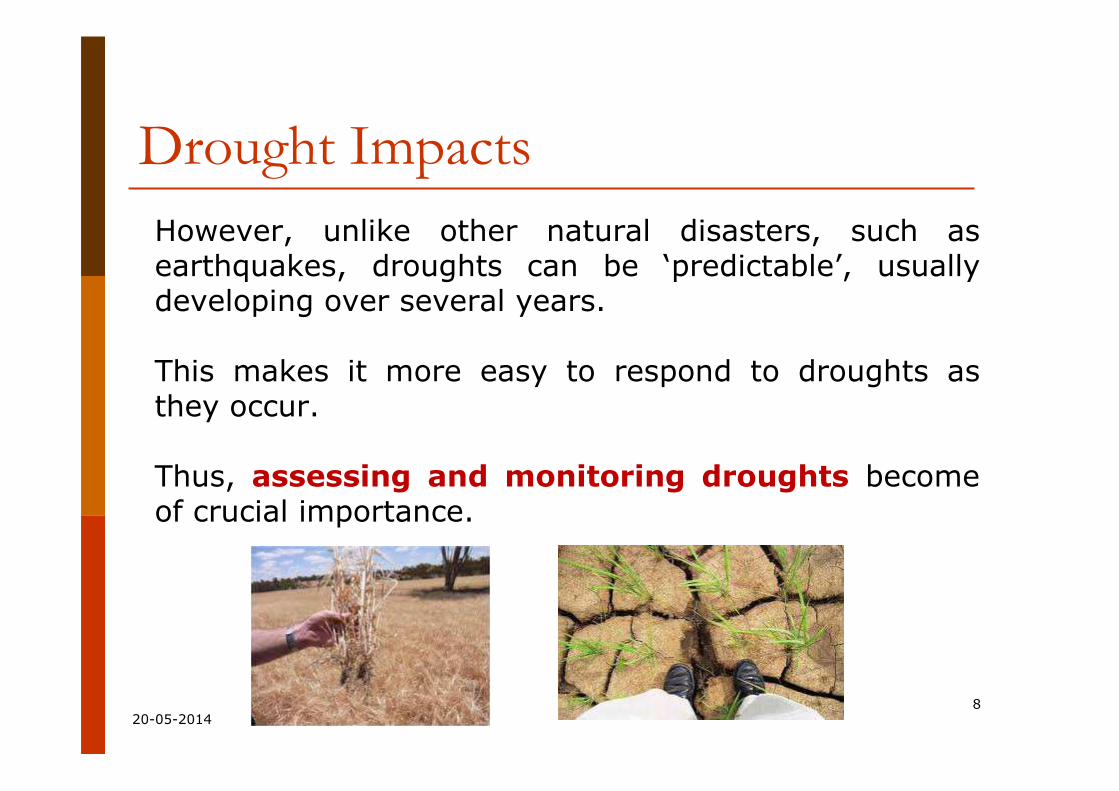
However, unlike other natural disasters, such as earthquakes, droughts can be ‘predictable’, usually developing over several years.
This makes it more easy to respond to droughts as they occur.
Thus, assessing and monitoring droughts become of crucial importance.
20-05-2014 8

Drought Assessment
Traditional methods of drought assessment and monitoring rely on rainfall data as recorded in meteorological and hydrological networks.
The role of remote sensing in drought monitoring has been reinforced in recent years due to the availability of reliable satellite imagery covering wide regions over long periods.
20-05-2014 9

Vegetation Indices
� NDVI was successfully tested (e.g., in regions characterized by Mediterranean climates) to monitor vegetation dynamics
rednir
rednirNDVIρρρρ
+−=
20-05-2014 10

Vegetation Indices
� NDVI was successfully tested (e.g., in regions characterized by Mediterranean climates) to monitor vegetation dynamics
20-05-2014
SPRINGSPRING SUMMERSUMMER
Gouveia et al. (2008)Gouveia et al. (2008)GIMMS NDVI from 1982GIMMS NDVI from 1982--20022002
11

� Monthly time-series of NDVI (1999–2006) for different land cover types
SPOT VEGETATION NDVI from 1999SPOT VEGETATION NDVI from 1999--20062006
� During 2004/2005, the Iberian Peninsula was hit by one of the two worst drought episodes in the last 60 years.
Vegetation Indices
20-05-2014 12

� Monthly means of NDVI (1999-2006) from September to August
Vegetation Indices
Gouveia et al. (2009)Gouveia et al. (2009)
20-05-2014 13

� NDVI anomalies from September to August of the year 2004/2005.
Vegetation Indices
Gouveia et al. (2009)Gouveia et al. (2009)
20-05-2014 14

� Drought persistence was evaluated by adding up (for each pixel) the number of months with corrected NDVI anomalies lower than a specific threshold (-0.025).
Vegetation Indices
Gouveia et al. (2009)Gouveia et al. (2009)20-05-2014 15

Monthly time-series (1999–2009) averaged over Iberian Peninsula for all pixels (black), for pixels of non-irrigated arable land (red) and for pixels of needle-leaved forest (green).
Vegetation Indices
Gouveia et al. (2012)Gouveia et al. (2012)20-05-2014 16
Number of months from September 2004 to July 2005 with NDVI anomaly < -0.025
65% of Iberia in vegetative stress and low water availability conditions during spring and early summer
Drought Indices
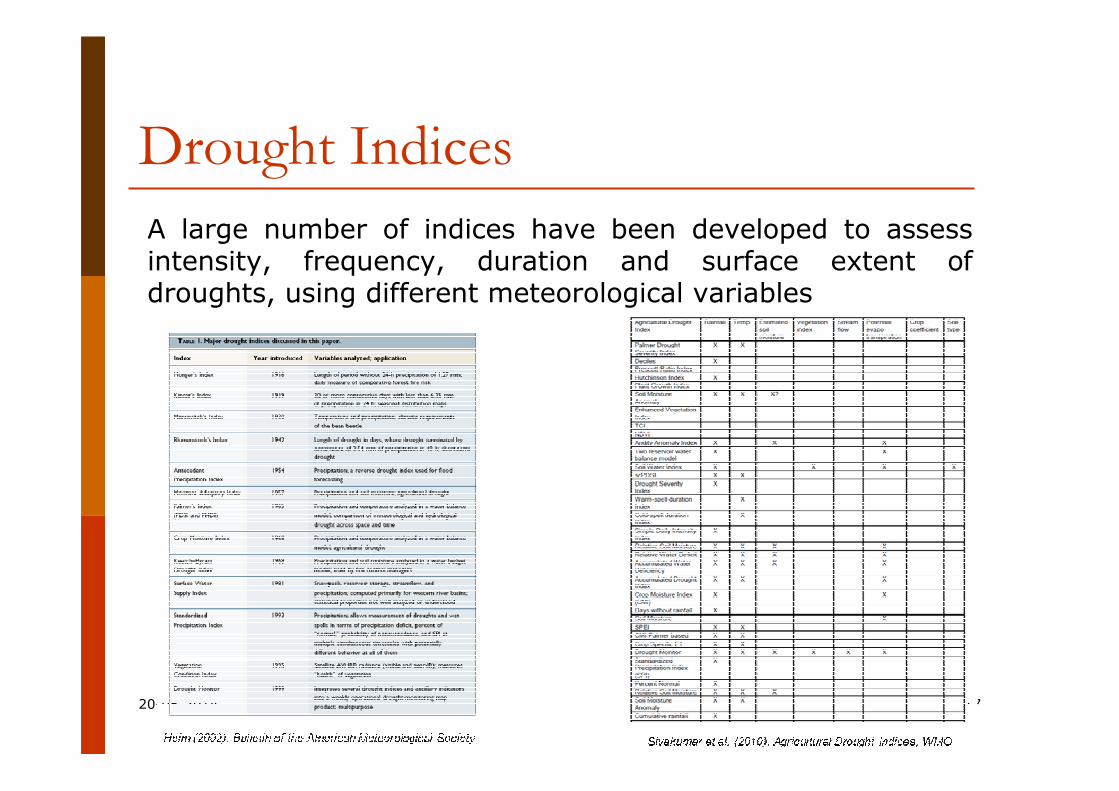
A large number of indices have been developed to assess intensity, frequency, duration and surface extent of droughts, using different meteorological variables
20-05-2014 17
Drought Indices
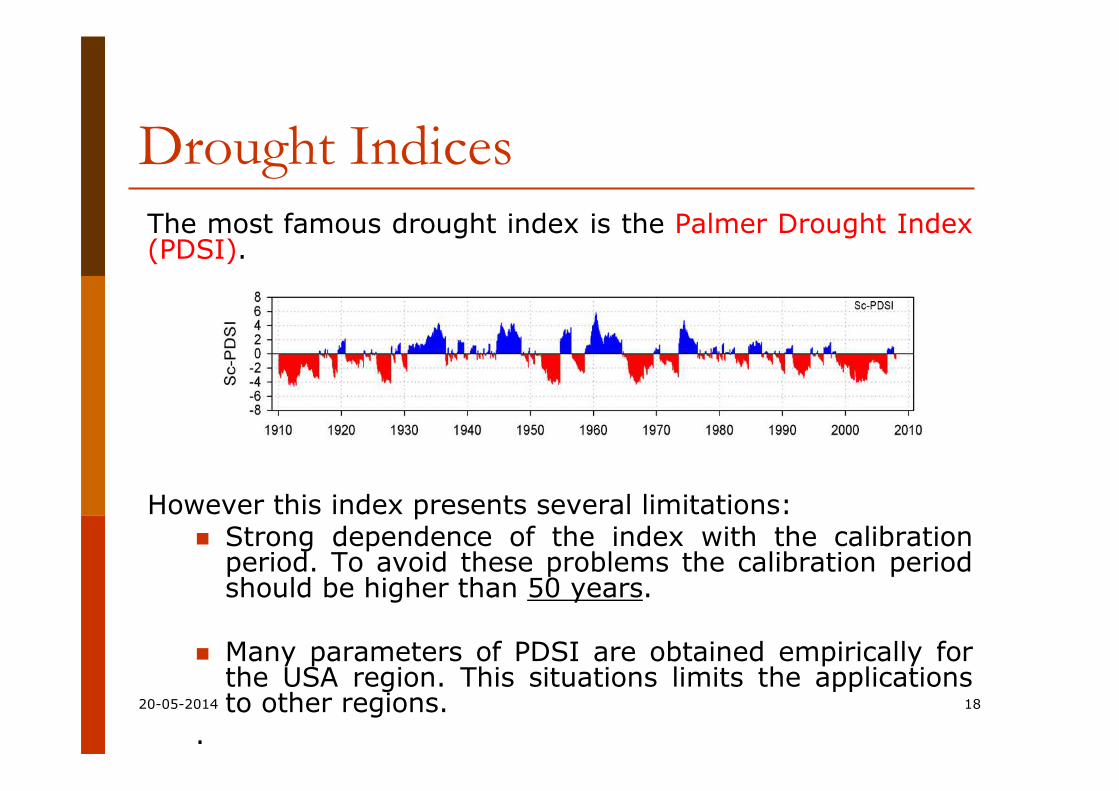
The most famous drought index is the Palmer Drought Index (PDSI).
However this index presents several limitations:� Strong dependence of the index with the calibration
period. To avoid these problems the calibration period should be higher than 50 years.
� Many parameters of PDSI are obtained empirically for the USA region. This situations limits the applications to other regions.
.
20-05-2014 18

Drought Indices
Well et al. (2004) have developed the self calibrated PDSI (scPDSI). The calibration of the modified index is made based on the original dataset, improving its performance.
Maps of the monthly self-calibrating Palmer drought severity index (scPDSI) have been calculated for the period 1901–2002 for United States (20°–50°N; 130°–60°W) and Europe (35°–70°N; 10°W–60°E) with a spatial resolution of 0.5°×0.5°(https://climatedataguide.ucar.edu/climate-data/cru-sc-pdsi-self-calibrating-pdsi-over-europe-north-america).
20-05-2014 19

Drought Indices
20-05-2014
Mean annual scPDSI absolute trends, using CRU (Climatic Research Unit) high-resolution (0.5º lat×0.5º long) dataset for the 1901–2002 period.
Sousa et al., 2010 Sousa et al., 2010 (Natural Hazards and (Natural Hazards and Earth System Sciences)Earth System Sciences)
20

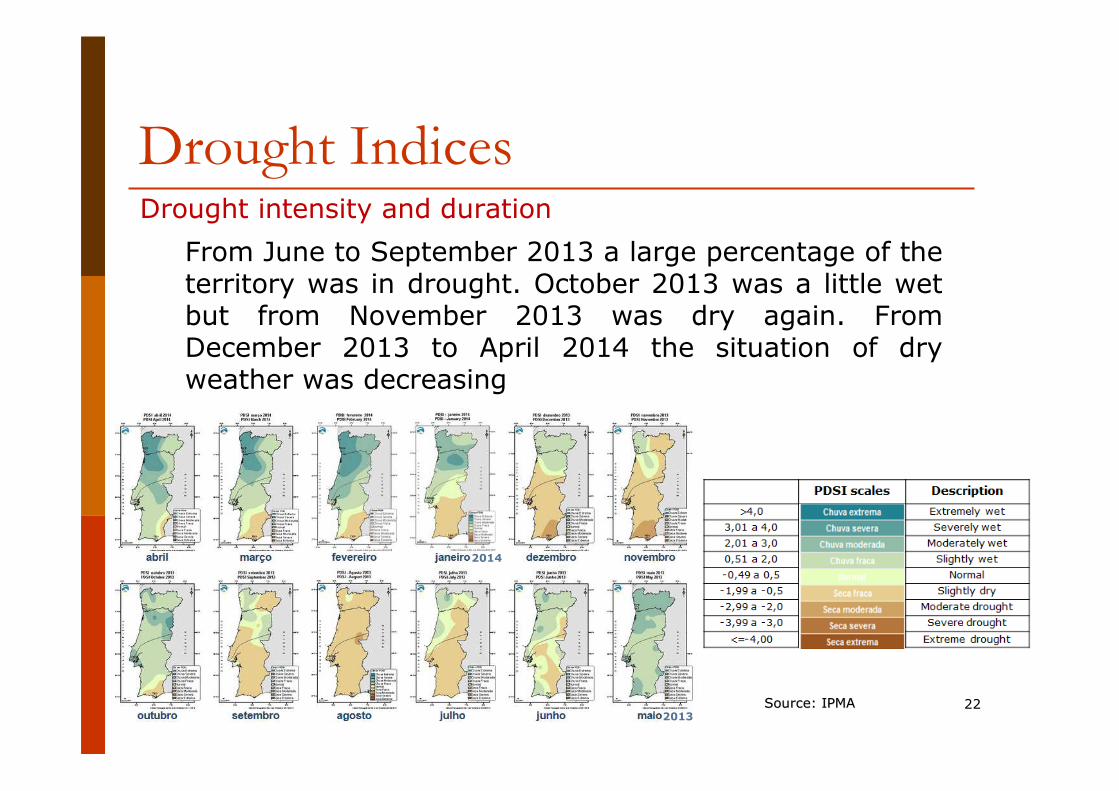
Drought IndicesDrought intensity and duration
20-05-2014 21
From May to August 2012 almost all the country (± 50% in extreme drought and ± 20% in severe drought) was in drought. October 2012 was normal. From November 2012 to April 2013 the main territory is slightly wet, being March the wettest month with ± 60% of the mainland moderately wet.
Source: IPMASource: IPMA
Drought IndicesDrought intensity and duration
20-05-2014 22
From June to September 2013 a large percentage of the territory was in drought. October 2013 was a little wet but from November 2013 was dry again. From December 2013 to April 2014 the situation of dry weather was decreasing
Source: IPMA Source: IPMA 2013
2014

Drought Indices
However the different systems responds to water scarcity with different temporal scales.
Flexible indicators to quantify the drought impacts given the different response times of hydrological, agricultural, economic systems to drought are needed .
20-05-2014 23

Drought Indices
The Standardised Precipitation Index (SPI), based on precipitation data, permit the analysis of the drought at different temporal scales.
SPI is very adjustable index, extremely useful for drought monitoring and assessing impacts.
Heim (2002). Bulletin of the American Meteorological Society.Heim (2002). Bulletin of the American Meteorological Society.http://ams.allenpress.com/archive/1520http://ams.allenpress.com/archive/1520--0477/83/8/pdf/i15200477/83/8/pdf/i1520--04770477--8383--88--1149.pdf1149.pdf
20-05-2014 24

Drought Indices
Time series of the 6 month Standardized Precipitation Index (SPI) averaged over Namibia (top) and Melbourne, Australia (bottom) between 1980-2012.
Hao et al. (2014). Hao et al. (2014). doi:10.1038/sdata.2014.1doi:10.1038/sdata.2014.120-05-2014 25

Drought Indices
SPI at Boulder, Colorado (USA) from 1894-2010 for 3, 6, 12, 24, 36 and 48 months. The original data were from http://www.esrl.noaa.gov/psd/boulder/ (Climate Data Guide; D. Shea)
20-05-2014 26

Drought Indices
SPI for 1 month (top) and 6 months (bottom) over Iberia for 2001(left) and 2005(right)
Colorbar: blue=dry;
orange=wet;
20-05-2014 27
SPISPI--0101
SPISPI--0606
20012001 20052005

Drought Indices
However, SPI is only based on precipitation and doesn’t take in account variables such as temperature or evapotranspiration.
� What will happen if the temperature increase significantly?
� What will happen in the case of extreme events, such as heat waves?
� What will happen in the case of the possible scenarios of increase temperature?
VicenteVicente--Serrano et al., 2010Serrano et al., 201020-05-2014 28

Drought Indices
Vicente-Serrano et al. (2010) have developed a new multi-scale index, the Standardized Precipitation and Evapotranspiration Index (SPEI)
SPEI uses as input precipitation and temperature
VicenteVicente--Serrano et al., 2010Serrano et al., 2010
20-05-2014 29

Drought Indices
� The 3-, 12- ,18- and 24-month SPEI at Lisbon, Portugal, 1901–2012.
The main drought episodes occurred in the decades of 1920-30 (prolonged
drought), 1940, 1980, and 2000.
The year 2005 is extremely striking, reaching most of cases very low SPEI (<-2)20-05-2014 30
SPEI 3
SPEI 12
SPEI 18
SPEI 24
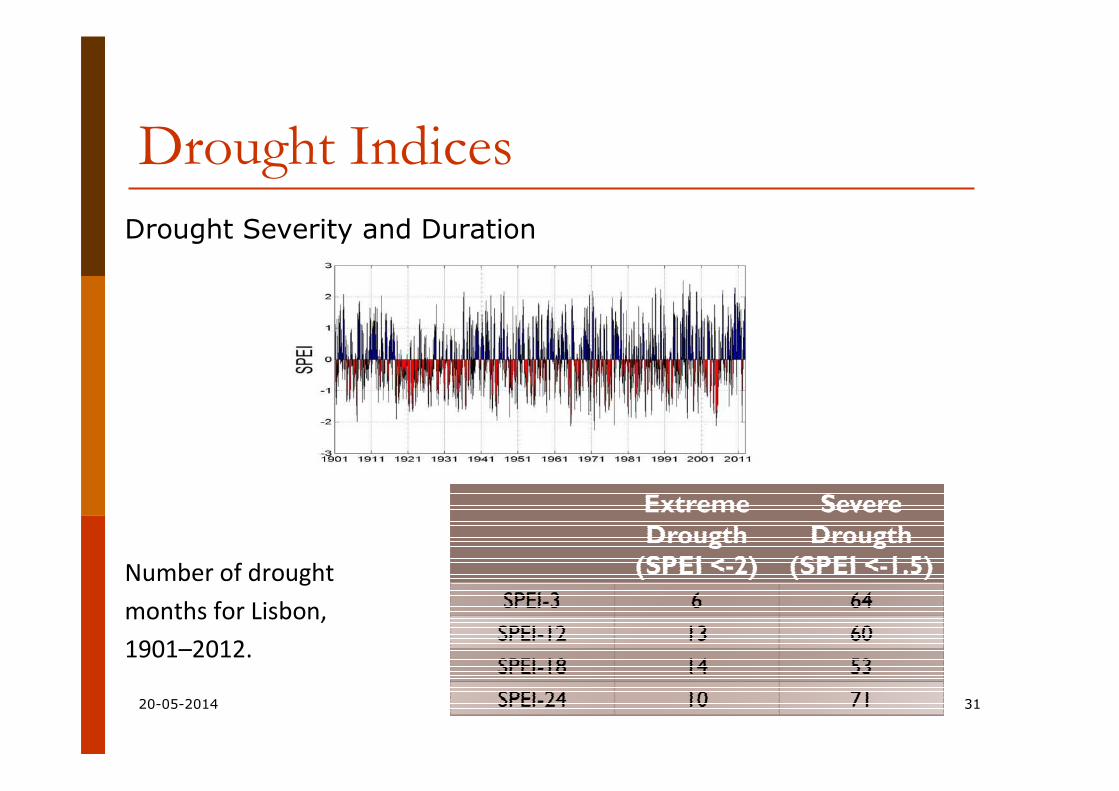
Drought Indices
Drought Severity and Duration
Number of drought
months for Lisbon,
1901–2012.
20-05-2014 31

Drought Indices
Temperature and Evapotranspiration for the IP for March 2005 from CRU TS3.21
The 3- and 12- SPEI at IP
20-05-2014 32
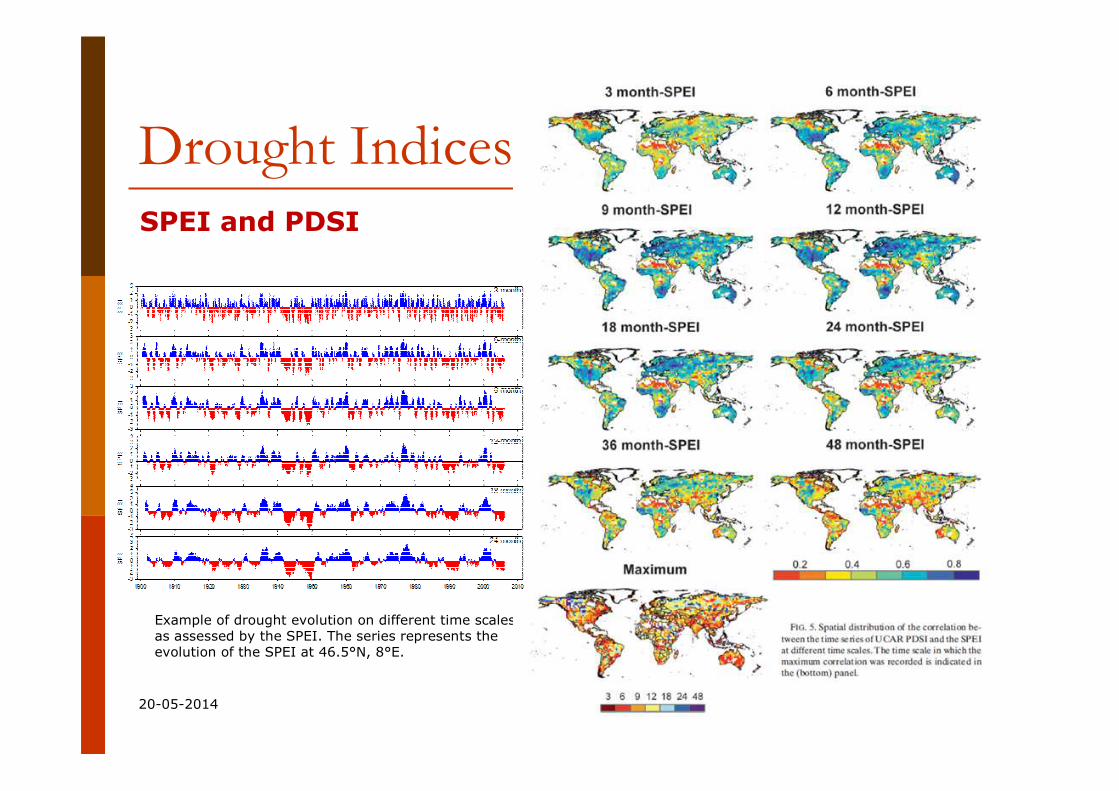
Drought Indices
SPEI and PDSI
20-05-2014 33
Example of drought evolution on different time scales as assessed by the SPEI. The series represents the evolution of the SPEI at 46.5°N, 8°E.

Drought Indices
SPEI and TemperatureSpatial distribution of 3-month SPEI values in August 2003 from the SPEI Global Drought Monitor (http://sac.csic.es/spei/map/maps.html ). Evolution of the 3-month SPI, SPEI and Standardized P-ETa in central France (47ºN-2ºE). Details for the 2003 drought are showed for the three indices. (by S. Vicente-Serrano,)
20-05-2014 34(https://climatedataguide.ucar.edu/climate-data/standardized-precipitation-evapotranspiration-index-spei )

Drought Severity and Warming
Is warming affecting drought severity?
Dai, Dai, Nature Climate Change (2012), Nature Climate Change (2012),
doi:10.1038/nclimate1633doi:10.1038/nclimate163320-05-2014 35
Trend maps for sc_PDSI_pm and time series of percentage dry areas.

Drought Severity and Warming
Sheffield et al., 2012, Nature 491, 435–438
20-05-2014 36
Trends for 1950–2008 in annual average PDSI from the PDSI_Th (a) and the PDSI_PM (c), and their difference (e). b, d, f, Trends for 1950–2008 in annual average PE from the Thornthwaite equation (b) and the PM equations (d), and their difference (f).

Drought Severity and Warming
20-05-2014 37
Warming and Drought in Iberia (1930-2006)
Spatial distribution of annual trends: difference between SPI and SPEI, potential evapotranspiration (PET) and precipitation.
Vicente-Serrano et al., 2011,Clim Res, 48: 203–212, 2011

Drought Severity and Warming
20-05-2014 38
Evidence of increasing drought severity caused by temperature rise in southern Europe
Drought severity has been aggravated by greater evaporative demand by the atmosphere.The SPEI has indicated increased drought severity relative to the SPI
Vicente-Serrano et al., 2014,doi:10.1088/1748-9326/9/4/04400

Dryness and shrubland degradation
20-05-2014 39
Vicente-Serrano et al., 2012, Ecological Monographs, 82(4), 2012, pp. 407–428
Drought Impacts on Vegetation Dynamics
� With the aim to:
� determine the most vulnerable areas and land cover types,
� determine the seasons and drought-time scales more prone to cause negative effects on vegetation.
� The data used:
� NDVI from GIMMS as obtained from NOAA-AVHRR sensor (1982-2006)
� Multi-scalar drought index (SPEI), obtained from CRU dataset (1982-2006)
20-05-2014 40

Drought Impacts on Vegetation Dynamics
Spatial distribution of correlation values between NDVI vs. SPEI for February, May, August and November, using the temporal scales of 3, 6, 9 12, 18 and 24 months.
20-05-2014 41

20-05-2014
Drought Impacts on Vegetation DynamicsSpatial distribution of the maximum of the significant (p<0.05) grid point correlations (NDVI vs. SPEI) for the time scales of 3, 6, 9, 12, 18 and 24 months, during February, May, August and November
42
20-05-2014
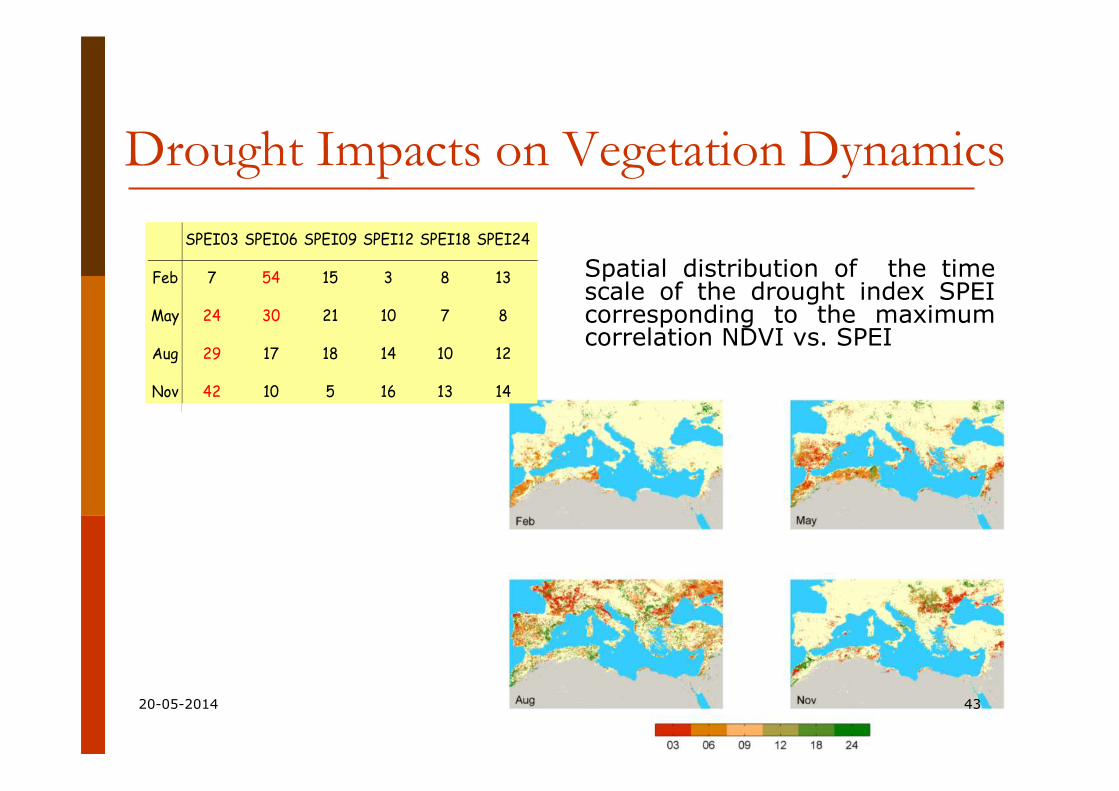
Drought Impacts on Vegetation Dynamics
Spatial distribution of the time scale of the drought index SPEI corresponding to the maximum correlation NDVI vs. SPEI
SPEI03 SPEI06 SPEI09 SPEI12 SPEI18 SPEI24
Feb 7 54 15 3 8 13
May 24 30 21 10 7 8
Aug 29 17 18 14 10 12
Nov 42 10 5 16 13 14
43

20-05-2014
Drought Impacts on Vegetation Dynamics� The annual NDVI and aridity controls of drought impacts
on rainfed crops over Iberia
44
(Gouveia et al., in preparation)

20-05-2014
Drought Impacts on Vegetation Dynamics� The annual NDVI and aridity controls of drought impacts
on rainfed crops over Iberia
(Gouveia et al., in preparation)
45


