Metal Dusting of Heat-Resistant Alloys
Abdulaziz I. Al-Meshari
Hughes Hall, Cambridge
University of Cambridge
Department of Materials Science and Metallurgy
A dissertation submitted to the University of Cambridge for
the degree of Doctor of Philosophy
October, 2008
Page 2 of 344
PREFACE
This dissertation reports research that was carried out in the Department of Materials
Science and Metallurgy under the supervision of Dr. John A. Little.
Unless otherwise stated, the work described in this dissertation is that of the author and
has not been previously submitted in support of an application for another degree or
qualification at this or other universities. This dissertation does not exceed word limit of
60,000 words. Attached to this dissertation is a CD with appendices A, B, and C containing
supplementary data.
Part of this work has been published as follows:
1. Al-Meshari, Abdulaziz and John Little, Oxidation of Heat-Resistant Alloys,
Oxidation of Metals (2008)69:109-118.
2. Al-Meshari, Abdulaziz and John Little, Oxidation of Commercial Heat-Resistant
Alloys, Materials Performance, June 2008:68-72.
3. Al-Meshari, Abdulaziz and John Little, Oxidation of Centrifugally Cast
Superalloys, The 7th International Conference on Microscopy of Oxidation, 15-17
September 2008, Chester, UK
Abdulaziz Al-Meshari
October 2008
Page 3 of 344
ACKNOWLEDGMENTS
I would like to thank my supervisor Dr. John Little for his support, motivation, and
valuable advice.
I also thank all the people in the Department of Materials Science and Metallurgy who
contributed by any mean to produce this work.
I would like to express my thanks to my employer, Saudi Basic Industries Corporation
(SABIC), for giving me the opportunity to carry out this study. I am also grateful to
SABIC Technology Centre-Jubail (STC-J), particularly Mr Mosaed Al-Garni, for allowing
part of the analyses to be carried out in STC-J analytical labs.
I wish to thank Kubota Corporation, Japan for providing the alloys used throughout this
research.
Page 4 of 344
Table of Contents
ABSTRACT ............................................................................................................... 10
1 LITERATURE REVIEW ................................................................................. 10
1.1 Introduction ............................................................................................... 11
1.2 Thermodynamic Considerations.............................................................. 16
1.3 Kinetics Considerations ............................................................................ 26
1.4 Metal Dusting Mechanisms ...................................................................... 33
1.4.1 Metal Dusting Mechanism for Iron and Low Alloy Steels ................. 33
1.4.2 Metal Dusting Mechanism for Nickel and Nickel-Based Alloys ........ 40
1.5 Alloys Performance in Metal Dusting...................................................... 45
1.6 Control and Prevention of Metal Dusting ............................................... 57
1.6.1 Materials Selection .............................................................................. 57
1.6.2 Influence of Surface Condition, Grain Size, and Metal Processing .... 59
1.6.3 Coating ................................................................................................ 63
1.6.4 Process Modification ........................................................................... 64
1.6.5 Sulphur Addition ................................................................................. 65
2 EXPERIMENTAL PLAN AND METHODOLOGY..................................... 67
2.1 Research Target......................................................................................... 67
2.2 Test Alloys .................................................................................................. 67
2.3 Risk Assessment......................................................................................... 68
2.4 Experimental Apparatus........................................................................... 69
2.5 Experimental Procedure ........................................................................... 71
2.6 Analyses and Characterisations ............................................................... 74
2.7 Oxidation Experiments ............................................................................. 76
Page 5 of 344
3 MICROSTRUCTURAL ANALYSES ............................................................. 77
3.1 Microstructure of Heat-Resistant Alloys................................................. 77
3.2 Objective..................................................................................................... 78
3.3 Metallographic Examination.................................................................... 79
3.3.1 HP ........................................................................................................ 79
3.3.2 35Cr-45Ni............................................................................................ 81
3.3.3 UCX..................................................................................................... 82
3.4 Conclusion .................................................................................................. 84
4 OXIDATION OF HEAT-RESISTANT ALLOYS ......................................... 85
4.1 Introduction to High Temperature Oxidation........................................ 85
4.1.1 Thermodynamic Considerations.......................................................... 85
4.1.2 Kinetic Considerations ........................................................................ 86
4.1.3 Oxidation of Engineering Alloys......................................................... 88
4.1.4 Effect of Oxide Scale Composition on Metal Dusting........................ 93
4.2 Investigation Objectives ............................................................................ 94
4.3 Experimental Apparatus and Procedure ................................................ 95
4.3.1 Short-Term Tests ................................................................................. 95
4.3.2 Long-Term Tests ................................................................................. 97
4.4 Analyses and Results ................................................................................. 98
4.4.1 Short-Term Tests ................................................................................. 98
4.4.2 Long-Term Tests (1000h).................................................................. 119
4.5 Discussion ................................................................................................. 138
4.6 Conclusion ................................................................................................ 143
Page 6 of 344
5 EVALUATION OF ALLOY HP PERFORMANCE IN METAL DUSTING
CONDITIONS ......................................................................................................... 144
5.1 Visual Examination ................................................................................. 144
5.1.1 HP Tested at 650ºC............................................................................ 145
5.1.2 HP Tested at 750ºC............................................................................ 148
5.1.3 HP Tested at 850ºC............................................................................ 151
5.2 Weight Change Measurements .............................................................. 154
5.3 X ray Diffraction Results ........................................................................ 154
5.4 SEM/EDX Deposits Analysis .................................................................. 155
5.4.1 HP-650ºC-100h ................................................................................. 156
5.4.2 HP-650ºC-500h ................................................................................. 157
5.4.3 HP-650ºC-1000h ............................................................................... 158
5.4.4 HP-750ºC-100h ................................................................................. 159
5.4.5 HP-750ºC-500h ................................................................................. 160
5.4.6 HP-750ºC-1000h ............................................................................... 161
5.5 Surface Analyses ...................................................................................... 162
5.5.1 HP-650ºC-100h ................................................................................. 162
5.5.2 HP-650ºC-500h ................................................................................. 164
5.5.3 HP-650ºC-1000h ............................................................................... 167
5.5.4 HP-750ºC-100h ................................................................................. 170
5.5.5 HP-750ºC-500h ................................................................................. 172
5.5.6 HP-750ºC-1000h ............................................................................... 174
5.5.7 HP-850ºC-100h ................................................................................. 176
5.5.8 HP-850ºC-500h ................................................................................. 179
5.5.9 HP-850ºC-1000h ............................................................................... 182
5.6 Metallographic Examination.................................................................. 184
5.6.1 HP-650ºC-100h ................................................................................. 184
5.6.2 HP-650ºC-500h ................................................................................. 191
Page 7 of 344
5.6.3 HP-650ºC-1000h ............................................................................... 195
5.6.4 HP-750ºC-100h ................................................................................. 198
5.6.5 HP-750ºC-500h ................................................................................. 202
5.6.6 HP-750ºC-1000h ............................................................................... 204
5.6.7 HP-850ºC-100h ................................................................................. 206
5.6.8 HP-850ºC-500h ................................................................................. 208
5.6.9 HP-850ºC-1000h ............................................................................... 211
6 EVALUATION OF ALLOY 35Cr-45Ni PERFORMANCE IN METAL
DUSTING CONDITIONS ...................................................................................... 214
6.1 Visual Examination ................................................................................. 214
6.1.1 35Cr-45Ni Tested at 650ºC ............................................................... 214
6.1.2 35Cr-45Ni Tested at 750ºC ............................................................... 216
6.1.3 35Cr-45Ni Tested at 850ºC ............................................................... 218
6.2 Weight Change Measurements .............................................................. 220
6.3 X ray Diffraction Results ........................................................................ 220
6.4 SEM/EDX Deposits Analysis .................................................................. 221
6.4.1 35Cr-45Ni-650ºC-100h ..................................................................... 222
6.4.2 35Cr-45Ni-650ºC-500h ..................................................................... 223
6.4.3 35Cr-45Ni-750ºC-100h ..................................................................... 224
6.4.4 35Cr-45Ni-750ºC-1000h ................................................................... 225
6.5 Surface Analyses ...................................................................................... 226
6.5.1 35Cr-45Ni-650ºC-100h ..................................................................... 226
6.5.2 35Cr-45Ni-650ºC-500h ..................................................................... 227
6.5.3 35Cr-45Ni-650ºC-1000h ................................................................... 229
6.5.4 35Cr-45Ni-750ºC-100h ..................................................................... 231
6.5.5 35Cr-45Ni-750ºC-500h ..................................................................... 233
6.5.6 35Cr-45Ni-750ºC-1000h ................................................................... 234
6.5.7 35Cr-45Ni-850ºC-100h ..................................................................... 236
6.5.8 35Cr-45Ni-850ºC-500h ..................................................................... 237
Page 8 of 344
6.5.9 35Cr-45Ni-850ºC-1000h ................................................................... 239
6.6 Metallographic Examination.................................................................. 242
6.6.1 35Cr-45Ni-650ºC-100h ..................................................................... 242
6.6.2 35Cr-45Ni-650ºC-500h ..................................................................... 244
6.6.3 35Cr-45Ni-650ºC-1000h ................................................................... 247
6.6.4 35Cr-45Ni-750ºC-100h ..................................................................... 252
6.6.5 35Cr-45Ni-750ºC-500h ..................................................................... 255
6.6.6 35Cr-45Ni-750ºC-1000h ................................................................... 257
6.6.7 35Cr-45Ni-850ºC-100h ..................................................................... 258
6.6.8 35Cr-45Ni-850ºC-500h ..................................................................... 262
6.6.9 35Cr-45Ni-850ºC-1000h ................................................................... 263
7 EVALUATION OF ALLOY UCX PERFORMANCE IN METAL DUSTING
CONDITIONS ......................................................................................................... 265
7.1 Visual Examination ................................................................................. 265
7.1.1 UCX Tested at 650ºC ........................................................................ 265
7.1.2 UCX Tested at 750ºC ........................................................................ 267
7.1.3 UCX Tested at 850ºC ........................................................................ 267
7.2 Weight Change Measurements .............................................................. 270
7.3 X ray Diffraction Results ........................................................................ 270
7.4 SEM/EDX Deposits Analysis .................................................................. 271
7.4.1 UCX-650ºC-500h .............................................................................. 271
7.4.2 UCX-850ºC-500h .............................................................................. 272
7.5 Surface Analyses ...................................................................................... 273
7.5.1 UCX-650ºC-100h .............................................................................. 273
7.5.2 UCX-650ºC-500h .............................................................................. 275
7.5.3 UCX-650ºC-1000h ............................................................................ 277
7.5.4 UCX-750ºC-100h .............................................................................. 279
7.5.5 UCX-750ºC-500h .............................................................................. 280
Page 9 of 344
7.5.6 UCX-750ºC-1000h ............................................................................ 283
7.5.7 UCX-850ºC-100h .............................................................................. 286
7.5.8 UCX-850ºC-500h .............................................................................. 289
7.5.9 UCX-850ºC-1000h ............................................................................ 292
7.6 Metallographic Examination.................................................................. 295
7.6.1 UCX-650ºC-100h .............................................................................. 295
7.6.2 UCX-650ºC-500h .............................................................................. 297
7.6.3 UCX-650ºC-1000h ............................................................................ 299
7.6.4 UCX-750ºC-100h .............................................................................. 301
7.6.5 UCX-750ºC-500h .............................................................................. 303
7.6.6 UCX-750ºC-1000h ............................................................................ 306
7.6.7 UCX-850ºC-100h .............................................................................. 309
7.6.8 UCX-850ºC-500h .............................................................................. 312
7.6.9 UCX-850ºC-1000h ............................................................................ 313
8 METAL DUSTING OF HEAT-RESISTANT ALLOYS: DISCUSSION .. 315
8.1 Introduction ............................................................................................. 315
8.2 Discussion ................................................................................................. 315
8.2.1 Carbon Formation.............................................................................. 316
8.2.2 Oxygen Generation............................................................................ 317
8.2.3 Occurrence of Metal Dusting ............................................................ 319
8.2.4 Performance of HP ............................................................................ 320
8.2.5 Performance of 35Cr-45Ni at all Temperatures ................................ 325
8.2.6 Performance of UCX at all Temperatures ......................................... 326
8.2.7 Observations ...................................................................................... 326
9 CONCLUSIONS AND FUTURE WORK..................................................... 328
9.1 Conclusions .............................................................................................. 328
9.2 Future Work ............................................................................................ 331
10 BIBLIOGRAPHY............................................................................................ 333
Page 10 of 344
ABSTRACT
Metal dusting leads to disintegration of such alloys as iron and nickel-based into a “dust”
of particulate metal, metal carbide, carbon, and/or oxide. It occurs in strongly carburising
environments at 400-900°C. Literature survey has shown that alloys behave differently in
metal dusting conditions based on their composition and the environment. Metal dusting
mechanisms for iron and nickel-based alloys have been proposed but, nevertheless, have
not been agreed upon and numerous modifications to them have been suggested. Further
adding to the complexity, the mechanisms were found to have differed due to operating
condition alterations. In view of that, this research was carried out to gain a better
understanding of metal dusting process(s) by evaluating the performance of heat-resistant
alloys, namely KHR35C HiSi© (HP), KHR45A LC© (35Cr-45Ni), and UCX©, in metal
dusting conditions. HP, which is an iron-based alloy, was modified by adding more silicon
in order to improve its resistance through the development of SiO2 at the surface. The
carbon content in the nickel-based alloy, 35Cr-45Ni, was lowered to delay the attack onset
by accommodating more diffused carbon. UCX©, however, has the highest nickel and
chromium levels. The alloys were exposed to a gas containing 80 vol% CO+20 vol% H2 at
650, 750, and 850ºC for 100, 500, and 1000h. Analyses including visual inspection, XRD,
and SEM/EDX revealed that the alloys suffered localised attacks at the three temperatures
but to varying degrees and in different shapes. In general, the attack initiated at the matrix
rather than the primary carbides and also progressed through the matrix. Increasing the
exposure temperature caused less carbon deposition and more oxides formation on the
alloy surfaces leading to a reduction in the attack aggressiveness. UCX© exhibited the
highest resistance to metal dusting whilst HP suffered the severest attack. The presence of
high concentrations of chromium at the surface catalysed a quick formation of Cr2O3 scale
that reduced the extent of metal dusting. Also, the increase in nickel content might have
slowed down the carbon diffusion into the alloy. In addition, the presence of other oxide
and carbide-forming elements such as silicon and tungsten might well have enhanced the
alloy performance. Diffused carbon binds with free tungsten, niobium, and chromium to
form carbides prolonging the incubation period prior to the attack initiation.
Page 11 of 344
1 LITERATURE REVIEW
1.1 Introduction
Metal dusting can be defined as a high temperature phenomenon that causes materials,
such as iron, nickel, and cobalt-based alloys, to lose their desirable properties as they
disintegrate into powder (or dust). The powder is generally composed of metal, metal
carbide, carbon, and oxide particles. Metal dusting can alternatively be described as a
catastrophic carburisation that occurs in environments with high carbon activities (i.e.
more than unity) and low oxygen partial pressures [1] [2]. Carburisation plays an important
role in the metal dusting process and unstable carbides (in steels) are apparently a major
factor in the reaction [3].
Metal dusting usually takes place in temperatures within the range 450-800°C [1] [2].
However, the temperature range has not been well identified as it has also been reported to
be 400-800°C [4] or 450-900°C [5] [6]. Conversely, in heat-treating industry, metal dusting
has been reported to have occasionally occurred in the temperature range 900-930°C [7].
Additionally, it is documented that metal dusting has happened at temperatures as high as
1100°C in strongly reducing environments [8]. Theoretically, metal dusting should be
possible at any temperature as long as the carbon activity is greater than one [9] [10].
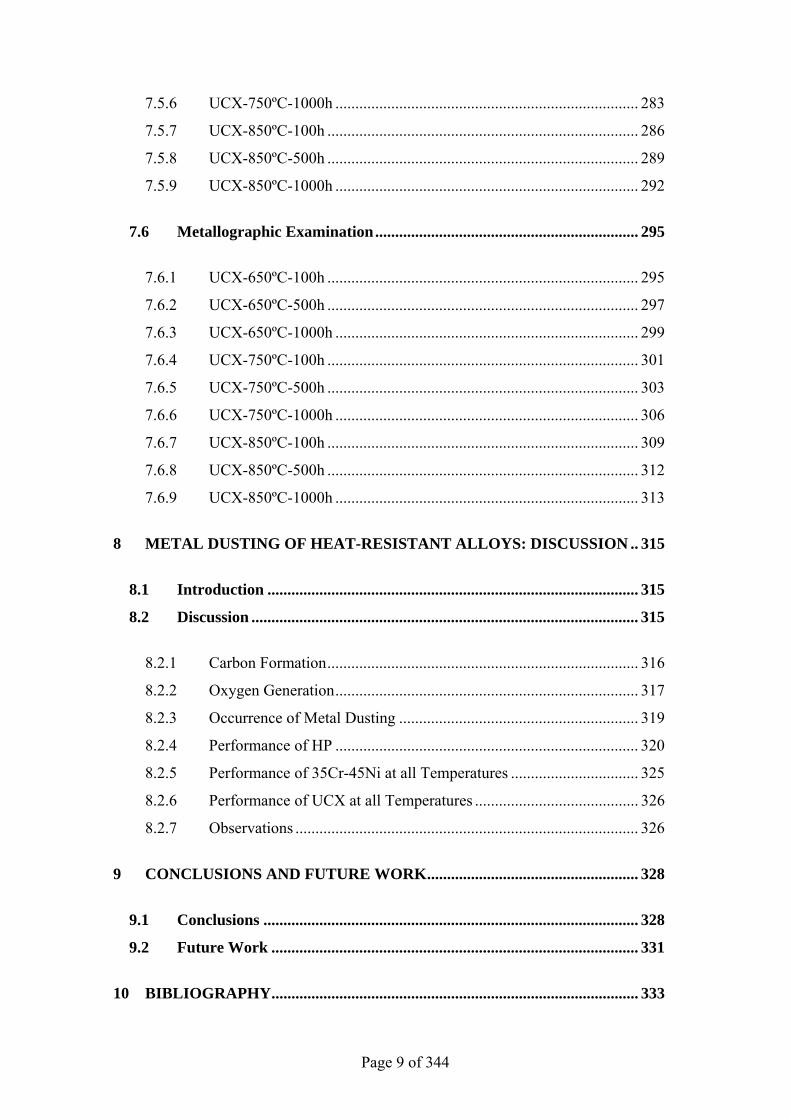
Figure 1.1 Metal dusting in heater tube of direct reduction plant. The attack occurred at about 600°C. The tube alloy is HK 40 [11].
Page 12 of 344
Metal dusting is a chronic problem that is responsible for many premature failures in a
wide variety of industrial sectors. It has been encountered in CO, methane, methane plus
hydrogen, ethane, propane, and butane plus CO, hydrogen, and other mixtures of similar
gases [3]. In petrochemical plants, for example, metal dusting has been experienced in
steam reforming furnaces used to manufacture synthesis gases (e.g. H2, CO, and CO2). The
frequency of such failures has recently increased as plant operators tend to boost the
process efficiency by introducing less steam to the system, thereby increasing the carbon
monoxide content and consequently raising the probability of metal dusting [12]. Iron,
nickel, cobalt and their alloys are susceptible to metal dusting which can be localised
and/or uniform [13]. Metal dusting has also been encountered in the heat-treating industry,
especially in atmospheres used to carburise steels [7]. Petroleum refineries also suffer
metal dusting in processes involving hydro-dealkylation and catalyst regeneration systems.
Metal dusting can also be a serious problem in other industrial sectors including nuclear
plants, coal gasification units, ethylene plants, fuel cells, chemical reactors, steam
generators, acetic acid cracking furnaces, and waste heat boilers [14] [15] [16]. Steel making
plants are also vulnerable to metal dusting. In fact, blast furnaces and reformers using
direct reduction of iron ore are readily susceptible to metal dusting [1].
Page 13 of 344
(a)
(b)
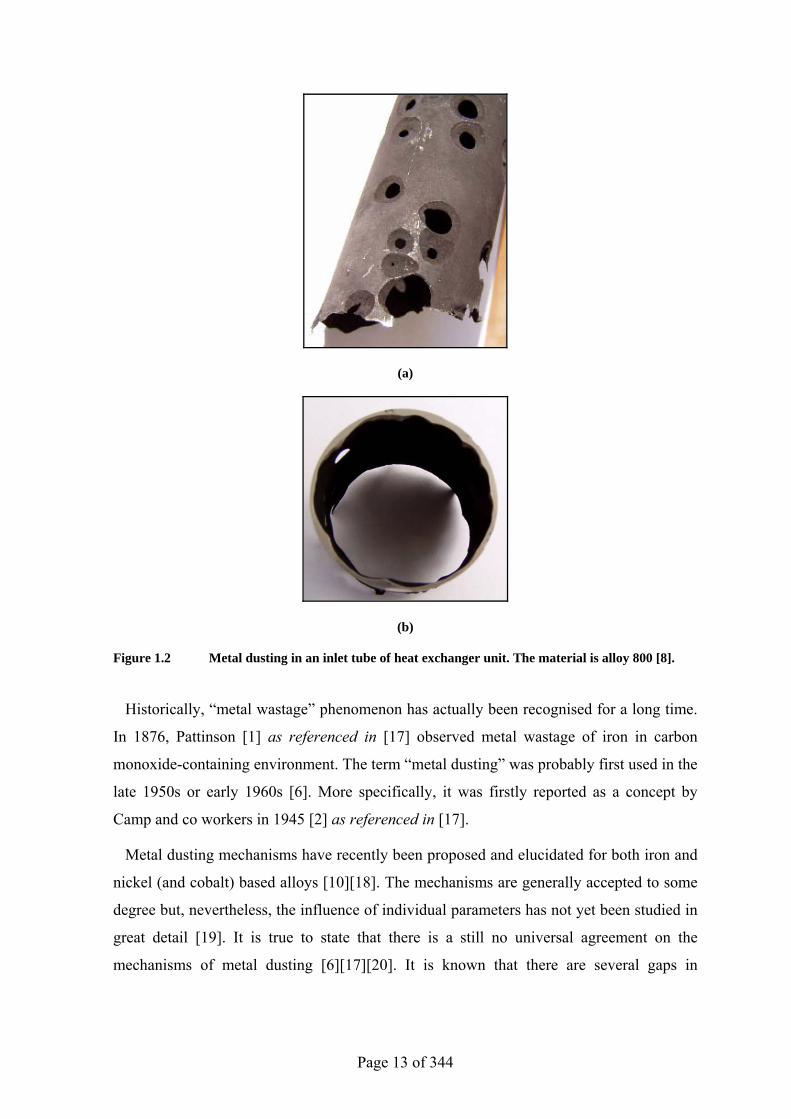
Figure 1.2 Metal dusting in an inlet tube of heat exchanger unit. The material is alloy 800 [8].
Historically, “metal wastage” phenomenon has actually been recognised for a long time.
In 1876, Pattinson [1] as referenced in [17] observed metal wastage of iron in carbon
monoxide-containing environment. The term “metal dusting” was probably first used in the
late 1950s or early 1960s [6]. More specifically, it was firstly reported as a concept by
Camp and co workers in 1945 [2] as referenced in [17].
Metal dusting mechanisms have recently been proposed and elucidated for both iron and
nickel (and cobalt) based alloys [10] [18]. The mechanisms are generally accepted to some
degree but, nevertheless, the influence of individual parameters has not yet been studied in
great detail [19]. It is true to state that there is a still no universal agreement on the
mechanisms of metal dusting [6] [17] [20]. It is known that there are several gaps in
Page 14 of 344
knowledge, which need to be bridged in order to gain a better understanding of the
mechanisms [17].
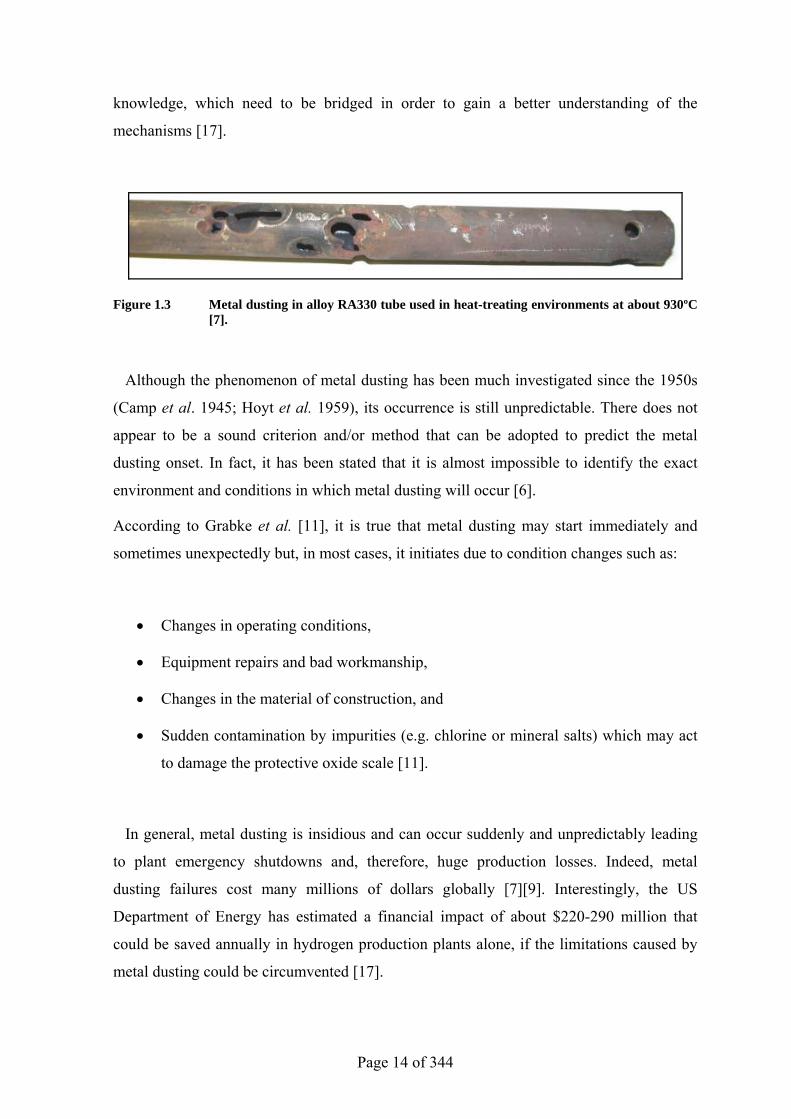
Figure 1.3 Metal dusting in alloy RA330 tube used in heat-treating environments at about 930ºC [7].
Although the phenomenon of metal dusting has been much investigated since the 1950s
(Camp et al. 1945; Hoyt et al. 1959), its occurrence is still unpredictable. There does not
appear to be a sound criterion and/or method that can be adopted to predict the metal
dusting onset. In fact, it has been stated that it is almost impossible to identify the exact
environment and conditions in which metal dusting will occur [6].
According to Grabke et al. [11], it is true that metal dusting may start immediately and
sometimes unexpectedly but, in most cases, it initiates due to condition changes such as:
• Changes in operating conditions,
• Equipment repairs and bad workmanship,
• Changes in the material of construction, and
• Sudden contamination by impurities (e.g. chlorine or mineral salts) which may act
to damage the protective oxide scale [11].
In general, metal dusting is insidious and can occur suddenly and unpredictably leading
to plant emergency shutdowns and, therefore, huge production losses. Indeed, metal
dusting failures cost many millions of dollars globally [7] [9]. Interestingly, the US
Department of Energy has estimated a financial impact of about $220-290 million that
could be saved annually in hydrogen production plants alone, if the limitations caused by
metal dusting could be circumvented [17].
Page 15 of 344
Unfortunately, no method is currently available that can completely mitigate metal
dusting [10]. There are, however, some effective measures that have been widely proven to
control metal dusting. For example, control of operating conditions, addition of sulphur-
containing compounds, change of alloy, and application of surface coatings [10].
The purpose of this research is to gain a better understanding of metal dusting process
through evaluating and comparing the performance of three, commercially available, heat-
resistant alloys, namely KHR35C HiSi© (HP), KHR45A LC© (35Cr-45Ni), and UCX©, in
metal dusting conditions. A literature review covering the aspects of metal dusting is given
in Chapter 1. Thermodynamic and kinetic considerations as well as the suggested metal
dusting mechanisms are elucidated. Chapter 2 reports the experimental apparatus,
procedures, and characterisation techniques used thorough the research. Metallographic
examination of the alloys is shown in Chapter 3. The microstructural changes due to
different exposures are also reported. Chapter 4 describes findings concerning the
oxidation study carried out to assess the alloys ability to form protective oxide scale at 650,
750, and 850ºC for 100 and 1000h. Chapters 5, 6, and 7 report and discuss the findings
concerning the behaviour of alloys, HP, 35Cr-45Ni, and UCX respectively that had been
exposed to the gas mixture at 650, 750, and 850ºC for periods of 100, 500, and 1000 hours.
Chapter 8 is to discuss the results illustrated in Chapters, 5, 6, and 7 and to evaluate and
compare the alloys performance in the gas mixture. The conclusions that have been
reached are shown in Capter 9. The chapter also includes the future work suggested in
order to continue investigating the metal dusting process and gain a better understanding
concerning the roles of different parameters on the alloys performance.
Page 16 of 344
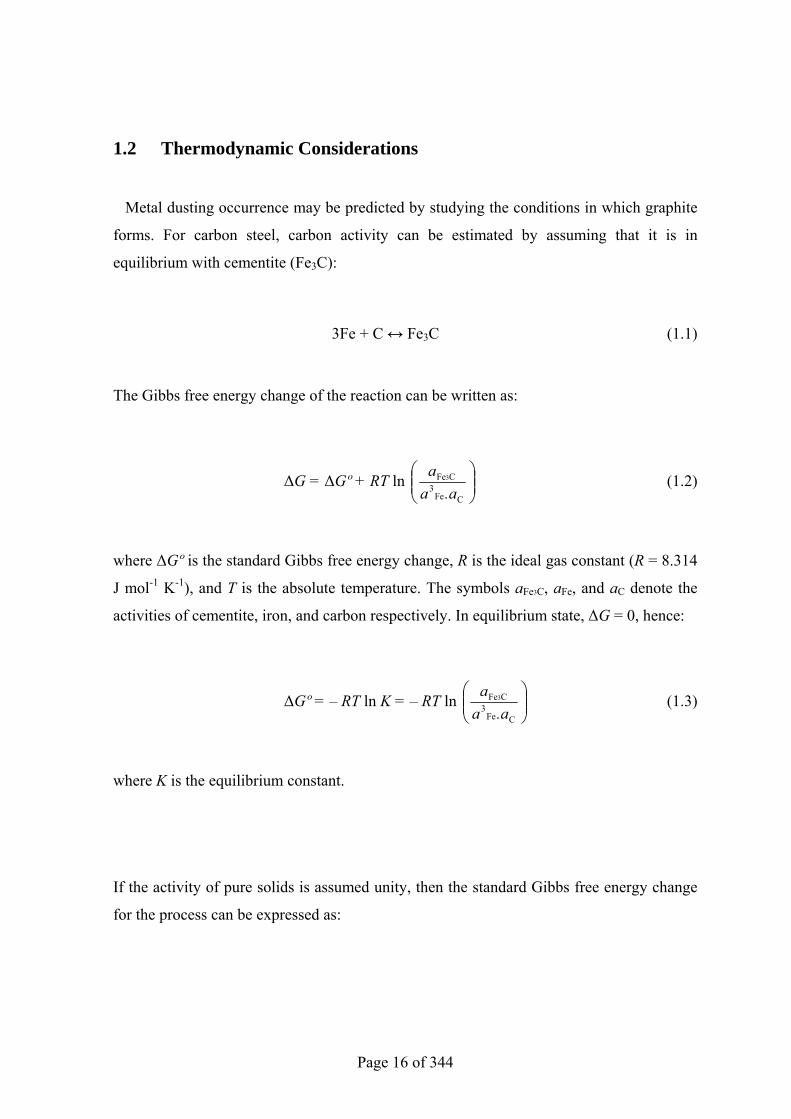
1.2 Thermodynamic Considerations
Metal dusting occurrence may be predicted by studying the conditions in which graphite
forms. For carbon steel, carbon activity can be estimated by assuming that it is in
equilibrium with cementite (Fe3C):
3Fe + C ↔ Fe3C (1.1)
The Gibbs free energy change of the reaction can be written as:
∆G = ∆Gº + RT ln ⎟⎟⎠
⎞⎜⎜⎝
⎛
CFe3
CFe3
.aaa (1.2)
where ∆Gº is the standard Gibbs free energy change, R is the ideal gas constant (R = 8.314
J mol-1 K-1), and T is the absolute temperature. The symbols aFe3C, aFe, and aC denote the
activities of cementite, iron, and carbon respectively. In equilibrium state, ∆G = 0, hence:
∆Gº = – RT ln K = – RT ln ⎟⎟⎠
⎞⎜⎜⎝
⎛
CFe3
CFe3
.aaa (1.3)
where K is the equilibrium constant.
If the activity of pure solids is assumed unity, then the standard Gibbs free energy change
for the process can be expressed as:
Page 17 of 344
∆Gº = – RT ln ⎟⎟⎠
⎞⎜⎜⎝
⎛
C
1a
(1.4)
Thus, ∆Gº is equal to zero at equilibrium with graphite where the carbon activity is unity,
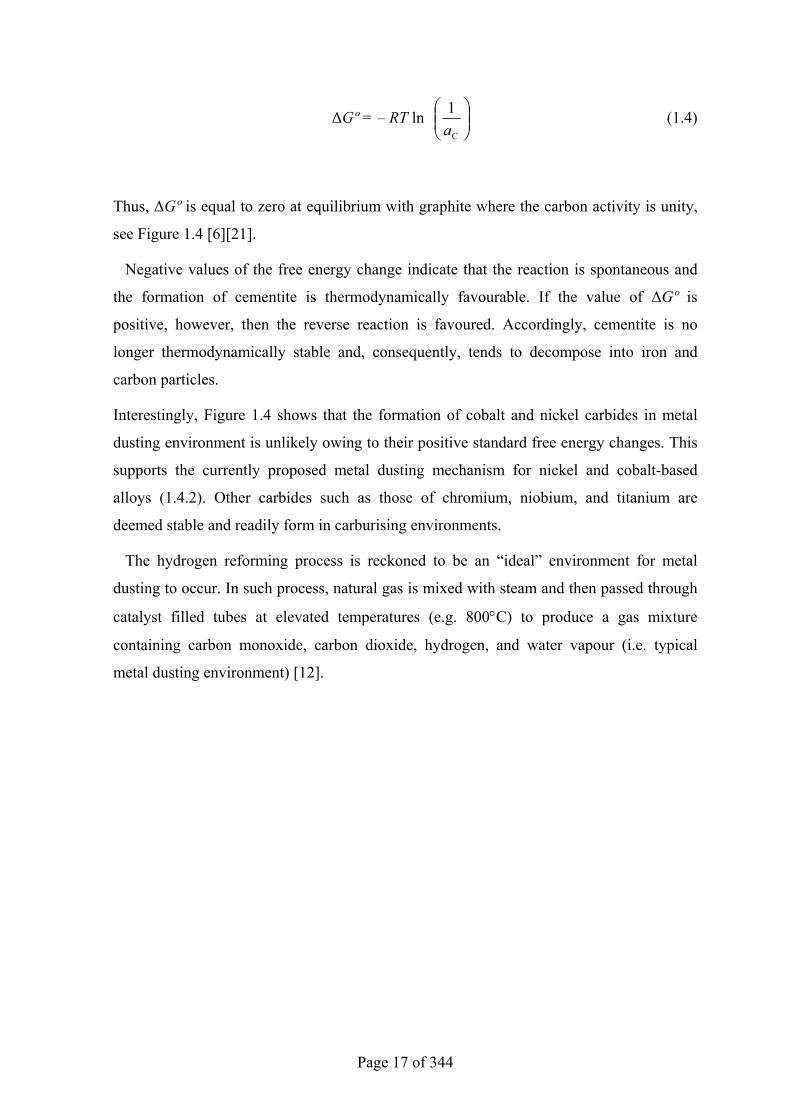
see Figure 1.4 [6] [21].
Negative values of the free energy change indicate that the reaction is spontaneous and
the formation of cementite is thermodynamically favourable. If the value of ∆Gº is
positive, however, then the reverse reaction is favoured. Accordingly, cementite is no
longer thermodynamically stable and, consequently, tends to decompose into iron and
carbon particles.
Interestingly, Figure 1.4 shows that the formation of cobalt and nickel carbides in metal
dusting environment is unlikely owing to their positive standard free energy changes. This
supports the currently proposed metal dusting mechanism for nickel and cobalt-based
alloys (1.4.2). Other carbides such as those of chromium, niobium, and titanium are
deemed stable and readily form in carburising environments.
The hydrogen reforming process is reckoned to be an “ideal” environment for metal
dusting to occur. In such process, natural gas is mixed with steam and then passed through
catalyst filled tubes at elevated temperatures (e.g. 800°C) to produce a gas mixture
containing carbon monoxide, carbon dioxide, hydrogen, and water vapour (i.e. typical
metal dusting environment) [12].
Page 18 of 344
Figure 1.4 Standard free energies of formation for carbides [6].
The metal dusting tendency is evaluated by considering the carbon activity (ac) and
oxygen partial pressure (pO2) of the gas mixture [22]. In metal dusting environments, the
two main reactions, by which carbon transfer from the atmosphere can occur, are carbon
monoxide reduction and the Boudouard reaction. Carbon monoxide reduction can be
written as [21] [23]:
CO + H2 ↔ H2O + C (1.5)
Hence, the standard free energy change:
∆Gº = – RT ln ⎟⎟⎠
⎞⎜⎜⎝
⎛
2
2c
H.COOH.1.5
pppa = – RT ln K1.5 (1.6)
Page 19 of 344
Therefore, the carbon activity (ac1.5) can be written as:
ac1.5 = K1.5 ⎟⎟⎠
⎞⎜⎜⎝
⎛OHHCO
2
2
p.pp (1.7)
where p is the partial pressure for the given gaseous compounds. Partial pressures can be
obtained at atmospheric pressure from the volume percentage divided by a hundred.
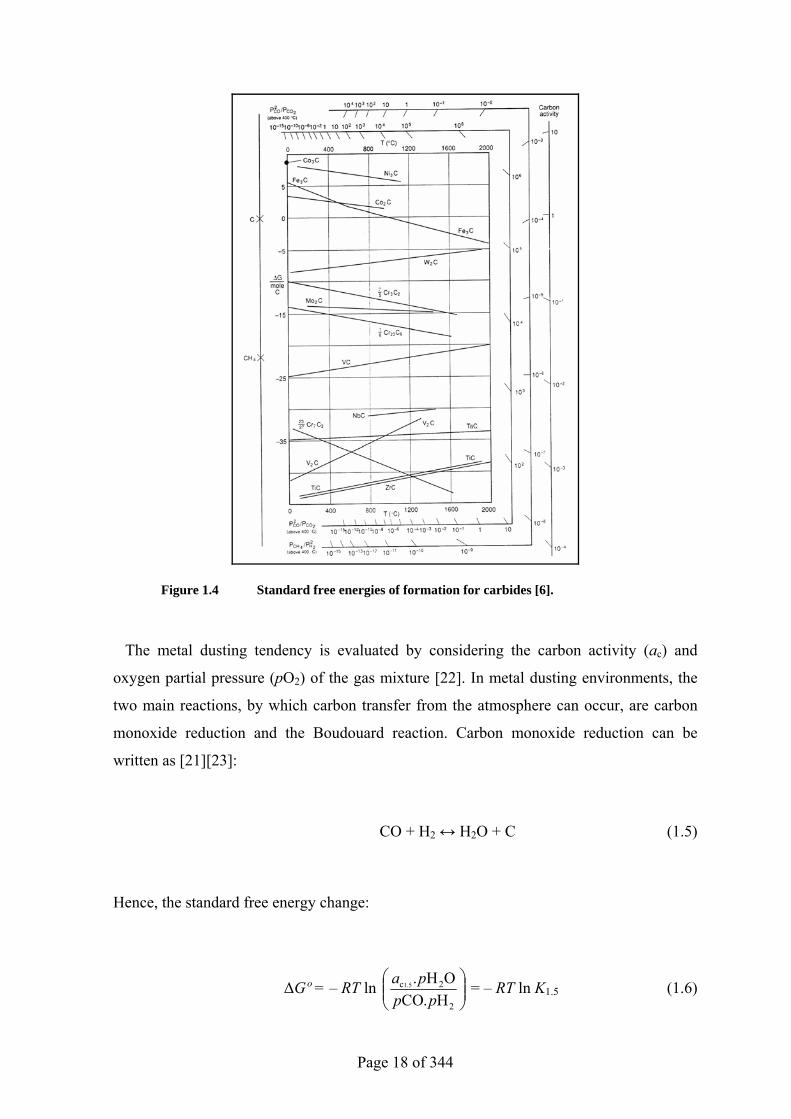
The chart in Figure 1.5 displays the variation of carbon activity as a function of CO/CO2
and H2O/H2 ratios for reaction (1.5) at 627ºC. In general, it can be interpreted that high
carbon activities of the gas mixture are associated with low H2O/H2 ratio and vice versa.
Figure 1.5 Carbon activity as a function of CO/CO2 and H2O/H2 for the reduction of CO by H2 at 627ºC with 1% H2O [24].
Indeed, the equilibrium constant can also be expressed as a function of temperature. This
can be derived by considering the relationship between the standard free energy change
and both standard enthalpy and entropy changes:
∆Gº = ∆Hº – T ∆Sº = – RT ln K (1.8)
Page 20 of 344
Solving for K:
ln K = −RTH ο∆ +
RS ο∆ (1.9)
Since the standard enthalpy and standard entropy changes do not vary with temperature
and are assumed constants, then the equilibrium constant can be written as a function of
temperature only. According to Ref. [21], K1.5 (reaction (1.5)) can be obtained by:
log K1.5 = T
7100 − 7.496 (1.10)
The second main reaction that plays a significant role in metal dusting initiation is the
Boudouard reaction:
2CO ↔ CO2 + C (1.11)
∆Gº for this reaction is:
∆Gº = – RT ln ⎟⎟⎠
⎞⎜⎜⎝
⎛COCO.
22c1.11
ppa = – RT ln K1.11 (1.12)
And the carbon activity is given by:
ac1.11 = K1.11 ⎟⎟⎠
⎞⎜⎜⎝
⎛
2
2
COCO
pp (1.13)
Page 21 of 344
Where the equilibrium constant is given by:
log K1.11 = T
8817 − 9.071 [21] [23] (1.14)
In addition to these two reactions, some other reactions are known to take place in metal
dusting environments. The dissociation of hydrocarbons, e.g.: [1]
CH4 ↔ 2H2 + C (1.15)
The ∆Gº of this reaction:
∆Gº = – RT ln ⎟⎟⎠
⎞⎜⎜⎝
⎛
4
22
c
CHH.1.15
ppa = – RT ln K1.15 (1.16)
Therefore, the carbon activity is given by:
ac1.15 = K1.15 ⎟⎟⎠
⎞⎜⎜⎝
⎛
22
4
HCH
pp (1.17)
The production of carbon in this reaction is slow in the metal dusting temperature range.
Thus, it is unlikely to be responsible for the metal dusting and its effect is usually ignored
[4] [22] [25].
Page 22 of 344
The following reactions also take place in metal dusting environments, i.e. the water
gas/shift reaction [1]:
H2O + CO ↔ CO2 + H2 (1.18)
And the steam/methane-reforming process:
H2O + CH4 ↔ CO + 3H2 (1.19)
However, in metal dusting conditions, the gases are at high temperatures and are not in
the equilibrium state suggesting that the carbon activities may be appreciably high. As seen
in the two main reactions above (i.e. (1.5) and (1.11)), carbon activity increases as the
temperature is decreased [1] [21]. For example, if the temperature is decreased from 850 to
600°C, then K1.5 (equation (1.10)) will increase from 0.07 to 4.33. This results in a
significant increase in the carbon activity ac1.5 (equation (1.7)). The equilibrium constants
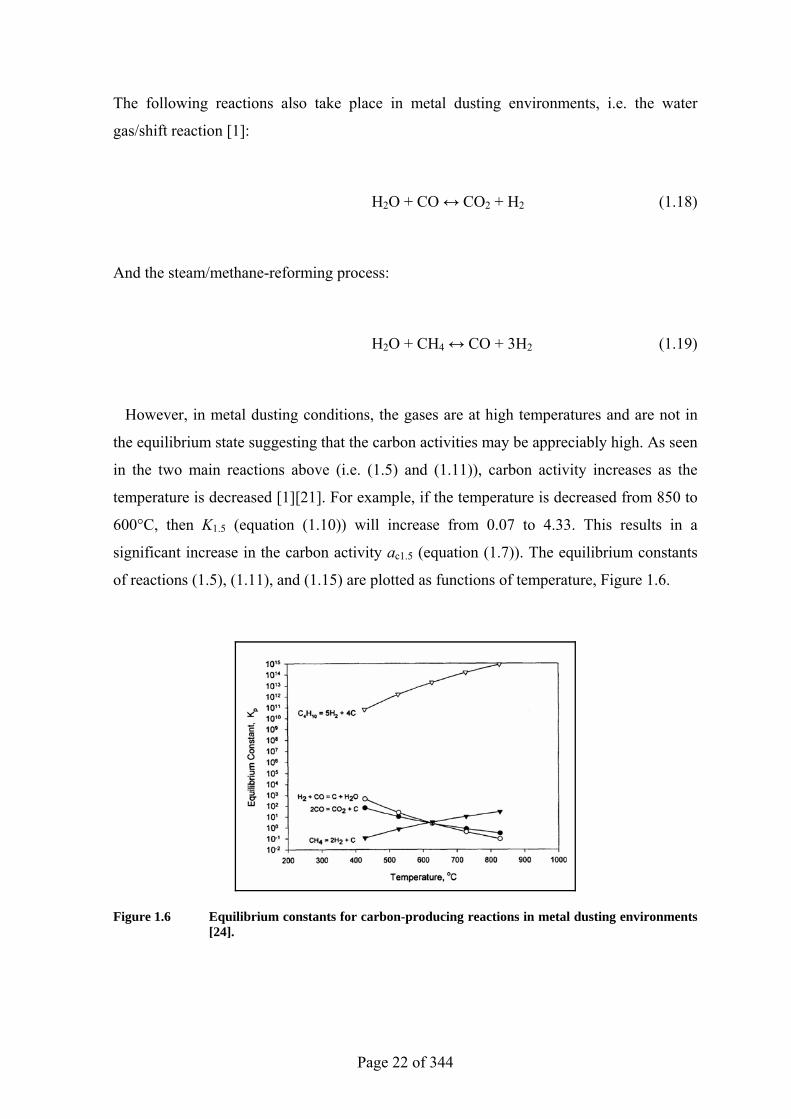
of reactions (1.5), (1.11), and (1.15) are plotted as functions of temperature, Figure 1.6.
Figure 1.6 Equilibrium constants for carbon-producing reactions in metal dusting environments [24].
Page 23 of 344
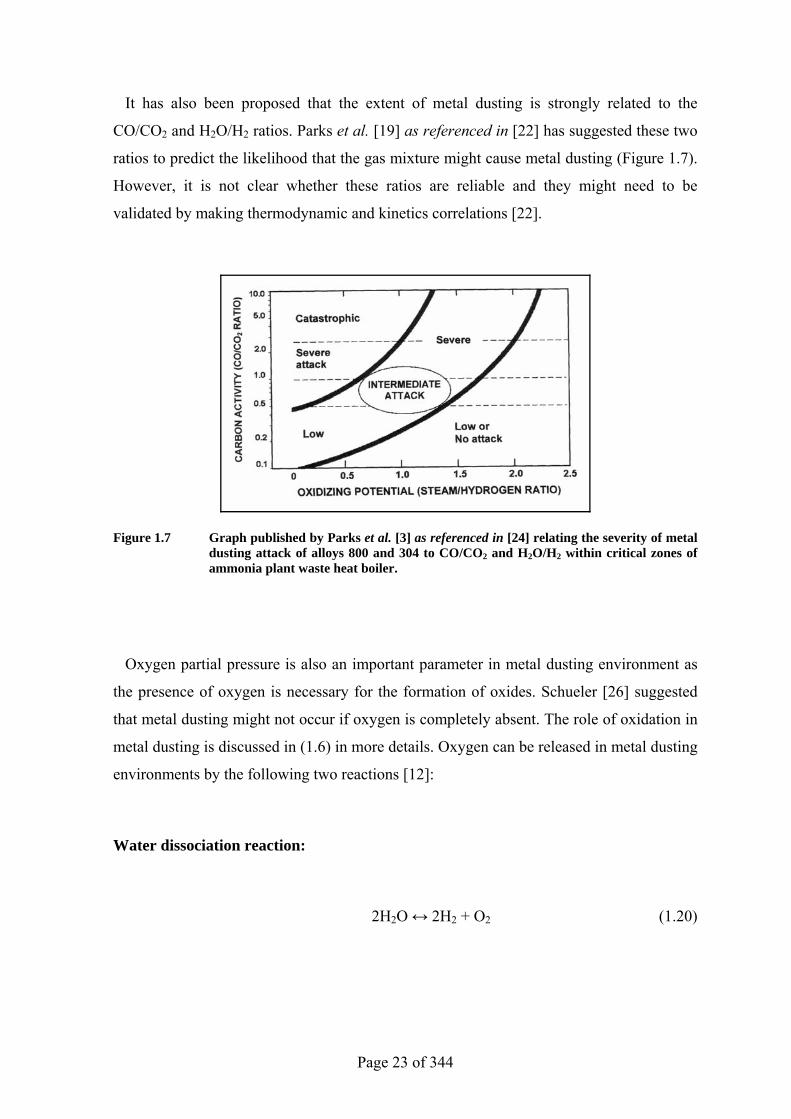
It has also been proposed that the extent of metal dusting is strongly related to the
CO/CO2 and H2O/H2 ratios. Parks et al. [19] as referenced in [22] has suggested these two
ratios to predict the likelihood that the gas mixture might cause metal dusting (Figure 1.7).
However, it is not clear whether these ratios are reliable and they might need to be
validated by making thermodynamic and kinetics correlations [22].
Figure 1.7 Graph published by Parks et al. [3] as referenced in [24] relating the severity of metal dusting attack of alloys 800 and 304 to CO/CO2 and H2O/H2 within critical zones of ammonia plant waste heat boiler.
Oxygen partial pressure is also an important parameter in metal dusting environment as
the presence of oxygen is necessary for the formation of oxides. Schueler [26] suggested
that metal dusting might not occur if oxygen is completely absent. The role of oxidation in
metal dusting is discussed in (1.6) in more details. Oxygen can be released in metal dusting
environments by the following two reactions [12]:
Water dissociation reaction:
2H2O ↔ 2H2 + O2 (1.20)
Page 24 of 344
The oxygen partial pressure can be obtained:
∆Gº = – RT ln K1.20 = – RT ln ⎟⎟⎠
⎞⎜⎜⎝
⎛OHO.H
22
222
ppp (1.21)
So;
pO2 = K1.20 ⎟⎟⎠
⎞⎜⎜⎝
⎛
22
22
HOH
pp (1.22)
And carbon dioxide dissociation: [12]
2CO2 ↔ 2CO + O2 (1.23)
The oxygen partial pressure is given by:
∆Gº = – RT ln K1.23 = – RT ln ⎟⎟⎠
⎞⎜⎜⎝
⎛
22
22
COO.CO
ppp (1.24)
Hence;
pO2 = K1.23 ⎟⎟⎠
⎞⎜⎜⎝
⎛COCO2
22
pp (1.25)
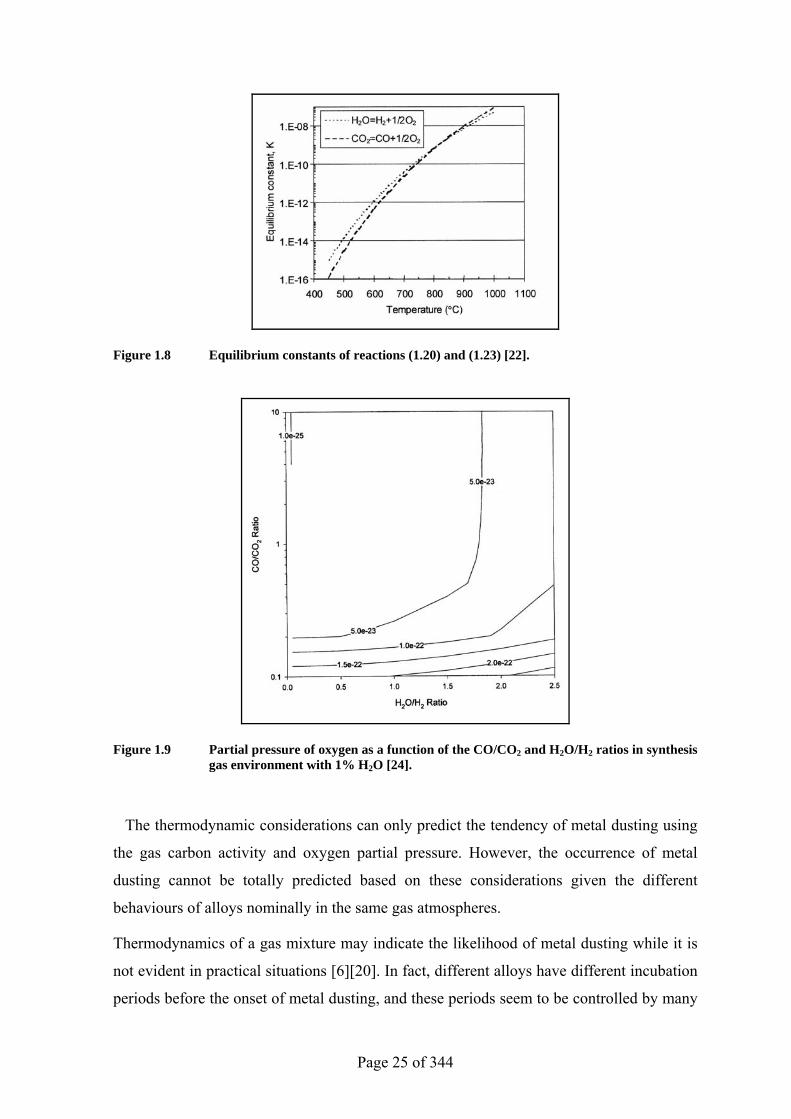
In Figure 1.8, the equilibrium constants of reactions (1.20) and (1.23) are plotted as
functions of temperature. Reaction (1.20) appears to have higher equilibrium constant at
metal dusting temperature range and, therefore, is anticipated to be dominant. Figure 1.9
discloses the values of partial pressure of oxygen as a function of the CO/CO2 and H2O/H2
ratios in synthesis gas environment. It is obvious that oxygen partial pressure increases
with H2O/H2 ratio.
Page 25 of 344
Figure 1.8 Equilibrium constants of reactions (1.20) and (1.23) [22].
Figure 1.9 Partial pressure of oxygen as a function of the CO/CO2 and H2O/H2 ratios in synthesis gas environment with 1% H2O [24].
The thermodynamic considerations can only predict the tendency of metal dusting using
the gas carbon activity and oxygen partial pressure. However, the occurrence of metal
dusting cannot be totally predicted based on these considerations given the different
behaviours of alloys nominally in the same gas atmospheres.
Thermodynamics of a gas mixture may indicate the likelihood of metal dusting while it is
not evident in practical situations [6] [20]. In fact, different alloys have different incubation
periods before the onset of metal dusting, and these periods seem to be controlled by many
Page 26 of 344
factors such as alloy composition, oxide scale stability, operating pressure, and operating
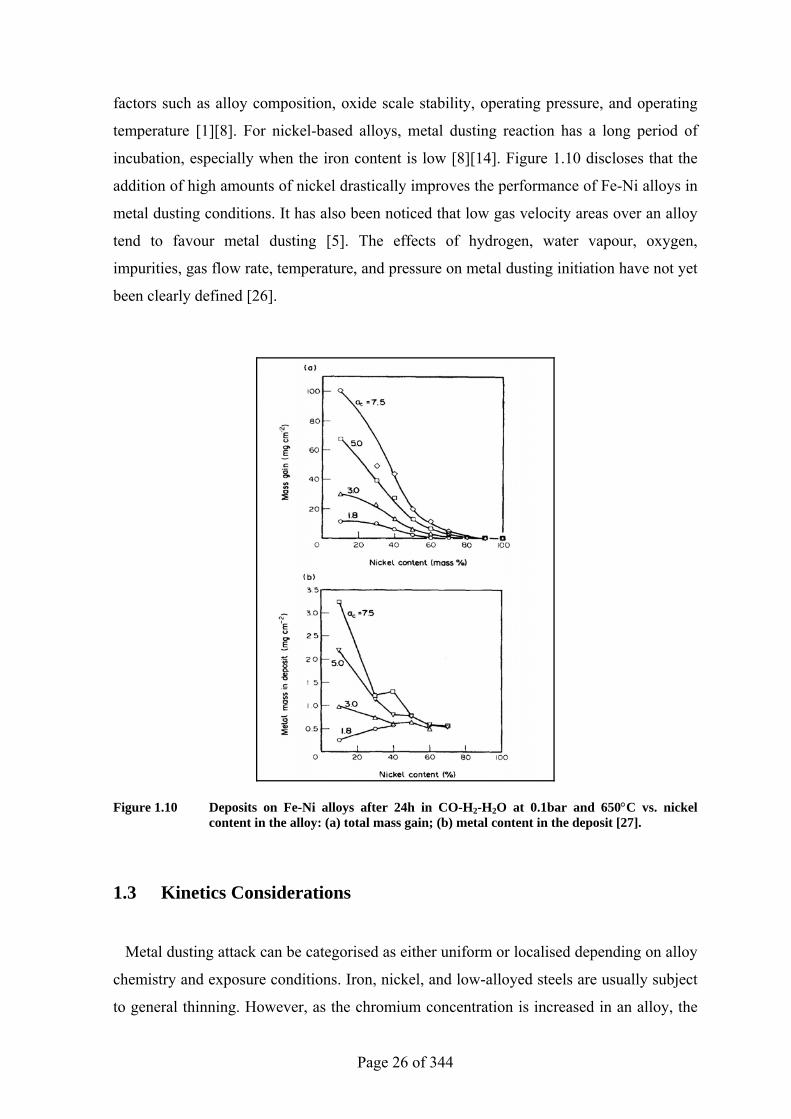
temperature [1] [8]. For nickel-based alloys, metal dusting reaction has a long period of
incubation, especially when the iron content is low [8] [14]. Figure 1.10 discloses that the
addition of high amounts of nickel drastically improves the performance of Fe-Ni alloys in
metal dusting conditions. It has also been noticed that low gas velocity areas over an alloy
tend to favour metal dusting [5]. The effects of hydrogen, water vapour, oxygen,
impurities, gas flow rate, temperature, and pressure on metal dusting initiation have not yet
been clearly defined [26].
Figure 1.10 Deposits on Fe-Ni alloys after 24h in CO-H2-H2O at 0.1bar and 650°C vs. nickel content in the alloy: (a) total mass gain; (b) metal content in the deposit [27].
1.3 Kinetics Considerations
Metal dusting attack can be categorised as either uniform or localised depending on alloy
chemistry and exposure conditions. Iron, nickel, and low-alloyed steels are usually subject
to general thinning. However, as the chromium concentration is increased in an alloy, the
Page 27 of 344
overall corrosion rate decreases considerably and the attack becomes more localised [28].
Accordingly, high chromium iron and nickel-based alloys are usually susceptible to metal
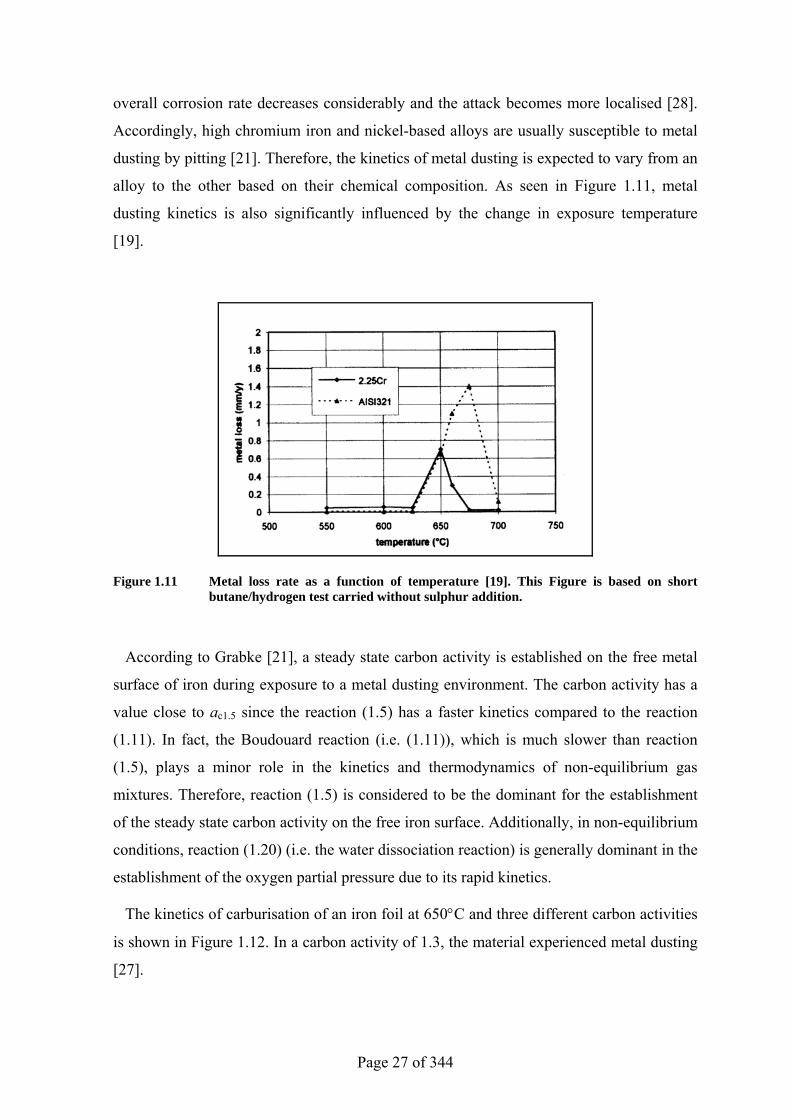
dusting by pitting [21]. Therefore, the kinetics of metal dusting is expected to vary from an
alloy to the other based on their chemical composition. As seen in Figure 1.11, metal
dusting kinetics is also significantly influenced by the change in exposure temperature
[19].
Figure 1.11 Metal loss rate as a function of temperature [19]. This Figure is based on short butane/hydrogen test carried without sulphur addition.
According to Grabke [21], a steady state carbon activity is established on the free metal
surface of iron during exposure to a metal dusting environment. The carbon activity has a
value close to ac1.5 since the reaction (1.5) has a faster kinetics compared to the reaction
(1.11). In fact, the Boudouard reaction (i.e. (1.11)), which is much slower than reaction
(1.5), plays a minor role in the kinetics and thermodynamics of non-equilibrium gas
mixtures. Therefore, reaction (1.5) is considered to be the dominant for the establishment
of the steady state carbon activity on the free iron surface. Additionally, in non-equilibrium
conditions, reaction (1.20) (i.e. the water dissociation reaction) is generally dominant in the
establishment of the oxygen partial pressure due to its rapid kinetics.
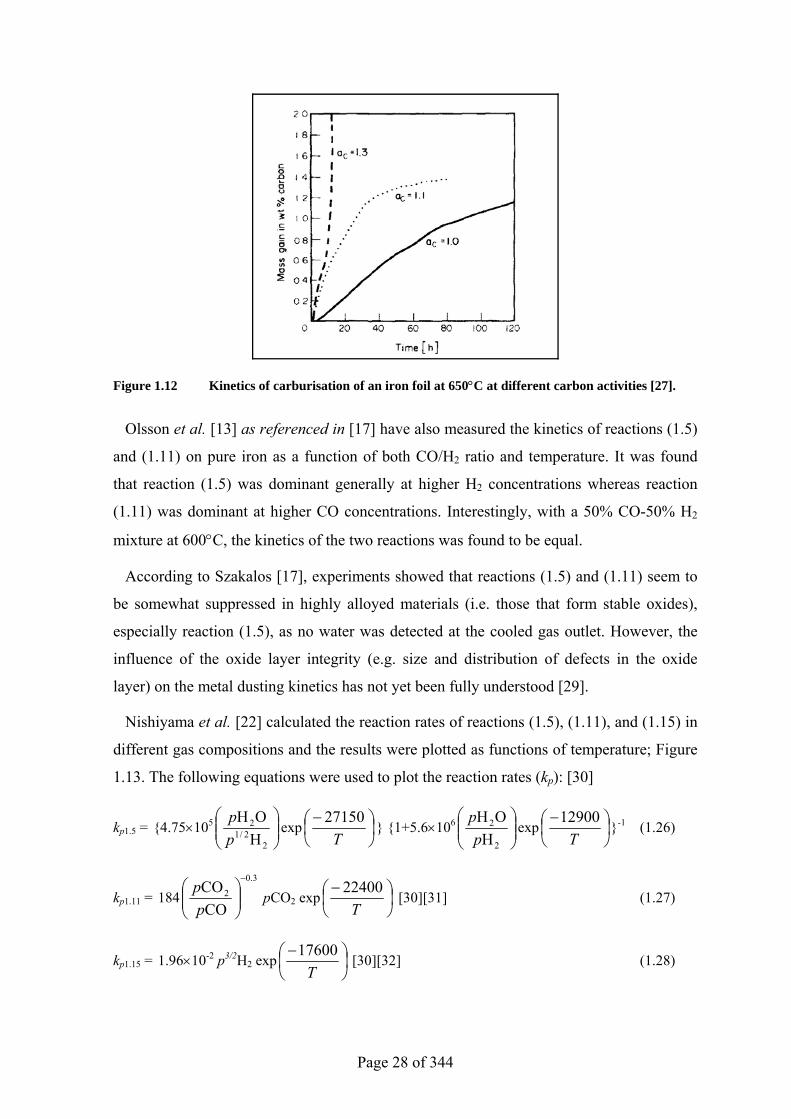
The kinetics of carburisation of an iron foil at 650°C and three different carbon activities
is shown in Figure 1.12. In a carbon activity of 1.3, the material experienced metal dusting
[27].
Page 28 of 344
Figure 1.12 Kinetics of carburisation of an iron foil at 650°C at different carbon activities [27].
Olsson et al. [13] as referenced in [17] have also measured the kinetics of reactions (1.5)
and (1.11) on pure iron as a function of both CO/H2 ratio and temperature. It was found
that reaction (1.5) was dominant generally at higher H2 concentrations whereas reaction
(1.11) was dominant at higher CO concentrations. Interestingly, with a 50% CO-50% H2
mixture at 600°C, the kinetics of the two reactions was found to be equal.
According to Szakalos [17], experiments showed that reactions (1.5) and (1.11) seem to
be somewhat suppressed in highly alloyed materials (i.e. those that form stable oxides),
especially reaction (1.5), as no water was detected at the cooled gas outlet. However, the
influence of the oxide layer integrity (e.g. size and distribution of defects in the oxide
layer) on the metal dusting kinetics has not yet been fully understood [29].
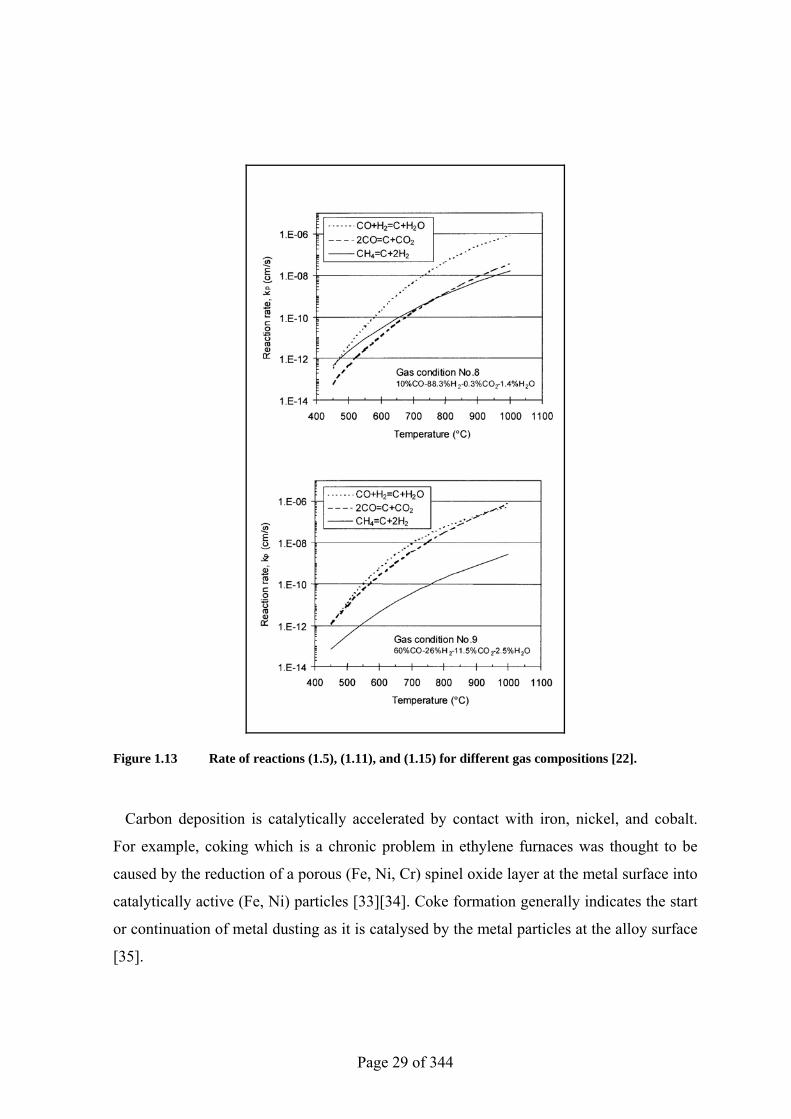
Nishiyama et al. [22] calculated the reaction rates of reactions (1.5), (1.11), and (1.15) in
different gas compositions and the results were plotted as functions of temperature; Figure
1.13. The following equations were used to plot the reaction rates (kp): [30]
kp1.5 = {4.75×10⁵⎟⎟⎠
⎞⎜⎜⎝
⎛
22/1
2
HOH
pp
exp ⎟⎠⎞
⎜⎝⎛ −
T27150
} {1+5.6×10⁶⎟⎟⎠
⎞⎜⎜⎝
⎛
2
2
HOH
pp
exp ⎟⎠⎞
⎜⎝⎛ −
T12900
}-1 (1.26)
kp1.11 = 1843.0
2
COCO
−
⎟⎟⎠
⎞⎜⎜⎝
⎛pp
pCO2 exp ⎟⎠⎞
⎜⎝⎛ −
T22400
[30] [31] (1.27)
kp1.15 = 1.96×10⁻² p3/2H2 exp ⎟⎠⎞
⎜⎝⎛ −
T17600
[30] [32] (1.28)
Page 29 of 344
Figure 1.13 Rate of reactions (1.5), (1.11), and (1.15) for different gas compositions [22].
Carbon deposition is catalytically accelerated by contact with iron, nickel, and cobalt.
For example, coking which is a chronic problem in ethylene furnaces was thought to be
caused by the reduction of a porous (Fe, Ni, Cr) spinel oxide layer at the metal surface into
catalytically active (Fe, Ni) particles [33] [34]. Coke formation generally indicates the start
or continuation of metal dusting as it is catalysed by the metal particles at the alloy surface
[35].
Page 30 of 344
Turkdogan et al. [36] studied the catalytic effect of iron on decomposition of carbon
monoxide in H2-CO mixtures. In 100% CO, the amount of carbon accumulated at a given
time was proportional to the amount of iron catalyst present in the system. In H2-CO
mixtures, carbon deposition increased to a lesser extent with an increasing amount of the
catalyst. As the reaction progressed, most iron was converted to cementite and no further
carbon deposition occurred. It was concluded that graphite, iron carbides, oxides, and
sulphides had no catalytic effect on the decomposition of carbon monoxide.
Olsson et al. [37] studied the catalytic effect of iron on decomposition of carbon and the
effect of additions of H2, H2O, CO2, SO2, and H2S. The Boudouard reaction was catalysed
by hydrogen adsorbed on the iron surface. The contribution of the reaction, CO + H2 ↔ C
+ H2O, to the total rate was minor up to 50% hydrogen. In CO-H2-H2O mixtures with
H2/CO greater than 0.1, the rate of carbon deposition decreased with increasing the
concentration of water vapour due to the reverse reaction of CO + H2 ↔ C + H2O. In the
absence of hydrogen, the rate of Boudouard reaction at 400 to 600ºC increased with
increasing the water content, at least up to 6% H2O.
Maximum wastage rates of iron, cobalt, and ferritic stainless steels are reported to have
occurred within the temperature range 400-700°C in CO and CO-H2 gases. Austenitic
stainless steels, however, showed maximum wastage rates at 650-800°C. Nickel-based
alloys exhibited maximum dusting at 675-850°C [1].
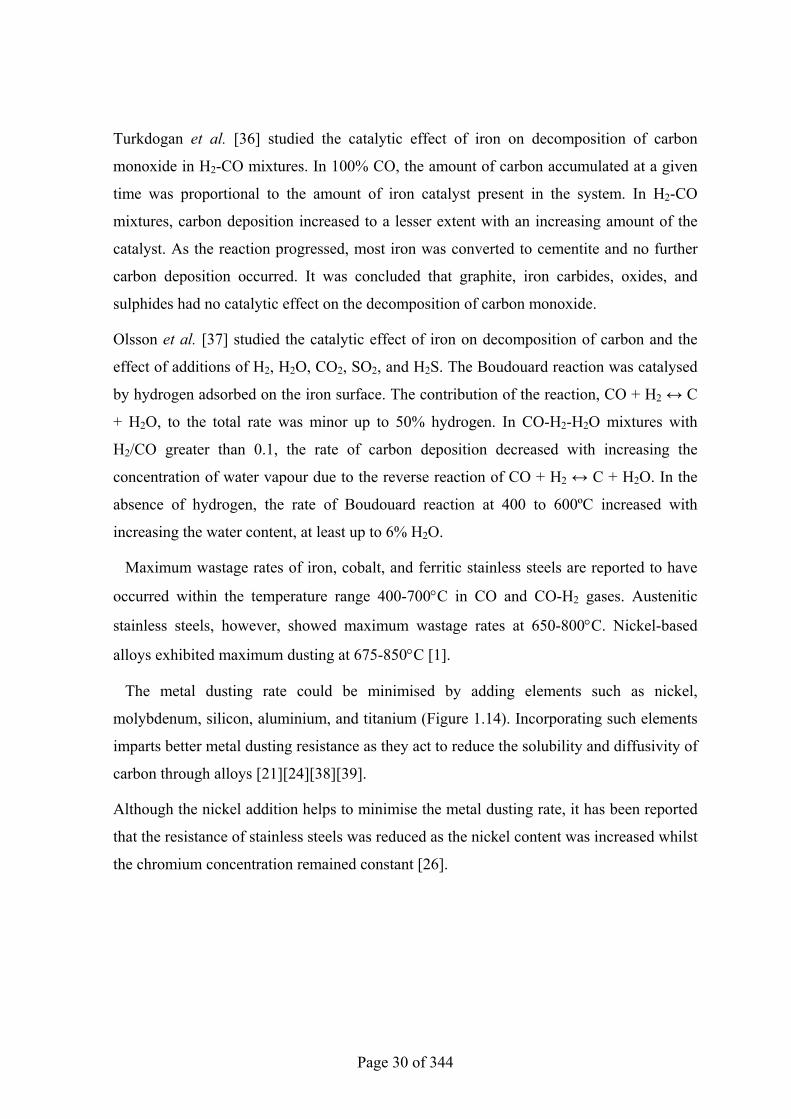
The metal dusting rate could be minimised by adding elements such as nickel,
molybdenum, silicon, aluminium, and titanium (Figure 1.14). Incorporating such elements
imparts better metal dusting resistance as they act to reduce the solubility and diffusivity of
carbon through alloys [21] [24] [38] [39].
Although the nickel addition helps to minimise the metal dusting rate, it has been reported
that the resistance of stainless steels was reduced as the nickel content was increased whilst
the chromium concentration remained constant [26].
Page 31 of 344
Figure 1.14 Behaviour of Alloy 800 in metal dusting environment. The influence of the addition of alloying elements is shown [21].
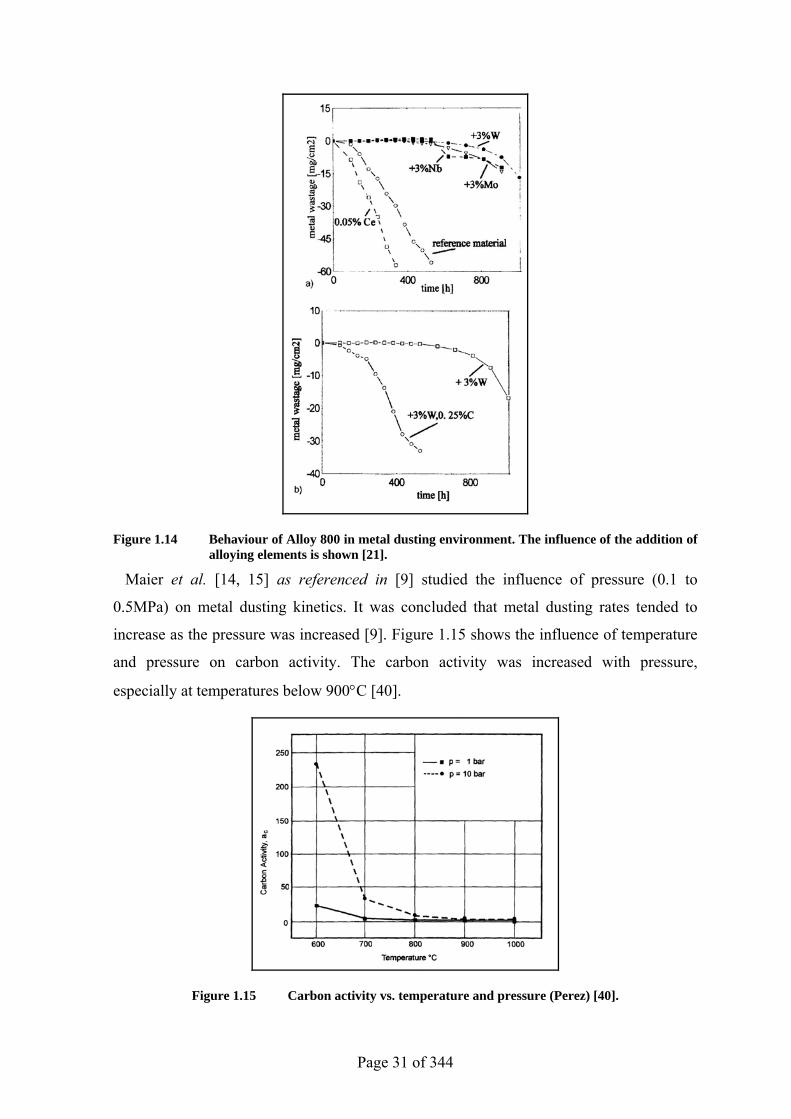
Maier et al. [14, 15] as referenced in [9] studied the influence of pressure (0.1 to
0.5MPa) on metal dusting kinetics. It was concluded that metal dusting rates tended to
increase as the pressure was increased [9]. Figure 1.15 shows the influence of temperature
and pressure on carbon activity. The carbon activity was increased with pressure,
especially at temperatures below 900°C [40].
Figure 1.15 Carbon activity vs. temperature and pressure (Perez) [40].
Page 32 of 344
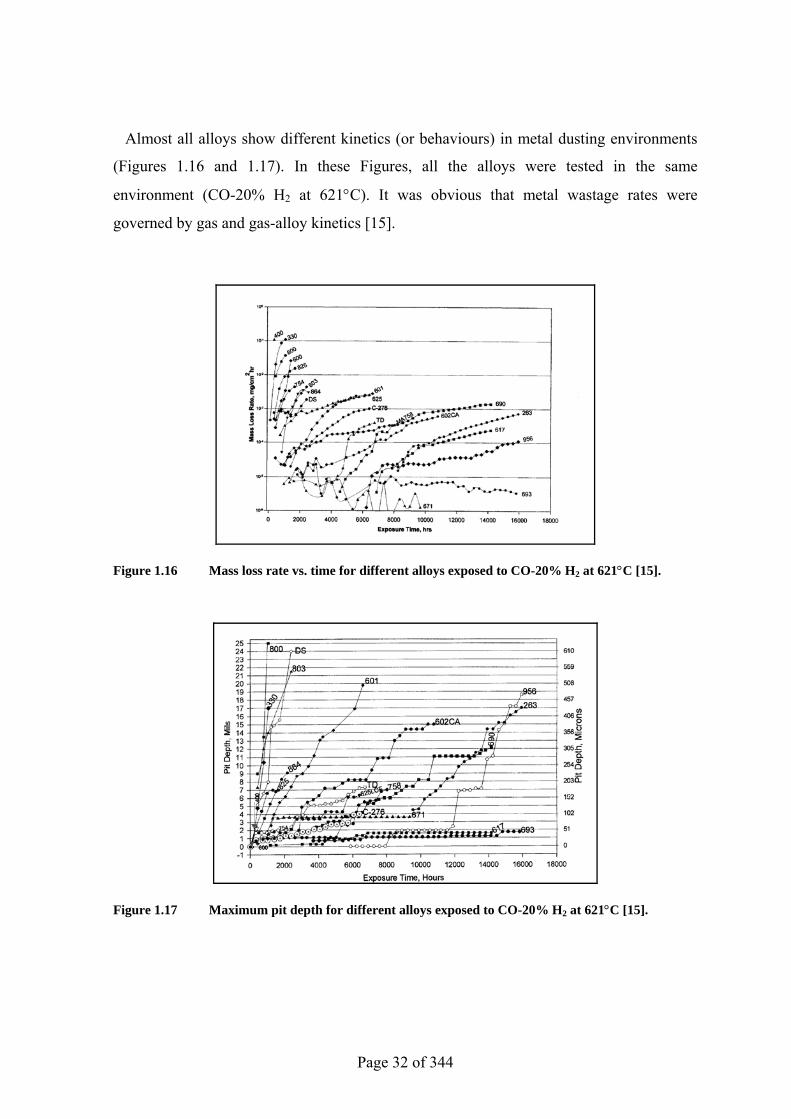
Almost all alloys show different kinetics (or behaviours) in metal dusting environments
(Figures 1.16 and 1.17). In these Figures, all the alloys were tested in the same
environment (CO-20% H2 at 621°C). It was obvious that metal wastage rates were
governed by gas and gas-alloy kinetics [15].
Figure 1.16 Mass loss rate vs. time for different alloys exposed to CO-20% H2 at 621°C [15].
Figure 1.17 Maximum pit depth for different alloys exposed to CO-20% H2 at 621°C [15].
Page 33 of 344
1.4 Metal Dusting Mechanisms
Metal dusting mechanisms have been extensively studied since the 1950s. Prange [3] as
referenced in [17] carried out some studies concerning the metal dusting mechanisms of
alloys exposed to carbon-containing environments in petrochemical plants.
Further investigations were conducted in the 1950s and 1960s by several researchers (e.g.
Prange [3] as referenced in [17], Eberle et al. [4] as referenced in [17], Hoyt et al. [5] as
referenced in [17], and Hopkins et al. [6] as referenced in [17]). Most of these works
concentrated on the behaviour of some alloys in metal dusting conditions and suggested
possible mechanisms.
Indeed, it is interesting to note that the currently proposed metal dusting mechanism of
binary Fe-Ni alloys was firstly described during the 1950s by Hultgren et al. [7] as
referenced in [17]. Subsequently, Peppel et al [16, 17] as references to [17] investigated
this mechanism in more detail.
1.4.1 Metal Dusting Mechanism for Iron and Low Alloy Steels
The process of metal dusting for iron and low alloy steels was originally investigated by
Hochman [4] as referenced in [27]. It has also been thoroughly studied and modified by
different researchers, especially Grabke and co-workers [27] [41].
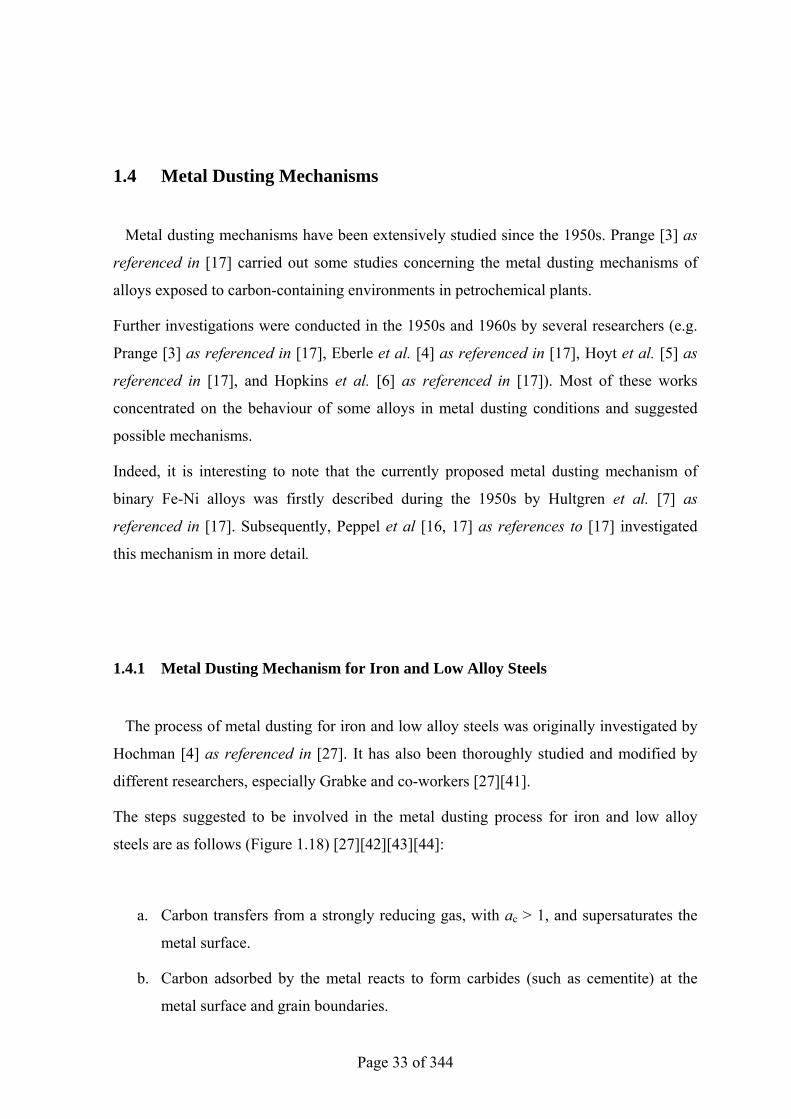
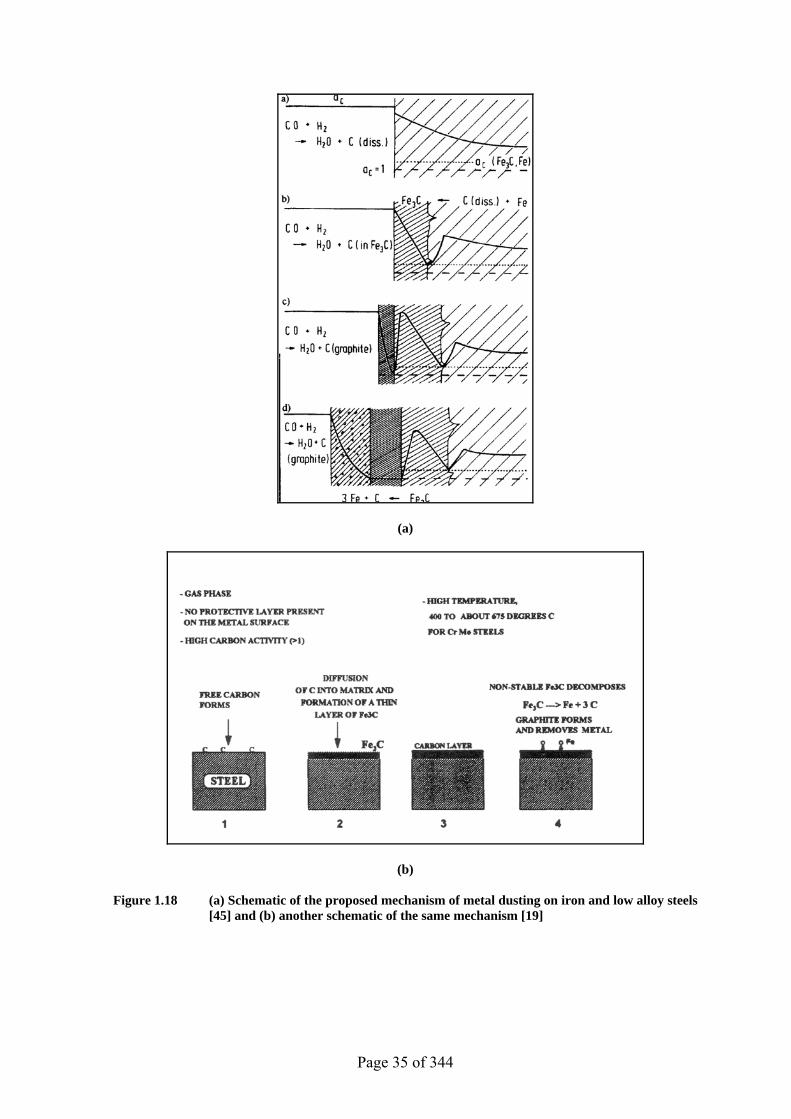
The steps suggested to be involved in the metal dusting process for iron and low alloy
steels are as follows (Figure 1.18) [27] [42] [43] [44]:
a. Carbon transfers from a strongly reducing gas, with ac > 1, and supersaturates the
metal surface.
b. Carbon adsorbed by the metal reacts to form carbides (such as cementite) at the
metal surface and grain boundaries.
Page 34 of 344
c. The formation of a cementite layer consequently hinders the carbon diffusion into
the metal.
d. The cementite becomes supersaturated as the carbon keeps diffusing through the
alloy, and hence graphite starts to nucleate and deposit on the surface leading to a
significant reduction in the carbon activity at the graphite/metal interface.
e. The graphite accumulation eventually results in the carbon activity approaching
unity where cementite becomes thermodynamically instable and hence decomposes
into pure metal particles and graphite (according to the reaction Fe3C → 3Fe + C).
f. The decomposed metal particles diffuse through the graphite lattice structure and
agglomerate into nanometre size particles that serve as catalysts for more carbon
deposition.
Page 35 of 344
(a)
(b)
Figure 1.18 (a) Schematic of the proposed mechanism of metal dusting on iron and low alloy steels [45] and (b) another schematic of the same mechanism [19]
Page 36 of 344
According to Grabke [21], the suggested metal dusting mechanism for iron and low alloy
steels was observed at 400-650°C in H2-CO-H2O mixtures.
At higher temperatures (T > 700°C), however, the iron atoms produced by the cementite
decomposition agglomerated to form an iron layer that reduced the carbon diffusion rate.
Accordingly, the metal dusting process was slowed down as it became controlled by
carbon diffusion through ferrite. At even higher temperatures, 900-1000°C in CH4-H2
mixtures with ac > 1, the cementite did not form.
Schneider [46] reported that the iron layer produced by cementite decomposition, at 700ºC
in CO-H2-H2O gas mixture with aC = 15.9 and 20, had a thickness of 1-3µm.
The metal dusting mechanism suggested for iron and low alloy steels is more or less
accepted by most researchers. Nevertheless, many related questions are still uncertain,
especially regarding the steady state situation and driving force of this mechanism. It is
very difficult to explain thermodynamically the carbon diffusion in opposite direction to
the carbon activity gradient.
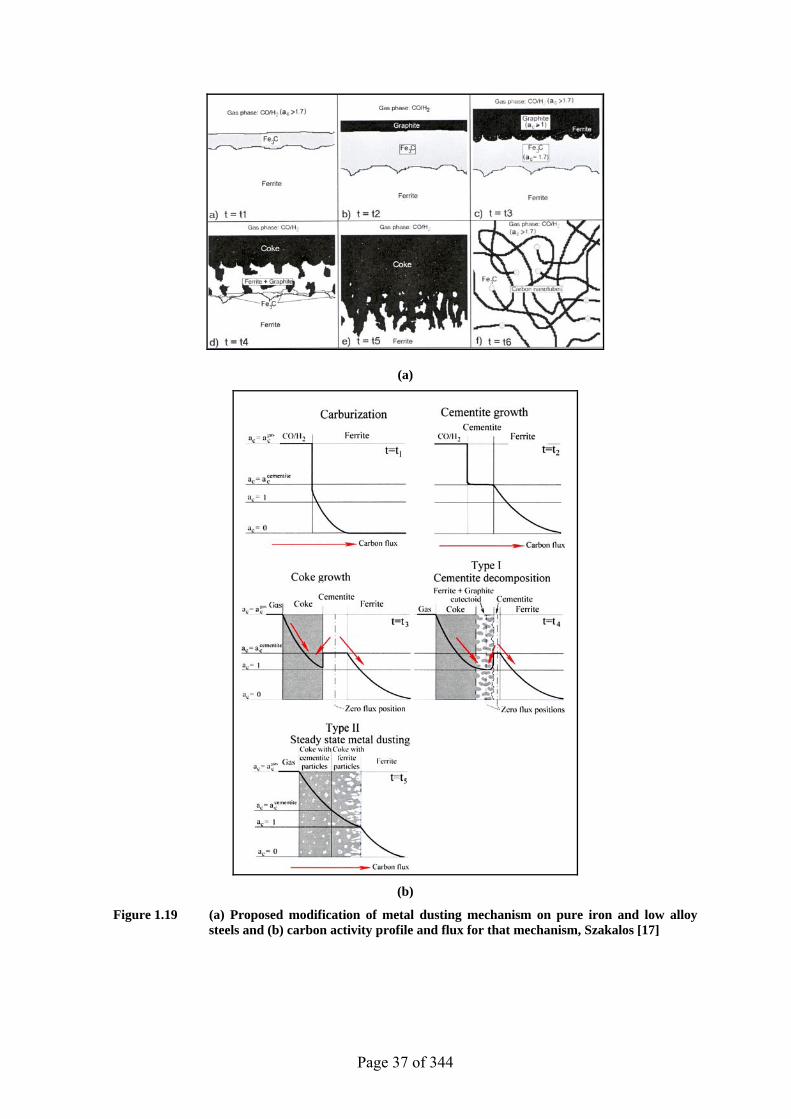
In view of that, some modifications to the original mechanism have been suggested to
overcome these points, Figure 1.19. It has been proposed that the cementite layer forms
only during the initiation stage of the metal dusting process and that stage may last for
more than twenty hours and can last for 100h at 650-700°C. Metal dusting then proceeds
but with a different mechanism involving internal graphitisation (i.e. similar mechanism to
that proposed for nickel and cobalt).
The coke formed during this process showed steady state situation of the corrosion end
products with small catalytic cementite particles producing carbon nanotubes. These
different steps were summarised with thermodynamically consistent carbon activity curves,
Figure 1.19 (b) [17]
Page 37 of 344
(a)
(b)
Figure 1.19 (a) Proposed modification of metal dusting mechanism on pure iron and low alloy steels and (b) carbon activity profile and flux for that mechanism, Szakalos [17]
Page 38 of 344
Many researches have suggested other modifications to the original mechanism proposed
for iron and low alloy steels [43]:
a. Unreleased Stresses were believed to play a role in metal dusting. Koszman [16]
as referenced in [43] observed that metal dusting could proceed due to the presence
of surface localised stresses. However, no conclusive study concerning the effect of
stress has been published.
b. Deposition of Carbon on a catalytically active metal surface was thought to be a
possible cause of metal dusting. Several studies concluded that carbon monoxide
dissociation involved the removal of metal particles from the surface after the
growth of graphite [43]. It was suggested that carbon monoxide is adsorbed and
dissociates on the steel surface and that the dissociation is enhanced by surface
defects and steps [47]. According to Hochman [48], metal dusting process starts
with adsorption, then catalytic decomposition of CO (Boudouard reaction),
followed by absorption of released carbon into the surface. This hypothesis could
be supported by that it is difficult for graphite to nucleate directly from the gas
phase even in high carbon activities. It is also well known that iron, nickel, and
cobalt are very efficient catalysts that promote graphite nucleation and growth [17].
c. Oxidation role on the metal dusting process has not been fully understood. Many
studies, however, have strongly suggested that metal dusting was significantly
influenced by oxidation. Eberle et al. [19] as referenced in [43] reported that
metallic particles and coke formation could be produced through exposing alloys to
cyclic carburisation and oxidation. Interestingly, it was also observed that
simultaneous carburisation and oxidation exposure would lead to damage that
appeared similar to metal dusting. Perkins et al. [21] as referenced in [43]
suggested that the metal dusting process is controlled by the simultaneous reaction
of carbon and oxygen with chromium. Szakalos [17] proposed a mechanism that
applies to high alloy steels and nickel-based alloys and it involves selective
oxidation of alloyed carbides i.e. not pure cementite [49] [50].
d. Coke Structure: Chun et al. [28] suggested that metal dusting aggressiveness on
low chromium steels could be assessed based on the nature of the carbon formed.
For example, the formation of crystallised carbon on steel provided diffusion paths
Page 39 of 344
for iron atoms produced by cementite decomposition where the iron atoms diffused
through the carbon to the gas environment and then acted to catalyse filamentous
carbon deposition. However, if the carbon layer was amorphous, then the iron
atoms would not be able to diffuse, except when the layer suffered cracking.
e. Cementite Role: Toh et al. [51] studied metal dusting of Fe-Cr and Fe-Cr-Ni
alloys under cyclic exposures and observed that the cementite layer formed at the
alloy surfaces has catalysed the carbon deposition. Carbon deposition was observed
to have started only after the formation of a surface layer of cementite on pure iron
exposed to carbon-containing gas.
f. Driving Forces: According to Zeng et al. [52], the suggested metal dusting
mechanisms are not fully clear. Although Hochman [4] as referenced in [27],
suggested that the final products of the metal dusting process are graphite and iron,
cementite is usually detected. It is not clear what drives the cementite formation
and decomposition under the same conditions of temperature, pressure, and gas
composition. Zhang et al. [53] studied the influence of the gas composition on the
final product of metal dusting of pure iron. Cementite and iron were detected in the
coke when the iron was exposed to a gas mixture bearing low concentrations of
carbon monoxide (e.g. 5%). Introducing more carbon monoxide (e.g. 30% or
more), however, resulted in the presence of only cementite particles in the dust.
g. Carbon Activity Level: The metal dusting mechanisms for moderate carbon
activities and high carbon activities were shown to be slightly different [42].
These modifications and comments have a strong potential to improve the current
mechanisms. The effect of the oxygen partial pressure on the metal dusting mechanisms
needs to be investigated in more details. Currently, the oxygen partial pressure is only
considered to predict the establishment of stable oxide scales [43].
LeFrancois et al. (1963) [54] proposed a metal dusting mechanism of stainless steel in
which reduced nickel, iron, or exposed metal activates the carbon-producing reactions
leading to carbon diffusion into the steel matrix and causing Cr23C6 precipitation, initially
at grain boundaries. It was also proposed that direct reaction of chromium in the steel with
carbon monoxide could produce chromium carbides:
Page 40 of 344
23/6 Cr + C ↔ 1/6 Cr23C6 (1.29)
23/6 Cr + 2CO ↔ 1/6 Cr23C6 + CO2 (1.30)
As the grain boundaries become saturated with carbides, the carbon reacts with the
chromium remaining in the grain leading to an appreciable change in the volume and as a
consequence the grain is disintegrated from the steel at the grain boundary.
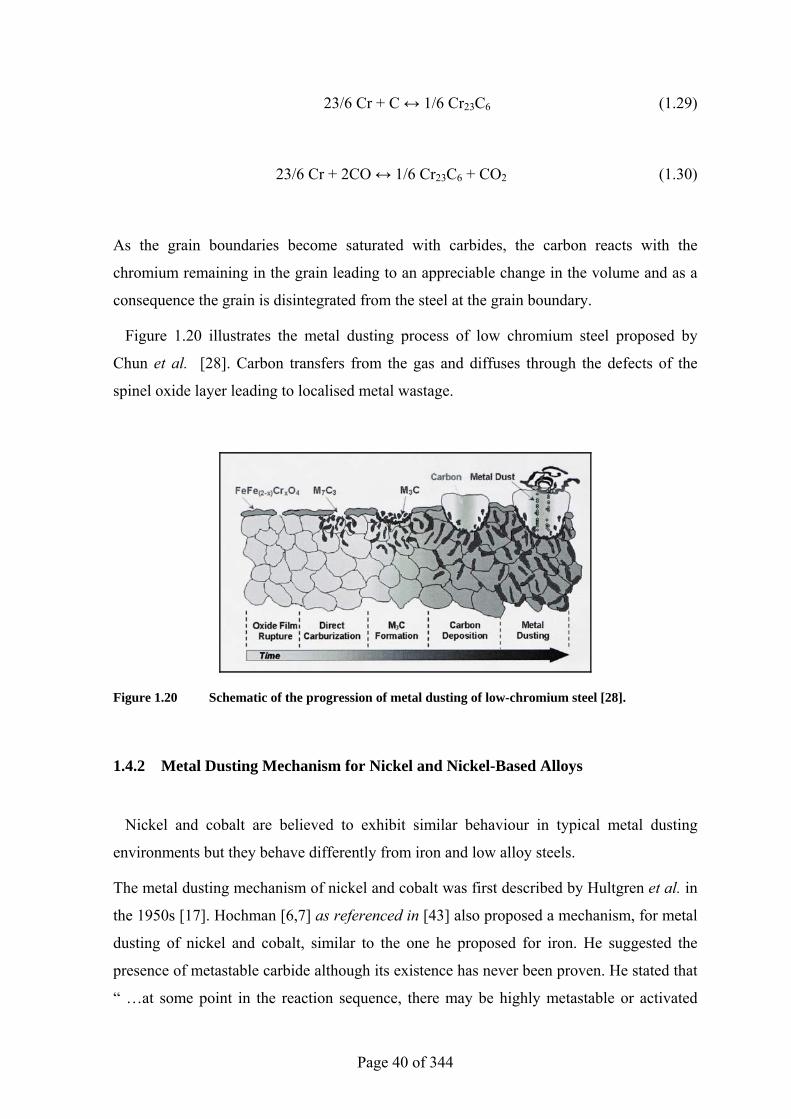
Figure 1.20 illustrates the metal dusting process of low chromium steel proposed by
Chun et al. [28]. Carbon transfers from the gas and diffuses through the defects of the
spinel oxide layer leading to localised metal wastage.
Figure 1.20 Schematic of the progression of metal dusting of low-chromium steel [28].
1.4.2 Metal Dusting Mechanism for Nickel and Nickel-Based Alloys
Nickel and cobalt are believed to exhibit similar behaviour in typical metal dusting
environments but they behave differently from iron and low alloy steels.
The metal dusting mechanism of nickel and cobalt was first described by Hultgren et al. in
the 1950s [17]. Hochman [6,7] as referenced in [43] also proposed a mechanism, for metal
dusting of nickel and cobalt, similar to the one he proposed for iron. He suggested the
presence of metastable carbide although its existence has never been proven. He stated that
“ …at some point in the reaction sequence, there may be highly metastable or activated
Page 41 of 344
complexes of the carbides of these metals, but they must deteriorate rapidly, since carbides
cannot be identified in the corrosion products in the work performed to date…” [55].
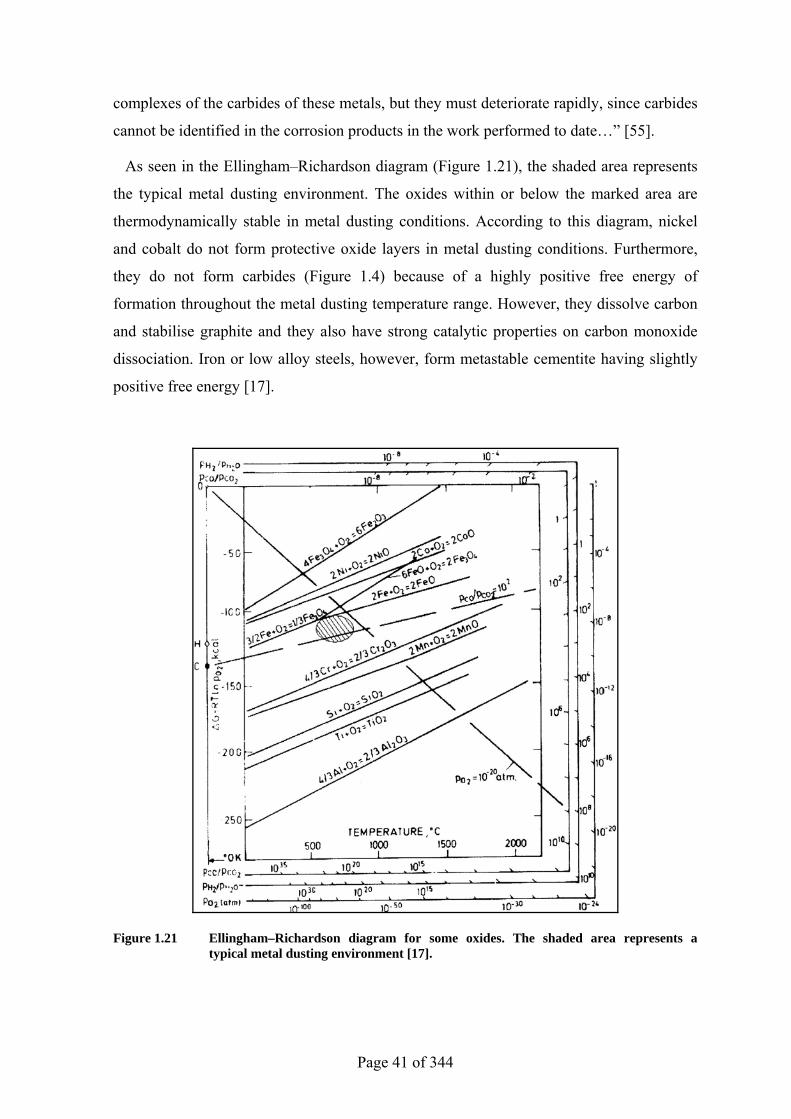
As seen in the Ellingham–Richardson diagram (Figure 1.21), the shaded area represents
the typical metal dusting environment. The oxides within or below the marked area are
thermodynamically stable in metal dusting conditions. According to this diagram, nickel
and cobalt do not form protective oxide layers in metal dusting conditions. Furthermore,
they do not form carbides (Figure 1.4) because of a highly positive free energy of
formation throughout the metal dusting temperature range. However, they dissolve carbon
and stabilise graphite and they also have strong catalytic properties on carbon monoxide
dissociation. Iron or low alloy steels, however, form metastable cementite having slightly
positive free energy [17].
Figure 1.21 Ellingham–Richardson diagram for some oxides. The shaded area represents a typical metal dusting environment [17].
Page 42 of 344
Unlike iron and low alloy steels, the metal dusting process in nickel and nickel-based
alloys does not involve the formation of metastable carbides. Instead, the alloy
disintegrates by direct inward growth of graphite into the supersaturated structure.
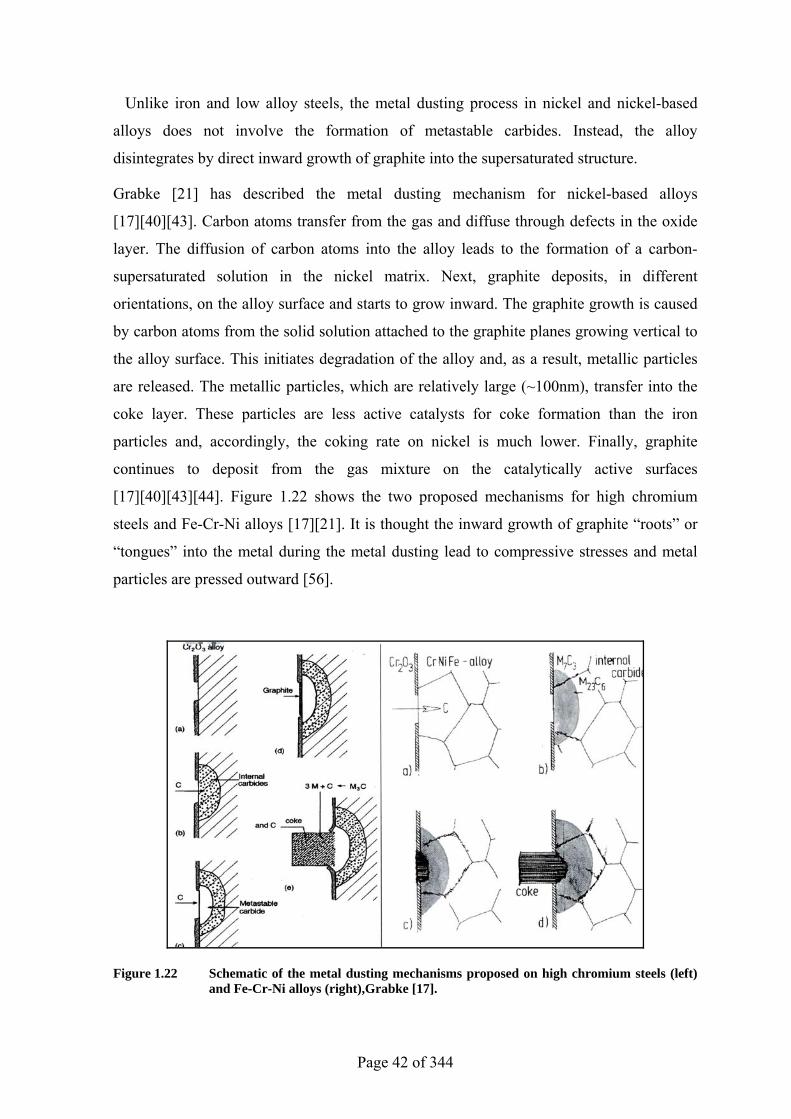
Grabke [21] has described the metal dusting mechanism for nickel-based alloys
[17] [40] [43]. Carbon atoms transfer from the gas and diffuse through defects in the oxide
layer. The diffusion of carbon atoms into the alloy leads to the formation of a carbon-
supersaturated solution in the nickel matrix. Next, graphite deposits, in different
orientations, on the alloy surface and starts to grow inward. The graphite growth is caused
by carbon atoms from the solid solution attached to the graphite planes growing vertical to
the alloy surface. This initiates degradation of the alloy and, as a result, metallic particles
are released. The metallic particles, which are relatively large (~100nm), transfer into the
coke layer. These particles are less active catalysts for coke formation than the iron
particles and, accordingly, the coking rate on nickel is much lower. Finally, graphite
continues to deposit from the gas mixture on the catalytically active surfaces
[17] [40] [43] [44]. Figure 1.22 shows the two proposed mechanisms for high chromium
steels and Fe-Cr-Ni alloys [17] [21]. It is thought the inward growth of graphite “roots” or
“tongues” into the metal during the metal dusting lead to compressive stresses and metal
particles are pressed outward [56].
Figure 1.22 Schematic of the metal dusting mechanisms proposed on high chromium steels (left) and Fe-Cr-Ni alloys (right),Grabke [17].
Page 43 of 344
The metal dusting mechanism for nickel and nickel-based alloys is generally accepted by
most researchers. However, there is another mechanism that was proposed by Pippel et al.
[16,17] as referenced in [17] for iron and nickel. This mechanism involves metal
dissolution and diffusion into the graphite. It was further discussed by Chun et al. for iron
and cobalt [17] [57] [58] [59].
The addition of nickel to iron leads to a change from one mechanism to the other and, as
a certain amount of nickel is added to iron, the formation of the metastable cementite is
inhibited. The mechanism change is experienced when the nickel content in the alloy
reaches 40%. At that level, it was observed that cementite did not form after exposure to
metal dusting environment at 650°C. However, Transmission Electron Microscope
analyses indicated that the mechanism had already changed at Ni > 10% [21].
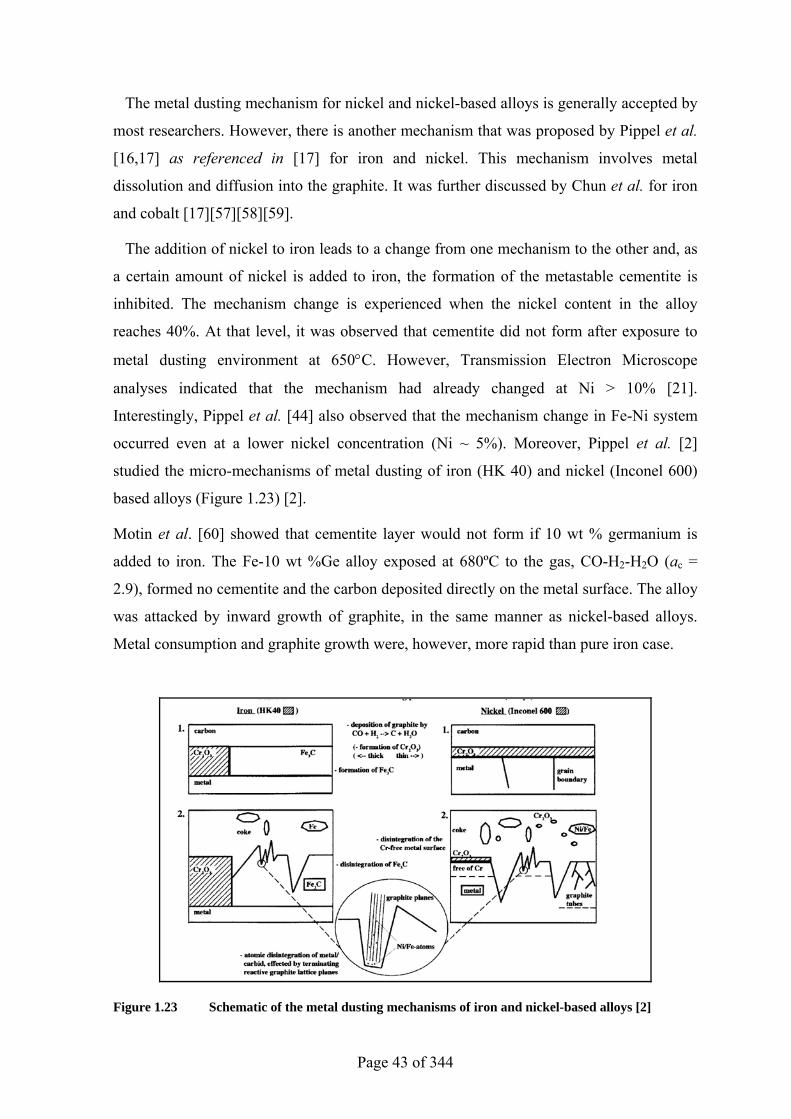
Interestingly, Pippel et al. [44] also observed that the mechanism change in Fe-Ni system
occurred even at a lower nickel concentration (Ni ~ 5%). Moreover, Pippel et al. [2]
studied the micro-mechanisms of metal dusting of iron (HK 40) and nickel (Inconel 600)
based alloys (Figure 1.23) [2].
Motin et al. [60] showed that cementite layer would not form if 10 wt % germanium is
added to iron. The Fe-10 wt %Ge alloy exposed at 680ºC to the gas, CO-H2-H2O (ac =
2.9), formed no cementite and the carbon deposited directly on the metal surface. The alloy
was attacked by inward growth of graphite, in the same manner as nickel-based alloys.
Metal consumption and graphite growth were, however, more rapid than pure iron case.
Figure 1.23 Schematic of the metal dusting mechanisms of iron and nickel-based alloys [2]
Page 44 of 344
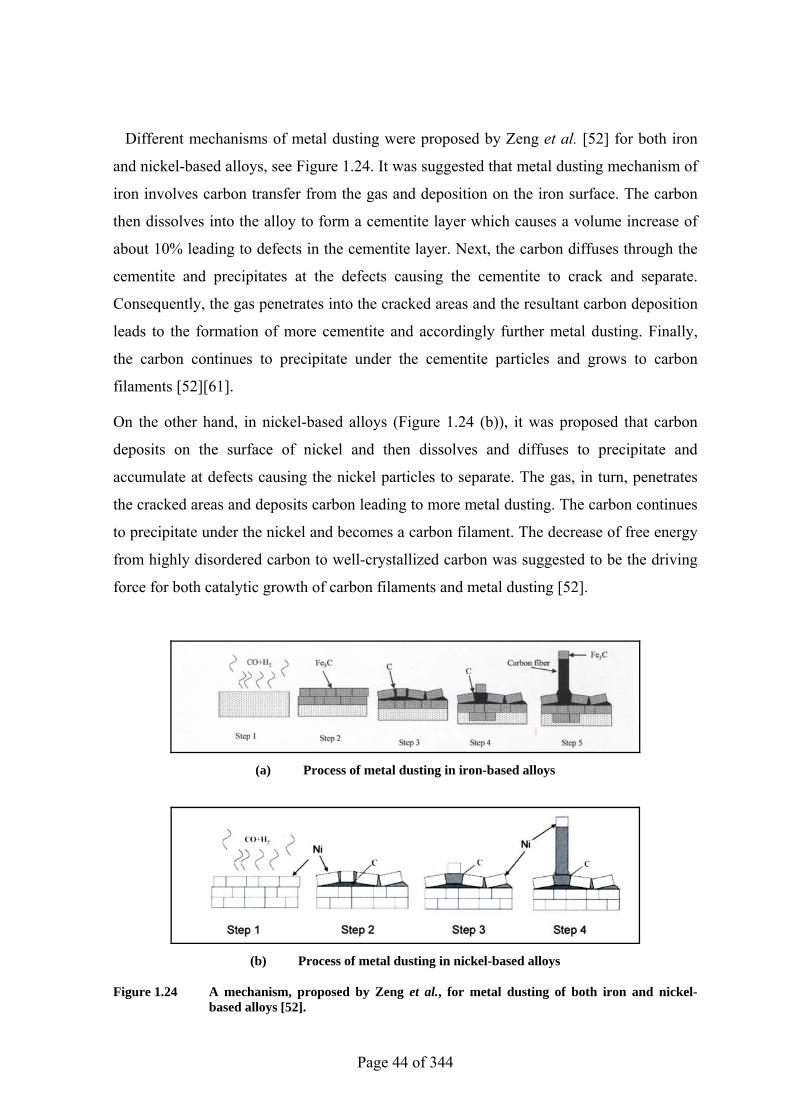
Different mechanisms of metal dusting were proposed by Zeng et al. [52] for both iron
and nickel-based alloys, see Figure 1.24. It was suggested that metal dusting mechanism of
iron involves carbon transfer from the gas and deposition on the iron surface. The carbon
then dissolves into the alloy to form a cementite layer which causes a volume increase of
about 10% leading to defects in the cementite layer. Next, the carbon diffuses through the
cementite and precipitates at the defects causing the cementite to crack and separate.
Consequently, the gas penetrates into the cracked areas and the resultant carbon deposition
leads to the formation of more cementite and accordingly further metal dusting. Finally,
the carbon continues to precipitate under the cementite particles and grows to carbon
filaments [52] [61].
On the other hand, in nickel-based alloys (Figure 1.24 (b)), it was proposed that carbon
deposits on the surface of nickel and then dissolves and diffuses to precipitate and
accumulate at defects causing the nickel particles to separate. The gas, in turn, penetrates
the cracked areas and deposits carbon leading to more metal dusting. The carbon continues
to precipitate under the nickel and becomes a carbon filament. The decrease of free energy
from highly disordered carbon to well-crystallized carbon was suggested to be the driving
force for both catalytic growth of carbon filaments and metal dusting [52].
(a) Process of metal dusting in iron-based alloys
(b) Process of metal dusting in nickel-based alloys
Figure 1.24 A mechanism, proposed by Zeng et al., for metal dusting of both iron and nickel-based alloys [52].
Page 45 of 344
In conclusion, it is obvious that there is a still no universal agreement on metal dusting
mechanisms [5]. Zeng et al. [9] as referenced in [17] concluded that the mechanisms of
metal dusting are not fully understood although they have been studied for more than fifty
years. Further researches are needed to gain a better understanding of the mechanisms,
particularly in high alloy metals. Grabke [62] emphasised that the complex processes in the
metal dusting of iron and steels are not completely recognised. Gabriele et al. [12] stated
that understanding metal dusting of nickel-based alloys still lacks precision and reliability.
1.5 Alloys Performance in Metal Dusting
Many researches have been carried out to study the performance of various alloys in
metal dusting conditions. The typical chemical compositions of the alloys are tabulated in
Tables 1.1 and 1.2.
In 1945, Camp et al. [183] as referenced in [1] investigated the metal dusting behaviour
of stainless steel type 304 at 704-870°C for 20h in petroleum naphtha in a simulated
superheater environment. The metal wastage rate varied from zero at 704°C and 870°C to
53 mm/year at 760°C.
Eberle et al. [181] as referenced in [1] investigated the behaviour of sixteen nickel and
iron-based alloys at different locations in a waste heat boiler for 14 and 41days
respectively. The temperature in the system varied within the range 370-927°C and the
total gas pressure was 2.17MPa. Metal dusting rate was generally the highest at 593-704°C
with stainless steel type 446 showing a good resistance.
Prange [179] as referenced in [1] tested different alloys in a butane dehydrogenation
process environment at 600°C. Some alloys showed good resistance to metal dusting,
namely: 31Cr-9Ni, 30Cr-65Co-4W, 24Cr-15Ni, 20Cr-10Ni-3.6Mo, 18Cr-12Ni-2.5Si, and
27Cr alloy. However, alloys 20Cr-3Ni, 18Cr-11Ni, 17Cr-13Ni-2Mo, 12Cr, 9Cr-1.4Mo, Fe-
Ni, and 14Si-Fe exhibited poor resistance and suffered severe metal dusting.
Wolfe [143] as referenced in [1] studied the performance of engineering alloys in H2-
CO-H2O at 649-816°C and pressures 345-1,034KPa. The alloys were stainless steel types
202, 302, 316, 347, 16Cr, and 18-18-2, Cb-3, copper alloy 400, Nichrome, Chromal,
Page 46 of 344
Alumel, Constantan, C-4, X, 601, 811E, and 702. All the tested alloys experienced
localised metal dusting, except copper alloy 400 and alloy 702 which, however, exhibited
good resistance to metal dusting.
Grabke et al. [103] as referenced in [1] tested 13 commercial alloys in H2-CO-H2O
mixtures at 450,500,550, and 600°C for 3-28days. The best resistance to metal dusting was
observed on the alloys 18Cr-1.3Si-1Al, X18CrN28, and 25Cr-7.2Mn-3Ni. Furthermore,
the performance of high nickel alloys in metal dusting was suggested to have been
improved by the addition of more chromium.
Grabke et al. [63] studied the behaviour of alloys including stainless steel type 304,
17Cr-10Mn, 153MA, and alloy 800 in metal dusting condition (H2-24%CO-2%H2O at
600°C). As a consequence, all the alloys suffered metal dusting but in different degrees.
Interestingly, alloys possessed fine grain microstructure or deformed surface exhibited less
metal dusting.
Gommans et al. [84] as referenced in [1] evaluated nine commercial alloys by placing
them in a waste heat boiler and superheater of an ammonia plant for 19,000-25,000h. The
alloys were DS, stainless steel type 310, stainless steel type 310Si, alloy AC66, Fe-18Cr-
17Ni-5Si, Fe-18Cr-20Ni-5Si-Cu/Mo, 253MA, 353MA, and Pack aluminised TP 304
stainless steel. Metal dusting occurred on the all alloys but the Pack aluminised TP 304
stainless steel.
Stahl et al. [71] as referenced in [1] investigated the performance of alloys 617 and 601
in a mixed gas environment (ac = 3.6) at 620 and 660°C and a pressure of 3.4MPa for an
undisclosed time. Both alloys experienced localised metal dusting..
Shibasaki et al. [72] as referenced in [1] reported results on metal dusting behaviour of
stainless steel types 304, 321, and 310S, Incoloy 800H, 32X, Inconel 600, Inconel 601,
Inconel 625, HP-Nb & HP-Nb-Ti, 20Cr-32Ni-Nb, and Filler Metal 82. The alloys were
evaluated at a transfer line of a reformed gas reheater in a direct iron ore reduction plant at
444-875°C and a pressure of 5atm. The environment was a gas mixture of 15%CO-
9.2%CH4-10%H2O-1%CO2. Exposing the alloys for several months resulted in metal
dusting on stainless steels 304 and 321, and alloys 600 and 601
Maier et al. [64] tested P91, stainless steel type 410, stainless steel type 310, and a model
alloy (12Cr-2.75Si) in an environment that contained a mixture of 73.2%H2-24.4%CO-
2.4%H2O at 560°C and 1.5bar for 200h. P91 and stainless steel type 410 suffered metal
Page 47 of 344
dusting before 25h whereas stainless steel type 310 and the model alloy did not show metal
dusting after 200h.
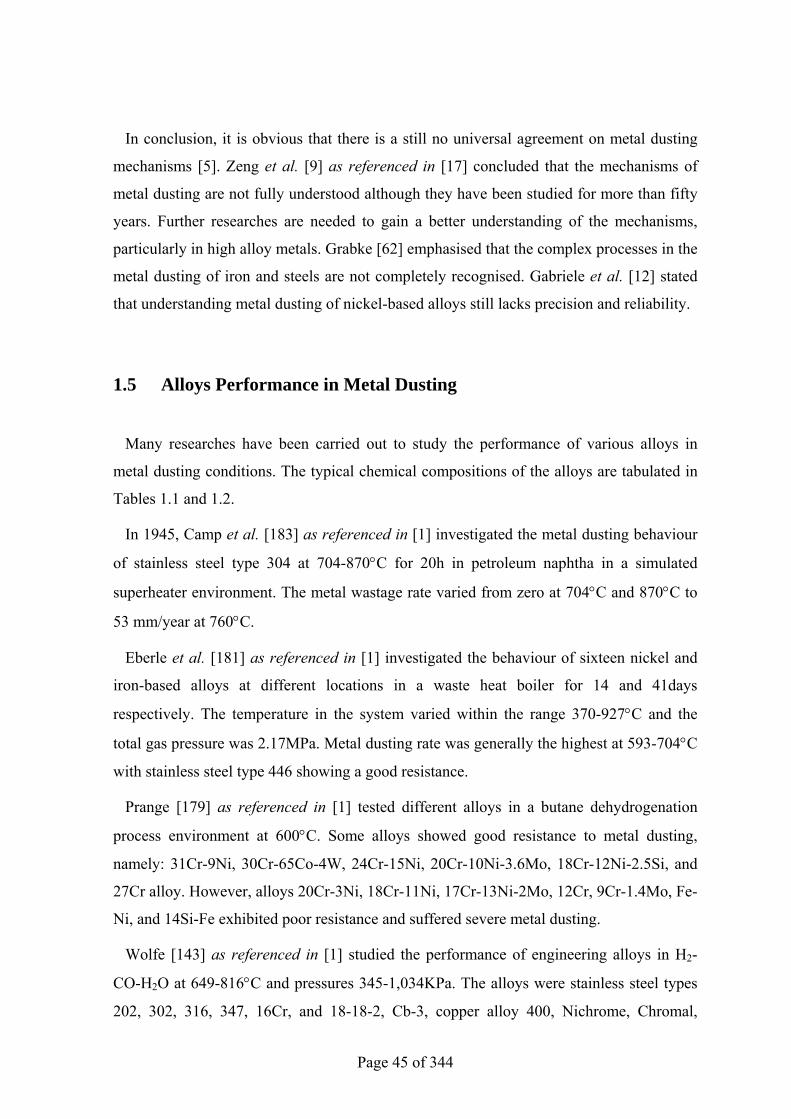
Klower et. al. [18] exposed commercial alloys to metal dusting conditions at 650°C for
up to 10,000h. The alloys were Incoloy 800H, HK40, HP40, DS, alloy 600, alloy 601, C-4,
214, HR-160, 45-TM, alloy 602CA, alloy 617, and alloy 690. In the first 5,000h, the gas
composition was 24%CO-74%H2-2%H2O and in the second 5,000h, the composition was
changed to 49%CO-2%H2-49%H2O. The least metal wastage rates were observed on the
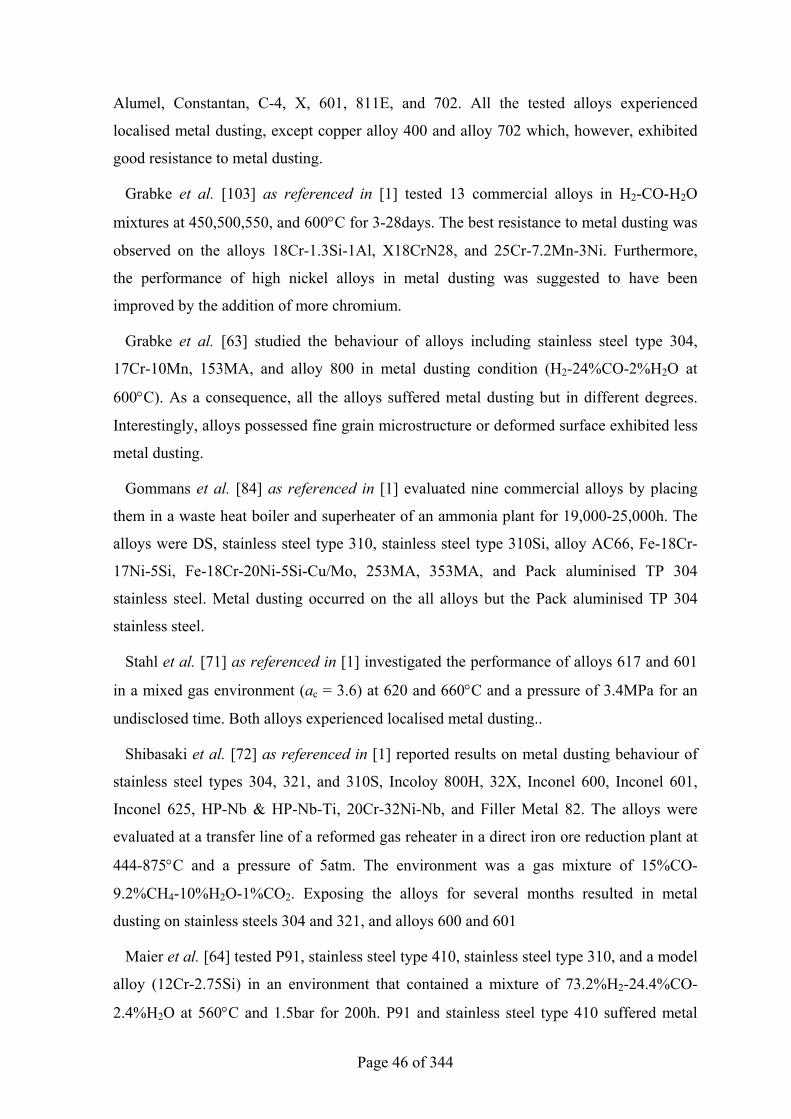
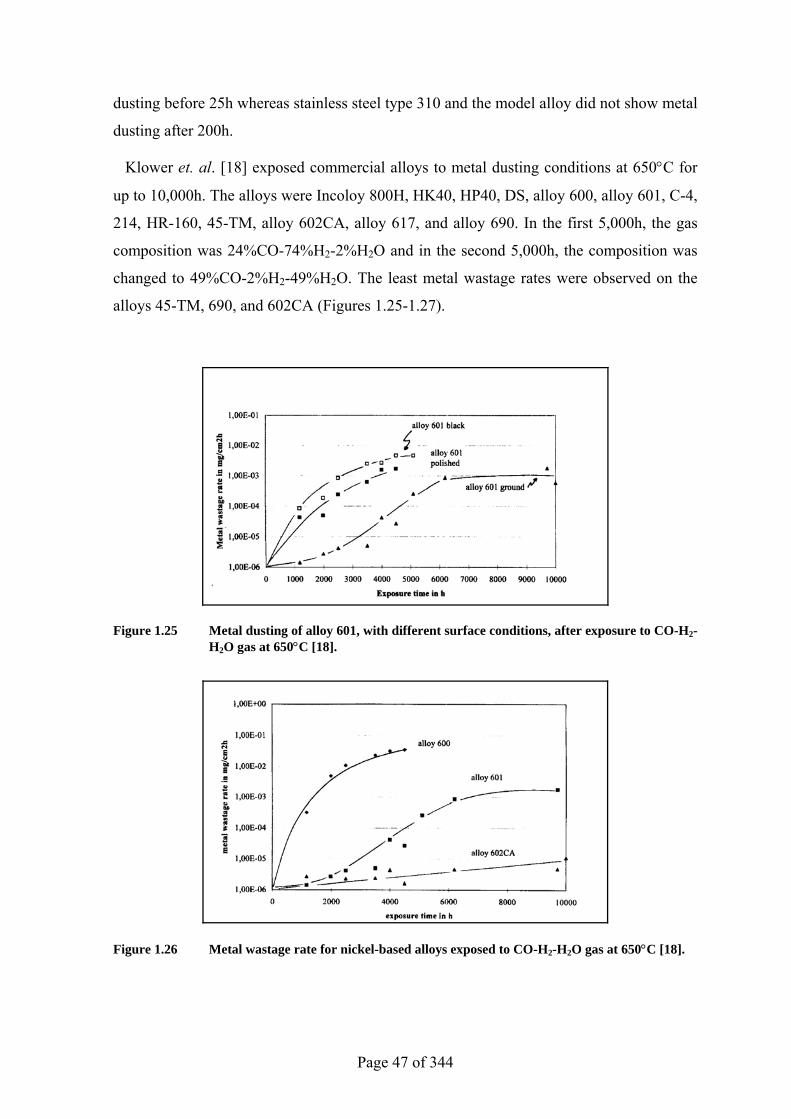
alloys 45-TM, 690, and 602CA (Figures 1.25-1.27).
Figure 1.25 Metal dusting of alloy 601, with different surface conditions, after exposure to CO-H2-H2O gas at 650°C [18].
Figure 1.26 Metal wastage rate for nickel-based alloys exposed to CO-H2-H2O gas at 650°C [18].
Page 48 of 344
Figure 1.27 Metal dusting of iron-based alloys in comparison to the nickel-based alloy 600H after exposure to CO-H2-H2O gas at 650°C [18].
Levi et al. [9] investigated the behaviour of stainless steel type 316 by exposing it to
75%H2–25%CO at 450-650°C in 1.0MPa and 2.0MPa. The metal dusting became more
aggressive as the temperature or pressure or both were increased.
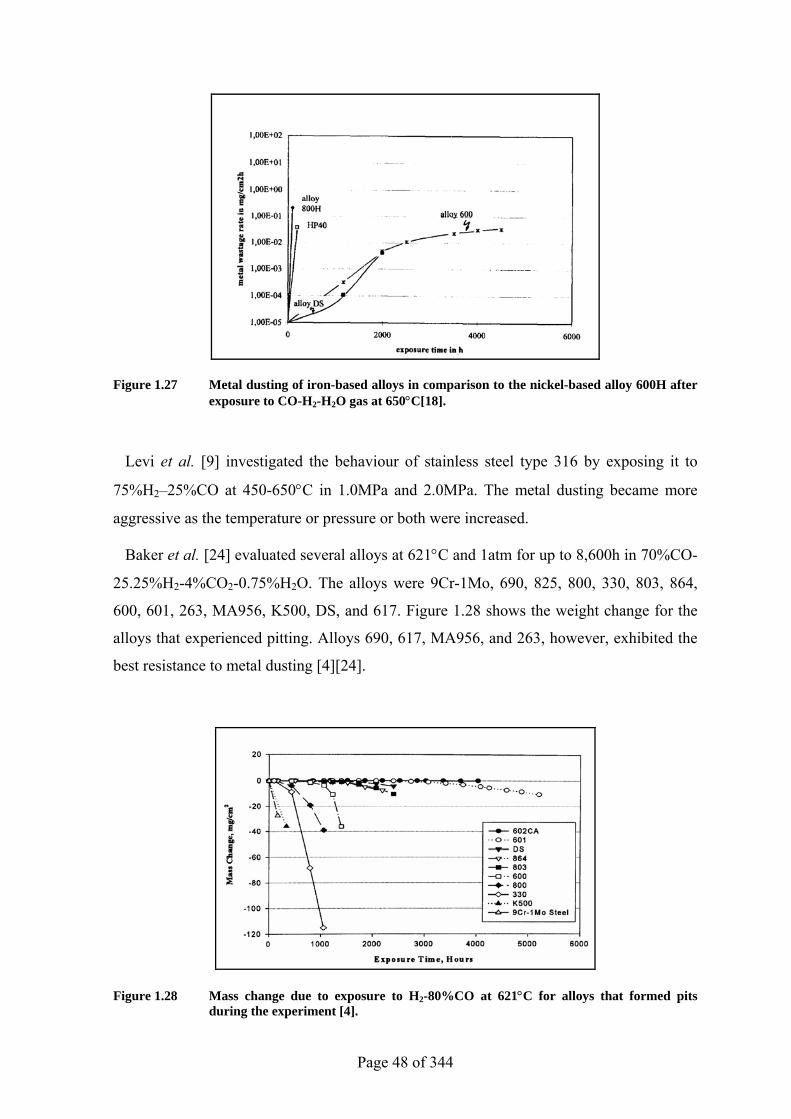
Baker et al. [24] evaluated several alloys at 621°C and 1atm for up to 8,600h in 70%CO-
25.25%H2-4%CO2-0.75%H2O. The alloys were 9Cr-1Mo, 690, 825, 800, 330, 803, 864,
600, 601, 263, MA956, K500, DS, and 617. Figure 1.28 shows the weight change for the
alloys that experienced pitting. Alloys 690, 617, MA956, and 263, however, exhibited the
best resistance to metal dusting [4] [24].
Figure 1.28 Mass change due to exposure to H2-80%CO at 621°C for alloys that formed pits during the experiment [4].
Page 49 of 344
The performance of alloys 754, TD, 600, 758, 400, 693, 602CA, 625LCF, 601, 690, 276,
671, 617, 263, 825, DS, 330, 803, 864, 800/800HT, and 956 in metal dusting conditions
was evaluated by Baker et al. [15]. The experiment was carried out in CO-20%H2 gas at
621°C for 16,000h. Alloy 693 exhibited the best performance; see Figures 1.10 and 1.11.
Fabiszewski et. al. [20] tested six commercial alloys in 99.99%CO and 90%CO-10% H2
atmospheres for four weeks at 482, 566, 649, and 732°C and a pressure of 2.2atm. The
alloys were stainless steel types 304 and 310, alloys RA85H, 800H, 601, and RA333.
Metal dusting attack was generally more aggressive in 90%CO-10%H2 although, in pure
CO, pitting was observed on four of the alloys exposed at 482°C. In 90%CO-10% H2,
however, five alloys suffered pitting at 482°C. The exposure to this gas at the higher
temperatures also led to metal dusting on stainless steels 304, 310, and alloy 800H and the
aggressiveness of the attack increased with temperature. No metal dusting was observed on
the alloys at 732°C in 90%CO-10%H2.
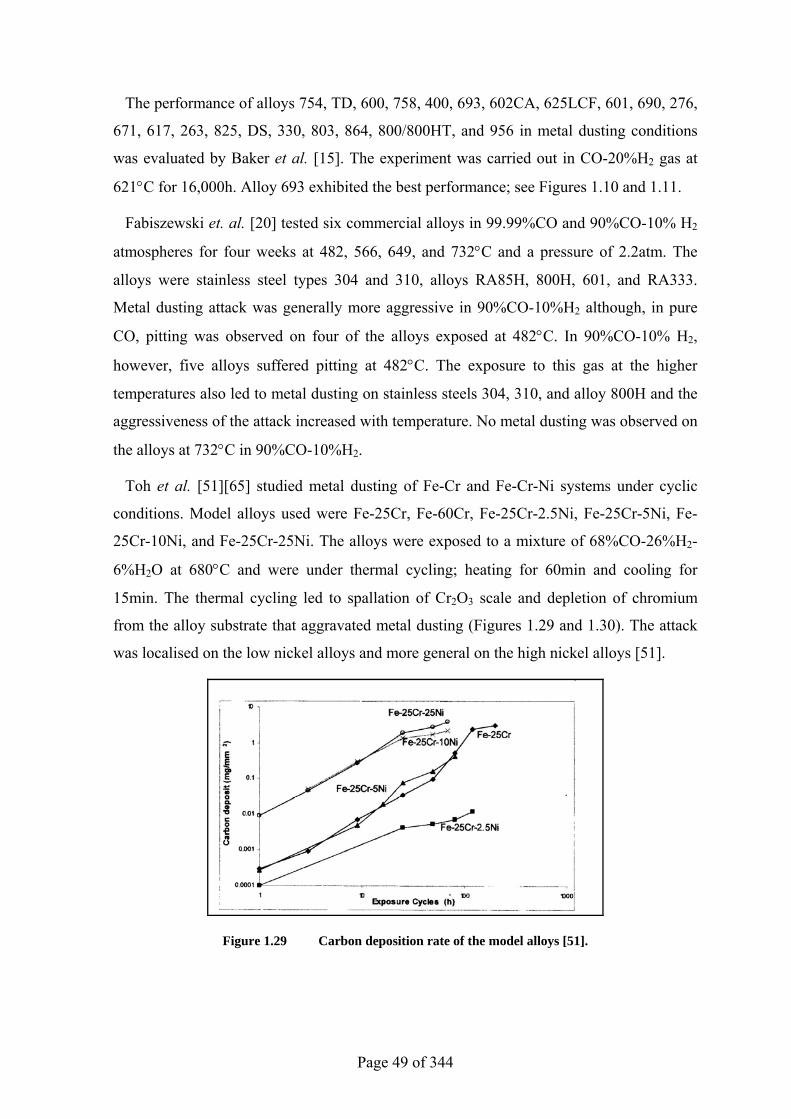
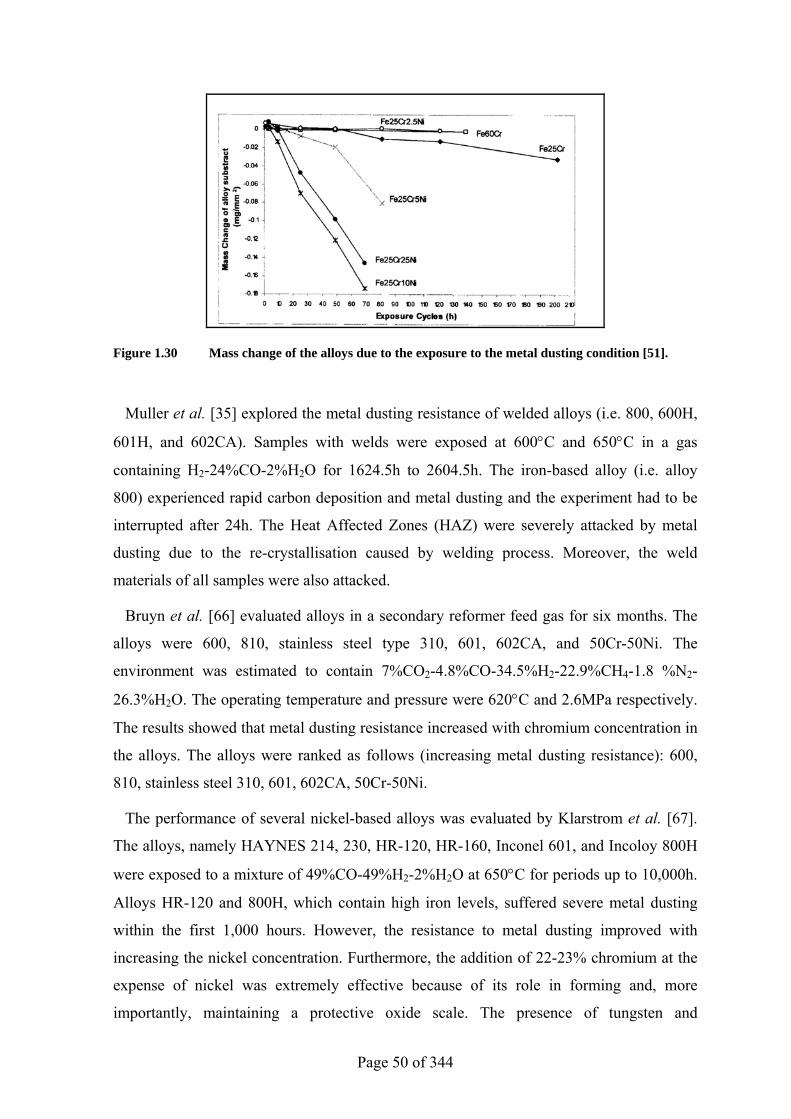
Toh et al. [51] [65] studied metal dusting of Fe-Cr and Fe-Cr-Ni systems under cyclic
conditions. Model alloys used were Fe-25Cr, Fe-60Cr, Fe-25Cr-2.5Ni, Fe-25Cr-5Ni, Fe-
25Cr-10Ni, and Fe-25Cr-25Ni. The alloys were exposed to a mixture of 68%CO-26%H2-
6%H2O at 680°C and were under thermal cycling; heating for 60min and cooling for
15min. The thermal cycling led to spallation of Cr2O3 scale and depletion of chromium
from the alloy substrate that aggravated metal dusting (Figures 1.29 and 1.30). The attack
was localised on the low nickel alloys and more general on the high nickel alloys [51].
Figure 1.29 Carbon deposition rate of the model alloys [51].
Page 50 of 344
Figure 1.30 Mass change of the alloys due to the exposure to the metal dusting condition [51].
Muller et al. [35] explored the metal dusting resistance of welded alloys (i.e. 800, 600H,
601H, and 602CA). Samples with welds were exposed at 600°C and 650°C in a gas
containing H2-24%CO-2%H2O for 1624.5h to 2604.5h. The iron-based alloy (i.e. alloy
800) experienced rapid carbon deposition and metal dusting and the experiment had to be
interrupted after 24h. The Heat Affected Zones (HAZ) were severely attacked by metal
dusting due to the re-crystallisation caused by welding process. Moreover, the weld
materials of all samples were also attacked.
Bruyn et al. [66] evaluated alloys in a secondary reformer feed gas for six months. The
alloys were 600, 810, stainless steel type 310, 601, 602CA, and 50Cr-50Ni. The
environment was estimated to contain 7%CO2-4.8%CO-34.5%H2-22.9%CH4-1.8 %N2-
26.3%H2O. The operating temperature and pressure were 620°C and 2.6MPa respectively.
The results showed that metal dusting resistance increased with chromium concentration in
the alloys. The alloys were ranked as follows (increasing metal dusting resistance): 600,
810, stainless steel 310, 601, 602CA, 50Cr-50Ni.
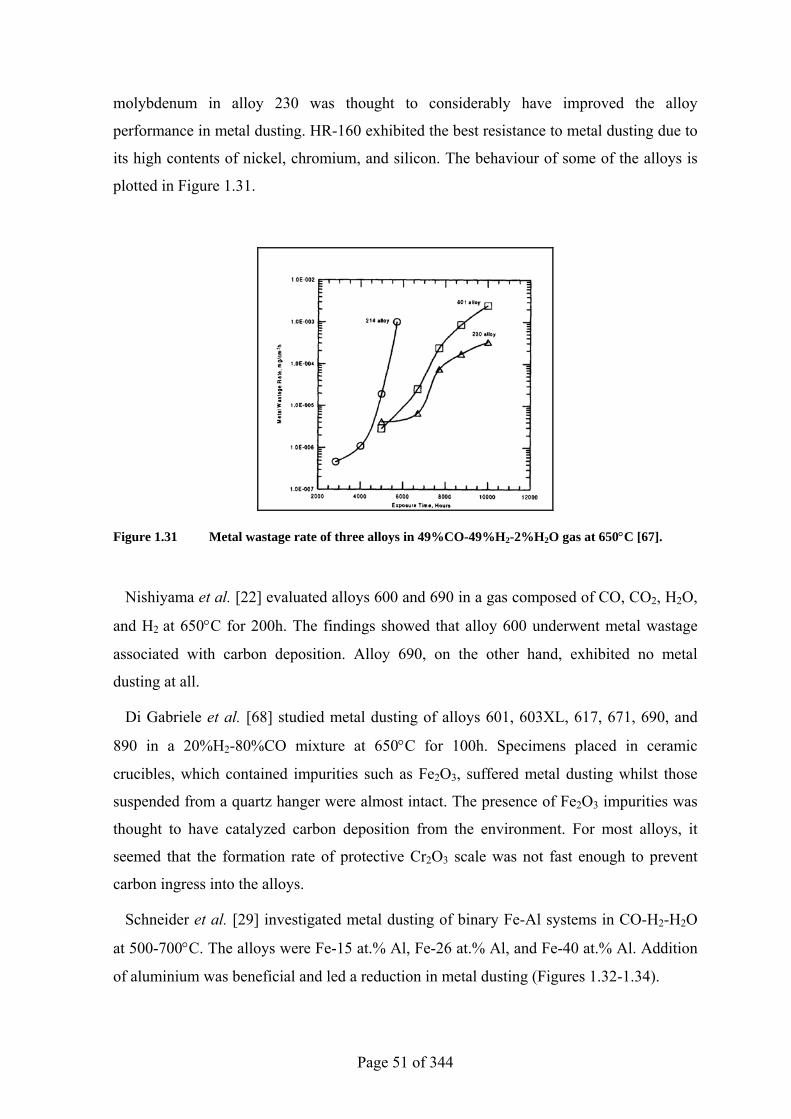
The performance of several nickel-based alloys was evaluated by Klarstrom et al. [67].
The alloys, namely HAYNES 214, 230, HR-120, HR-160, Inconel 601, and Incoloy 800H
were exposed to a mixture of 49%CO-49%H2-2%H2O at 650°C for periods up to 10,000h.
Alloys HR-120 and 800H, which contain high iron levels, suffered severe metal dusting
within the first 1,000 hours. However, the resistance to metal dusting improved with
increasing the nickel concentration. Furthermore, the addition of 22-23% chromium at the
expense of nickel was extremely effective because of its role in forming and, more
importantly, maintaining a protective oxide scale. The presence of tungsten and
Page 51 of 344
molybdenum in alloy 230 was thought to considerably have improved the alloy
performance in metal dusting. HR-160 exhibited the best resistance to metal dusting due to
its high contents of nickel, chromium, and silicon. The behaviour of some of the alloys is
plotted in Figure 1.31.
Figure 1.31 Metal wastage rate of three alloys in 49%CO-49%H2-2%H2O gas at 650°C [67].
Nishiyama et al. [22] evaluated alloys 600 and 690 in a gas composed of CO, CO2, H2O,
and H2 at 650°C for 200h. The findings showed that alloy 600 underwent metal wastage
associated with carbon deposition. Alloy 690, on the other hand, exhibited no metal
dusting at all.
Di Gabriele et al. [68] studied metal dusting of alloys 601, 603XL, 617, 671, 690, and
890 in a 20%H2-80%CO mixture at 650°C for 100h. Specimens placed in ceramic
crucibles, which contained impurities such as Fe2O3, suffered metal dusting whilst those
suspended from a quartz hanger were almost intact. The presence of Fe2O3 impurities was
thought to have catalyzed carbon deposition from the environment. For most alloys, it
seemed that the formation rate of protective Cr2O3 scale was not fast enough to prevent
carbon ingress into the alloys.
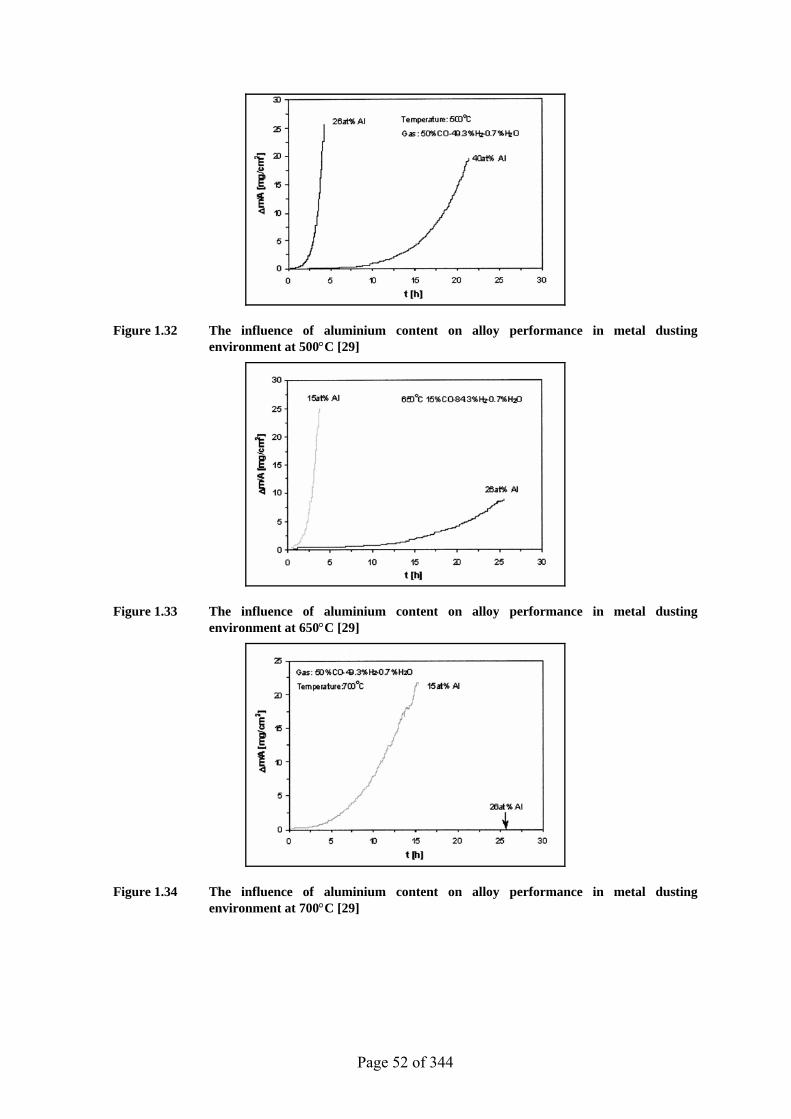
Schneider et al. [29] investigated metal dusting of binary Fe-Al systems in CO-H2-H2O
at 500-700°C. The alloys were Fe-15 at.% Al, Fe-26 at.% Al, and Fe-40 at.% Al. Addition
of aluminium was beneficial and led a reduction in metal dusting (Figures 1.32-1.34).
Page 52 of 344
Figure 1.32 The influence of aluminium content on alloy performance in metal dusting environment at 500°C [29]
Figure 1.33 The influence of aluminium content on alloy performance in metal dusting environment at 650°C [29]
Figure 1.34 The influence of aluminium content on alloy performance in metal dusting environment at 700°C [29]
Page 53 of 344
From the researches reported previously, it is obvious that there is a still no standardised
testing protocol or procedure for metal dusting [1].
It should also be pointed out that most of the lab researches were carried out in controlled
conditions where only one parameter was changed at a time. Accordingly, the results
would not be expected to predict the simultaneous interaction between parameters such as
those encountered in real plant life.
Furthermore, the experimental conditions selected for metal dusting research are intended
to produce fast results within a certain time frame and relating such data to plant
experience is extremely difficult. This gap might be bridged if a reliable simulation to plant
conditions could be achieved in researches [43].
In labs, for example, the samples are usually unstressed unlike the case in plant where the
alloys are under stress and the resulting strain may lead to damages in the protective oxide
scale leading to the onset of metal dusting [69].
In some cases, the plant experience appears to contradict some of the research results. For
instance, in plant metal dusting conditions, alloy 800 has been found to behave much better
than the nickel-based alloy 600 (as reported by Holland et al.) [25]. This is clearly different
to some of the research results.
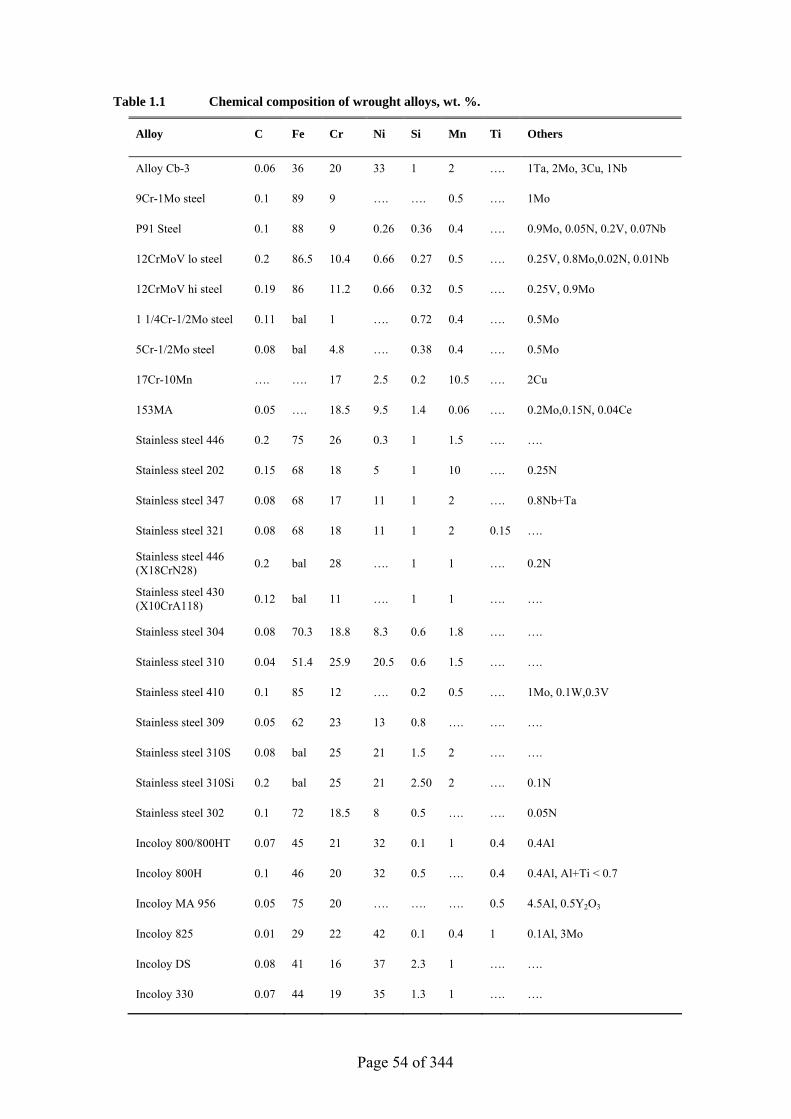
Page 54 of 344
Table 1.1 Chemical composition of wrought alloys, wt. %.
Alloy C Fe Cr Ni Si Mn Ti Others
Alloy Cb-3 0.06 36 20 33 1 2 …. 1Ta, 2Mo, 3Cu, 1Nb
9Cr-1Mo steel 0.1 89 9 …. …. 0.5 …. 1Mo
P91 Steel 0.1 88 9 0.26 0.36 0.4 …. 0.9Mo, 0.05N, 0.2V, 0.07Nb
12CrMoV lo steel 0.2 86.5 10.4 0.66 0.27 0.5 …. 0.25V, 0.8Mo,0.02N, 0.01Nb
12CrMoV hi steel 0.19 86 11.2 0.66 0.32 0.5 …. 0.25V, 0.9Mo
1 1/4Cr-1/2Mo steel 0.11 bal 1 …. 0.72 0.4 …. 0.5Mo
5Cr-1/2Mo steel 0.08 bal 4.8 …. 0.38 0.4 …. 0.5Mo
17Cr-10Mn …. …. 17 2.5 0.2 10.5 …. 2Cu
153MA 0.05 …. 18.5 9.5 1.4 0.06 …. 0.2Mo,0.15N, 0.04Ce
Stainless steel 446 0.2 75 26 0.3 1 1.5 …. ….
Stainless steel 202 0.15 68 18 5 1 10 …. 0.25N
Stainless steel 347 0.08 68 17 11 1 2 …. 0.8Nb+Ta
Stainless steel 321 0.08 68 18 11 1 2 0.15 ….
Stainless steel 446 (X18CrN28) 0.2 bal 28 …. 1 1 …. 0.2N
Stainless steel 430 (X10CrA118) 0.12 bal 11 …. 1 1 …. ….
Stainless steel 304 0.08 70.3 18.8 8.3 0.6 1.8 …. ….
Stainless steel 310 0.04 51.4 25.9 20.5 0.6 1.5 …. ….
Stainless steel 410 0.1 85 12 …. 0.2 0.5 …. 1Mo, 0.1W,0.3V
Stainless steel 309 0.05 62 23 13 0.8 …. …. ….
Stainless steel 310S 0.08 bal 25 21 1.5 2 …. ….
Stainless steel 310Si 0.2 bal 25 21 2.50 2 …. 0.1N
Stainless steel 302 0.1 72 18.5 8 0.5 …. …. 0.05N
Incoloy 800/800HT 0.07 45 21 32 0.1 1 0.4 0.4Al
Incoloy 800H 0.1 46 20 32 0.5 …. 0.4 0.4Al, Al+Ti < 0.7
Incoloy MA 956 0.05 75 20 …. …. …. 0.5 4.5Al, 0.5Y2O3
Incoloy 825 0.01 29 22 42 0.1 0.4 1 0.1Al, 3Mo
Incoloy DS 0.08 41 16 37 2.3 1 …. ….
Incoloy 330 0.07 44 19 35 1.3 1 …. ….
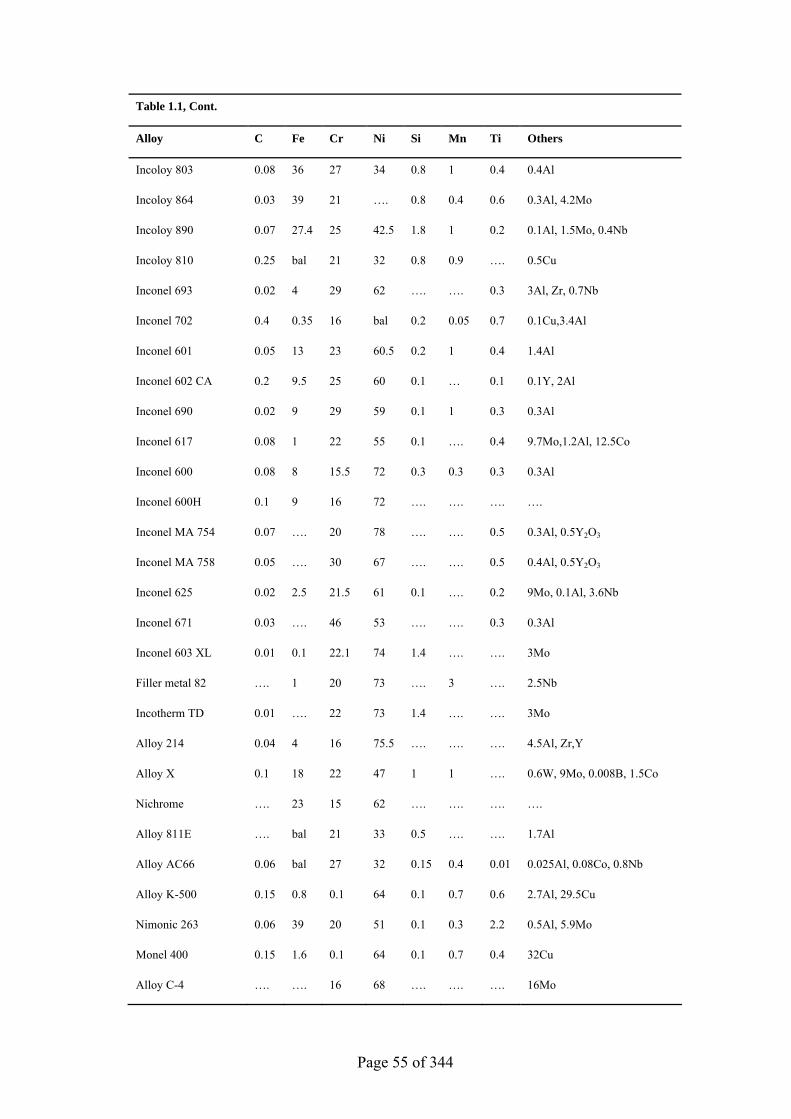
Page 55 of 344
Table 1.1, Cont.
Alloy C Fe Cr Ni Si Mn Ti Others
Incoloy 803 0.08 36 27 34 0.8 1 0.4 0.4Al
Incoloy 864 0.03 39 21 …. 0.8 0.4 0.6 0.3Al, 4.2Mo
Incoloy 890 0.07 27.4 25 42.5 1.8 1 0.2 0.1Al, 1.5Mo, 0.4Nb
Incoloy 810 0.25 bal 21 32 0.8 0.9 …. 0.5Cu
Inconel 693 0.02 4 29 62 …. …. 0.3 3Al, Zr, 0.7Nb
Inconel 702 0.4 0.35 16 bal 0.2 0.05 0.7 0.1Cu,3.4Al
Inconel 601 0.05 13 23 60.5 0.2 1 0.4 1.4Al
Inconel 602 CA 0.2 9.5 25 60 0.1 … 0.1 0.1Y, 2Al
Inconel 690 0.02 9 29 59 0.1 1 0.3 0.3Al
Inconel 617 0.08 1 22 55 0.1 …. 0.4 9.7Mo,1.2Al, 12.5Co
Inconel 600 0.08 8 15.5 72 0.3 0.3 0.3 0.3Al
Inconel 600H 0.1 9 16 72 …. …. …. ….
Inconel MA 754 0.07 …. 20 78 …. …. 0.5 0.3Al, 0.5Y2O3
Inconel MA 758 0.05 …. 30 67 …. …. 0.5 0.4Al, 0.5Y2O3
Inconel 625 0.02 2.5 21.5 61 0.1 …. 0.2 9Mo, 0.1Al, 3.6Nb
Inconel 671 0.03 …. 46 53 …. …. 0.3 0.3Al
Inconel 603 XL 0.01 0.1 22.1 74 1.4 …. …. 3Mo
Filler metal 82 …. 1 20 73 …. 3 …. 2.5Nb
Incotherm TD 0.01 …. 22 73 1.4 …. …. 3Mo
Alloy 214 0.04 4 16 75.5 …. …. …. 4.5Al, Zr,Y
Alloy X 0.1 18 22 47 1 1 …. 0.6W, 9Mo, 0.008B, 1.5Co
Nichrome …. 23 15 62 …. …. …. ….
Alloy 811E …. bal 21 33 0.5 …. …. 1.7Al
Alloy AC66 0.06 bal 27 32 0.15 0.4 0.01 0.025Al, 0.08Co, 0.8Nb
Alloy K-500 0.15 0.8 0.1 64 0.1 0.7 0.6 2.7Al, 29.5Cu
Nimonic 263 0.06 39 20 51 0.1 0.3 2.2 0.5Al, 5.9Mo
Monel 400 0.15 1.6 0.1 64 0.1 0.7 0.4 32Cu
Alloy C-4 …. …. 16 68 …. …. …. 16Mo
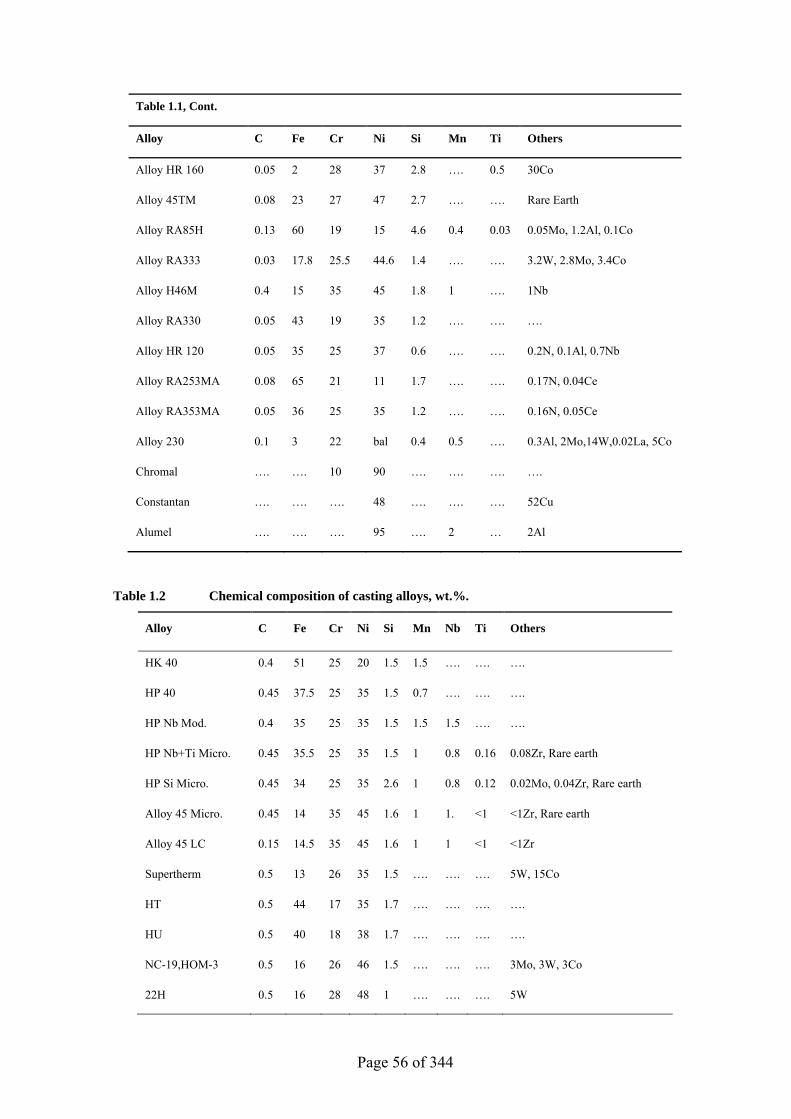
Page 56 of 344
Table 1.1, Cont.
Alloy C Fe Cr Ni Si Mn Ti Others
Alloy HR 160 0.05 2 28 37 2.8 …. 0.5 30Co
Alloy 45TM 0.08 23 27 47 2.7 …. …. Rare Earth
Alloy RA85H 0.13 60 19 15 4.6 0.4 0.03 0.05Mo, 1.2Al, 0.1Co
Alloy RA333 0.03 17.8 25.5 44.6 1.4 …. …. 3.2W, 2.8Mo, 3.4Co
Alloy H46M 0.4 15 35 45 1.8 1 …. 1Nb
Alloy RA330 0.05 43 19 35 1.2 …. …. ….
Alloy HR 120 0.05 35 25 37 0.6 …. …. 0.2N, 0.1Al, 0.7Nb
Alloy RA253MA 0.08 65 21 11 1.7 …. …. 0.17N, 0.04Ce
Alloy RA353MA 0.05 36 25 35 1.2 …. …. 0.16N, 0.05Ce
Alloy 230 0.1 3 22 bal 0.4 0.5 …. 0.3Al, 2Mo,14W,0.02La, 5Co
Chromal …. …. 10 90 …. …. …. ….
Constantan …. …. …. 48 …. …. …. 52Cu
Alumel …. …. …. 95 …. 2 … 2Al
Table 1.2 Chemical composition of casting alloys, wt.%.
Alloy C Fe Cr Ni Si Mn Nb Ti Others
HK 40 0.4 51 25 20 1.5 1.5 …. …. ….
HP 40 0.45 37.5 25 35 1.5 0.7 …. …. ….
HP Nb Mod. 0.4 35 25 35 1.5 1.5 1.5 …. ….
HP Nb+Ti Micro. 0.45 35.5 25 35 1.5 1 0.8 0.16 0.08Zr, Rare earth
HP Si Micro. 0.45 34 25 35 2.6 1 0.8 0.12 0.02Mo, 0.04Zr, Rare earth
Alloy 45 Micro. 0.45 14 35 45 1.6 1 1. <1 <1Zr, Rare earth
Alloy 45 LC 0.15 14.5 35 45 1.6 1 1 <1 <1Zr
Supertherm 0.5 13 26 35 1.5 …. …. …. 5W, 15Co
HT 0.5 44 17 35 1.7 …. …. …. ….
HU 0.5 40 18 38 1.7 …. …. …. ….
NC-19,HOM-3 0.5 16 26 46 1.5 …. …. …. 3Mo, 3W, 3Co
22H 0.5 16 28 48 1 …. …. …. 5W
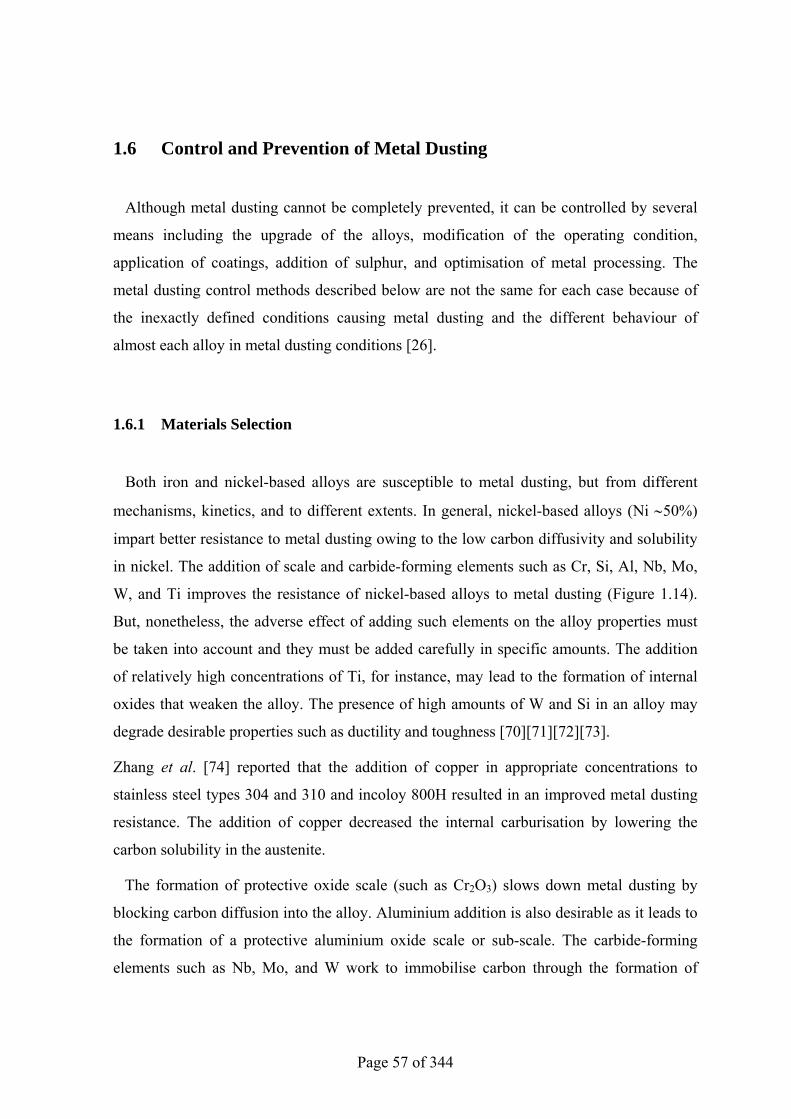
Page 57 of 344
1.6 Control and Prevention of Metal Dusting
Although metal dusting cannot be completely prevented, it can be controlled by several
means including the upgrade of the alloys, modification of the operating condition,
application of coatings, addition of sulphur, and optimisation of metal processing. The
metal dusting control methods described below are not the same for each case because of
the inexactly defined conditions causing metal dusting and the different behaviour of
almost each alloy in metal dusting conditions [26].
1.6.1 Materials Selection
Both iron and nickel-based alloys are susceptible to metal dusting, but from different
mechanisms, kinetics, and to different extents. In general, nickel-based alloys (Ni ∼50%)
impart better resistance to metal dusting owing to the low carbon diffusivity and solubility
in nickel. The addition of scale and carbide-forming elements such as Cr, Si, Al, Nb, Mo,
W, and Ti improves the resistance of nickel-based alloys to metal dusting (Figure 1.14).
But, nonetheless, the adverse effect of adding such elements on the alloy properties must
be taken into account and they must be added carefully in specific amounts. The addition
of relatively high concentrations of Ti, for instance, may lead to the formation of internal
oxides that weaken the alloy. The presence of high amounts of W and Si in an alloy may
degrade desirable properties such as ductility and toughness [70] [71] [72] [73].
Zhang et al. [74] reported that the addition of copper in appropriate concentrations to
stainless steel types 304 and 310 and incoloy 800H resulted in an improved metal dusting
resistance. The addition of copper decreased the internal carburisation by lowering the
carbon solubility in the austenite.
The formation of protective oxide scale (such as Cr2O3) slows down metal dusting by
blocking carbon diffusion into the alloy. Aluminium addition is also desirable as it leads to
the formation of a protective aluminium oxide scale or sub-scale. The carbide-forming
elements such as Nb, Mo, and W work to immobilise carbon through the formation of
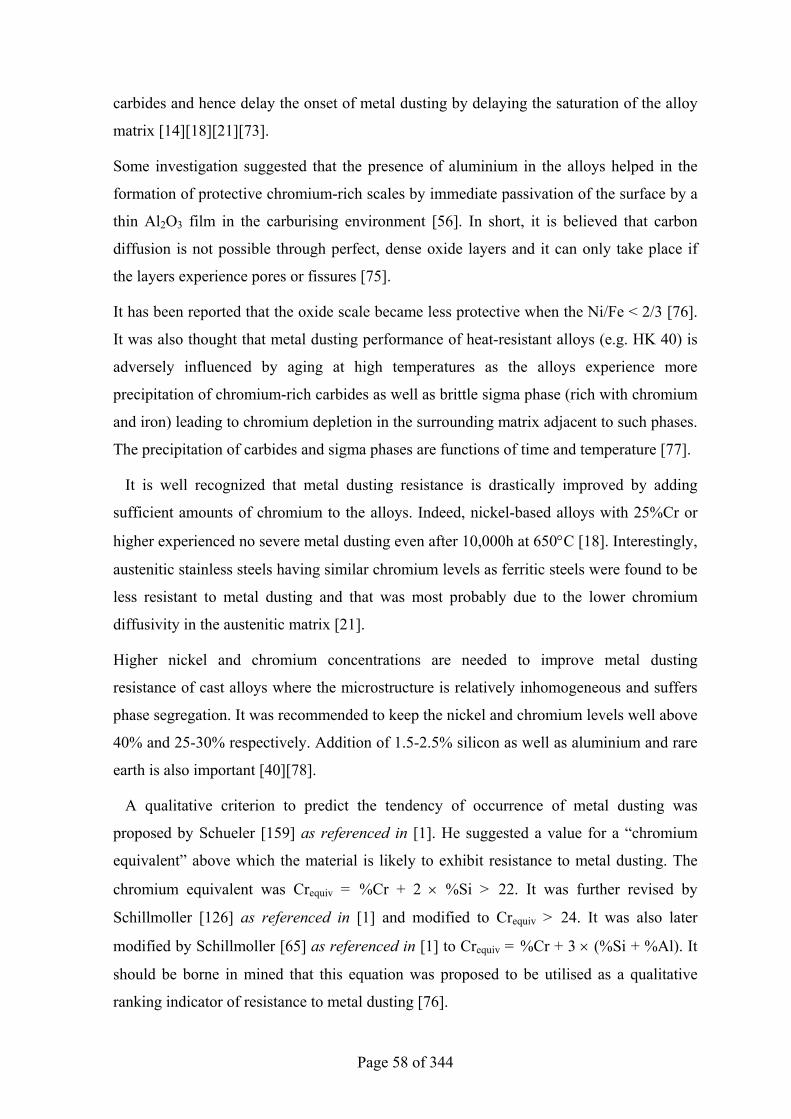
Page 58 of 344
carbides and hence delay the onset of metal dusting by delaying the saturation of the alloy
matrix [14] [18] [21] [73].
Some investigation suggested that the presence of aluminium in the alloys helped in the
formation of protective chromium-rich scales by immediate passivation of the surface by a
thin Al2O3 film in the carburising environment [56]. In short, it is believed that carbon
diffusion is not possible through perfect, dense oxide layers and it can only take place if
the layers experience pores or fissures [75].
It has been reported that the oxide scale became less protective when the Ni/Fe < 2/3 [76].
It was also thought that metal dusting performance of heat-resistant alloys (e.g. HK 40) is
adversely influenced by aging at high temperatures as the alloys experience more
precipitation of chromium-rich carbides as well as brittle sigma phase (rich with chromium
and iron) leading to chromium depletion in the surrounding matrix adjacent to such phases.
The precipitation of carbides and sigma phases are functions of time and temperature [77].
It is well recognized that metal dusting resistance is drastically improved by adding
sufficient amounts of chromium to the alloys. Indeed, nickel-based alloys with 25%Cr or
higher experienced no severe metal dusting even after 10,000h at 650°C [18]. Interestingly,
austenitic stainless steels having similar chromium levels as ferritic steels were found to be
less resistant to metal dusting and that was most probably due to the lower chromium
diffusivity in the austenitic matrix [21].
Higher nickel and chromium concentrations are needed to improve metal dusting
resistance of cast alloys where the microstructure is relatively inhomogeneous and suffers
phase segregation. It was recommended to keep the nickel and chromium levels well above
40% and 25-30% respectively. Addition of 1.5-2.5% silicon as well as aluminium and rare
earth is also important [40] [78].
A qualitative criterion to predict the tendency of occurrence of metal dusting was
proposed by Schueler [159] as referenced in [1]. He suggested a value for a “chromium
equivalent” above which the material is likely to exhibit resistance to metal dusting. The
chromium equivalent was Crequiv = %Cr + 2 × %Si > 22. It was further revised by
Schillmoller [126] as referenced in [1] and modified to Crequiv > 24. It was also later
modified by Schillmoller [65] as referenced in [1] to Crequiv = %Cr + 3 × (%Si + %Al). It
should be borne in mined that this equation was proposed to be utilised as a qualitative
ranking indicator of resistance to metal dusting [76].
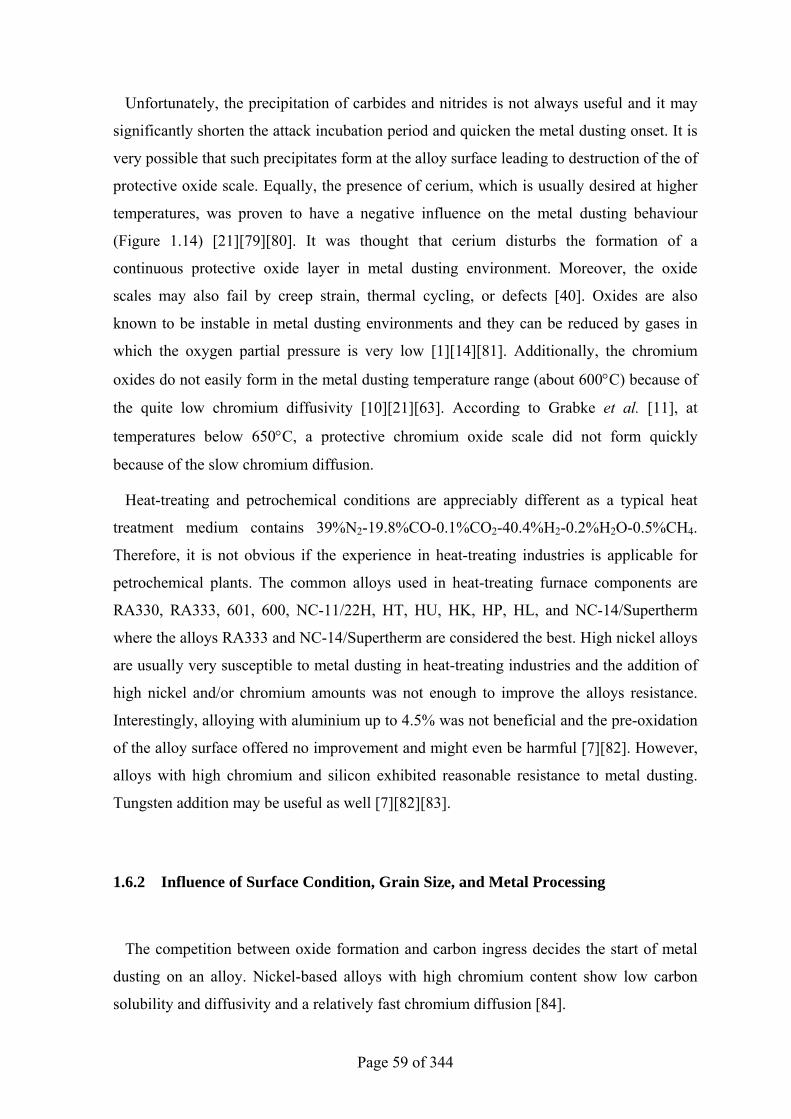
Page 59 of 344
Unfortunately, the precipitation of carbides and nitrides is not always useful and it may
significantly shorten the attack incubation period and quicken the metal dusting onset. It is
very possible that such precipitates form at the alloy surface leading to destruction of the of
protective oxide scale. Equally, the presence of cerium, which is usually desired at higher
temperatures, was proven to have a negative influence on the metal dusting behaviour
(Figure 1.14) [21] [79] [80]. It was thought that cerium disturbs the formation of a
continuous protective oxide layer in metal dusting environment. Moreover, the oxide
scales may also fail by creep strain, thermal cycling, or defects [40]. Oxides are also
known to be instable in metal dusting environments and they can be reduced by gases in
which the oxygen partial pressure is very low [1] [14] [81]. Additionally, the chromium
oxides do not easily form in the metal dusting temperature range (about 600°C) because of
the quite low chromium diffusivity [10] [21] [63]. According to Grabke et al. [11], at
temperatures below 650°C, a protective chromium oxide scale did not form quickly
because of the slow chromium diffusion.
Heat-treating and petrochemical conditions are appreciably different as a typical heat
treatment medium contains 39%N2-19.8%CO-0.1%CO2-40.4%H2-0.2%H2O-0.5%CH4.
Therefore, it is not obvious if the experience in heat-treating industries is applicable for
petrochemical plants. The common alloys used in heat-treating furnace components are
RA330, RA333, 601, 600, NC-11/22H, HT, HU, HK, HP, HL, and NC-14/Supertherm
where the alloys RA333 and NC-14/Supertherm are considered the best. High nickel alloys
are usually very susceptible to metal dusting in heat-treating industries and the addition of
high nickel and/or chromium amounts was not enough to improve the alloys resistance.
Interestingly, alloying with aluminium up to 4.5% was not beneficial and the pre-oxidation
of the alloy surface offered no improvement and might even be harmful [7] [82]. However,
alloys with high chromium and silicon exhibited reasonable resistance to metal dusting.
Tungsten addition may be useful as well [7] [82] [83].
1.6.2 Influence of Surface Condition, Grain Size, and Metal Processing
The competition between oxide formation and carbon ingress decides the start of metal
dusting on an alloy. Nickel-based alloys with high chromium content show low carbon
solubility and diffusivity and a relatively fast chromium diffusion [84].
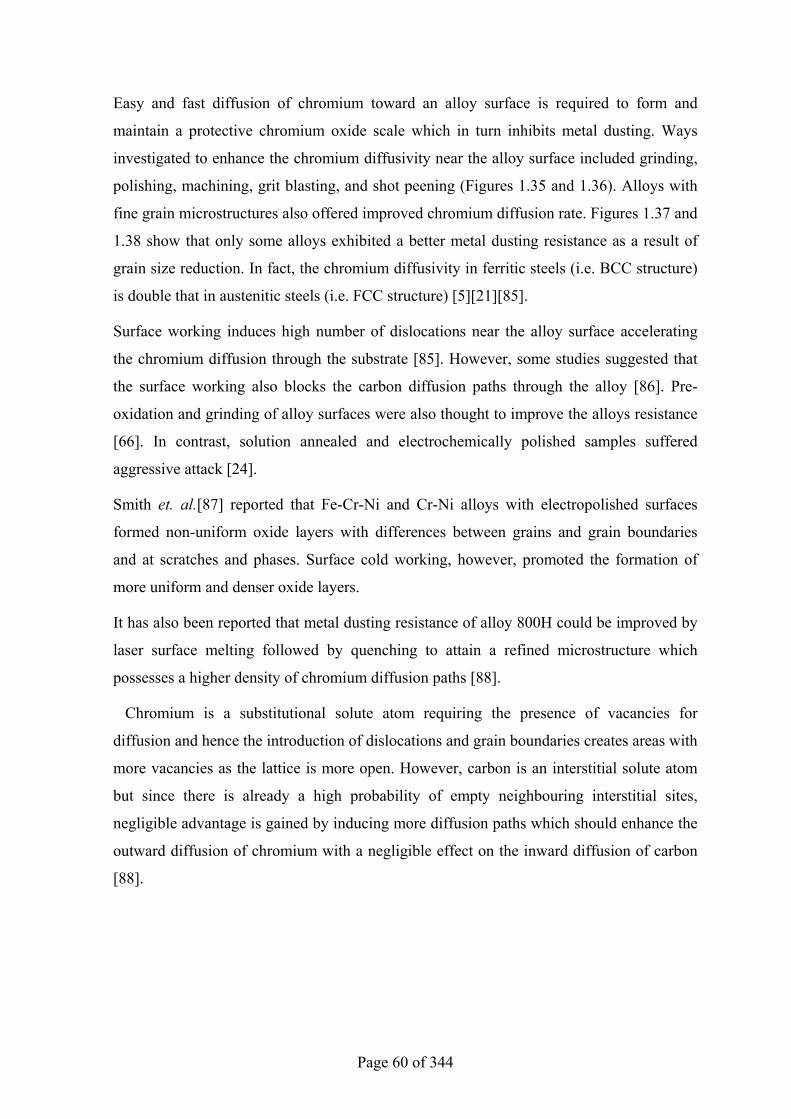
Page 60 of 344
Easy and fast diffusion of chromium toward an alloy surface is required to form and
maintain a protective chromium oxide scale which in turn inhibits metal dusting. Ways
investigated to enhance the chromium diffusivity near the alloy surface included grinding,
polishing, machining, grit blasting, and shot peening (Figures 1.35 and 1.36). Alloys with
fine grain microstructures also offered improved chromium diffusion rate. Figures 1.37 and
1.38 show that only some alloys exhibited a better metal dusting resistance as a result of
grain size reduction. In fact, the chromium diffusivity in ferritic steels (i.e. BCC structure)
is double that in austenitic steels (i.e. FCC structure) [5] [21] [85].
Surface working induces high number of dislocations near the alloy surface accelerating
the chromium diffusion through the substrate [85]. However, some studies suggested that
the surface working also blocks the carbon diffusion paths through the alloy [86]. Pre-
oxidation and grinding of alloy surfaces were also thought to improve the alloys resistance
[66]. In contrast, solution annealed and electrochemically polished samples suffered
aggressive attack [24].
Smith et. al. [87] reported that Fe-Cr-Ni and Cr-Ni alloys with electropolished surfaces
formed non-uniform oxide layers with differences between grains and grain boundaries
and at scratches and phases. Surface cold working, however, promoted the formation of
more uniform and denser oxide layers.
It has also been reported that metal dusting resistance of alloy 800H could be improved by
laser surface melting followed by quenching to attain a refined microstructure which
possesses a higher density of chromium diffusion paths [88].
Chromium is a substitutional solute atom requiring the presence of vacancies for
diffusion and hence the introduction of dislocations and grain boundaries creates areas with
more vacancies as the lattice is more open. However, carbon is an interstitial solute atom
but since there is already a high probability of empty neighbouring interstitial sites,
negligible advantage is gained by inducing more diffusion paths which should enhance the
outward diffusion of chromium with a negligible effect on the inward diffusion of carbon
[88].
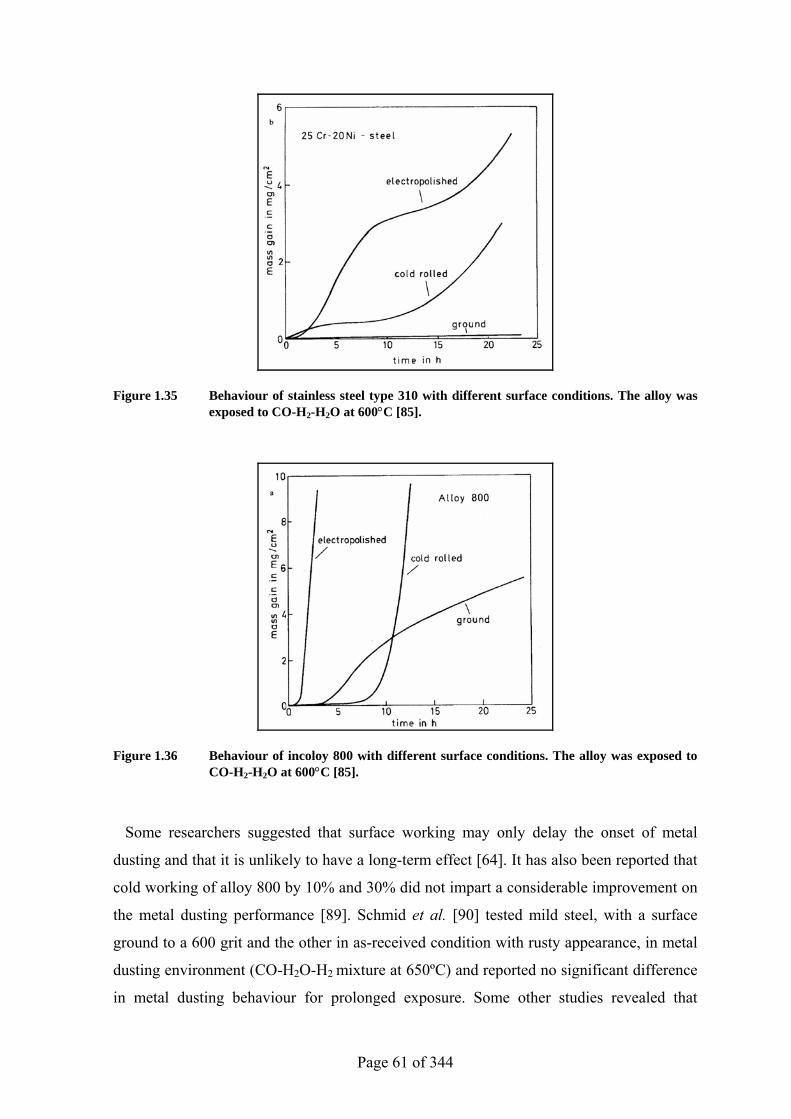
Page 61 of 344
Figure 1.35 Behaviour of stainless steel type 310 with different surface conditions. The alloy was exposed to CO-H2-H2O at 600°C [85].
Figure 1.36 Behaviour of incoloy 800 with different surface conditions. The alloy was exposed to CO-H2-H2O at 600°C [85].
Some researchers suggested that surface working may only delay the onset of metal
dusting and that it is unlikely to have a long-term effect [64]. It has also been reported that
cold working of alloy 800 by 10% and 30% did not impart a considerable improvement on
the metal dusting performance [89]. Schmid et al. [90] tested mild steel, with a surface
ground to a 600 grit and the other in as-received condition with rusty appearance, in metal
dusting environment (CO-H2O-H2 mixture at 650ºC) and reported no significant difference
in metal dusting behaviour for prolonged exposure. Some other studies revealed that
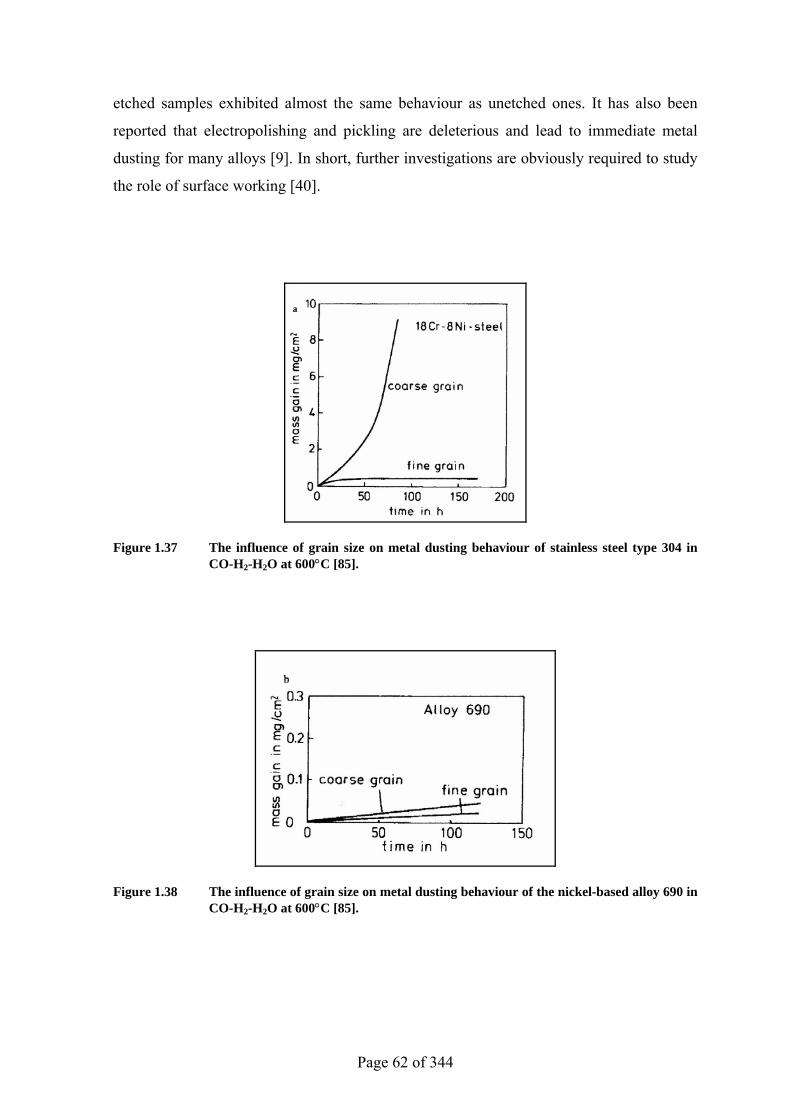
Page 62 of 344
etched samples exhibited almost the same behaviour as unetched ones. It has also been
reported that electropolishing and pickling are deleterious and lead to immediate metal
dusting for many alloys [9]. In short, further investigations are obviously required to study
the role of surface working [40].
Figure 1.37 The influence of grain size on metal dusting behaviour of stainless steel type 304 in CO-H2-H2O at 600°C [85].
Figure 1.38 The influence of grain size on metal dusting behaviour of the nickel-based alloy 690 in CO-H2-H2O at 600°C [85].
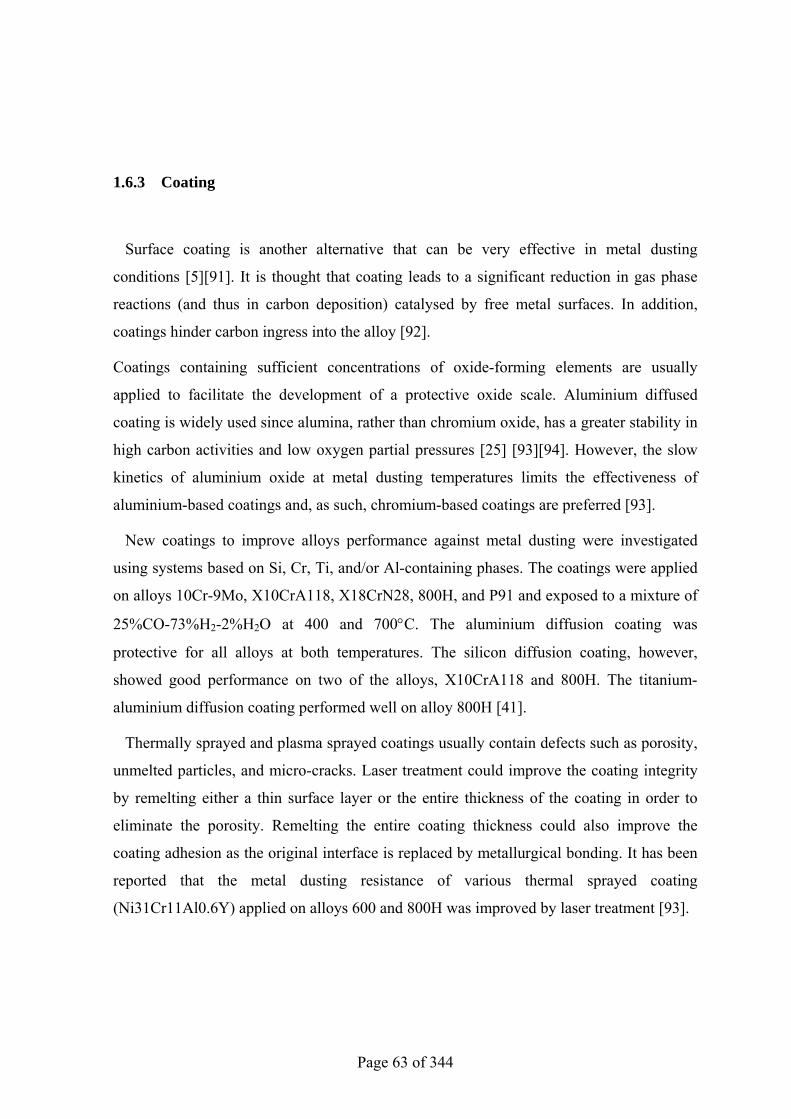
Page 63 of 344
1.6.3 Coating
Surface coating is another alternative that can be very effective in metal dusting
conditions [5] [91]. It is thought that coating leads to a significant reduction in gas phase
reactions (and thus in carbon deposition) catalysed by free metal surfaces. In addition,
coatings hinder carbon ingress into the alloy [92].
Coatings containing sufficient concentrations of oxide-forming elements are usually
applied to facilitate the development of a protective oxide scale. Aluminium diffused
coating is widely used since alumina, rather than chromium oxide, has a greater stability in
high carbon activities and low oxygen partial pressures [25] [93] [94]. However, the slow
kinetics of aluminium oxide at metal dusting temperatures limits the effectiveness of
aluminium-based coatings and, as such, chromium-based coatings are preferred [93].
New coatings to improve alloys performance against metal dusting were investigated
using systems based on Si, Cr, Ti, and/or Al-containing phases. The coatings were applied
on alloys 10Cr-9Mo, X10CrA118, X18CrN28, 800H, and P91 and exposed to a mixture of
25%CO-73%H2-2%H2O at 400 and 700°C. The aluminium diffusion coating was
protective for all alloys at both temperatures. The silicon diffusion coating, however,
showed good performance on two of the alloys, X10CrA118 and 800H. The titanium-
aluminium diffusion coating performed well on alloy 800H [41].
Thermally sprayed and plasma sprayed coatings usually contain defects such as porosity,
unmelted particles, and micro-cracks. Laser treatment could improve the coating integrity
by remelting either a thin surface layer or the entire thickness of the coating in order to
eliminate the porosity. Remelting the entire coating thickness could also improve the
coating adhesion as the original interface is replaced by metallurgical bonding. It has been
reported that the metal dusting resistance of various thermal sprayed coating
(Ni31Cr11Al0.6Y) applied on alloys 600 and 800H was improved by laser treatment [93].
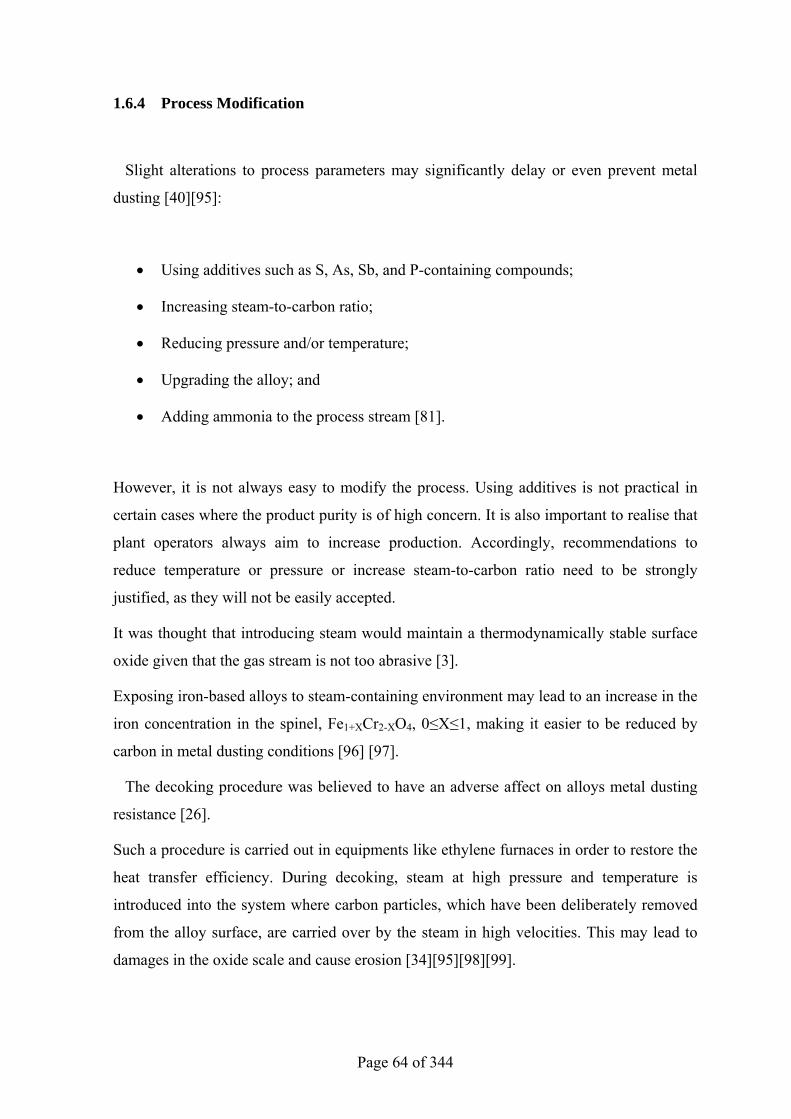
Page 64 of 344
1.6.4 Process Modification
Slight alterations to process parameters may significantly delay or even prevent metal
dusting [40] [95]:
• Using additives such as S, As, Sb, and P-containing compounds;
• Increasing steam-to-carbon ratio;
• Reducing pressure and/or temperature;
• Upgrading the alloy; and
• Adding ammonia to the process stream [81].
However, it is not always easy to modify the process. Using additives is not practical in
certain cases where the product purity is of high concern. It is also important to realise that
plant operators always aim to increase production. Accordingly, recommendations to
reduce temperature or pressure or increase steam-to-carbon ratio need to be strongly
justified, as they will not be easily accepted.
It was thought that introducing steam would maintain a thermodynamically stable surface
oxide given that the gas stream is not too abrasive [3].
Exposing iron-based alloys to steam-containing environment may lead to an increase in the
iron concentration in the spinel, Fe1+XCr2-XO4, 0≤X≤1, making it easier to be reduced by
carbon in metal dusting conditions [96] [97].
The decoking procedure was believed to have an adverse affect on alloys metal dusting
resistance [26].
Such a procedure is carried out in equipments like ethylene furnaces in order to restore the
heat transfer efficiency. During decoking, steam at high pressure and temperature is
introduced into the system where carbon particles, which have been deliberately removed
from the alloy surface, are carried over by the steam in high velocities. This may lead to
damages in the oxide scale and cause erosion [34] [95] [98] [99].
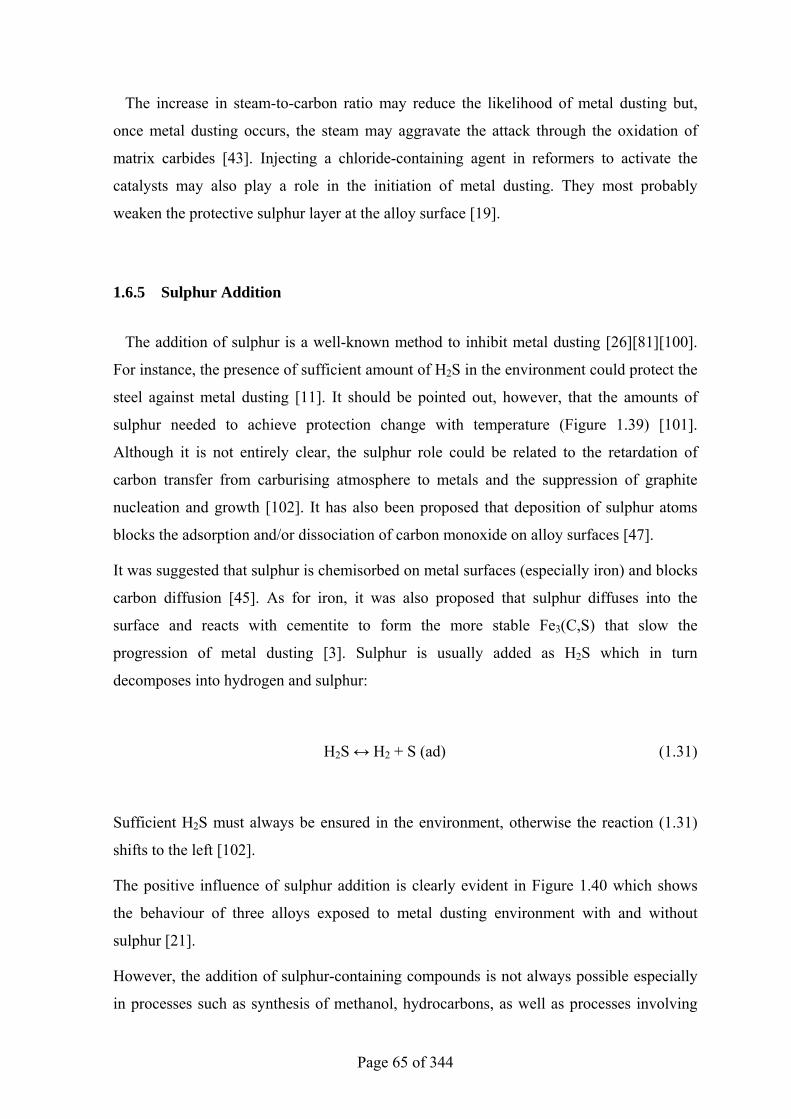
Page 65 of 344
The increase in steam-to-carbon ratio may reduce the likelihood of metal dusting but,
once metal dusting occurs, the steam may aggravate the attack through the oxidation of
matrix carbides [43]. Injecting a chloride-containing agent in reformers to activate the
catalysts may also play a role in the initiation of metal dusting. They most probably
weaken the protective sulphur layer at the alloy surface [19].
1.6.5 Sulphur Addition
The addition of sulphur is a well-known method to inhibit metal dusting [26] [81] [100].
For instance, the presence of sufficient amount of H2S in the environment could protect the
steel against metal dusting [11]. It should be pointed out, however, that the amounts of
sulphur needed to achieve protection change with temperature (Figure 1.39) [101].
Although it is not entirely clear, the sulphur role could be related to the retardation of
carbon transfer from carburising atmosphere to metals and the suppression of graphite
nucleation and growth [102]. It has also been proposed that deposition of sulphur atoms
blocks the adsorption and/or dissociation of carbon monoxide on alloy surfaces [47].
It was suggested that sulphur is chemisorbed on metal surfaces (especially iron) and blocks
carbon diffusion [45]. As for iron, it was also proposed that sulphur diffuses into the
surface and reacts with cementite to form the more stable Fe3(C,S) that slow the
progression of metal dusting [3]. Sulphur is usually added as H2S which in turn
decomposes into hydrogen and sulphur:
H2S ↔ H2 + S (ad) (1.31)
Sufficient H2S must always be ensured in the environment, otherwise the reaction (1.31)
shifts to the left [102].
The positive influence of sulphur addition is clearly evident in Figure 1.40 which shows
the behaviour of three alloys exposed to metal dusting environment with and without
sulphur [21].
However, the addition of sulphur-containing compounds is not always possible especially
in processes such as synthesis of methanol, hydrocarbons, as well as processes involving
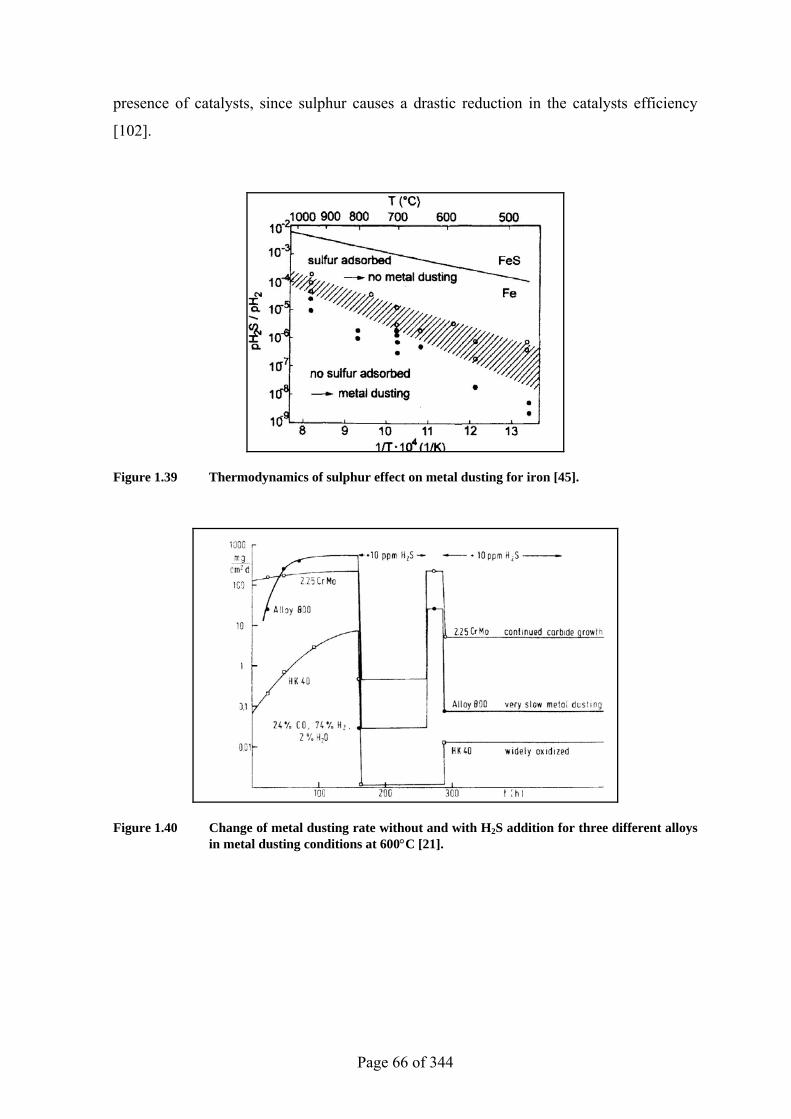
Page 66 of 344
presence of catalysts, since sulphur causes a drastic reduction in the catalysts efficiency
[102].
Figure 1.39 Thermodynamics of sulphur effect on metal dusting for iron [45].
Figure 1.40 Change of metal dusting rate without and with H2S addition for three different alloys in metal dusting conditions at 600°C [21].
Page 67 of 344
2 EXPERIMENTAL PLAN AND METHODOLOGY
2.1 Research Target
The literature survey conducted in Chapter 1 has emphasised that several aspects of
metal dusting are not well understood or agreed upon. Therefore, the main goal of this
research is to gain a better understanding of the metal dusting process through evaluating
and comparing the performance of three, commercially available, heat-resistant alloys in
metal dusting conditions. The reason behind selecting commercial alloys, instead of
models, was to make the project more relevant to plant experience and requirements.
During the study, the alloys were subjected to a carbon-containing gas mixture (80 vol%
CO + 20 vol% H2) at 650, 750, and 850ºC for periods of 100, 500, and 1000 hours.
2.2 Test Alloys
Three heat-resistant alloys had been proposed for the study, namely KHR35C-Hi Si
(HP), KHR45A LC (35Cr-45Ni), and UCX [103] [104] [105]. All were fabricated using
centrifugal casting and have been provided, as tube portions, by the manufacturer; Kubota
Corporation, Japan. The sample chemical compositions as well as dimensions are provided
in Tables 2.1-2.3 below [106]. Microalloying elements had been added, in very small
amounts, to modify the alloys 35Cr-45Ni and UCX but their names and quantities have
been kept confidential by the manufacturer. However, the microstructural analyses
reported in Chapters 3&4 revealed the presence of zirconium, titanium, aluminium, and
nitrogen.
The alloys had been chosen based on their applications and chemical composition, as HP
is an iron-based alloy and 35Cr-45Ni and UCX are nickel-based. Each alloy contains
different concentrations of elements to enable the investigation of their influence on the
alloys’ behaviour in metal dusting conditions. These alloys are currently, widely used in
elevated temperature applications including but not limited to ethylene furnaces, direct
reduction furnaces, steam reformers, and superheater tubes.
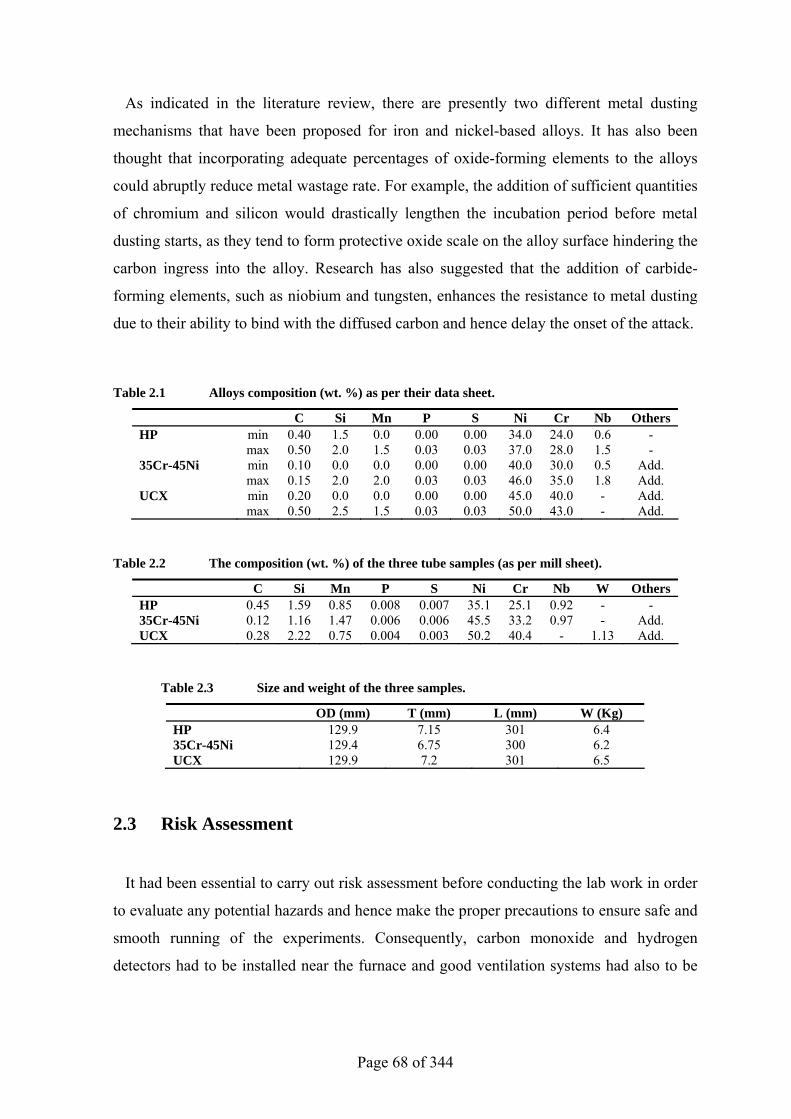
Page 68 of 344
As indicated in the literature review, there are presently two different metal dusting
mechanisms that have been proposed for iron and nickel-based alloys. It has also been
thought that incorporating adequate percentages of oxide-forming elements to the alloys
could abruptly reduce metal wastage rate. For example, the addition of sufficient quantities
of chromium and silicon would drastically lengthen the incubation period before metal
dusting starts, as they tend to form protective oxide scale on the alloy surface hindering the
carbon ingress into the alloy. Research has also suggested that the addition of carbide-
forming elements, such as niobium and tungsten, enhances the resistance to metal dusting
due to their ability to bind with the diffused carbon and hence delay the onset of the attack.
Table 2.1 Alloys composition (wt. %) as per their data sheet.
C Si Mn P S Ni Cr Nb Others HP min 0.40 1.5 0.0 0.00 0.00 34.0 24.0 0.6 - max 0.50 2.0 1.5 0.03 0.03 37.0 28.0 1.5 - 35Cr-45Ni min 0.10 0.0 0.0 0.00 0.00 40.0 30.0 0.5 Add. max 0.15 2.0 2.0 0.03 0.03 46.0 35.0 1.8 Add. UCX min 0.20 0.0 0.0 0.00 0.00 45.0 40.0 - Add. max 0.50 2.5 1.5 0.03 0.03 50.0 43.0 - Add.
Table 2.2 The composition (wt. %) of the three tube samples (as per mill sheet).
C Si Mn P S Ni Cr Nb W Others HP 0.45 1.59 0.85 0.008 0.007 35.1 25.1 0.92 - - 35Cr-45Ni 0.12 1.16 1.47 0.006 0.006 45.5 33.2 0.97 - Add. UCX 0.28 2.22 0.75 0.004 0.003 50.2 40.4 - 1.13 Add.
Table 2.3 Size and weight of the three samples.
OD (mm) T (mm) L (mm) W (Kg) HP 129.9 7.15 301 6.4 35Cr-45Ni 129.4 6.75 300 6.2 UCX 129.9 7.2 301 6.5
2.3 Risk Assessment
It had been essential to carry out risk assessment before conducting the lab work in order
to evaluate any potential hazards and hence make the proper precautions to ensure safe and
smooth running of the experiments. Consequently, carbon monoxide and hydrogen
detectors had to be installed near the furnace and good ventilation systems had also to be
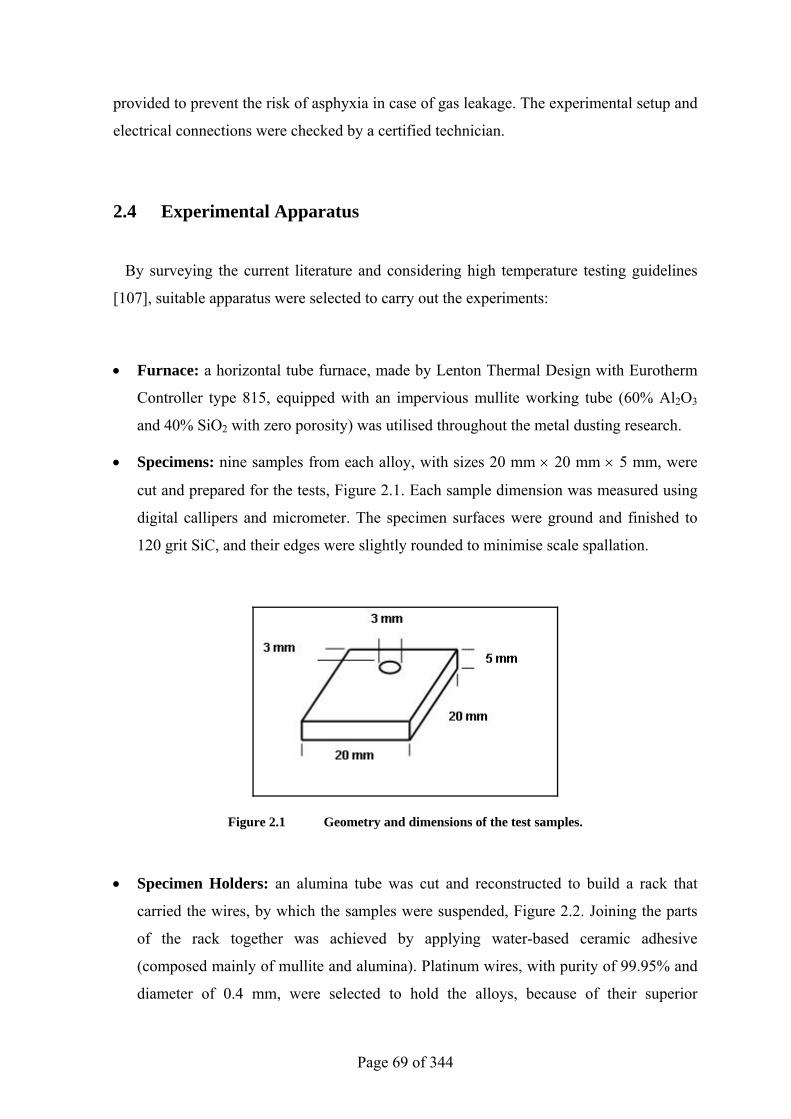
Page 69 of 344
provided to prevent the risk of asphyxia in case of gas leakage. The experimental setup and
electrical connections were checked by a certified technician.
2.4 Experimental Apparatus
By surveying the current literature and considering high temperature testing guidelines
[107], suitable apparatus were selected to carry out the experiments:
• Furnace: a horizontal tube furnace, made by Lenton Thermal Design with Eurotherm
Controller type 815, equipped with an impervious mullite working tube (60% Al2O3
and 40% SiO2 with zero porosity) was utilised throughout the metal dusting research.
• Specimens: nine samples from each alloy, with sizes 20 mm × 20 mm × 5 mm, were
cut and prepared for the tests, Figure 2.1. Each sample dimension was measured using
digital callipers and micrometer. The specimen surfaces were ground and finished to
120 grit SiC, and their edges were slightly rounded to minimise scale spallation.
Figure 2.1 Geometry and dimensions of the test samples.
• Specimen Holders: an alumina tube was cut and reconstructed to build a rack that
carried the wires, by which the samples were suspended, Figure 2.2. Joining the parts
of the rack together was achieved by applying water-based ceramic adhesive
(composed mainly of mullite and alumina). Platinum wires, with purity of 99.95% and
diameter of 0.4 mm, were selected to hold the alloys, because of their superior
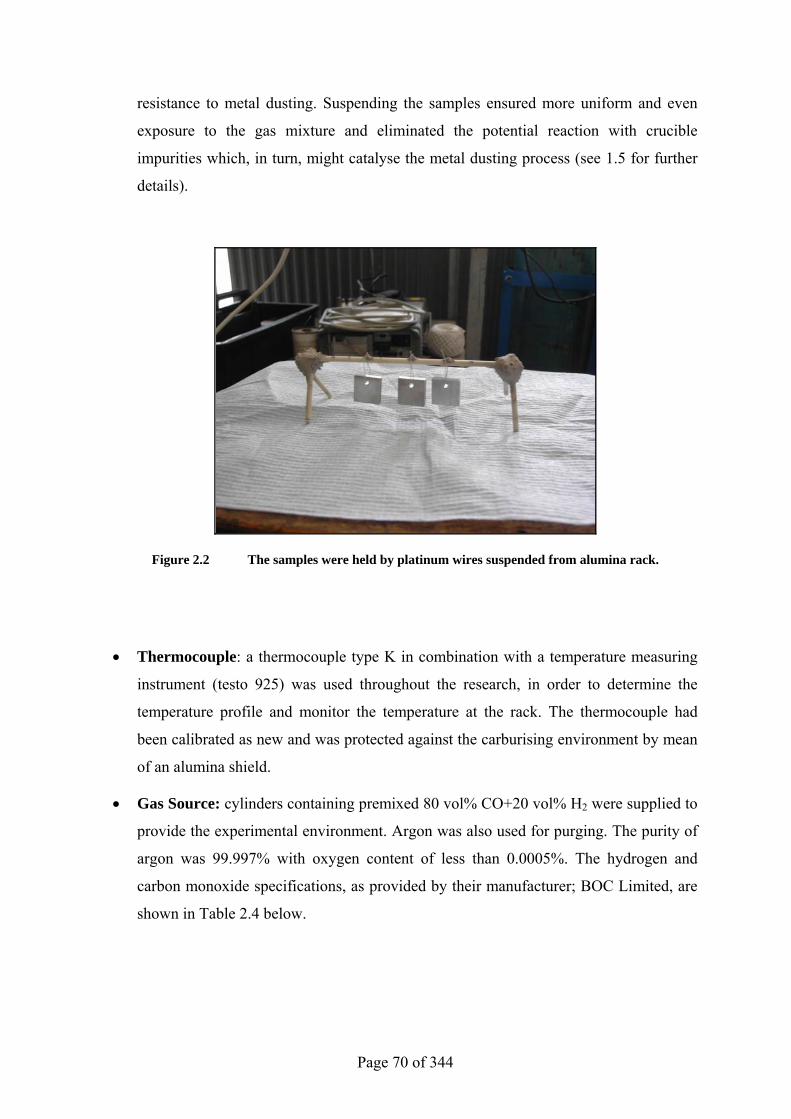
Page 70 of 344
resistance to metal dusting. Suspending the samples ensured more uniform and even
exposure to the gas mixture and eliminated the potential reaction with crucible
impurities which, in turn, might catalyse the metal dusting process (see 1.5 for further
details).
Figure 2.2 The samples were held by platinum wires suspended from alumina rack.
• Thermocouple: a thermocouple type K in combination with a temperature measuring
instrument (testo 925) was used throughout the research, in order to determine the
temperature profile and monitor the temperature at the rack. The thermocouple had
been calibrated as new and was protected against the carburising environment by mean
of an alumina shield.
• Gas Source: cylinders containing premixed 80 vol% CO+20 vol% H2 were supplied to
provide the experimental environment. Argon was also used for purging. The purity of
argon was 99.997% with oxygen content of less than 0.0005%. The hydrogen and
carbon monoxide specifications, as provided by their manufacturer; BOC Limited, are
shown in Table 2.4 below.
Page 71 of 344
Table 2.4 Specifications for H2 and CO used in the experiments. The maximum level of impurities is shown.
Hydrogen (min. purity 99.995%) Carbon monoxide (min. purity 99.9%)
Oxygen 5 ppm Oxygen 50 ppm
Nitrogen 20 ppm Nitrogen 800 ppm
Total Hydrocarbons 5 ppm Total Hydrocarbons 25 ppm
Carbon Dioxides 5 ppm Carbon Dioxides 50 ppm
Water 5 ppm Water 5 ppm
Carbon Monoxide 10 ppm Hydrogen 200 ppm
Carbonyl Sulphide 200 ppb
• Others: valves, fittings, flow meters, and connection (copper tubes with diameter of 4
mm) were installed.
• Experiment Operating Conditions:
o Temperature: 650°C, 750°C, and 850°C;
o Pressure: 1.0atm;
o Gas Flow Rate: 100cm3 min-1;
o Exposure Times: 100, 500, and 1,000hours.
2.5 Experimental Procedure
Bearing in mind the best practices stated in the literature [107], the experiments were
conducted according to the following steps:
• Firstly, the temperature profiling was carried out in order to determine the hot zone
within the tube, at temperatures set to 650, 750, and 850ºC. The maximum air
temperatures measured were 656, 749, and 846 respectively, and the hot zone was
eventually located 55cm from the tube inlet. Despite setting the furnace to heat in the
rate 100ºC per minute, it took 30, 35, and 40 minutes to reach 650, 750, and 850ºC
respectively. However, it needed much longer time to cool down. More details of the
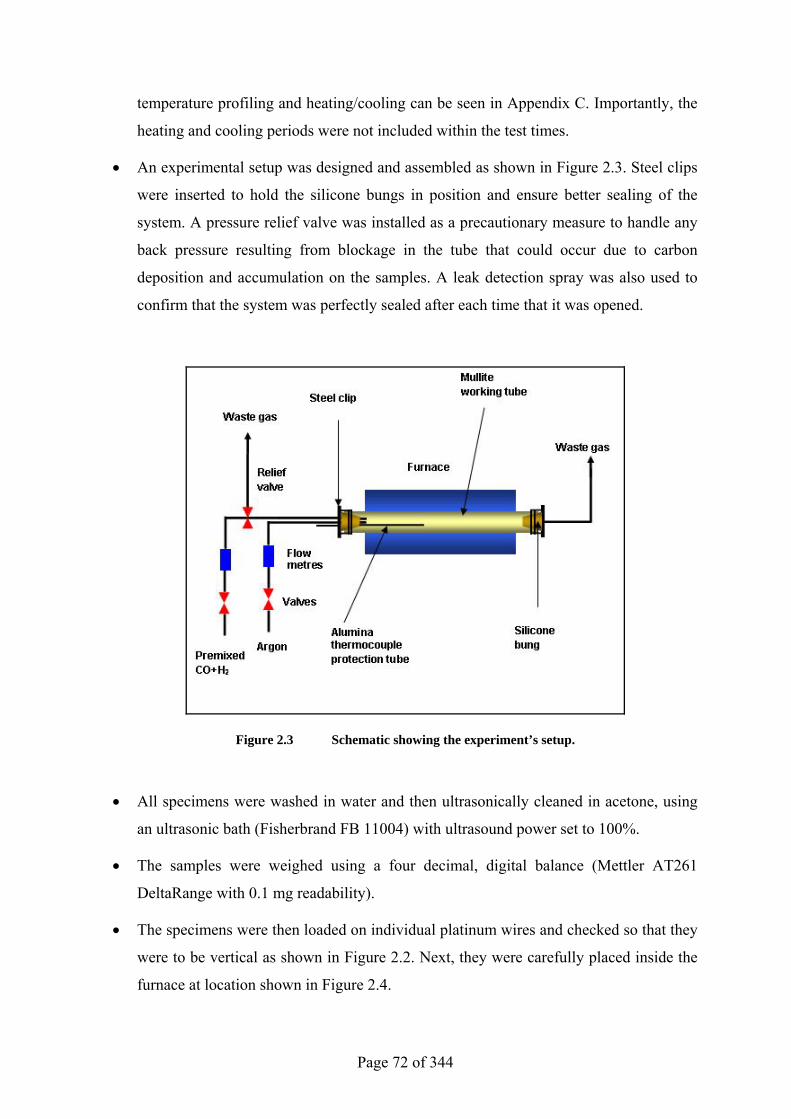
Page 72 of 344
temperature profiling and heating/cooling can be seen in Appendix C. Importantly, the
heating and cooling periods were not included within the test times.
• An experimental setup was designed and assembled as shown in Figure 2.3. Steel clips
were inserted to hold the silicone bungs in position and ensure better sealing of the
system. A pressure relief valve was installed as a precautionary measure to handle any
back pressure resulting from blockage in the tube that could occur due to carbon
deposition and accumulation on the samples. A leak detection spray was also used to
confirm that the system was perfectly sealed after each time that it was opened.
Figure 2.3 Schematic showing the experiment’s setup.
• All specimens were washed in water and then ultrasonically cleaned in acetone, using
an ultrasonic bath (Fisherbrand FB 11004) with ultrasound power set to 100%.
• The samples were weighed using a four decimal, digital balance (Mettler AT261
DeltaRange with 0.1 mg readability).
• The specimens were then loaded on individual platinum wires and checked so that they
were to be vertical as shown in Figure 2.2. Next, they were carefully placed inside the
furnace at location shown in Figure 2.4.
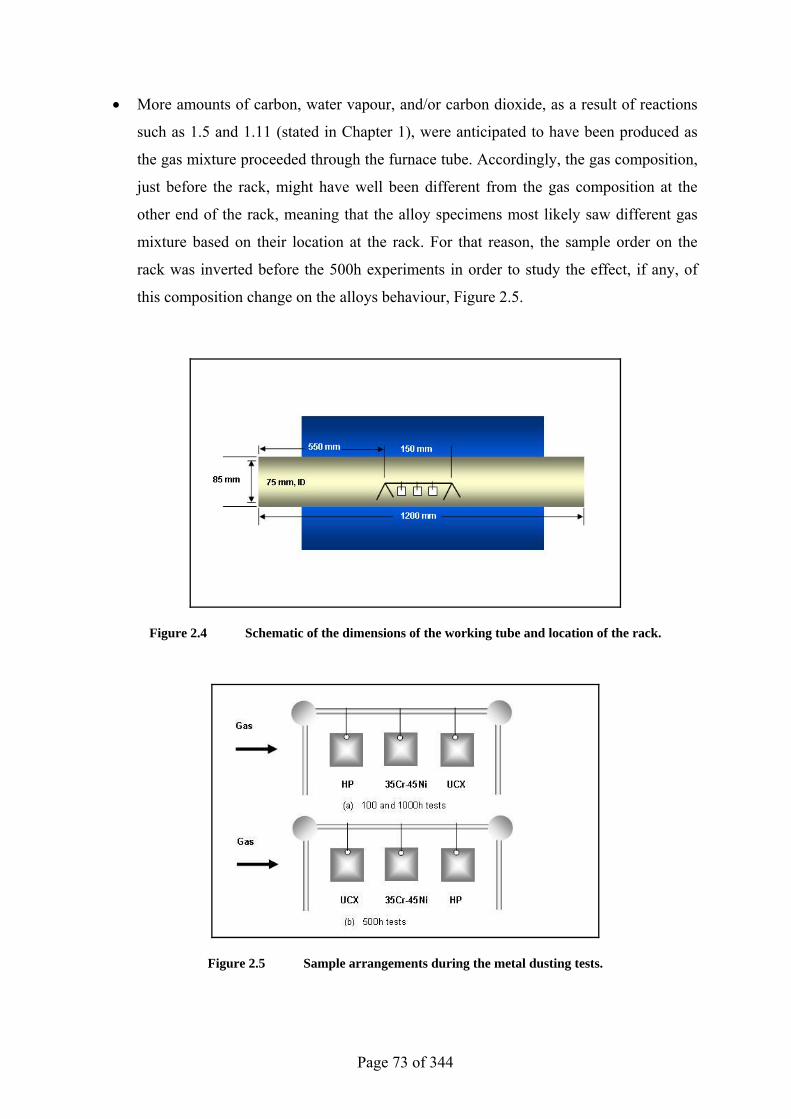
Page 73 of 344
• More amounts of carbon, water vapour, and/or carbon dioxide, as a result of reactions
such as 1.5 and 1.11 (stated in Chapter 1), were anticipated to have been produced as
the gas mixture proceeded through the furnace tube. Accordingly, the gas composition,
just before the rack, might have well been different from the gas composition at the
other end of the rack, meaning that the alloy specimens most likely saw different gas
mixture based on their location at the rack. For that reason, the sample order on the
rack was inverted before the 500h experiments in order to study the effect, if any, of
this composition change on the alloys behaviour, Figure 2.5.
Figure 2.4 Schematic of the dimensions of the working tube and location of the rack.
Figure 2.5 Sample arrangements during the metal dusting tests.
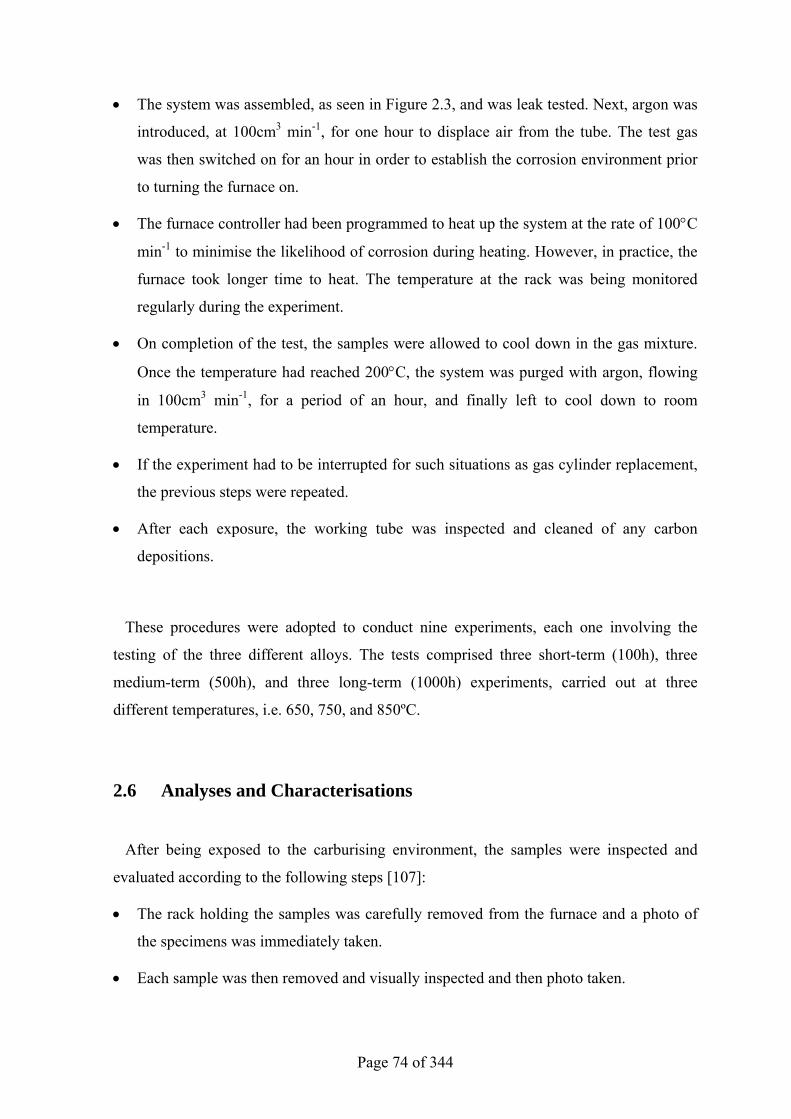
Page 74 of 344
• The system was assembled, as seen in Figure 2.3, and was leak tested. Next, argon was
introduced, at 100cm3 min-1, for one hour to displace air from the tube. The test gas
was then switched on for an hour in order to establish the corrosion environment prior
to turning the furnace on.
• The furnace controller had been programmed to heat up the system at the rate of 100°C
min-1 to minimise the likelihood of corrosion during heating. However, in practice, the
furnace took longer time to heat. The temperature at the rack was being monitored
regularly during the experiment.
• On completion of the test, the samples were allowed to cool down in the gas mixture.
Once the temperature had reached 200°C, the system was purged with argon, flowing
in 100cm3 min-1, for a period of an hour, and finally left to cool down to room
temperature.
• If the experiment had to be interrupted for such situations as gas cylinder replacement,
the previous steps were repeated.
• After each exposure, the working tube was inspected and cleaned of any carbon
depositions.
These procedures were adopted to conduct nine experiments, each one involving the
testing of the three different alloys. The tests comprised three short-term (100h), three
medium-term (500h), and three long-term (1000h) experiments, carried out at three
different temperatures, i.e. 650, 750, and 850ºC.
2.6 Analyses and Characterisations
After being exposed to the carburising environment, the samples were inspected and
evaluated according to the following steps [107]:
• The rack holding the samples was carefully removed from the furnace and a photo of
the specimens was immediately taken.
• Each sample was then removed and visually inspected and then photo taken.
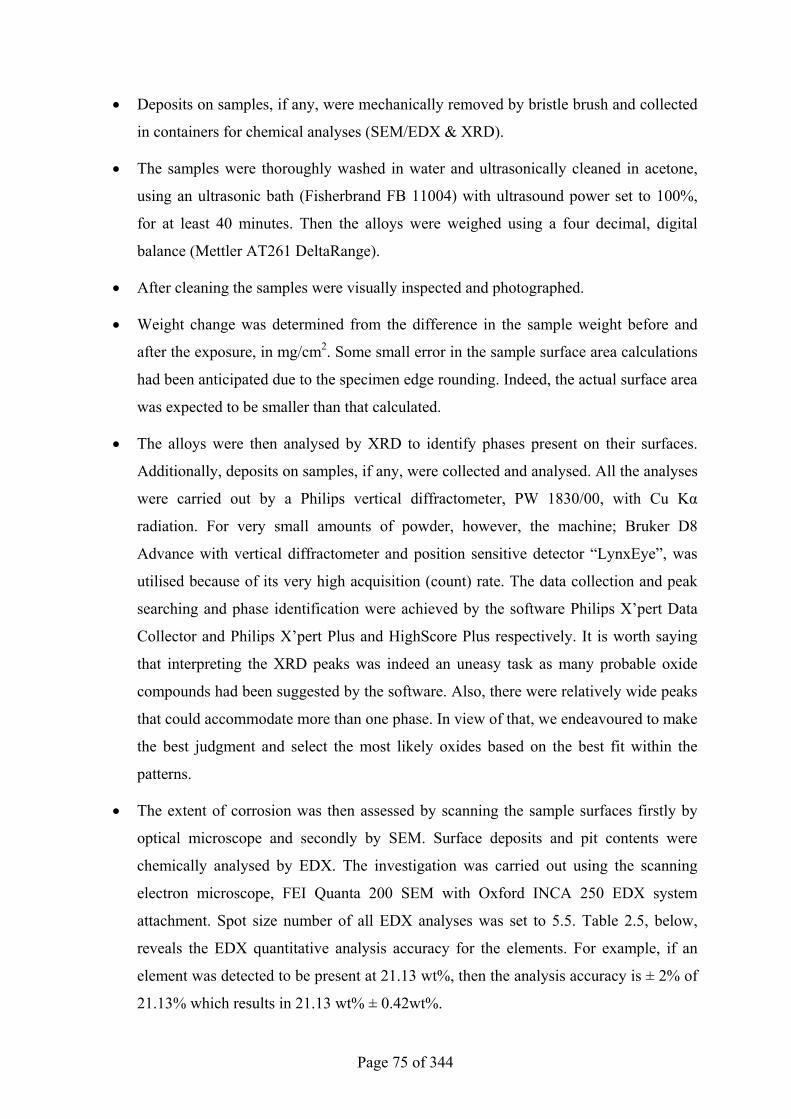
Page 75 of 344
• Deposits on samples, if any, were mechanically removed by bristle brush and collected
in containers for chemical analyses (SEM/EDX & XRD).
• The samples were thoroughly washed in water and ultrasonically cleaned in acetone,
using an ultrasonic bath (Fisherbrand FB 11004) with ultrasound power set to 100%,
for at least 40 minutes. Then the alloys were weighed using a four decimal, digital
balance (Mettler AT261 DeltaRange).
• After cleaning the samples were visually inspected and photographed.
• Weight change was determined from the difference in the sample weight before and
after the exposure, in mg/cm2. Some small error in the sample surface area calculations
had been anticipated due to the specimen edge rounding. Indeed, the actual surface area
was expected to be smaller than that calculated.
• The alloys were then analysed by XRD to identify phases present on their surfaces.
Additionally, deposits on samples, if any, were collected and analysed. All the analyses
were carried out by a Philips vertical diffractometer, PW 1830/00, with Cu Kα
radiation. For very small amounts of powder, however, the machine; Bruker D8
Advance with vertical diffractometer and position sensitive detector “LynxEye”, was
utilised because of its very high acquisition (count) rate. The data collection and peak
searching and phase identification were achieved by the software Philips X’pert Data
Collector and Philips X’pert Plus and HighScore Plus respectively. It is worth saying
that interpreting the XRD peaks was indeed an uneasy task as many probable oxide
compounds had been suggested by the software. Also, there were relatively wide peaks
that could accommodate more than one phase. In view of that, we endeavoured to make
the best judgment and select the most likely oxides based on the best fit within the
patterns.
• The extent of corrosion was then assessed by scanning the sample surfaces firstly by
optical microscope and secondly by SEM. Surface deposits and pit contents were
chemically analysed by EDX. The investigation was carried out using the scanning
electron microscope, FEI Quanta 200 SEM with Oxford INCA 250 EDX system
attachment. Spot size number of all EDX analyses was set to 5.5. Table 2.5, below,
reveals the EDX quantitative analysis accuracy for the elements. For example, if an
element was detected to be present at 21.13 wt%, then the analysis accuracy is ± 2% of
21.13% which results in 21.13 wt% ± 0.42wt%.
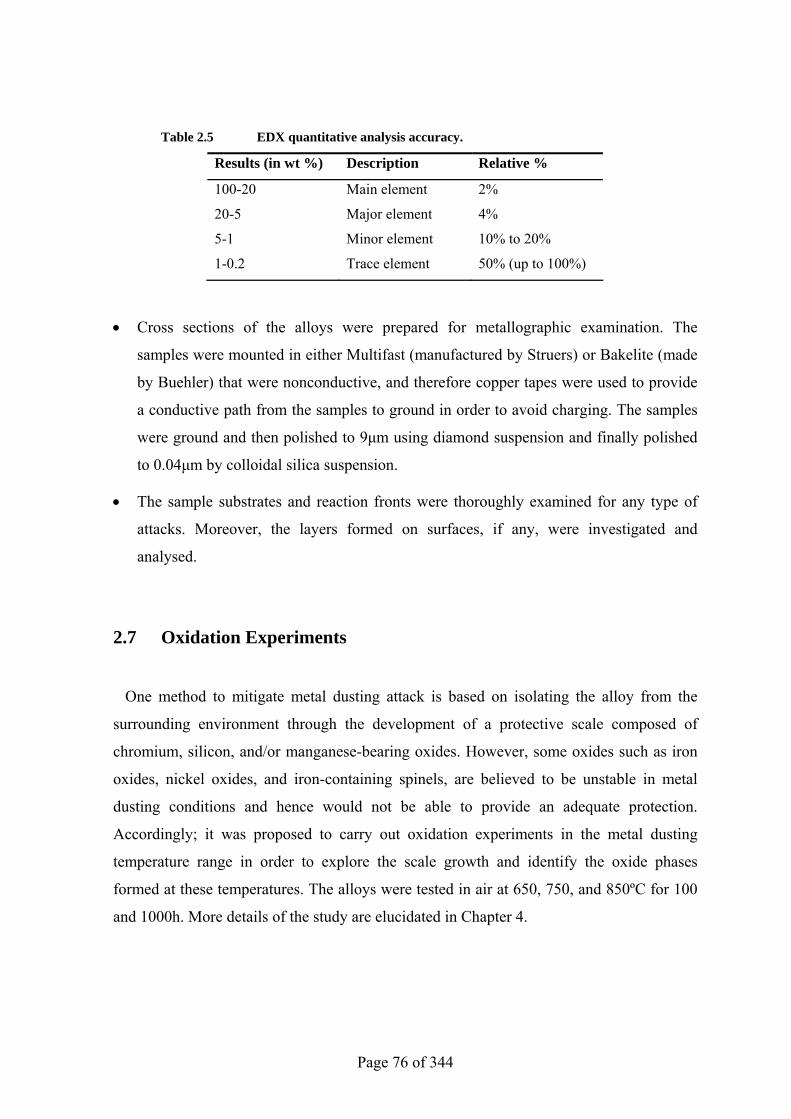
Page 76 of 344
Table 2.5 EDX quantitative analysis accuracy.
Results (in wt %) Description Relative %
100-20 Main element 2%
20-5 Major element 4%
5-1 Minor element 10% to 20%
1-0.2 Trace element 50% (up to 100%)
• Cross sections of the alloys were prepared for metallographic examination. The
samples were mounted in either Multifast (manufactured by Struers) or Bakelite (made
by Buehler) that were nonconductive, and therefore copper tapes were used to provide
a conductive path from the samples to ground in order to avoid charging. The samples
were ground and then polished to 9µm using diamond suspension and finally polished
to 0.04µm by colloidal silica suspension.
• The sample substrates and reaction fronts were thoroughly examined for any type of
attacks. Moreover, the layers formed on surfaces, if any, were investigated and
analysed.
2.7 Oxidation Experiments
One method to mitigate metal dusting attack is based on isolating the alloy from the
surrounding environment through the development of a protective scale composed of
chromium, silicon, and/or manganese-bearing oxides. However, some oxides such as iron
oxides, nickel oxides, and iron-containing spinels, are believed to be unstable in metal
dusting conditions and hence would not be able to provide an adequate protection.
Accordingly; it was proposed to carry out oxidation experiments in the metal dusting
temperature range in order to explore the scale growth and identify the oxide phases
formed at these temperatures. The alloys were tested in air at 650, 750, and 850ºC for 100
and 1000h. More details of the study are elucidated in Chapter 4.
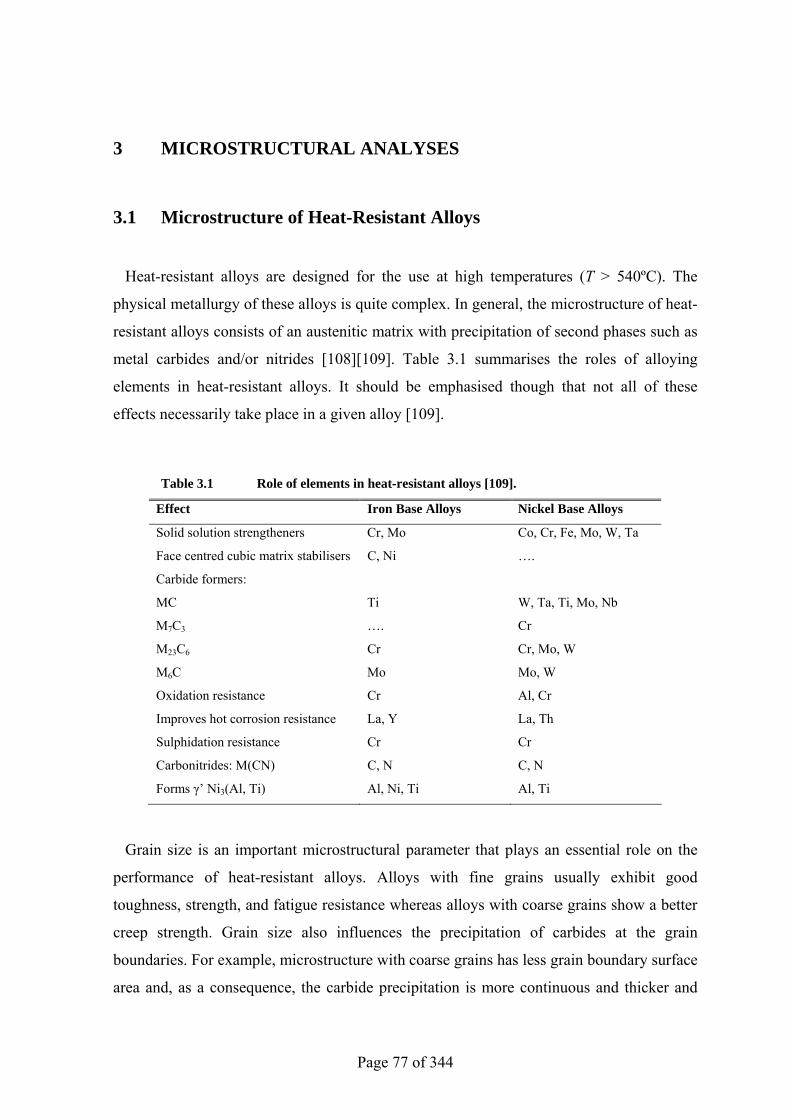
Page 77 of 344
3 MICROSTRUCTURAL ANALYSES
3.1 Microstructure of Heat-Resistant Alloys
Heat-resistant alloys are designed for the use at high temperatures (T > 540ºC). The
physical metallurgy of these alloys is quite complex. In general, the microstructure of heat-
resistant alloys consists of an austenitic matrix with precipitation of second phases such as
metal carbides and/or nitrides [108] [109]. Table 3.1 summarises the roles of alloying
elements in heat-resistant alloys. It should be emphasised though that not all of these
effects necessarily take place in a given alloy [109].
Table 3.1 Role of elements in heat-resistant alloys [109].
Effect Iron Base Alloys Nickel Base Alloys
Solid solution strengtheners Cr, Mo Co, Cr, Fe, Mo, W, Ta
Face centred cubic matrix stabilisers C, Ni ….
Carbide formers:
MC
M7C3
M23C6
M6C
Ti
….
Cr
Mo
W, Ta, Ti, Mo, Nb
Cr
Cr, Mo, W
Mo, W
Oxidation resistance Cr Al, Cr
Improves hot corrosion resistance La, Y La, Th
Sulphidation resistance Cr Cr
Carbonitrides: M(CN) C, N C, N
Forms γ’ Ni3(Al, Ti) Al, Ni, Ti Al, Ti
Grain size is an important microstructural parameter that plays an essential role on the
performance of heat-resistant alloys. Alloys with fine grains usually exhibit good
toughness, strength, and fatigue resistance whereas alloys with coarse grains show a better
creep strength. Grain size also influences the precipitation of carbides at the grain
boundaries. For example, microstructure with coarse grains has less grain boundary surface
area and, as a consequence, the carbide precipitation is more continuous and thicker and
Page 78 of 344
that may lead to a significant degradation in the alloy properties. Hence, a uniform
intermediate grain size is generally preferred [109].
Metal carbide might be regarded as the most important second phase precipitated in heat-
resistant alloys. Carbides precipitated at the grain boundaries improve the alloys strength,
prevent grain boundaries sliding, and permit stress relaxation. Moreover, the formation of
fine carbides within the matrix results in alloy strengthening [109].
Carbides can be categorised as primary and secondary where the formers are precipitated
during the solidification process and distributed at the dendrite and grain boundaries. The
primary carbides are very effective in preventing grain boundaries sliding. The secondary
carbides start to form once the alloy is introduced to elevated temperature service and they
are precipitated heterogeneously within the dendrites and at the grain boundaries.
Secondary carbides precipitation is also desired in order to hinder the motion of
dislocations during high temperature exposures [110].
Carbide growth and morphology are time and temperature dependents. The carbides tend
to coarsen and coalescence as a result of increasing temperature and time. In general, the
useful life of heat-resistant alloys is significantly influenced by the carbide size and shape.
The carbides growth with time results in a gradual degradation of the alloy properties until
a stage where the alloy cannot function at the operating condition any longer. In other
words, once the carbides reach a critical size, their interaction with dislocations becomes
less effective and the alloy consequently loses its strength. The critical size of the carbides
may vary from one alloy to another depending on the ductility of the alloy [111].
3.2 Objective
Metallographic examination was carried out in order to investigate the microstructure of
virgin samples of alloys HP, 35Cr-45Ni, and UCX. Phases observed in the microstructures
were also analysed by EDX. Additionally, the microstructural change of the alloys after
exposures for 100, 500, and 1000h is reported in Appendix A. Sample preparation and
characterisation procedures are given in Chapter 2.
Page 79 of 344
3.3 Metallographic Examination
3.3.1 HP
Most of the phases present in the microstructure of heat-resistant alloys (e.g. carbides and
nitrides) are readily observed without etching [109].
The microstructure of alloy HP is composed of an austenitic matrix containing a complex
network of carbides that outlines the boundaries of the original dendrites (Figure 3.1). It is
generally characterised by the equiaxed grain shape.
EDX of the phases observed on the microstructure is shown in Figure 3.2. Chromium was
the main constituent of the dark grey precipitate (A1) confirming it to be chromium
carbides. The whitish phase (A2), however, was found to be niobium-based carbide. The
composition of the base metal was also confirmed (A3).
Going through all EDX analyses done on the alloy after different exposures (Appendix A),
Y and N were detected in some of the niobium-based carbides in considerable
concentrations (0.7 and 2.6 wt% respectively). Moreover, introducing the alloy to the high
temperature environments resulted in the precipitation of secondary carbides across the
matrix. More carbide precipitation was observed as the temperature and/or time were
increased. Also, a transformation of niobium carbides into niobium, nickel, and silicon-rich
phase appeared to have occurred on the samples exposed at 850ºC for 500 and 1000h. In
the former, the weight percentages of Nb, Ni, and Si were 30.6, 48.4, and 10.4
respectively; whilst, in the latter, the amounts were 49.6, 31.3, and 6.7 respectively. Some
transformation was also observed in the alloy exposed for 500h at 750ºC.
It seemed that the niobium carbides transformed partially into the intermetallic nickel-
niobium silicide (Ni16Nb6Si7), also known as G-phase. It has been reported that the
formation of G-phase improved the high temperature performance of the alloys but,
nonetheless, resulted in an extreme brittleness at ambient temperature not to mention the
poor weldability [112] [113].
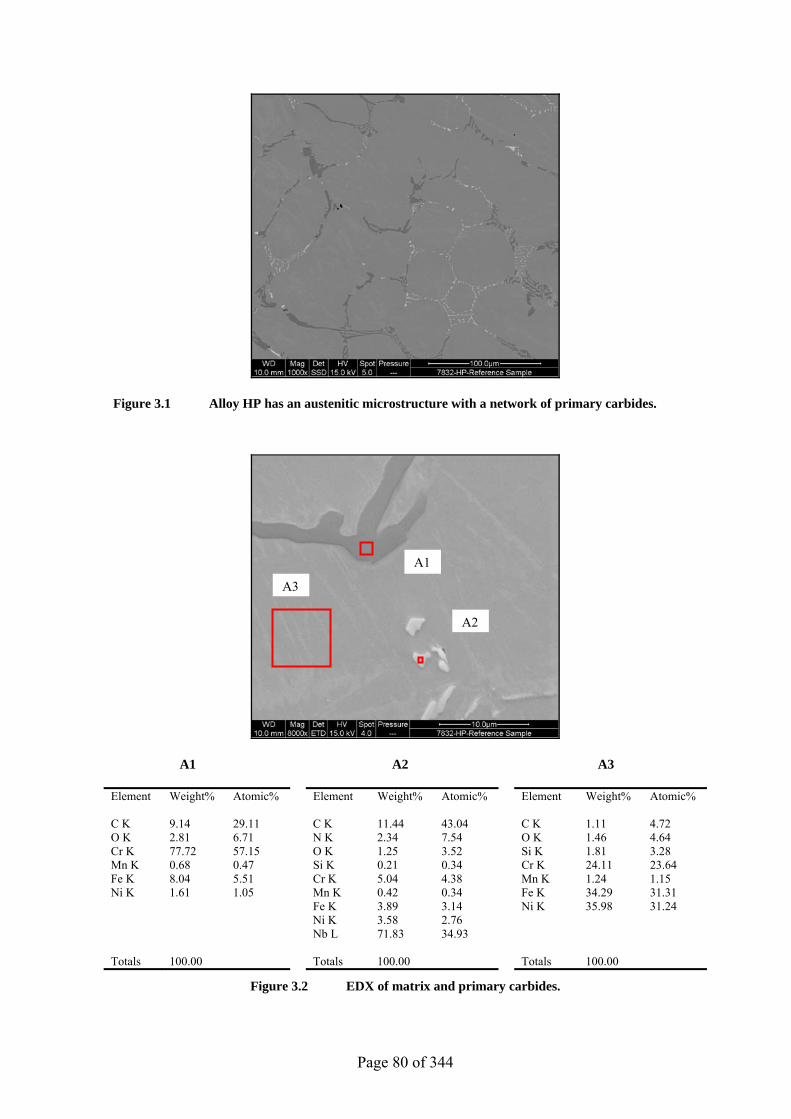
Page 80 of 344
Figure 3.1 Alloy HP has an austenitic microstructure with a network of primary carbides.
A1 A2 A3
Element Weight% Atomic% Element Weight% Atomic% Element Weight% Atomic% C K 9.14 29.11 C K 11.44 43.04 C K 1.11 4.72 O K 2.81 6.71 N K 2.34 7.54 O K 1.46 4.64 Cr K 77.72 57.15 O K 1.25 3.52 Si K 1.81 3.28 Mn K 0.68 0.47 Si K 0.21 0.34 Cr K 24.11 23.64 Fe K 8.04 5.51 Cr K 5.04 4.38 Mn K 1.24 1.15 Ni K 1.61 1.05 Mn K 0.42 0.34 Fe K 34.29 31.31 Fe K 3.89 3.14 Ni K 35.98 31.24 Ni K 3.58 2.76 Nb L 71.83 34.93 Totals 100.00 Totals 100.00 Totals 100.00
Figure 3.2 EDX of matrix and primary carbides.
A1
A2
A3
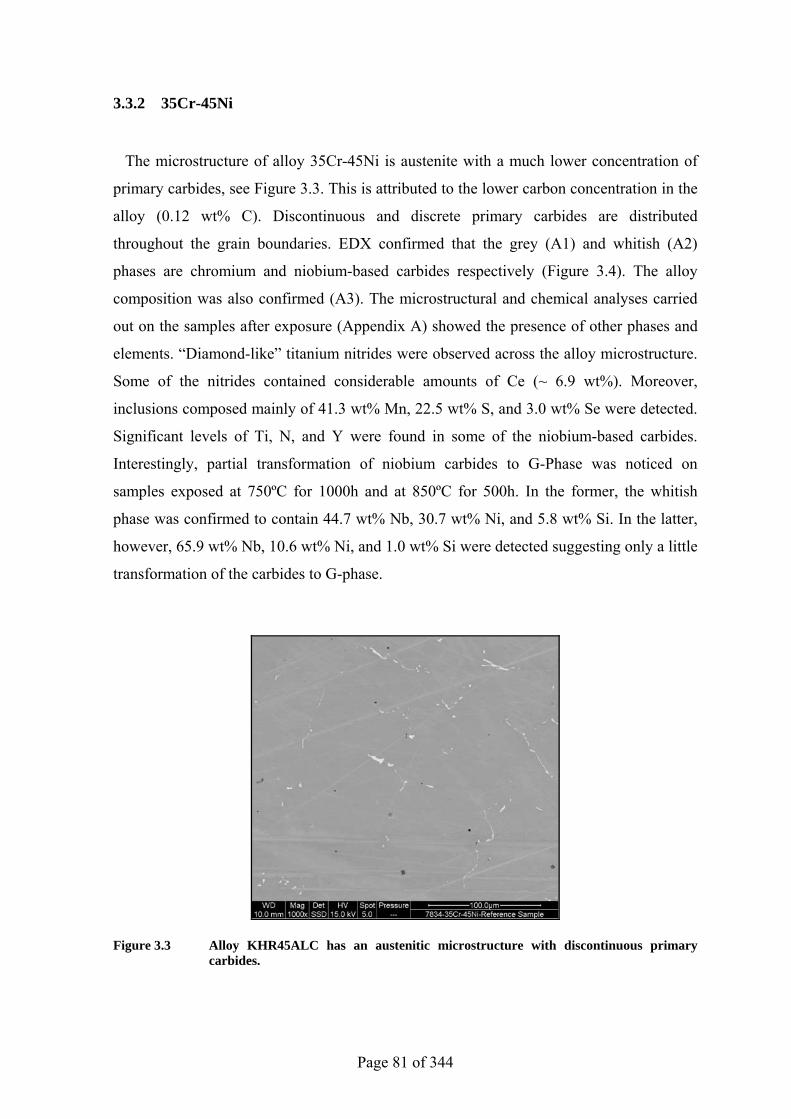
Page 81 of 344
3.3.2 35Cr-45Ni
The microstructure of alloy 35Cr-45Ni is austenite with a much lower concentration of
primary carbides, see Figure 3.3. This is attributed to the lower carbon concentration in the
alloy (0.12 wt% C). Discontinuous and discrete primary carbides are distributed
throughout the grain boundaries. EDX confirmed that the grey (A1) and whitish (A2)
phases are chromium and niobium-based carbides respectively (Figure 3.4). The alloy
composition was also confirmed (A3). The microstructural and chemical analyses carried
out on the samples after exposure (Appendix A) showed the presence of other phases and
elements. “Diamond-like” titanium nitrides were observed across the alloy microstructure.
Some of the nitrides contained considerable amounts of Ce (~ 6.9 wt%). Moreover,
inclusions composed mainly of 41.3 wt% Mn, 22.5 wt% S, and 3.0 wt% Se were detected.
Significant levels of Ti, N, and Y were found in some of the niobium-based carbides.
Interestingly, partial transformation of niobium carbides to G-Phase was noticed on
samples exposed at 750ºC for 1000h and at 850ºC for 500h. In the former, the whitish
phase was confirmed to contain 44.7 wt% Nb, 30.7 wt% Ni, and 5.8 wt% Si. In the latter,
however, 65.9 wt% Nb, 10.6 wt% Ni, and 1.0 wt% Si were detected suggesting only a little
transformation of the carbides to G-phase.
Figure 3.3 Alloy KHR45ALC has an austenitic microstructure with discontinuous primary carbides.
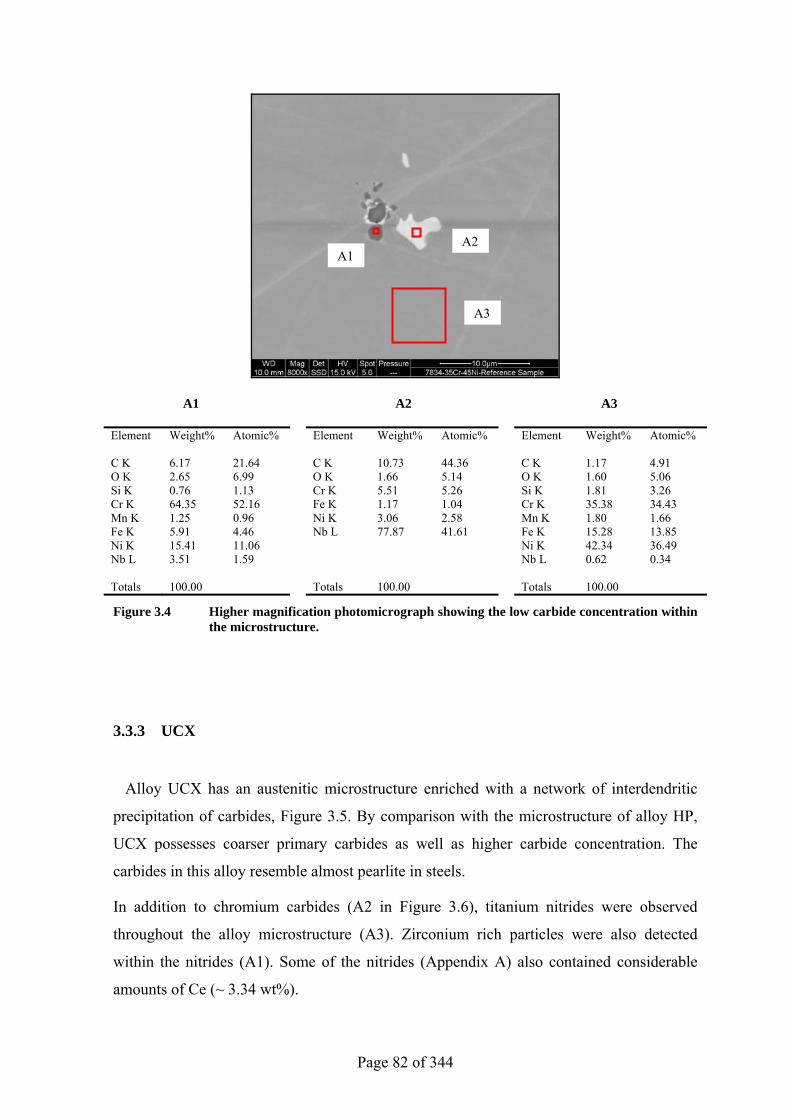
Page 82 of 344
A1 A2 A3
Element Weight% Atomic% Element Weight% Atomic% Element Weight% Atomic% C K 6.17 21.64 C K 10.73 44.36 C K 1.17 4.91 O K 2.65 6.99 O K 1.66 5.14 O K 1.60 5.06 Si K 0.76 1.13 Cr K 5.51 5.26 Si K 1.81 3.26 Cr K 64.35 52.16 Fe K 1.17 1.04 Cr K 35.38 34.43 Mn K 1.25 0.96 Ni K 3.06 2.58 Mn K 1.80 1.66 Fe K 5.91 4.46 Nb L 77.87 41.61 Fe K 15.28 13.85 Ni K 15.41 11.06 Ni K 42.34 36.49 Nb L 3.51 1.59 Nb L 0.62 0.34 Totals 100.00 Totals 100.00 Totals 100.00
Figure 3.4 Higher magnification photomicrograph showing the low carbide concentration within the microstructure.
3.3.3 UCX
Alloy UCX has an austenitic microstructure enriched with a network of interdendritic
precipitation of carbides, Figure 3.5. By comparison with the microstructure of alloy HP,
UCX possesses coarser primary carbides as well as higher carbide concentration. The
carbides in this alloy resemble almost pearlite in steels.
In addition to chromium carbides (A2 in Figure 3.6), titanium nitrides were observed
throughout the alloy microstructure (A3). Zirconium rich particles were also detected
within the nitrides (A1). Some of the nitrides (Appendix A) also contained considerable
amounts of Ce (~ 3.34 wt%).
A1A2
A3
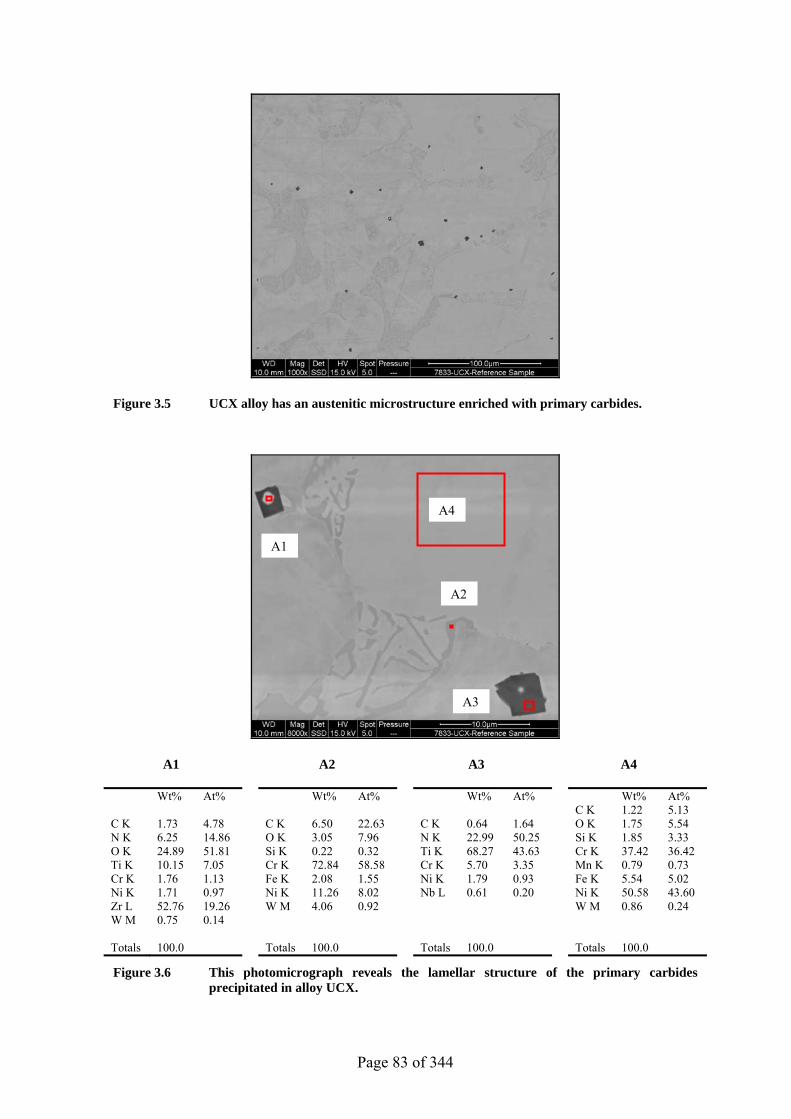
Page 83 of 344
Figure 3.5 UCX alloy has an austenitic microstructure enriched with primary carbides.
A1 A2 A3 A4
Wt% At% Wt% At% Wt% At% Wt% At% C K 1.22 5.13 C K 1.73 4.78 C K 6.50 22.63 C K 0.64 1.64 O K 1.75 5.54 N K 6.25 14.86 O K 3.05 7.96 N K 22.99 50.25 Si K 1.85 3.33 O K 24.89 51.81 Si K 0.22 0.32 Ti K 68.27 43.63 Cr K 37.42 36.42 Ti K 10.15 7.05 Cr K 72.84 58.58 Cr K 5.70 3.35 Mn K 0.79 0.73 Cr K 1.76 1.13 Fe K 2.08 1.55 Ni K 1.79 0.93 Fe K 5.54 5.02 Ni K 1.71 0.97 Ni K 11.26 8.02 Nb L 0.61 0.20 Ni K 50.58 43.60 Zr L 52.76 19.26 W M 4.06 0.92 W M 0.86 0.24 W M 0.75 0.14 Totals 100.0 Totals 100.0 Totals 100.0 Totals 100.0
Figure 3.6 This photomicrograph reveals the lamellar structure of the primary carbides precipitated in alloy UCX.
A1
A2
A3
A4
Page 84 of 344
3.4 Conclusion
In general, carbides are deliberately precipitated in heat-resistant alloys to improve their
high temperature strength. The microstructures of cast heat-resistant alloys are austenitic
and characterised by the presence of interdendritc primary carbides in different
concentration, shape, and distribution. Unlike wrought alloys, these alloys have coarser
grains and contain alloy segregation (inhomogeneous microstructure). Furthermore, casting
alloys have equal properties in all directions [114] [115].
EDX confirmed that all alloys contained additives of rare earth elements (e.g. Y and Ce).
Furthermore, nitrides of Ti and Zr were also detected on 35Cr-45Ni and UCX. It was also
evident that introducing the alloys to the high temperature environments led to
precipitation and growth of secondary carbides within the matrix and at the grain
boundaries. Increasing the exposure temperature and/or time obviously caused more
formation of carbides. Also, a transformation of the niobium-based carbides to G-phase in
HP and 35Cr-45Ni was also observed. HP experienced that transformation after 500 and
1000h at 850ºC and after 500h at 750ºC whereas 35Cr-45Ni showed transformation after
1000h at 750ºC and after 500h at 850ºC.
Page 85 of 344
4 OXIDATION OF HEAT-RESISTANT ALLOYS
Most alloys rely on the development of protective oxide scales to perform in a
satisfactory manner at high temperatures. The scale acts as a barrier between the
environment and the alloy in order to meet the requirements of the desired life time of the
equipment. Not all oxide layers are protective and therefore alloys are carefully designed to
form such protective scales as chromium, aluminium and/or silicon oxides. In addition to
the scale composition and morphology, the protectiveness of the oxide scales depends
strongly on several factors including pressure, temperature, environment, applied stresses,
and component geometry.
4.1 Introduction to High Temperature Oxidation
The oxidation process involves the adsorption of oxygen on the metal surface followed
by the formation of individual oxide nuclei which grows laterally to form a continuous
oxide film. Then the oxide film grows normal to the metal surface. Nucleation of oxides
usually occurs at high energy sites including surface defects, such as dislocations, grain
boundaries, impurities, and surface precipitates. Once a continuous oxide film has
developed the reaction can only proceed by solid state diffusion of one or both reactants
through the film. The oxidation rate is controlled by the slowest step which, in many cases,
is the transport of reactants across the scale [116].
4.1.1 Thermodynamic Considerations
Most metals are thermodynamically unstable in oxygen-containing environments and
may consequently undergo oxidation through reactions of the type:
M + O2 ↔ MO2 (4.1)
Page 86 of 344
The oxidation process is thermodynamically favourable if the oxygen partial pressure in
the environment exceeds the dissociation pressure of the oxide in equilibrium with the
metal. The latter can be computed using the expression of the standard free energy change
of formation of the oxide:
∆Gº = – RT ln K = – RT ln ⎟⎟⎠
⎞⎜⎜⎝
⎛
2M
MO
O .2
paa
(4.2)
By assuming a unit activity for the solid species, the dissociation pressure can be written
as:
pO2 = exp ⎟⎟⎠
⎞⎜⎜⎝
⎛ ∆RTGo
(4.3)
The Ellingham/Richardson diagram (Figure 1.21) is a vital tool that can be effectively
utilised to determine the oxygen partial pressure required for any metal to develop oxide at
any temperature. In this diagram, the standard free energy of formation of oxides is plotted
as a function of temperature. The values of dissociation pressure of the oxide can be
obtained directly from that diagram by drawing a straight line from point O, through the
appropriate free energy curve at the temperature of interest and reading the oxygen partial
pressure value at its point of intersection with the right hand axis labelled (pO2) [117]
[118].
4.1.2 Kinetic Considerations
An accurate determination of the oxidation rate is of an extreme importance in order to
produce a reliable estimation of the design life of an alloy subject to oxidising conditions.
However, calculating the rate is not an easy task as parameters like temperature, oxygen
pressure, and surface treatment have considerable influence on the oxidation kinetics. Also,
oxidation of metals and alloys follows different rate laws including linear, parabolic,
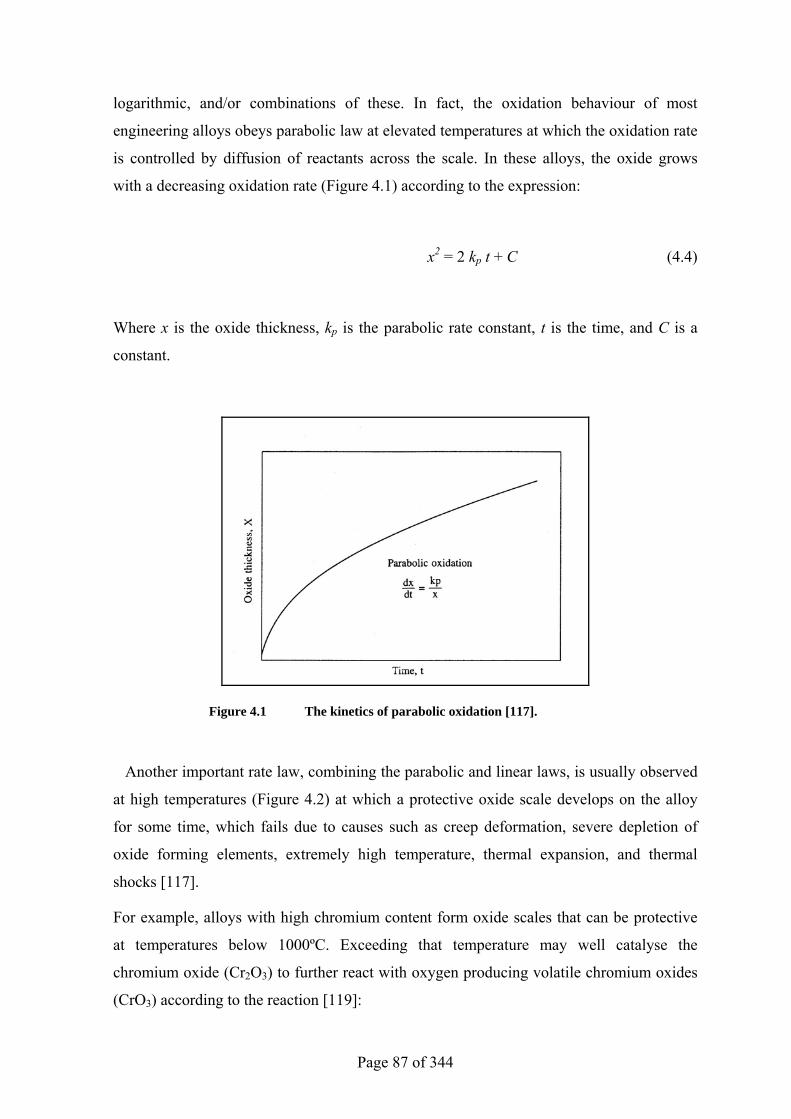
Page 87 of 344
logarithmic, and/or combinations of these. In fact, the oxidation behaviour of most
engineering alloys obeys parabolic law at elevated temperatures at which the oxidation rate
is controlled by diffusion of reactants across the scale. In these alloys, the oxide grows
with a decreasing oxidation rate (Figure 4.1) according to the expression:
x2 = 2 kp t + C (4.4)
Where x is the oxide thickness, kp is the parabolic rate constant, t is the time, and C is a
constant.
Figure 4.1 The kinetics of parabolic oxidation [117].
Another important rate law, combining the parabolic and linear laws, is usually observed
at high temperatures (Figure 4.2) at which a protective oxide scale develops on the alloy
for some time, which fails due to causes such as creep deformation, severe depletion of
oxide forming elements, extremely high temperature, thermal expansion, and thermal
shocks [117].
For example, alloys with high chromium content form oxide scales that can be protective
at temperatures below 1000ºC. Exceeding that temperature may well catalyse the
chromium oxide (Cr2O3) to further react with oxygen producing volatile chromium oxides
(CrO3) according to the reaction [119]:
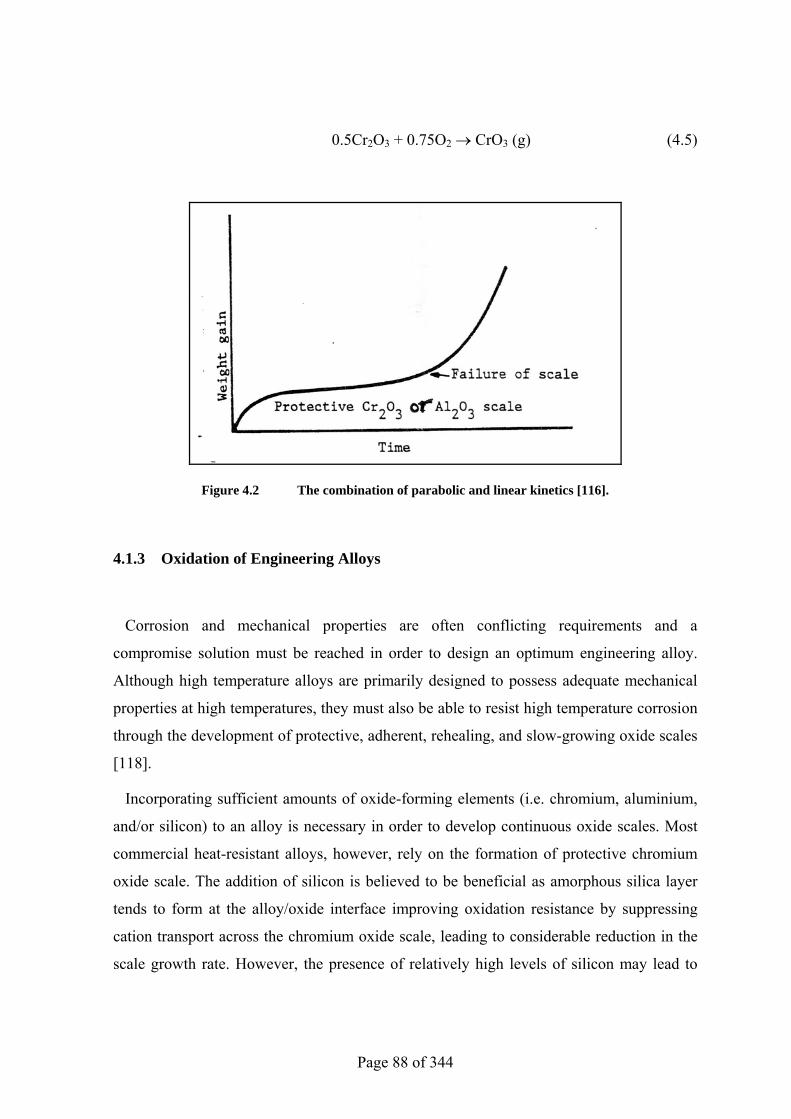
Page 88 of 344
0.5Cr2O3 + 0.75O2 → CrO3 (g) (4.5)
Figure 4.2 The combination of parabolic and linear kinetics [116].
4.1.3 Oxidation of Engineering Alloys
Corrosion and mechanical properties are often conflicting requirements and a
compromise solution must be reached in order to design an optimum engineering alloy.
Although high temperature alloys are primarily designed to possess adequate mechanical
properties at high temperatures, they must also be able to resist high temperature corrosion
through the development of protective, adherent, rehealing, and slow-growing oxide scales
[118].
Incorporating sufficient amounts of oxide-forming elements (i.e. chromium, aluminium,
and/or silicon) to an alloy is necessary in order to develop continuous oxide scales. Most
commercial heat-resistant alloys, however, rely on the formation of protective chromium
oxide scale. The addition of silicon is believed to be beneficial as amorphous silica layer
tends to form at the alloy/oxide interface improving oxidation resistance by suppressing
cation transport across the chromium oxide scale, leading to considerable reduction in the
scale growth rate. However, the presence of relatively high levels of silicon may lead to
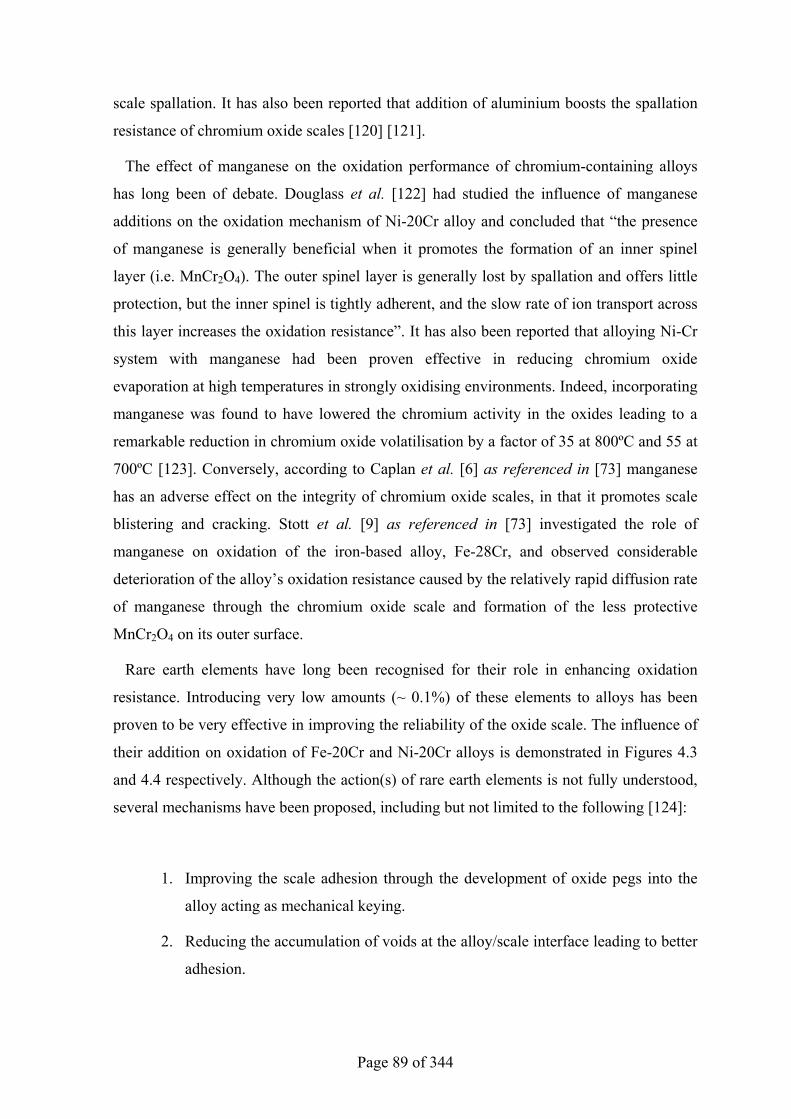
Page 89 of 344
scale spallation. It has also been reported that addition of aluminium boosts the spallation
resistance of chromium oxide scales [120] [121].
The effect of manganese on the oxidation performance of chromium-containing alloys
has long been of debate. Douglass et al. [122] had studied the influence of manganese
additions on the oxidation mechanism of Ni-20Cr alloy and concluded that “the presence
of manganese is generally beneficial when it promotes the formation of an inner spinel
layer (i.e. MnCr2O4). The outer spinel layer is generally lost by spallation and offers little
protection, but the inner spinel is tightly adherent, and the slow rate of ion transport across
this layer increases the oxidation resistance”. It has also been reported that alloying Ni-Cr
system with manganese had been proven effective in reducing chromium oxide
evaporation at high temperatures in strongly oxidising environments. Indeed, incorporating
manganese was found to have lowered the chromium activity in the oxides leading to a
remarkable reduction in chromium oxide volatilisation by a factor of 35 at 800ºC and 55 at
700ºC [123]. Conversely, according to Caplan et al. [6] as referenced in [73] manganese
has an adverse effect on the integrity of chromium oxide scales, in that it promotes scale
blistering and cracking. Stott et al. [9] as referenced in [73] investigated the role of
manganese on oxidation of the iron-based alloy, Fe-28Cr, and observed considerable
deterioration of the alloy’s oxidation resistance caused by the relatively rapid diffusion rate
of manganese through the chromium oxide scale and formation of the less protective
MnCr2O4 on its outer surface.
Rare earth elements have long been recognised for their role in enhancing oxidation
resistance. Introducing very low amounts (~ 0.1%) of these elements to alloys has been
proven to be very effective in improving the reliability of the oxide scale. The influence of
their addition on oxidation of Fe-20Cr and Ni-20Cr alloys is demonstrated in Figures 4.3
and 4.4 respectively. Although the action(s) of rare earth elements is not fully understood,
several mechanisms have been proposed, including but not limited to the following [124]:
1. Improving the scale adhesion through the development of oxide pegs into the
alloy acting as mechanical keying.
2. Reducing the accumulation of voids at the alloy/scale interface leading to better
adhesion.
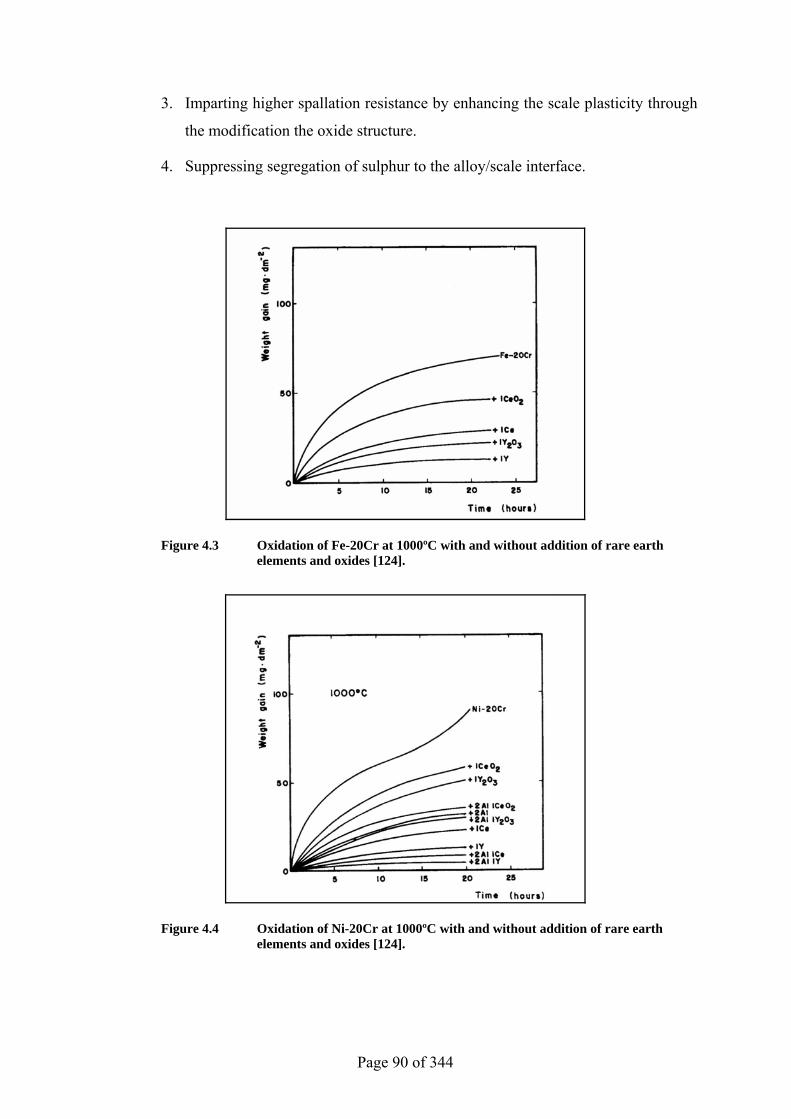
Page 90 of 344
3. Imparting higher spallation resistance by enhancing the scale plasticity through
the modification the oxide structure.
4. Suppressing segregation of sulphur to the alloy/scale interface.
Figure 4.3 Oxidation of Fe-20Cr at 1000ºC with and without addition of rare earth elements and oxides [124].
Figure 4.4 Oxidation of Ni-20Cr at 1000ºC with and without addition of rare earth elements and oxides [124].
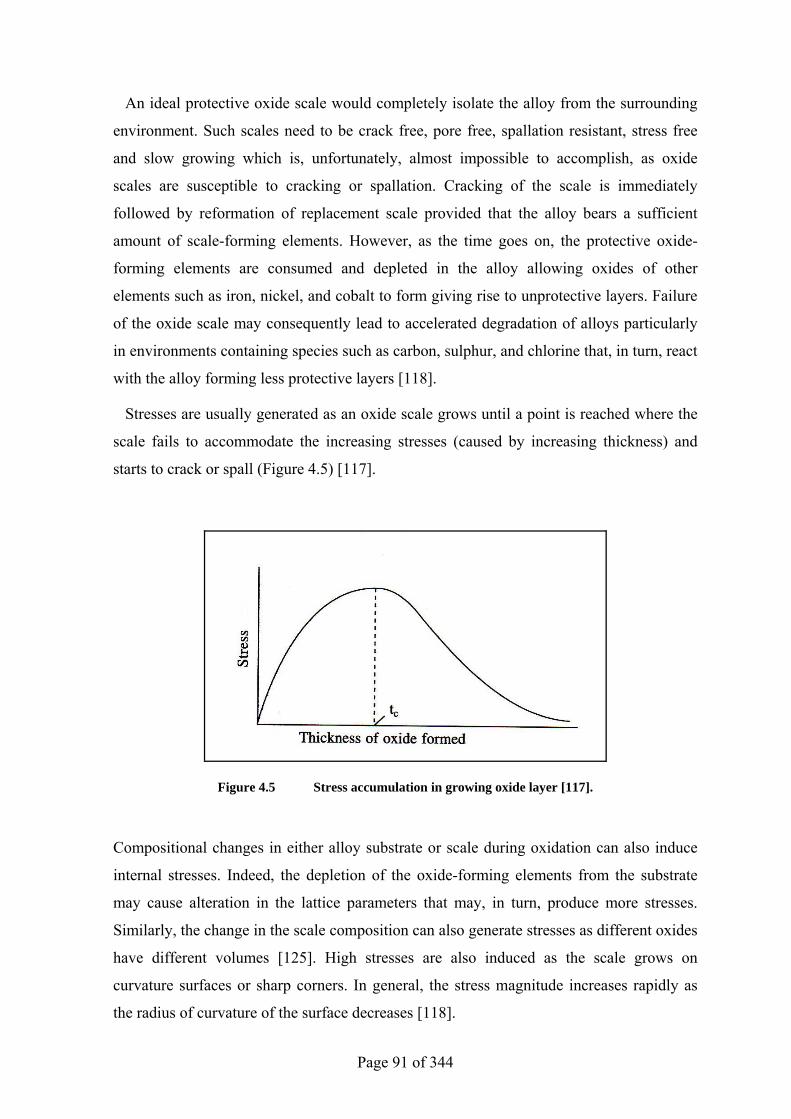
Page 91 of 344
An ideal protective oxide scale would completely isolate the alloy from the surrounding
environment. Such scales need to be crack free, pore free, spallation resistant, stress free
and slow growing which is, unfortunately, almost impossible to accomplish, as oxide
scales are susceptible to cracking or spallation. Cracking of the scale is immediately
followed by reformation of replacement scale provided that the alloy bears a sufficient
amount of scale-forming elements. However, as the time goes on, the protective oxide-
forming elements are consumed and depleted in the alloy allowing oxides of other
elements such as iron, nickel, and cobalt to form giving rise to unprotective layers. Failure
of the oxide scale may consequently lead to accelerated degradation of alloys particularly
in environments containing species such as carbon, sulphur, and chlorine that, in turn, react
with the alloy forming less protective layers [118].
Stresses are usually generated as an oxide scale grows until a point is reached where the
scale fails to accommodate the increasing stresses (caused by increasing thickness) and
starts to crack or spall (Figure 4.5) [117].
Figure 4.5 Stress accumulation in growing oxide layer [117].
Compositional changes in either alloy substrate or scale during oxidation can also induce
internal stresses. Indeed, the depletion of the oxide-forming elements from the substrate
may cause alteration in the lattice parameters that may, in turn, produce more stresses.
Similarly, the change in the scale composition can also generate stresses as different oxides
have different volumes [125]. High stresses are also induced as the scale grows on
curvature surfaces or sharp corners. In general, the stress magnitude increases rapidly as
the radius of curvature of the surface decreases [118].
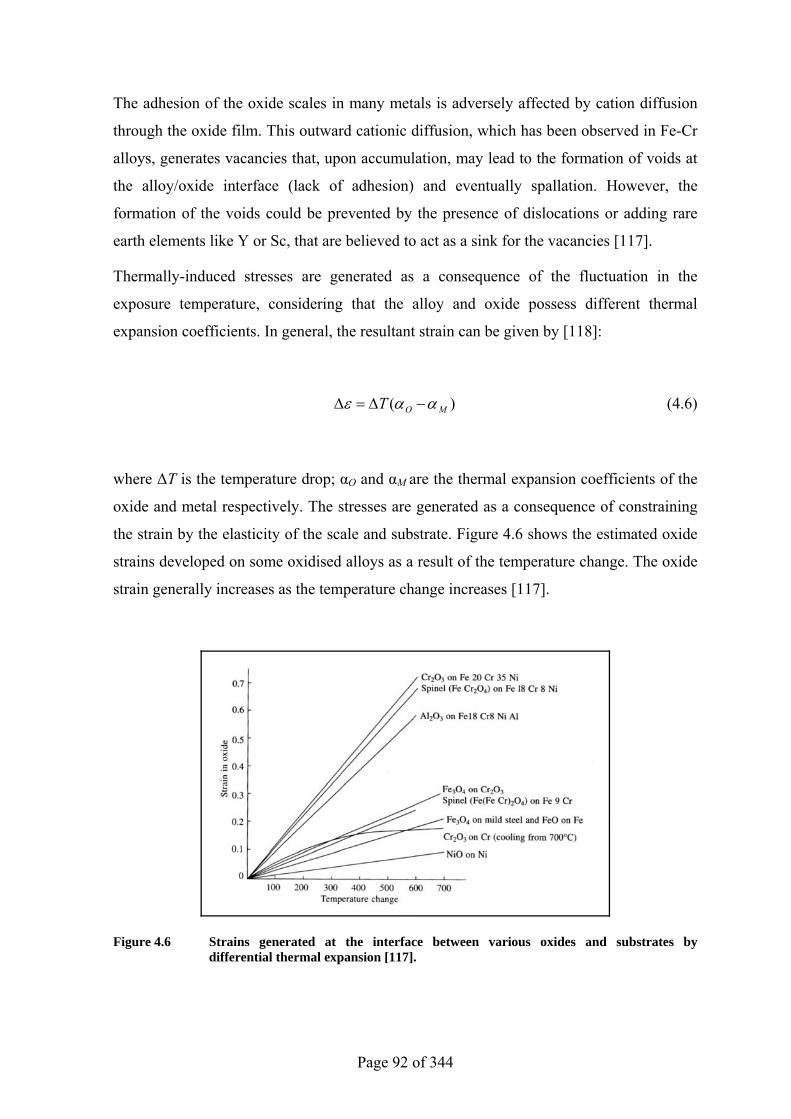
Page 92 of 344
The adhesion of the oxide scales in many metals is adversely affected by cation diffusion
through the oxide film. This outward cationic diffusion, which has been observed in Fe-Cr
alloys, generates vacancies that, upon accumulation, may lead to the formation of voids at
the alloy/oxide interface (lack of adhesion) and eventually spallation. However, the
formation of the voids could be prevented by the presence of dislocations or adding rare
earth elements like Y or Sc, that are believed to act as a sink for the vacancies [117].
Thermally-induced stresses are generated as a consequence of the fluctuation in the
exposure temperature, considering that the alloy and oxide possess different thermal
expansion coefficients. In general, the resultant strain can be given by [118]:
)( MOT ααε −∆=∆ (4.6)
where ∆T is the temperature drop; αO and αM are the thermal expansion coefficients of the
oxide and metal respectively. The stresses are generated as a consequence of constraining
the strain by the elasticity of the scale and substrate. Figure 4.6 shows the estimated oxide
strains developed on some oxidised alloys as a result of the temperature change. The oxide
strain generally increases as the temperature change increases [117].
Figure 4.6 Strains generated at the interface between various oxides and substrates by differential thermal expansion [117].
Page 93 of 344
The stress induced by temperature change is given by:
)/)(/(21)(
MOMO
MOO
ttEETE
+−∆
=αασ (4.7)
where EO and EM are the Young’s modulus of the oxide and metal respectively; αO and αM
are the thermal expansion coefficients of the oxide and metal; tO and tM are the thicknesses
of the oxide and metal; and ∆T is the temperature drop [117]. An equation has also been
suggested to estimate the magnitude of the scale internal stresses. Considering the method
of bending a metal strip of thickness d, clamped at one end and oxidised on one side,
forming a thin oxide (of thickness t ) with the radius of curvature due to bending r, the
following formula has been obtained:
)(6)(
6)( 3
dtrdEE
rddttE MOO
+−
++
=σ (4.8)
where EO and EM are the Young’s modulus of the oxide and metal respectively [117].
4.1.4 Effect of Oxide Scale Composition on Metal Dusting
The composition of oxides depends mainly on alloy chemistry, oxygen partial pressure,
and alloy pre-treatment. The establishment of Cr2O3, Al2O3, and SiO2-containing scales has
been proven to be an effective defence against metal dusting because of their reasonable
stability under very low oxygen pressures. MnCr2O4 spinel has also been reported as stable
and very impermeable to carbon, unlike MnO that was reported to have been less
protective [63]. Indeed, spinel oxides become more stable in direct proportion to their
chromium content. For instance, Fe(Cr1-X FeX)2O4 is not as stable as chromium oxide,
because of the presence of iron, which can be easily reduced in strongly carburising
atmosphere. The composition of the iron-chromium spinel can vary from FeCr2O4 to Fe3O4
(magnetite) with FeCr2O4 as more stable than magnetite, though it was reported to have
Page 94 of 344
been readily reduced by carbon at 600ºC [96]. In short, nickel and/or iron-bearing spinels
could be reduced by carbon in metal dusting conditions and, also, their nickel and/or iron
content may catalyse the carbon deposition on alloys, and hence increase the probability of
metal dusting [63].
4.2 Investigation Objectives
Much metal dusting research has emphasised the role of oxidation in slowing down or
even preventing metal dusting. However, it is not clear whether the oxide layers formed at
the metal dusting temperature range (i.e. 400-800ºC) are sufficient to provide a reliable
barrier between the metal and the environment. Therefore, oxidation of the heat-resistant
alloys KHR35C HiSi (HP), KHR45A LC (35Cr-45Ni), and UCX was of extremely high
interest in order to assess their performance and ability to form protective oxide scale at
such temperatures. Accordingly, a study has been undertaken where the alloys were
exposed to static air at temperatures of 650, 750, and 850ºC, for 100 and 1000 hours. The
investigation was basically aimed at exploring the scale growth and identifying the oxide
phases formed at these conditions. The alloys were characterised using visual examination,
weight change measurements, scanning electron microscopy (SEM), energy dispersive x-
ray spectroscopy (EDX), and x-ray diffraction (XRD) techniques.
The alloys performance in metal dusting may be predicted by considering their
chromium equivalents (elucidated in Chapter 1; 1.6.1), i.e. Crequiv = %Cr + 3 × (%Si +
%Al). Using Table 2.1, the chromium equivalents were calculated for the three alloys as
follows:
Alloy HP, Crequiv = 29.9
Alloy 35Cr-45Ni, Crequiv = 36.8
Alloy UCX, Crequiv = 47.0
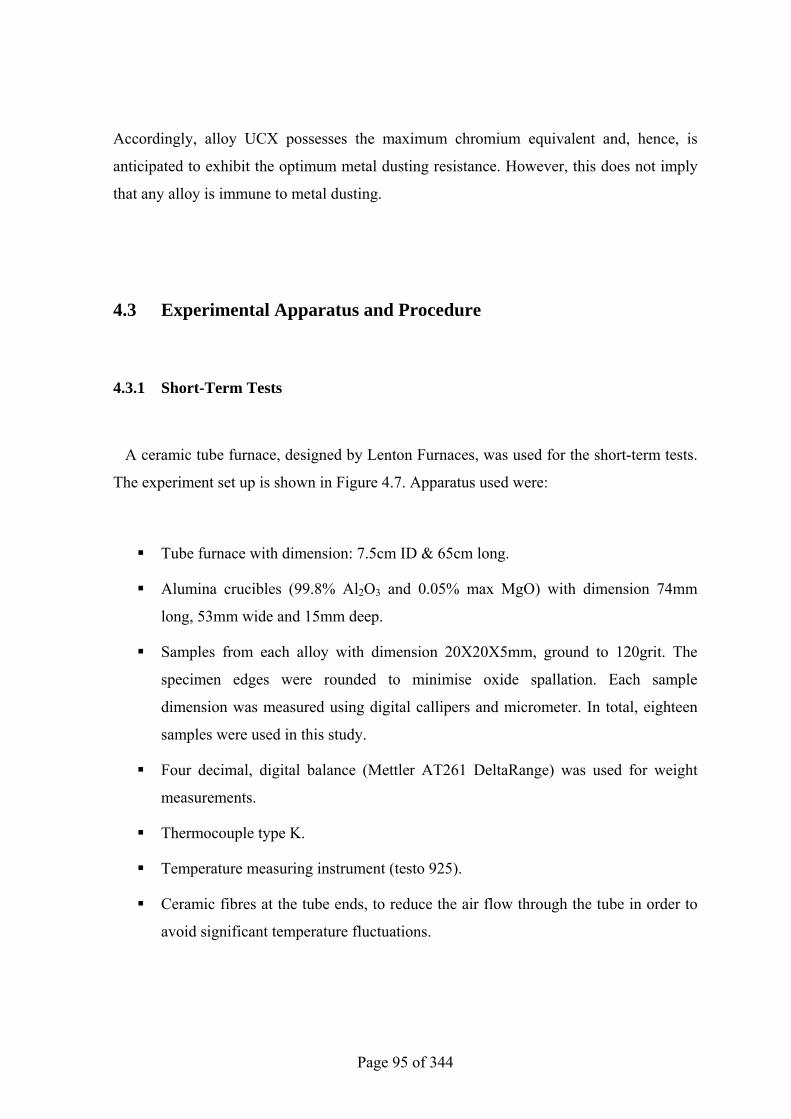
Page 95 of 344
Accordingly, alloy UCX possesses the maximum chromium equivalent and, hence, is
anticipated to exhibit the optimum metal dusting resistance. However, this does not imply
that any alloy is immune to metal dusting.
4.3 Experimental Apparatus and Procedure
4.3.1 Short-Term Tests
A ceramic tube furnace, designed by Lenton Furnaces, was used for the short-term tests.
The experiment set up is shown in Figure 4.7. Apparatus used were:
Tube furnace with dimension: 7.5cm ID & 65cm long.
Alumina crucibles (99.8% Al2O3 and 0.05% max MgO) with dimension 74mm
long, 53mm wide and 15mm deep.
Samples from each alloy with dimension 20X20X5mm, ground to 120grit. The
specimen edges were rounded to minimise oxide spallation. Each sample
dimension was measured using digital callipers and micrometer. In total, eighteen
samples were used in this study.
Four decimal, digital balance (Mettler AT261 DeltaRange) was used for weight
measurements.
Thermocouple type K.
Temperature measuring instrument (testo 925).
Ceramic fibres at the tube ends, to reduce the air flow through the tube in order to
avoid significant temperature fluctuations.
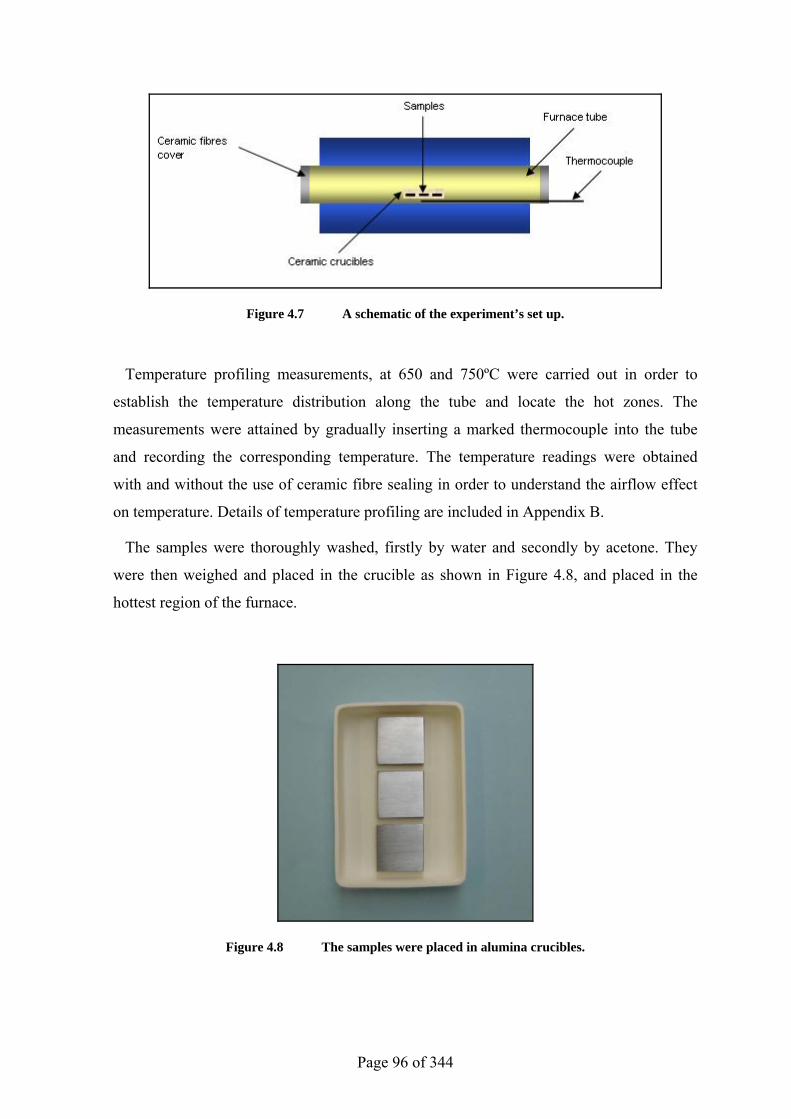
Page 96 of 344
Figure 4.7 A schematic of the experiment’s set up.
Temperature profiling measurements, at 650 and 750ºC were carried out in order to
establish the temperature distribution along the tube and locate the hot zones. The
measurements were attained by gradually inserting a marked thermocouple into the tube
and recording the corresponding temperature. The temperature readings were obtained
with and without the use of ceramic fibre sealing in order to understand the airflow effect
on temperature. Details of temperature profiling are included in Appendix B.
The samples were thoroughly washed, firstly by water and secondly by acetone. They
were then weighed and placed in the crucible as shown in Figure 4.8, and placed in the
hottest region of the furnace.
Figure 4.8 The samples were placed in alumina crucibles.
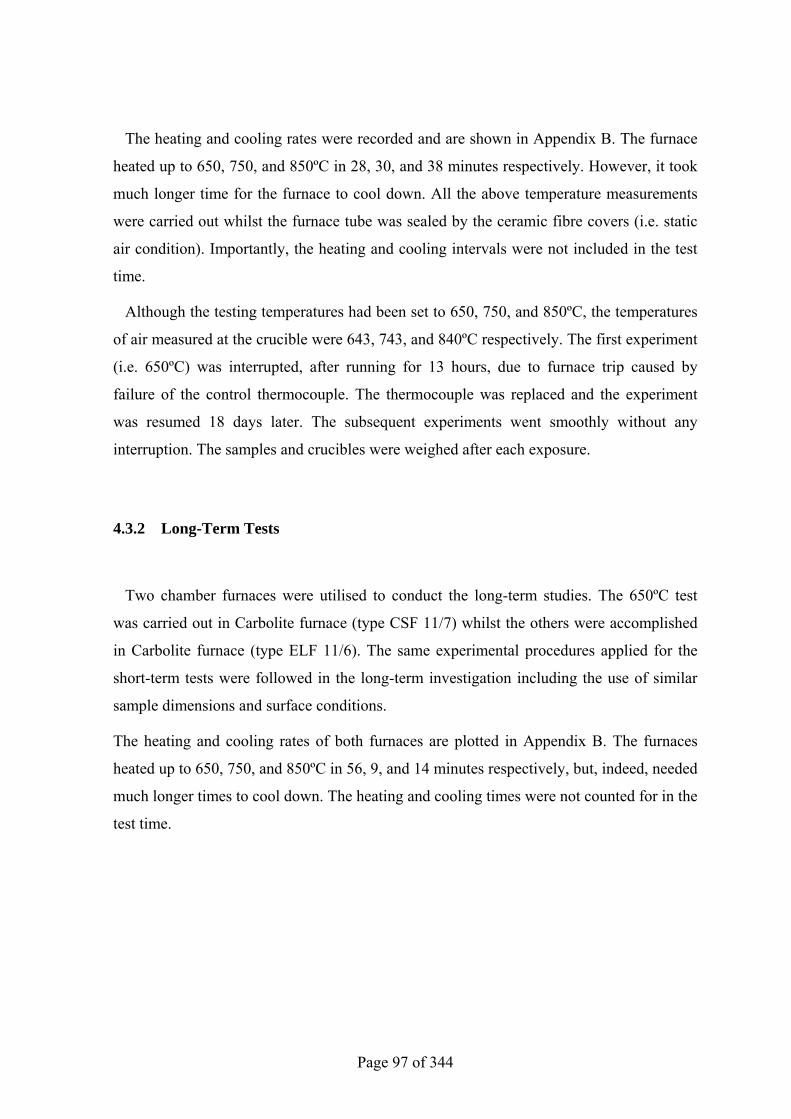
Page 97 of 344
The heating and cooling rates were recorded and are shown in Appendix B. The furnace
heated up to 650, 750, and 850ºC in 28, 30, and 38 minutes respectively. However, it took
much longer time for the furnace to cool down. All the above temperature measurements
were carried out whilst the furnace tube was sealed by the ceramic fibre covers (i.e. static
air condition). Importantly, the heating and cooling intervals were not included in the test
time.
Although the testing temperatures had been set to 650, 750, and 850ºC, the temperatures
of air measured at the crucible were 643, 743, and 840ºC respectively. The first experiment
(i.e. 650ºC) was interrupted, after running for 13 hours, due to furnace trip caused by
failure of the control thermocouple. The thermocouple was replaced and the experiment
was resumed 18 days later. The subsequent experiments went smoothly without any
interruption. The samples and crucibles were weighed after each exposure.
4.3.2 Long-Term Tests
Two chamber furnaces were utilised to conduct the long-term studies. The 650ºC test
was carried out in Carbolite furnace (type CSF 11/7) whilst the others were accomplished
in Carbolite furnace (type ELF 11/6). The same experimental procedures applied for the
short-term tests were followed in the long-term investigation including the use of similar
sample dimensions and surface conditions.
The heating and cooling rates of both furnaces are plotted in Appendix B. The furnaces
heated up to 650, 750, and 850ºC in 56, 9, and 14 minutes respectively, but, indeed, needed
much longer times to cool down. The heating and cooling times were not counted for in the
test time.
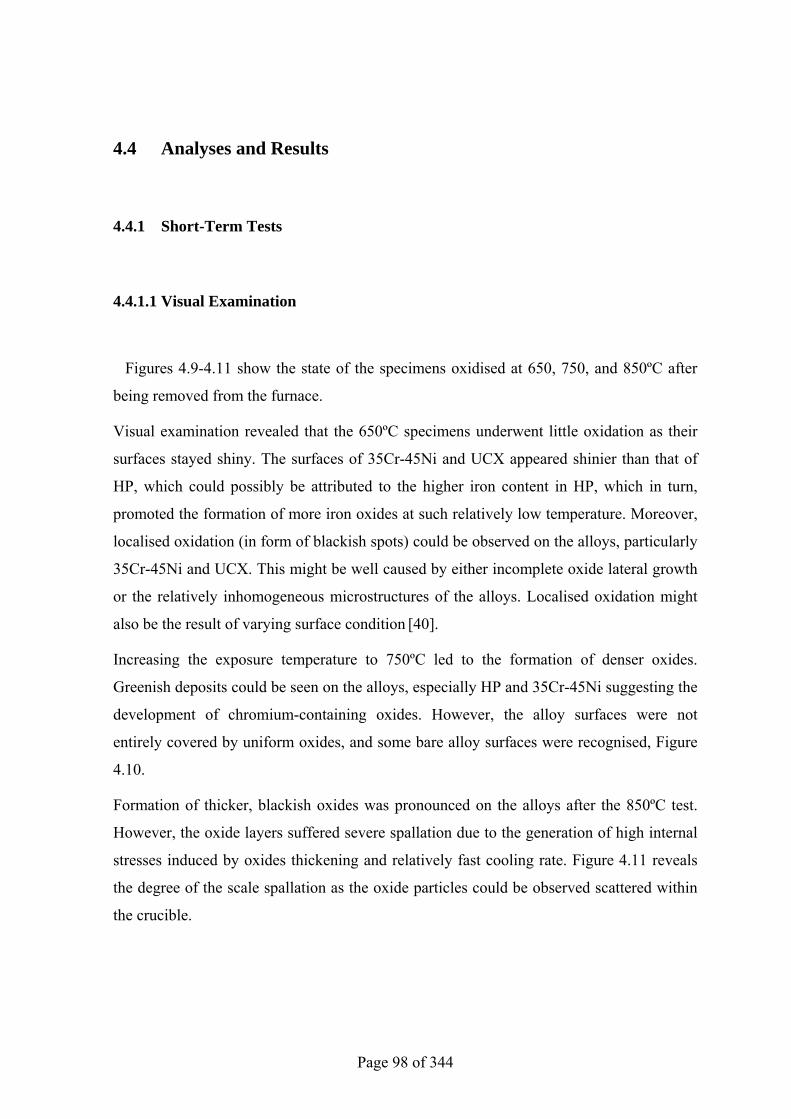
Page 98 of 344
4.4 Analyses and Results
4.4.1 Short-Term Tests
4.4.1.1 Visual Examination
Figures 4.9-4.11 show the state of the specimens oxidised at 650, 750, and 850ºC after
being removed from the furnace.
Visual examination revealed that the 650ºC specimens underwent little oxidation as their
surfaces stayed shiny. The surfaces of 35Cr-45Ni and UCX appeared shinier than that of
HP, which could possibly be attributed to the higher iron content in HP, which in turn,
promoted the formation of more iron oxides at such relatively low temperature. Moreover,
localised oxidation (in form of blackish spots) could be observed on the alloys, particularly
35Cr-45Ni and UCX. This might be well caused by either incomplete oxide lateral growth
or the relatively inhomogeneous microstructures of the alloys. Localised oxidation might
also be the result of varying surface condition [40].
Increasing the exposure temperature to 750ºC led to the formation of denser oxides.
Greenish deposits could be seen on the alloys, especially HP and 35Cr-45Ni suggesting the
development of chromium-containing oxides. However, the alloy surfaces were not
entirely covered by uniform oxides, and some bare alloy surfaces were recognised, Figure
4.10.
Formation of thicker, blackish oxides was pronounced on the alloys after the 850ºC test.
However, the oxide layers suffered severe spallation due to the generation of high internal
stresses induced by oxides thickening and relatively fast cooling rate. Figure 4.11 reveals
the degree of the scale spallation as the oxide particles could be observed scattered within
the crucible.
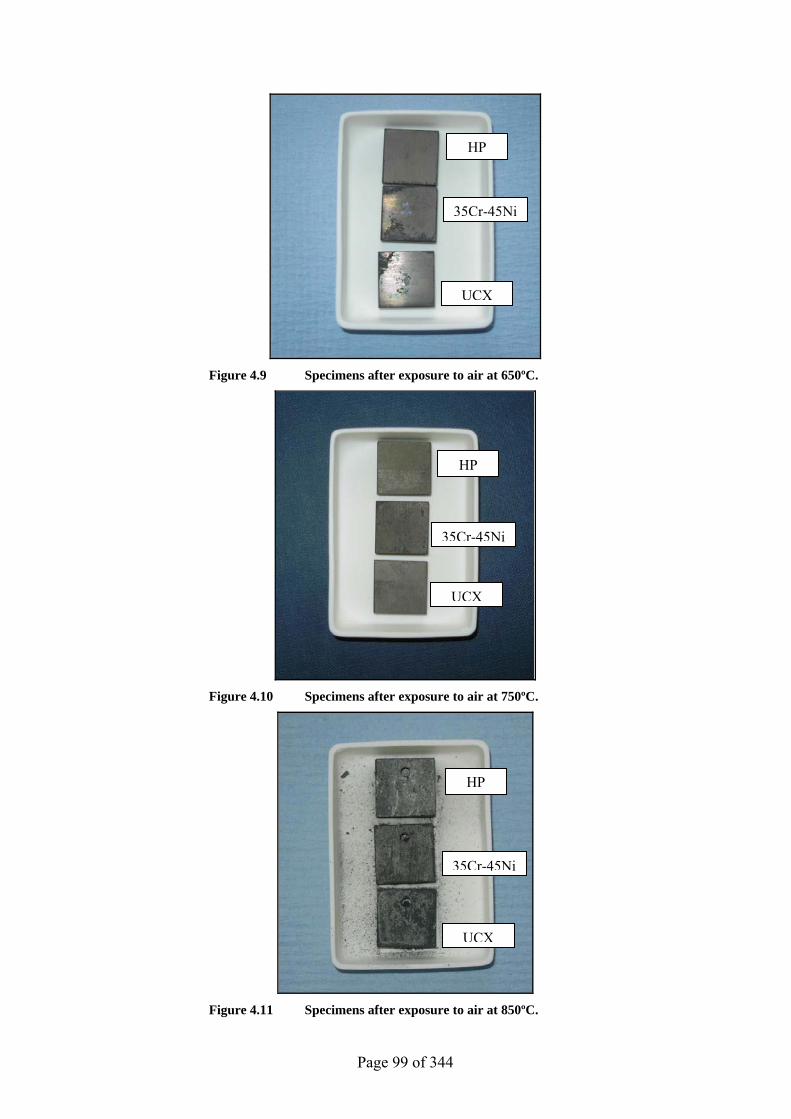
Page 99 of 344
Figure 4.9 Specimens after exposure to air at 650ºC.
Figure 4.10 Specimens after exposure to air at 750ºC.
Figure 4.11 Specimens after exposure to air at 850ºC.
HP
35Cr-45Ni
UCX
HP
35Cr-45Ni
UCX
HP
35Cr-45Ni
UCX
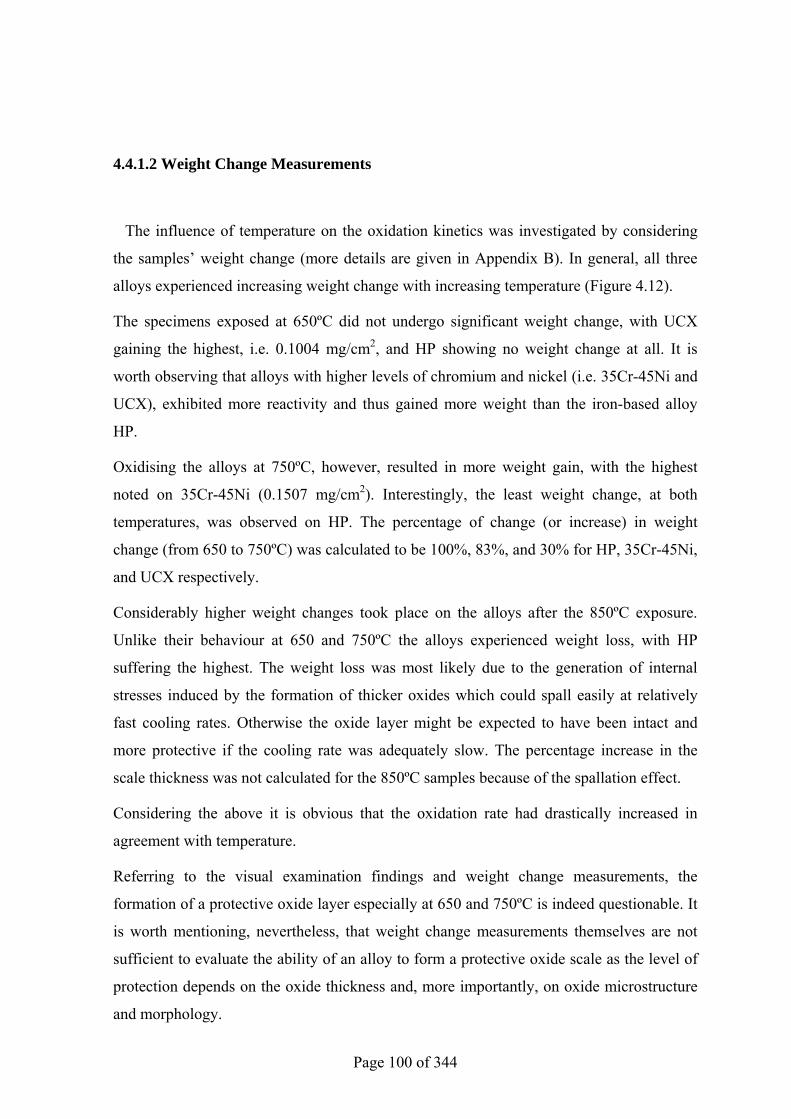
Page 100 of 344
4.4.1.2 Weight Change Measurements
The influence of temperature on the oxidation kinetics was investigated by considering
the samples’ weight change (more details are given in Appendix B). In general, all three
alloys experienced increasing weight change with increasing temperature (Figure 4.12).
The specimens exposed at 650ºC did not undergo significant weight change, with UCX
gaining the highest, i.e. 0.1004 mg/cm2, and HP showing no weight change at all. It is
worth observing that alloys with higher levels of chromium and nickel (i.e. 35Cr-45Ni and
UCX), exhibited more reactivity and thus gained more weight than the iron-based alloy
HP.
Oxidising the alloys at 750ºC, however, resulted in more weight gain, with the highest
noted on 35Cr-45Ni (0.1507 mg/cm2). Interestingly, the least weight change, at both
temperatures, was observed on HP. The percentage of change (or increase) in weight
change (from 650 to 750ºC) was calculated to be 100%, 83%, and 30% for HP, 35Cr-45Ni,
and UCX respectively.
Considerably higher weight changes took place on the alloys after the 850ºC exposure.
Unlike their behaviour at 650 and 750ºC the alloys experienced weight loss, with HP
suffering the highest. The weight loss was most likely due to the generation of internal
stresses induced by the formation of thicker oxides which could spall easily at relatively
fast cooling rates. Otherwise the oxide layer might be expected to have been intact and
more protective if the cooling rate was adequately slow. The percentage increase in the
scale thickness was not calculated for the 850ºC samples because of the spallation effect.
Considering the above it is obvious that the oxidation rate had drastically increased in
agreement with temperature.
Referring to the visual examination findings and weight change measurements, the
formation of a protective oxide layer especially at 650 and 750ºC is indeed questionable. It
is worth mentioning, nevertheless, that weight change measurements themselves are not
sufficient to evaluate the ability of an alloy to form a protective oxide scale as the level of
protection depends on the oxide thickness and, more importantly, on oxide microstructure
and morphology.
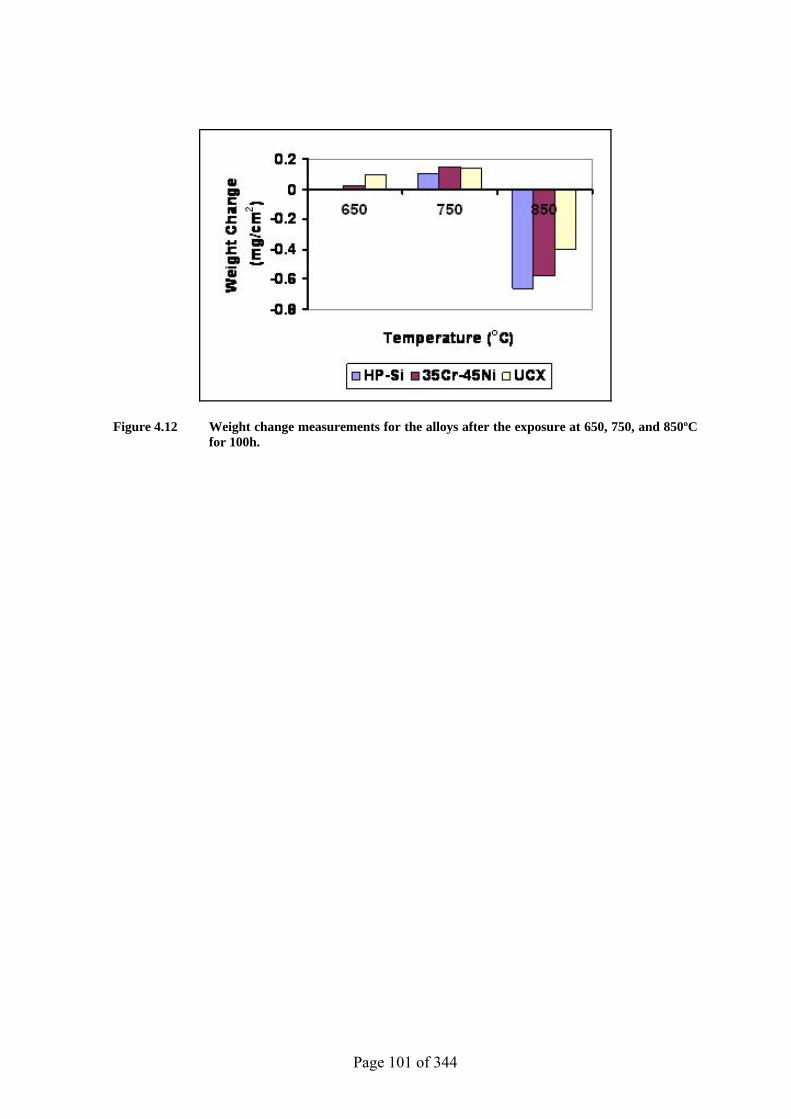
Page 101 of 344
Figure 4.12 Weight change measurements for the alloys after the exposure at 650, 750, and 850ºC for 100h.
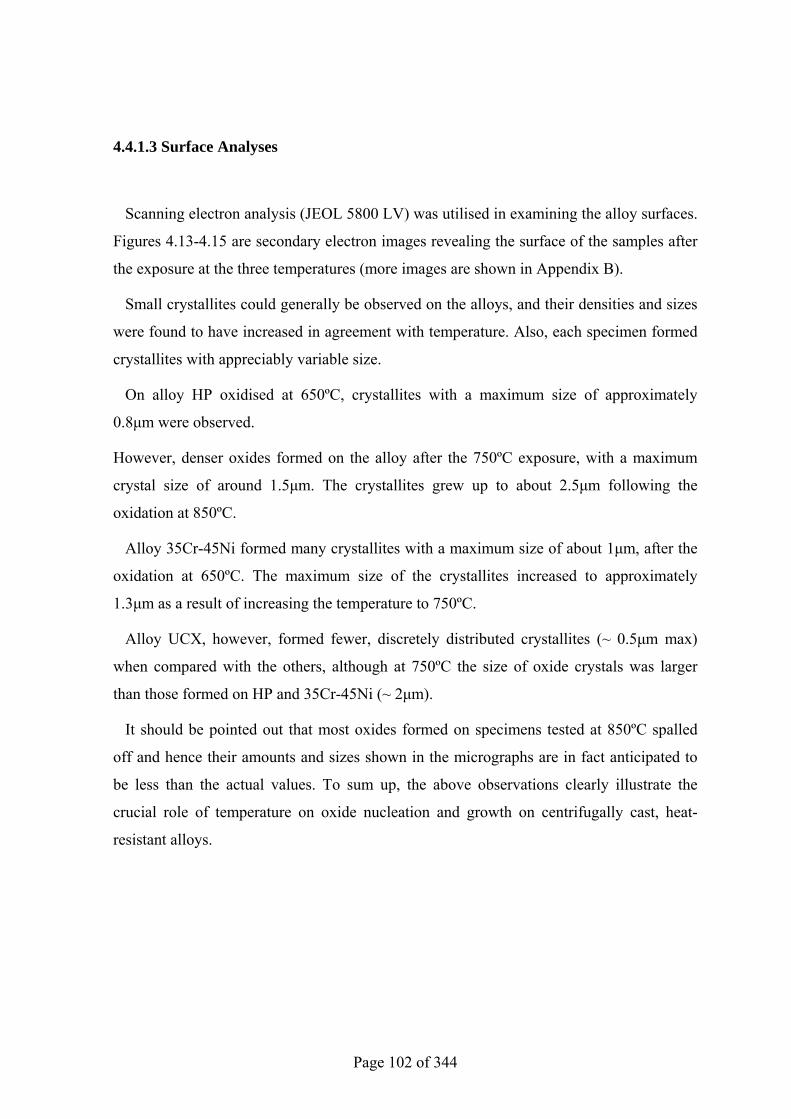
Page 102 of 344
4.4.1.3 Surface Analyses
Scanning electron analysis (JEOL 5800 LV) was utilised in examining the alloy surfaces.
Figures 4.13-4.15 are secondary electron images revealing the surface of the samples after
the exposure at the three temperatures (more images are shown in Appendix B).
Small crystallites could generally be observed on the alloys, and their densities and sizes
were found to have increased in agreement with temperature. Also, each specimen formed
crystallites with appreciably variable size.
On alloy HP oxidised at 650ºC, crystallites with a maximum size of approximately
0.8µm were observed.
However, denser oxides formed on the alloy after the 750ºC exposure, with a maximum
crystal size of around 1.5µm. The crystallites grew up to about 2.5µm following the
oxidation at 850ºC.
Alloy 35Cr-45Ni formed many crystallites with a maximum size of about 1µm, after the
oxidation at 650ºC. The maximum size of the crystallites increased to approximately
1.3µm as a result of increasing the temperature to 750ºC.
Alloy UCX, however, formed fewer, discretely distributed crystallites (~ 0.5µm max)
when compared with the others, although at 750ºC the size of oxide crystals was larger
than those formed on HP and 35Cr-45Ni (~ 2µm).
It should be pointed out that most oxides formed on specimens tested at 850ºC spalled
off and hence their amounts and sizes shown in the micrographs are in fact anticipated to
be less than the actual values. To sum up, the above observations clearly illustrate the
crucial role of temperature on oxide nucleation and growth on centrifugally cast, heat-
resistant alloys.
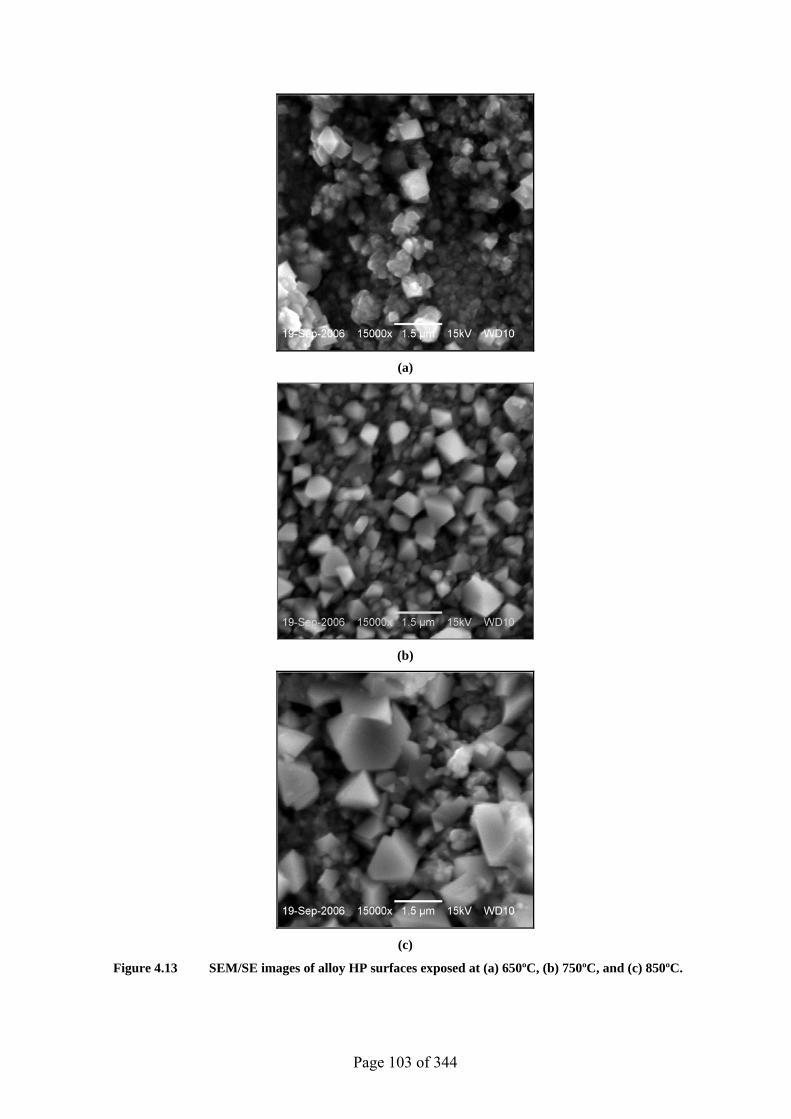
Page 103 of 344
(a)
(b)
(c)
Figure 4.13 SEM/SE images of alloy HP surfaces exposed at (a) 650ºC, (b) 750ºC, and (c) 850ºC.
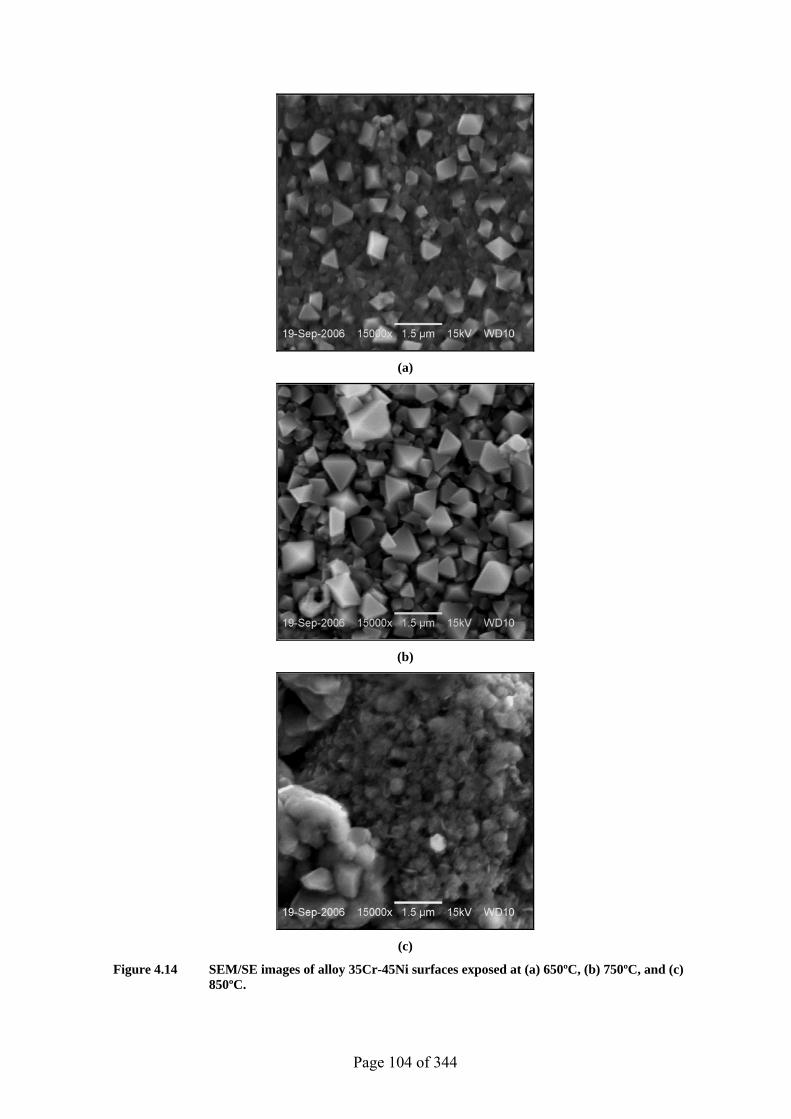
Page 104 of 344
(a)
(b)
(c)
Figure 4.14 SEM/SE images of alloy 35Cr-45Ni surfaces exposed at (a) 650ºC, (b) 750ºC, and (c) 850ºC.
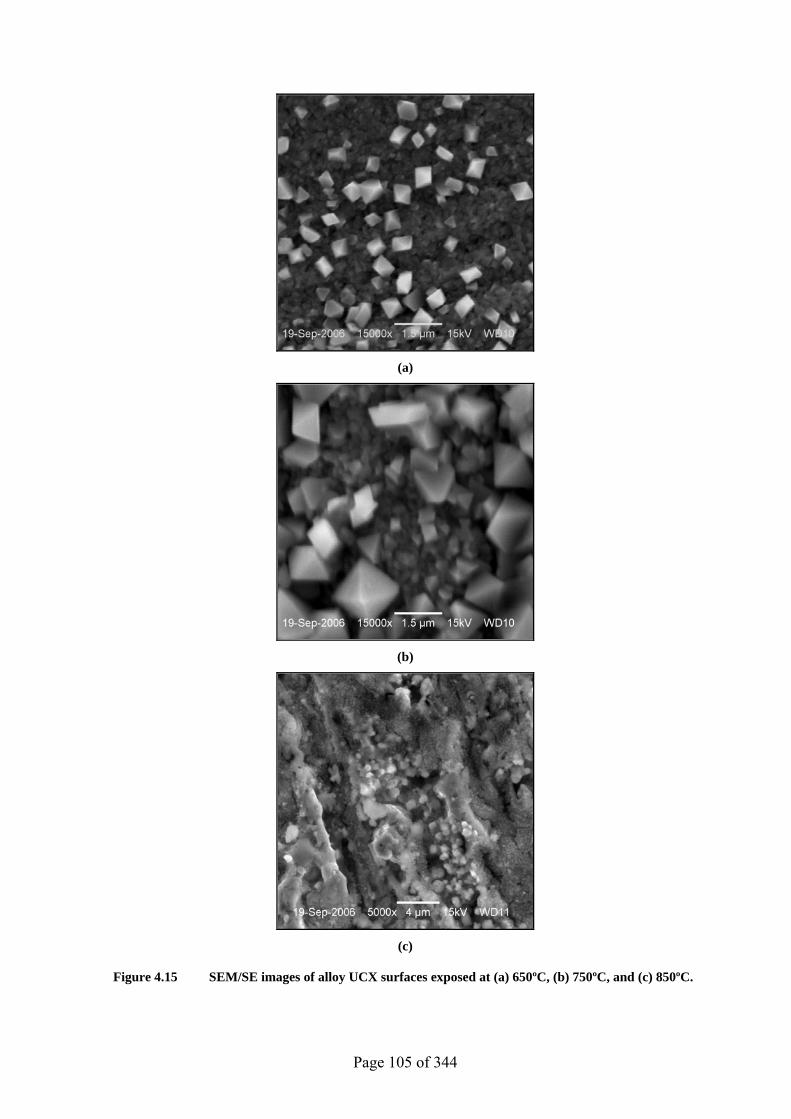
Page 105 of 344
(a)
(b)
(c)
Figure 4.15 SEM/SE images of alloy UCX surfaces exposed at (a) 650ºC, (b) 750ºC, and (c) 850ºC.
Page 106 of 344
4.4.1.4 XRD Analyses
A Philips vertical diffractometer, PW 1830/00, with Cu Kα radiation, was used to
identify the alloys surface composition. The software Philips X’pert Data Collector was
used to collect the data whereas Philips X’pert Plus and HighScore Plus were used for peak
searching and phase identification. The X-ray diffraction charts and patterns are given in
Appendix B. The oxides formed on alloy HP, at both 650 and 750ºC, were composed
mainly of chromium oxide (Cr2O3) and Mn1.5Cr1.5O4. At 850ºC the alloy formed Cr2O3,
NiMn2O4, and some FeO. The oxides on alloy 35Cr-45Ni, exposed at 650ºC, consisted of
Cr2O3 and Cr1.5Fe0.5MnO4. At higher temperature (i.e. 750ºC), however, Mn1.5Cr1.5O4
formed as well as Cr2O3. Chromium oxide (Cr2O3), nickel oxide (NiO), and FeO were
detected at 850ºC. The alloy UCX showed only the formation of Cr2O3 at 650ºC. However,
the analysis of specimen exposed at 750ºC confirmed the presence of Mn1.5Cr1.5O4 in
addition to Cr2O3. Only Cr2O3 was detected at 850ºC.
4.4.1.5 Metallographic Examination
Cross sections of the alloys were prepared to study further the oxide layers formed on
each alloy. The investigation was carried out using the scanning electron microscope, FEI
Quanta 200 SEM with Oxford INCA 250 EDX system attachment.
The samples were mounted in Multifast (manufactured by Struers) that was nonconductive,
and therefore copper tapes were used to provide a conductive path from the samples to
ground in order to avoid charging. The samples were ground and polished to 9µm using
diamond suspension and finally polished to 0.04µm by colloidal silica suspension.
It is important to state that, during the analyses; areas with intact oxide and maximum
layer thickness were located and imaged. Backscattered electron imaging and quantitative
EDX analyses were utilised to investigate the oxides throughout this study.
Page 107 of 344
An uneven, thin oxide layer was observed to have formed on the alloy HP after the
exposure at 650ºC. The thickness of the layer varied from 0.2 to 1µm, with 0.7µm as
typical (Figure 4.16). EDX analyses of the two spots, P1 and P2, showed different oxide
composition with chromium oxide as the main constituent in both. More nickel, silicon,
and iron were detected at point P1, where the layer was less dark than point 2. At point 2,
however, more manganese was detected. The line profiling, across the formed layer (along
the yellow line in Figure 4.16), revealed the presence of chromium and oxygen peaks
suggesting that the scale was mainly composed of chromium oxide. A silicon peak was
also observed just beneath the chromium peak suggesting the formation of a silicon oxide
layer (~ 0.4µm) below the chromium oxide. Moreover, approximately a 3µm, chromium-
depleted zone was also detected in the substrate.
Relatively thicker, more uniform oxide layer, of about 0.5-1.2µm thickness, had formed
on the alloy after the oxidation at 750ºC (Figure 4.17). EDX analyses revealed that O, Cr,
and Mn were the main constituents of the scale. Interestingly, zirconium was also detected,
at the two spots, in considerable amounts (1.11 & 2.88 wt%). Iron and nickel were also
observed. The line profiling of the substrate revealed that the predominant oxide was that
of chromium, with some iron and silicon-containing oxides formed just near the alloy-
oxide interface.
Some intact oxide scale could be found on the alloy after the 850ºC exposure despite the
severe spallation caused by a fast cooling rate (Figure 4.18). Much thicker (~2µm), more
even, and denser oxide scale had formed on the alloy. The oxide composition was
confirmed by EDX as mainly chromium oxide. The lighter grey oxide, however, contained
a considerable amount of manganese (~18.81wt%), and traces of silicon and iron. The line
profiling analyses showed the distribution of elements across the substrate. Chromium
peak detected within the mounting material was probably a result of contamination with
alloy particles during the sample preparation.
Collectively, increasing the exposure temperature rendered the oxide layers thicker and
denser on HP alloy. It was also noticed that the amount of alloying elements, iron, nickel,
and niobium in the oxides, was reduced as the temperature was increased.
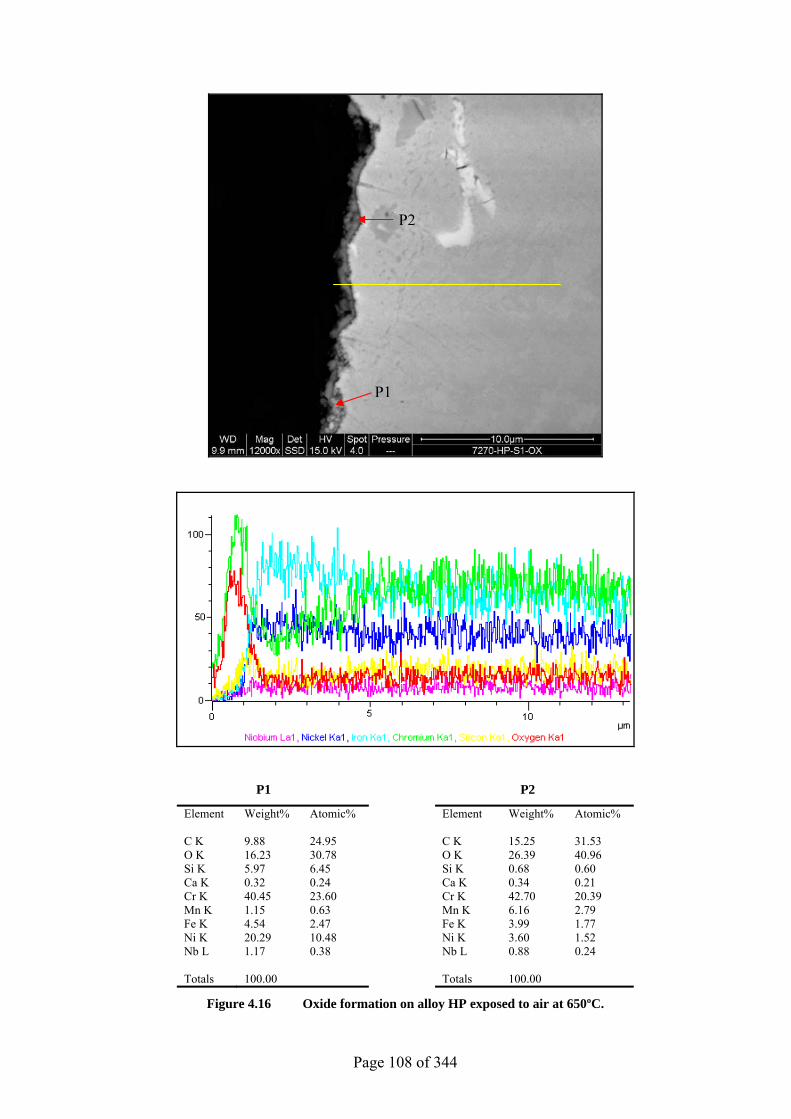
Page 108 of 344
P1 P2
Element Weight% Atomic% Element Weight% Atomic% C K 9.88 24.95 C K 15.25 31.53 O K 16.23 30.78 O K 26.39 40.96 Si K 5.97 6.45 Si K 0.68 0.60 Ca K 0.32 0.24 Ca K 0.34 0.21 Cr K 40.45 23.60 Cr K 42.70 20.39 Mn K 1.15 0.63 Mn K 6.16 2.79 Fe K 4.54 2.47 Fe K 3.99 1.77 Ni K 20.29 10.48 Ni K 3.60 1.52 Nb L 1.17 0.38 Nb L 0.88 0.24 Totals 100.00 Totals 100.00
Figure 4.16 Oxide formation on alloy HP exposed to air at 650ºC.
P1
P2
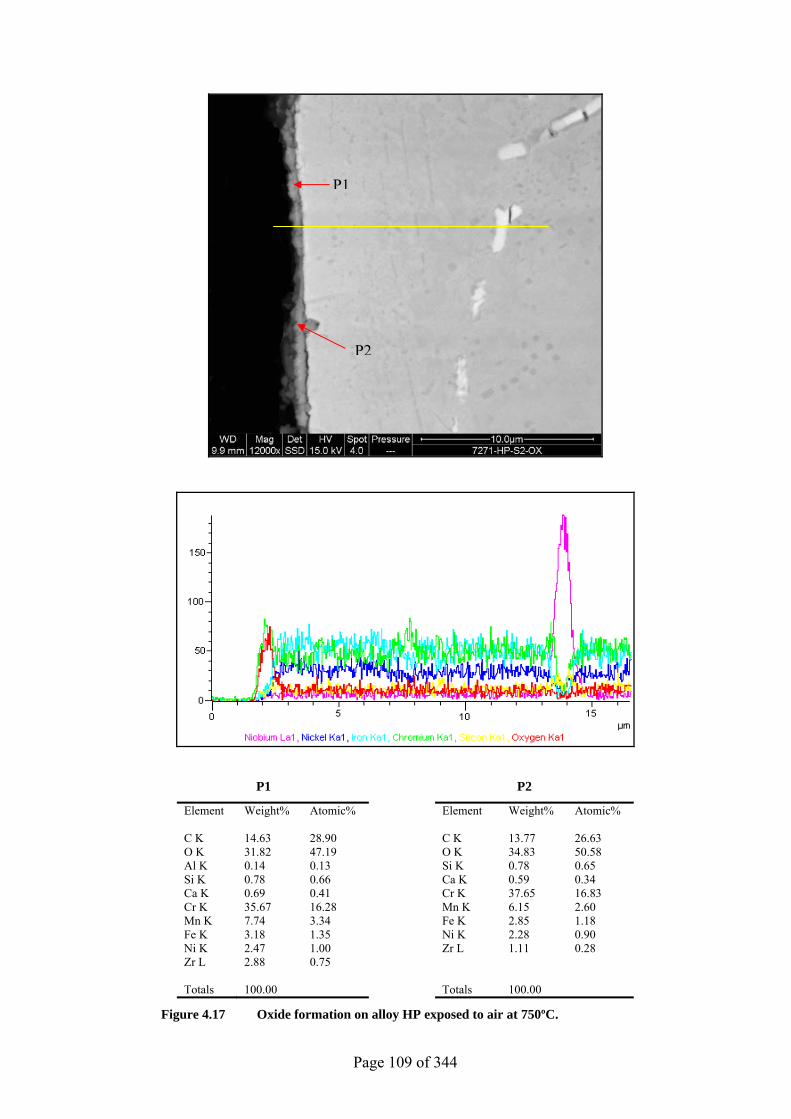
Page 109 of 344
P1 P2
Element Weight% Atomic% Element Weight% Atomic% C K 14.63 28.90 C K 13.77 26.63 O K 31.82 47.19 O K 34.83 50.58 Al K 0.14 0.13 Si K 0.78 0.65 Si K 0.78 0.66 Ca K 0.59 0.34 Ca K 0.69 0.41 Cr K 37.65 16.83 Cr K 35.67 16.28 Mn K 6.15 2.60 Mn K 7.74 3.34 Fe K 2.85 1.18 Fe K 3.18 1.35 Ni K 2.28 0.90 Ni K 2.47 1.00 Zr L 1.11 0.28 Zr L 2.88 0.75 Totals 100.00 Totals 100.00
Figure 4.17 Oxide formation on alloy HP exposed to air at 750ºC.
P1
P2
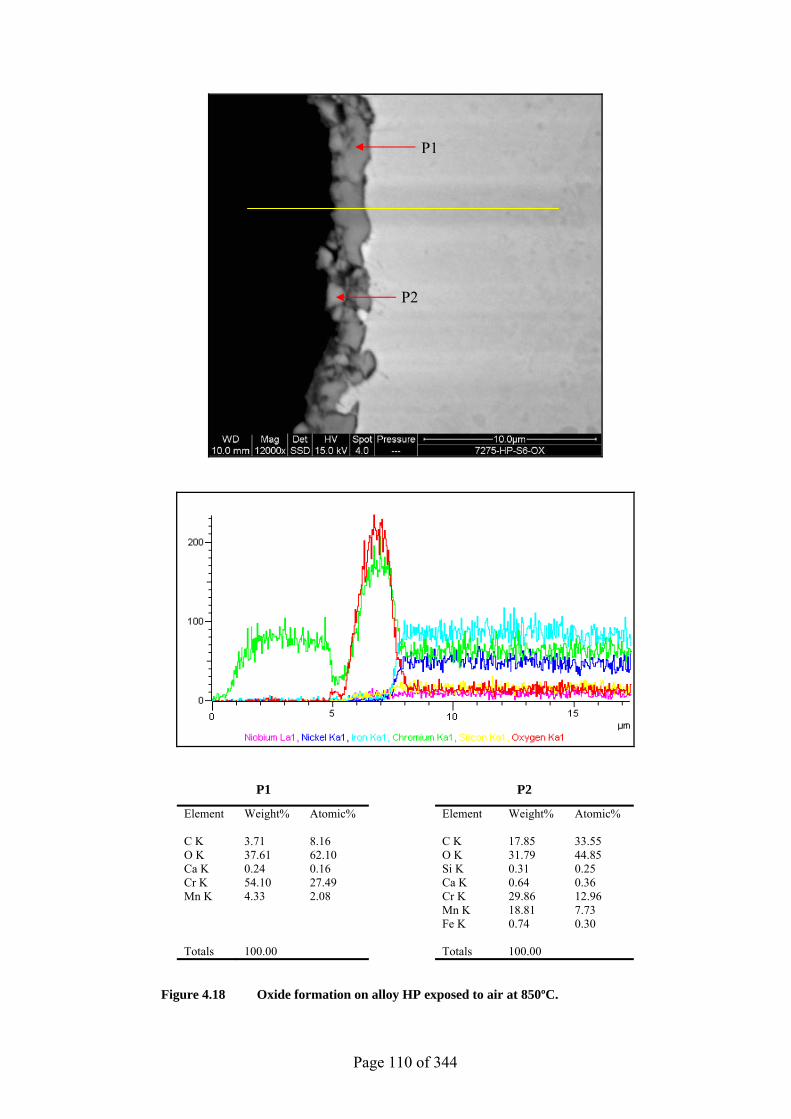
Page 110 of 344
P1 P2
Element Weight% Atomic% Element Weight% Atomic% C K 3.71 8.16 C K 17.85 33.55 O K 37.61 62.10 O K 31.79 44.85 Ca K 0.24 0.16 Si K 0.31 0.25 Cr K 54.10 27.49 Ca K 0.64 0.36 Mn K 4.33 2.08 Cr K 29.86 12.96 Mn K 18.81 7.73 Fe K 0.74 0.30 Totals 100.00 Totals 100.00
Figure 4.18 Oxide formation on alloy HP exposed to air at 850ºC.
P1
P2
Page 111 of 344
A thin oxide layer was observed on the 35Cr-45Ni specimen as a result of exposure to air
at 650ºC (Figure 4.19). The layer thickness varied from 0.2µm to 1.3µm, with typical
thickness of 0.8µm. Elemental analyses showed that O, Cr, and Mn were the major
constituents of the scale while Fe, Ni, and Si were the minor. A 2.5µm chromium depleted
area was noticed using the line profiling. The niobium peak detected by the line profiling
indicated the presence of niobium carbide phase (white precipitates).
Non uniform oxide thickness was also observed on the 35Cr-45Ni specimen as a result of
exposure to air at 750ºC (Figure 4.20). The layer thickness varied from 0.2µm to 1.2µm.
Elemental analyses showed that the scale was mainly composed of O, Cr, and Mn, with Fe,
Ni, and Si in minor amounts. However, higher amounts of Fe and Ni were detected at this
temperature. Approximately a 3.5µm chromium-depleted zone was observed by line
profiling.
A thicker oxide layer (~3.4µm) was observed on the alloy at 850ºC (Figure 4.21). The
layer appeared to be continuous, even, and dense. However, this should not imply that the
whole specimen was covered with such oxide as most of it suffered spallation during the
cooling down. The oxide layer was found to contain chromium oxide and some
manganese-containing spinel. Traces of Fe, Si, and Ni were also detected. The line
profiling showed the formation of some silicon oxide at the lower part of the chromium
oxide layer.
In short, the alloy 35Cr-45Ni underwent more oxide growth in direct proportion to the
exposure temperature. Consequently the oxide layer became denser, more uniform and
contained less nonprotective iron and nickel oxides.
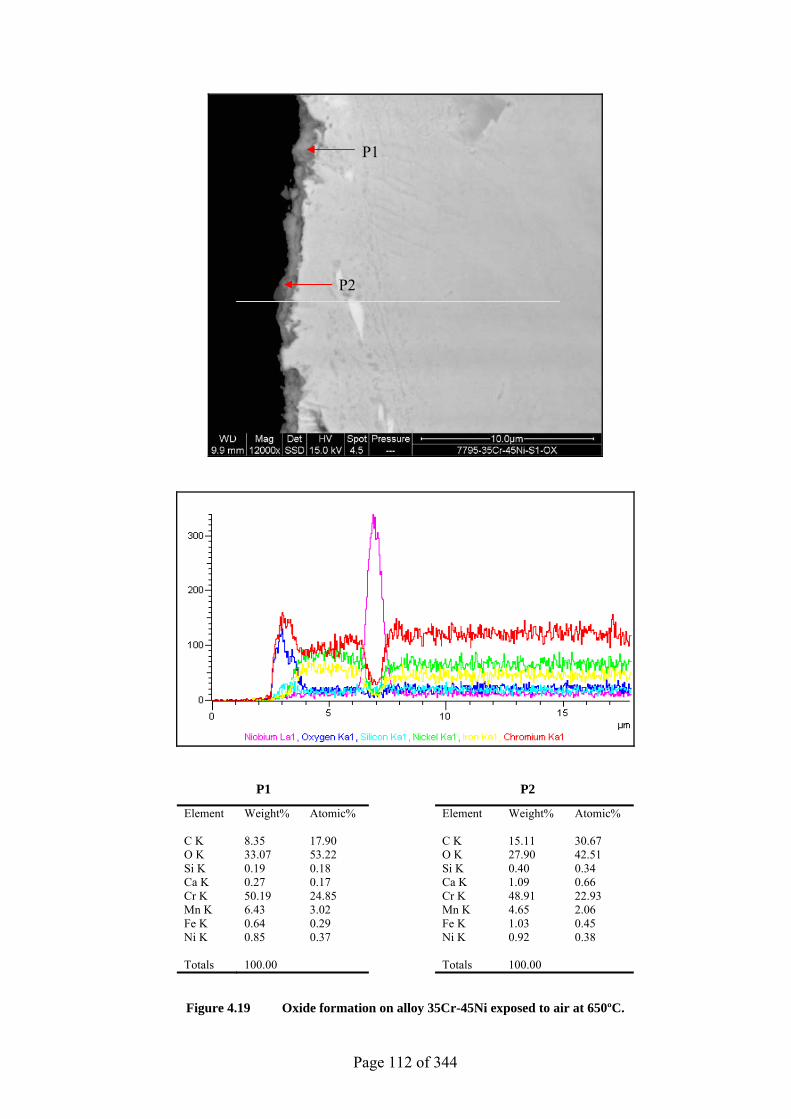
Page 112 of 344
P1 P2
Element Weight% Atomic% Element Weight% Atomic% C K 8.35 17.90 C K 15.11 30.67 O K 33.07 53.22 O K 27.90 42.51 Si K 0.19 0.18 Si K 0.40 0.34 Ca K 0.27 0.17 Ca K 1.09 0.66 Cr K 50.19 24.85 Cr K 48.91 22.93 Mn K 6.43 3.02 Mn K 4.65 2.06 Fe K 0.64 0.29 Fe K 1.03 0.45 Ni K 0.85 0.37 Ni K 0.92 0.38 Totals 100.00 Totals 100.00
Figure 4.19 Oxide formation on alloy 35Cr-45Ni exposed to air at 650ºC.
P1
P2
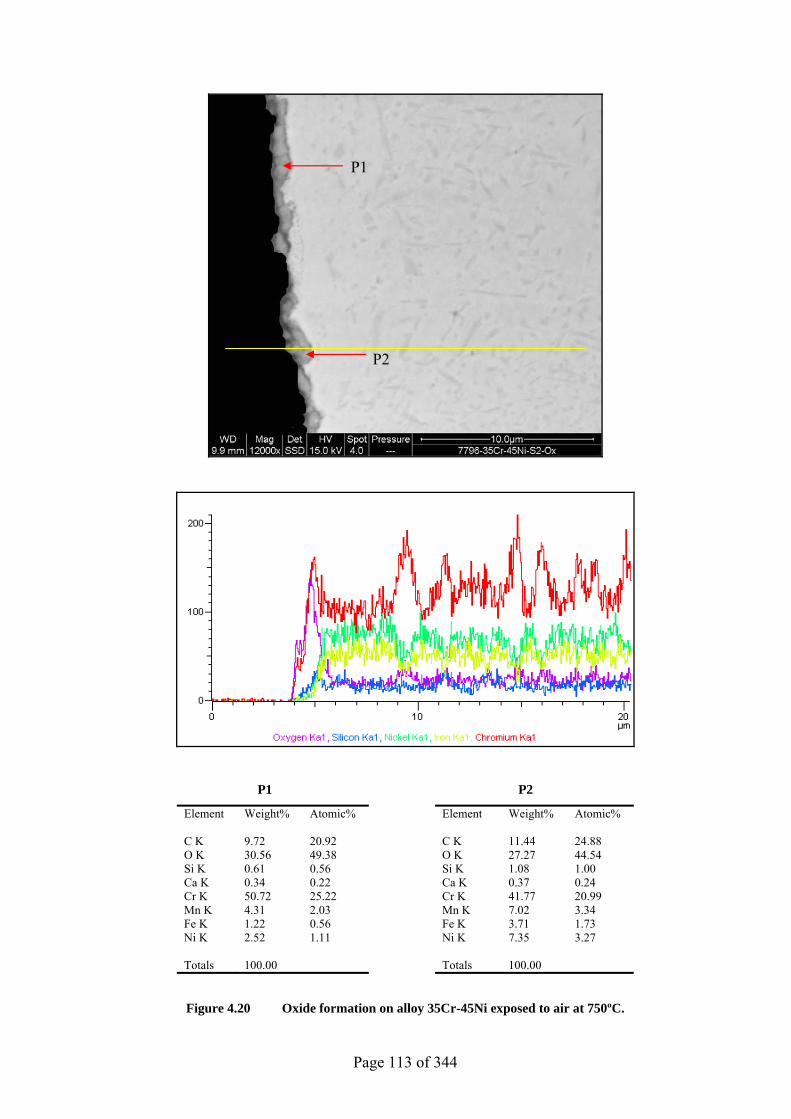
Page 113 of 344
P1 P2
Element Weight% Atomic% Element Weight% Atomic% C K 9.72 20.92 C K 11.44 24.88 O K 30.56 49.38 O K 27.27 44.54 Si K 0.61 0.56 Si K 1.08 1.00 Ca K 0.34 0.22 Ca K 0.37 0.24 Cr K 50.72 25.22 Cr K 41.77 20.99 Mn K 4.31 2.03 Mn K 7.02 3.34 Fe K 1.22 0.56 Fe K 3.71 1.73 Ni K 2.52 1.11 Ni K 7.35 3.27 Totals 100.00 Totals 100.00
Figure 4.20 Oxide formation on alloy 35Cr-45Ni exposed to air at 750ºC.
P1
P2
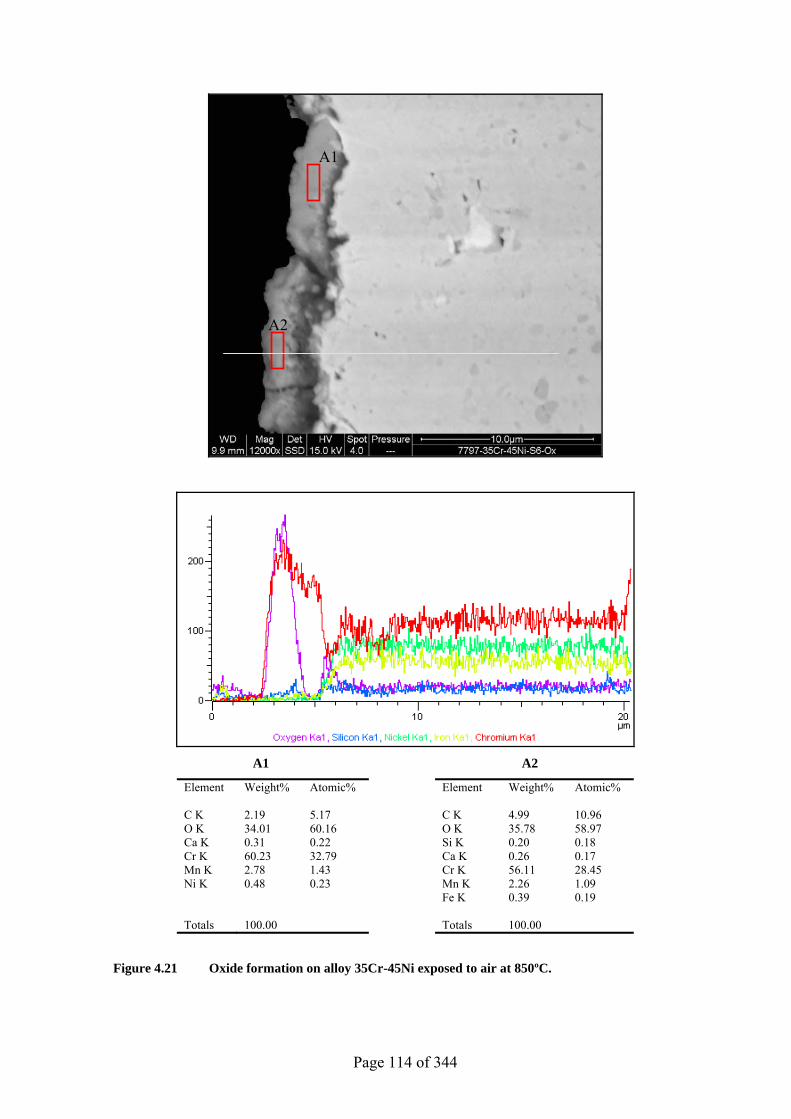
Page 114 of 344
A1 A2
Element Weight% Atomic% Element Weight% Atomic% C K 2.19 5.17 C K 4.99 10.96 O K 34.01 60.16 O K 35.78 58.97 Ca K 0.31 0.22 Si K 0.20 0.18 Cr K 60.23 32.79 Ca K 0.26 0.17 Mn K 2.78 1.43 Cr K 56.11 28.45 Ni K 0.48 0.23 Mn K 2.26 1.09 Fe K 0.39 0.19 Totals 100.00 Totals 100.00
Figure 4.21 Oxide formation on alloy 35Cr-45Ni exposed to air at 850ºC.
A1
A2
Page 115 of 344
A thin, non uniform oxide layer had formed on the alloy UCX after exposure at 650ºC
(Figure 4.22). The layer formed was 0.2µm thick with some localised 1.2µm oxides. A
2.5µm chromium depleted area could be noted at the substrate. The layer was mainly
composed of O, Cr, Mn, Fe, and Ni.
A non uniform layer, with thickness varying from about 0.3µm to 1.4µm, had formed on
the UCX alloy after the 750ºC test (Figure 4.23). The layer was composed of O, Si, Cr,
Mn, and Ni (P1). Compared with oxides formed at 650ºC, this layer contained higher
amounts of Si, Mn, and oxygen and lower amounts of Ni, with no iron detected. The
elemental analysis of the phase, A1, revealed that it contained mainly chromium-rich
carbide with a considerable amount of tungsten. The photomicrograph showed the
presence of a chromium-depleted zone of about 5µm in depth.
Much thicker, denser, and more even oxide scale was found to have formed on the alloy
at 850ºC, see Figure 4.24. The layer was typically 3µm thick, although there were some
localised areas in which thicker oxides formed (~7µm). The oxide layer was mainly
chromium oxide with some Mn, Ni, and Si-containing oxides. From the line profiling it is
evident that a silicon rich layer had formed just at the alloy/chromium oxide interface.
Approximately a 15µm chromium depleted zone was observed at the substrate. From the
EDX results, it is obvious that iron and nickel levels in the oxides were reduced as a
consequence of increasing the exposure temperature. This was also accompanied by
significant scale growth, from 0.2µm to 3µm.
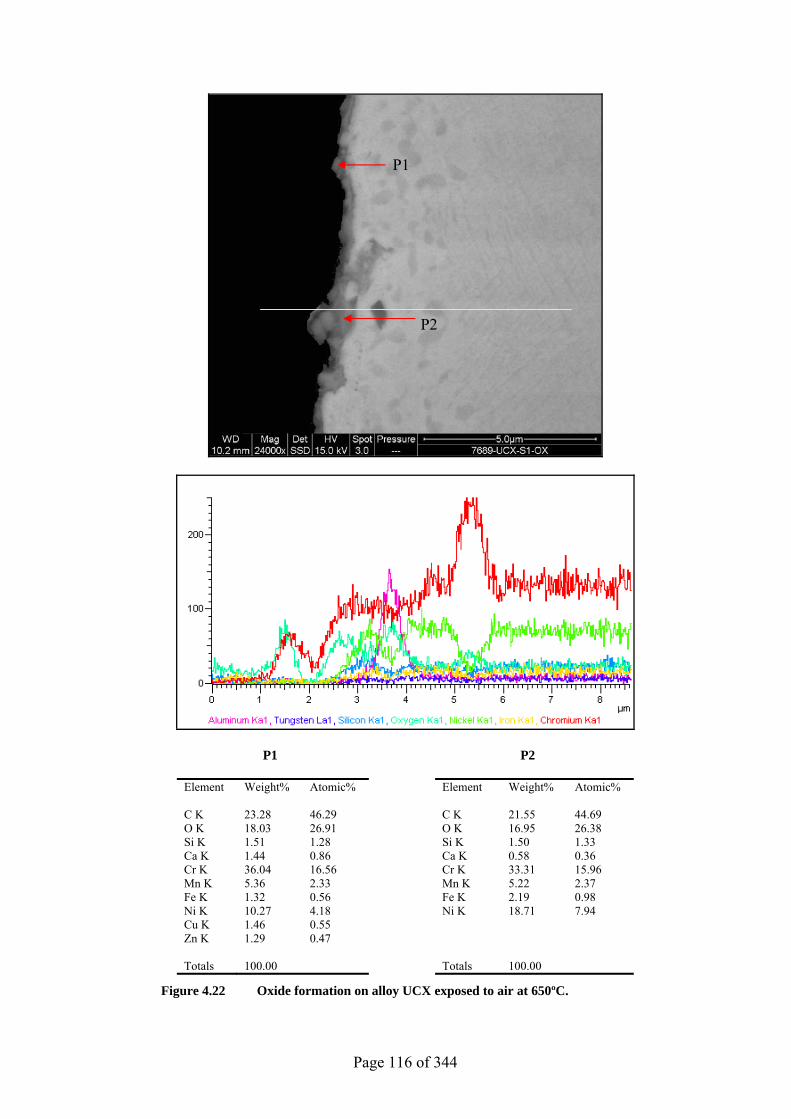
Page 116 of 344
P1 P2
Element Weight% Atomic% Element Weight% Atomic% C K 23.28 46.29 C K 21.55 44.69 O K 18.03 26.91 O K 16.95 26.38 Si K 1.51 1.28 Si K 1.50 1.33 Ca K 1.44 0.86 Ca K 0.58 0.36 Cr K 36.04 16.56 Cr K 33.31 15.96 Mn K 5.36 2.33 Mn K 5.22 2.37 Fe K 1.32 0.56 Fe K 2.19 0.98 Ni K 10.27 4.18 Ni K 18.71 7.94 Cu K 1.46 0.55 Zn K 1.29 0.47 Totals 100.00 Totals 100.00
Figure 4.22 Oxide formation on alloy UCX exposed to air at 650ºC.
P1
P2
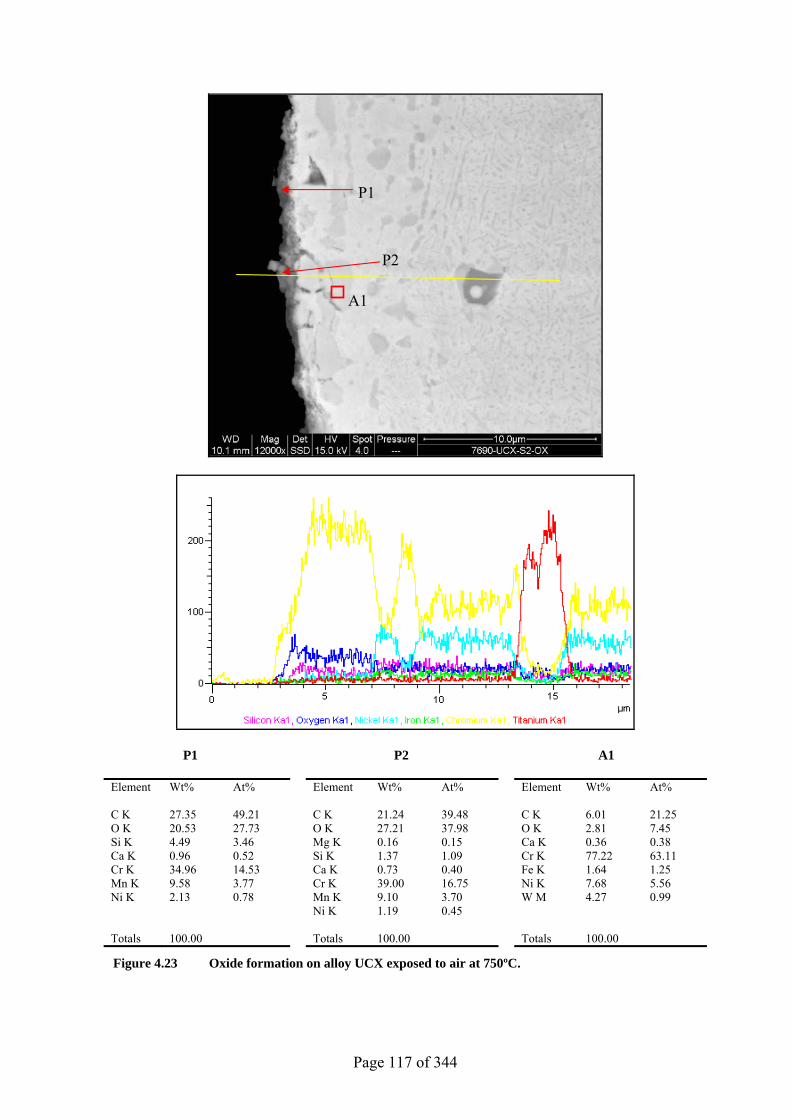
Page 117 of 344
P1 P2 A1
Element Wt% At% Element Wt% At% Element Wt% At% C K 27.35 49.21 C K 21.24 39.48 C K 6.01 21.25 O K 20.53 27.73 O K 27.21 37.98 O K 2.81 7.45 Si K 4.49 3.46 Mg K 0.16 0.15 Ca K 0.36 0.38 Ca K 0.96 0.52 Si K 1.37 1.09 Cr K 77.22 63.11 Cr K 34.96 14.53 Ca K 0.73 0.40 Fe K 1.64 1.25 Mn K 9.58 3.77 Cr K 39.00 16.75 Ni K 7.68 5.56 Ni K 2.13 0.78 Mn K 9.10 3.70 W M 4.27 0.99 Ni K 1.19 0.45 Totals 100.00 Totals 100.00 Totals 100.00
Figure 4.23 Oxide formation on alloy UCX exposed to air at 750ºC.
P1
P2
A1
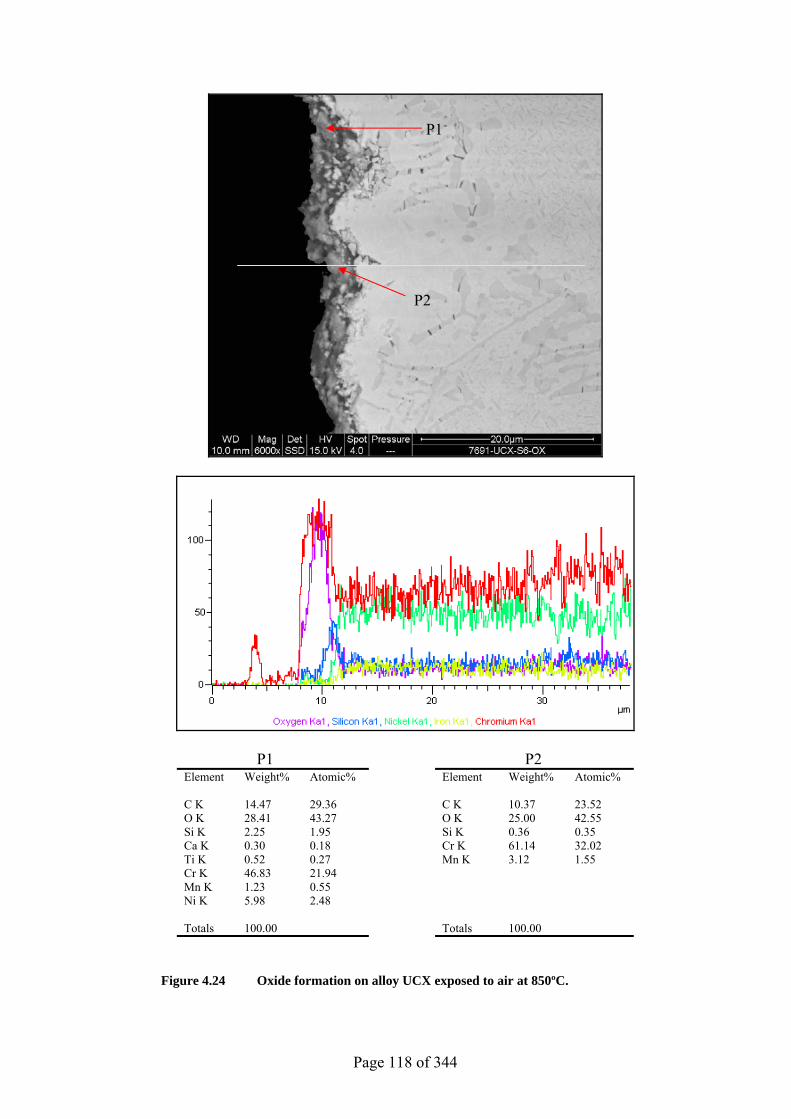
Page 118 of 344
P1 P2 Element Weight% Atomic% Element Weight% Atomic% C K 14.47 29.36 C K 10.37 23.52 O K 28.41 43.27 O K 25.00 42.55 Si K 2.25 1.95 Si K 0.36 0.35 Ca K 0.30 0.18 Cr K 61.14 32.02 Ti K 0.52 0.27 Mn K 3.12 1.55 Cr K 46.83 21.94 Mn K 1.23 0.55 Ni K 5.98 2.48 Totals 100.00 Totals 100.00
Figure 4.24 Oxide formation on alloy UCX exposed to air at 850ºC.
P1
P2
Page 119 of 344
4.4.2 Long-Term Tests (1000h)
4.4.2.1 Visual Examination
The specimens tested at 650, 750, and 850ºC were visually inspected and photographed,
directly after the removal from the furnace.
Blackish deposits covered the alloys oxidised at 650ºC and appeared to be the densest on
HP. However, alloys 35Cr-45Ni and UCX were not entirely covered as some shiny areas
could be spotted particularly along the edges.
The effect of the exposure time can be understood by referring to the 100h test, where the
post exposure examination revealed that the alloys experienced just a little oxidation.
More oxidation took place on the 750ºC specimens, and the surfaces seemed to have been
completely covered with blackish oxides that were much denser than those formed after
100h at the same temperature.
The samples, after exposure at 850ºC, were still covered with some oxides despite
considerable spallation observed on all of them after furnace cooling. However, the
percentage of oxidation varied on the sample surfaces as high densities of localised darker
spots were noticed on each alloy suggesting the occurrence of selective oxidation.
Collectively, prolonging the exposure time undoubtedly allowed more oxides to grow on
the alloys at the three temperatures. Nevertheless, the degree of oxide growth was
apparently, strongly dependent on temperature. As the exposure temperature was
increased, the oxide density increased.
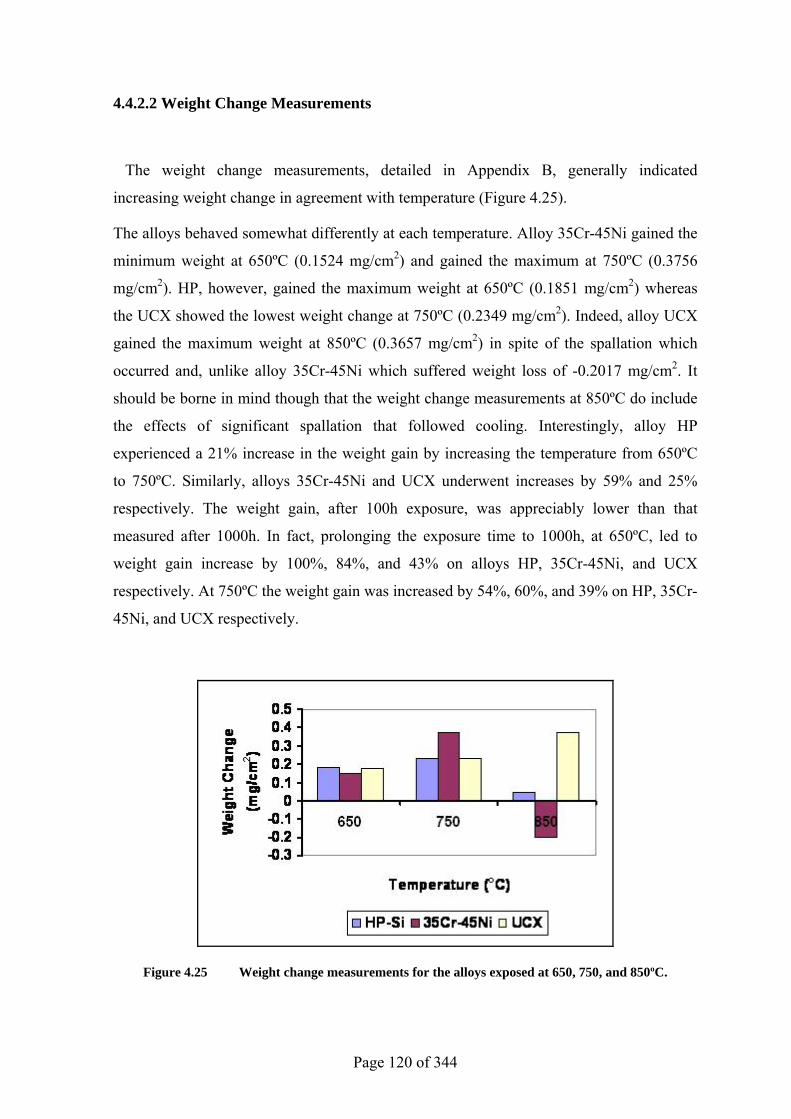
Page 120 of 344
4.4.2.2 Weight Change Measurements
The weight change measurements, detailed in Appendix B, generally indicated
increasing weight change in agreement with temperature (Figure 4.25).
The alloys behaved somewhat differently at each temperature. Alloy 35Cr-45Ni gained the
minimum weight at 650ºC (0.1524 mg/cm2) and gained the maximum at 750ºC (0.3756
mg/cm2). HP, however, gained the maximum weight at 650ºC (0.1851 mg/cm2) whereas
the UCX showed the lowest weight change at 750ºC (0.2349 mg/cm2). Indeed, alloy UCX
gained the maximum weight at 850ºC (0.3657 mg/cm2) in spite of the spallation which
occurred and, unlike alloy 35Cr-45Ni which suffered weight loss of -0.2017 mg/cm2. It
should be borne in mind though that the weight change measurements at 850ºC do include
the effects of significant spallation that followed cooling. Interestingly, alloy HP
experienced a 21% increase in the weight gain by increasing the temperature from 650ºC
to 750ºC. Similarly, alloys 35Cr-45Ni and UCX underwent increases by 59% and 25%
respectively. The weight gain, after 100h exposure, was appreciably lower than that
measured after 1000h. In fact, prolonging the exposure time to 1000h, at 650ºC, led to
weight gain increase by 100%, 84%, and 43% on alloys HP, 35Cr-45Ni, and UCX
respectively. At 750ºC the weight gain was increased by 54%, 60%, and 39% on HP, 35Cr-
45Ni, and UCX respectively.
Figure 4.25 Weight change measurements for the alloys exposed at 650, 750, and 850ºC.
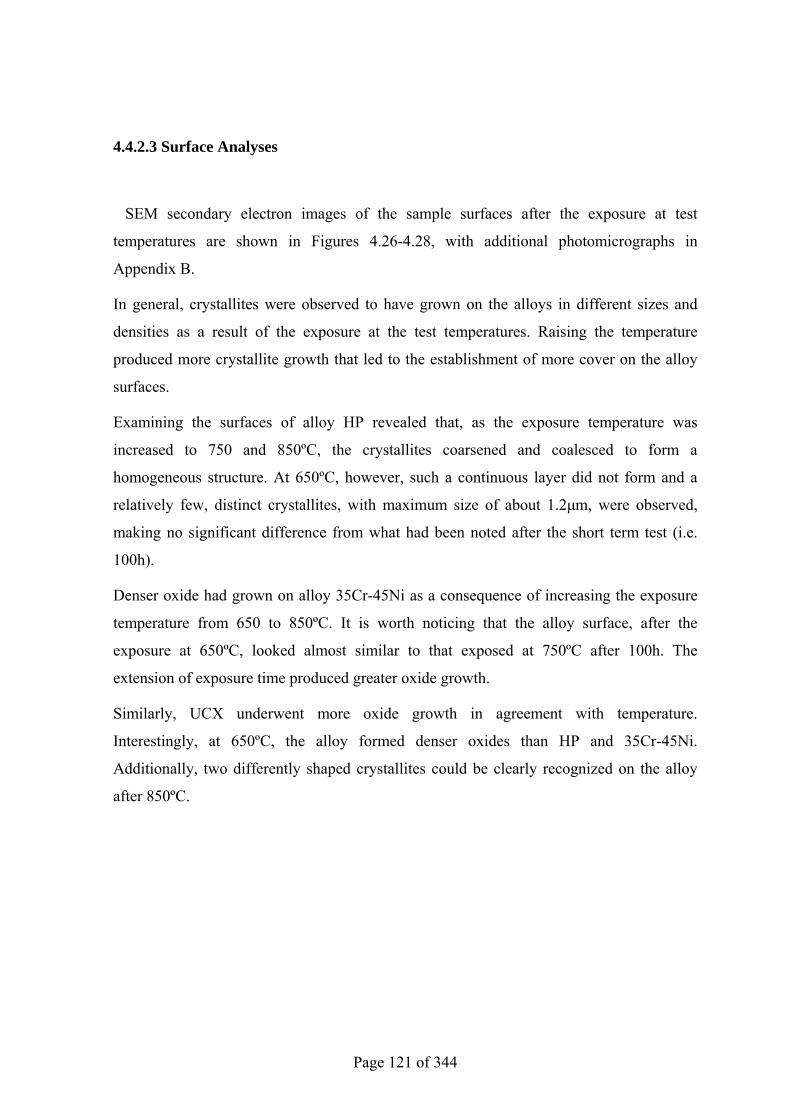
Page 121 of 344
4.4.2.3 Surface Analyses
SEM secondary electron images of the sample surfaces after the exposure at test
temperatures are shown in Figures 4.26-4.28, with additional photomicrographs in
Appendix B.
In general, crystallites were observed to have grown on the alloys in different sizes and
densities as a result of the exposure at the test temperatures. Raising the temperature
produced more crystallite growth that led to the establishment of more cover on the alloy
surfaces.
Examining the surfaces of alloy HP revealed that, as the exposure temperature was
increased to 750 and 850ºC, the crystallites coarsened and coalesced to form a
homogeneous structure. At 650ºC, however, such a continuous layer did not form and a
relatively few, distinct crystallites, with maximum size of about 1.2µm, were observed,
making no significant difference from what had been noted after the short term test (i.e.
100h).
Denser oxide had grown on alloy 35Cr-45Ni as a consequence of increasing the exposure
temperature from 650 to 850ºC. It is worth noticing that the alloy surface, after the
exposure at 650ºC, looked almost similar to that exposed at 750ºC after 100h. The
extension of exposure time produced greater oxide growth.
Similarly, UCX underwent more oxide growth in agreement with temperature.
Interestingly, at 650ºC, the alloy formed denser oxides than HP and 35Cr-45Ni.
Additionally, two differently shaped crystallites could be clearly recognized on the alloy
after 850ºC.
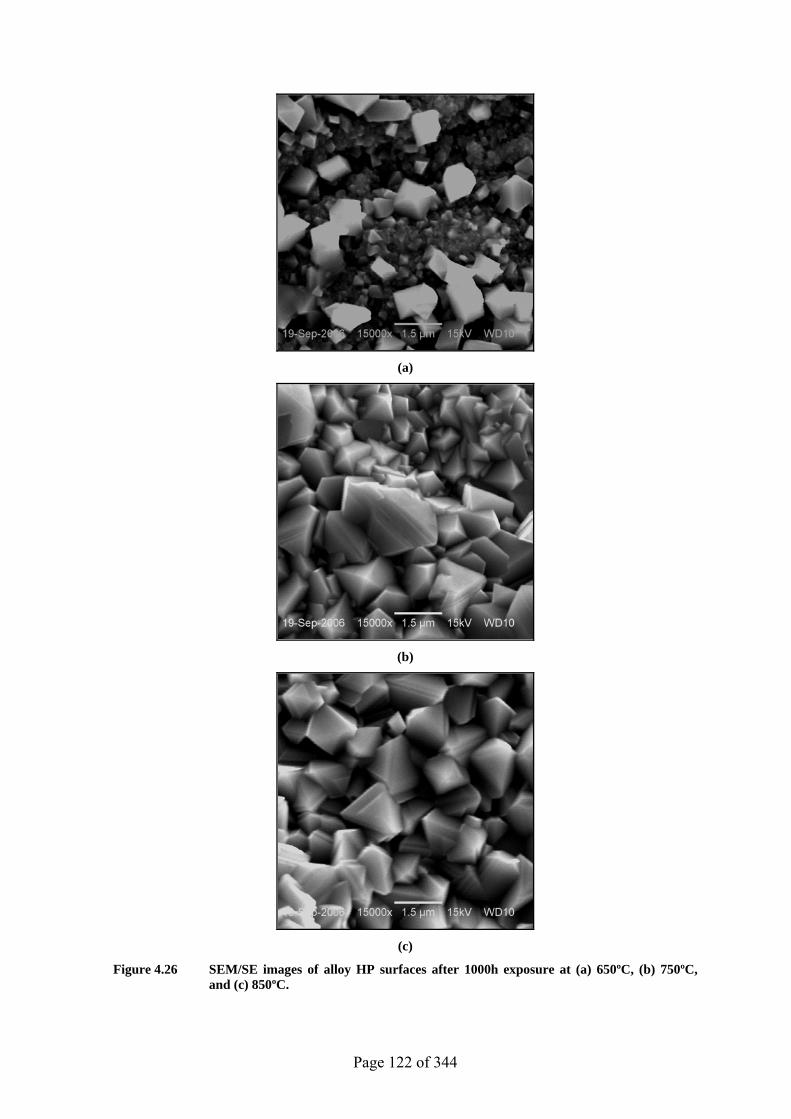
Page 122 of 344
(a)
(b)
(c)
Figure 4.26 SEM/SE images of alloy HP surfaces after 1000h exposure at (a) 650ºC, (b) 750ºC, and (c) 850ºC.
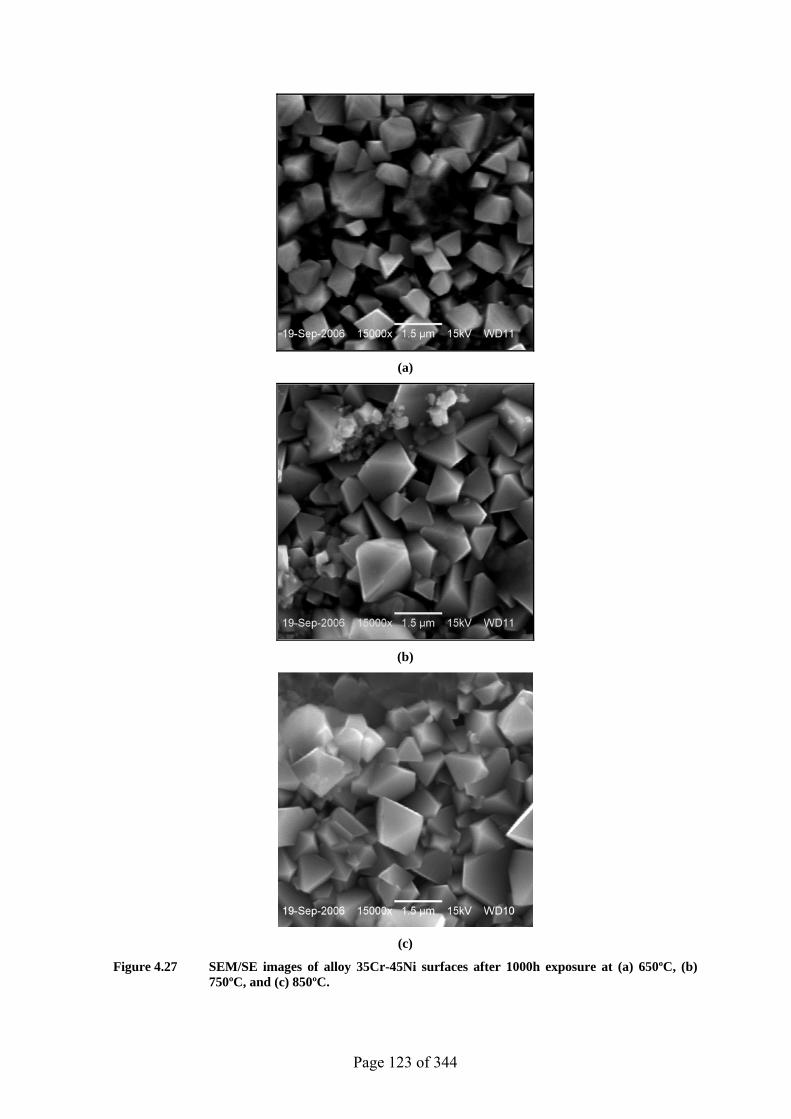
Page 123 of 344
(a)
(b)
(c)
Figure 4.27 SEM/SE images of alloy 35Cr-45Ni surfaces after 1000h exposure at (a) 650ºC, (b) 750ºC, and (c) 850ºC.
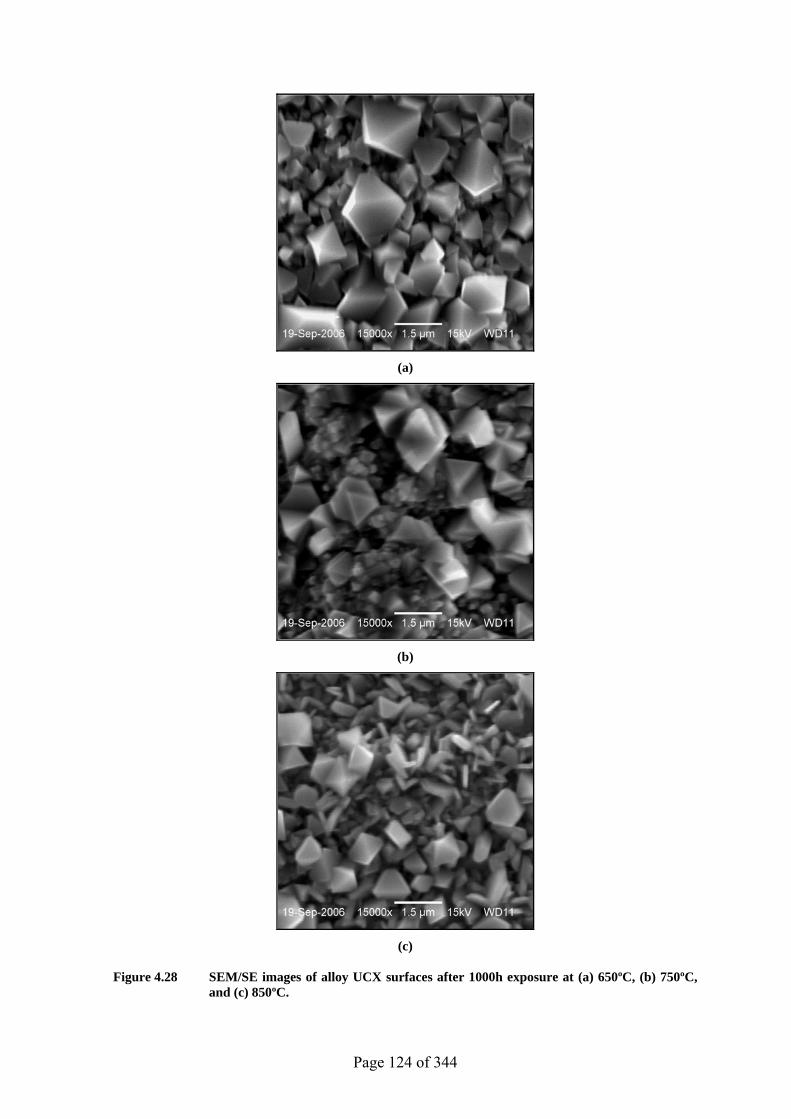
Page 124 of 344
(a)
(b)
(c)
Figure 4.28 SEM/SE images of alloy UCX surfaces after 1000h exposure at (a) 650ºC, (b) 750ºC, and (c) 850ºC.
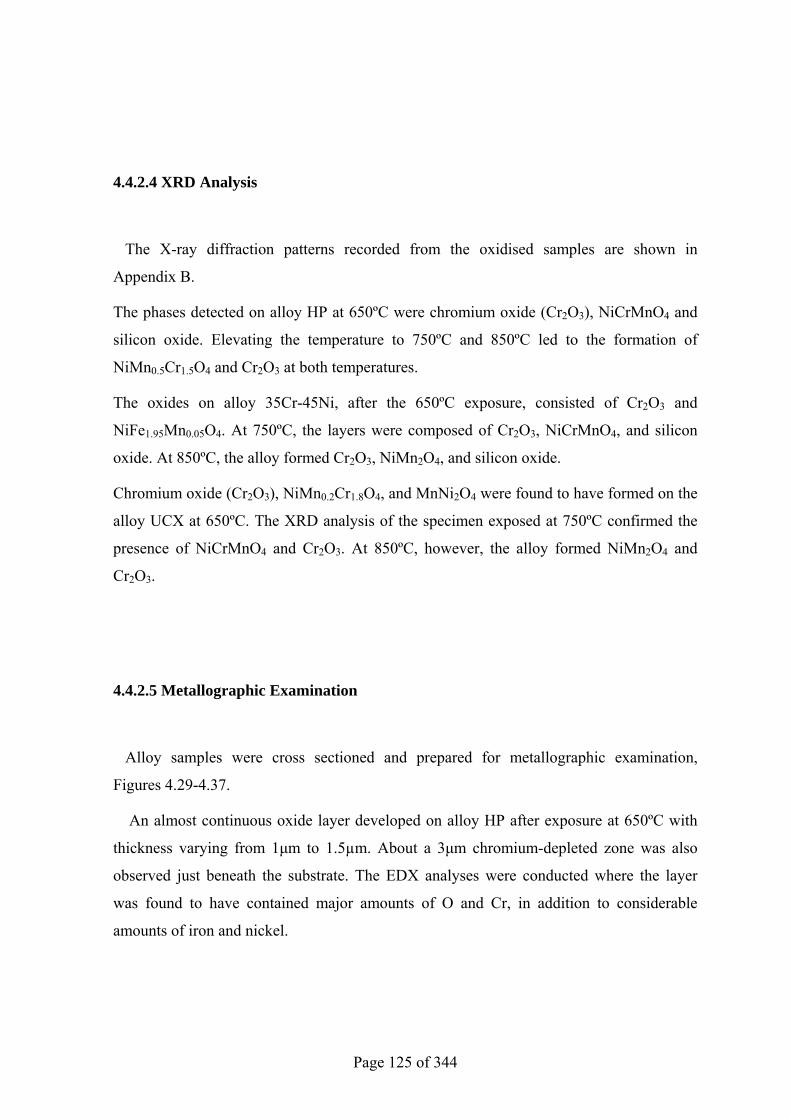
Page 125 of 344
4.4.2.4 XRD Analysis
The X-ray diffraction patterns recorded from the oxidised samples are shown in
Appendix B.
The phases detected on alloy HP at 650ºC were chromium oxide (Cr2O3), NiCrMnO4 and
silicon oxide. Elevating the temperature to 750ºC and 850ºC led to the formation of
NiMn0.5Cr1.5O4 and Cr2O3 at both temperatures.
The oxides on alloy 35Cr-45Ni, after the 650ºC exposure, consisted of Cr2O3 and
NiFe1.95Mn0.05O4. At 750ºC, the layers were composed of Cr2O3, NiCrMnO4, and silicon
oxide. At 850ºC, the alloy formed Cr2O3, NiMn2O4, and silicon oxide.
Chromium oxide (Cr2O3), NiMn0.2Cr1.8O4, and MnNi2O4 were found to have formed on the
alloy UCX at 650ºC. The XRD analysis of the specimen exposed at 750ºC confirmed the
presence of NiCrMnO4 and Cr2O3. At 850ºC, however, the alloy formed NiMn2O4 and
Cr2O3.
4.4.2.5 Metallographic Examination
Alloy samples were cross sectioned and prepared for metallographic examination,
Figures 4.29-4.37.
An almost continuous oxide layer developed on alloy HP after exposure at 650ºC with
thickness varying from 1µm to 1.5µm. About a 3µm chromium-depleted zone was also
observed just beneath the substrate. The EDX analyses were conducted where the layer
was found to have contained major amounts of O and Cr, in addition to considerable
amounts of iron and nickel.
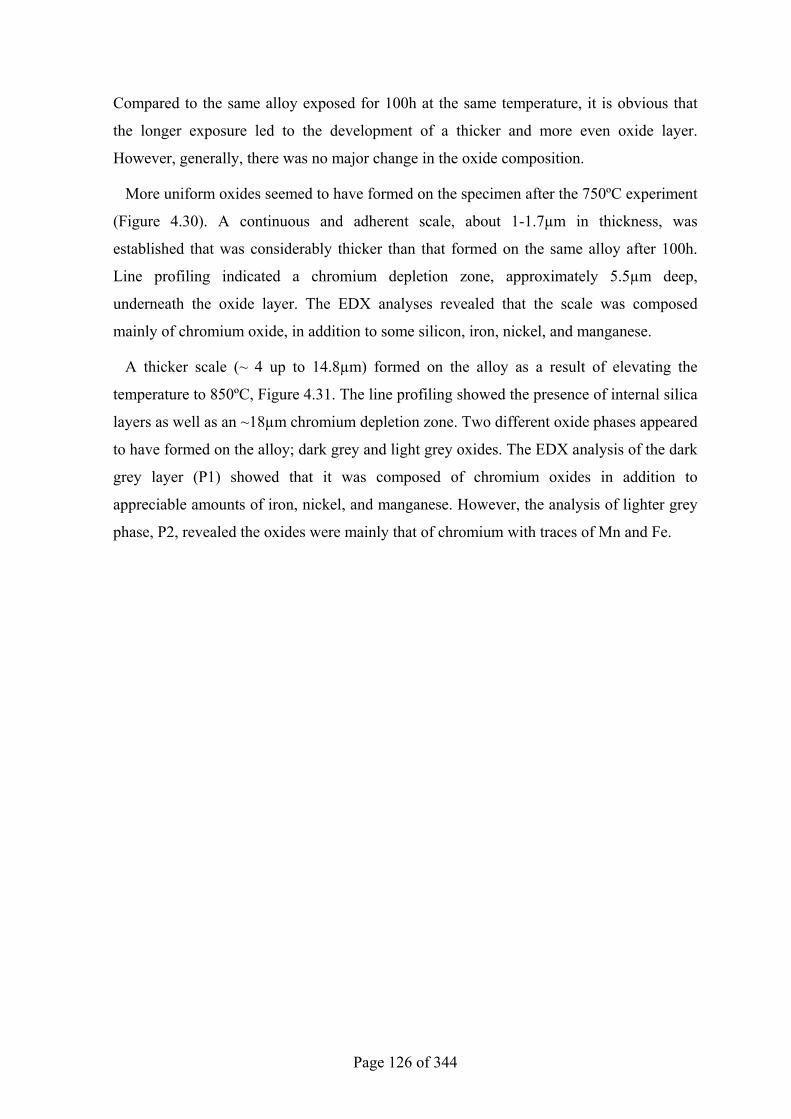
Page 126 of 344
Compared to the same alloy exposed for 100h at the same temperature, it is obvious that
the longer exposure led to the development of a thicker and more even oxide layer.
However, generally, there was no major change in the oxide composition.
More uniform oxides seemed to have formed on the specimen after the 750ºC experiment
(Figure 4.30). A continuous and adherent scale, about 1-1.7µm in thickness, was
established that was considerably thicker than that formed on the same alloy after 100h.
Line profiling indicated a chromium depletion zone, approximately 5.5µm deep,
underneath the oxide layer. The EDX analyses revealed that the scale was composed
mainly of chromium oxide, in addition to some silicon, iron, nickel, and manganese.
A thicker scale (~ 4 up to 14.8µm) formed on the alloy as a result of elevating the
temperature to 850ºC, Figure 4.31. The line profiling showed the presence of internal silica
layers as well as an ~18µm chromium depletion zone. Two different oxide phases appeared
to have formed on the alloy; dark grey and light grey oxides. The EDX analysis of the dark
grey layer (P1) showed that it was composed of chromium oxides in addition to
appreciable amounts of iron, nickel, and manganese. However, the analysis of lighter grey
phase, P2, revealed the oxides were mainly that of chromium with traces of Mn and Fe.
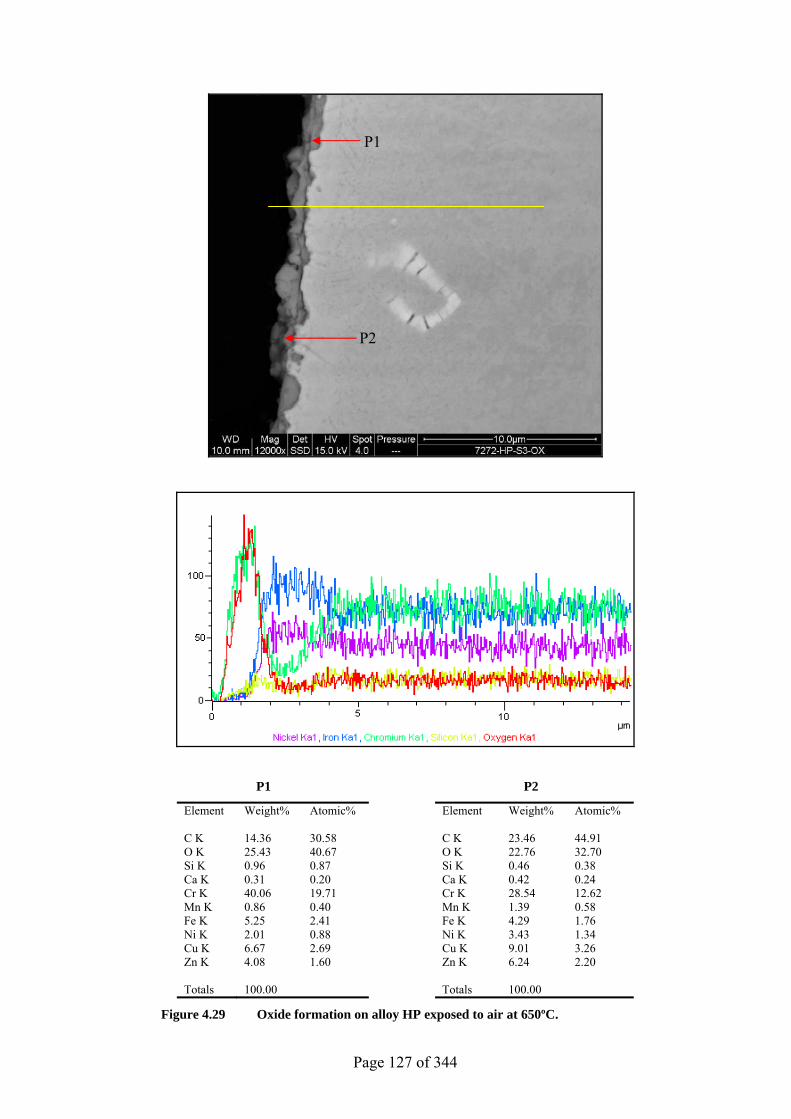
Page 127 of 344
P1 P2
Element Weight% Atomic% Element Weight% Atomic% C K 14.36 30.58 C K 23.46 44.91 O K 25.43 40.67 O K 22.76 32.70 Si K 0.96 0.87 Si K 0.46 0.38 Ca K 0.31 0.20 Ca K 0.42 0.24 Cr K 40.06 19.71 Cr K 28.54 12.62 Mn K 0.86 0.40 Mn K 1.39 0.58 Fe K 5.25 2.41 Fe K 4.29 1.76 Ni K 2.01 0.88 Ni K 3.43 1.34 Cu K 6.67 2.69 Cu K 9.01 3.26 Zn K 4.08 1.60 Zn K 6.24 2.20 Totals 100.00 Totals 100.00
Figure 4.29 Oxide formation on alloy HP exposed to air at 650ºC.
P1
P2
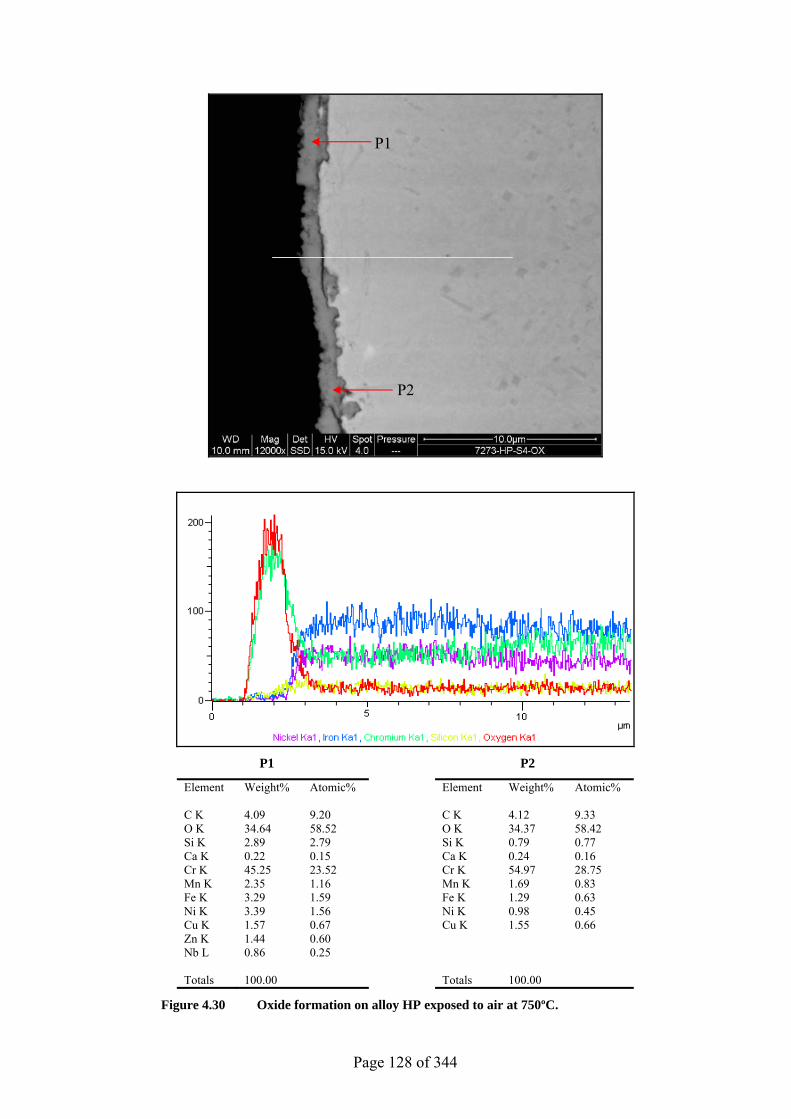
Page 128 of 344
P1 P2
Element Weight% Atomic% Element Weight% Atomic% C K 4.09 9.20 C K 4.12 9.33 O K 34.64 58.52 O K 34.37 58.42 Si K 2.89 2.79 Si K 0.79 0.77 Ca K 0.22 0.15 Ca K 0.24 0.16 Cr K 45.25 23.52 Cr K 54.97 28.75 Mn K 2.35 1.16 Mn K 1.69 0.83 Fe K 3.29 1.59 Fe K 1.29 0.63 Ni K 3.39 1.56 Ni K 0.98 0.45 Cu K 1.57 0.67 Cu K 1.55 0.66 Zn K 1.44 0.60 Nb L 0.86 0.25 Totals 100.00 Totals 100.00
Figure 4.30 Oxide formation on alloy HP exposed to air at 750ºC.
P1
P2
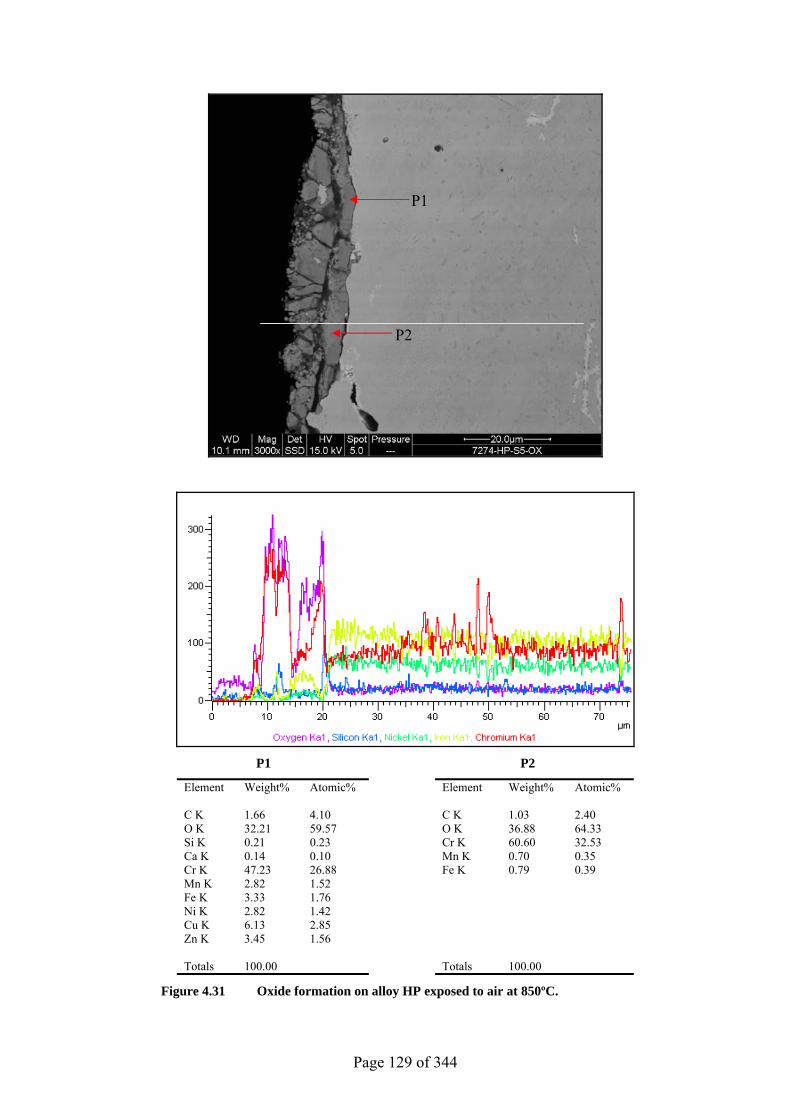
Page 129 of 344
P1 P2
Element Weight% Atomic% Element Weight% Atomic% C K 1.66 4.10 C K 1.03 2.40 O K 32.21 59.57 O K 36.88 64.33 Si K 0.21 0.23 Cr K 60.60 32.53 Ca K 0.14 0.10 Mn K 0.70 0.35 Cr K 47.23 26.88 Fe K 0.79 0.39 Mn K 2.82 1.52 Fe K 3.33 1.76 Ni K 2.82 1.42 Cu K 6.13 2.85 Zn K 3.45 1.56 Totals 100.00 Totals 100.00
Figure 4.31 Oxide formation on alloy HP exposed to air at 850ºC.
P1
P2
Page 130 of 344
A relatively uneven layer had formed on 35Cr-45Ni after exposure at 650ºC, see Figure
4.32. The layer was found to be very thin in some localised areas (~ 0.4µm) but it was 3µm
thick in other areas. Moreover, this layer was thicker than that formed on the same alloy
after 100h exposure (i.e. 0.2-1.3µm). The line profiling showed that the layer was mainly
composed of chromium oxides and some silicon oxides that produced a chromium depleted
zone of about 3µm. The chromium peaks along the scan line indicated the presence of
chromium carbides. The EDX spot analyses confirmed that the oxides contained chromium
as the major constituent as well as some iron, nickel, and manganese.
After exposure at 750ºC (Figure 4.33) a scale of 4-6µm had formed in a continuous
manner and was much thicker than that observed on the alloy after 100h (0.2-1.2µm).
Moreover, a chromium-depleted zone, around 14µm, was shown by line scanning. The
oxide layer was found to have contained predominantly chromium and oxygen in addition
to minor quantities of manganese, iron, and nickel.
Due to severe spallation, the thickness of the oxide layer formed on the alloy after the
850ºC exposure could not be accurately measured, as no area was found intact during the
SEM examination, Figure 4.34. However, the oxide contents were determined, by EDX, to
have been chromium and nickel in addition to some iron and silicon.
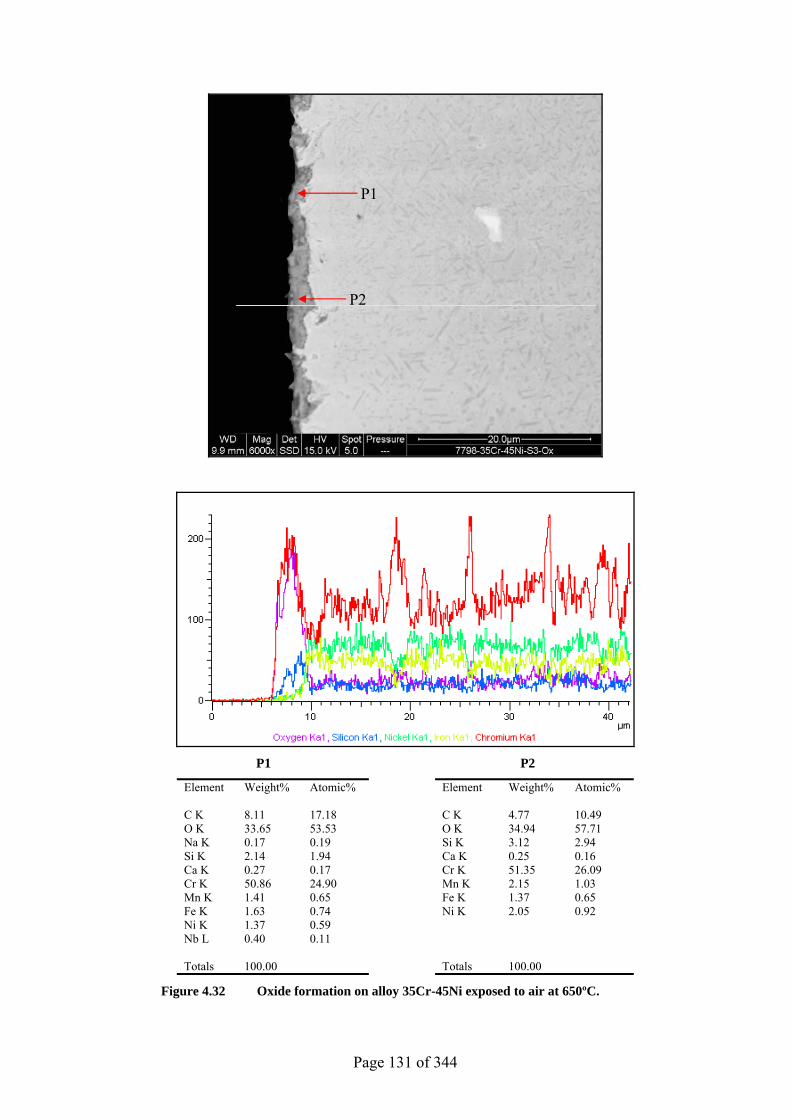
Page 131 of 344
P1 P2
Element Weight% Atomic% Element Weight% Atomic% C K 8.11 17.18 C K 4.77 10.49 O K 33.65 53.53 O K 34.94 57.71 Na K 0.17 0.19 Si K 3.12 2.94 Si K 2.14 1.94 Ca K 0.25 0.16 Ca K 0.27 0.17 Cr K 51.35 26.09 Cr K 50.86 24.90 Mn K 2.15 1.03 Mn K 1.41 0.65 Fe K 1.37 0.65 Fe K 1.63 0.74 Ni K 2.05 0.92 Ni K 1.37 0.59 Nb L 0.40 0.11 Totals 100.00 Totals 100.00
Figure 4.32 Oxide formation on alloy 35Cr-45Ni exposed to air at 650ºC.
P1
P2
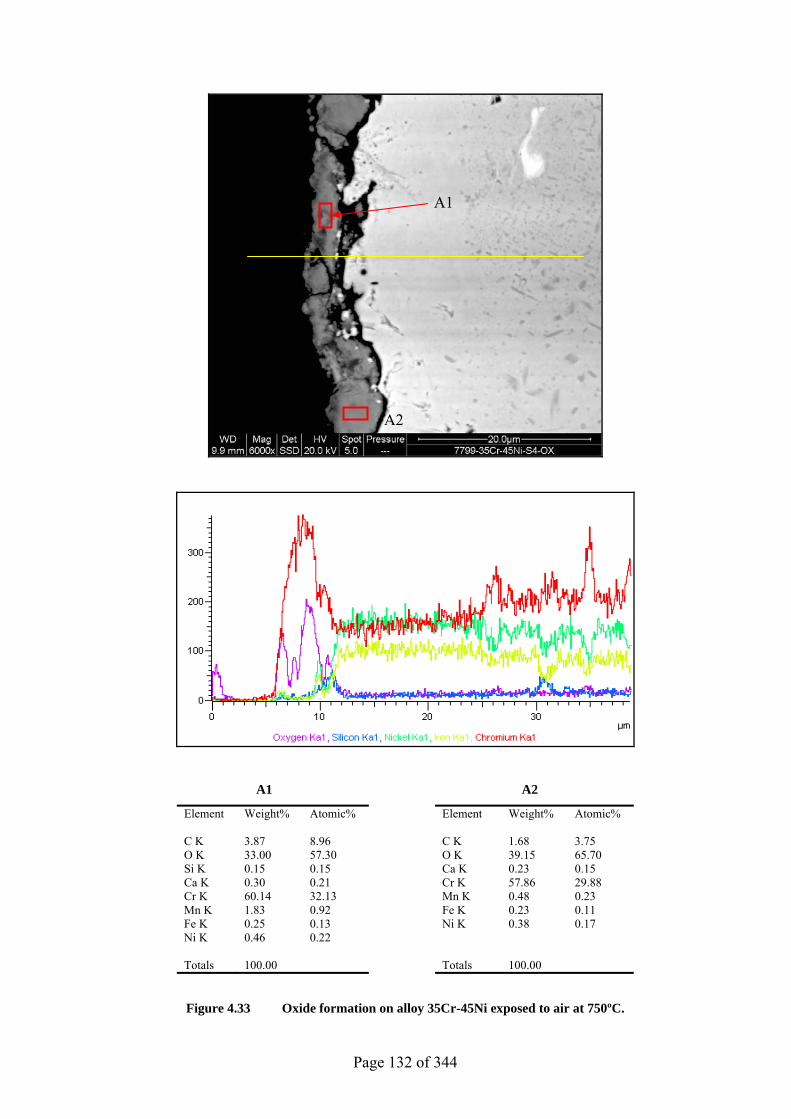
Page 132 of 344
A1 A2
Element Weight% Atomic% Element Weight% Atomic% C K 3.87 8.96 C K 1.68 3.75 O K 33.00 57.30 O K 39.15 65.70 Si K 0.15 0.15 Ca K 0.23 0.15 Ca K 0.30 0.21 Cr K 57.86 29.88 Cr K 60.14 32.13 Mn K 0.48 0.23 Mn K 1.83 0.92 Fe K 0.23 0.11 Fe K 0.25 0.13 Ni K 0.38 0.17 Ni K 0.46 0.22 Totals 100.00 Totals 100.00
Figure 4.33 Oxide formation on alloy 35Cr-45Ni exposed to air at 750ºC.
A1
A2
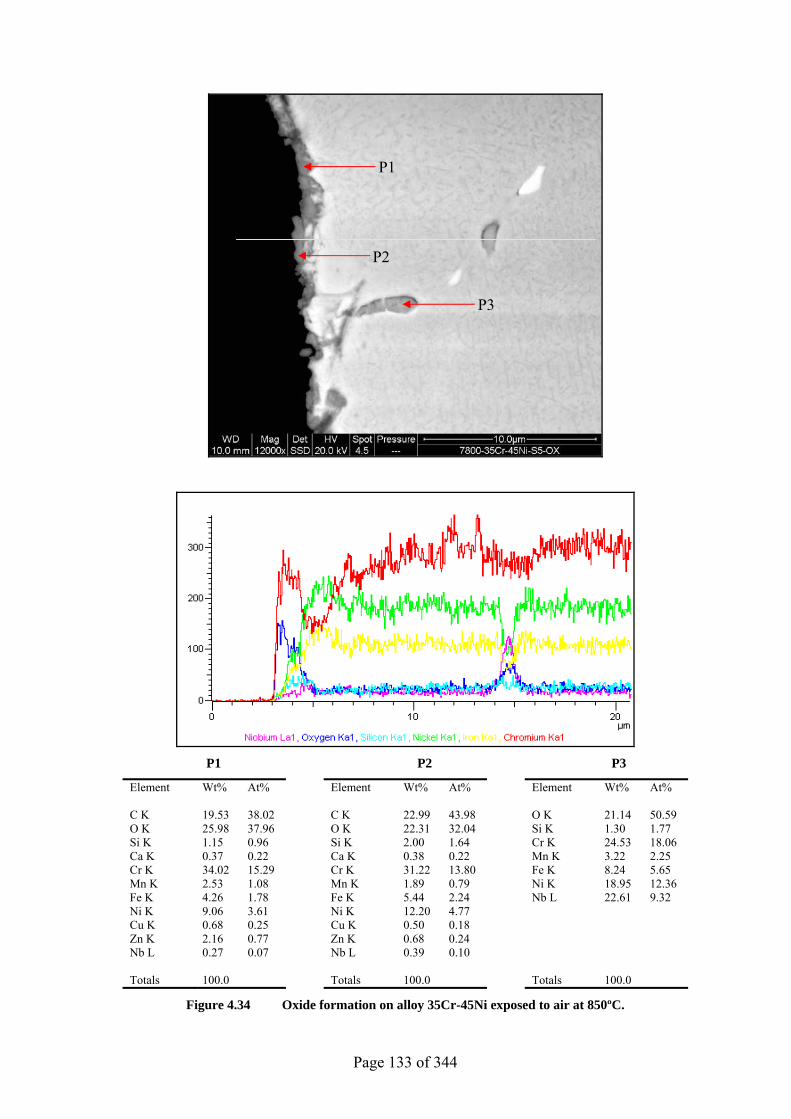
Page 133 of 344
P1 P2 P3
Element Wt% At% Element Wt% At% Element Wt% At% C K 19.53 38.02 C K 22.99 43.98 O K 21.14 50.59 O K 25.98 37.96 O K 22.31 32.04 Si K 1.30 1.77 Si K 1.15 0.96 Si K 2.00 1.64 Cr K 24.53 18.06 Ca K 0.37 0.22 Ca K 0.38 0.22 Mn K 3.22 2.25 Cr K 34.02 15.29 Cr K 31.22 13.80 Fe K 8.24 5.65 Mn K 2.53 1.08 Mn K 1.89 0.79 Ni K 18.95 12.36 Fe K 4.26 1.78 Fe K 5.44 2.24 Nb L 22.61 9.32 Ni K 9.06 3.61 Ni K 12.20 4.77 Cu K 0.68 0.25 Cu K 0.50 0.18 Zn K 2.16 0.77 Zn K 0.68 0.24 Nb L 0.27 0.07 Nb L 0.39 0.10 Totals 100.0 Totals 100.0 Totals 100.0
Figure 4.34 Oxide formation on alloy 35Cr-45Ni exposed to air at 850ºC.
P1
P2
P3
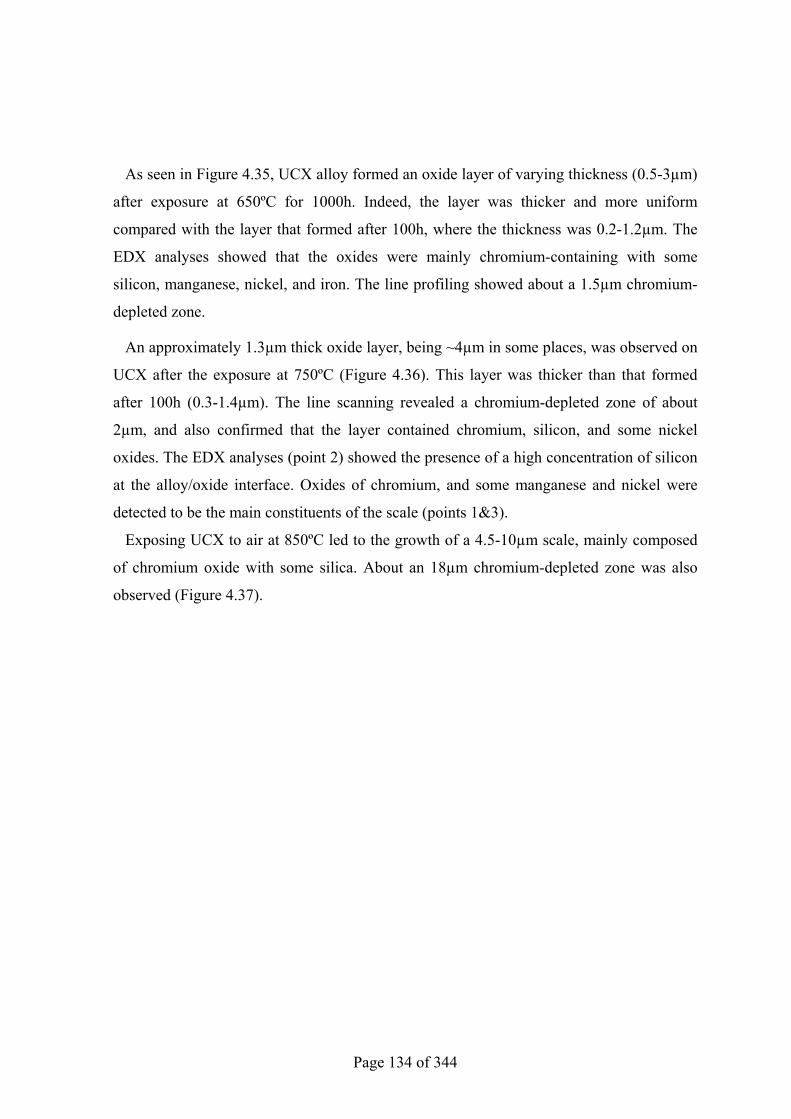
Page 134 of 344
As seen in Figure 4.35, UCX alloy formed an oxide layer of varying thickness (0.5-3µm)
after exposure at 650ºC for 1000h. Indeed, the layer was thicker and more uniform
compared with the layer that formed after 100h, where the thickness was 0.2-1.2µm. The
EDX analyses showed that the oxides were mainly chromium-containing with some
silicon, manganese, nickel, and iron. The line profiling showed about a 1.5µm chromium-
depleted zone.
An approximately 1.3µm thick oxide layer, being ~4µm in some places, was observed on
UCX after the exposure at 750ºC (Figure 4.36). This layer was thicker than that formed
after 100h (0.3-1.4µm). The line scanning revealed a chromium-depleted zone of about
2µm, and also confirmed that the layer contained chromium, silicon, and some nickel
oxides. The EDX analyses (point 2) showed the presence of a high concentration of silicon
at the alloy/oxide interface. Oxides of chromium, and some manganese and nickel were
detected to be the main constituents of the scale (points 1&3).
Exposing UCX to air at 850ºC led to the growth of a 4.5-10µm scale, mainly composed
of chromium oxide with some silica. About an 18µm chromium-depleted zone was also
observed (Figure 4.37).
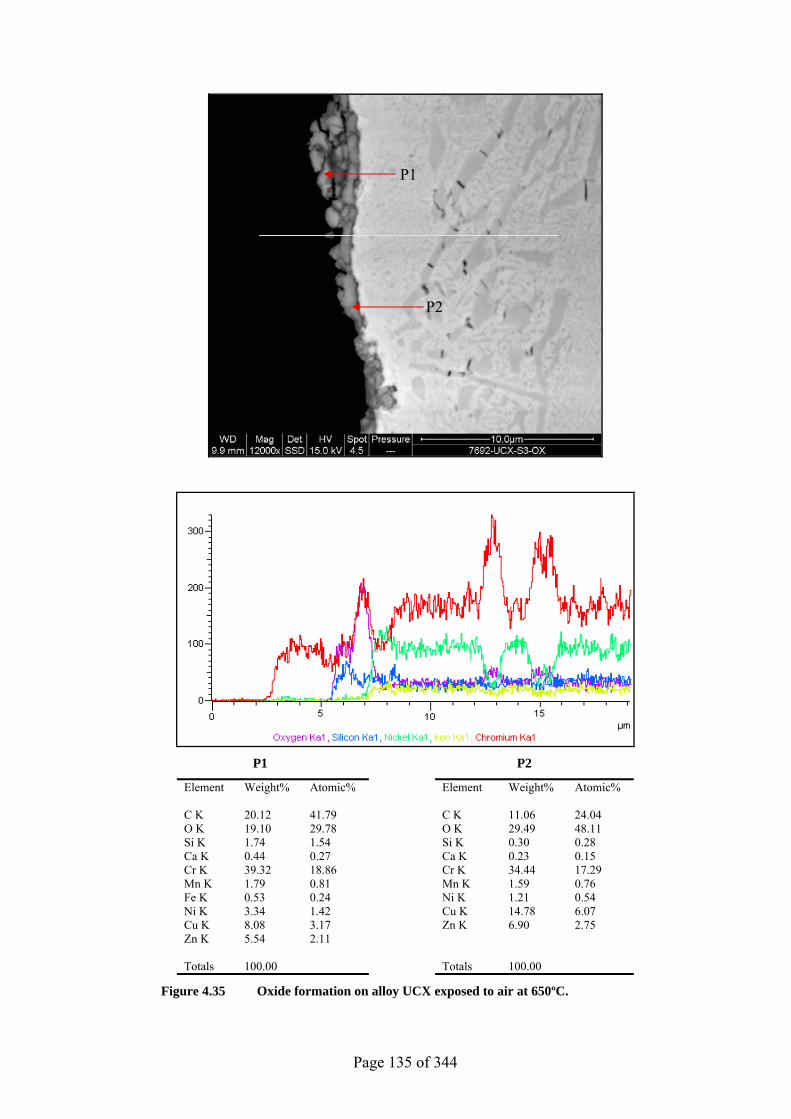
Page 135 of 344
P1 P2
Element Weight% Atomic% Element Weight% Atomic% C K 20.12 41.79 C K 11.06 24.04 O K 19.10 29.78 O K 29.49 48.11 Si K 1.74 1.54 Si K 0.30 0.28 Ca K 0.44 0.27 Ca K 0.23 0.15 Cr K 39.32 18.86 Cr K 34.44 17.29 Mn K 1.79 0.81 Mn K 1.59 0.76 Fe K 0.53 0.24 Ni K 1.21 0.54 Ni K 3.34 1.42 Cu K 14.78 6.07 Cu K 8.08 3.17 Zn K 6.90 2.75 Zn K 5.54 2.11 Totals 100.00 Totals 100.00
Figure 4.35 Oxide formation on alloy UCX exposed to air at 650ºC.
P1
P2
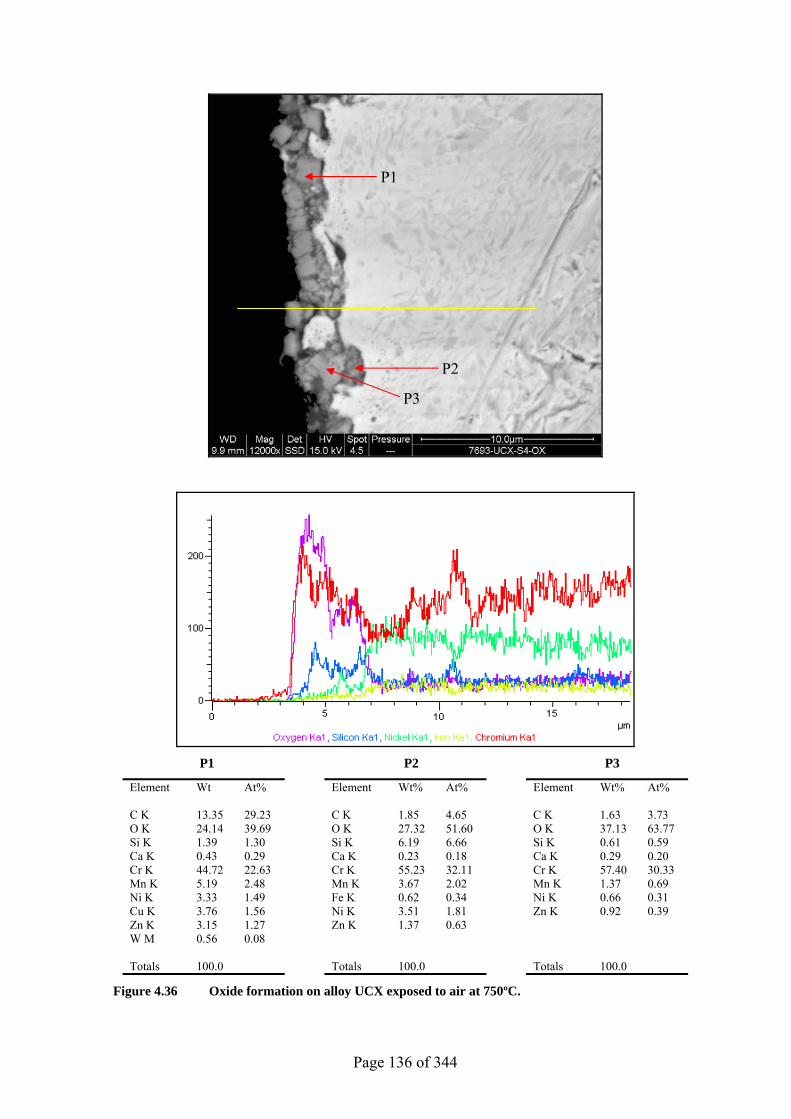
Page 136 of 344
P1 P2 P3
Element Wt At% Element Wt% At% Element Wt% At% C K 13.35 29.23 C K 1.85 4.65 C K 1.63 3.73 O K 24.14 39.69 O K 27.32 51.60 O K 37.13 63.77 Si K 1.39 1.30 Si K 6.19 6.66 Si K 0.61 0.59 Ca K 0.43 0.29 Ca K 0.23 0.18 Ca K 0.29 0.20 Cr K 44.72 22.63 Cr K 55.23 32.11 Cr K 57.40 30.33 Mn K 5.19 2.48 Mn K 3.67 2.02 Mn K 1.37 0.69 Ni K 3.33 1.49 Fe K 0.62 0.34 Ni K 0.66 0.31 Cu K 3.76 1.56 Ni K 3.51 1.81 Zn K 0.92 0.39 Zn K 3.15 1.27 Zn K 1.37 0.63 W M 0.56 0.08 Totals 100.0 Totals 100.0 Totals 100.0
Figure 4.36 Oxide formation on alloy UCX exposed to air at 750ºC.
P1
P2
P3
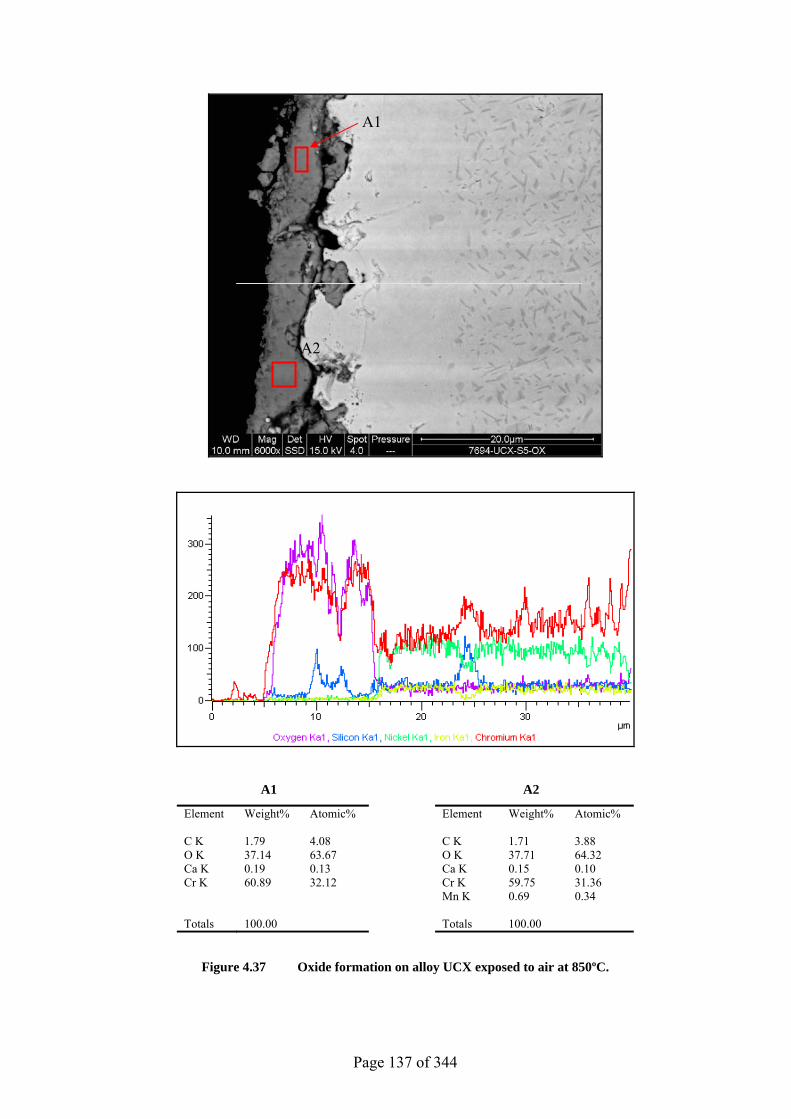
Page 137 of 344
A1 A2
Element Weight% Atomic% Element Weight% Atomic% C K 1.79 4.08 C K 1.71 3.88 O K 37.14 63.67 O K 37.71 64.32 Ca K 0.19 0.13 Ca K 0.15 0.10 Cr K 60.89 32.12 Cr K 59.75 31.36 Mn K 0.69 0.34 Totals 100.00 Totals 100.00
Figure 4.37 Oxide formation on alloy UCX exposed to air at 850ºC.
A1
A2
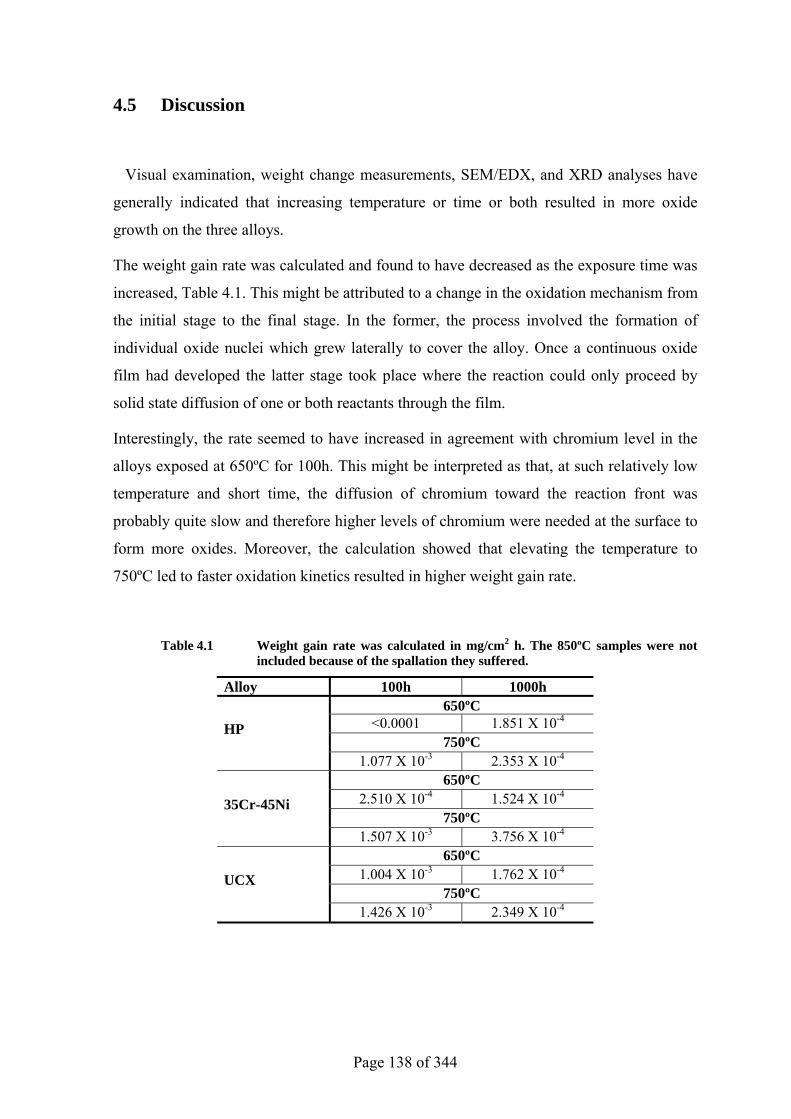
Page 138 of 344
4.5 Discussion
Visual examination, weight change measurements, SEM/EDX, and XRD analyses have
generally indicated that increasing temperature or time or both resulted in more oxide
growth on the three alloys.
The weight gain rate was calculated and found to have decreased as the exposure time was
increased, Table 4.1. This might be attributed to a change in the oxidation mechanism from
the initial stage to the final stage. In the former, the process involved the formation of
individual oxide nuclei which grew laterally to cover the alloy. Once a continuous oxide
film had developed the latter stage took place where the reaction could only proceed by
solid state diffusion of one or both reactants through the film.
Interestingly, the rate seemed to have increased in agreement with chromium level in the
alloys exposed at 650ºC for 100h. This might be interpreted as that, at such relatively low
temperature and short time, the diffusion of chromium toward the reaction front was
probably quite slow and therefore higher levels of chromium were needed at the surface to
form more oxides. Moreover, the calculation showed that elevating the temperature to
750ºC led to faster oxidation kinetics resulted in higher weight gain rate.
Table 4.1 Weight gain rate was calculated in mg/cm2 h. The 850ºC samples were not included because of the spallation they suffered.
Alloy 100h 1000h 650ºC
<0.0001 1.851 X 10⁻⁴ 750ºC
HP
1.077 X 10⁻³ 2.353 X 10⁻⁴ 650ºC
2.510 X 10⁻⁴ 1.524 X 10⁻⁴ 750ºC
35Cr-45Ni
1.507 X 10⁻³ 3.756 X 10⁻⁴ 650ºC
1.004 X 10⁻³ 1.762 X 10⁻⁴ 750ºC
UCX
1.426 X 10⁻³ 2.349 X 10⁻⁴
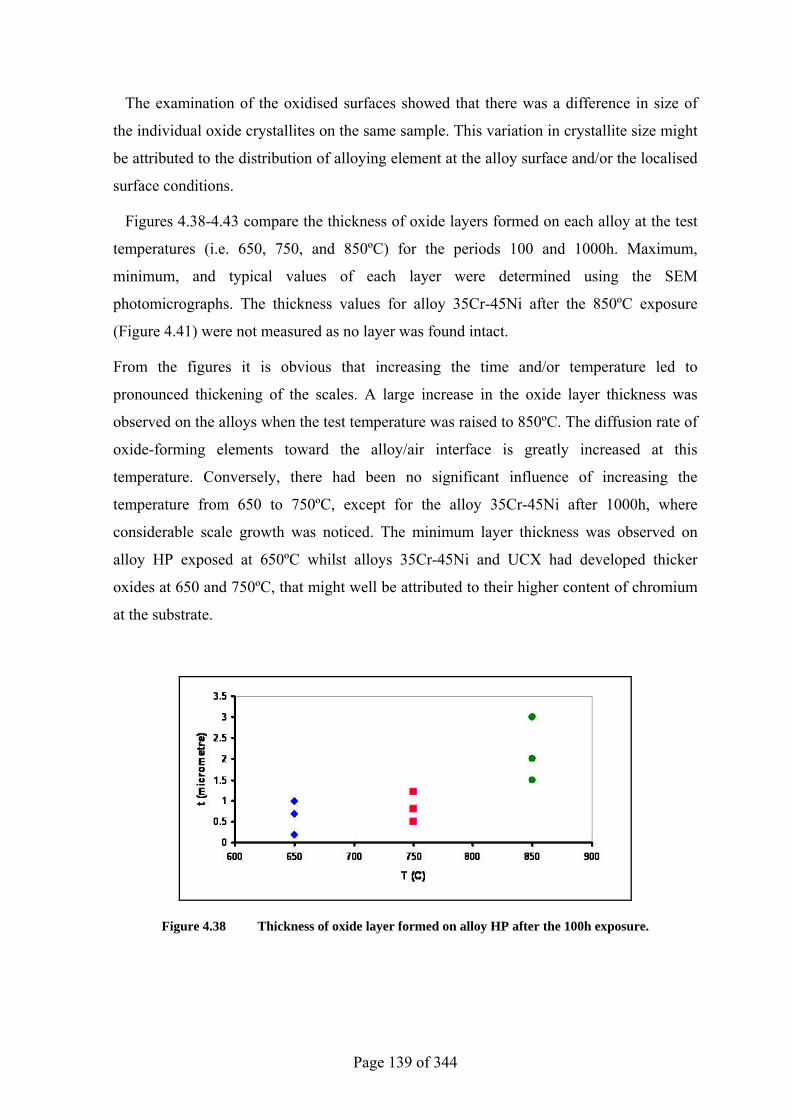
Page 139 of 344
The examination of the oxidised surfaces showed that there was a difference in size of
the individual oxide crystallites on the same sample. This variation in crystallite size might
be attributed to the distribution of alloying element at the alloy surface and/or the localised
surface conditions.
Figures 4.38-4.43 compare the thickness of oxide layers formed on each alloy at the test
temperatures (i.e. 650, 750, and 850ºC) for the periods 100 and 1000h. Maximum,
minimum, and typical values of each layer were determined using the SEM
photomicrographs. The thickness values for alloy 35Cr-45Ni after the 850ºC exposure
(Figure 4.41) were not measured as no layer was found intact.
From the figures it is obvious that increasing the time and/or temperature led to
pronounced thickening of the scales. A large increase in the oxide layer thickness was
observed on the alloys when the test temperature was raised to 850ºC. The diffusion rate of
oxide-forming elements toward the alloy/air interface is greatly increased at this
temperature. Conversely, there had been no significant influence of increasing the
temperature from 650 to 750ºC, except for the alloy 35Cr-45Ni after 1000h, where
considerable scale growth was noticed. The minimum layer thickness was observed on
alloy HP exposed at 650ºC whilst alloys 35Cr-45Ni and UCX had developed thicker
oxides at 650 and 750ºC, that might well be attributed to their higher content of chromium
at the substrate.
Figure 4.38 Thickness of oxide layer formed on alloy HP after the 100h exposure.
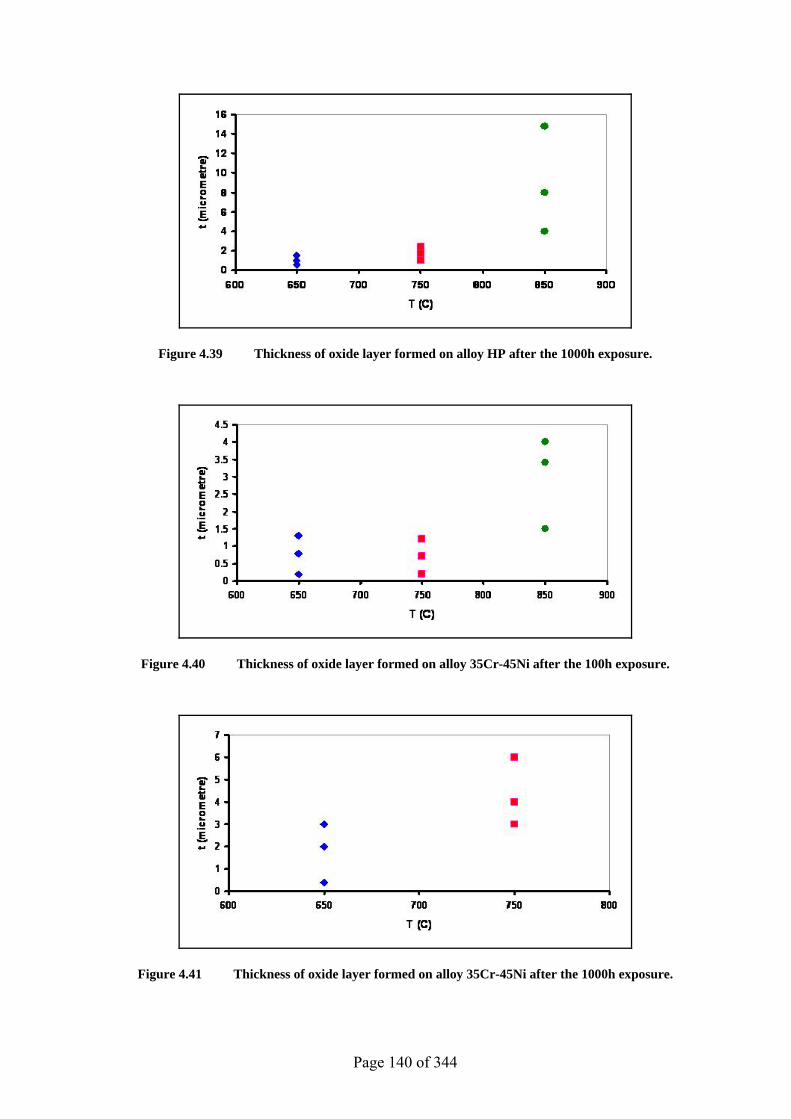
Page 140 of 344
Figure 4.39 Thickness of oxide layer formed on alloy HP after the 1000h exposure.
Figure 4.40 Thickness of oxide layer formed on alloy 35Cr-45Ni after the 100h exposure.
Figure 4.41 Thickness of oxide layer formed on alloy 35Cr-45Ni after the 1000h exposure.
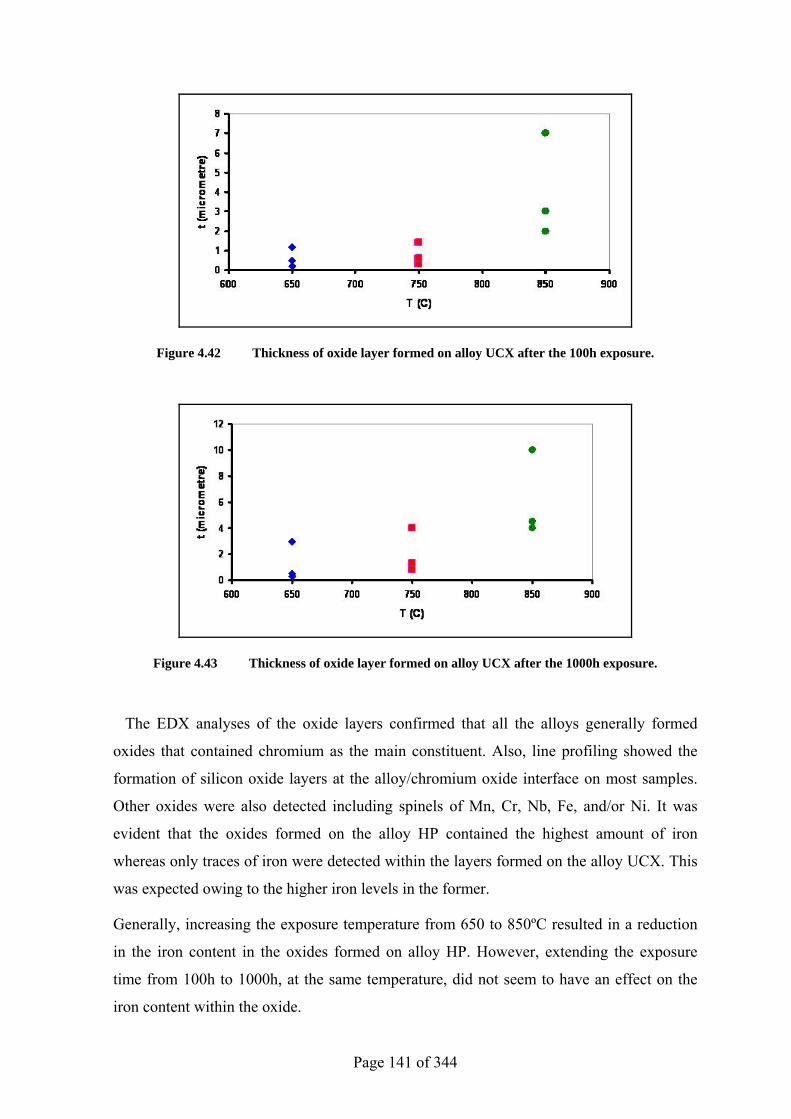
Page 141 of 344
Figure 4.42 Thickness of oxide layer formed on alloy UCX after the 100h exposure.
Figure 4.43 Thickness of oxide layer formed on alloy UCX after the 1000h exposure.
The EDX analyses of the oxide layers confirmed that all the alloys generally formed
oxides that contained chromium as the main constituent. Also, line profiling showed the
formation of silicon oxide layers at the alloy/chromium oxide interface on most samples.
Other oxides were also detected including spinels of Mn, Cr, Nb, Fe, and/or Ni. It was
evident that the oxides formed on the alloy HP contained the highest amount of iron
whereas only traces of iron were detected within the layers formed on the alloy UCX. This
was expected owing to the higher iron levels in the former.
Generally, increasing the exposure temperature from 650 to 850ºC resulted in a reduction
in the iron content in the oxides formed on alloy HP. However, extending the exposure
time from 100h to 1000h, at the same temperature, did not seem to have an effect on the
iron content within the oxide.
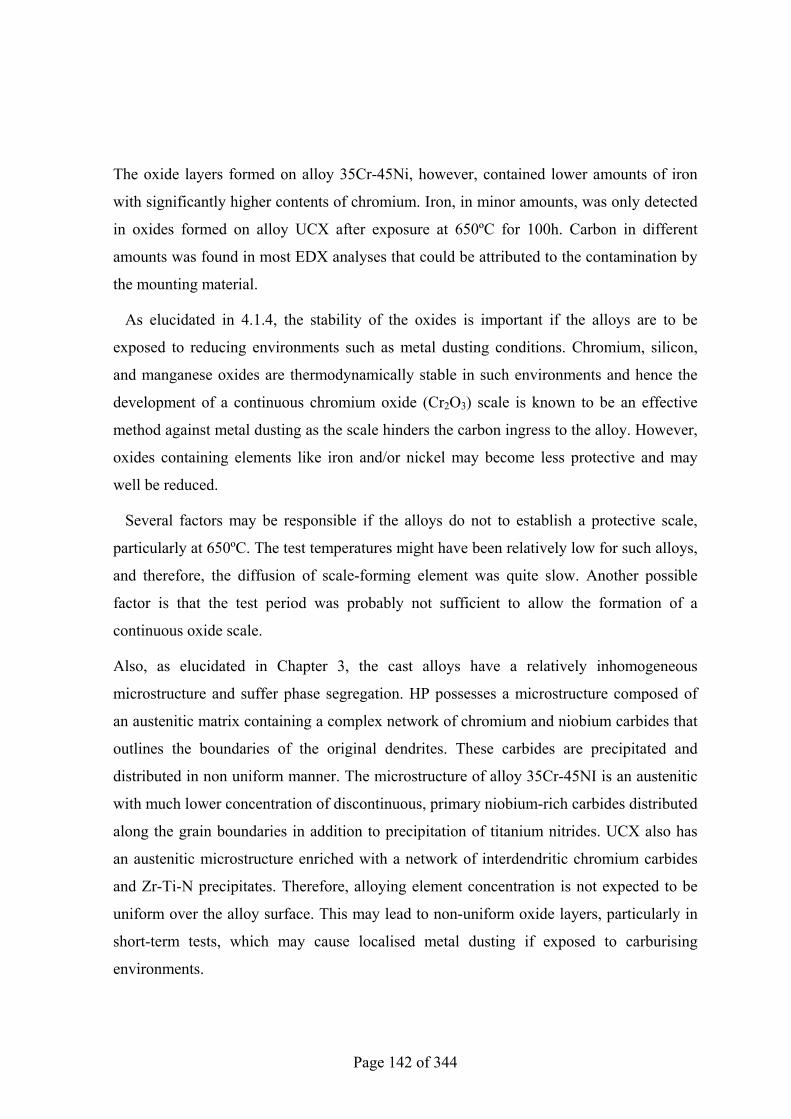
Page 142 of 344
The oxide layers formed on alloy 35Cr-45Ni, however, contained lower amounts of iron
with significantly higher contents of chromium. Iron, in minor amounts, was only detected
in oxides formed on alloy UCX after exposure at 650ºC for 100h. Carbon in different
amounts was found in most EDX analyses that could be attributed to the contamination by
the mounting material.
As elucidated in 4.1.4, the stability of the oxides is important if the alloys are to be
exposed to reducing environments such as metal dusting conditions. Chromium, silicon,
and manganese oxides are thermodynamically stable in such environments and hence the
development of a continuous chromium oxide (Cr2O3) scale is known to be an effective
method against metal dusting as the scale hinders the carbon ingress to the alloy. However,
oxides containing elements like iron and/or nickel may become less protective and may
well be reduced.
Several factors may be responsible if the alloys do not to establish a protective scale,
particularly at 650ºC. The test temperatures might have been relatively low for such alloys,
and therefore, the diffusion of scale-forming element was quite slow. Another possible
factor is that the test period was probably not sufficient to allow the formation of a
continuous oxide scale.
Also, as elucidated in Chapter 3, the cast alloys have a relatively inhomogeneous
microstructure and suffer phase segregation. HP possesses a microstructure composed of
an austenitic matrix containing a complex network of chromium and niobium carbides that
outlines the boundaries of the original dendrites. These carbides are precipitated and
distributed in non uniform manner. The microstructure of alloy 35Cr-45NI is an austenitic
with much lower concentration of discontinuous, primary niobium-rich carbides distributed
along the grain boundaries in addition to precipitation of titanium nitrides. UCX also has
an austenitic microstructure enriched with a network of interdendritic chromium carbides
and Zr-Ti-N precipitates. Therefore, alloying element concentration is not expected to be
uniform over the alloy surface. This may lead to non-uniform oxide layers, particularly in
short-term tests, which may cause localised metal dusting if exposed to carburising
environments.
Page 143 of 344
4.6 Conclusion
Increasing the exposure time and/or temperature resulted in an increase of the oxide
growth on the alloys and the oxides appeared to have become more continuous, adherent
and thicker. It is unlikely though that the alloys formed a completely protective scale,
especially at 650ºC, as the oxide layers were uneven and very thin in some areas. It is also
suggested that the alloys were still at the initial oxidation stages after exposure for 100h
and that lateral growth had not been sufficient to establish a continuous layer. More
research may be necessary in order to look at potential, practical methods for improving
oxidation kinetics (diffusion of oxide-forming elements) of the alloys in the metal dusting
temperature range.
Page 144 of 344
5 EVALUATION OF ALLOY HP PERFORMANCE IN METAL DUSTING CONDITIONS
This chapter reports and discusses the findings concerning the behaviour of the iron-
based alloy, HP, that had been exposed to the gas mixture at 650, 750, and 850ºC for
periods of 100, 500, and 1000 hours. Details of the experimental apparatus and procedures
as well as characterisation methods have already been fully covered in Chapter 2.
Moreover, all related XRD patterns and charts, weight change measurements, and EDX
spectroscopy are listed in Appendix C. Chapter 8 is dedicated to an overall discussion
pertaining to the performance of the three alloys, HP, 35Cr-45Ni, and UCX in the metal
dusting conditions.
5.1 Visual Examination
Following each experiment, the samples were removed from the tube and were
immediately photographed whilst they were still suspended from the rack. However,
despite being drawn out very carefully, the rack movement unavoidably caused some of
the carbon deposits on the alloys to fall. The specimens were then detached from the rack
and mechanically brushed (by bristle brush) and thoroughly washed in water followed by
ultrasonic cleaning in acetone, and were subsequently examined and photographed.
Although Figures 5.1-5.6 show the condition of the three alloys after the experiments,
only the behaviour of alloy HP is being described in this chapter as the others are described
in chapters 6 and 7.
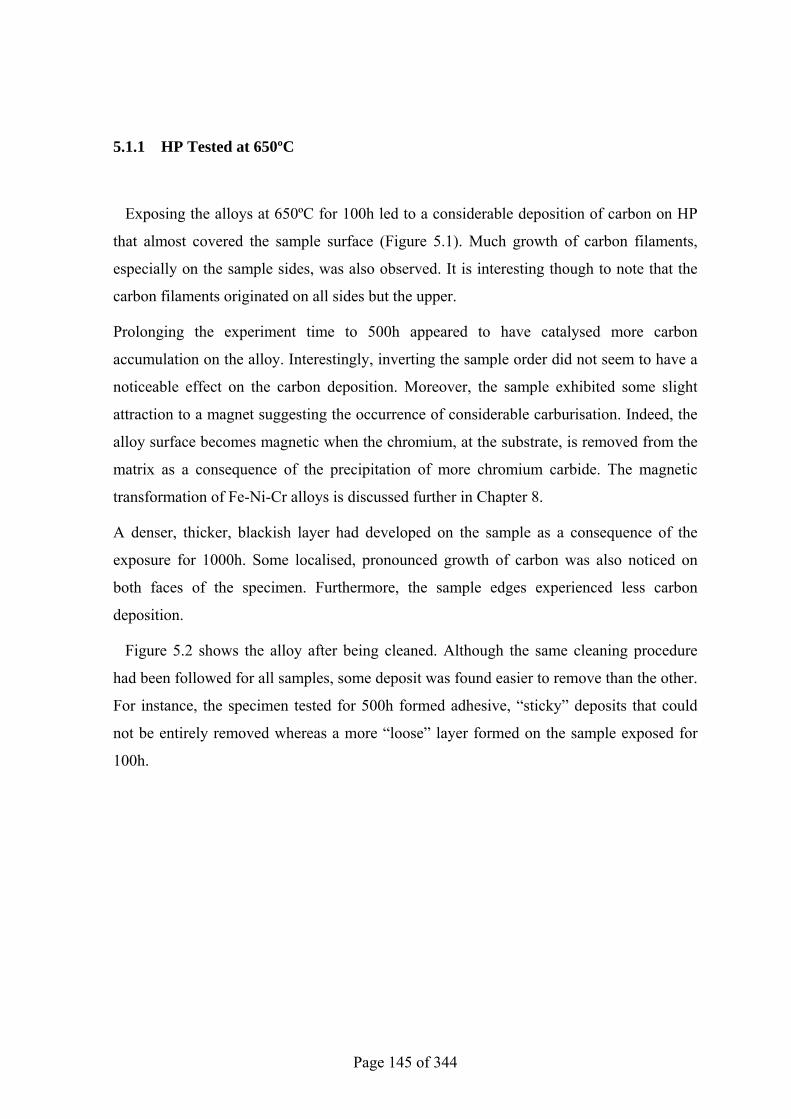
Page 145 of 344
5.1.1 HP Tested at 650ºC
Exposing the alloys at 650ºC for 100h led to a considerable deposition of carbon on HP
that almost covered the sample surface (Figure 5.1). Much growth of carbon filaments,
especially on the sample sides, was also observed. It is interesting though to note that the
carbon filaments originated on all sides but the upper.
Prolonging the experiment time to 500h appeared to have catalysed more carbon
accumulation on the alloy. Interestingly, inverting the sample order did not seem to have a
noticeable effect on the carbon deposition. Moreover, the sample exhibited some slight
attraction to a magnet suggesting the occurrence of considerable carburisation. Indeed, the
alloy surface becomes magnetic when the chromium, at the substrate, is removed from the
matrix as a consequence of the precipitation of more chromium carbide. The magnetic
transformation of Fe-Ni-Cr alloys is discussed further in Chapter 8.
A denser, thicker, blackish layer had developed on the sample as a consequence of the
exposure for 1000h. Some localised, pronounced growth of carbon was also noticed on
both faces of the specimen. Furthermore, the sample edges experienced less carbon
deposition.
Figure 5.2 shows the alloy after being cleaned. Although the same cleaning procedure
had been followed for all samples, some deposit was found easier to remove than the other.
For instance, the specimen tested for 500h formed adhesive, “sticky” deposits that could
not be entirely removed whereas a more “loose” layer formed on the sample exposed for
100h.
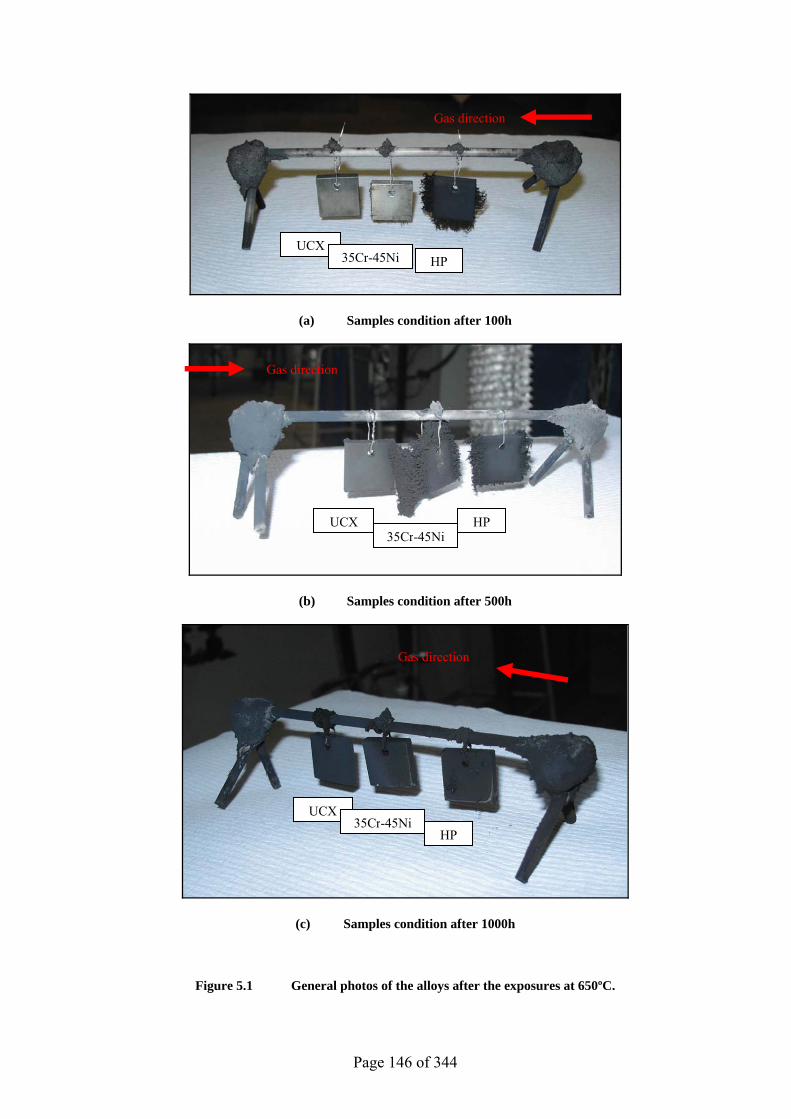
Page 146 of 344
(a) Samples condition after 100h
(b) Samples condition after 500h
(c) Samples condition after 1000h
Figure 5.1 General photos of the alloys after the exposures at 650ºC.
HPUCX
35Cr-45Ni
Gas direction
HPUCX35Cr-45Ni
Gas direction
HP
UCX35Cr-45Ni
Gas direction
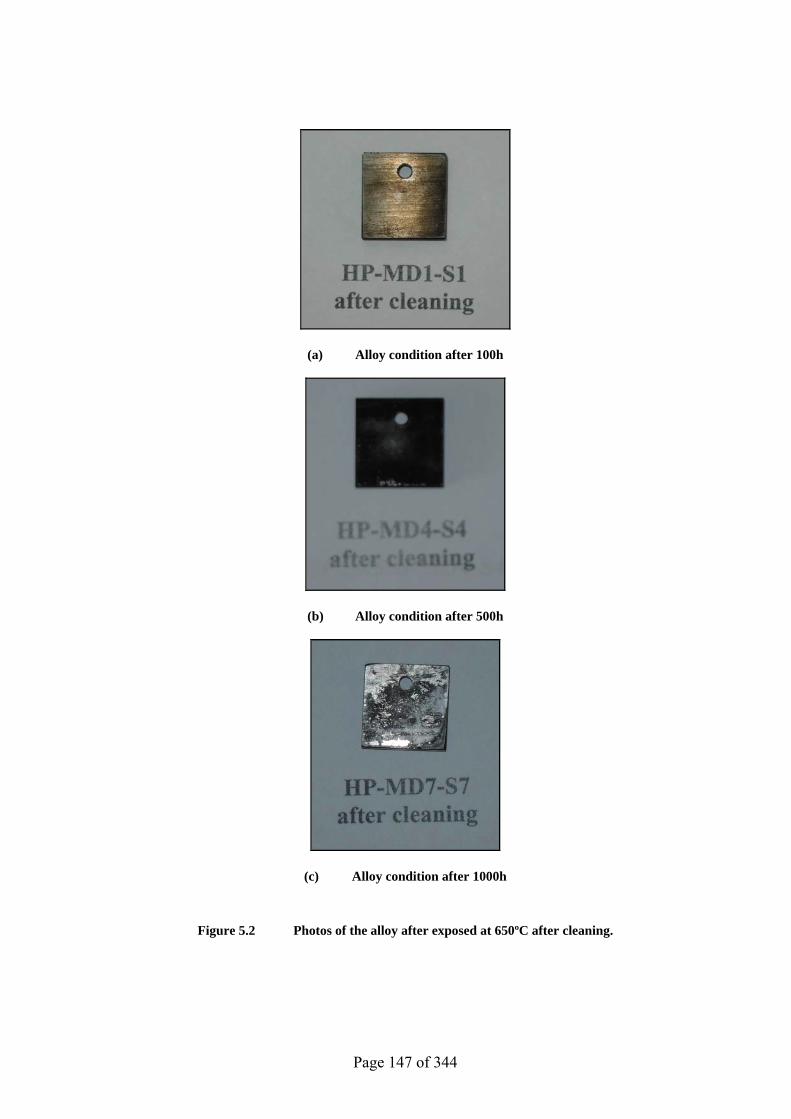
Page 147 of 344
(a) Alloy condition after 100h
(b) Alloy condition after 500h
(c) Alloy condition after 1000h
Figure 5.2 Photos of the alloy after exposed at 650ºC after cleaning.
Page 148 of 344
5.1.2 HP Tested at 750ºC
In general, increasing the test temperature to 750ºC resulted in a relatively low carbon
deposition (Figure 5.3). Also, more carbon accumulation appeared to have occurred as a
result of prolonging the experiment time.
No significant carbon filament growth was observed on the sample after 100h of testing,
and the degree of carbon deposition appeared to be considerably less than that took place at
the 650ºC. However, comparatively dense carbon layers could be noticed on the sides of
the sample.
The sample exposed for 500h did not appear to experience appreciable carbon build up,
despite some growth of carbon filament on two sides of the sample. The alloy surface,
however, seemed to be mostly covered with a greyish layer.
Extending the exposure time to 1000h allowed a deposition of a thick, loose, blackish layer
that could be removed effortlessly from the surface.
It is worth noting that the carbon deposition was gradually lessening in agreement with the
gas flow direction, as seen in Figure 5.3 b & c. Most carbon deposition was observed on
alloy UCX, which had been the first to see the gas, during the 500h experiment. In
contrast, the least deposition was seen on alloy HP which was the last on the rack (Figure
5.3 b). Alloy 35Cr-45Ni, however, appeared to have experienced different levels of
deposition as the specimen first half (next to UCX) showed more carbon accumulation
than the other half (near HP). Similar behaviour was also noticed on the samples exposed
for 1000h despite the reversion of their order on the rack. In short, the inversion of the
samples order might well have influenced their interaction with the environment.
Moreover, none of the samples exhibited any strong attraction to the magnet. The sample’s
condition after cleaning is shown in Figure 5.4.
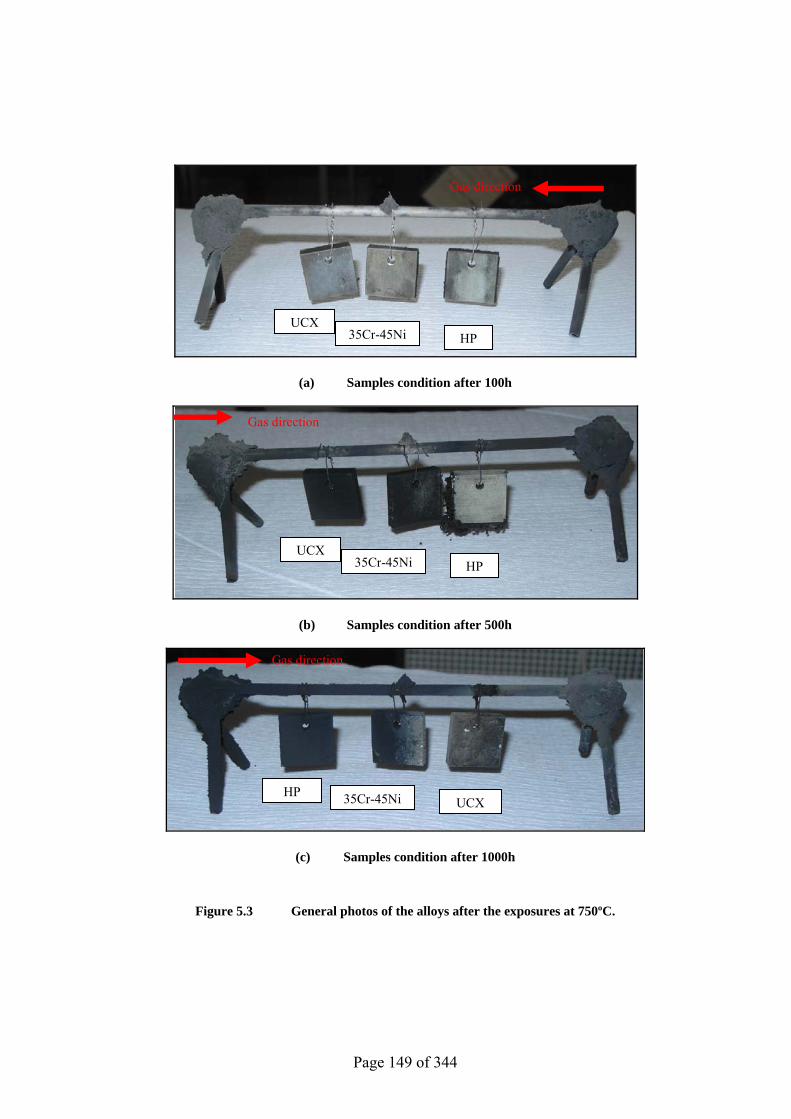
Page 149 of 344
(a) Samples condition after 100h
(b) Samples condition after 500h
(c) Samples condition after 1000h
Figure 5.3 General photos of the alloys after the exposures at 750ºC.
HPUCX
35Cr-45Ni
Gas direction
HPUCX
35Cr-45Ni
Gas direction
UCXHP 35Cr-45Ni
Gas direction
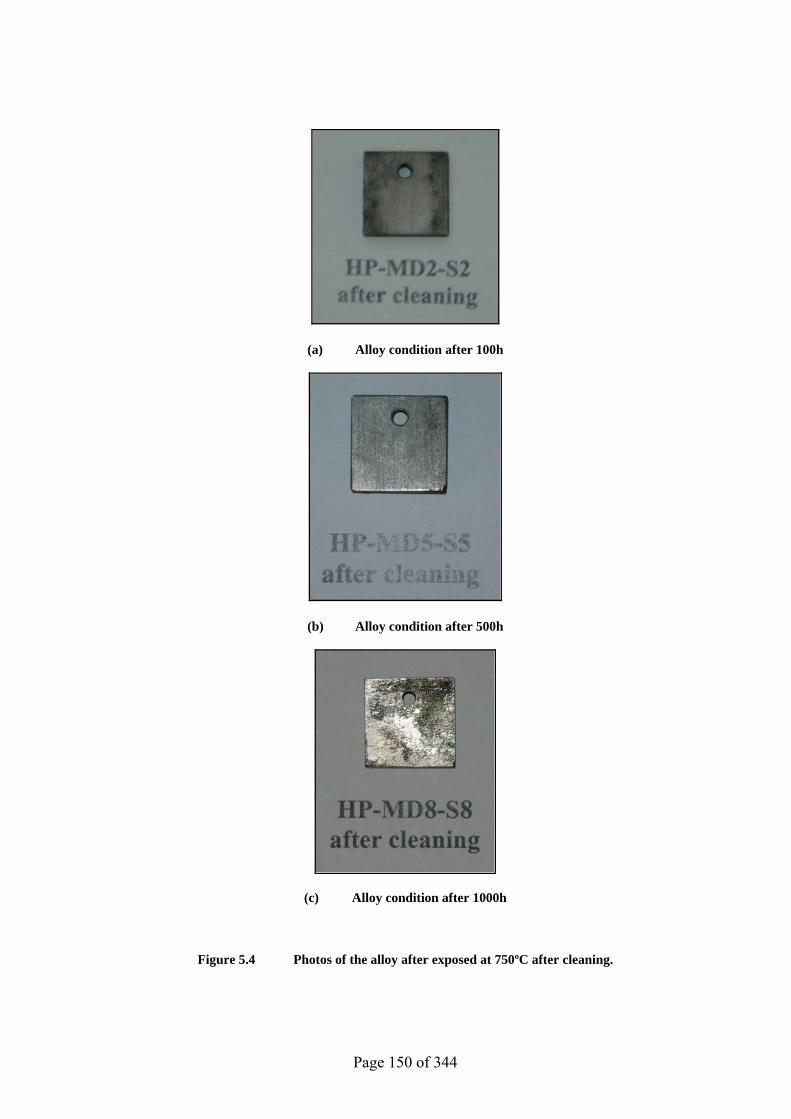
Page 150 of 344
(a) Alloy condition after 100h
(b) Alloy condition after 500h
(c) Alloy condition after 1000h
Figure 5.4 Photos of the alloy after exposed at 750ºC after cleaning.
Page 151 of 344
5.1.3 HP Tested at 850ºC
It was very obvious that increasing the temperature from 650 to 850ºC was accompanied
by a remarkable decrease in carbon deposition. Photos of the samples tested at the latter
temperature are shown in Figure 5.5.
The alloy experienced extremely low carbon deposition following the exposure for 100h at
850ºC. Indeed, the carbon deposition was more prevalent at the sample sides. The surface
of the alloy was mainly covered with a grey layer.
Two different areas, shown by grey and lighter grey layers, were noticed on the sample
exposed for the period of 500h. In addition, some small blackish spots were also observed
on the alloy.
The sample subjected at 850ºC for 1000h formed a mixture of greyish and greenish layers
(Figure 5.5 c). No samples showed any attraction to a magnet. The samples after cleaning
are shown in Figure 5.6.
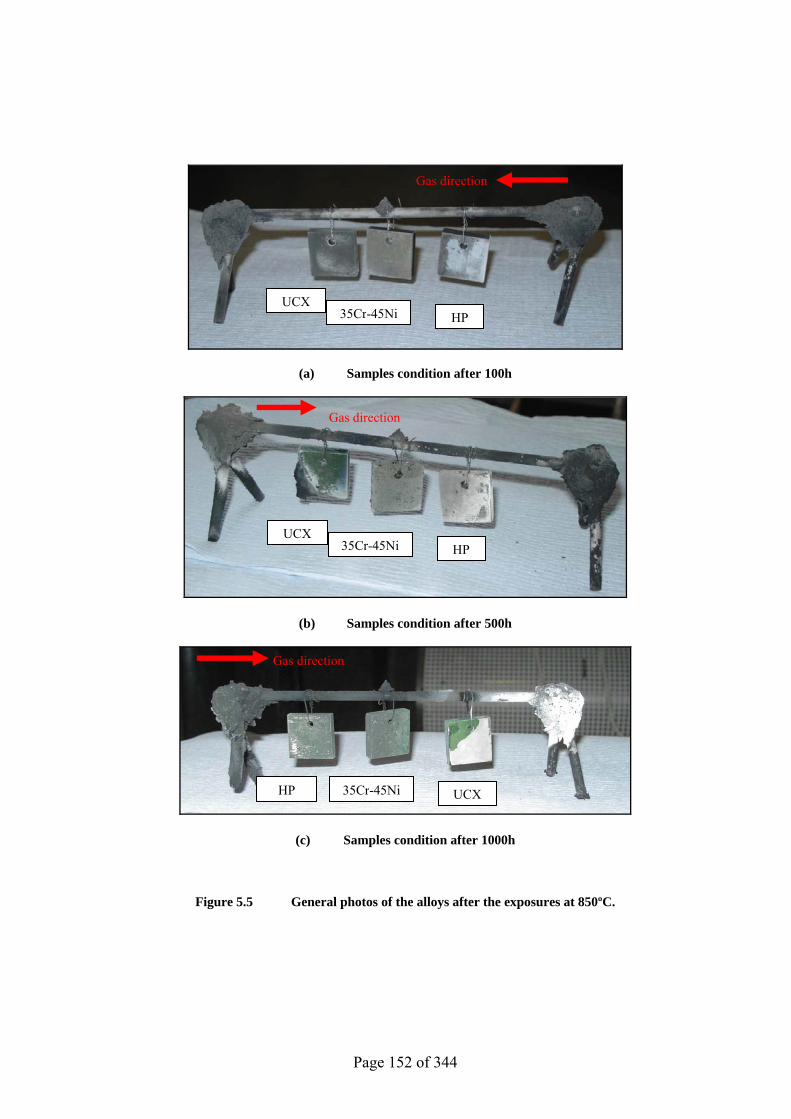
Page 152 of 344
(a) Samples condition after 100h
(b) Samples condition after 500h
(c) Samples condition after 1000h
Figure 5.5 General photos of the alloys after the exposures at 850ºC.
HPUCX
35Cr-45Ni
Gas direction
HPUCX
35Cr-45Ni
Gas direction
UCXHP 35Cr-45Ni
Gas direction
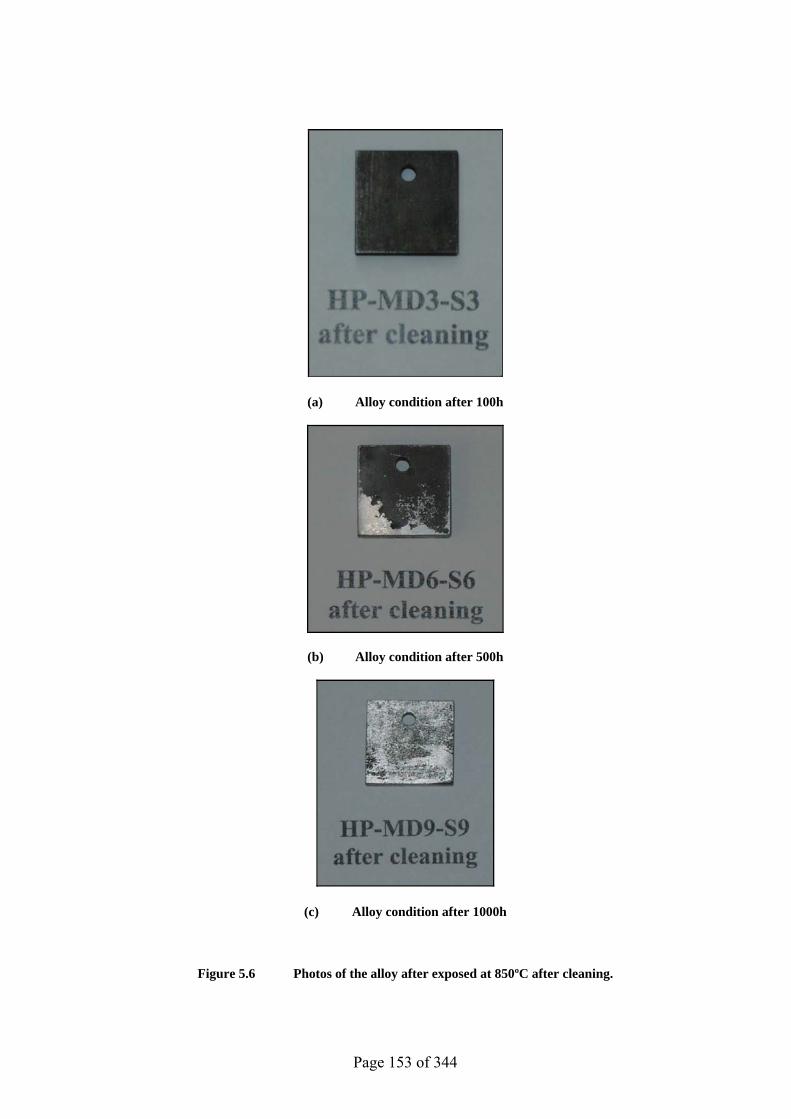
Page 153 of 344
(a) Alloy condition after 100h
(b) Alloy condition after 500h
(c) Alloy condition after 1000h
Figure 5.6 Photos of the alloy after exposed at 850ºC after cleaning.
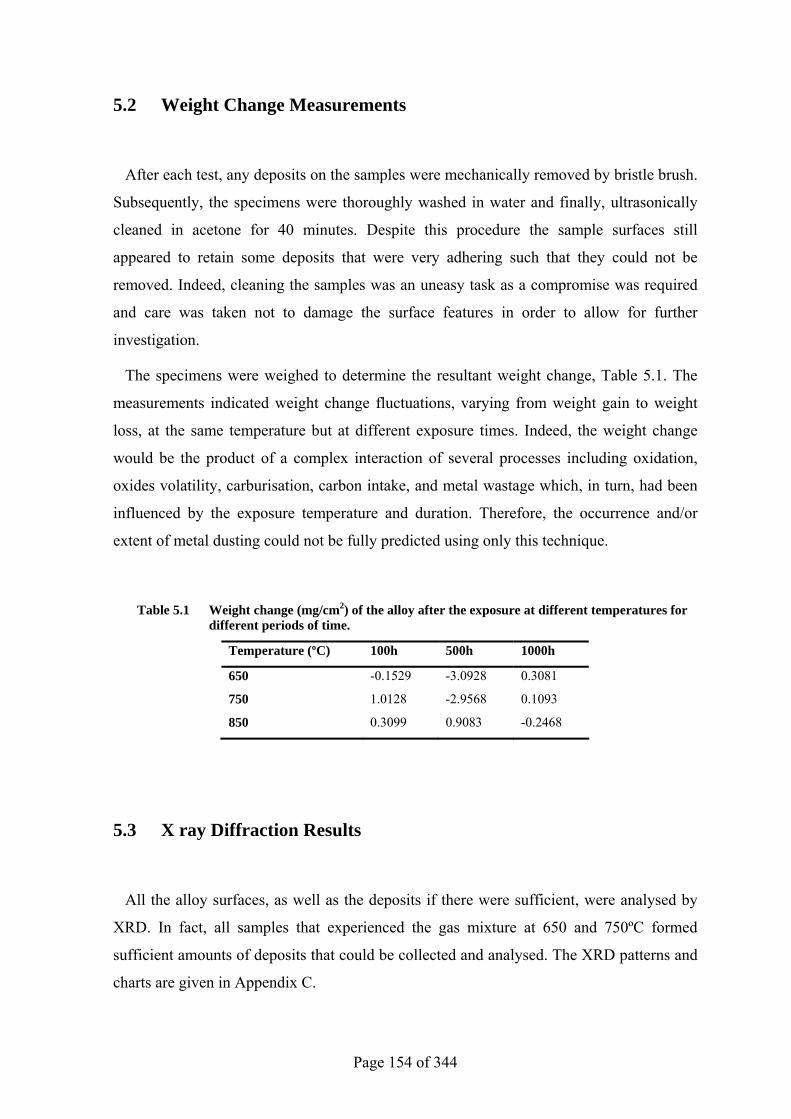
Page 154 of 344
5.2 Weight Change Measurements
After each test, any deposits on the samples were mechanically removed by bristle brush.
Subsequently, the specimens were thoroughly washed in water and finally, ultrasonically
cleaned in acetone for 40 minutes. Despite this procedure the sample surfaces still
appeared to retain some deposits that were very adhering such that they could not be
removed. Indeed, cleaning the samples was an uneasy task as a compromise was required
and care was taken not to damage the surface features in order to allow for further
investigation.
The specimens were weighed to determine the resultant weight change, Table 5.1. The
measurements indicated weight change fluctuations, varying from weight gain to weight
loss, at the same temperature but at different exposure times. Indeed, the weight change
would be the product of a complex interaction of several processes including oxidation,
oxides volatility, carburisation, carbon intake, and metal wastage which, in turn, had been
influenced by the exposure temperature and duration. Therefore, the occurrence and/or
extent of metal dusting could not be fully predicted using only this technique.
Table 5.1 Weight change (mg/cm2) of the alloy after the exposure at different temperatures for different periods of time.
Temperature (ºC) 100h 500h 1000h
650 -0.1529 -3.0928 0.3081
750 1.0128 -2.9568 0.1093
850 0.3099 0.9083 -0.2468
5.3 X ray Diffraction Results
All the alloy surfaces, as well as the deposits if there were sufficient, were analysed by
XRD. In fact, all samples that experienced the gas mixture at 650 and 750ºC formed
sufficient amounts of deposits that could be collected and analysed. The XRD patterns and
charts are given in Appendix C.
Page 155 of 344
Exposing the alloy at 650ºC for 100h resulted in the formation of Fe3O4 and C in addition
to chromium and iron-containing carbides. Analysing the deposit removed from this
sample revealed the presence of C, SiO2, Cr2O3, Fe2O3, and (Fe,Ni). Extending the test
time to 500h led to the formation of chromium and iron-containing carbides. Carbon,
Cr2O3, FeNi3, and Ni0.6Fe2.4O4 were detected in the deposit collected from this sample. The
1000h exposure, however, led to the formation of C, Cr2O3, niobium carbides, and
chromium and iron-containing carbides. The carbon gathered from this alloy was found to
contain SiO2 and Fe, as well as carbon.
Increasing the exposure temperature to 750ºC (for 100h) promoted the formation of
Cr0.5Fe1.5MnO4, SiO2, and chromium and iron-bearing carbides on the alloy surface. The
analysis of the deposits found on this sample revealed the presence of (Fe,Ni), SiO2, and
carbon. Prolonging the experiment time to 500h resulted in the development of
Mn0.43Fe2.57O4, SiO2, and chromium and iron-containing carbides. The deposit removed
from this specimen was confirmed to consist of Cr2O3, FeNi, SiO2, and carbon. Increasing
the exposure time to 1000h led to the formation of Cr2O3 and Mn1.5Cr1.5O4. The deposit
removed from this sample contained SiO2 and carbon.
The alloy formed CrFeMnO4, SiO2, chromium, and chromium and iron-containing
carbides after being exposed at 850ºC for 100h. Increasing the testing period to 500h led to
the formation of SiO2 and chromium and iron-containing carbides. The 1000h exposure
caused the alloy to form Mn1.5Cr1.5O4, C, Fe1.34Si0.66, and chromium carbides. Not enough
deposit could be collected from the alloys exposed at 850ºC.
5.4 SEM/EDX Deposits Analysis
The chemical composition of the deposits removed from the alloys was confirmed using
SEM/EDX, see Figures 5.7-5.12.
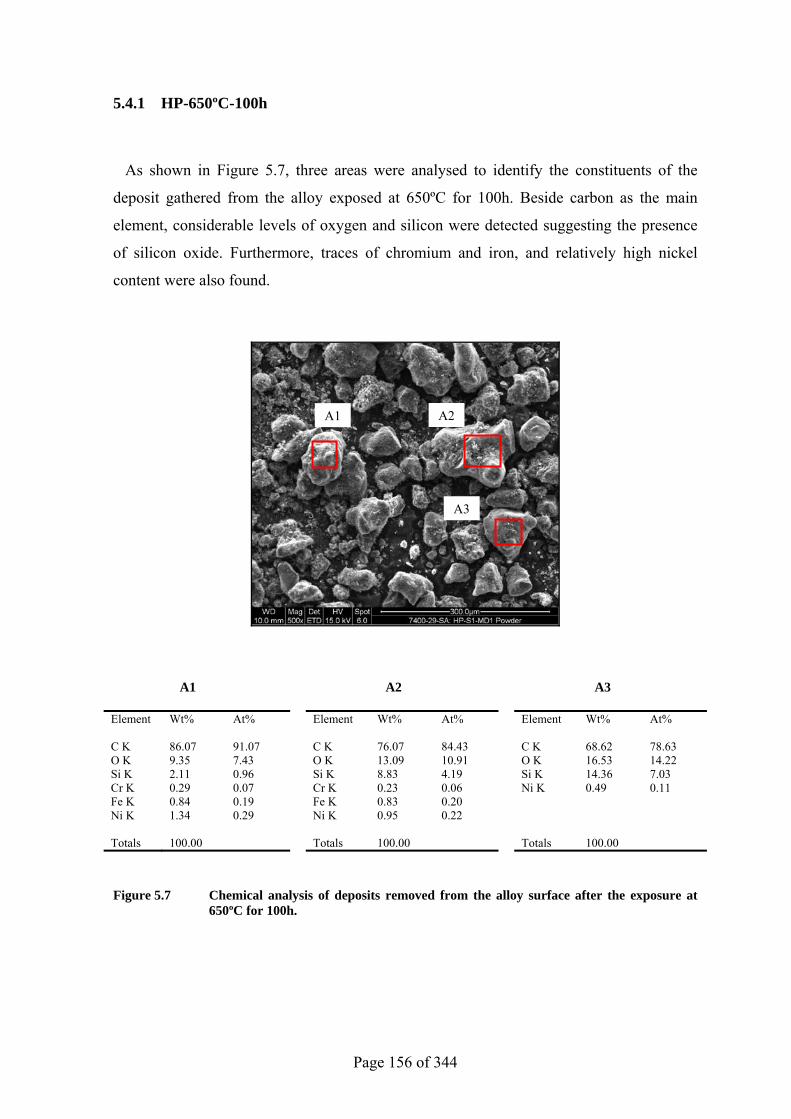
Page 156 of 344
5.4.1 HP-650ºC-100h
As shown in Figure 5.7, three areas were analysed to identify the constituents of the
deposit gathered from the alloy exposed at 650ºC for 100h. Beside carbon as the main
element, considerable levels of oxygen and silicon were detected suggesting the presence
of silicon oxide. Furthermore, traces of chromium and iron, and relatively high nickel
content were also found.
A1 A2 A3
Element Wt% At% Element Wt% At% Element Wt% At% C K 86.07 91.07 C K 76.07 84.43 C K 68.62 78.63 O K 9.35 7.43 O K 13.09 10.91 O K 16.53 14.22 Si K 2.11 0.96 Si K 8.83 4.19 Si K 14.36 7.03 Cr K 0.29 0.07 Cr K 0.23 0.06 Ni K 0.49 0.11 Fe K 0.84 0.19 Fe K 0.83 0.20 Ni K 1.34 0.29 Ni K 0.95 0.22 Totals 100.00 Totals 100.00 Totals 100.00
Figure 5.7 Chemical analysis of deposits removed from the alloy surface after the exposure at 650ºC for 100h.
A1 A2
A3
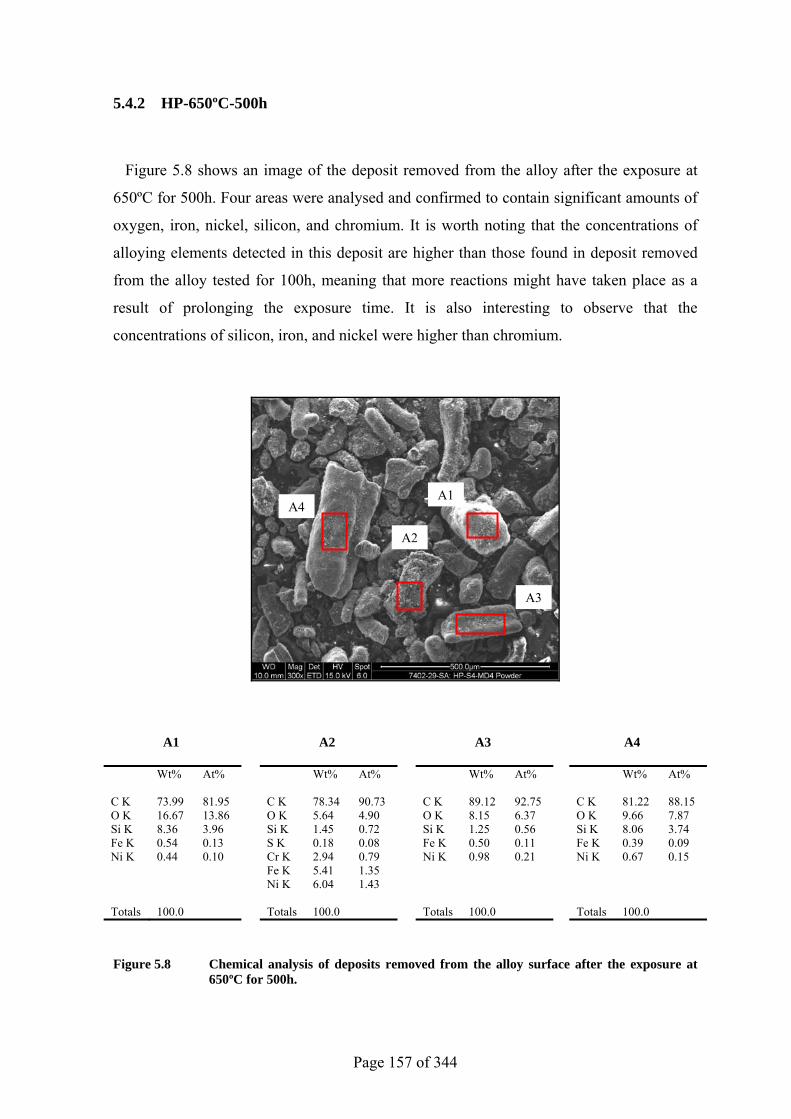
Page 157 of 344
5.4.2 HP-650ºC-500h
Figure 5.8 shows an image of the deposit removed from the alloy after the exposure at
650ºC for 500h. Four areas were analysed and confirmed to contain significant amounts of
oxygen, iron, nickel, silicon, and chromium. It is worth noting that the concentrations of
alloying elements detected in this deposit are higher than those found in deposit removed
from the alloy tested for 100h, meaning that more reactions might have taken place as a
result of prolonging the exposure time. It is also interesting to observe that the
concentrations of silicon, iron, and nickel were higher than chromium.
A1 A2 A3 A4
Wt% At% Wt% At% Wt% At% Wt% At% C K 73.99 81.95 C K 78.34 90.73 C K 89.12 92.75 C K 81.22 88.15 O K 16.67 13.86 O K 5.64 4.90 O K 8.15 6.37 O K 9.66 7.87 Si K 8.36 3.96 Si K 1.45 0.72 Si K 1.25 0.56 Si K 8.06 3.74 Fe K 0.54 0.13 S K 0.18 0.08 Fe K 0.50 0.11 Fe K 0.39 0.09 Ni K 0.44 0.10 Cr K 2.94 0.79 Ni K 0.98 0.21 Ni K 0.67 0.15 Fe K 5.41 1.35 Ni K 6.04 1.43 Totals 100.0 Totals 100.0 Totals 100.0 Totals 100.0
Figure 5.8 Chemical analysis of deposits removed from the alloy surface after the exposure at 650ºC for 500h.
A1
A2
A3
A4
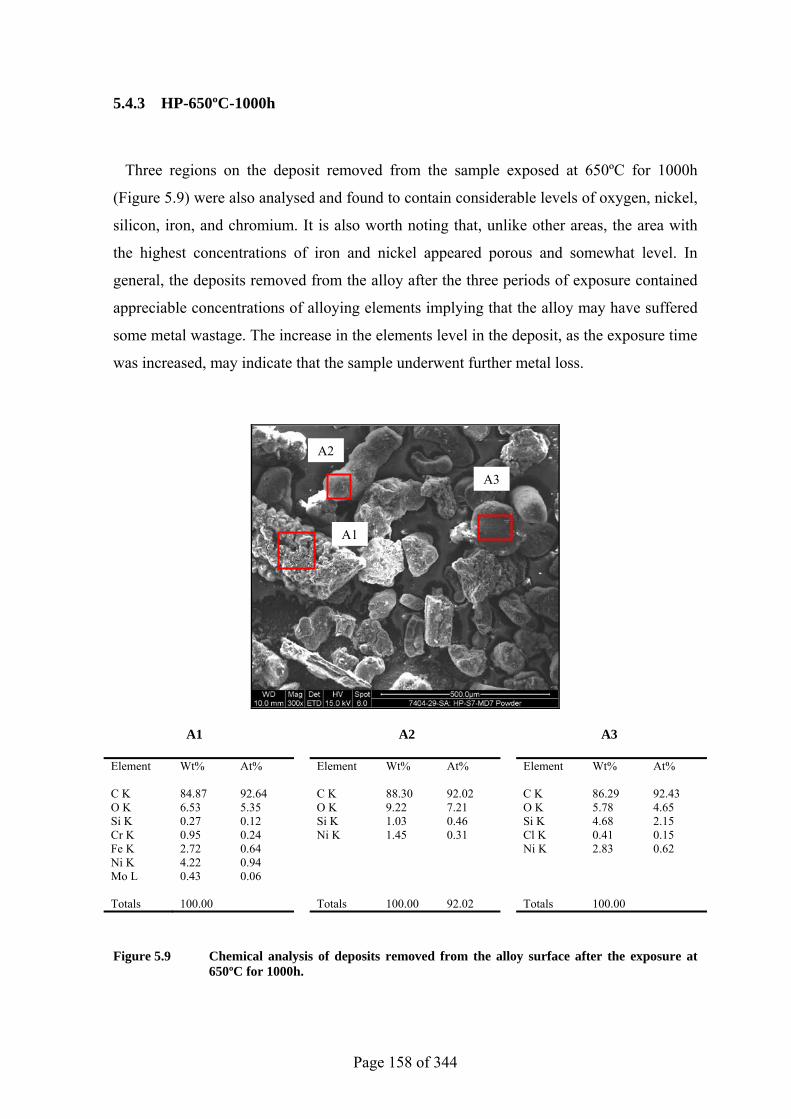
Page 158 of 344
5.4.3 HP-650ºC-1000h
Three regions on the deposit removed from the sample exposed at 650ºC for 1000h
(Figure 5.9) were also analysed and found to contain considerable levels of oxygen, nickel,
silicon, iron, and chromium. It is also worth noting that, unlike other areas, the area with
the highest concentrations of iron and nickel appeared porous and somewhat level. In
general, the deposits removed from the alloy after the three periods of exposure contained
appreciable concentrations of alloying elements implying that the alloy may have suffered
some metal wastage. The increase in the elements level in the deposit, as the exposure time
was increased, may indicate that the sample underwent further metal loss.
A1 A2 A3
Element Wt% At% Element Wt% At% Element Wt% At% C K 84.87 92.64 C K 88.30 92.02 C K 86.29 92.43 O K 6.53 5.35 O K 9.22 7.21 O K 5.78 4.65 Si K 0.27 0.12 Si K 1.03 0.46 Si K 4.68 2.15 Cr K 0.95 0.24 Ni K 1.45 0.31 Cl K 0.41 0.15 Fe K 2.72 0.64 Ni K 2.83 0.62 Ni K 4.22 0.94 Mo L 0.43 0.06 Totals 100.00 Totals 100.00 92.02 Totals 100.00
Figure 5.9 Chemical analysis of deposits removed from the alloy surface after the exposure at 650ºC for 1000h.
A1
A2
A3
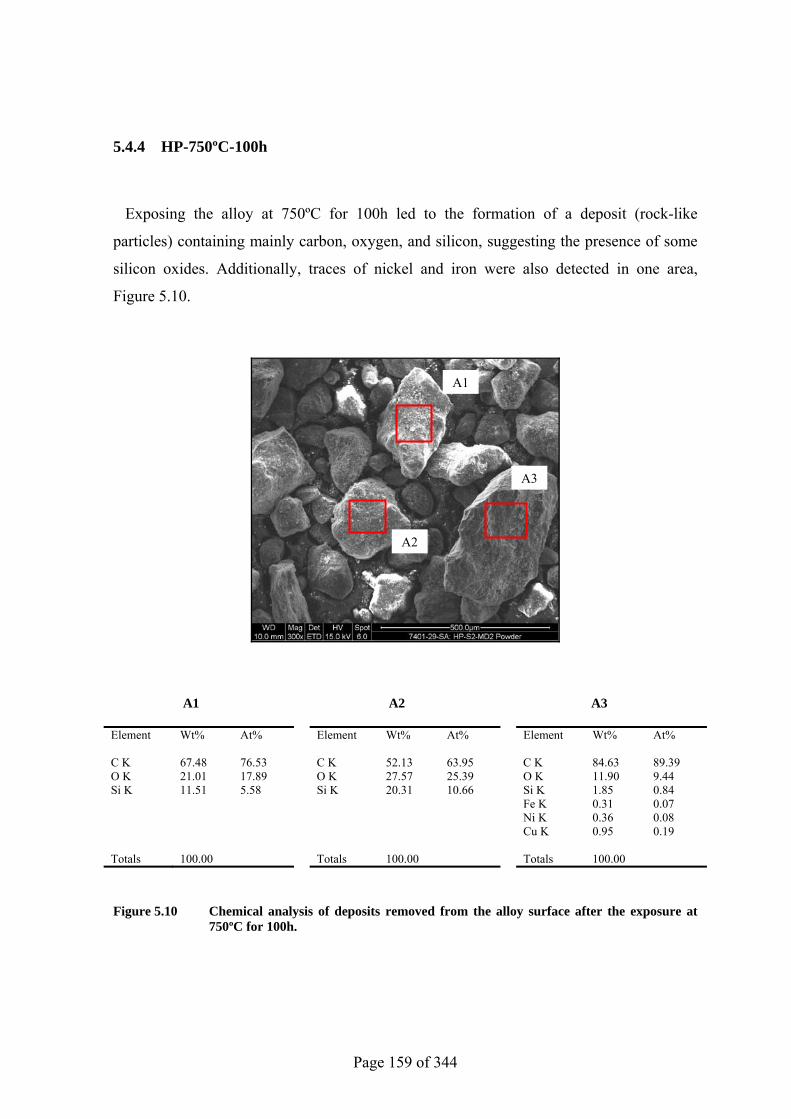
Page 159 of 344
5.4.4 HP-750ºC-100h
Exposing the alloy at 750ºC for 100h led to the formation of a deposit (rock-like
particles) containing mainly carbon, oxygen, and silicon, suggesting the presence of some
silicon oxides. Additionally, traces of nickel and iron were also detected in one area,
Figure 5.10.
A1 A2 A3
Element Wt% At% Element Wt% At% Element Wt% At% C K 67.48 76.53 C K 52.13 63.95 C K 84.63 89.39 O K 21.01 17.89 O K 27.57 25.39 O K 11.90 9.44 Si K 11.51 5.58 Si K 20.31 10.66 Si K 1.85 0.84 Fe K 0.31 0.07 Ni K 0.36 0.08 Cu K 0.95 0.19 Totals 100.00 Totals 100.00 Totals 100.00
Figure 5.10 Chemical analysis of deposits removed from the alloy surface after the exposure at 750ºC for 100h.
A1
A2
A3
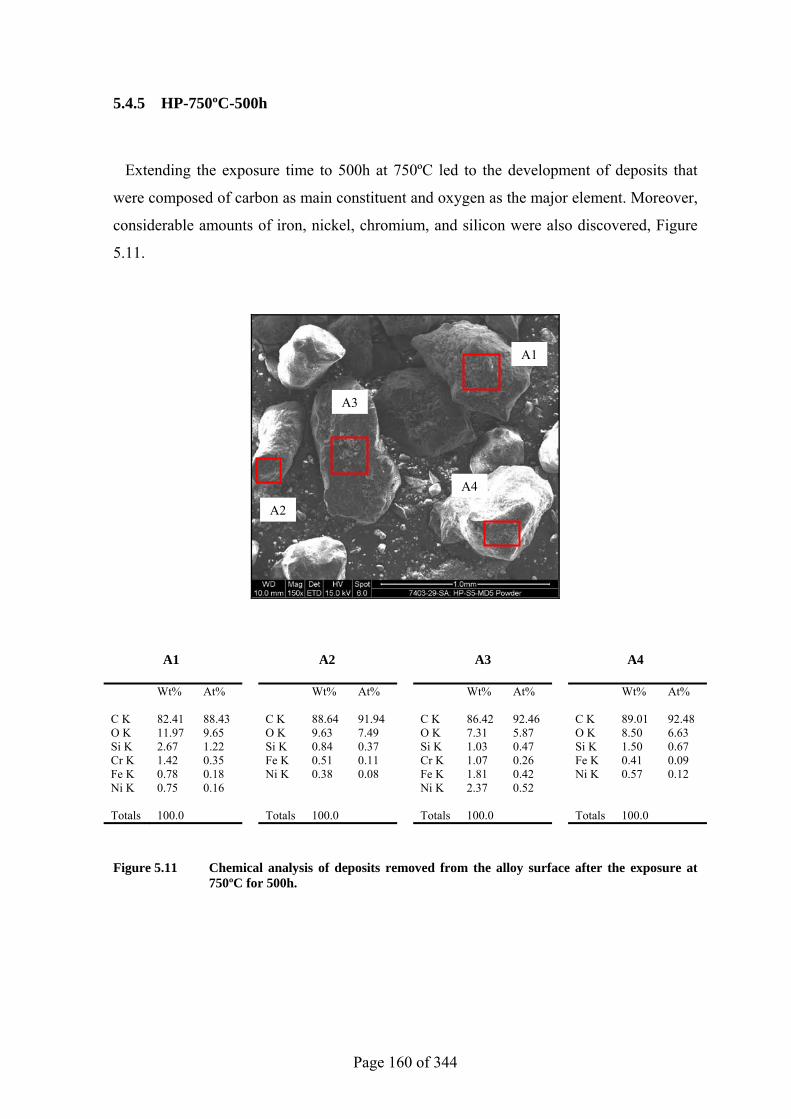
Page 160 of 344
5.4.5 HP-750ºC-500h
Extending the exposure time to 500h at 750ºC led to the development of deposits that
were composed of carbon as main constituent and oxygen as the major element. Moreover,
considerable amounts of iron, nickel, chromium, and silicon were also discovered, Figure
5.11.
A1 A2 A3 A4
Wt% At% Wt% At% Wt% At% Wt% At% C K 82.41 88.43 C K 88.64 91.94 C K 86.42 92.46 C K 89.01 92.48 O K 11.97 9.65 O K 9.63 7.49 O K 7.31 5.87 O K 8.50 6.63 Si K 2.67 1.22 Si K 0.84 0.37 Si K 1.03 0.47 Si K 1.50 0.67 Cr K 1.42 0.35 Fe K 0.51 0.11 Cr K 1.07 0.26 Fe K 0.41 0.09 Fe K 0.78 0.18 Ni K 0.38 0.08 Fe K 1.81 0.42 Ni K 0.57 0.12 Ni K 0.75 0.16 Ni K 2.37 0.52 Totals 100.0 Totals 100.0 Totals 100.0 Totals 100.0
Figure 5.11 Chemical analysis of deposits removed from the alloy surface after the exposure at 750ºC for 500h.
A1
A2
A3
A4
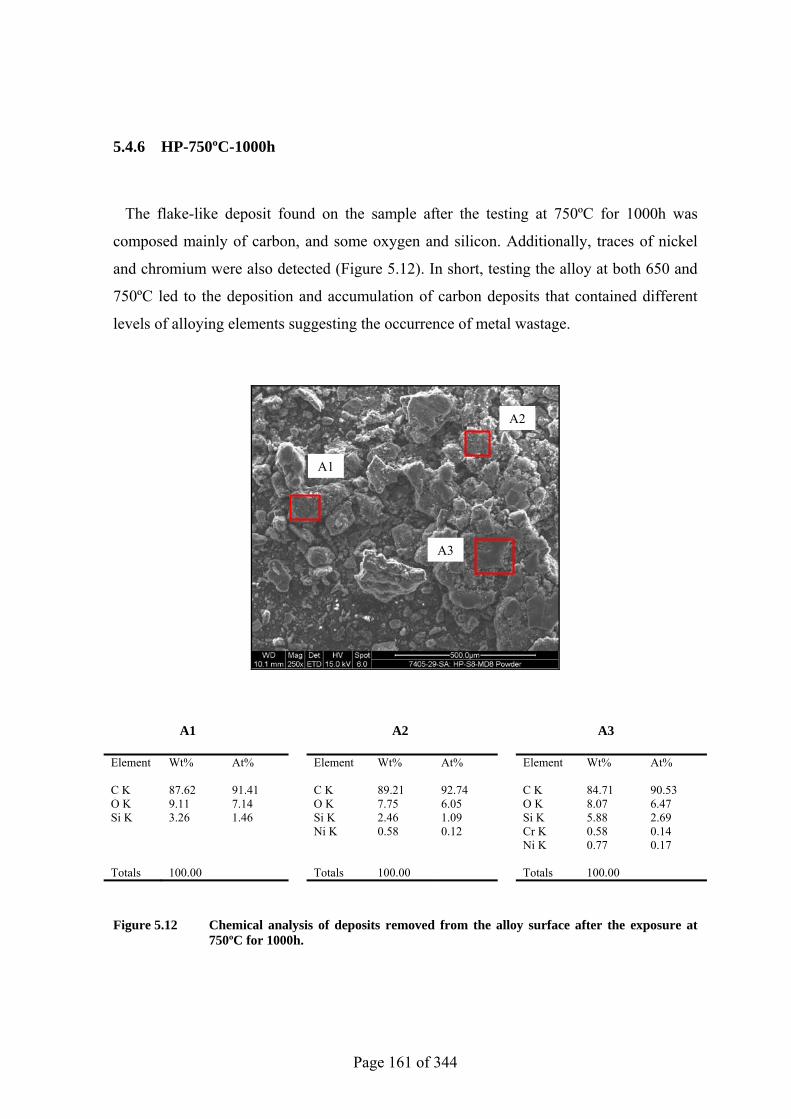
Page 161 of 344
5.4.6 HP-750ºC-1000h
The flake-like deposit found on the sample after the testing at 750ºC for 1000h was
composed mainly of carbon, and some oxygen and silicon. Additionally, traces of nickel
and chromium were also detected (Figure 5.12). In short, testing the alloy at both 650 and
750ºC led to the deposition and accumulation of carbon deposits that contained different
levels of alloying elements suggesting the occurrence of metal wastage.
A1 A2 A3
Element Wt% At% Element Wt% At% Element Wt% At% C K 87.62 91.41 C K 89.21 92.74 C K 84.71 90.53 O K 9.11 7.14 O K 7.75 6.05 O K 8.07 6.47 Si K 3.26 1.46 Si K 2.46 1.09 Si K 5.88 2.69 Ni K 0.58 0.12 Cr K 0.58 0.14 Ni K 0.77 0.17 Totals 100.00 Totals 100.00 Totals 100.00
Figure 5.12 Chemical analysis of deposits removed from the alloy surface after the exposure at 750ºC for 1000h.
A1
A2
A3
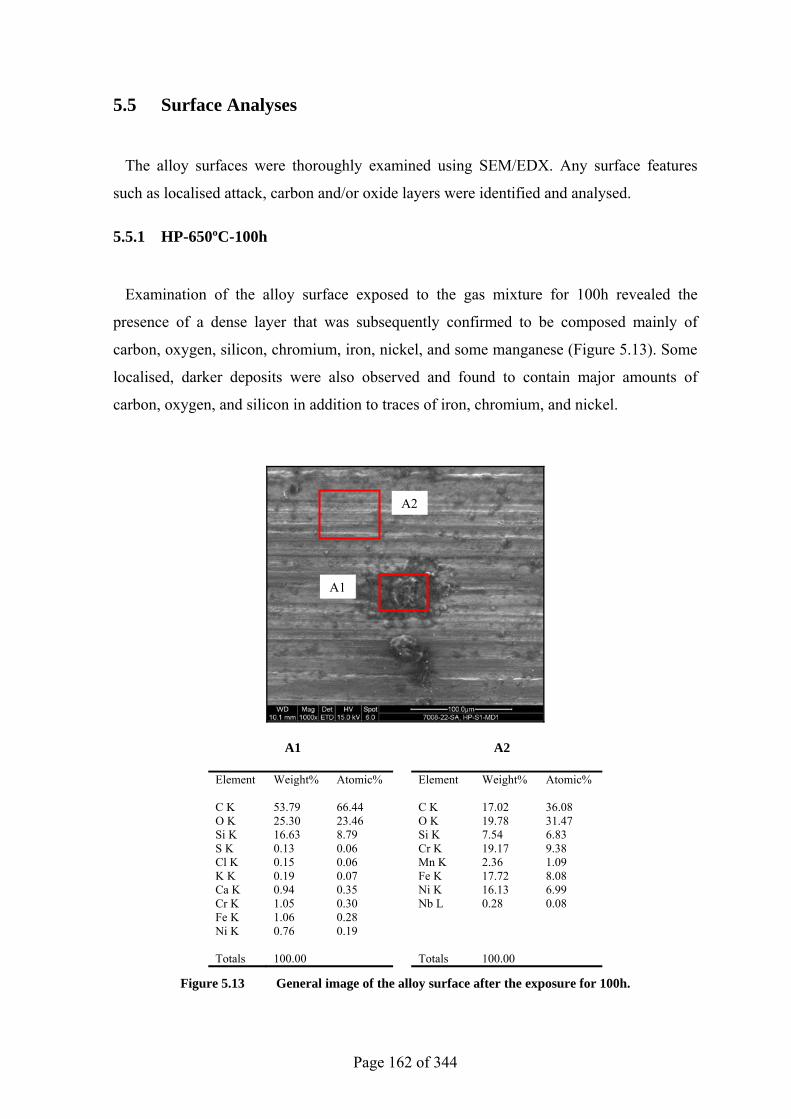
Page 162 of 344
5.5 Surface Analyses
The alloy surfaces were thoroughly examined using SEM/EDX. Any surface features
such as localised attack, carbon and/or oxide layers were identified and analysed.
5.5.1 HP-650ºC-100h
Examination of the alloy surface exposed to the gas mixture for 100h revealed the
presence of a dense layer that was subsequently confirmed to be composed mainly of
carbon, oxygen, silicon, chromium, iron, nickel, and some manganese (Figure 5.13). Some
localised, darker deposits were also observed and found to contain major amounts of
carbon, oxygen, and silicon in addition to traces of iron, chromium, and nickel.
A1 A2
Element Weight% Atomic% Element Weight% Atomic% C K 53.79 66.44 C K 17.02 36.08 O K 25.30 23.46 O K 19.78 31.47 Si K 16.63 8.79 Si K 7.54 6.83 S K 0.13 0.06 Cr K 19.17 9.38 Cl K 0.15 0.06 Mn K 2.36 1.09 K K 0.19 0.07 Fe K 17.72 8.08 Ca K 0.94 0.35 Ni K 16.13 6.99 Cr K 1.05 0.30 Nb L 0.28 0.08 Fe K 1.06 0.28 Ni K 0.76 0.19 Totals 100.00 Totals 100.00
Figure 5.13 General image of the alloy surface after the exposure for 100h.
A1
A2
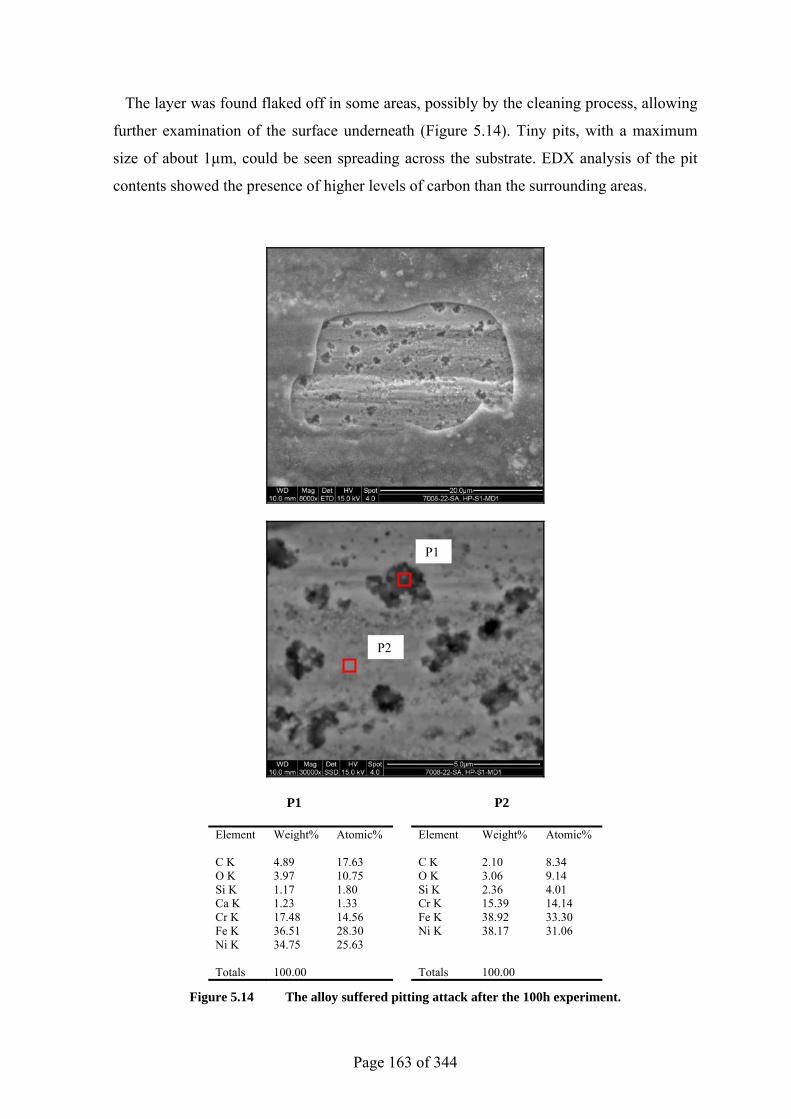
Page 163 of 344
The layer was found flaked off in some areas, possibly by the cleaning process, allowing
further examination of the surface underneath (Figure 5.14). Tiny pits, with a maximum
size of about 1µm, could be seen spreading across the substrate. EDX analysis of the pit
contents showed the presence of higher levels of carbon than the surrounding areas.
P1 P2
Element Weight% Atomic% Element Weight% Atomic% C K 4.89 17.63 C K 2.10 8.34 O K 3.97 10.75 O K 3.06 9.14 Si K 1.17 1.80 Si K 2.36 4.01 Ca K 1.23 1.33 Cr K 15.39 14.14 Cr K 17.48 14.56 Fe K 38.92 33.30 Fe K 36.51 28.30 Ni K 38.17 31.06 Ni K 34.75 25.63 Totals 100.00 Totals 100.00
Figure 5.14 The alloy suffered pitting attack after the 100h experiment.
P1
P2
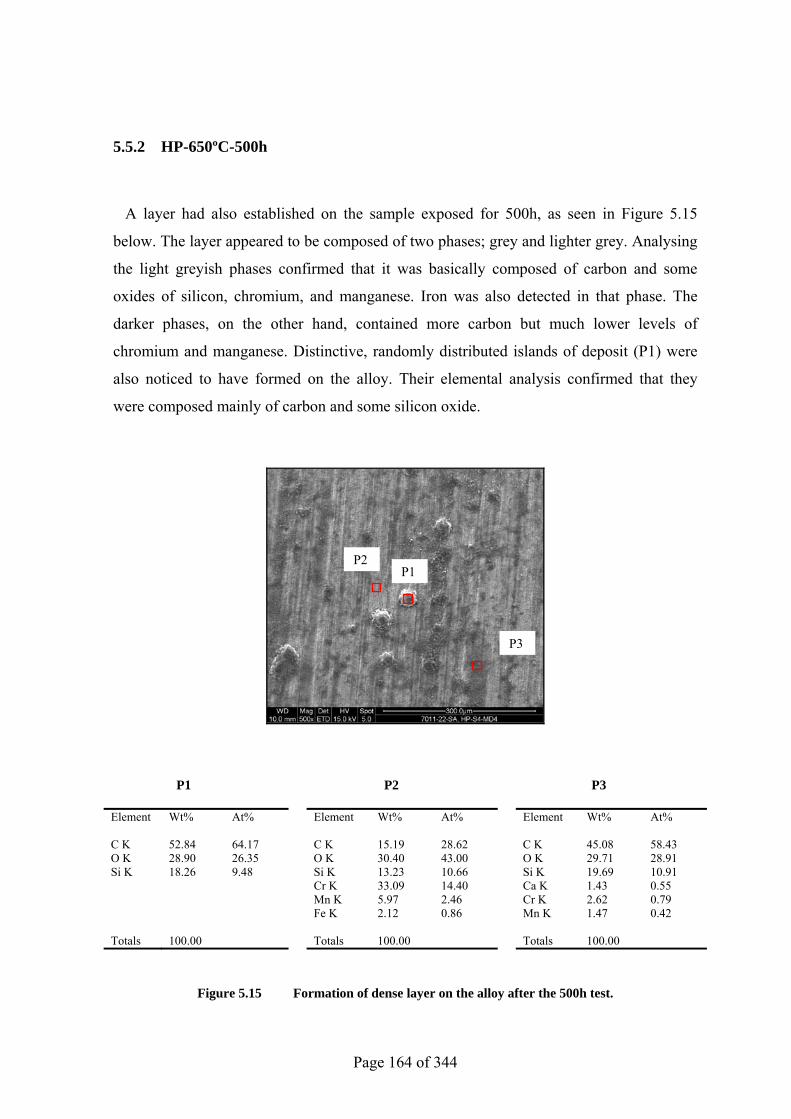
Page 164 of 344
5.5.2 HP-650ºC-500h
A layer had also established on the sample exposed for 500h, as seen in Figure 5.15
below. The layer appeared to be composed of two phases; grey and lighter grey. Analysing
the light greyish phases confirmed that it was basically composed of carbon and some
oxides of silicon, chromium, and manganese. Iron was also detected in that phase. The
darker phases, on the other hand, contained more carbon but much lower levels of
chromium and manganese. Distinctive, randomly distributed islands of deposit (P1) were
also noticed to have formed on the alloy. Their elemental analysis confirmed that they
were composed mainly of carbon and some silicon oxide.
P1 P2 P3
Element Wt% At% Element Wt% At% Element Wt% At% C K 52.84 64.17 C K 15.19 28.62 C K 45.08 58.43 O K 28.90 26.35 O K 30.40 43.00 O K 29.71 28.91 Si K 18.26 9.48 Si K 13.23 10.66 Si K 19.69 10.91 Cr K 33.09 14.40 Ca K 1.43 0.55 Mn K 5.97 2.46 Cr K 2.62 0.79 Fe K 2.12 0.86 Mn K 1.47 0.42 Totals 100.00 Totals 100.00 Totals 100.00
Figure 5.15 Formation of dense layer on the alloy after the 500h test.
P1P2
P3
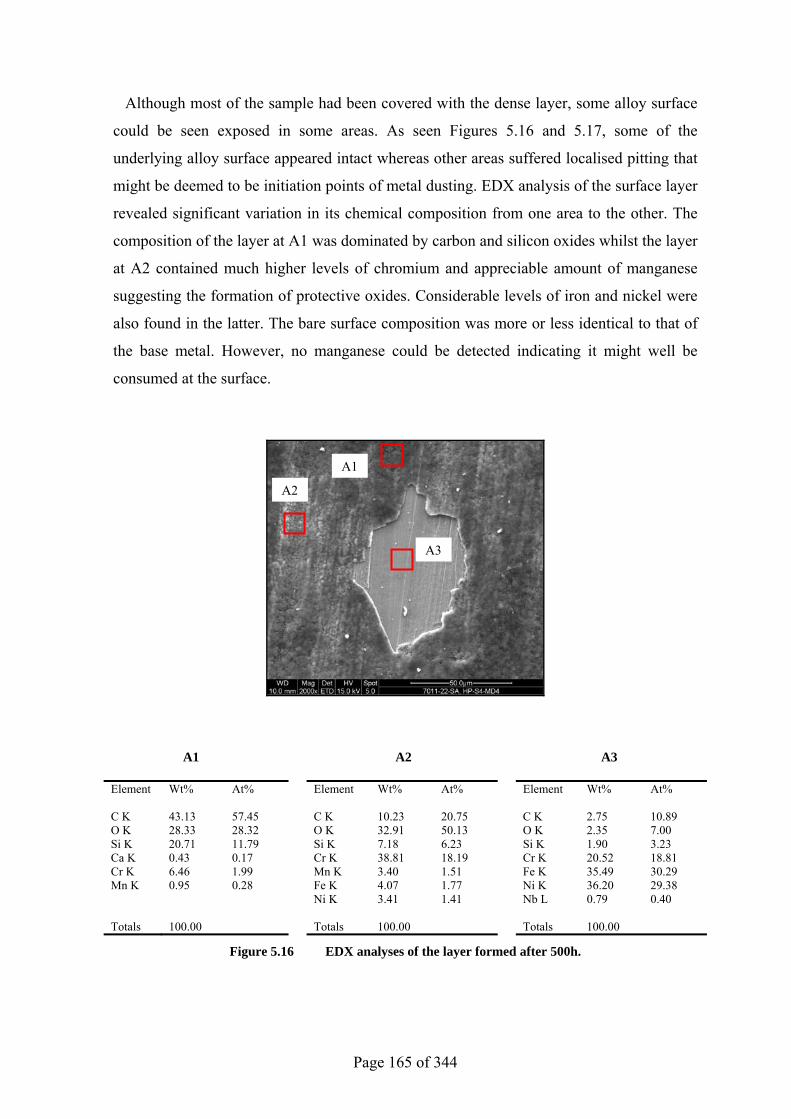
Page 165 of 344
Although most of the sample had been covered with the dense layer, some alloy surface
could be seen exposed in some areas. As seen Figures 5.16 and 5.17, some of the
underlying alloy surface appeared intact whereas other areas suffered localised pitting that
might be deemed to be initiation points of metal dusting. EDX analysis of the surface layer
revealed significant variation in its chemical composition from one area to the other. The
composition of the layer at A1 was dominated by carbon and silicon oxides whilst the layer
at A2 contained much higher levels of chromium and appreciable amount of manganese
suggesting the formation of protective oxides. Considerable levels of iron and nickel were
also found in the latter. The bare surface composition was more or less identical to that of
the base metal. However, no manganese could be detected indicating it might well be
consumed at the surface.
A1 A2 A3
Element Wt% At% Element Wt% At% Element Wt% At% C K 43.13 57.45 C K 10.23 20.75 C K 2.75 10.89 O K 28.33 28.32 O K 32.91 50.13 O K 2.35 7.00 Si K 20.71 11.79 Si K 7.18 6.23 Si K 1.90 3.23 Ca K 0.43 0.17 Cr K 38.81 18.19 Cr K 20.52 18.81 Cr K 6.46 1.99 Mn K 3.40 1.51 Fe K 35.49 30.29 Mn K 0.95 0.28 Fe K 4.07 1.77 Ni K 36.20 29.38 Ni K 3.41 1.41 Nb L 0.79 0.40 Totals 100.00 Totals 100.00 Totals 100.00
Figure 5.16 EDX analyses of the layer formed after 500h.
A1
A2
A3
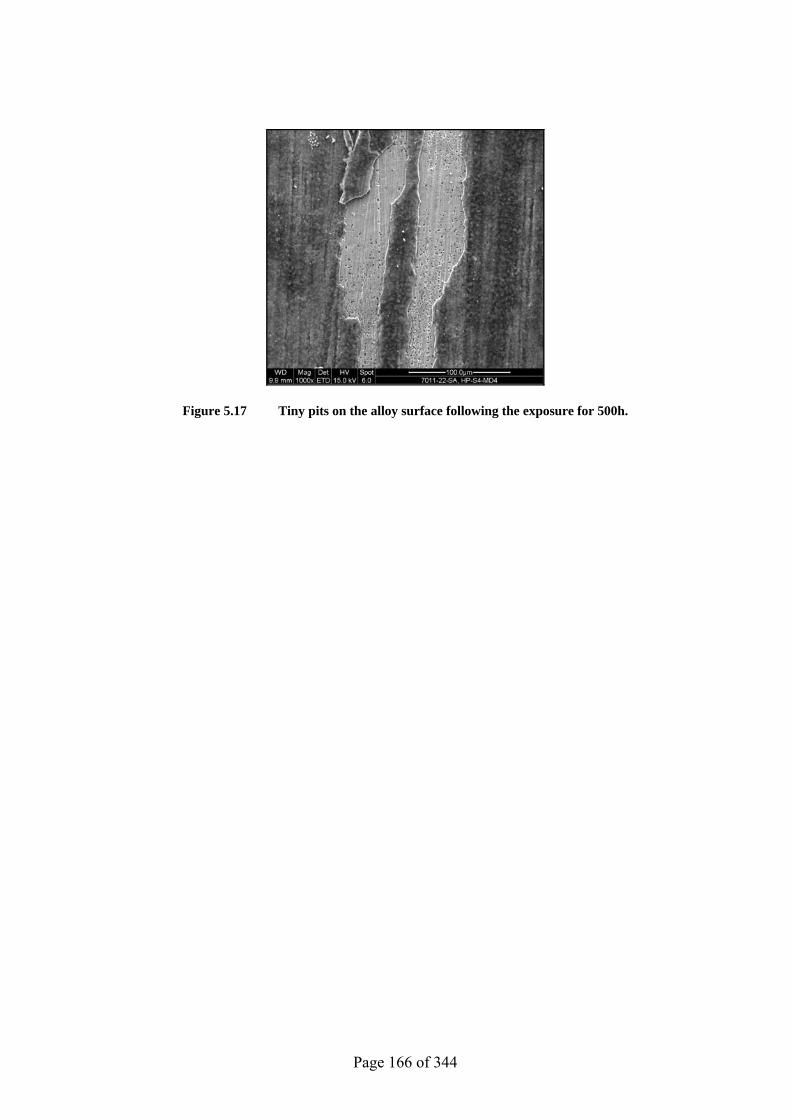
Page 166 of 344
Figure 5.17 Tiny pits on the alloy surface following the exposure for 500h.
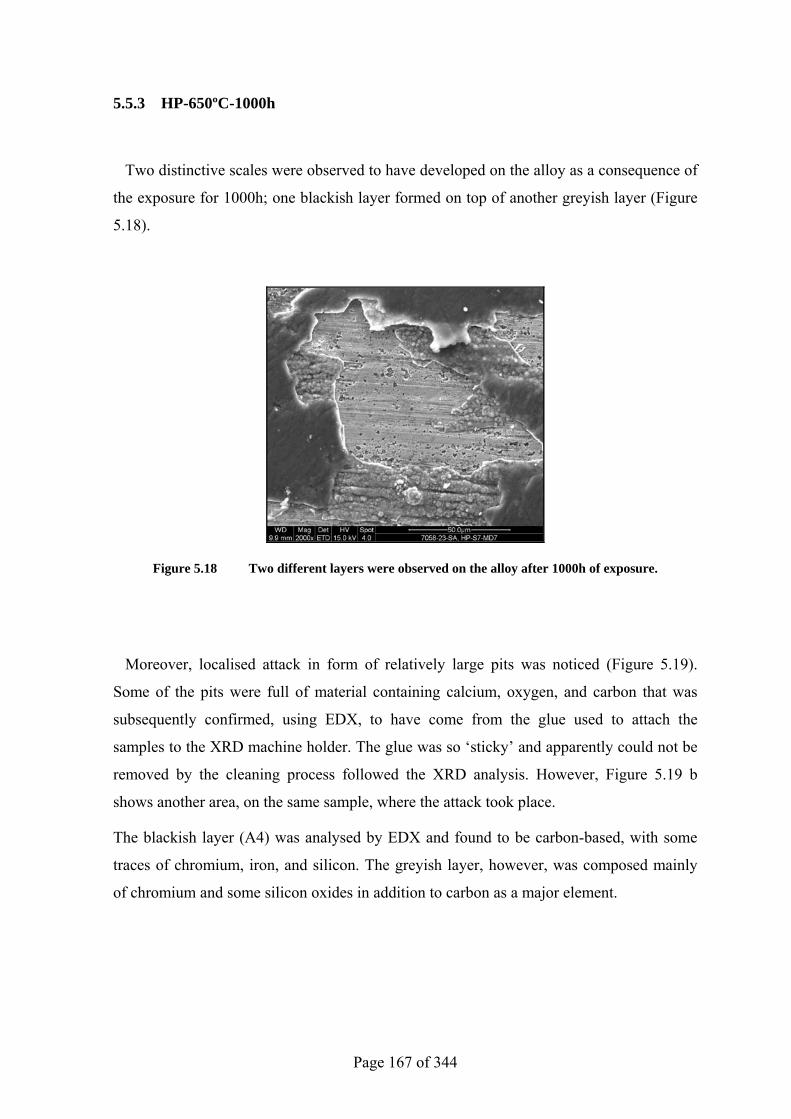
Page 167 of 344
5.5.3 HP-650ºC-1000h
Two distinctive scales were observed to have developed on the alloy as a consequence of
the exposure for 1000h; one blackish layer formed on top of another greyish layer (Figure
5.18).
Figure 5.18 Two different layers were observed on the alloy after 1000h of exposure.
Moreover, localised attack in form of relatively large pits was noticed (Figure 5.19).
Some of the pits were full of material containing calcium, oxygen, and carbon that was
subsequently confirmed, using EDX, to have come from the glue used to attach the
samples to the XRD machine holder. The glue was so ‘sticky’ and apparently could not be
removed by the cleaning process followed the XRD analysis. However, Figure 5.19 b
shows another area, on the same sample, where the attack took place.
The blackish layer (A4) was analysed by EDX and found to be carbon-based, with some
traces of chromium, iron, and silicon. The greyish layer, however, was composed mainly
of chromium and some silicon oxides in addition to carbon as a major element.
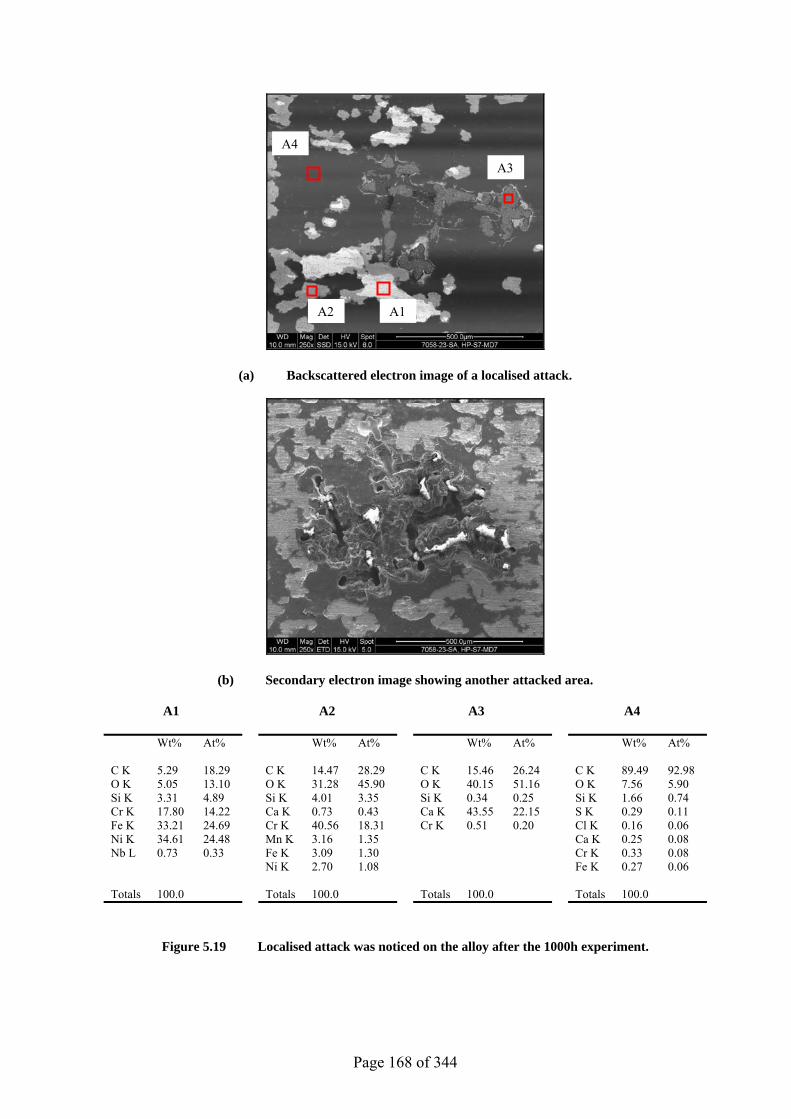
Page 168 of 344
(a) Backscattered electron image of a localised attack.
(b) Secondary electron image showing another attacked area.
A1 A2 A3 A4
Wt% At% Wt% At% Wt% At% Wt% At% C K 5.29 18.29 C K 14.47 28.29 C K 15.46 26.24 C K 89.49 92.98 O K 5.05 13.10 O K 31.28 45.90 O K 40.15 51.16 O K 7.56 5.90 Si K 3.31 4.89 Si K 4.01 3.35 Si K 0.34 0.25 Si K 1.66 0.74 Cr K 17.80 14.22 Ca K 0.73 0.43 Ca K 43.55 22.15 S K 0.29 0.11 Fe K 33.21 24.69 Cr K 40.56 18.31 Cr K 0.51 0.20 Cl K 0.16 0.06 Ni K 34.61 24.48 Mn K 3.16 1.35 Ca K 0.25 0.08 Nb L 0.73 0.33 Fe K 3.09 1.30 Cr K 0.33 0.08 Ni K 2.70 1.08 Fe K 0.27 0.06 Totals 100.0 Totals 100.0 Totals 100.0 Totals 100.0
Figure 5.19 Localised attack was noticed on the alloy after the 1000h experiment.
A1A2
A3
A4
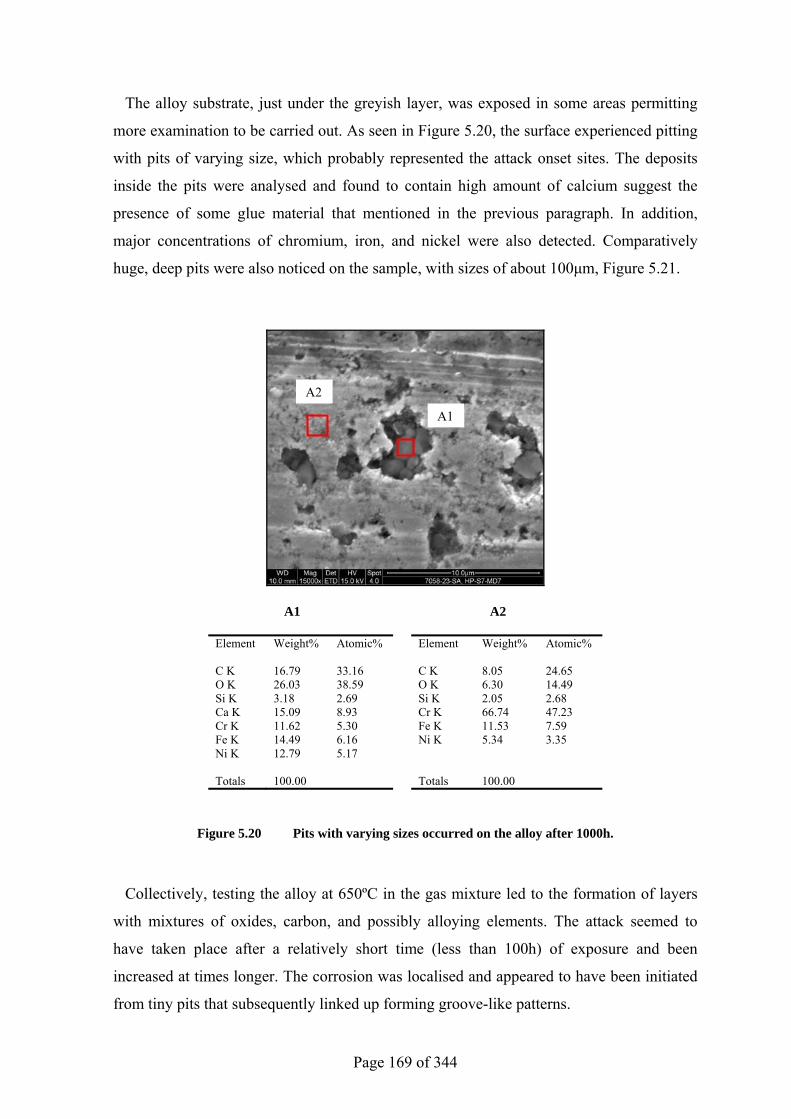
Page 169 of 344
The alloy substrate, just under the greyish layer, was exposed in some areas permitting
more examination to be carried out. As seen in Figure 5.20, the surface experienced pitting
with pits of varying size, which probably represented the attack onset sites. The deposits
inside the pits were analysed and found to contain high amount of calcium suggest the
presence of some glue material that mentioned in the previous paragraph. In addition,
major concentrations of chromium, iron, and nickel were also detected. Comparatively
huge, deep pits were also noticed on the sample, with sizes of about 100µm, Figure 5.21.
A1 A2
Element Weight% Atomic% Element Weight% Atomic% C K 16.79 33.16 C K 8.05 24.65 O K 26.03 38.59 O K 6.30 14.49 Si K 3.18 2.69 Si K 2.05 2.68 Ca K 15.09 8.93 Cr K 66.74 47.23 Cr K 11.62 5.30 Fe K 11.53 7.59 Fe K 14.49 6.16 Ni K 5.34 3.35 Ni K 12.79 5.17 Totals 100.00 Totals 100.00
Figure 5.20 Pits with varying sizes occurred on the alloy after 1000h.
Collectively, testing the alloy at 650ºC in the gas mixture led to the formation of layers
with mixtures of oxides, carbon, and possibly alloying elements. The attack seemed to
have taken place after a relatively short time (less than 100h) of exposure and been
increased at times longer. The corrosion was localised and appeared to have been initiated
from tiny pits that subsequently linked up forming groove-like patterns.
A1
A2
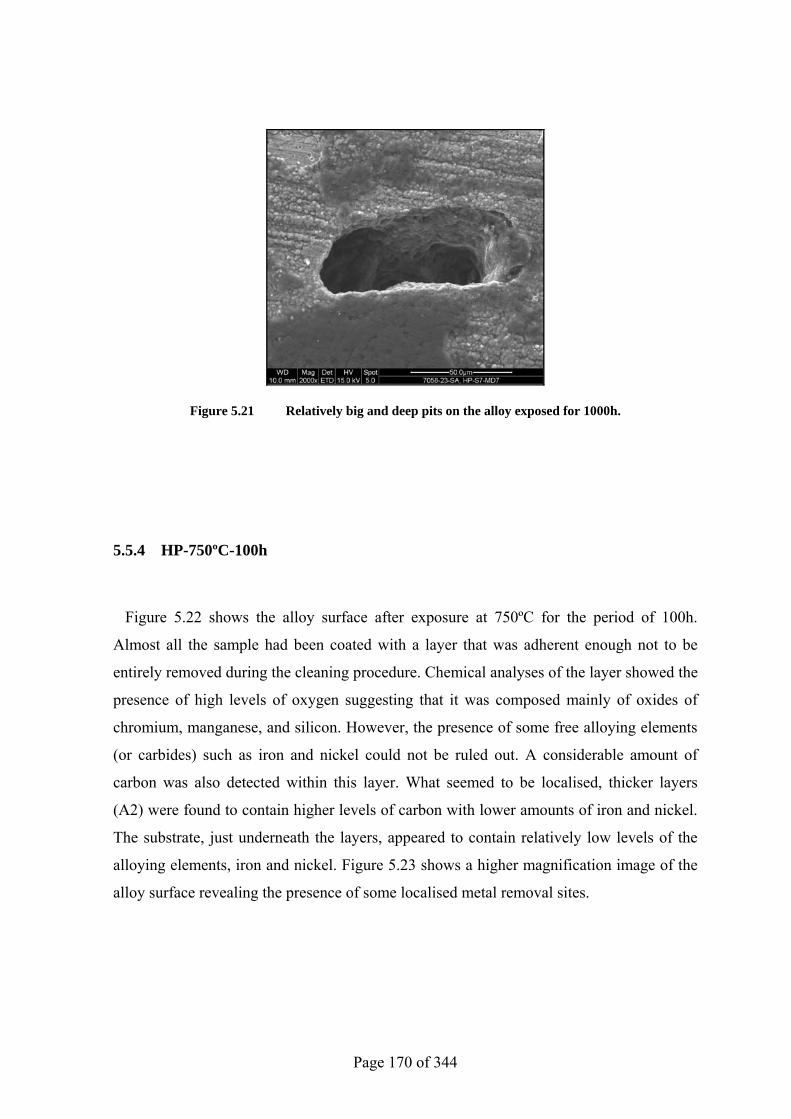
Page 170 of 344
Figure 5.21 Relatively big and deep pits on the alloy exposed for 1000h.
5.5.4 HP-750ºC-100h
Figure 5.22 shows the alloy surface after exposure at 750ºC for the period of 100h.
Almost all the sample had been coated with a layer that was adherent enough not to be
entirely removed during the cleaning procedure. Chemical analyses of the layer showed the
presence of high levels of oxygen suggesting that it was composed mainly of oxides of
chromium, manganese, and silicon. However, the presence of some free alloying elements
(or carbides) such as iron and nickel could not be ruled out. A considerable amount of
carbon was also detected within this layer. What seemed to be localised, thicker layers
(A2) were found to contain higher levels of carbon with lower amounts of iron and nickel.
The substrate, just underneath the layers, appeared to contain relatively low levels of the
alloying elements, iron and nickel. Figure 5.23 shows a higher magnification image of the
alloy surface revealing the presence of some localised metal removal sites.
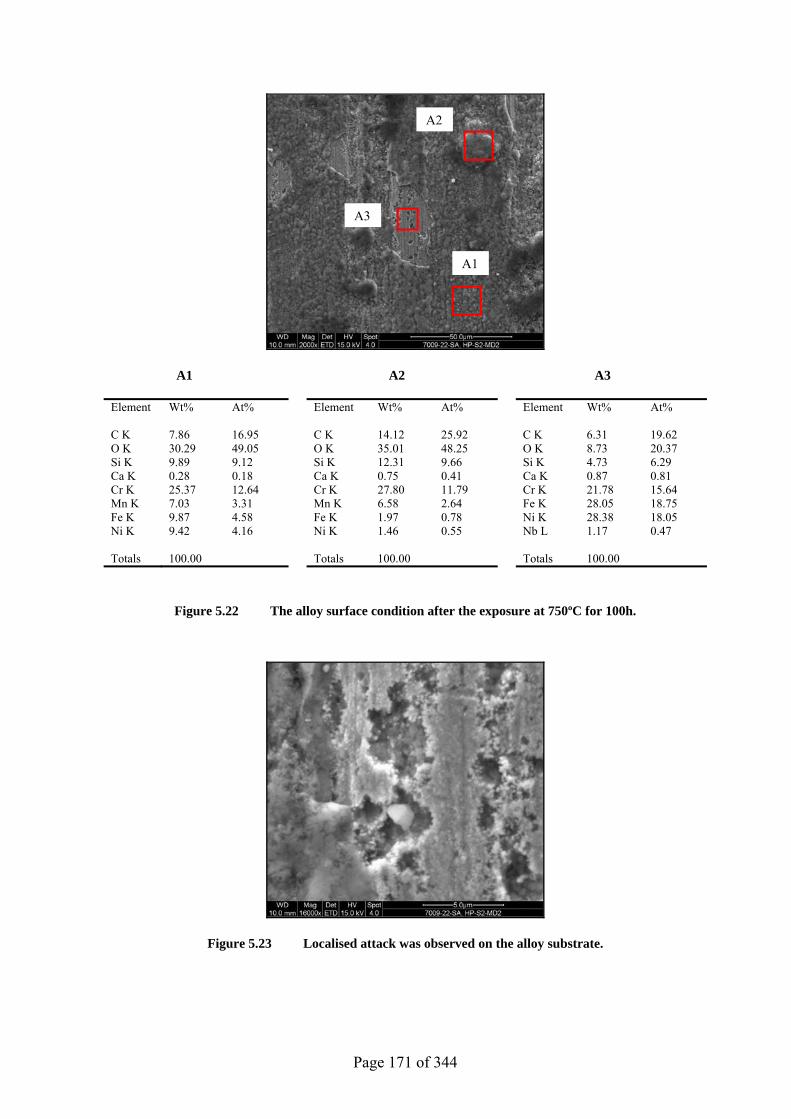
Page 171 of 344
A1 A2 A3
Element Wt% At% Element Wt% At% Element Wt% At% C K 7.86 16.95 C K 14.12 25.92 C K 6.31 19.62 O K 30.29 49.05 O K 35.01 48.25 O K 8.73 20.37 Si K 9.89 9.12 Si K 12.31 9.66 Si K 4.73 6.29 Ca K 0.28 0.18 Ca K 0.75 0.41 Ca K 0.87 0.81 Cr K 25.37 12.64 Cr K 27.80 11.79 Cr K 21.78 15.64 Mn K 7.03 3.31 Mn K 6.58 2.64 Fe K 28.05 18.75 Fe K 9.87 4.58 Fe K 1.97 0.78 Ni K 28.38 18.05 Ni K 9.42 4.16 Ni K 1.46 0.55 Nb L 1.17 0.47 Totals 100.00 Totals 100.00 Totals 100.00
Figure 5.22 The alloy surface condition after the exposure at 750ºC for 100h.
Figure 5.23 Localised attack was observed on the alloy substrate.
A1
A2
A3
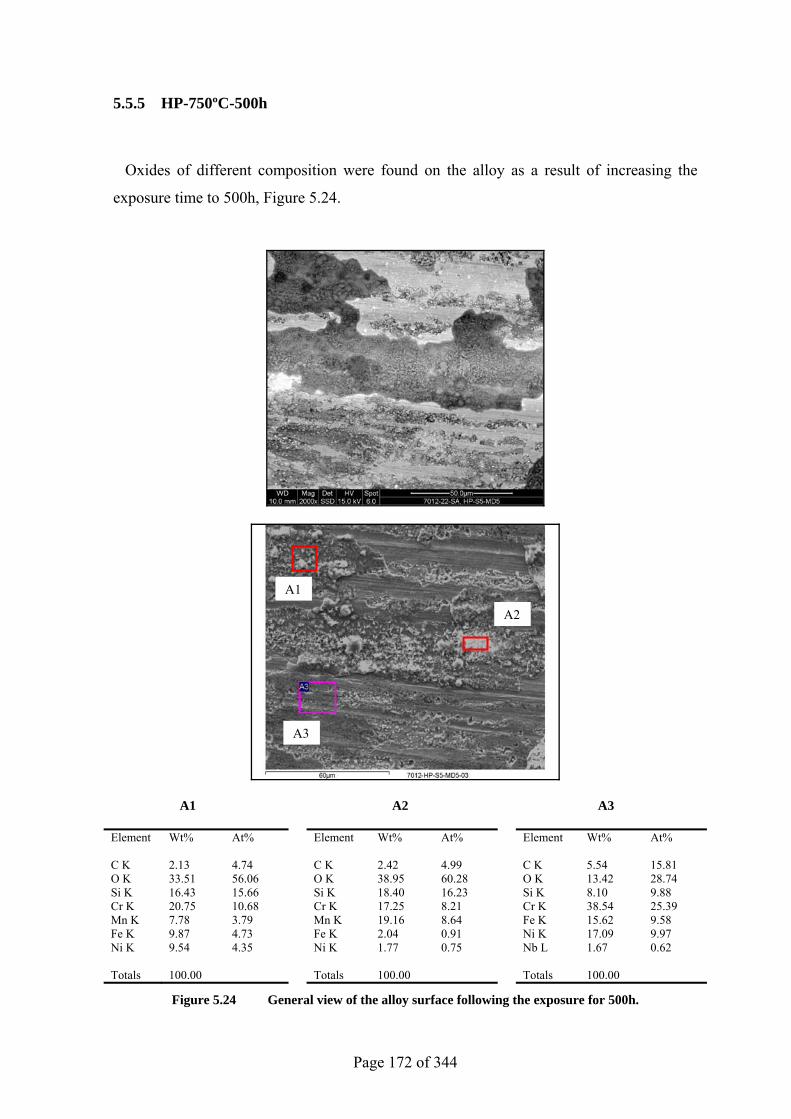
Page 172 of 344
5.5.5 HP-750ºC-500h
Oxides of different composition were found on the alloy as a result of increasing the
exposure time to 500h, Figure 5.24.
A1 A2 A3
Element Wt% At% Element Wt% At% Element Wt% At% C K 2.13 4.74 C K 2.42 4.99 C K 5.54 15.81 O K 33.51 56.06 O K 38.95 60.28 O K 13.42 28.74 Si K 16.43 15.66 Si K 18.40 16.23 Si K 8.10 9.88 Cr K 20.75 10.68 Cr K 17.25 8.21 Cr K 38.54 25.39 Mn K 7.78 3.79 Mn K 19.16 8.64 Fe K 15.62 9.58 Fe K 9.87 4.73 Fe K 2.04 0.91 Ni K 17.09 9.97 Ni K 9.54 4.35 Ni K 1.77 0.75 Nb L 1.67 0.62 Totals 100.00 Totals 100.00 Totals 100.00
Figure 5.24 General view of the alloy surface following the exposure for 500h.
A2
A1
A3
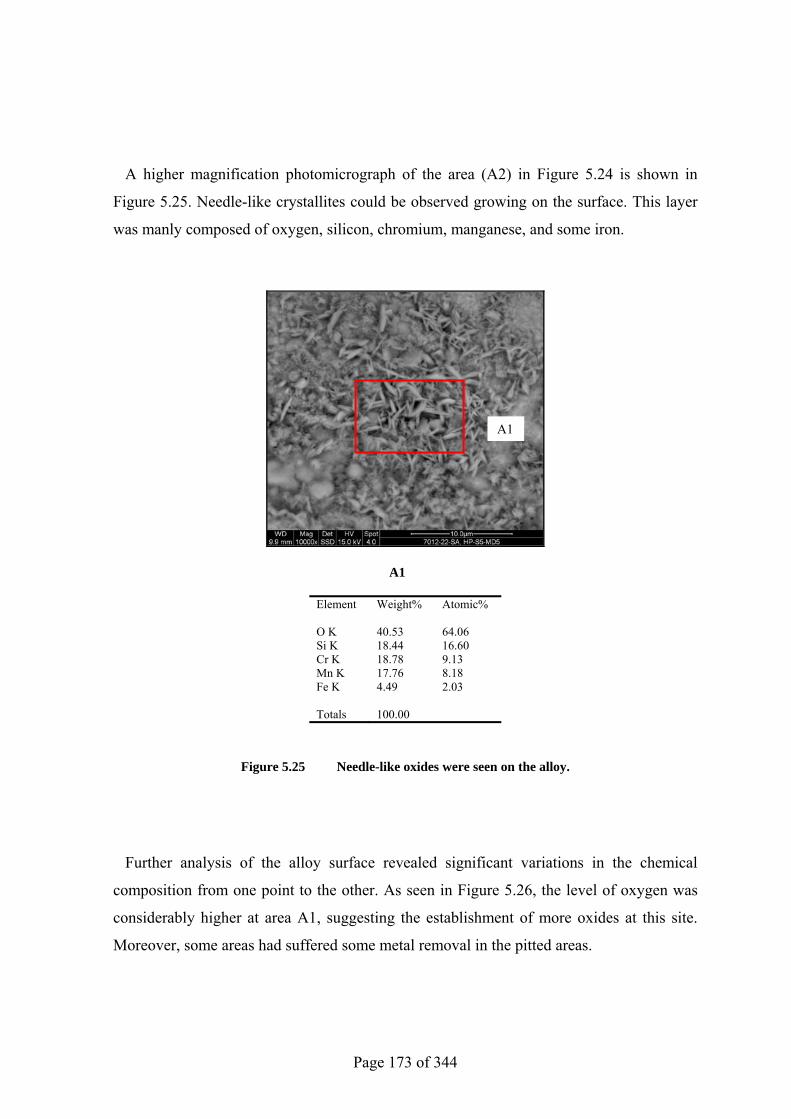
Page 173 of 344
A higher magnification photomicrograph of the area (A2) in Figure 5.24 is shown in
Figure 5.25. Needle-like crystallites could be observed growing on the surface. This layer
was manly composed of oxygen, silicon, chromium, manganese, and some iron.
A1
Element Weight% Atomic% O K 40.53 64.06 Si K 18.44 16.60 Cr K 18.78 9.13 Mn K 17.76 8.18 Fe K 4.49 2.03 Totals 100.00
Figure 5.25 Needle-like oxides were seen on the alloy.
Further analysis of the alloy surface revealed significant variations in the chemical
composition from one point to the other. As seen in Figure 5.26, the level of oxygen was
considerably higher at area A1, suggesting the establishment of more oxides at this site.
Moreover, some areas had suffered some metal removal in the pitted areas.
A1
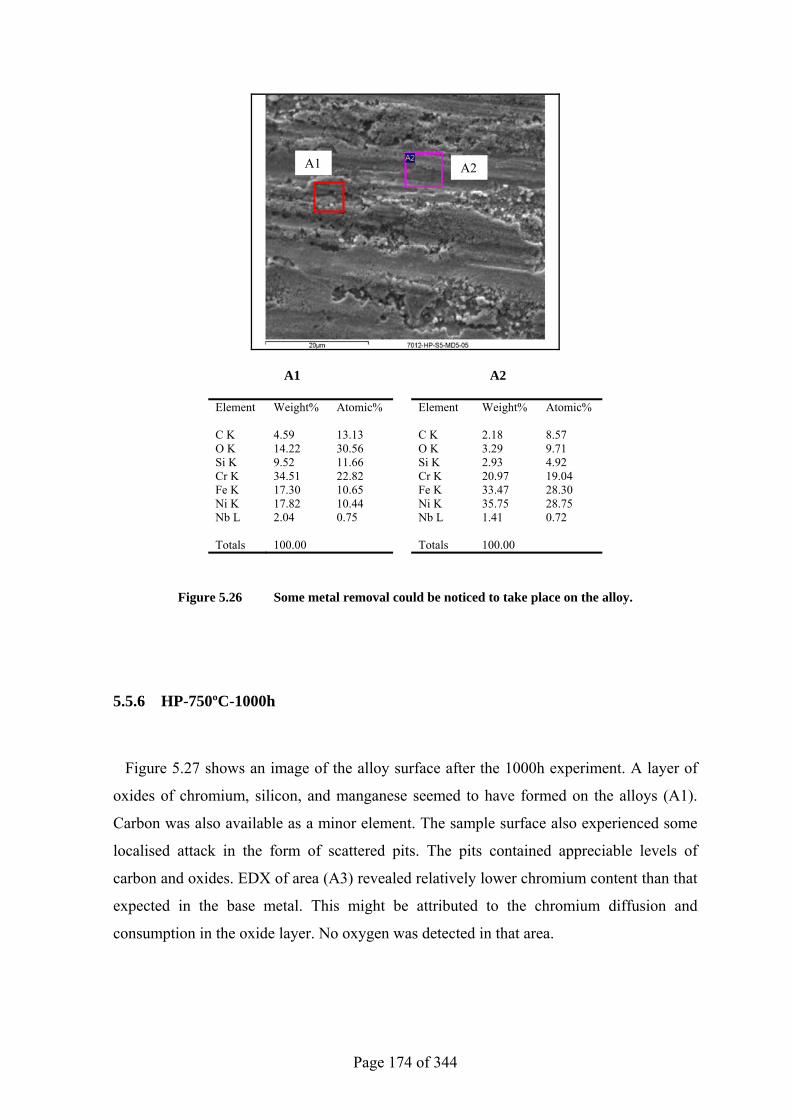
Page 174 of 344
A1 A2
Element Weight% Atomic% Element Weight% Atomic% C K 4.59 13.13 C K 2.18 8.57 O K 14.22 30.56 O K 3.29 9.71 Si K 9.52 11.66 Si K 2.93 4.92 Cr K 34.51 22.82 Cr K 20.97 19.04 Fe K 17.30 10.65 Fe K 33.47 28.30 Ni K 17.82 10.44 Ni K 35.75 28.75 Nb L 2.04 0.75 Nb L 1.41 0.72 Totals 100.00 Totals 100.00
Figure 5.26 Some metal removal could be noticed to take place on the alloy.
5.5.6 HP-750ºC-1000h
Figure 5.27 shows an image of the alloy surface after the 1000h experiment. A layer of
oxides of chromium, silicon, and manganese seemed to have formed on the alloys (A1).
Carbon was also available as a minor element. The sample surface also experienced some
localised attack in the form of scattered pits. The pits contained appreciable levels of
carbon and oxides. EDX of area (A3) revealed relatively lower chromium content than that
expected in the base metal. This might be attributed to the chromium diffusion and
consumption in the oxide layer. No oxygen was detected in that area.
A1 A2
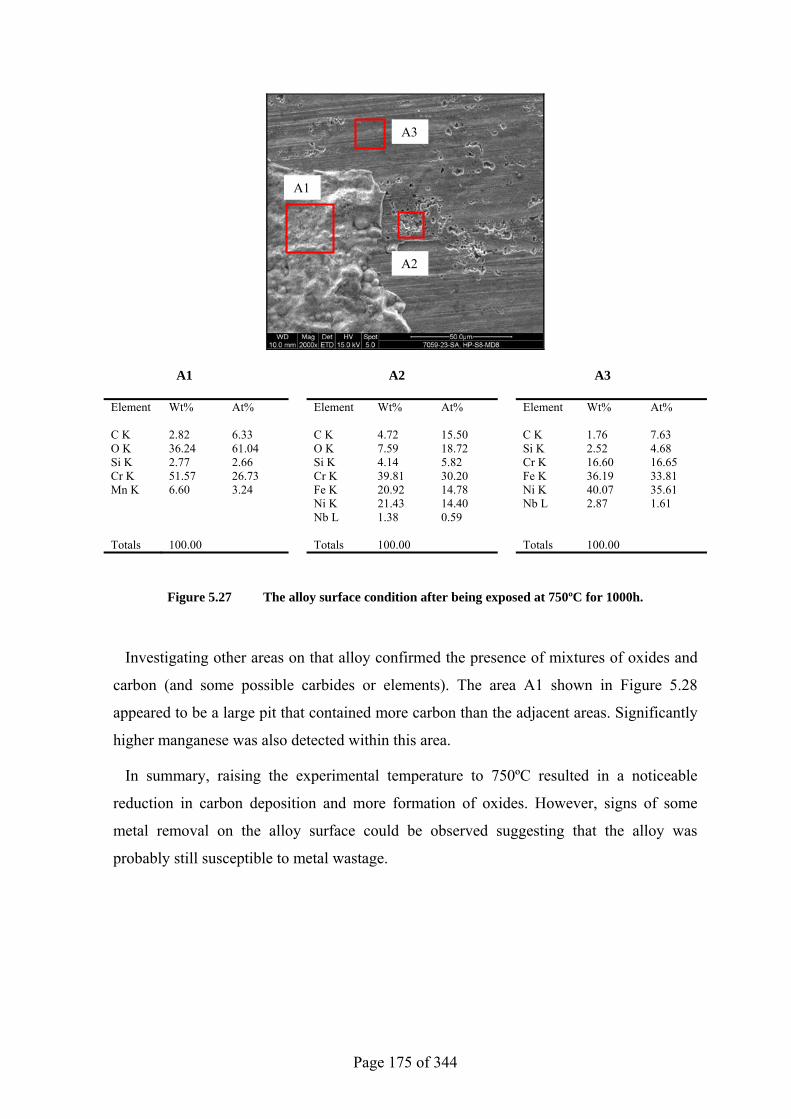
Page 175 of 344
A1 A2 A3
Element Wt% At% Element Wt% At% Element Wt% At% C K 2.82 6.33 C K 4.72 15.50 C K 1.76 7.63 O K 36.24 61.04 O K 7.59 18.72 Si K 2.52 4.68 Si K 2.77 2.66 Si K 4.14 5.82 Cr K 16.60 16.65 Cr K 51.57 26.73 Cr K 39.81 30.20 Fe K 36.19 33.81 Mn K 6.60 3.24 Fe K 20.92 14.78 Ni K 40.07 35.61 Ni K 21.43 14.40 Nb L 2.87 1.61 Nb L 1.38 0.59 Totals 100.00 Totals 100.00 Totals 100.00
Figure 5.27 The alloy surface condition after being exposed at 750ºC for 1000h.
Investigating other areas on that alloy confirmed the presence of mixtures of oxides and
carbon (and some possible carbides or elements). The area A1 shown in Figure 5.28
appeared to be a large pit that contained more carbon than the adjacent areas. Significantly
higher manganese was also detected within this area.
In summary, raising the experimental temperature to 750ºC resulted in a noticeable
reduction in carbon deposition and more formation of oxides. However, signs of some
metal removal on the alloy surface could be observed suggesting that the alloy was
probably still susceptible to metal wastage.
A1
A2
A3
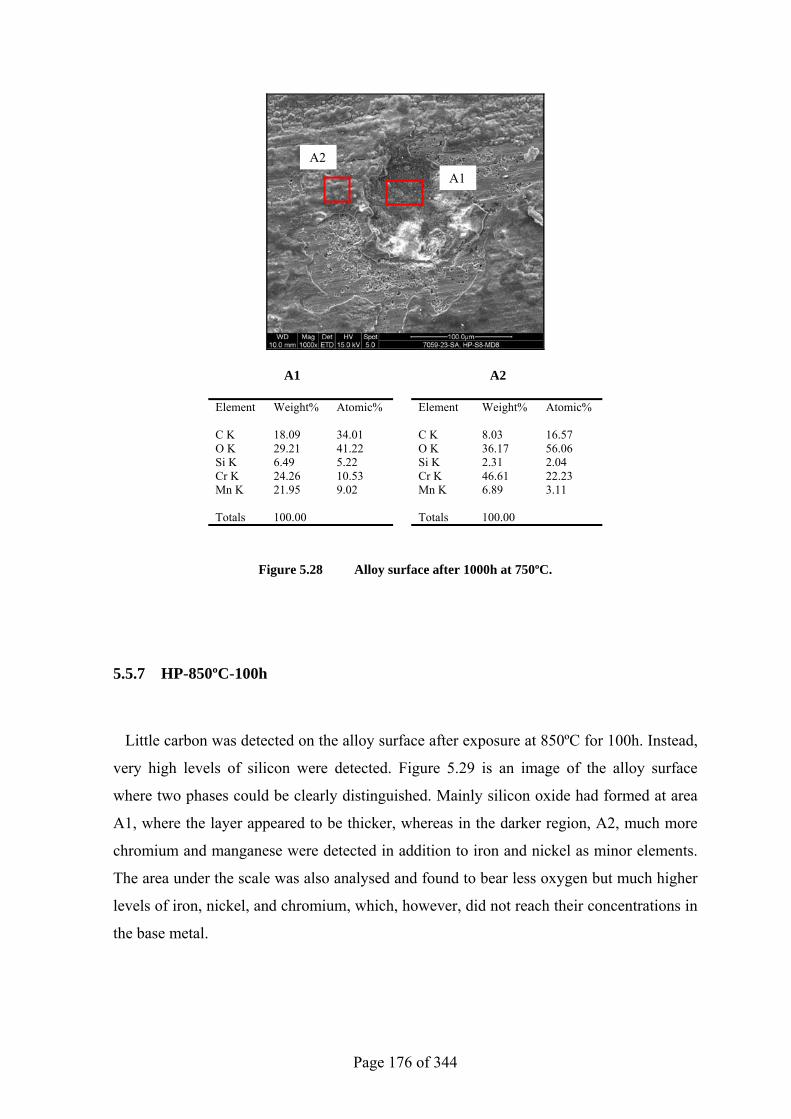
Page 176 of 344
A1 A2
Element Weight% Atomic% Element Weight% Atomic% C K 18.09 34.01 C K 8.03 16.57 O K 29.21 41.22 O K 36.17 56.06 Si K 6.49 5.22 Si K 2.31 2.04 Cr K 24.26 10.53 Cr K 46.61 22.23 Mn K 21.95 9.02 Mn K 6.89 3.11 Totals 100.00 Totals 100.00
Figure 5.28 Alloy surface after 1000h at 750ºC.
5.5.7 HP-850ºC-100h
Little carbon was detected on the alloy surface after exposure at 850ºC for 100h. Instead,
very high levels of silicon were detected. Figure 5.29 is an image of the alloy surface
where two phases could be clearly distinguished. Mainly silicon oxide had formed at area
A1, where the layer appeared to be thicker, whereas in the darker region, A2, much more
chromium and manganese were detected in addition to iron and nickel as minor elements.
The area under the scale was also analysed and found to bear less oxygen but much higher
levels of iron, nickel, and chromium, which, however, did not reach their concentrations in
the base metal.
A1A2
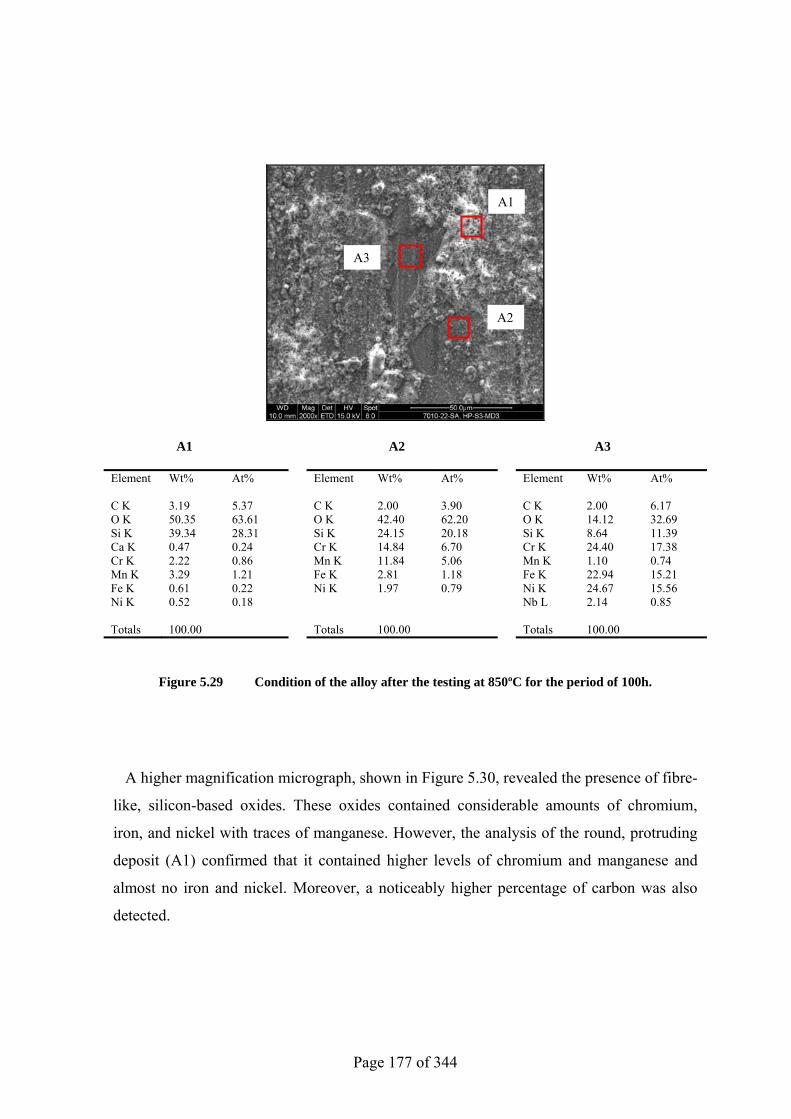
Page 177 of 344
A1 A2 A3
Element Wt% At% Element Wt% At% Element Wt% At% C K 3.19 5.37 C K 2.00 3.90 C K 2.00 6.17 O K 50.35 63.61 O K 42.40 62.20 O K 14.12 32.69 Si K 39.34 28.31 Si K 24.15 20.18 Si K 8.64 11.39 Ca K 0.47 0.24 Cr K 14.84 6.70 Cr K 24.40 17.38 Cr K 2.22 0.86 Mn K 11.84 5.06 Mn K 1.10 0.74 Mn K 3.29 1.21 Fe K 2.81 1.18 Fe K 22.94 15.21 Fe K 0.61 0.22 Ni K 1.97 0.79 Ni K 24.67 15.56 Ni K 0.52 0.18 Nb L 2.14 0.85 Totals 100.00 Totals 100.00 Totals 100.00
Figure 5.29 Condition of the alloy after the testing at 850ºC for the period of 100h.
A higher magnification micrograph, shown in Figure 5.30, revealed the presence of fibre-
like, silicon-based oxides. These oxides contained considerable amounts of chromium,
iron, and nickel with traces of manganese. However, the analysis of the round, protruding
deposit (A1) confirmed that it contained higher levels of chromium and manganese and
almost no iron and nickel. Moreover, a noticeably higher percentage of carbon was also
detected.
A1
A2
A3
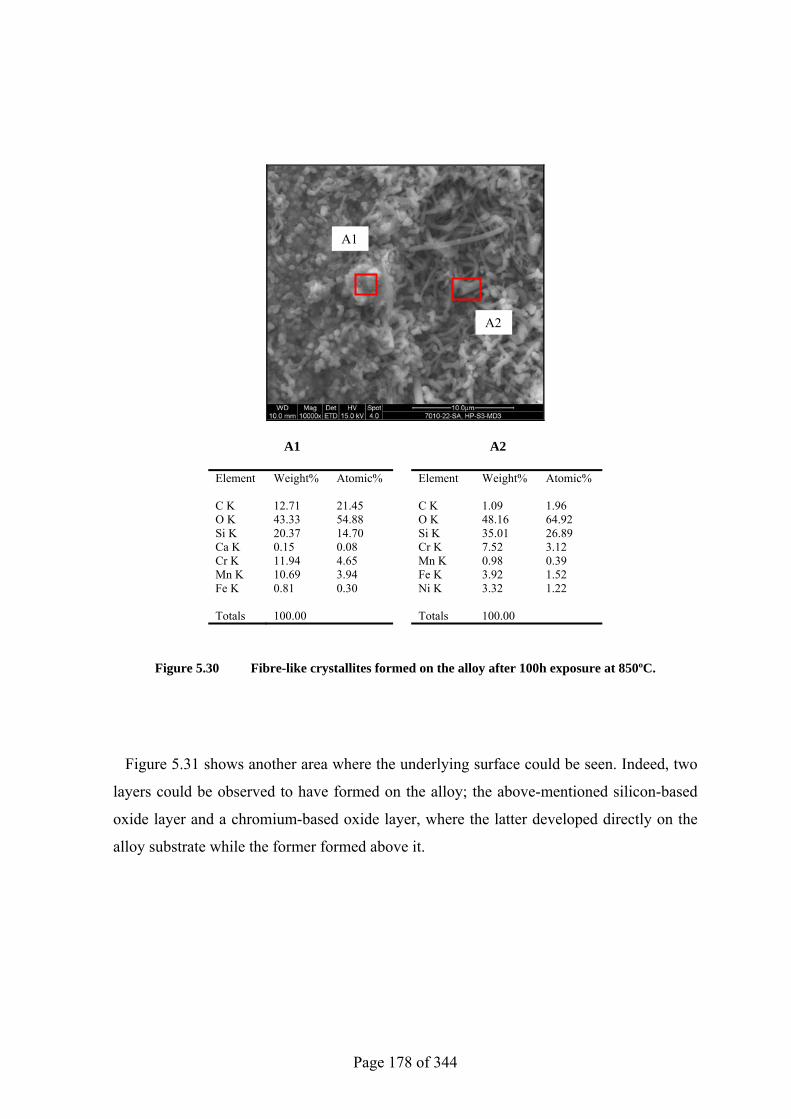
Page 178 of 344
A1 A2
Element Weight% Atomic% Element Weight% Atomic% C K 12.71 21.45 C K 1.09 1.96 O K 43.33 54.88 O K 48.16 64.92 Si K 20.37 14.70 Si K 35.01 26.89 Ca K 0.15 0.08 Cr K 7.52 3.12 Cr K 11.94 4.65 Mn K 0.98 0.39 Mn K 10.69 3.94 Fe K 3.92 1.52 Fe K 0.81 0.30 Ni K 3.32 1.22 Totals 100.00 Totals 100.00
Figure 5.30 Fibre-like crystallites formed on the alloy after 100h exposure at 850ºC.
Figure 5.31 shows another area where the underlying surface could be seen. Indeed, two
layers could be observed to have formed on the alloy; the above-mentioned silicon-based
oxide layer and a chromium-based oxide layer, where the latter developed directly on the
alloy substrate while the former formed above it.
A1
A2
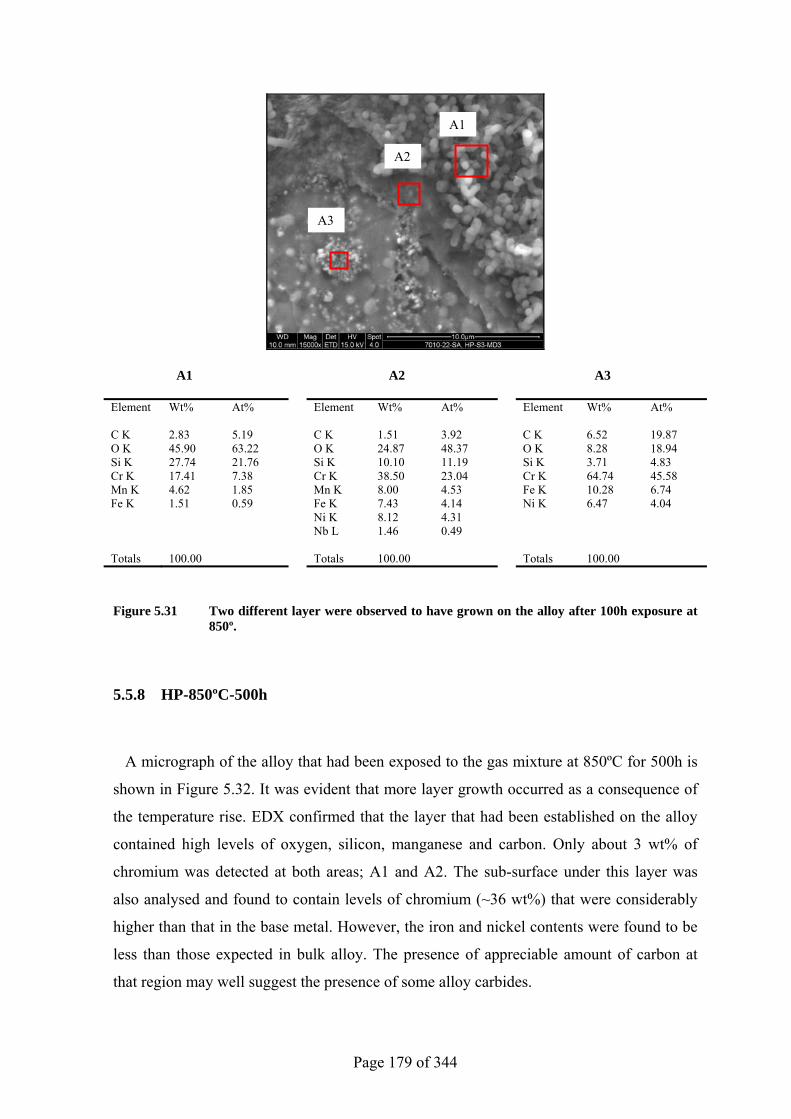
Page 179 of 344
A1 A2 A3
Element Wt% At% Element Wt% At% Element Wt% At% C K 2.83 5.19 C K 1.51 3.92 C K 6.52 19.87 O K 45.90 63.22 O K 24.87 48.37 O K 8.28 18.94 Si K 27.74 21.76 Si K 10.10 11.19 Si K 3.71 4.83 Cr K 17.41 7.38 Cr K 38.50 23.04 Cr K 64.74 45.58 Mn K 4.62 1.85 Mn K 8.00 4.53 Fe K 10.28 6.74 Fe K 1.51 0.59 Fe K 7.43 4.14 Ni K 6.47 4.04 Ni K 8.12 4.31 Nb L 1.46 0.49 Totals 100.00 Totals 100.00 Totals 100.00
Figure 5.31 Two different layer were observed to have grown on the alloy after 100h exposure at 850º.
5.5.8 HP-850ºC-500h
A micrograph of the alloy that had been exposed to the gas mixture at 850ºC for 500h is
shown in Figure 5.32. It was evident that more layer growth occurred as a consequence of
the temperature rise. EDX confirmed that the layer that had been established on the alloy
contained high levels of oxygen, silicon, manganese and carbon. Only about 3 wt% of
chromium was detected at both areas; A1 and A2. The sub-surface under this layer was
also analysed and found to contain levels of chromium (~36 wt%) that were considerably
higher than that in the base metal. However, the iron and nickel contents were found to be
less than those expected in bulk alloy. The presence of appreciable amount of carbon at
that region may well suggest the presence of some alloy carbides.
A1
A2
A3
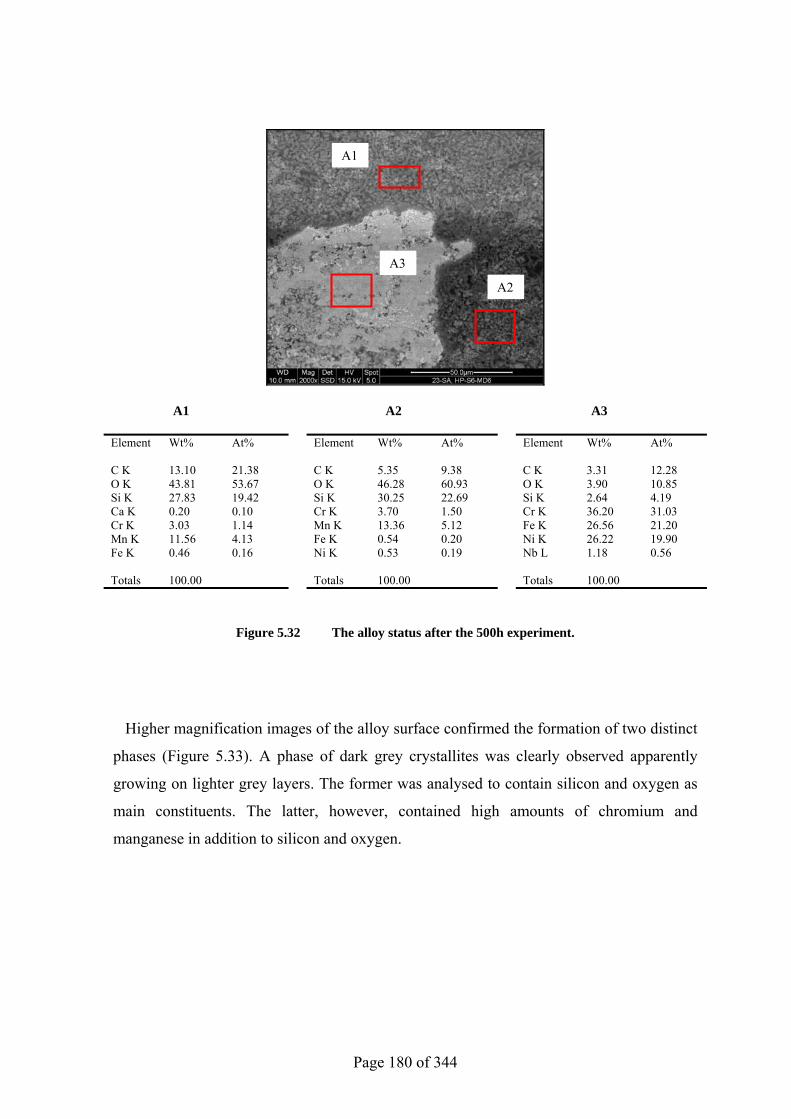
Page 180 of 344
A1 A2 A3
Element Wt% At% Element Wt% At% Element Wt% At% C K 13.10 21.38 C K 5.35 9.38 C K 3.31 12.28 O K 43.81 53.67 O K 46.28 60.93 O K 3.90 10.85 Si K 27.83 19.42 Si K 30.25 22.69 Si K 2.64 4.19 Ca K 0.20 0.10 Cr K 3.70 1.50 Cr K 36.20 31.03 Cr K 3.03 1.14 Mn K 13.36 5.12 Fe K 26.56 21.20 Mn K 11.56 4.13 Fe K 0.54 0.20 Ni K 26.22 19.90 Fe K 0.46 0.16 Ni K 0.53 0.19 Nb L 1.18 0.56 Totals 100.00 Totals 100.00 Totals 100.00
Figure 5.32 The alloy status after the 500h experiment.
Higher magnification images of the alloy surface confirmed the formation of two distinct
phases (Figure 5.33). A phase of dark grey crystallites was clearly observed apparently
growing on lighter grey layers. The former was analysed to contain silicon and oxygen as
main constituents. The latter, however, contained high amounts of chromium and
manganese in addition to silicon and oxygen.
A1
A2
A3
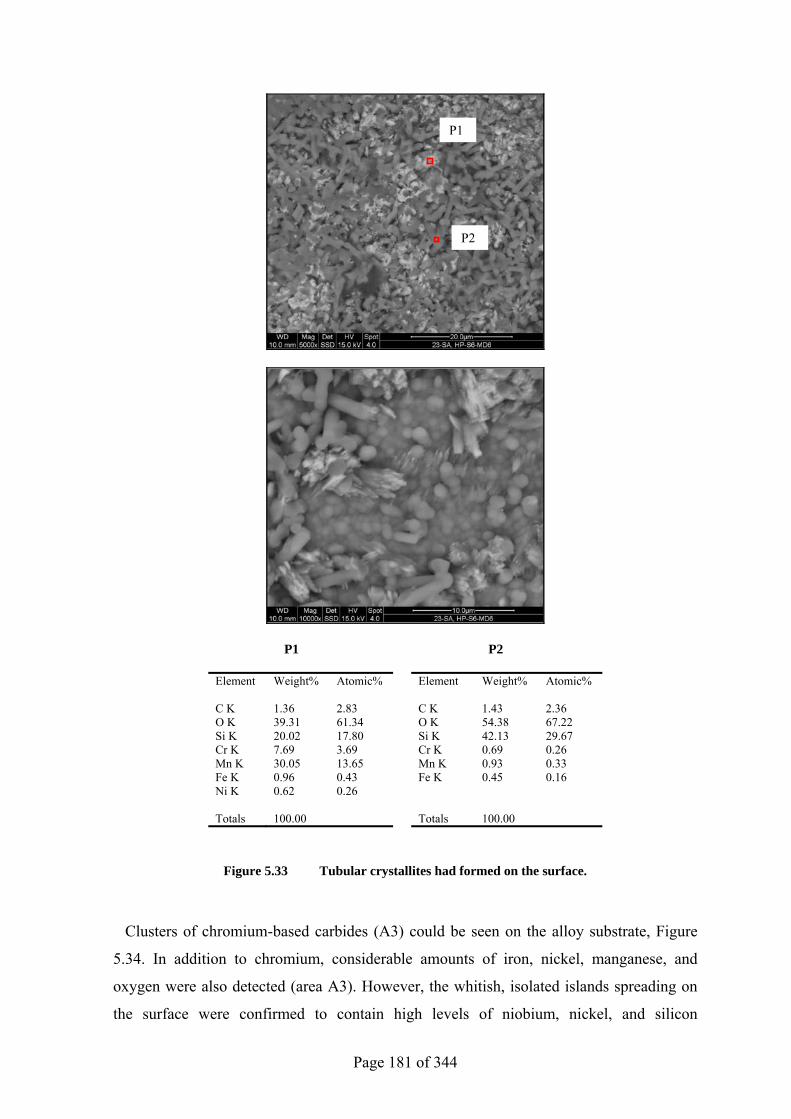
Page 181 of 344
P1 P2
Element Weight% Atomic% Element Weight% Atomic% C K 1.36 2.83 C K 1.43 2.36 O K 39.31 61.34 O K 54.38 67.22 Si K 20.02 17.80 Si K 42.13 29.67 Cr K 7.69 3.69 Cr K 0.69 0.26 Mn K 30.05 13.65 Mn K 0.93 0.33 Fe K 0.96 0.43 Fe K 0.45 0.16 Ni K 0.62 0.26 Totals 100.00 Totals 100.00
Figure 5.33 Tubular crystallites had formed on the surface.
Clusters of chromium-based carbides (A3) could be seen on the alloy substrate, Figure
5.34. In addition to chromium, considerable amounts of iron, nickel, manganese, and
oxygen were also detected (area A3). However, the whitish, isolated islands spreading on
the surface were confirmed to contain high levels of niobium, nickel, and silicon
P1
P2
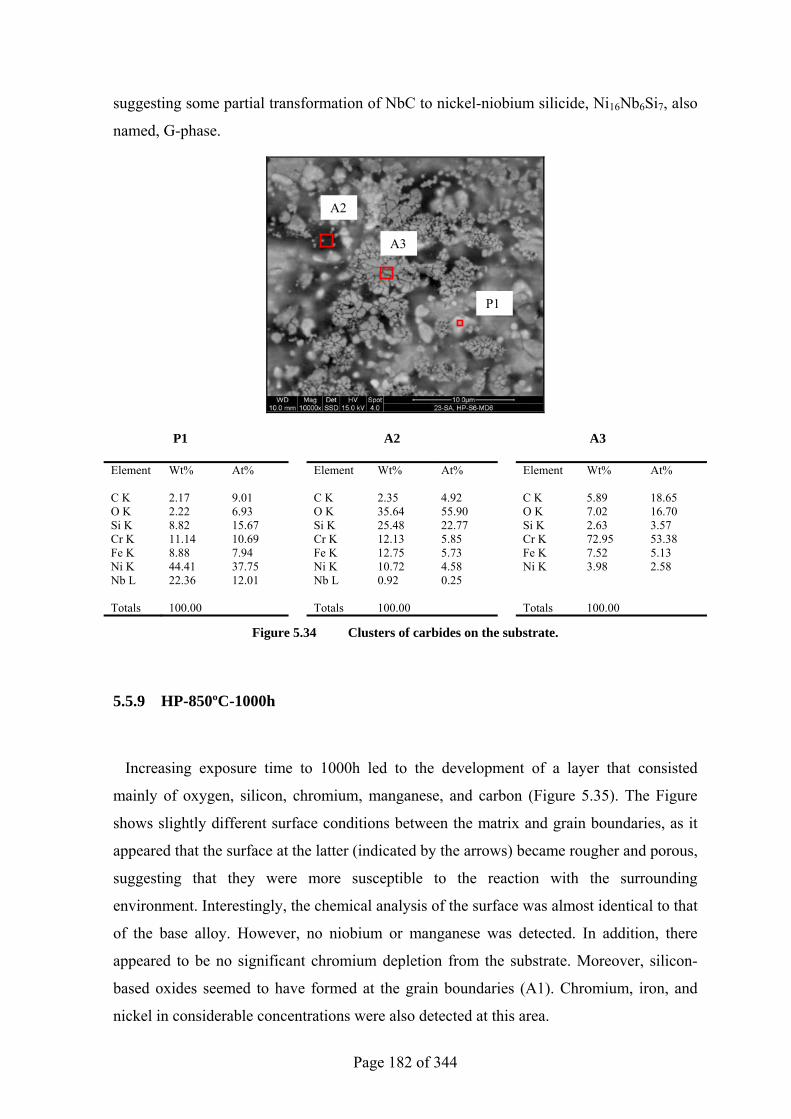
Page 182 of 344
suggesting some partial transformation of NbC to nickel-niobium silicide, Ni16Nb6Si7, also
named, G-phase.
P1 A2 A3
Element Wt% At% Element Wt% At% Element Wt% At% C K 2.17 9.01 C K 2.35 4.92 C K 5.89 18.65 O K 2.22 6.93 O K 35.64 55.90 O K 7.02 16.70 Si K 8.82 15.67 Si K 25.48 22.77 Si K 2.63 3.57 Cr K 11.14 10.69 Cr K 12.13 5.85 Cr K 72.95 53.38 Fe K 8.88 7.94 Fe K 12.75 5.73 Fe K 7.52 5.13 Ni K 44.41 37.75 Ni K 10.72 4.58 Ni K 3.98 2.58 Nb L 22.36 12.01 Nb L 0.92 0.25 Totals 100.00 Totals 100.00 Totals 100.00
Figure 5.34 Clusters of carbides on the substrate.
5.5.9 HP-850ºC-1000h
Increasing exposure time to 1000h led to the development of a layer that consisted
mainly of oxygen, silicon, chromium, manganese, and carbon (Figure 5.35). The Figure
shows slightly different surface conditions between the matrix and grain boundaries, as it
appeared that the surface at the latter (indicated by the arrows) became rougher and porous,
suggesting that they were more susceptible to the reaction with the surrounding
environment. Interestingly, the chemical analysis of the surface was almost identical to that
of the base alloy. However, no niobium or manganese was detected. In addition, there
appeared to be no significant chromium depletion from the substrate. Moreover, silicon-
based oxides seemed to have formed at the grain boundaries (A1). Chromium, iron, and
nickel in considerable concentrations were also detected at this area.
P1
A2
A3
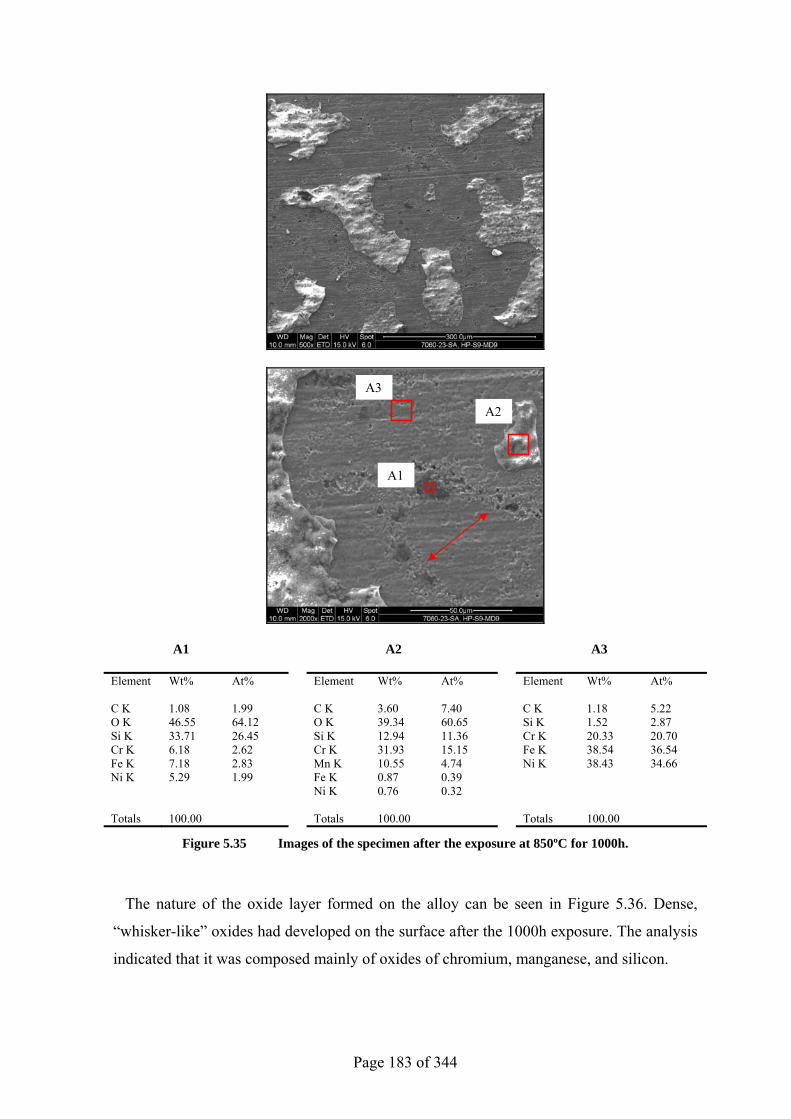
Page 183 of 344
A1 A2 A3
Element Wt% At% Element Wt% At% Element Wt% At% C K 1.08 1.99 C K 3.60 7.40 C K 1.18 5.22 O K 46.55 64.12 O K 39.34 60.65 Si K 1.52 2.87 Si K 33.71 26.45 Si K 12.94 11.36 Cr K 20.33 20.70 Cr K 6.18 2.62 Cr K 31.93 15.15 Fe K 38.54 36.54 Fe K 7.18 2.83 Mn K 10.55 4.74 Ni K 38.43 34.66 Ni K 5.29 1.99 Fe K 0.87 0.39 Ni K 0.76 0.32 Totals 100.00 Totals 100.00 Totals 100.00
Figure 5.35 Images of the specimen after the exposure at 850ºC for 1000h.
The nature of the oxide layer formed on the alloy can be seen in Figure 5.36. Dense,
“whisker-like” oxides had developed on the surface after the 1000h exposure. The analysis
indicated that it was composed mainly of oxides of chromium, manganese, and silicon.
A1
A2
A3
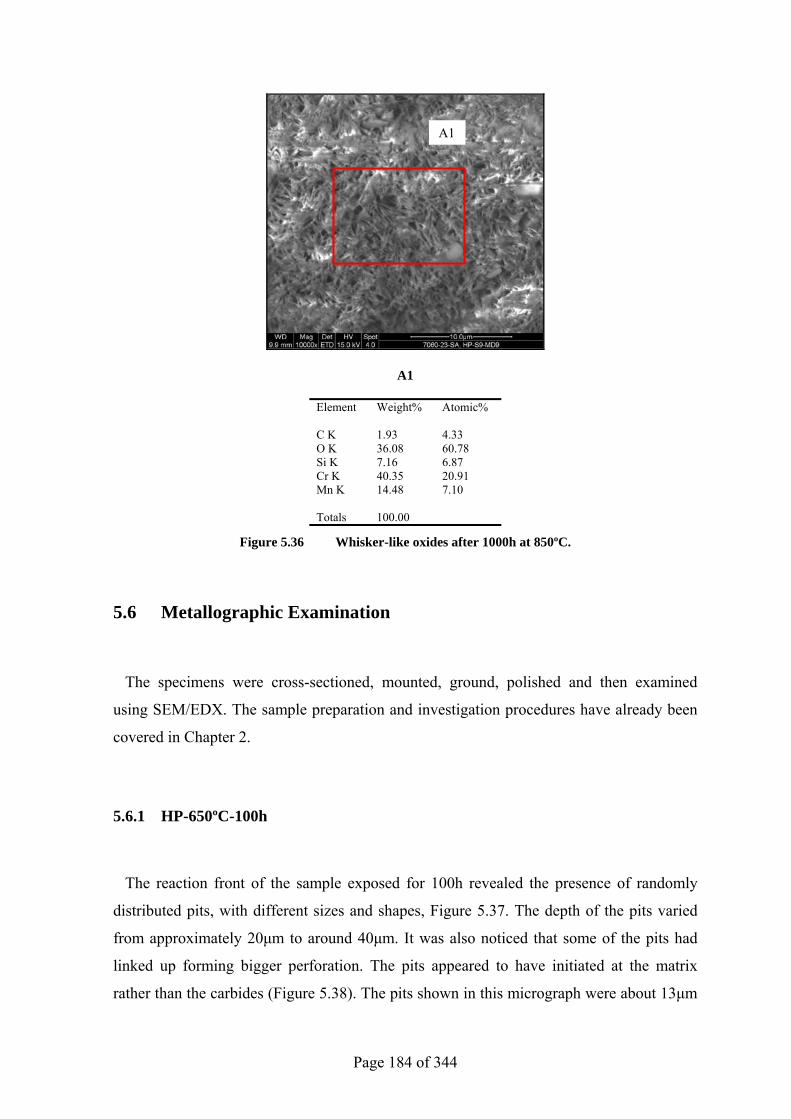
Page 184 of 344
A1
Element Weight% Atomic% C K 1.93 4.33 O K 36.08 60.78 Si K 7.16 6.87 Cr K 40.35 20.91 Mn K 14.48 7.10 Totals 100.00
Figure 5.36 Whisker-like oxides after 1000h at 850ºC.
5.6 Metallographic Examination
The specimens were cross-sectioned, mounted, ground, polished and then examined
using SEM/EDX. The sample preparation and investigation procedures have already been
covered in Chapter 2.
5.6.1 HP-650ºC-100h
The reaction front of the sample exposed for 100h revealed the presence of randomly
distributed pits, with different sizes and shapes, Figure 5.37. The depth of the pits varied
from approximately 20µm to around 40µm. It was also noticed that some of the pits had
linked up forming bigger perforation. The pits appeared to have initiated at the matrix
rather than the carbides (Figure 5.38). The pits shown in this micrograph were about 13µm
A1
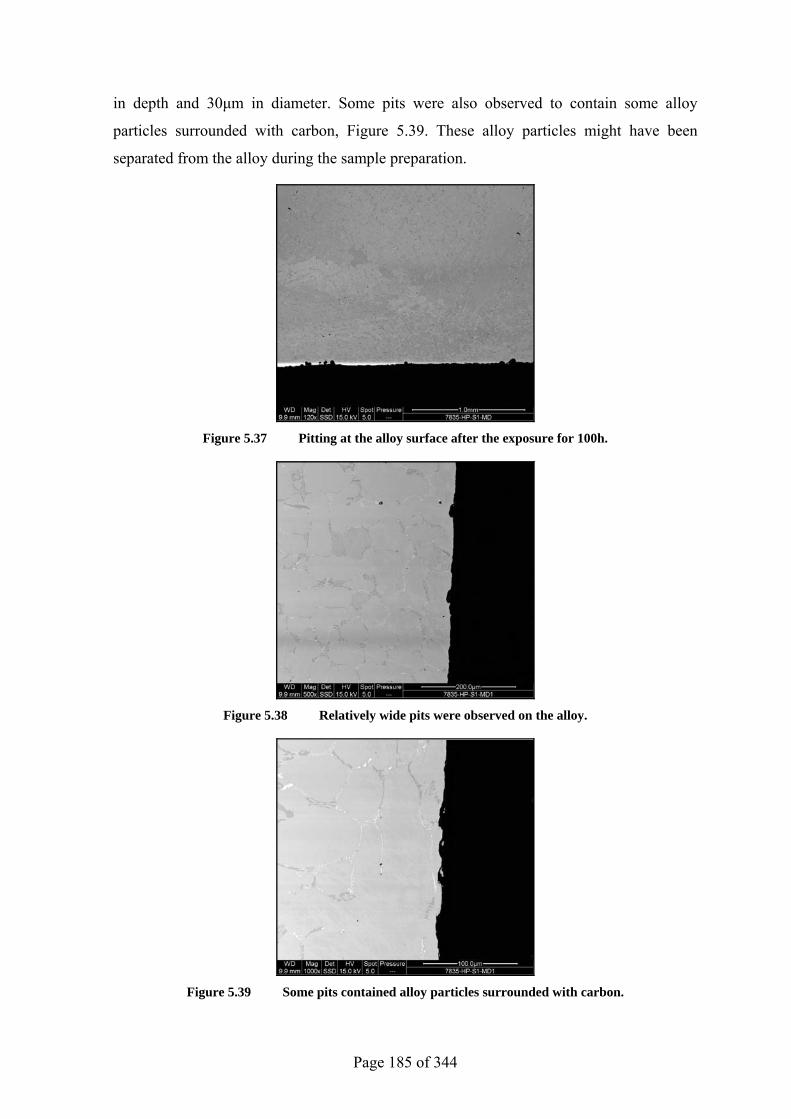
Page 185 of 344
in depth and 30µm in diameter. Some pits were also observed to contain some alloy
particles surrounded with carbon, Figure 5.39. These alloy particles might have been
separated from the alloy during the sample preparation.
Figure 5.37 Pitting at the alloy surface after the exposure for 100h.
Figure 5.38 Relatively wide pits were observed on the alloy.
Figure 5.39 Some pits contained alloy particles surrounded with carbon.
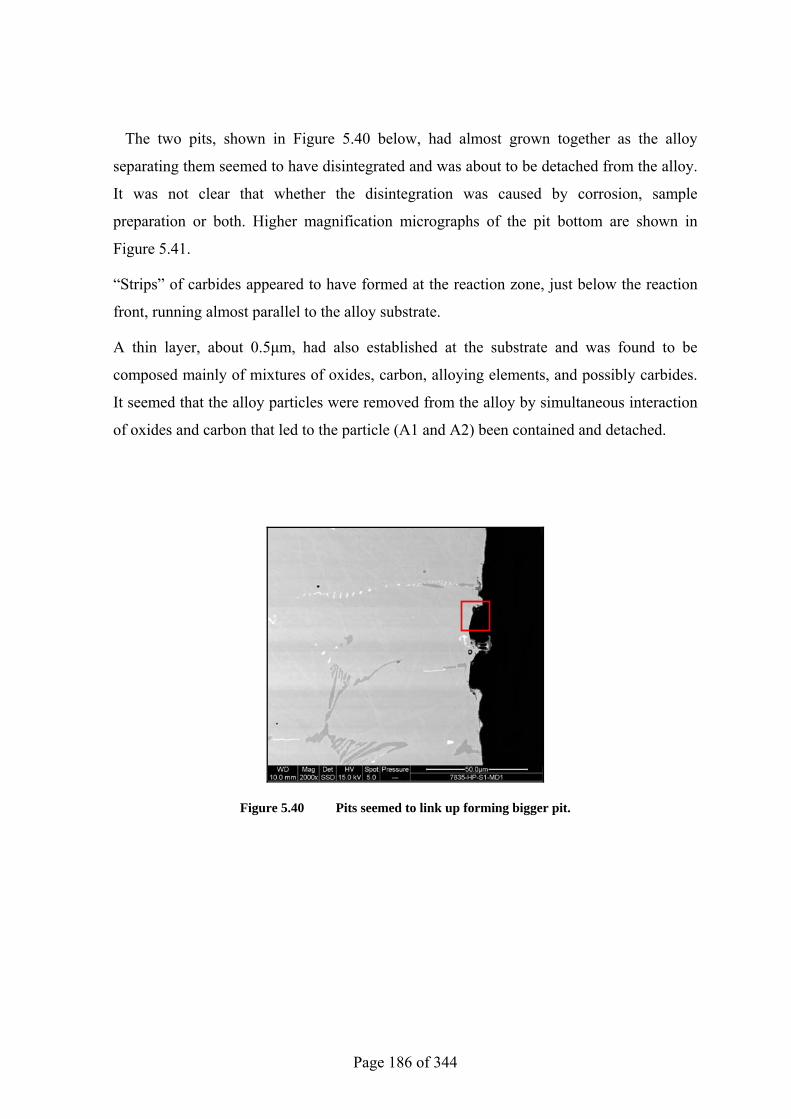
Page 186 of 344
The two pits, shown in Figure 5.40 below, had almost grown together as the alloy
separating them seemed to have disintegrated and was about to be detached from the alloy.
It was not clear that whether the disintegration was caused by corrosion, sample
preparation or both. Higher magnification micrographs of the pit bottom are shown in
Figure 5.41.
“Strips” of carbides appeared to have formed at the reaction zone, just below the reaction
front, running almost parallel to the alloy substrate.
A thin layer, about 0.5µm, had also established at the substrate and was found to be
composed mainly of mixtures of oxides, carbon, alloying elements, and possibly carbides.
It seemed that the alloy particles were removed from the alloy by simultaneous interaction
of oxides and carbon that led to the particle (A1 and A2) been contained and detached.
Figure 5.40 Pits seemed to link up forming bigger pit.
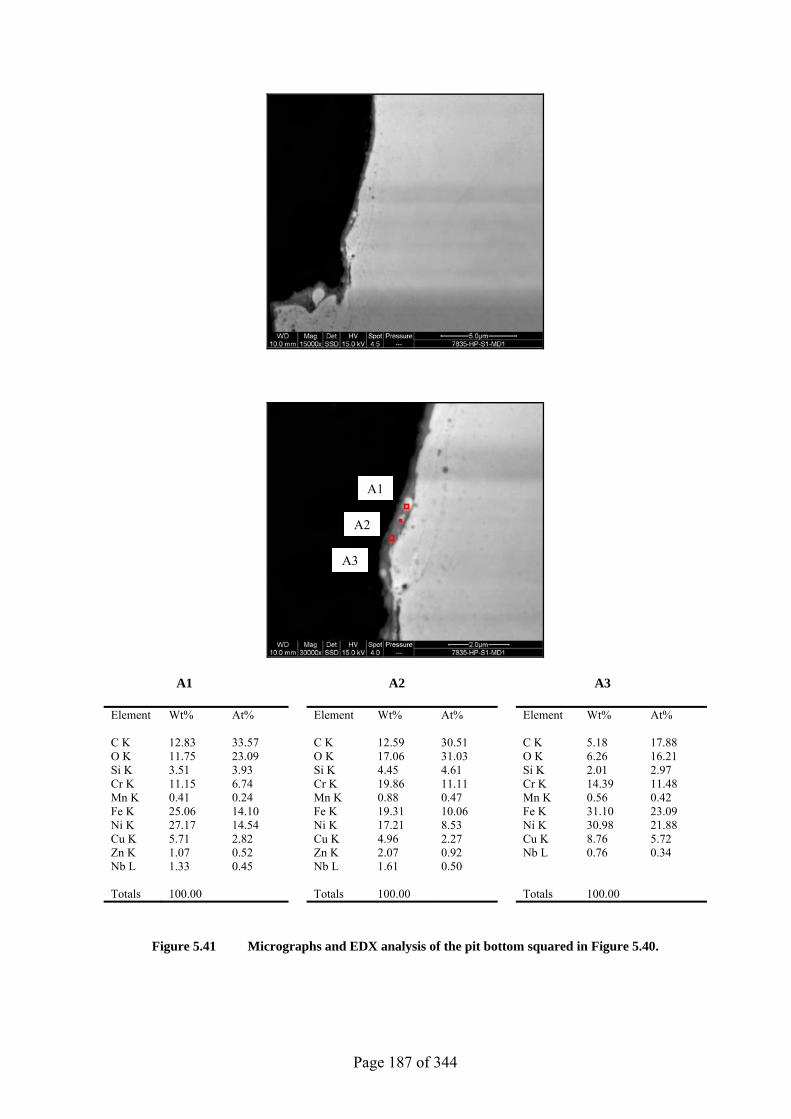
Page 187 of 344
A1 A2 A3
Element Wt% At% Element Wt% At% Element Wt% At% C K 12.83 33.57 C K 12.59 30.51 C K 5.18 17.88 O K 11.75 23.09 O K 17.06 31.03 O K 6.26 16.21 Si K 3.51 3.93 Si K 4.45 4.61 Si K 2.01 2.97 Cr K 11.15 6.74 Cr K 19.86 11.11 Cr K 14.39 11.48 Mn K 0.41 0.24 Mn K 0.88 0.47 Mn K 0.56 0.42 Fe K 25.06 14.10 Fe K 19.31 10.06 Fe K 31.10 23.09 Ni K 27.17 14.54 Ni K 17.21 8.53 Ni K 30.98 21.88 Cu K 5.71 2.82 Cu K 4.96 2.27 Cu K 8.76 5.72 Zn K 1.07 0.52 Zn K 2.07 0.92 Nb L 0.76 0.34 Nb L 1.33 0.45 Nb L 1.61 0.50 Totals 100.00 Totals 100.00 Totals 100.00
Figure 5.41 Micrographs and EDX analysis of the pit bottom squared in Figure 5.40.
A1
A2
A3
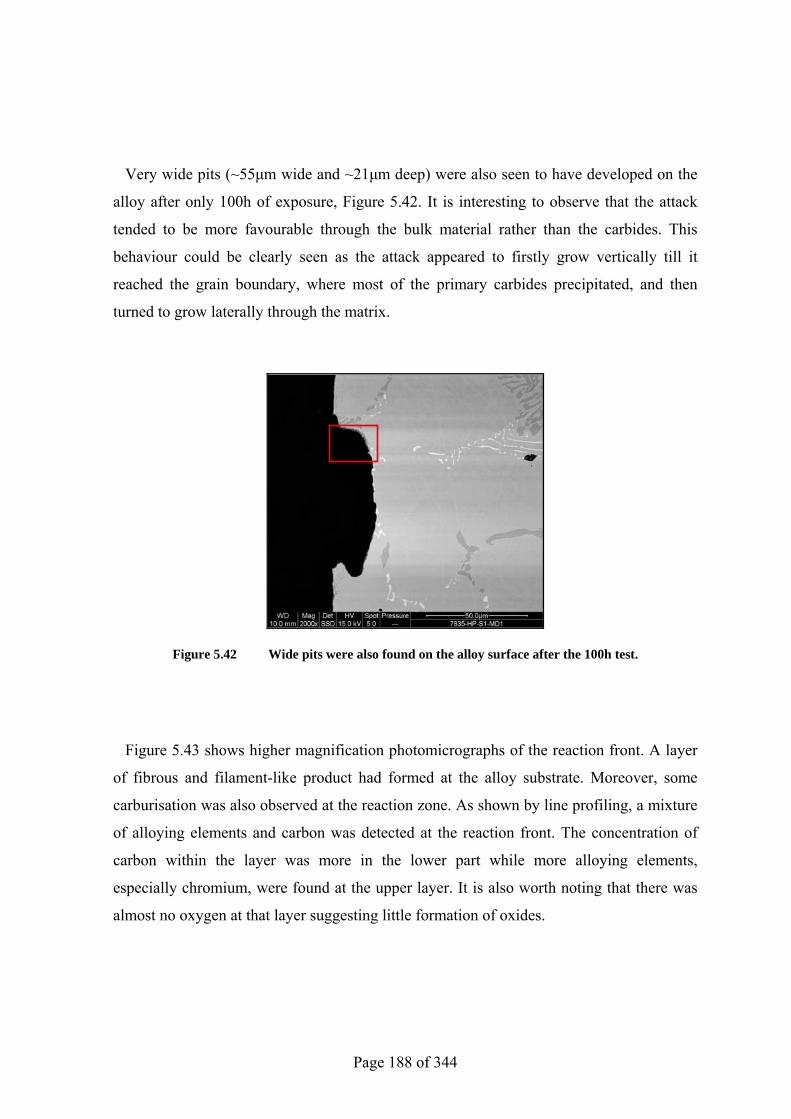
Page 188 of 344
Very wide pits (~55µm wide and ~21µm deep) were also seen to have developed on the
alloy after only 100h of exposure, Figure 5.42. It is interesting to observe that the attack
tended to be more favourable through the bulk material rather than the carbides. This
behaviour could be clearly seen as the attack appeared to firstly grow vertically till it
reached the grain boundary, where most of the primary carbides precipitated, and then
turned to grow laterally through the matrix.
Figure 5.42 Wide pits were also found on the alloy surface after the 100h test.
Figure 5.43 shows higher magnification photomicrographs of the reaction front. A layer
of fibrous and filament-like product had formed at the alloy substrate. Moreover, some
carburisation was also observed at the reaction zone. As shown by line profiling, a mixture
of alloying elements and carbon was detected at the reaction front. The concentration of
carbon within the layer was more in the lower part while more alloying elements,
especially chromium, were found at the upper layer. It is also worth noting that there was
almost no oxygen at that layer suggesting little formation of oxides.

Page 189 of 344
Figure 5.43 A layer of fibrous and filament-like product had formed at the reaction front.
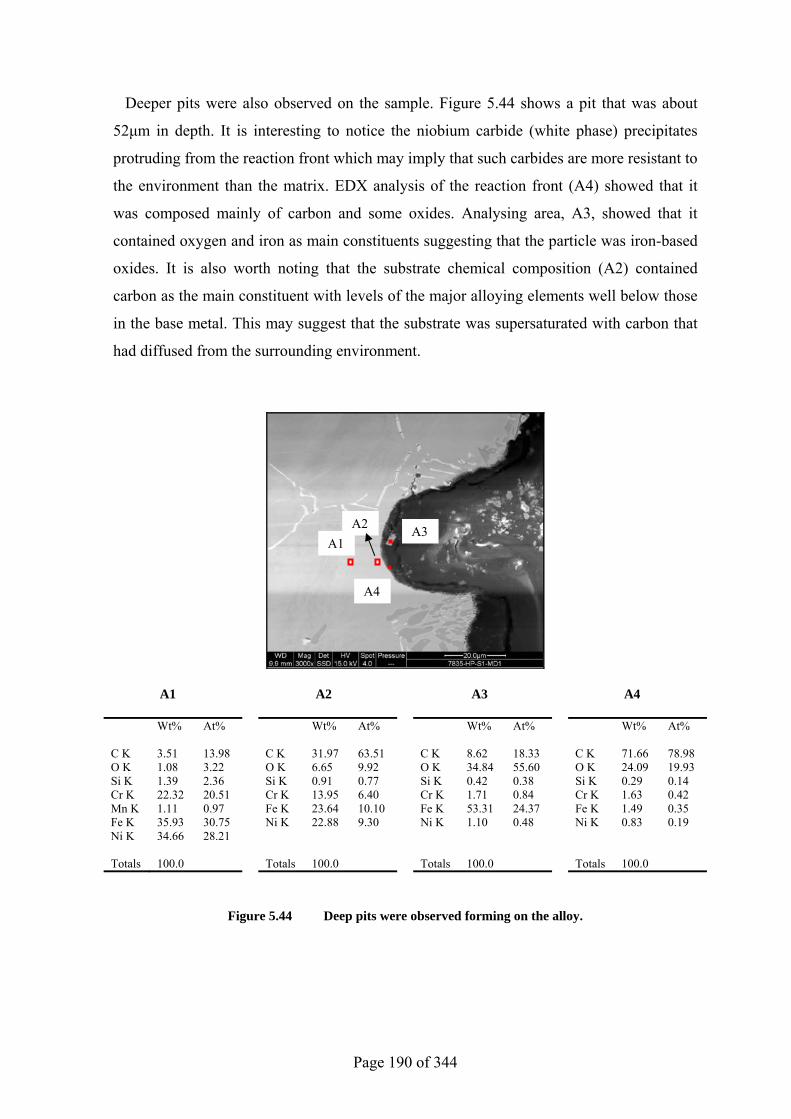
Page 190 of 344
Deeper pits were also observed on the sample. Figure 5.44 shows a pit that was about
52µm in depth. It is interesting to notice the niobium carbide (white phase) precipitates
protruding from the reaction front which may imply that such carbides are more resistant to
the environment than the matrix. EDX analysis of the reaction front (A4) showed that it
was composed mainly of carbon and some oxides. Analysing area, A3, showed that it
contained oxygen and iron as main constituents suggesting that the particle was iron-based
oxides. It is also worth noting that the substrate chemical composition (A2) contained
carbon as the main constituent with levels of the major alloying elements well below those
in the base metal. This may suggest that the substrate was supersaturated with carbon that
had diffused from the surrounding environment.
A1 A2 A3 A4
Wt% At% Wt% At% Wt% At% Wt% At% C K 3.51 13.98 C K 31.97 63.51 C K 8.62 18.33 C K 71.66 78.98 O K 1.08 3.22 O K 6.65 9.92 O K 34.84 55.60 O K 24.09 19.93 Si K 1.39 2.36 Si K 0.91 0.77 Si K 0.42 0.38 Si K 0.29 0.14 Cr K 22.32 20.51 Cr K 13.95 6.40 Cr K 1.71 0.84 Cr K 1.63 0.42 Mn K 1.11 0.97 Fe K 23.64 10.10 Fe K 53.31 24.37 Fe K 1.49 0.35 Fe K 35.93 30.75 Ni K 22.88 9.30 Ni K 1.10 0.48 Ni K 0.83 0.19 Ni K 34.66 28.21 Totals 100.0 Totals 100.0 Totals 100.0 Totals 100.0
Figure 5.44 Deep pits were observed forming on the alloy.
A1A2 A3
A4
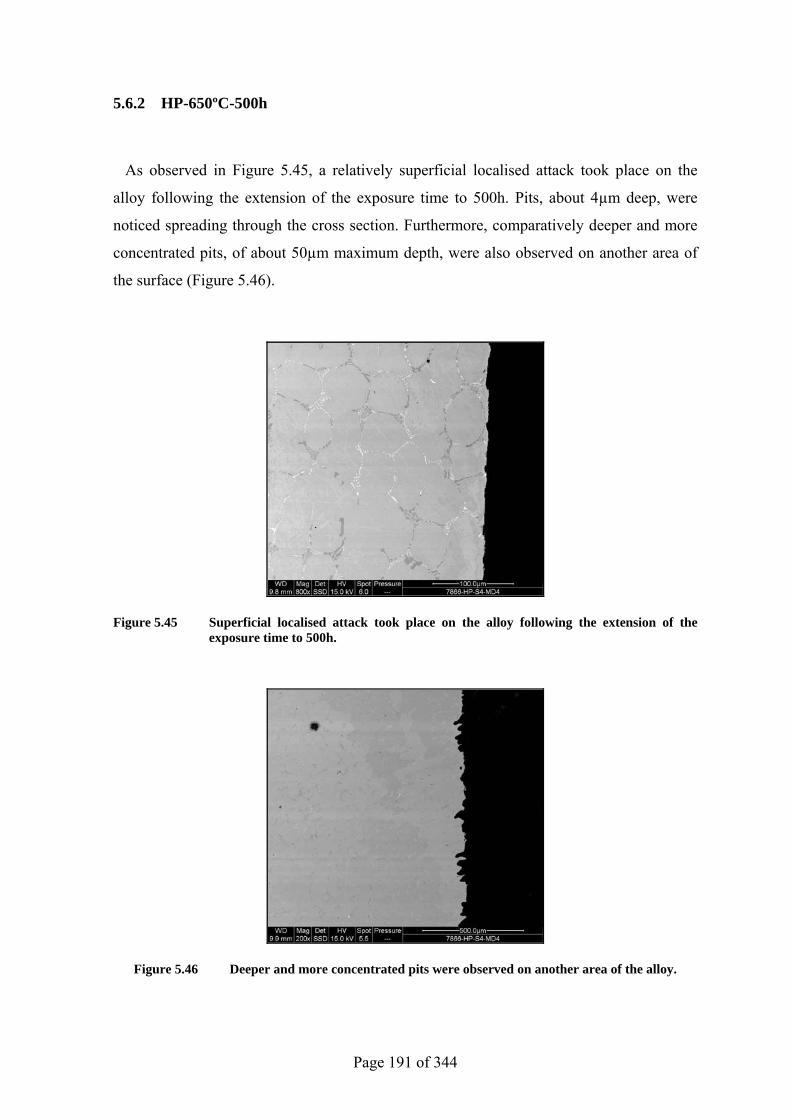
Page 191 of 344
5.6.2 HP-650ºC-500h
As observed in Figure 5.45, a relatively superficial localised attack took place on the
alloy following the extension of the exposure time to 500h. Pits, about 4µm deep, were
noticed spreading through the cross section. Furthermore, comparatively deeper and more
concentrated pits, of about 50µm maximum depth, were also observed on another area of
the surface (Figure 5.46).
Figure 5.45 Superficial localised attack took place on the alloy following the extension of the exposure time to 500h.
Figure 5.46 Deeper and more concentrated pits were observed on another area of the alloy.
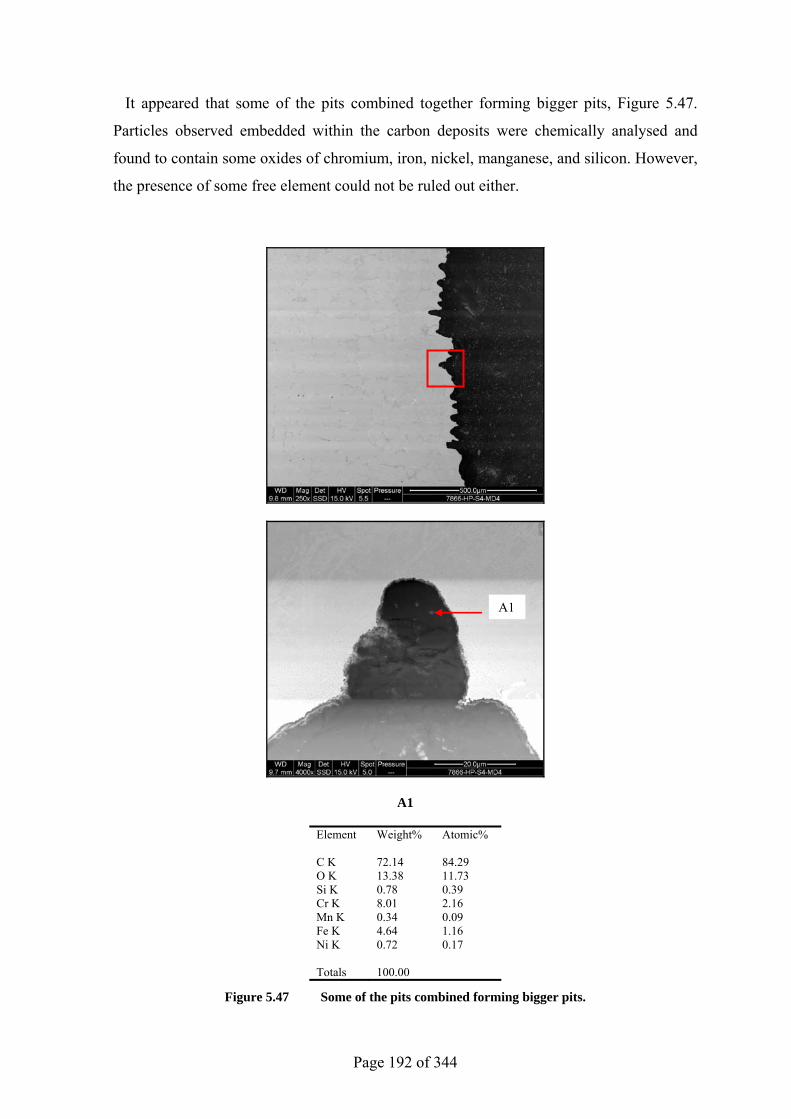
Page 192 of 344
It appeared that some of the pits combined together forming bigger pits, Figure 5.47.
Particles observed embedded within the carbon deposits were chemically analysed and
found to contain some oxides of chromium, iron, nickel, manganese, and silicon. However,
the presence of some free element could not be ruled out either.
A1
Element Weight% Atomic% C K 72.14 84.29 O K 13.38 11.73 Si K 0.78 0.39 Cr K 8.01 2.16 Mn K 0.34 0.09 Fe K 4.64 1.16 Ni K 0.72 0.17 Totals 100.00
Figure 5.47 Some of the pits combined forming bigger pits.
A1
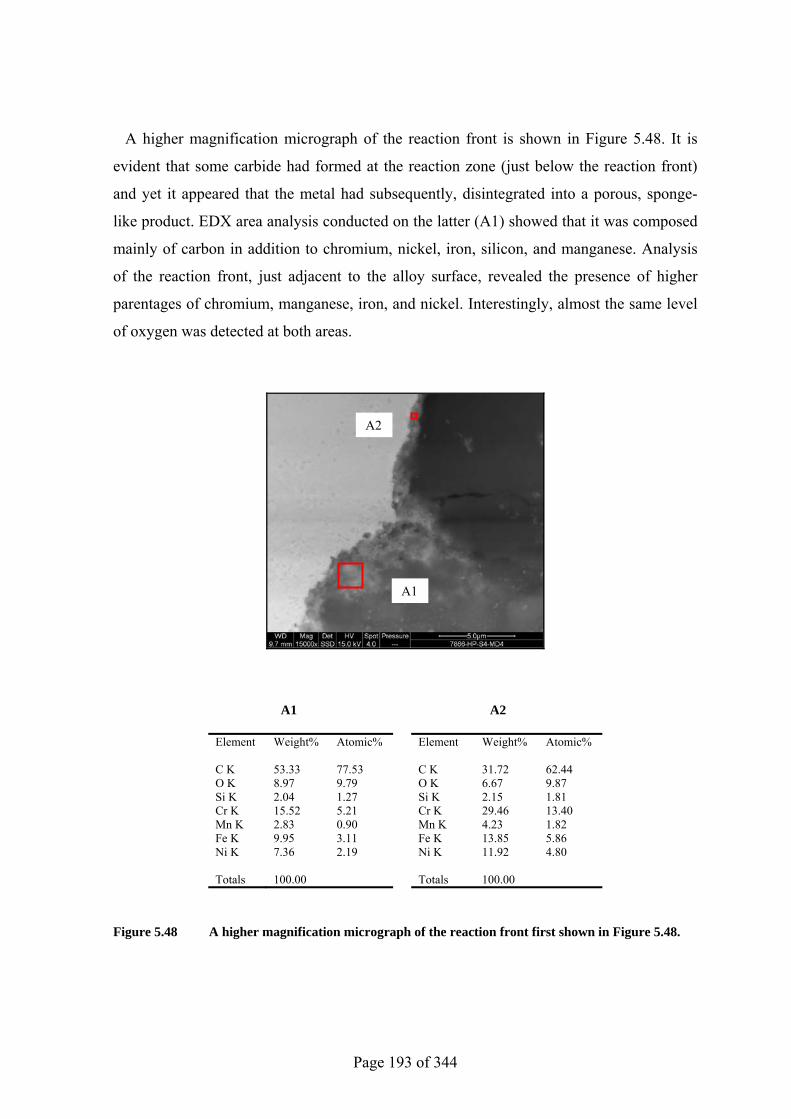
Page 193 of 344
A higher magnification micrograph of the reaction front is shown in Figure 5.48. It is
evident that some carbide had formed at the reaction zone (just below the reaction front)
and yet it appeared that the metal had subsequently, disintegrated into a porous, sponge-
like product. EDX area analysis conducted on the latter (A1) showed that it was composed
mainly of carbon in addition to chromium, nickel, iron, silicon, and manganese. Analysis
of the reaction front, just adjacent to the alloy surface, revealed the presence of higher
parentages of chromium, manganese, iron, and nickel. Interestingly, almost the same level
of oxygen was detected at both areas.
A1 A2
Element Weight% Atomic% Element Weight% Atomic% C K 53.33 77.53 C K 31.72 62.44 O K 8.97 9.79 O K 6.67 9.87 Si K 2.04 1.27 Si K 2.15 1.81 Cr K 15.52 5.21 Cr K 29.46 13.40 Mn K 2.83 0.90 Mn K 4.23 1.82 Fe K 9.95 3.11 Fe K 13.85 5.86 Ni K 7.36 2.19 Ni K 11.92 4.80 Totals 100.00 Totals 100.00
Figure 5.48 A higher magnification micrograph of the reaction front first shown in Figure 5.48.
A1
A2
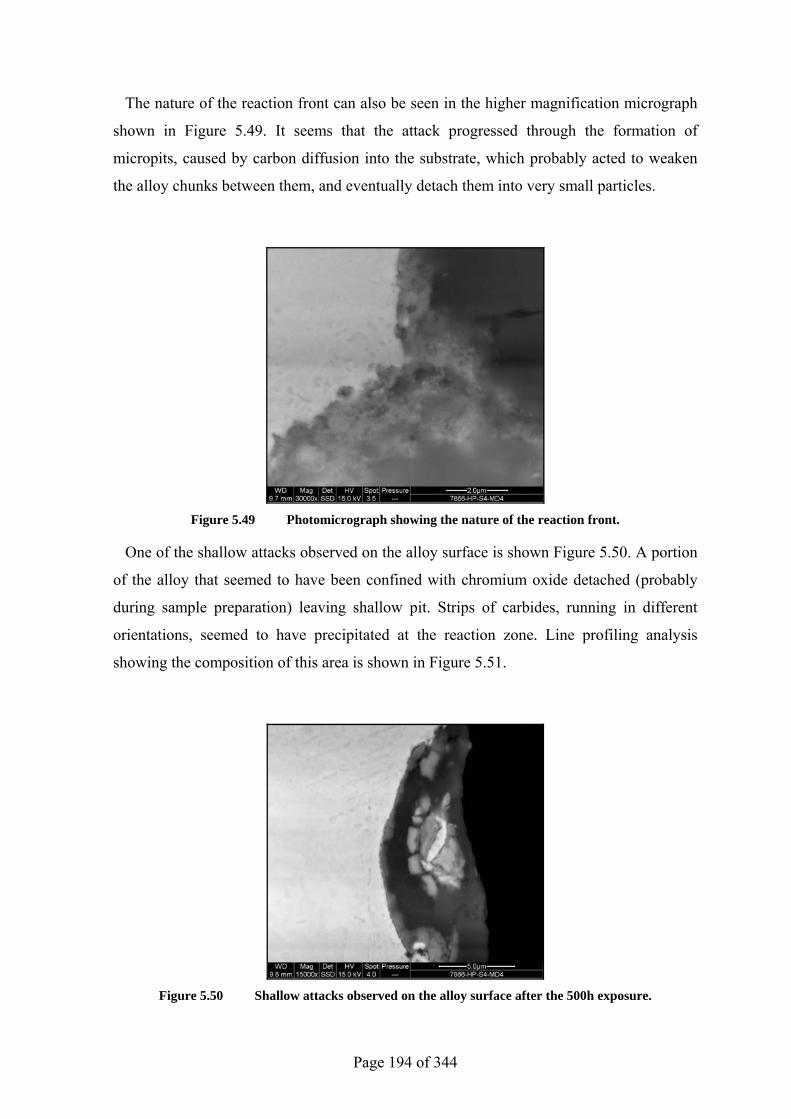
Page 194 of 344
The nature of the reaction front can also be seen in the higher magnification micrograph
shown in Figure 5.49. It seems that the attack progressed through the formation of
micropits, caused by carbon diffusion into the substrate, which probably acted to weaken
the alloy chunks between them, and eventually detach them into very small particles.
Figure 5.49 Photomicrograph showing the nature of the reaction front.
One of the shallow attacks observed on the alloy surface is shown Figure 5.50. A portion
of the alloy that seemed to have been confined with chromium oxide detached (probably
during sample preparation) leaving shallow pit. Strips of carbides, running in different
orientations, seemed to have precipitated at the reaction zone. Line profiling analysis
showing the composition of this area is shown in Figure 5.51.
Figure 5.50 Shallow attacks observed on the alloy surface after the 500h exposure.
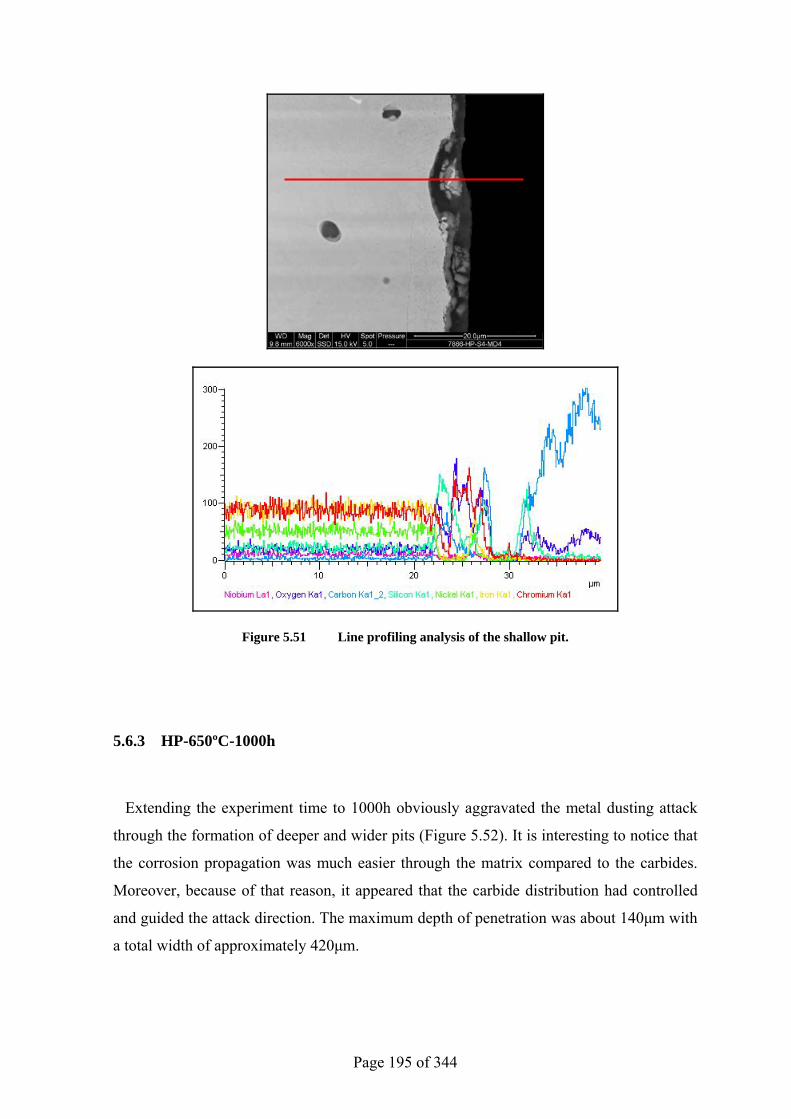
Page 195 of 344
Figure 5.51 Line profiling analysis of the shallow pit.
5.6.3 HP-650ºC-1000h
Extending the experiment time to 1000h obviously aggravated the metal dusting attack
through the formation of deeper and wider pits (Figure 5.52). It is interesting to notice that
the corrosion propagation was much easier through the matrix compared to the carbides.
Moreover, because of that reason, it appeared that the carbide distribution had controlled
and guided the attack direction. The maximum depth of penetration was about 140µm with
a total width of approximately 420µm.
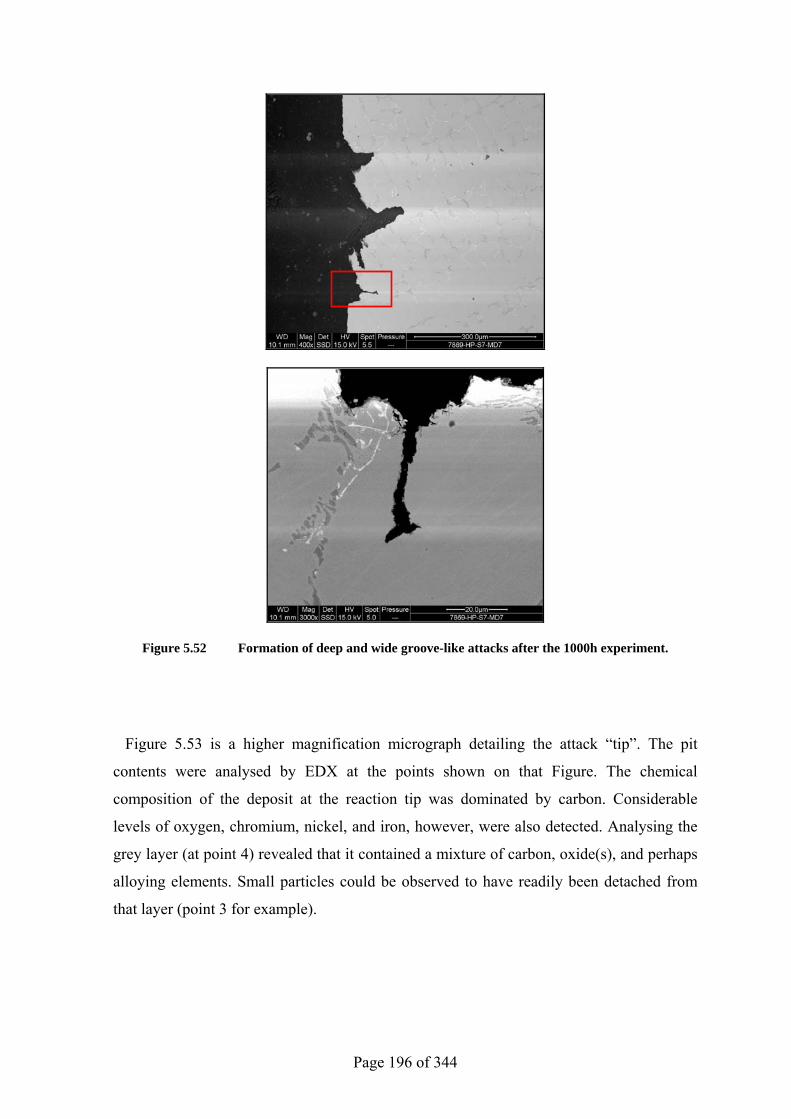
Page 196 of 344
Figure 5.52 Formation of deep and wide groove-like attacks after the 1000h experiment.
Figure 5.53 is a higher magnification micrograph detailing the attack “tip”. The pit
contents were analysed by EDX at the points shown on that Figure. The chemical
composition of the deposit at the reaction tip was dominated by carbon. Considerable
levels of oxygen, chromium, nickel, and iron, however, were also detected. Analysing the
grey layer (at point 4) revealed that it contained a mixture of carbon, oxide(s), and perhaps
alloying elements. Small particles could be observed to have readily been detached from
that layer (point 3 for example).
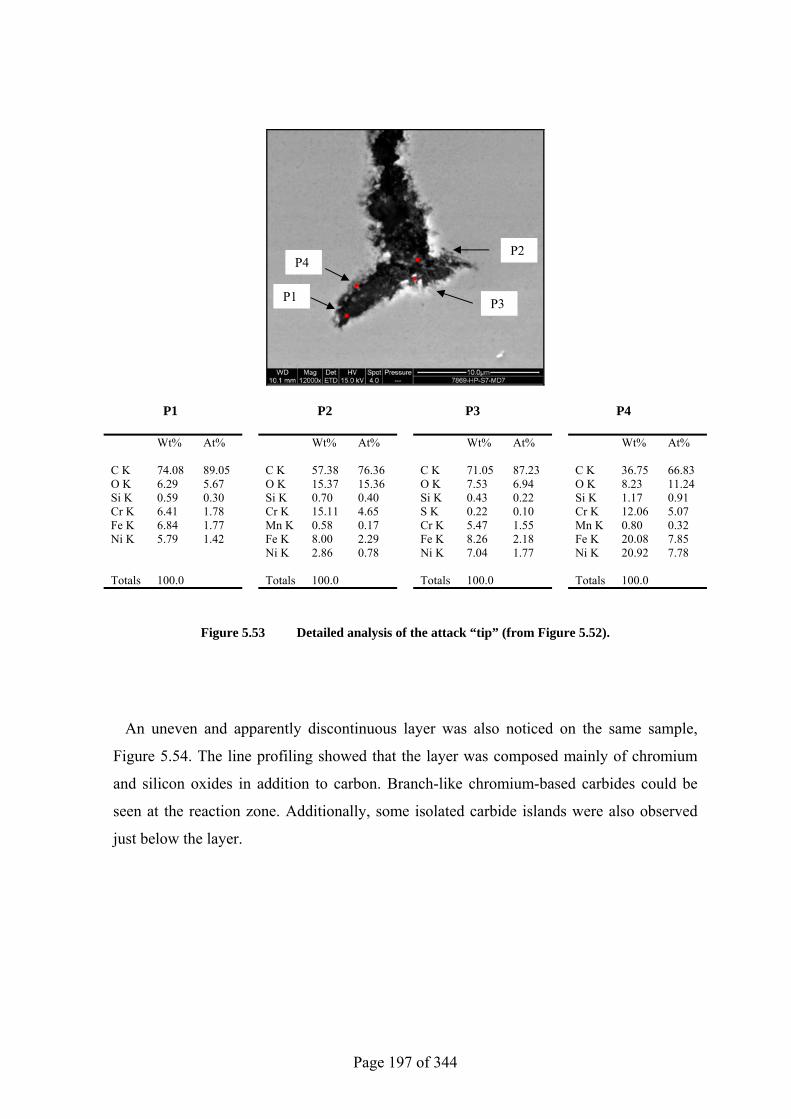
Page 197 of 344
P1 P2 P3 P4
Wt% At% Wt% At% Wt% At% Wt% At% C K 74.08 89.05 C K 57.38 76.36 C K 71.05 87.23 C K 36.75 66.83 O K 6.29 5.67 O K 15.37 15.36 O K 7.53 6.94 O K 8.23 11.24 Si K 0.59 0.30 Si K 0.70 0.40 Si K 0.43 0.22 Si K 1.17 0.91 Cr K 6.41 1.78 Cr K 15.11 4.65 S K 0.22 0.10 Cr K 12.06 5.07 Fe K 6.84 1.77 Mn K 0.58 0.17 Cr K 5.47 1.55 Mn K 0.80 0.32 Ni K 5.79 1.42 Fe K 8.00 2.29 Fe K 8.26 2.18 Fe K 20.08 7.85 Ni K 2.86 0.78 Ni K 7.04 1.77 Ni K 20.92 7.78 Totals 100.0 Totals 100.0 Totals 100.0 Totals 100.0
Figure 5.53 Detailed analysis of the attack “tip” (from Figure 5.52).
An uneven and apparently discontinuous layer was also noticed on the same sample,
Figure 5.54. The line profiling showed that the layer was composed mainly of chromium
and silicon oxides in addition to carbon. Branch-like chromium-based carbides could be
seen at the reaction zone. Additionally, some isolated carbide islands were also observed
just below the layer.
P1
P2
P3
P4
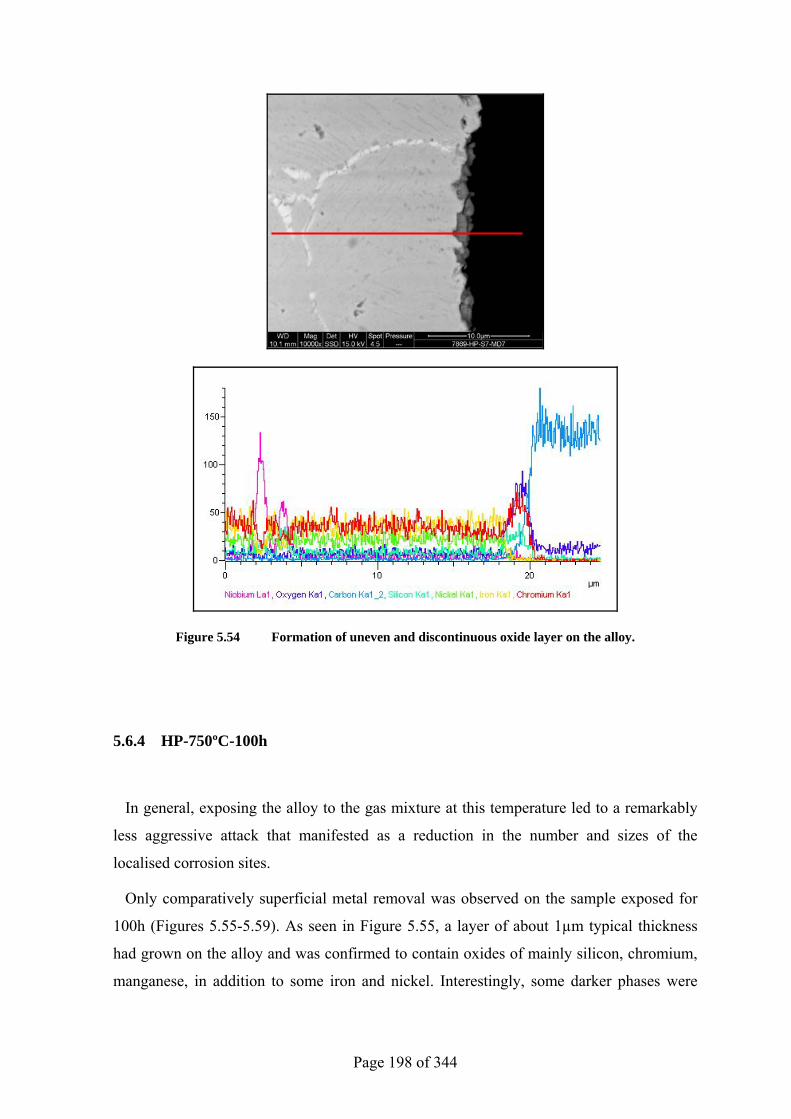
Page 198 of 344
Figure 5.54 Formation of uneven and discontinuous oxide layer on the alloy.
5.6.4 HP-750ºC-100h
In general, exposing the alloy to the gas mixture at this temperature led to a remarkably
less aggressive attack that manifested as a reduction in the number and sizes of the
localised corrosion sites.
Only comparatively superficial metal removal was observed on the sample exposed for
100h (Figures 5.55-5.59). As seen in Figure 5.55, a layer of about 1µm typical thickness
had grown on the alloy and was confirmed to contain oxides of mainly silicon, chromium,
manganese, in addition to some iron and nickel. Interestingly, some darker phases were
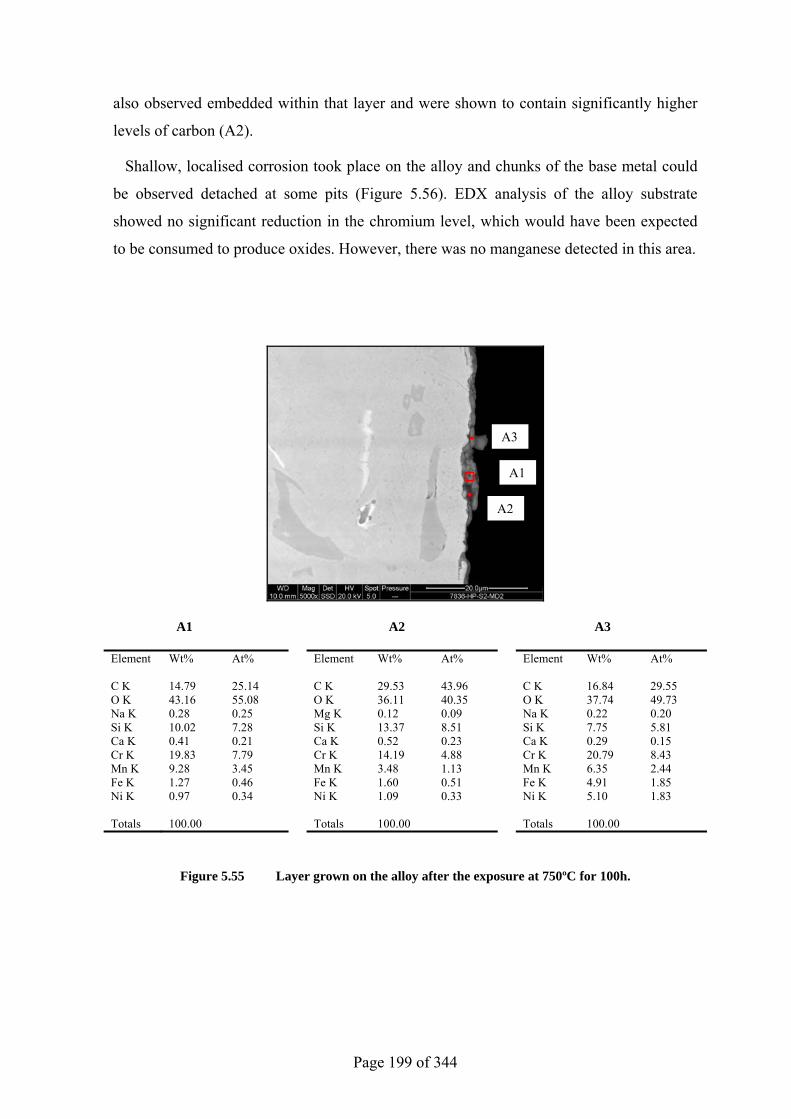
Page 199 of 344
also observed embedded within that layer and were shown to contain significantly higher
levels of carbon (A2).
Shallow, localised corrosion took place on the alloy and chunks of the base metal could
be observed detached at some pits (Figure 5.56). EDX analysis of the alloy substrate
showed no significant reduction in the chromium level, which would have been expected
to be consumed to produce oxides. However, there was no manganese detected in this area.
A1 A2 A3
Element Wt% At% Element Wt% At% Element Wt% At% C K 14.79 25.14 C K 29.53 43.96 C K 16.84 29.55 O K 43.16 55.08 O K 36.11 40.35 O K 37.74 49.73 Na K 0.28 0.25 Mg K 0.12 0.09 Na K 0.22 0.20 Si K 10.02 7.28 Si K 13.37 8.51 Si K 7.75 5.81 Ca K 0.41 0.21 Ca K 0.52 0.23 Ca K 0.29 0.15 Cr K 19.83 7.79 Cr K 14.19 4.88 Cr K 20.79 8.43 Mn K 9.28 3.45 Mn K 3.48 1.13 Mn K 6.35 2.44 Fe K 1.27 0.46 Fe K 1.60 0.51 Fe K 4.91 1.85 Ni K 0.97 0.34 Ni K 1.09 0.33 Ni K 5.10 1.83 Totals 100.00 Totals 100.00 Totals 100.00
Figure 5.55 Layer grown on the alloy after the exposure at 750ºC for 100h.
A1
A2
A3
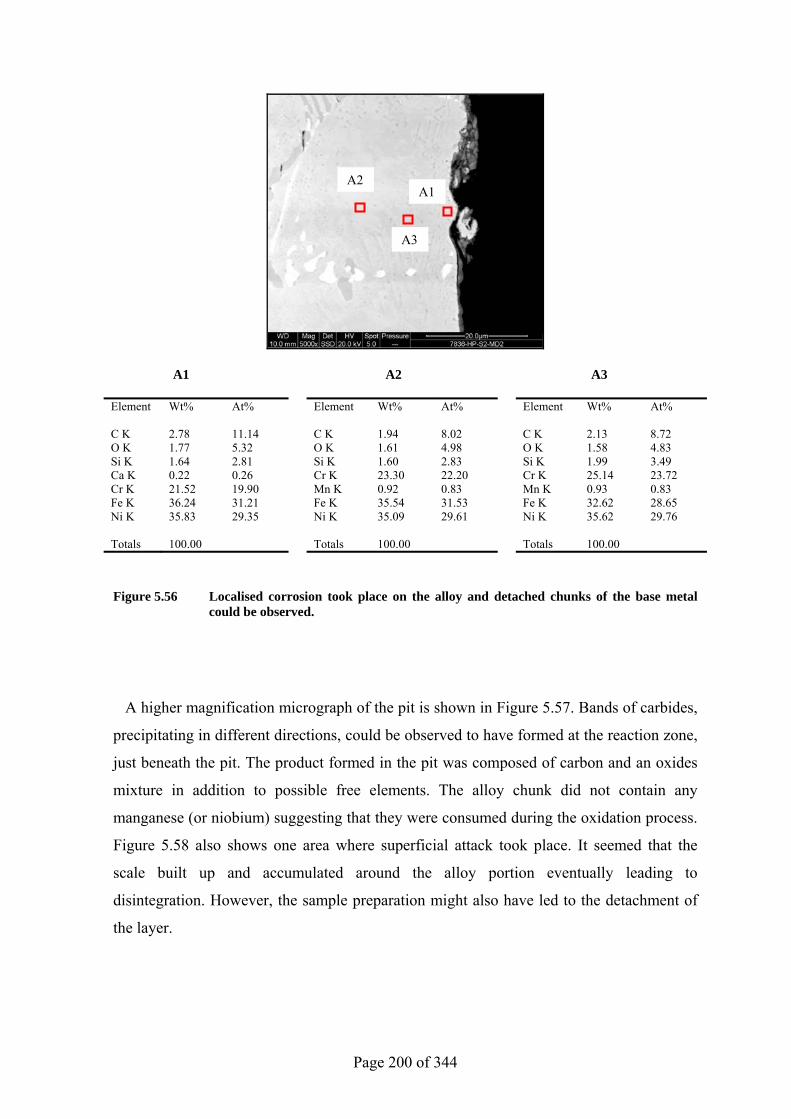
Page 200 of 344
A1 A2 A3
Element Wt% At% Element Wt% At% Element Wt% At% C K 2.78 11.14 C K 1.94 8.02 C K 2.13 8.72 O K 1.77 5.32 O K 1.61 4.98 O K 1.58 4.83 Si K 1.64 2.81 Si K 1.60 2.83 Si K 1.99 3.49 Ca K 0.22 0.26 Cr K 23.30 22.20 Cr K 25.14 23.72 Cr K 21.52 19.90 Mn K 0.92 0.83 Mn K 0.93 0.83 Fe K 36.24 31.21 Fe K 35.54 31.53 Fe K 32.62 28.65 Ni K 35.83 29.35 Ni K 35.09 29.61 Ni K 35.62 29.76 Totals 100.00 Totals 100.00 Totals 100.00
Figure 5.56 Localised corrosion took place on the alloy and detached chunks of the base metal could be observed.
A higher magnification micrograph of the pit is shown in Figure 5.57. Bands of carbides,
precipitating in different directions, could be observed to have formed at the reaction zone,
just beneath the pit. The product formed in the pit was composed of carbon and an oxides
mixture in addition to possible free elements. The alloy chunk did not contain any
manganese (or niobium) suggesting that they were consumed during the oxidation process.
Figure 5.58 also shows one area where superficial attack took place. It seemed that the
scale built up and accumulated around the alloy portion eventually leading to
disintegration. However, the sample preparation might also have led to the detachment of
the layer.
A3
A1A2
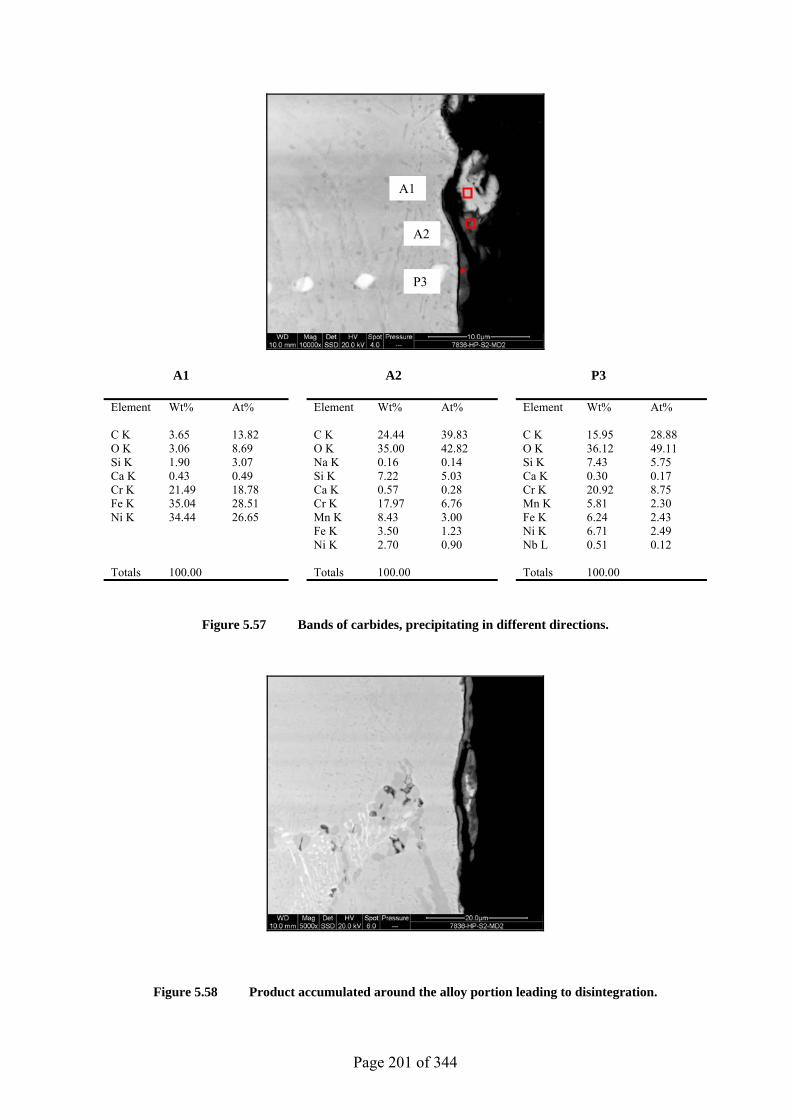
Page 201 of 344
A1 A2 P3
Element Wt% At% Element Wt% At% Element Wt% At% C K 3.65 13.82 C K 24.44 39.83 C K 15.95 28.88 O K 3.06 8.69 O K 35.00 42.82 O K 36.12 49.11 Si K 1.90 3.07 Na K 0.16 0.14 Si K 7.43 5.75 Ca K 0.43 0.49 Si K 7.22 5.03 Ca K 0.30 0.17 Cr K 21.49 18.78 Ca K 0.57 0.28 Cr K 20.92 8.75 Fe K 35.04 28.51 Cr K 17.97 6.76 Mn K 5.81 2.30 Ni K 34.44 26.65 Mn K 8.43 3.00 Fe K 6.24 2.43 Fe K 3.50 1.23 Ni K 6.71 2.49 Ni K 2.70 0.90 Nb L 0.51 0.12 Totals 100.00 Totals 100.00 Totals 100.00
Figure 5.57 Bands of carbides, precipitating in different directions.
Figure 5.58 Product accumulated around the alloy portion leading to disintegration.
A1
A2
P3
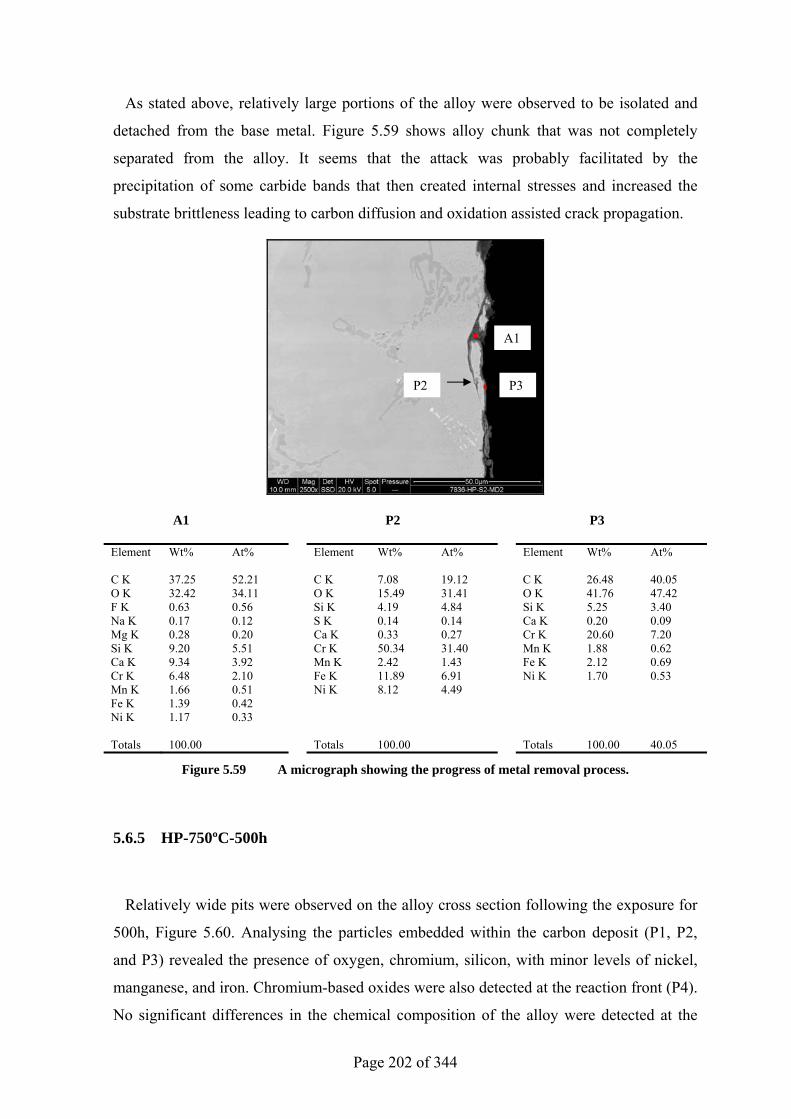
Page 202 of 344
As stated above, relatively large portions of the alloy were observed to be isolated and
detached from the base metal. Figure 5.59 shows alloy chunk that was not completely
separated from the alloy. It seems that the attack was probably facilitated by the
precipitation of some carbide bands that then created internal stresses and increased the
substrate brittleness leading to carbon diffusion and oxidation assisted crack propagation.
A1 P2 P3
Element Wt% At% Element Wt% At% Element Wt% At% C K 37.25 52.21 C K 7.08 19.12 C K 26.48 40.05 O K 32.42 34.11 O K 15.49 31.41 O K 41.76 47.42 F K 0.63 0.56 Si K 4.19 4.84 Si K 5.25 3.40 Na K 0.17 0.12 S K 0.14 0.14 Ca K 0.20 0.09 Mg K 0.28 0.20 Ca K 0.33 0.27 Cr K 20.60 7.20 Si K 9.20 5.51 Cr K 50.34 31.40 Mn K 1.88 0.62 Ca K 9.34 3.92 Mn K 2.42 1.43 Fe K 2.12 0.69 Cr K 6.48 2.10 Fe K 11.89 6.91 Ni K 1.70 0.53 Mn K 1.66 0.51 Ni K 8.12 4.49 Fe K 1.39 0.42 Ni K 1.17 0.33 Totals 100.00 Totals 100.00 Totals 100.00 40.05
Figure 5.59 A micrograph showing the progress of metal removal process.
5.6.5 HP-750ºC-500h
Relatively wide pits were observed on the alloy cross section following the exposure for
500h, Figure 5.60. Analysing the particles embedded within the carbon deposit (P1, P2,
and P3) revealed the presence of oxygen, chromium, silicon, with minor levels of nickel,
manganese, and iron. Chromium-based oxides were also detected at the reaction front (P4).
No significant differences in the chemical composition of the alloy were detected at the
A1
P2 P3
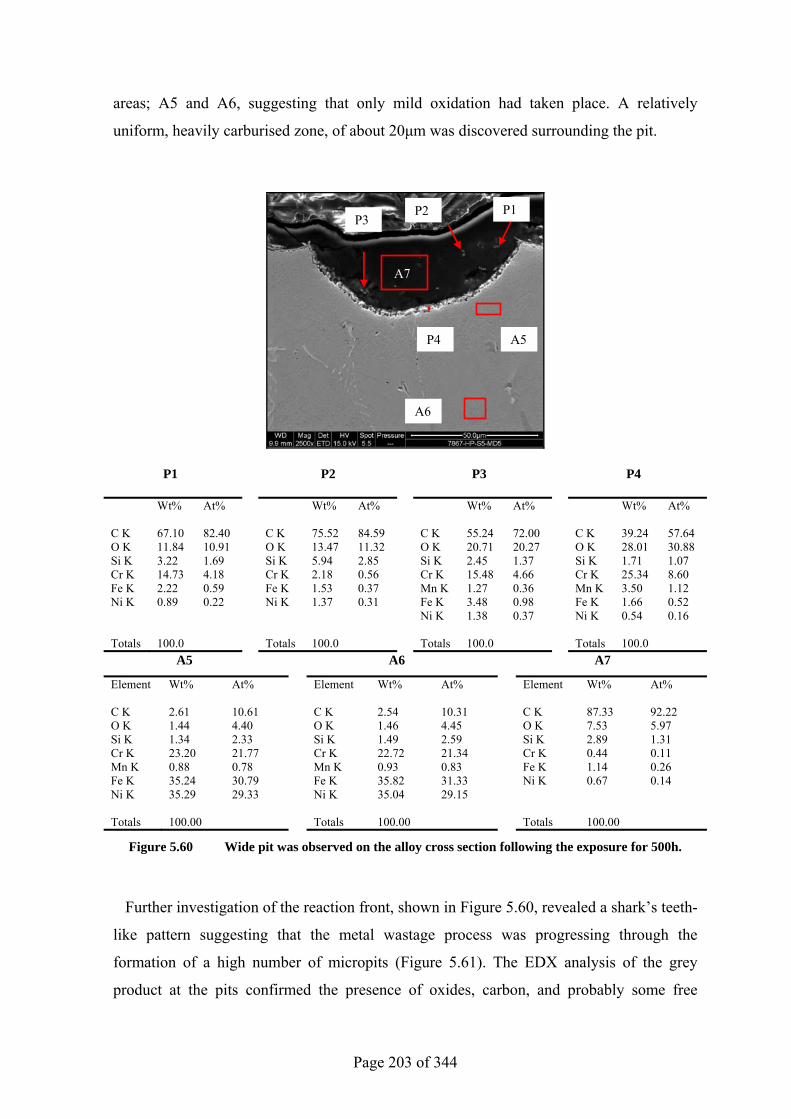
Page 203 of 344
areas; A5 and A6, suggesting that only mild oxidation had taken place. A relatively
uniform, heavily carburised zone, of about 20µm was discovered surrounding the pit.
P1 P2 P3 P4
Wt% At% Wt% At% Wt% At% Wt% At% C K 67.10 82.40 C K 75.52 84.59 C K 55.24 72.00 C K 39.24 57.64 O K 11.84 10.91 O K 13.47 11.32 O K 20.71 20.27 O K 28.01 30.88 Si K 3.22 1.69 Si K 5.94 2.85 Si K 2.45 1.37 Si K 1.71 1.07 Cr K 14.73 4.18 Cr K 2.18 0.56 Cr K 15.48 4.66 Cr K 25.34 8.60 Fe K 2.22 0.59 Fe K 1.53 0.37 Mn K 1.27 0.36 Mn K 3.50 1.12 Ni K 0.89 0.22 Ni K 1.37 0.31 Fe K 3.48 0.98 Fe K 1.66 0.52 Ni K 1.38 0.37 Ni K 0.54 0.16 Totals 100.0 Totals 100.0 Totals 100.0 Totals 100.0 A5 A6 A7
Element Wt% At% Element Wt% At% Element Wt% At% C K 2.61 10.61 C K 2.54 10.31 C K 87.33 92.22 O K 1.44 4.40 O K 1.46 4.45 O K 7.53 5.97 Si K 1.34 2.33 Si K 1.49 2.59 Si K 2.89 1.31 Cr K 23.20 21.77 Cr K 22.72 21.34 Cr K 0.44 0.11 Mn K 0.88 0.78 Mn K 0.93 0.83 Fe K 1.14 0.26 Fe K 35.24 30.79 Fe K 35.82 31.33 Ni K 0.67 0.14 Ni K 35.29 29.33 Ni K 35.04 29.15 Totals 100.00 Totals 100.00 Totals 100.00
Figure 5.60 Wide pit was observed on the alloy cross section following the exposure for 500h.
Further investigation of the reaction front, shown in Figure 5.60, revealed a shark’s teeth-
like pattern suggesting that the metal wastage process was progressing through the
formation of a high number of micropits (Figure 5.61). The EDX analysis of the grey
product at the pits confirmed the presence of oxides, carbon, and probably some free
P1P2P3
P4 A5
A6
A7
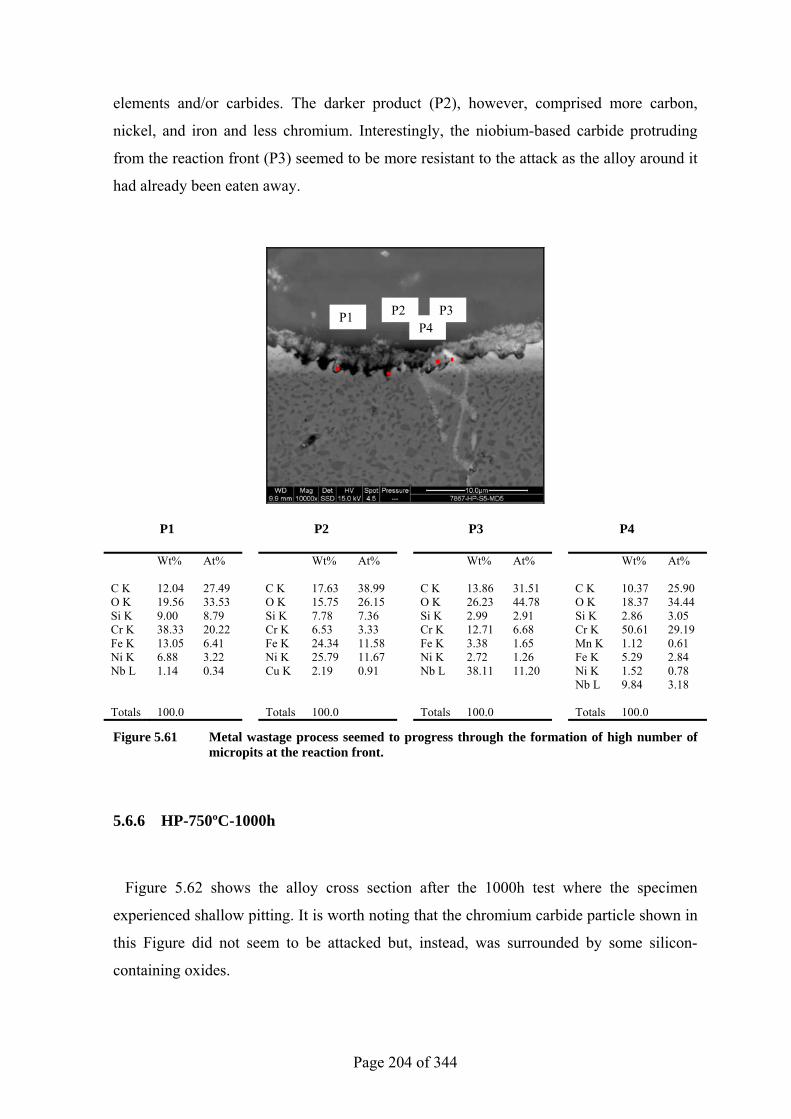
Page 204 of 344
elements and/or carbides. The darker product (P2), however, comprised more carbon,
nickel, and iron and less chromium. Interestingly, the niobium-based carbide protruding
from the reaction front (P3) seemed to be more resistant to the attack as the alloy around it
had already been eaten away.
P1 P2 P3 P4
Wt% At% Wt% At% Wt% At% Wt% At% C K 12.04 27.49 C K 17.63 38.99 C K 13.86 31.51 C K 10.37 25.90 O K 19.56 33.53 O K 15.75 26.15 O K 26.23 44.78 O K 18.37 34.44 Si K 9.00 8.79 Si K 7.78 7.36 Si K 2.99 2.91 Si K 2.86 3.05 Cr K 38.33 20.22 Cr K 6.53 3.33 Cr K 12.71 6.68 Cr K 50.61 29.19 Fe K 13.05 6.41 Fe K 24.34 11.58 Fe K 3.38 1.65 Mn K 1.12 0.61 Ni K 6.88 3.22 Ni K 25.79 11.67 Ni K 2.72 1.26 Fe K 5.29 2.84 Nb L 1.14 0.34 Cu K 2.19 0.91 Nb L 38.11 11.20 Ni K 1.52 0.78 Nb L 9.84 3.18 Totals 100.0 Totals 100.0 Totals 100.0 Totals 100.0
Figure 5.61 Metal wastage process seemed to progress through the formation of high number of micropits at the reaction front.
5.6.6 HP-750ºC-1000h
Figure 5.62 shows the alloy cross section after the 1000h test where the specimen
experienced shallow pitting. It is worth noting that the chromium carbide particle shown in
this Figure did not seem to be attacked but, instead, was surrounded by some silicon-
containing oxides.
P1 P2 P3P4
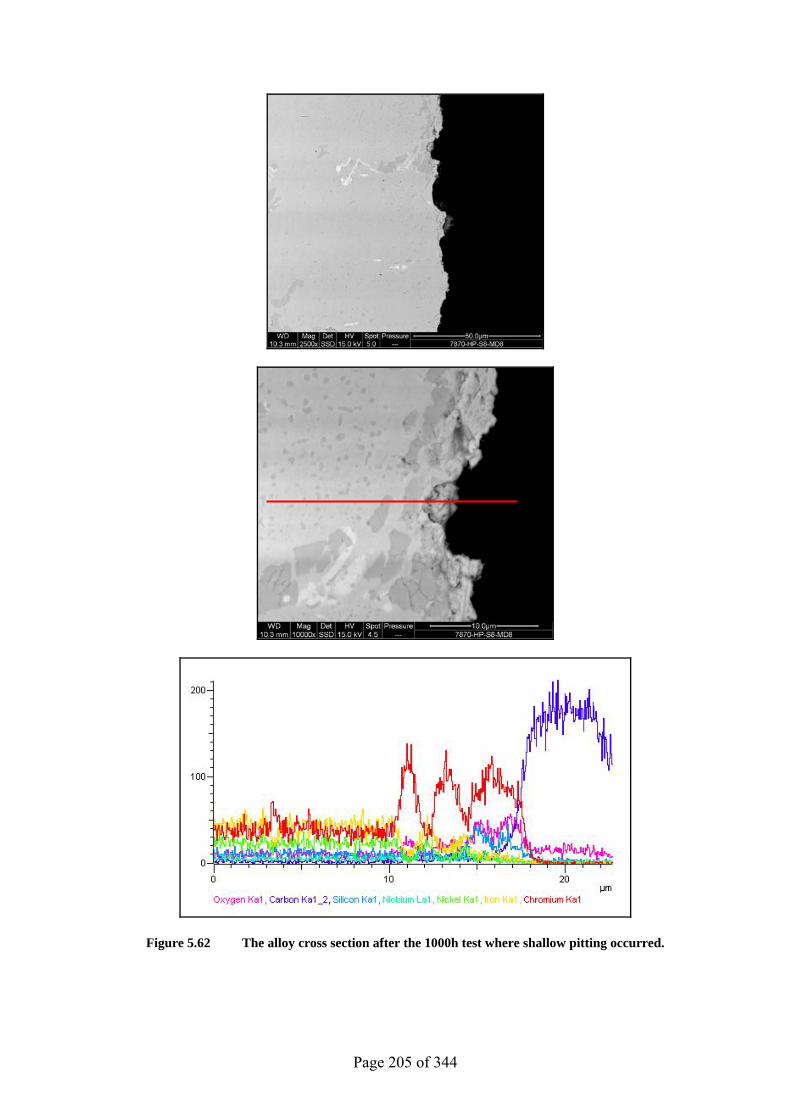
Page 205 of 344
Figure 5.62 The alloy cross section after the 1000h test where shallow pitting occurred.
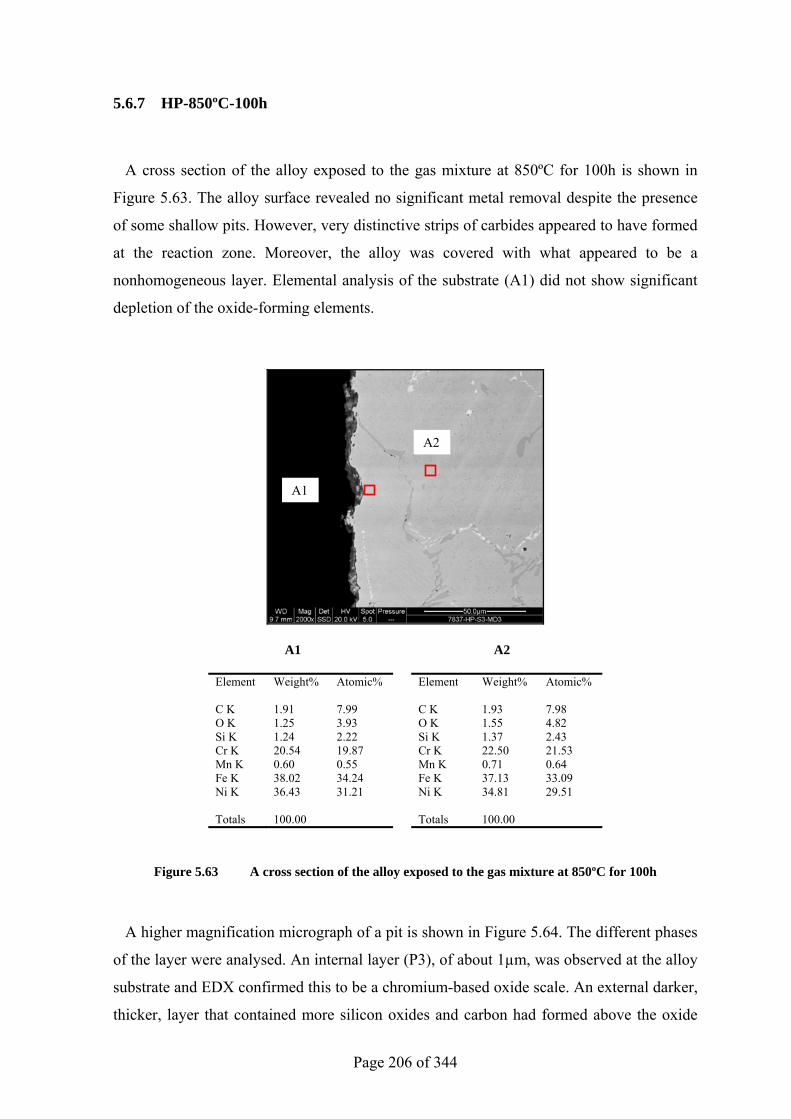
Page 206 of 344
5.6.7 HP-850ºC-100h
A cross section of the alloy exposed to the gas mixture at 850ºC for 100h is shown in
Figure 5.63. The alloy surface revealed no significant metal removal despite the presence
of some shallow pits. However, very distinctive strips of carbides appeared to have formed
at the reaction zone. Moreover, the alloy was covered with what appeared to be a
nonhomogeneous layer. Elemental analysis of the substrate (A1) did not show significant
depletion of the oxide-forming elements.
A1 A2
Element Weight% Atomic% Element Weight% Atomic% C K 1.91 7.99 C K 1.93 7.98 O K 1.25 3.93 O K 1.55 4.82 Si K 1.24 2.22 Si K 1.37 2.43 Cr K 20.54 19.87 Cr K 22.50 21.53 Mn K 0.60 0.55 Mn K 0.71 0.64 Fe K 38.02 34.24 Fe K 37.13 33.09 Ni K 36.43 31.21 Ni K 34.81 29.51 Totals 100.00 Totals 100.00
Figure 5.63 A cross section of the alloy exposed to the gas mixture at 850ºC for 100h
A higher magnification micrograph of a pit is shown in Figure 5.64. The different phases
of the layer were analysed. An internal layer (P3), of about 1µm, was observed at the alloy
substrate and EDX confirmed this to be a chromium-based oxide scale. An external darker,
thicker, layer that contained more silicon oxides and carbon had formed above the oxide
A1
A2
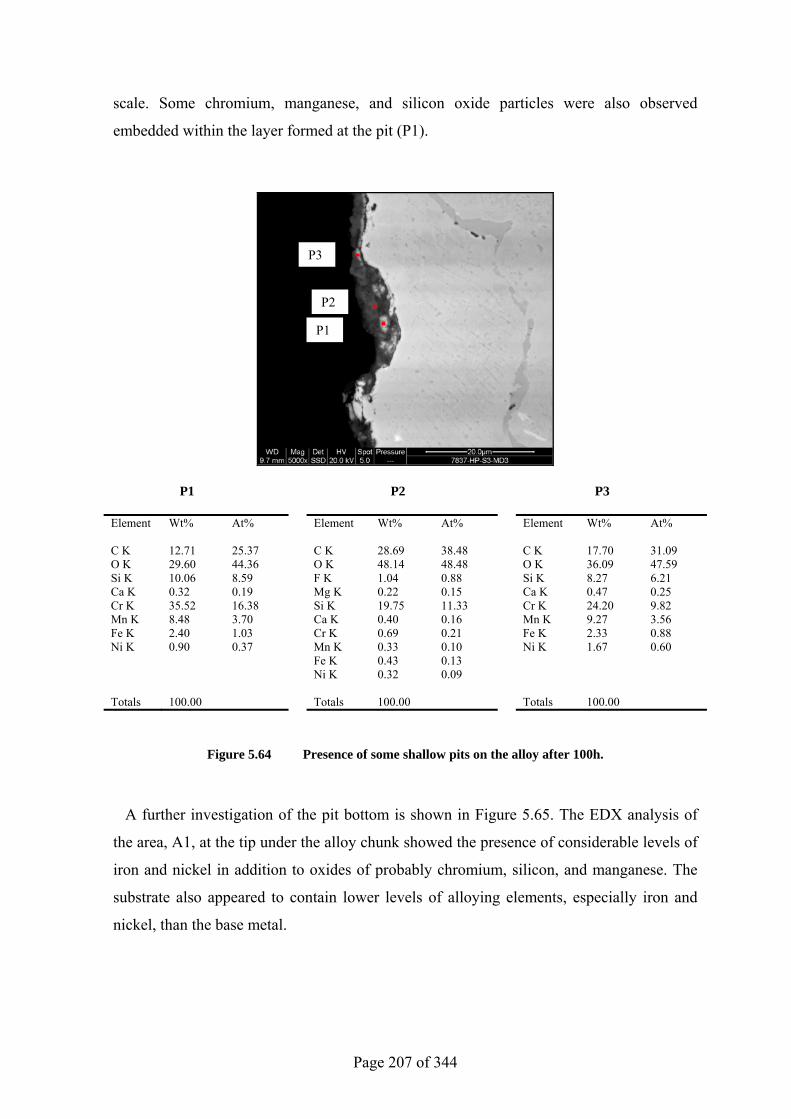
Page 207 of 344
scale. Some chromium, manganese, and silicon oxide particles were also observed
embedded within the layer formed at the pit (P1).
P1 P2 P3
Element Wt% At% Element Wt% At% Element Wt% At% C K 12.71 25.37 C K 28.69 38.48 C K 17.70 31.09 O K 29.60 44.36 O K 48.14 48.48 O K 36.09 47.59 Si K 10.06 8.59 F K 1.04 0.88 Si K 8.27 6.21 Ca K 0.32 0.19 Mg K 0.22 0.15 Ca K 0.47 0.25 Cr K 35.52 16.38 Si K 19.75 11.33 Cr K 24.20 9.82 Mn K 8.48 3.70 Ca K 0.40 0.16 Mn K 9.27 3.56 Fe K 2.40 1.03 Cr K 0.69 0.21 Fe K 2.33 0.88 Ni K 0.90 0.37 Mn K 0.33 0.10 Ni K 1.67 0.60 Fe K 0.43 0.13 Ni K 0.32 0.09 Totals 100.00 Totals 100.00 Totals 100.00
Figure 5.64 Presence of some shallow pits on the alloy after 100h.
A further investigation of the pit bottom is shown in Figure 5.65. The EDX analysis of
the area, A1, at the tip under the alloy chunk showed the presence of considerable levels of
iron and nickel in addition to oxides of probably chromium, silicon, and manganese. The
substrate also appeared to contain lower levels of alloying elements, especially iron and
nickel, than the base metal.
P1
P2
P3
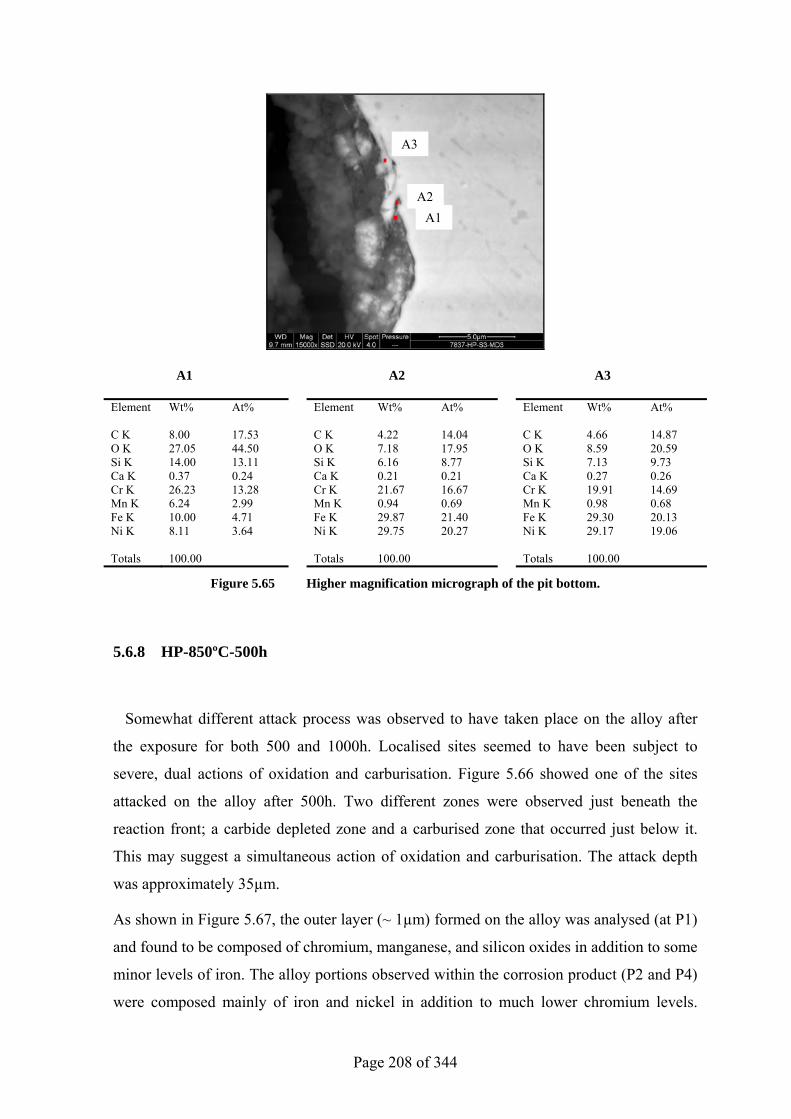
Page 208 of 344
A1 A2 A3
Element Wt% At% Element Wt% At% Element Wt% At% C K 8.00 17.53 C K 4.22 14.04 C K 4.66 14.87 O K 27.05 44.50 O K 7.18 17.95 O K 8.59 20.59 Si K 14.00 13.11 Si K 6.16 8.77 Si K 7.13 9.73 Ca K 0.37 0.24 Ca K 0.21 0.21 Ca K 0.27 0.26 Cr K 26.23 13.28 Cr K 21.67 16.67 Cr K 19.91 14.69 Mn K 6.24 2.99 Mn K 0.94 0.69 Mn K 0.98 0.68 Fe K 10.00 4.71 Fe K 29.87 21.40 Fe K 29.30 20.13 Ni K 8.11 3.64 Ni K 29.75 20.27 Ni K 29.17 19.06 Totals 100.00 Totals 100.00 Totals 100.00
Figure 5.65 Higher magnification micrograph of the pit bottom.
5.6.8 HP-850ºC-500h
Somewhat different attack process was observed to have taken place on the alloy after
the exposure for both 500 and 1000h. Localised sites seemed to have been subject to
severe, dual actions of oxidation and carburisation. Figure 5.66 showed one of the sites
attacked on the alloy after 500h. Two different zones were observed just beneath the
reaction front; a carbide depleted zone and a carburised zone that occurred just below it.
This may suggest a simultaneous action of oxidation and carburisation. The attack depth
was approximately 35µm.
As shown in Figure 5.67, the outer layer (~ 1µm) formed on the alloy was analysed (at P1)
and found to be composed of chromium, manganese, and silicon oxides in addition to some
minor levels of iron. The alloy portions observed within the corrosion product (P2 and P4)
were composed mainly of iron and nickel in addition to much lower chromium levels.
A1A2
A3
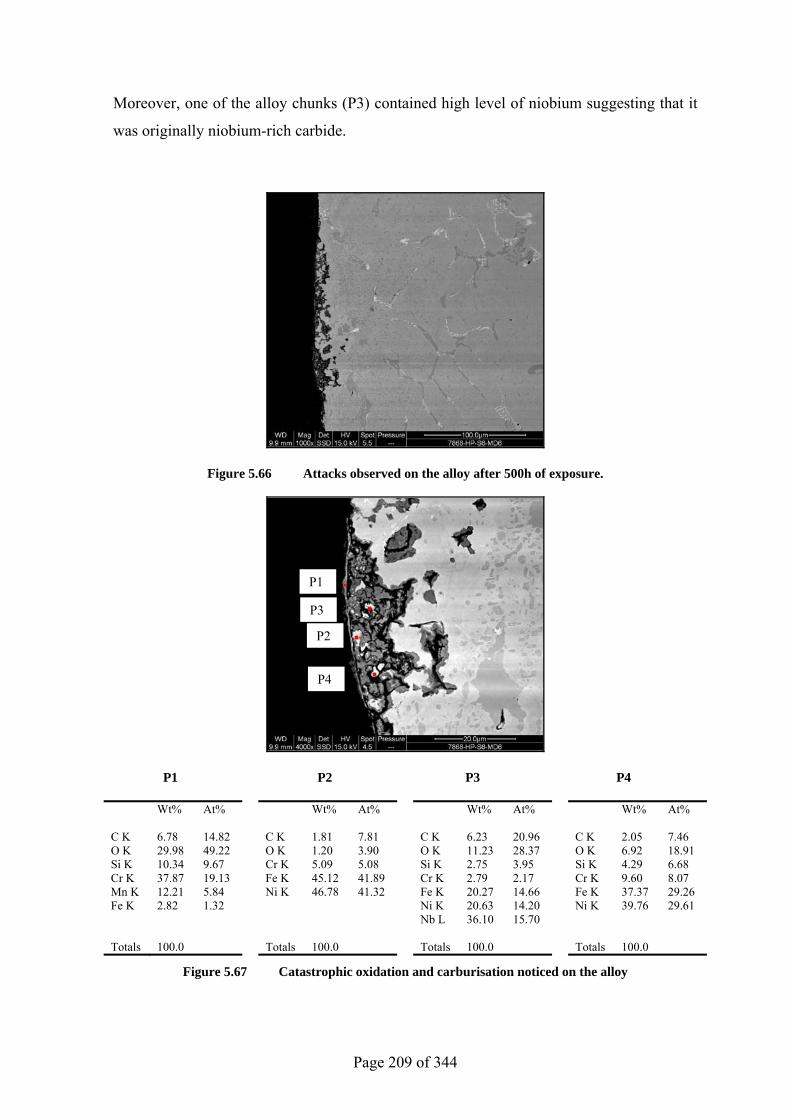
Page 209 of 344
Moreover, one of the alloy chunks (P3) contained high level of niobium suggesting that it
was originally niobium-rich carbide.
Figure 5.66 Attacks observed on the alloy after 500h of exposure.
P1 P2 P3 P4
Wt% At% Wt% At% Wt% At% Wt% At% C K 6.78 14.82 C K 1.81 7.81 C K 6.23 20.96 C K 2.05 7.46 O K 29.98 49.22 O K 1.20 3.90 O K 11.23 28.37 O K 6.92 18.91 Si K 10.34 9.67 Cr K 5.09 5.08 Si K 2.75 3.95 Si K 4.29 6.68 Cr K 37.87 19.13 Fe K 45.12 41.89 Cr K 2.79 2.17 Cr K 9.60 8.07 Mn K 12.21 5.84 Ni K 46.78 41.32 Fe K 20.27 14.66 Fe K 37.37 29.26 Fe K 2.82 1.32 Ni K 20.63 14.20 Ni K 39.76 29.61 Nb L 36.10 15.70 Totals 100.0 Totals 100.0 Totals 100.0 Totals 100.0
Figure 5.67 Catastrophic oxidation and carburisation noticed on the alloy
P1
P2
P3
P4
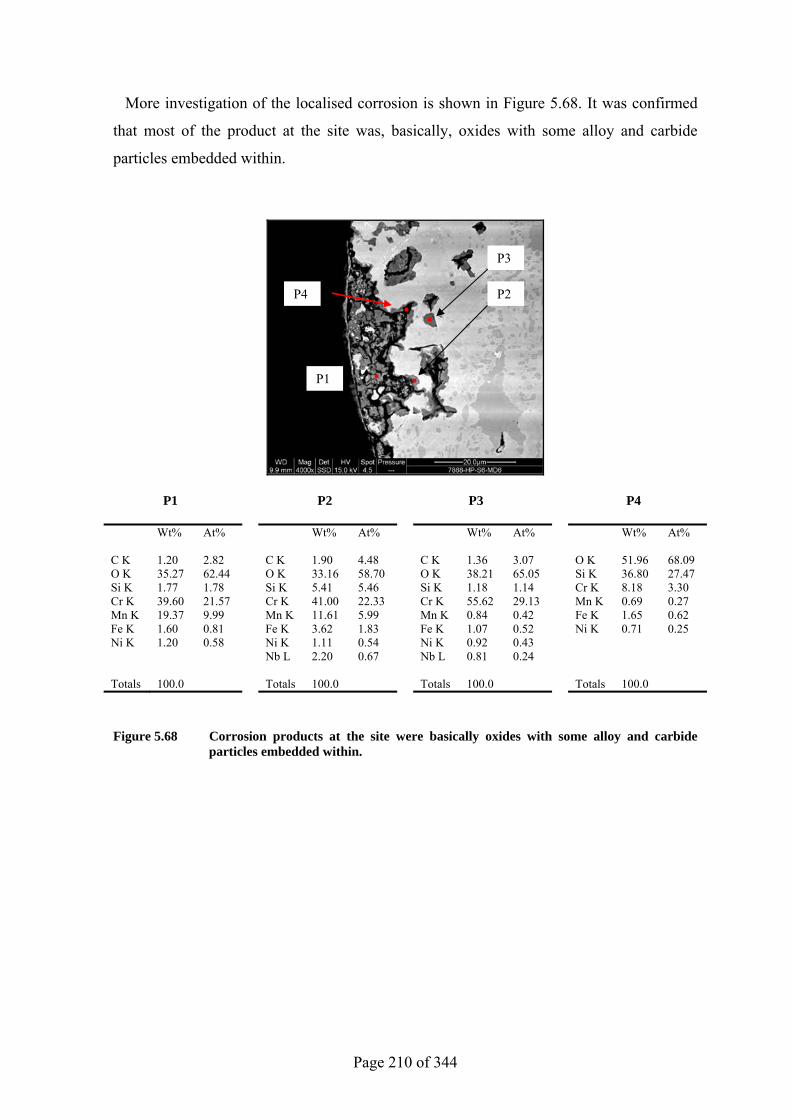
Page 210 of 344
More investigation of the localised corrosion is shown in Figure 5.68. It was confirmed
that most of the product at the site was, basically, oxides with some alloy and carbide
particles embedded within.
P1 P2 P3 P4
Wt% At% Wt% At% Wt% At% Wt% At% C K 1.20 2.82 C K 1.90 4.48 C K 1.36 3.07 O K 51.96 68.09 O K 35.27 62.44 O K 33.16 58.70 O K 38.21 65.05 Si K 36.80 27.47 Si K 1.77 1.78 Si K 5.41 5.46 Si K 1.18 1.14 Cr K 8.18 3.30 Cr K 39.60 21.57 Cr K 41.00 22.33 Cr K 55.62 29.13 Mn K 0.69 0.27 Mn K 19.37 9.99 Mn K 11.61 5.99 Mn K 0.84 0.42 Fe K 1.65 0.62 Fe K 1.60 0.81 Fe K 3.62 1.83 Fe K 1.07 0.52 Ni K 0.71 0.25 Ni K 1.20 0.58 Ni K 1.11 0.54 Ni K 0.92 0.43 Nb L 2.20 0.67 Nb L 0.81 0.24 Totals 100.0 Totals 100.0 Totals 100.0 Totals 100.0
Figure 5.68 Corrosion products at the site were basically oxides with some alloy and carbide particles embedded within.
P1
P2
P3
P4
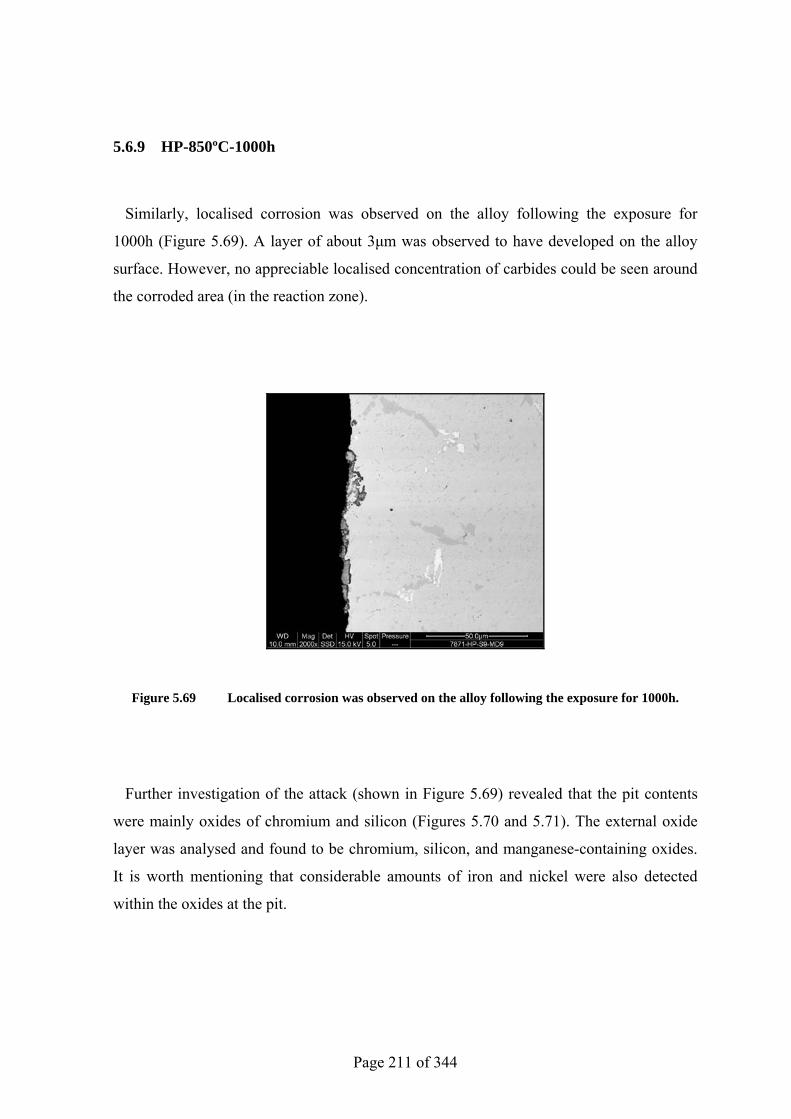
Page 211 of 344
5.6.9 HP-850ºC-1000h
Similarly, localised corrosion was observed on the alloy following the exposure for
1000h (Figure 5.69). A layer of about 3µm was observed to have developed on the alloy
surface. However, no appreciable localised concentration of carbides could be seen around
the corroded area (in the reaction zone).
Figure 5.69 Localised corrosion was observed on the alloy following the exposure for 1000h.
Further investigation of the attack (shown in Figure 5.69) revealed that the pit contents
were mainly oxides of chromium and silicon (Figures 5.70 and 5.71). The external oxide
layer was analysed and found to be chromium, silicon, and manganese-containing oxides.
It is worth mentioning that considerable amounts of iron and nickel were also detected
within the oxides at the pit.
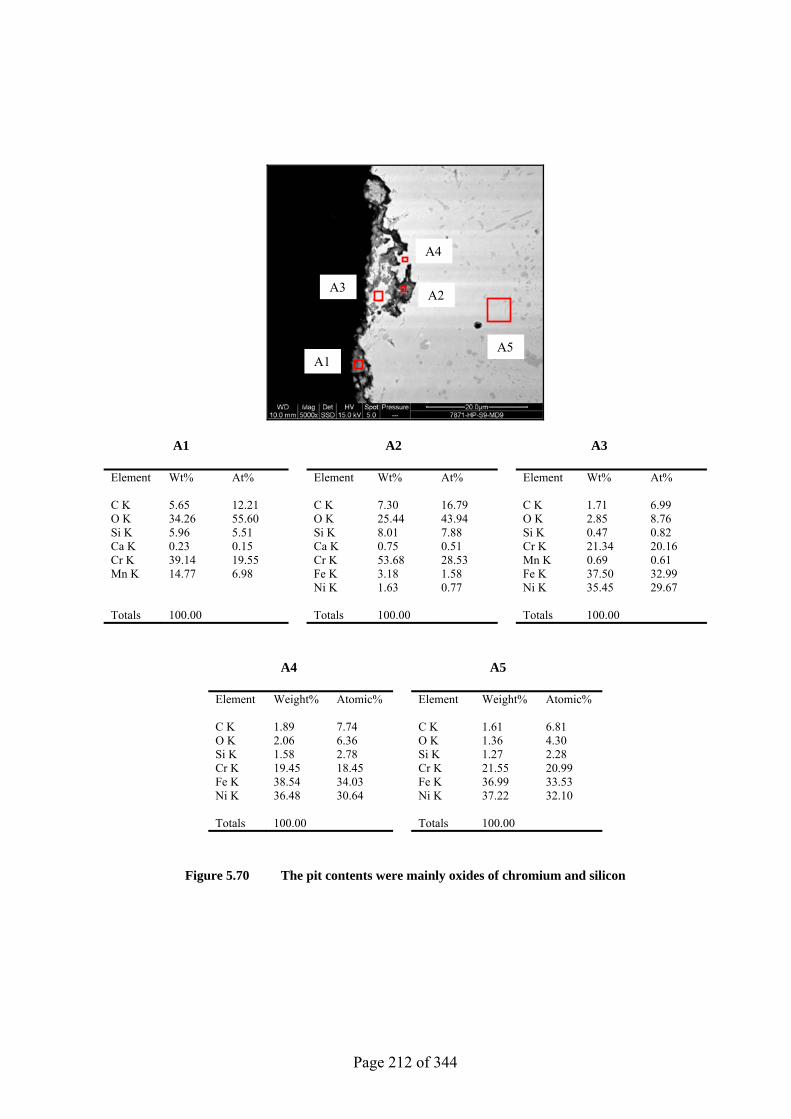
Page 212 of 344
A1 A2 A3
Element Wt% At% Element Wt% At% Element Wt% At% C K 5.65 12.21 C K 7.30 16.79 C K 1.71 6.99 O K 34.26 55.60 O K 25.44 43.94 O K 2.85 8.76 Si K 5.96 5.51 Si K 8.01 7.88 Si K 0.47 0.82 Ca K 0.23 0.15 Ca K 0.75 0.51 Cr K 21.34 20.16 Cr K 39.14 19.55 Cr K 53.68 28.53 Mn K 0.69 0.61 Mn K 14.77 6.98 Fe K 3.18 1.58 Fe K 37.50 32.99 Ni K 1.63 0.77 Ni K 35.45 29.67 Totals 100.00 Totals 100.00 Totals 100.00
A4 A5
Element Weight% Atomic% Element Weight% Atomic% C K 1.89 7.74 C K 1.61 6.81 O K 2.06 6.36 O K 1.36 4.30 Si K 1.58 2.78 Si K 1.27 2.28 Cr K 19.45 18.45 Cr K 21.55 20.99 Fe K 38.54 34.03 Fe K 36.99 33.53 Ni K 36.48 30.64 Ni K 37.22 32.10 Totals 100.00 Totals 100.00
Figure 5.70 The pit contents were mainly oxides of chromium and silicon
A1
A3 A2
A4
A5
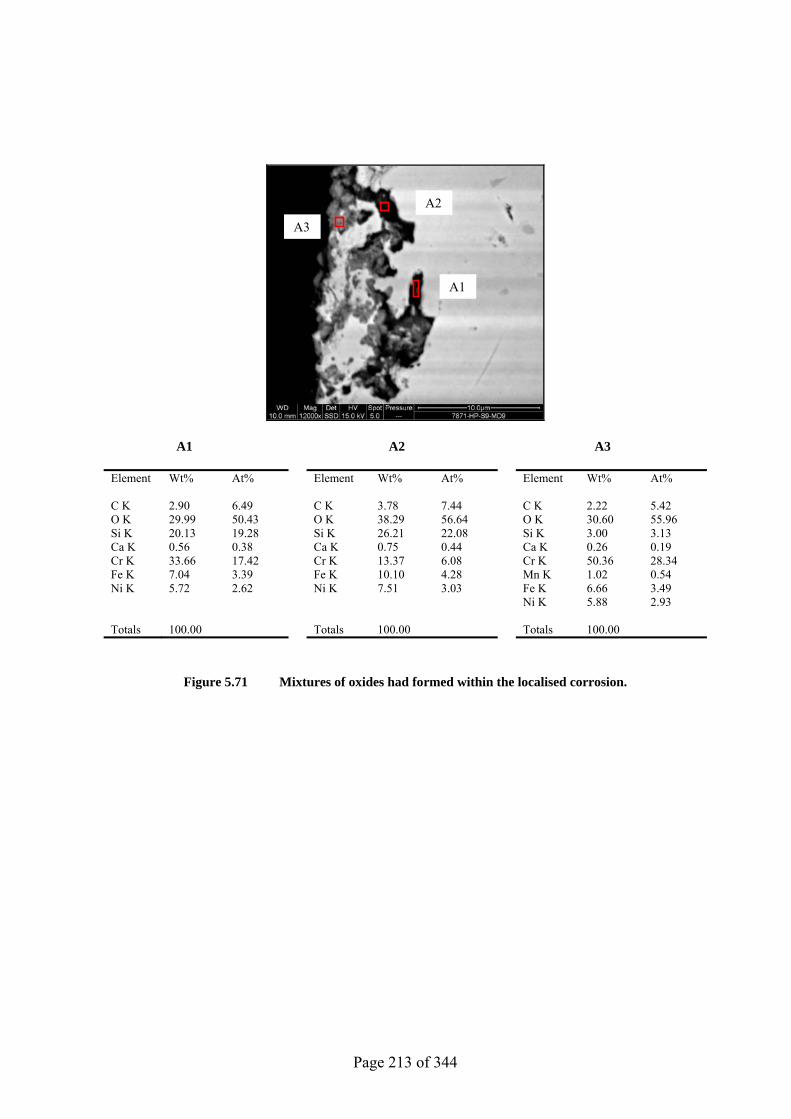
Page 213 of 344
A1 A2 A3
Element Wt% At% Element Wt% At% Element Wt% At% C K 2.90 6.49 C K 3.78 7.44 C K 2.22 5.42 O K 29.99 50.43 O K 38.29 56.64 O K 30.60 55.96 Si K 20.13 19.28 Si K 26.21 22.08 Si K 3.00 3.13 Ca K 0.56 0.38 Ca K 0.75 0.44 Ca K 0.26 0.19 Cr K 33.66 17.42 Cr K 13.37 6.08 Cr K 50.36 28.34 Fe K 7.04 3.39 Fe K 10.10 4.28 Mn K 1.02 0.54 Ni K 5.72 2.62 Ni K 7.51 3.03 Fe K 6.66 3.49 Ni K 5.88 2.93 Totals 100.00 Totals 100.00 Totals 100.00
Figure 5.71 Mixtures of oxides had formed within the localised corrosion.
A1
A2
A3
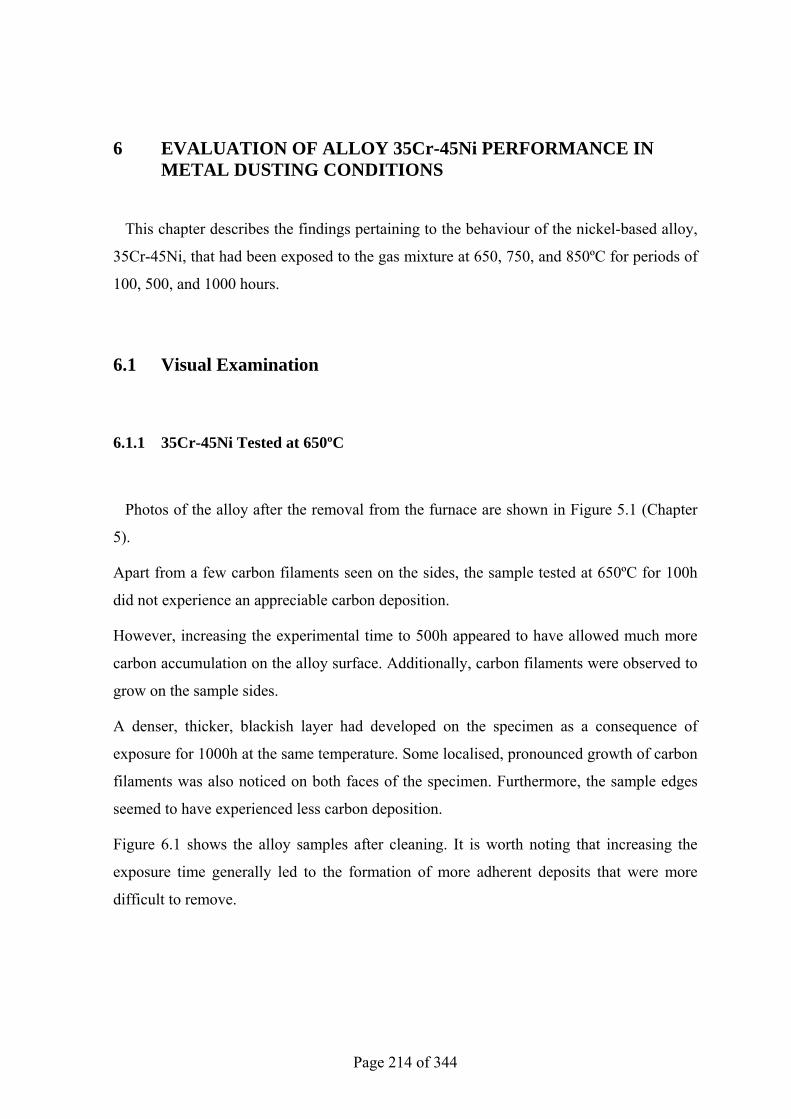
Page 214 of 344
6 EVALUATION OF ALLOY 35Cr-45Ni PERFORMANCE IN METAL DUSTING CONDITIONS
This chapter describes the findings pertaining to the behaviour of the nickel-based alloy,
35Cr-45Ni, that had been exposed to the gas mixture at 650, 750, and 850ºC for periods of
100, 500, and 1000 hours.
6.1 Visual Examination
6.1.1 35Cr-45Ni Tested at 650ºC
Photos of the alloy after the removal from the furnace are shown in Figure 5.1 (Chapter
5).
Apart from a few carbon filaments seen on the sides, the sample tested at 650ºC for 100h
did not experience an appreciable carbon deposition.
However, increasing the experimental time to 500h appeared to have allowed much more
carbon accumulation on the alloy surface. Additionally, carbon filaments were observed to
grow on the sample sides.
A denser, thicker, blackish layer had developed on the specimen as a consequence of
exposure for 1000h at the same temperature. Some localised, pronounced growth of carbon
filaments was also noticed on both faces of the specimen. Furthermore, the sample edges
seemed to have experienced less carbon deposition.
Figure 6.1 shows the alloy samples after cleaning. It is worth noting that increasing the
exposure time generally led to the formation of more adherent deposits that were more
difficult to remove.
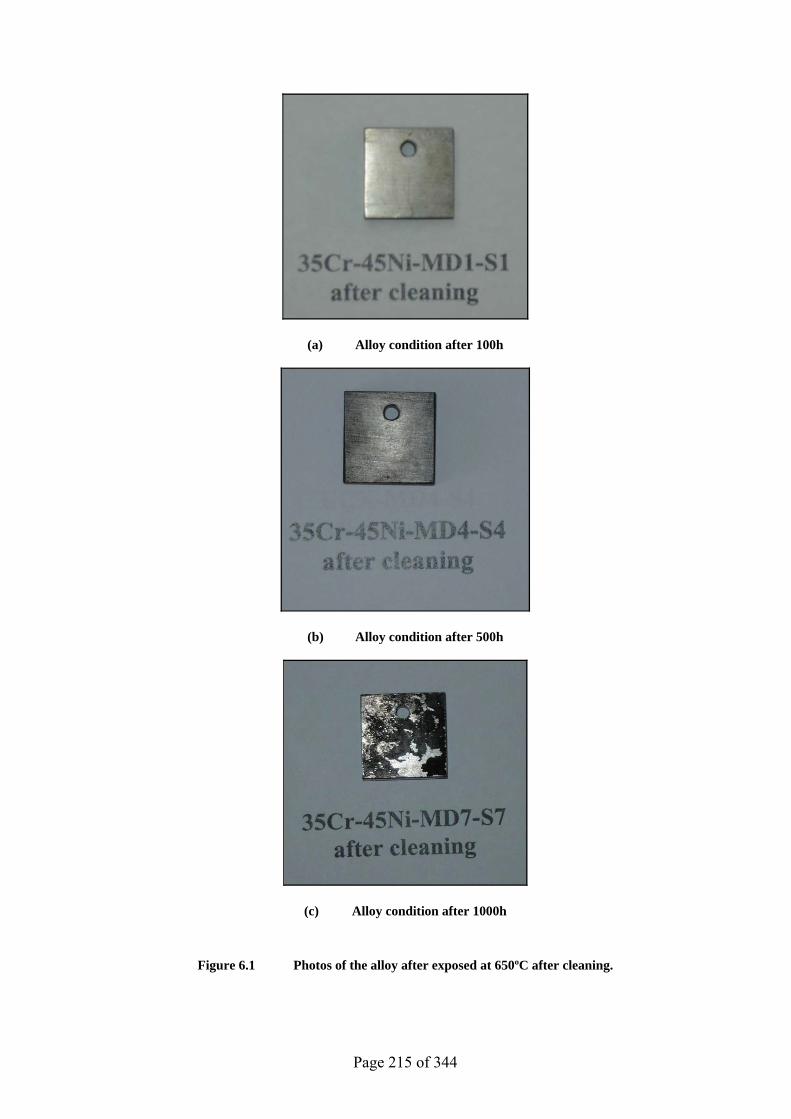
Page 215 of 344
(a) Alloy condition after 100h
(b) Alloy condition after 500h
(c) Alloy condition after 1000h
Figure 6.1 Photos of the alloy after exposed at 650ºC after cleaning.
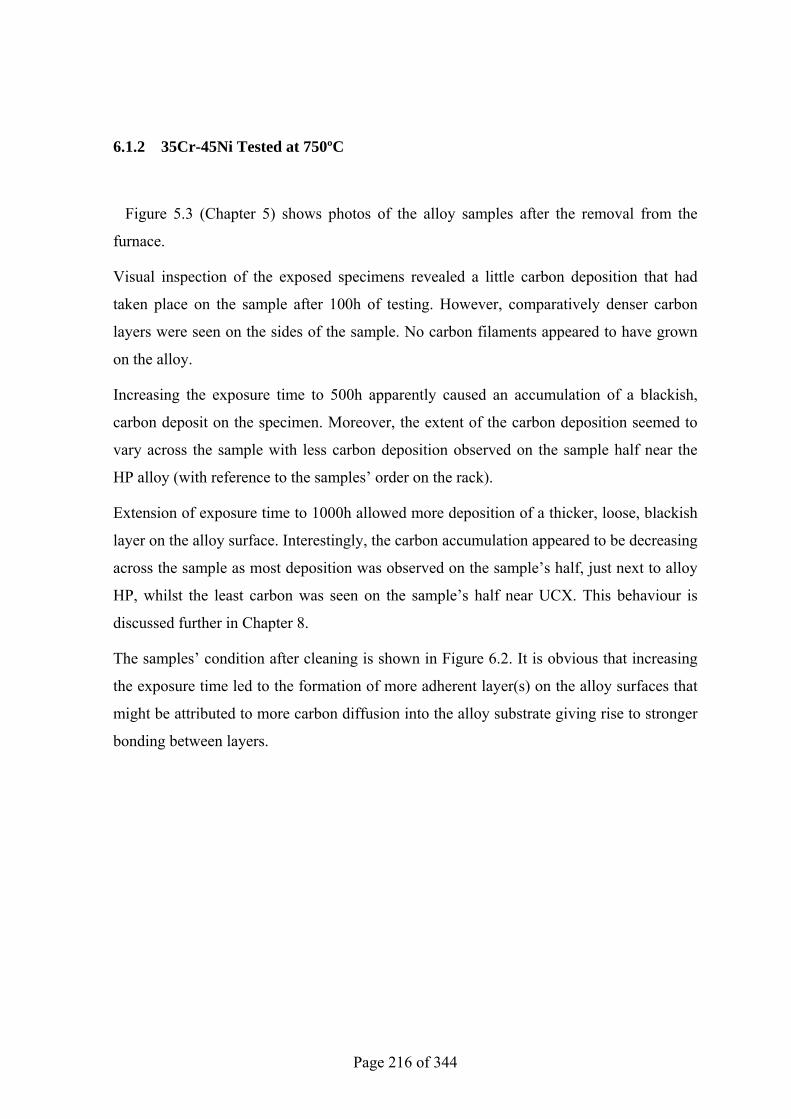
Page 216 of 344
6.1.2 35Cr-45Ni Tested at 750ºC
Figure 5.3 (Chapter 5) shows photos of the alloy samples after the removal from the
furnace.
Visual inspection of the exposed specimens revealed a little carbon deposition that had
taken place on the sample after 100h of testing. However, comparatively denser carbon
layers were seen on the sides of the sample. No carbon filaments appeared to have grown
on the alloy.
Increasing the exposure time to 500h apparently caused an accumulation of a blackish,
carbon deposit on the specimen. Moreover, the extent of the carbon deposition seemed to
vary across the sample with less carbon deposition observed on the sample half near the
HP alloy (with reference to the samples’ order on the rack).
Extension of exposure time to 1000h allowed more deposition of a thicker, loose, blackish
layer on the alloy surface. Interestingly, the carbon accumulation appeared to be decreasing
across the sample as most deposition was observed on the sample’s half, just next to alloy
HP, whilst the least carbon was seen on the sample’s half near UCX. This behaviour is
discussed further in Chapter 8.
The samples’ condition after cleaning is shown in Figure 6.2. It is obvious that increasing
the exposure time led to the formation of more adherent layer(s) on the alloy surfaces that
might be attributed to more carbon diffusion into the alloy substrate giving rise to stronger
bonding between layers.
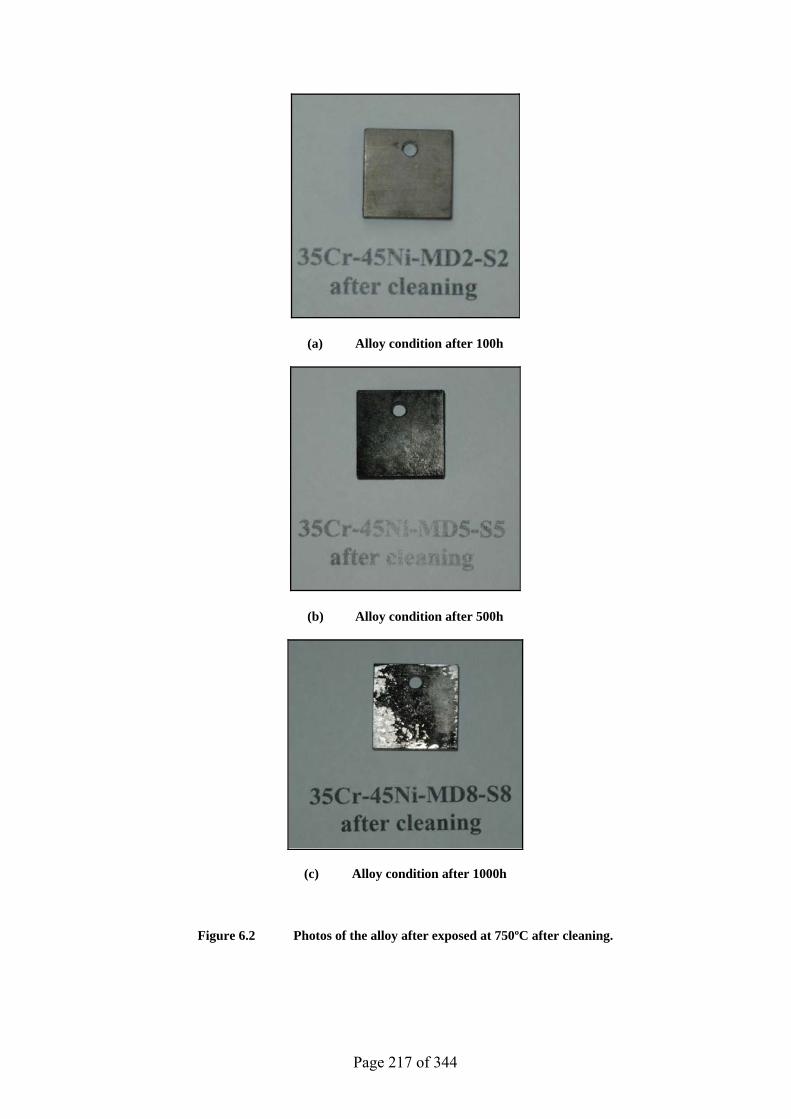
Page 217 of 344
(a) Alloy condition after 100h
(b) Alloy condition after 500h
(c) Alloy condition after 1000h
Figure 6.2 Photos of the alloy after exposed at 750ºC after cleaning.
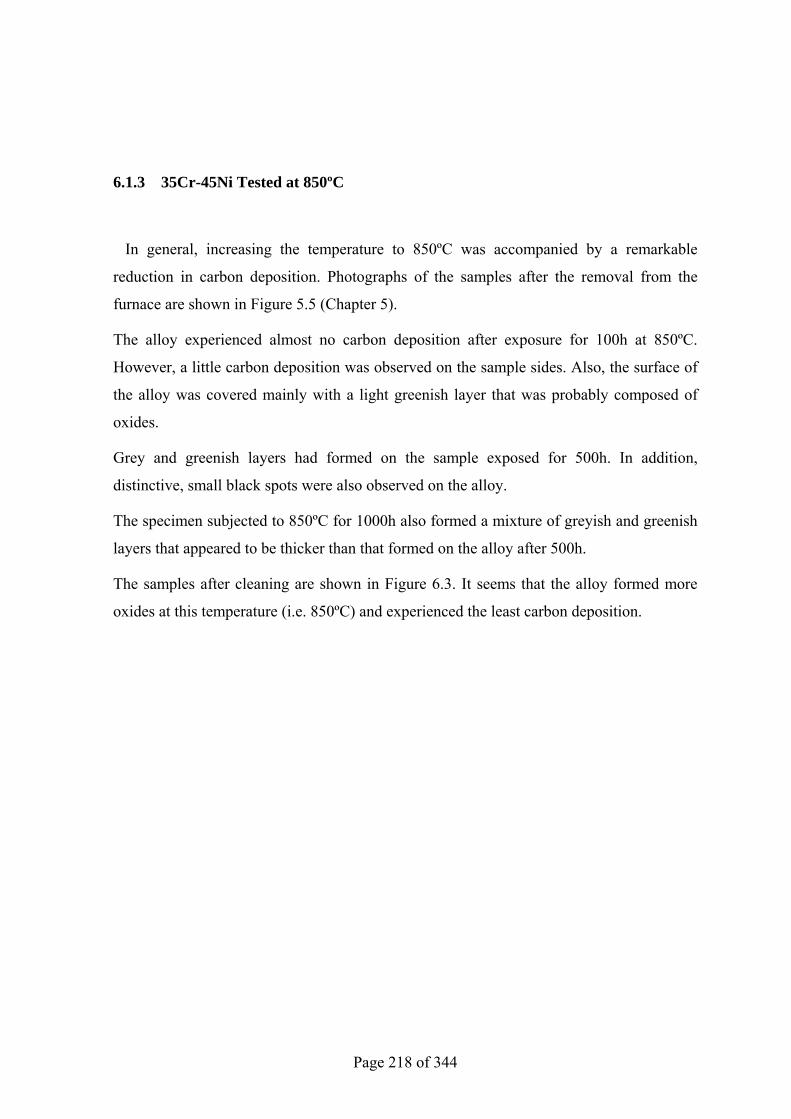
Page 218 of 344
6.1.3 35Cr-45Ni Tested at 850ºC
In general, increasing the temperature to 850ºC was accompanied by a remarkable
reduction in carbon deposition. Photographs of the samples after the removal from the
furnace are shown in Figure 5.5 (Chapter 5).
The alloy experienced almost no carbon deposition after exposure for 100h at 850ºC.
However, a little carbon deposition was observed on the sample sides. Also, the surface of
the alloy was covered mainly with a light greenish layer that was probably composed of
oxides.
Grey and greenish layers had formed on the sample exposed for 500h. In addition,
distinctive, small black spots were also observed on the alloy.
The specimen subjected to 850ºC for 1000h also formed a mixture of greyish and greenish
layers that appeared to be thicker than that formed on the alloy after 500h.
The samples after cleaning are shown in Figure 6.3. It seems that the alloy formed more
oxides at this temperature (i.e. 850ºC) and experienced the least carbon deposition.
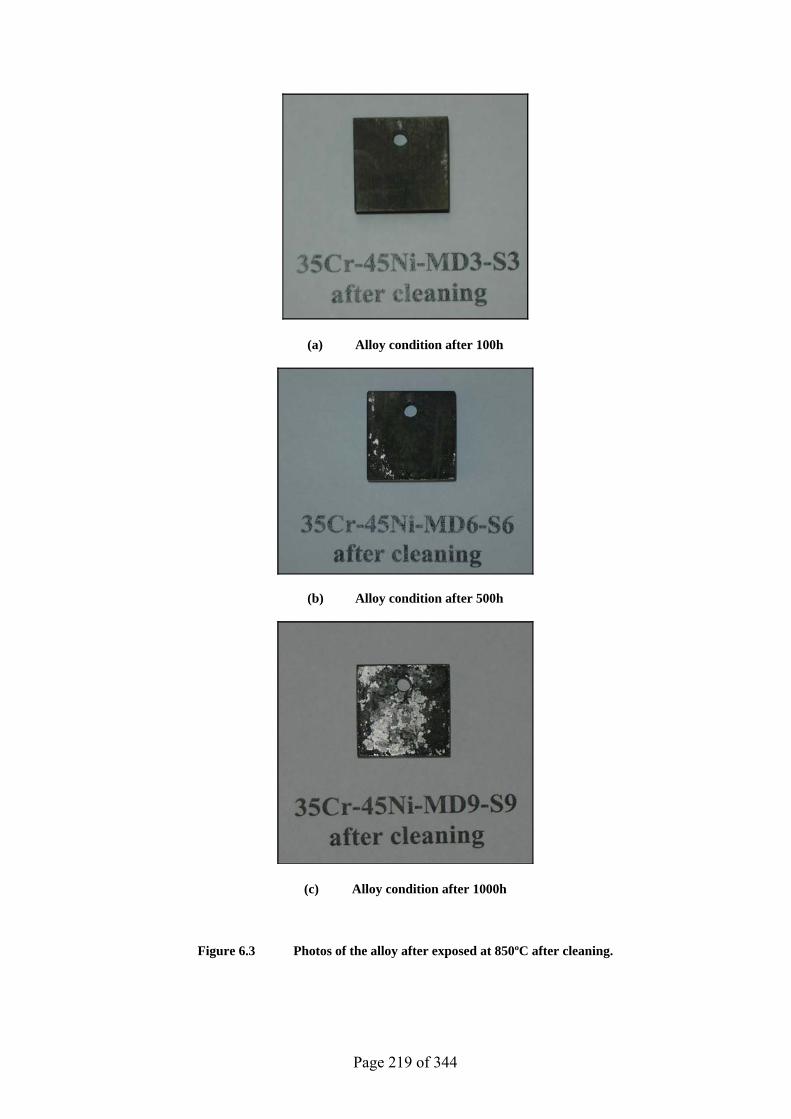
Page 219 of 344
(a) Alloy condition after 100h
(b) Alloy condition after 500h
(c) Alloy condition after 1000h
Figure 6.3 Photos of the alloy after exposed at 850ºC after cleaning.
Page 220 of 344
6.2 Weight Change Measurements
The specimens were then weighed in order to calculate the weight change (Table 6.1).
The measurements showed that the samples experienced weight gain in most experiments.
Weight loss, however, was observed on the sample exposed at 650ºC for 500h.
In general, the weight change might well be the result of oxidation, carburisation, metal
dusting, carbon deposition, or a combination of some or all of these. In view of that, we
can say that, although the weight gain may not prove whether the alloy experienced metal
wastage, the weight loss, nonetheless, might indicate that the alloy suffered metal dusting,
especially for the samples exposed at relatively low temperatures (650 and 750ºC) where
the formation (and spallation) of thick oxide scales is unlikely.
Table 6.1 Weight change (mg/cm2) of the alloy after the exposure at different temperatures for different periods of time.
Temperature (ºC) 100h 500h 1000h
650 0.1060 -0.8335 0.3519
750 0.4392 0.5191 0.1907
850 0.3741 0.3855 0.1427
6.3 X ray Diffraction Results
All the alloy surfaces, as well as any sufficient amount of deposits, were analysed by
XRD. The XRD patterns and charts are reported in Appendix C.
Analysis of the alloy after exposure at 650ºC for 100h showed the presence of carbon,
niobium carbides, and chromium and iron-containing carbides. It was also possible to
collect a small amount of the deposit that was found to contain carbon, chromium carbides,
chromium, and silicon oxide.
Page 221 of 344
Carbides of niobium and chromium-iron were detected in the sample exposed for 500h at
the same temperature. The deposit removed from this sample contained carbon, Cr2O3, and
alloy particles (Cr2Ni3).
Increasing the test time to 1000h resulted in the formation of silicon oxide, carbon, and
niobium and chromium-iron carbides on the alloy surface. The deposit extracted from this
alloy was found to contain mainly carbon and silicon oxide.
MnCr2O4 and chromium-iron carbides had formed on the alloy as a result of exposure at
750ºC for 100h. The deposit removed from this specimen was composed of carbon, silicon
oxide, and Fe3Ni2.
Extending the exposure time to 500h resulted in the formation of Cr1.5Fe0.5MnO4, Cr2O3,
silicon oxides, and chromium-iron-carbides on the alloy surface. Not enough deposit was
found on this sample to be analysed.
Prolonging the experiment time to 1000h led to the formation of CrMn1.5O4 and Cr2O3 on
the alloy. The analysis of the deposit removed from this sample showed the presence of
carbon, silicon oxide, and Ni-Si particles.
Carbon and CrMn1.5O4 were detected on the sample as a consequence of exposure at 850ºC
for 100h. However, Cr0.5Fe1.5MnO4 was found on the alloy after increasing the exposure
time to 500h. Increasing the experiment time further, to 1000h, led to the production of
CrMn1.5O4, Cr2O3, and Mn1.7Fe1.3O4 on the sample surface.
6.4 SEM/EDX Deposits Analysis
The chemical composition of the deposits removed from the alloys was examined using
SEM/EDX.
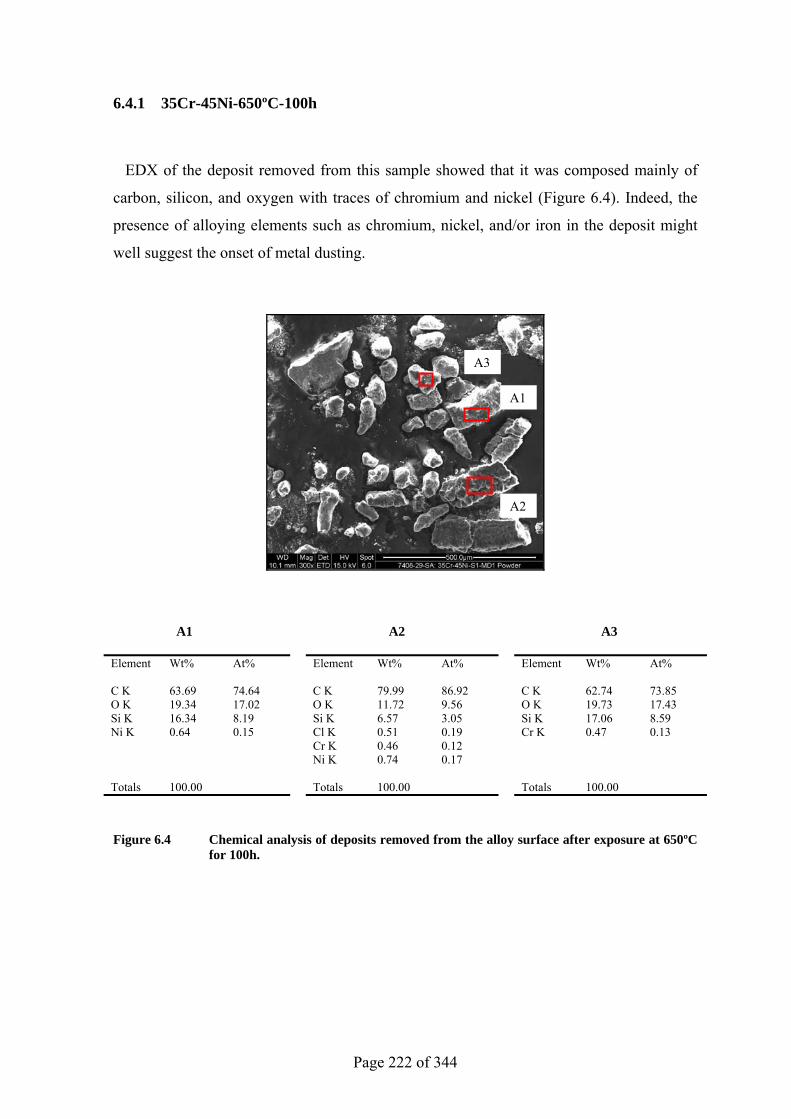
Page 222 of 344
6.4.1 35Cr-45Ni-650ºC-100h
EDX of the deposit removed from this sample showed that it was composed mainly of
carbon, silicon, and oxygen with traces of chromium and nickel (Figure 6.4). Indeed, the
presence of alloying elements such as chromium, nickel, and/or iron in the deposit might
well suggest the onset of metal dusting.
A1 A2 A3
Element Wt% At% Element Wt% At% Element Wt% At% C K 63.69 74.64 C K 79.99 86.92 C K 62.74 73.85 O K 19.34 17.02 O K 11.72 9.56 O K 19.73 17.43 Si K 16.34 8.19 Si K 6.57 3.05 Si K 17.06 8.59 Ni K 0.64 0.15 Cl K 0.51 0.19 Cr K 0.47 0.13 Cr K 0.46 0.12 Ni K 0.74 0.17 Totals 100.00 Totals 100.00 Totals 100.00
Figure 6.4 Chemical analysis of deposits removed from the alloy surface after exposure at 650ºC for 100h.
A1
A2
A3
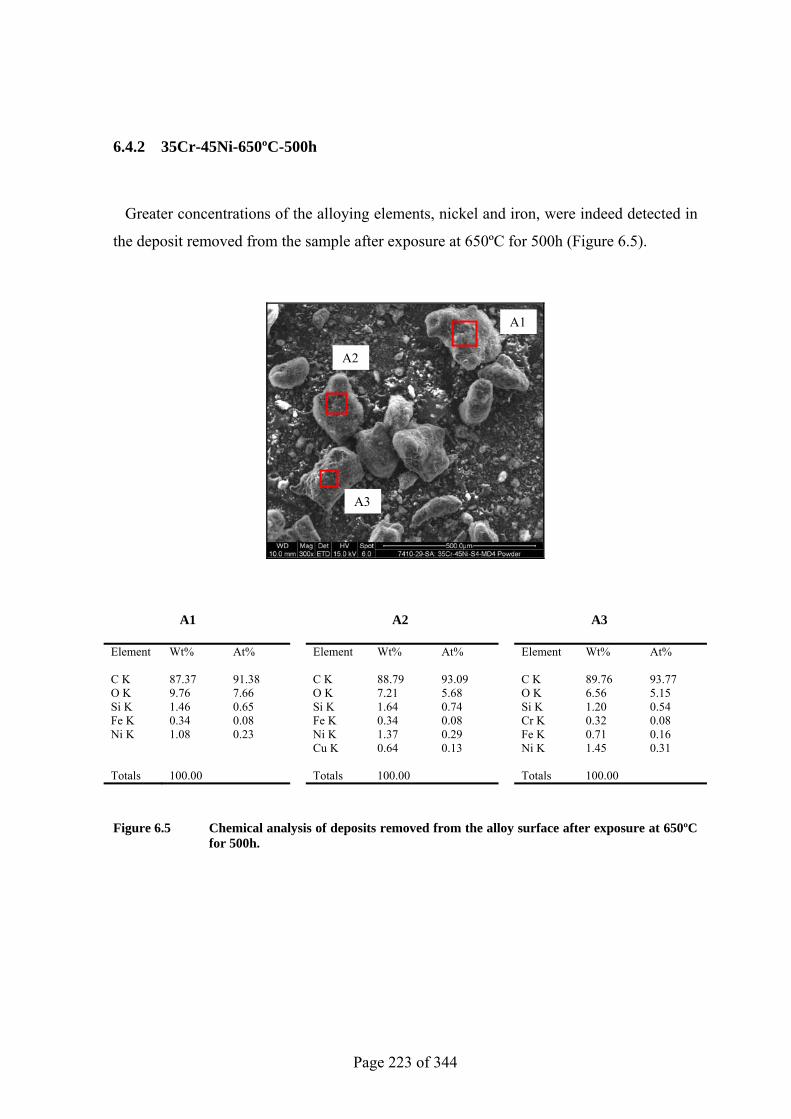
Page 223 of 344
6.4.2 35Cr-45Ni-650ºC-500h
Greater concentrations of the alloying elements, nickel and iron, were indeed detected in
the deposit removed from the sample after exposure at 650ºC for 500h (Figure 6.5).
A1 A2 A3
Element Wt% At% Element Wt% At% Element Wt% At% C K 87.37 91.38 C K 88.79 93.09 C K 89.76 93.77 O K 9.76 7.66 O K 7.21 5.68 O K 6.56 5.15 Si K 1.46 0.65 Si K 1.64 0.74 Si K 1.20 0.54 Fe K 0.34 0.08 Fe K 0.34 0.08 Cr K 0.32 0.08 Ni K 1.08 0.23 Ni K 1.37 0.29 Fe K 0.71 0.16 Cu K 0.64 0.13 Ni K 1.45 0.31 Totals 100.00 Totals 100.00 Totals 100.00
Figure 6.5 Chemical analysis of deposits removed from the alloy surface after exposure at 650ºC for 500h.
A1
A2
A3
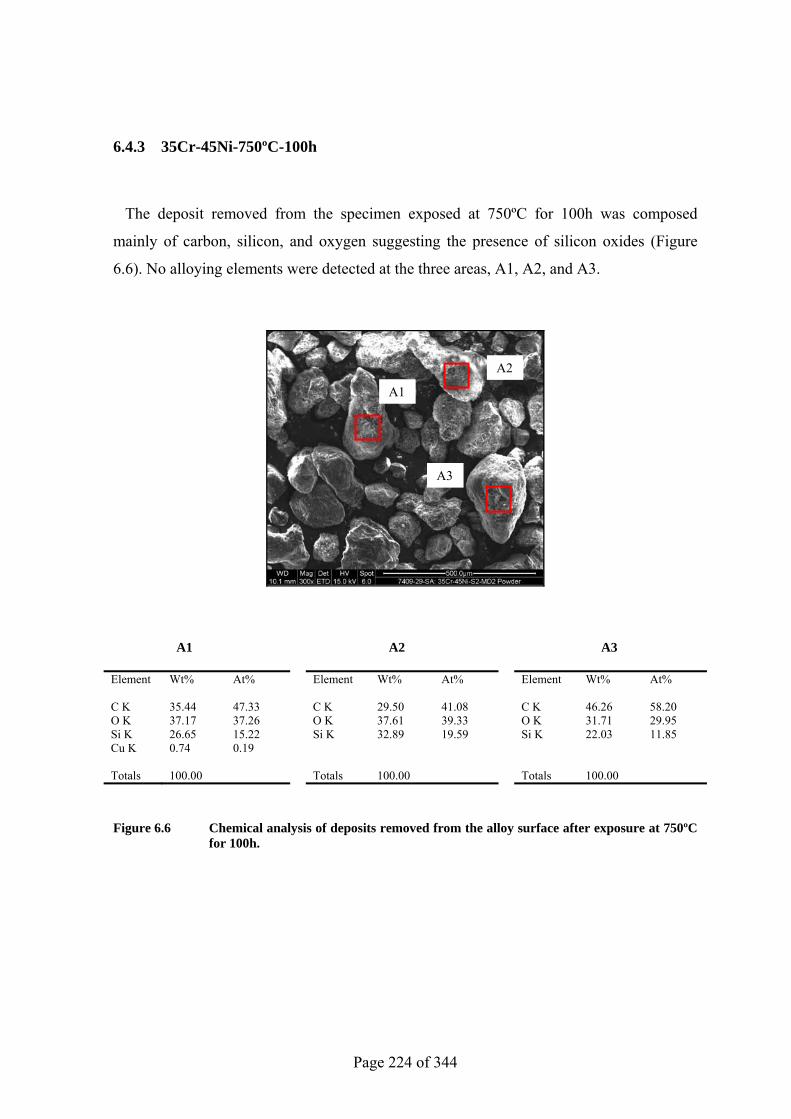
Page 224 of 344
6.4.3 35Cr-45Ni-750ºC-100h
The deposit removed from the specimen exposed at 750ºC for 100h was composed
mainly of carbon, silicon, and oxygen suggesting the presence of silicon oxides (Figure
6.6). No alloying elements were detected at the three areas, A1, A2, and A3.
A1 A2 A3
Element Wt% At% Element Wt% At% Element Wt% At% C K 35.44 47.33 C K 29.50 41.08 C K 46.26 58.20 O K 37.17 37.26 O K 37.61 39.33 O K 31.71 29.95 Si K 26.65 15.22 Si K 32.89 19.59 Si K 22.03 11.85 Cu K 0.74 0.19 Totals 100.00 Totals 100.00 Totals 100.00
Figure 6.6 Chemical analysis of deposits removed from the alloy surface after exposure at 750ºC for 100h.
A1
A2
A3
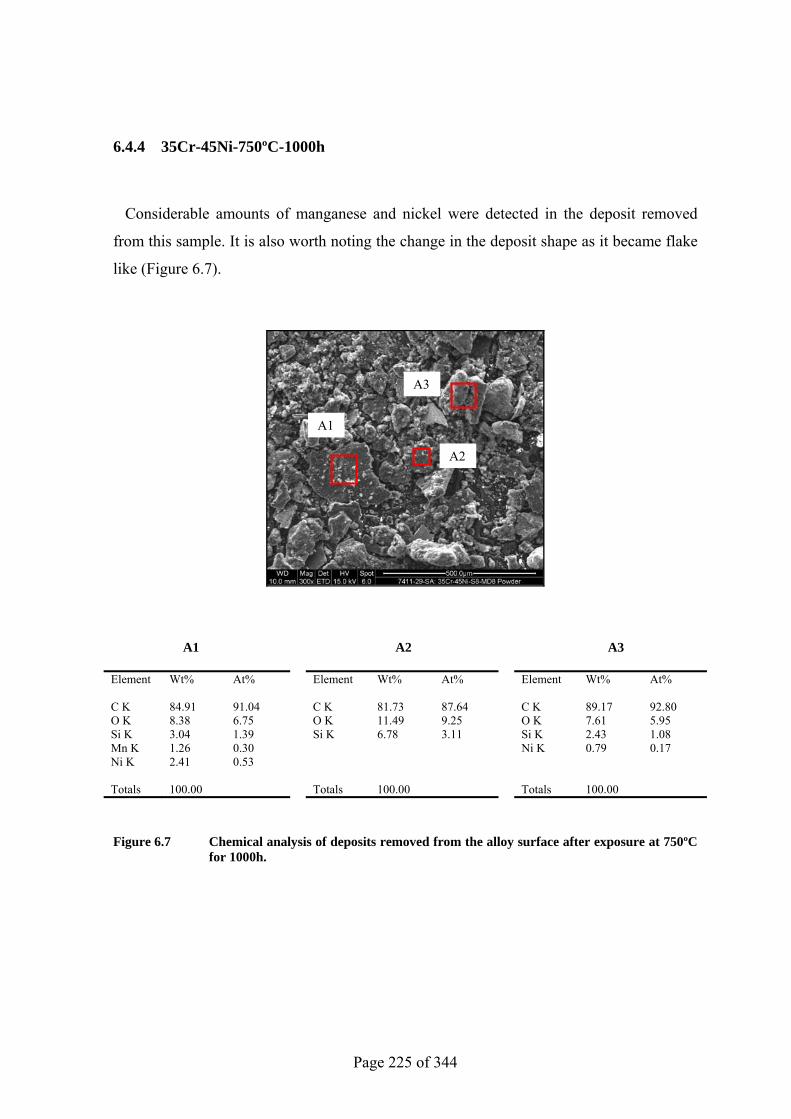
Page 225 of 344
6.4.4 35Cr-45Ni-750ºC-1000h
Considerable amounts of manganese and nickel were detected in the deposit removed
from this sample. It is also worth noting the change in the deposit shape as it became flake
like (Figure 6.7).
A1 A2 A3
Element Wt% At% Element Wt% At% Element Wt% At% C K 84.91 91.04 C K 81.73 87.64 C K 89.17 92.80 O K 8.38 6.75 O K 11.49 9.25 O K 7.61 5.95 Si K 3.04 1.39 Si K 6.78 3.11 Si K 2.43 1.08 Mn K 1.26 0.30 Ni K 0.79 0.17 Ni K 2.41 0.53 Totals 100.00 Totals 100.00 Totals 100.00
Figure 6.7 Chemical analysis of deposits removed from the alloy surface after exposure at 750ºC for 1000h.
A1
A2
A3
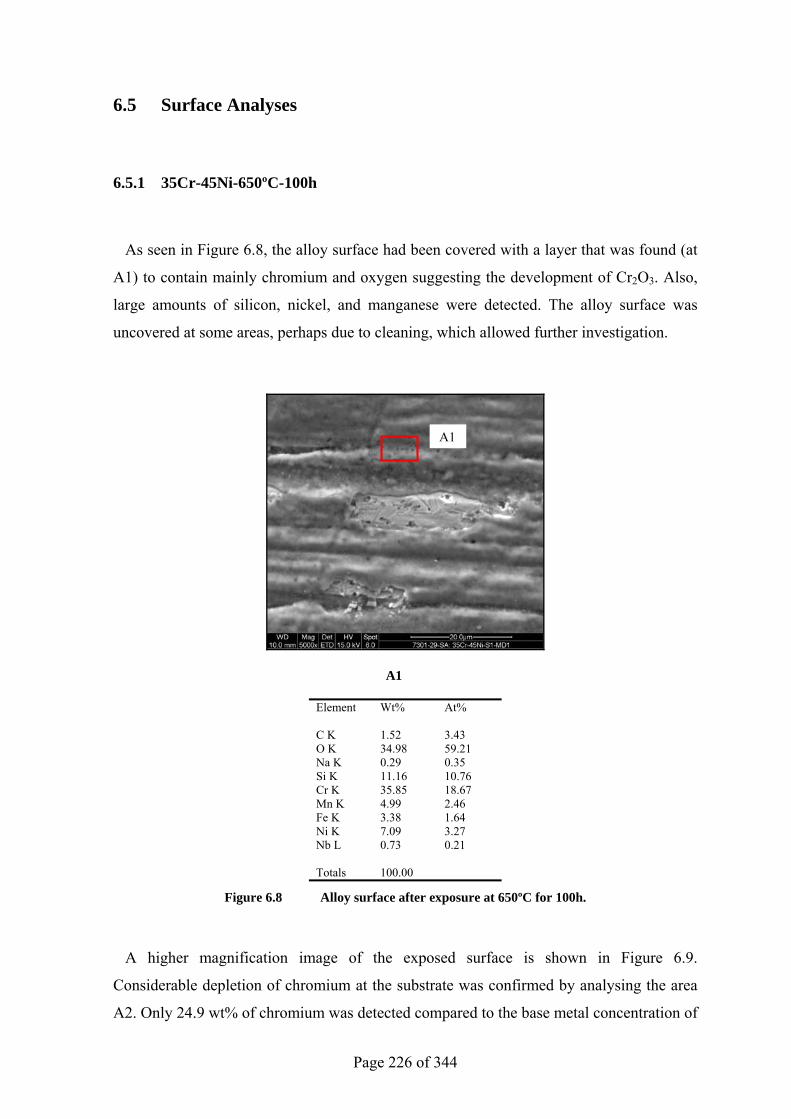
Page 226 of 344
6.5 Surface Analyses
6.5.1 35Cr-45Ni-650ºC-100h
As seen in Figure 6.8, the alloy surface had been covered with a layer that was found (at
A1) to contain mainly chromium and oxygen suggesting the development of Cr2O3. Also,
large amounts of silicon, nickel, and manganese were detected. The alloy surface was
uncovered at some areas, perhaps due to cleaning, which allowed further investigation.
A1
Element Wt% At% C K 1.52 3.43 O K 34.98 59.21 Na K 0.29 0.35 Si K 11.16 10.76 Cr K 35.85 18.67 Mn K 4.99 2.46 Fe K 3.38 1.64 Ni K 7.09 3.27 Nb L 0.73 0.21 Totals 100.00
Figure 6.8 Alloy surface after exposure at 650ºC for 100h.
A higher magnification image of the exposed surface is shown in Figure 6.9.
Considerable depletion of chromium at the substrate was confirmed by analysing the area
A2. Only 24.9 wt% of chromium was detected compared to the base metal concentration of
A1
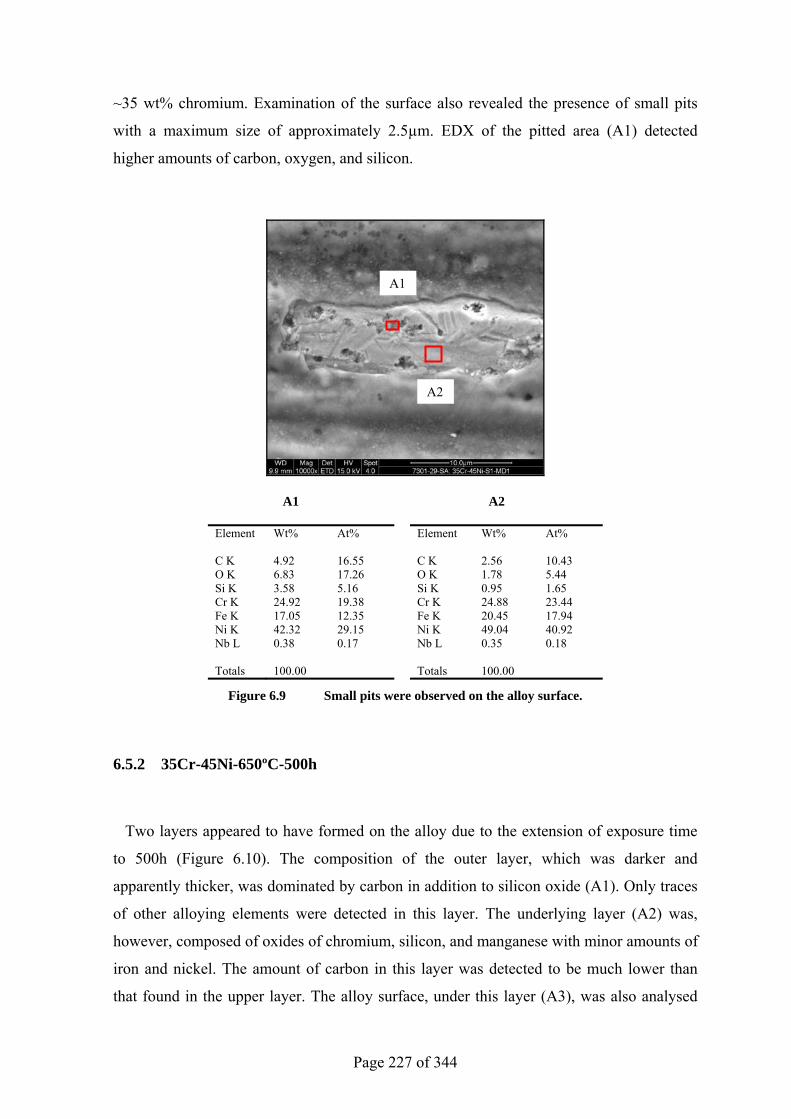
Page 227 of 344
~35 wt% chromium. Examination of the surface also revealed the presence of small pits
with a maximum size of approximately 2.5µm. EDX of the pitted area (A1) detected
higher amounts of carbon, oxygen, and silicon.
A1 A2
Element Wt% At% Element Wt% At% C K 4.92 16.55 C K 2.56 10.43 O K 6.83 17.26 O K 1.78 5.44 Si K 3.58 5.16 Si K 0.95 1.65 Cr K 24.92 19.38 Cr K 24.88 23.44 Fe K 17.05 12.35 Fe K 20.45 17.94 Ni K 42.32 29.15 Ni K 49.04 40.92 Nb L 0.38 0.17 Nb L 0.35 0.18 Totals 100.00 Totals 100.00
Figure 6.9 Small pits were observed on the alloy surface.
6.5.2 35Cr-45Ni-650ºC-500h
Two layers appeared to have formed on the alloy due to the extension of exposure time
to 500h (Figure 6.10). The composition of the outer layer, which was darker and
apparently thicker, was dominated by carbon in addition to silicon oxide (A1). Only traces
of other alloying elements were detected in this layer. The underlying layer (A2) was,
however, composed of oxides of chromium, silicon, and manganese with minor amounts of
iron and nickel. The amount of carbon in this layer was detected to be much lower than
that found in the upper layer. The alloy surface, under this layer (A3), was also analysed
A2
A1
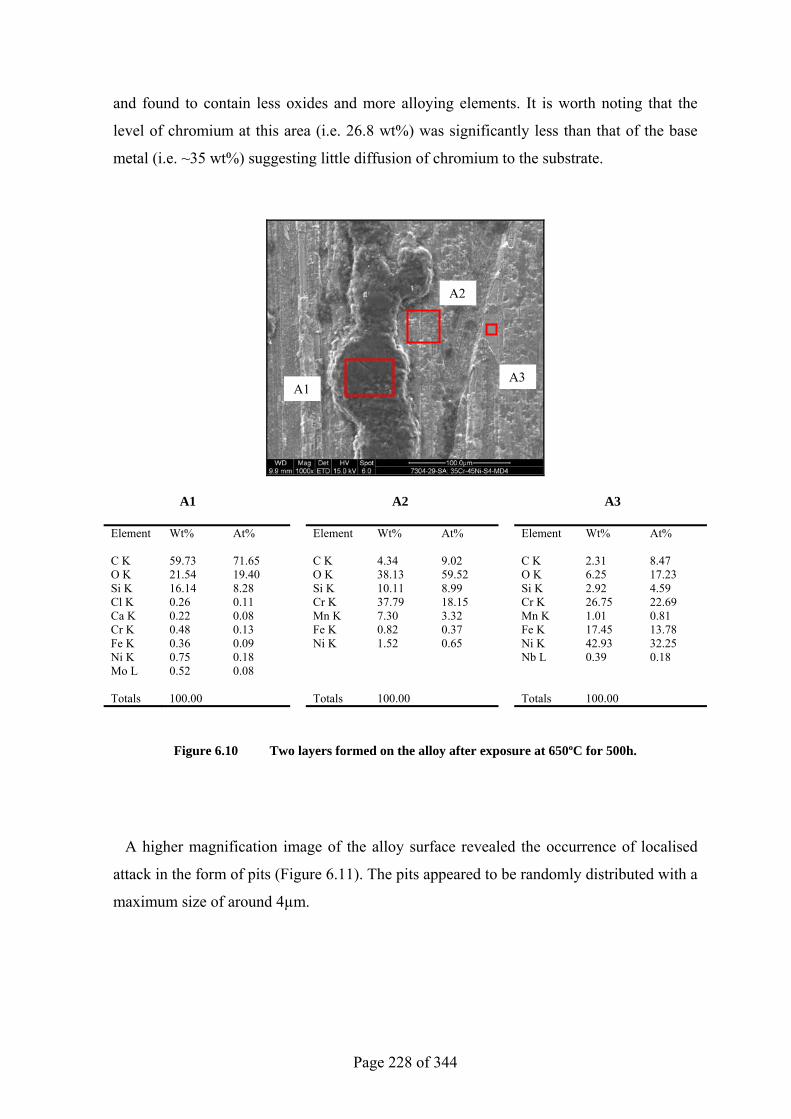
Page 228 of 344
and found to contain less oxides and more alloying elements. It is worth noting that the
level of chromium at this area (i.e. 26.8 wt%) was significantly less than that of the base
metal (i.e. ~35 wt%) suggesting little diffusion of chromium to the substrate.
A1 A2 A3
Element Wt% At% Element Wt% At% Element Wt% At% C K 59.73 71.65 C K 4.34 9.02 C K 2.31 8.47 O K 21.54 19.40 O K 38.13 59.52 O K 6.25 17.23 Si K 16.14 8.28 Si K 10.11 8.99 Si K 2.92 4.59 Cl K 0.26 0.11 Cr K 37.79 18.15 Cr K 26.75 22.69 Ca K 0.22 0.08 Mn K 7.30 3.32 Mn K 1.01 0.81 Cr K 0.48 0.13 Fe K 0.82 0.37 Fe K 17.45 13.78 Fe K 0.36 0.09 Ni K 1.52 0.65 Ni K 42.93 32.25 Ni K 0.75 0.18 Nb L 0.39 0.18 Mo L 0.52 0.08 Totals 100.00 Totals 100.00 Totals 100.00
Figure 6.10 Two layers formed on the alloy after exposure at 650ºC for 500h.
A higher magnification image of the alloy surface revealed the occurrence of localised
attack in the form of pits (Figure 6.11). The pits appeared to be randomly distributed with a
maximum size of around 4µm.
A1
A2
A3
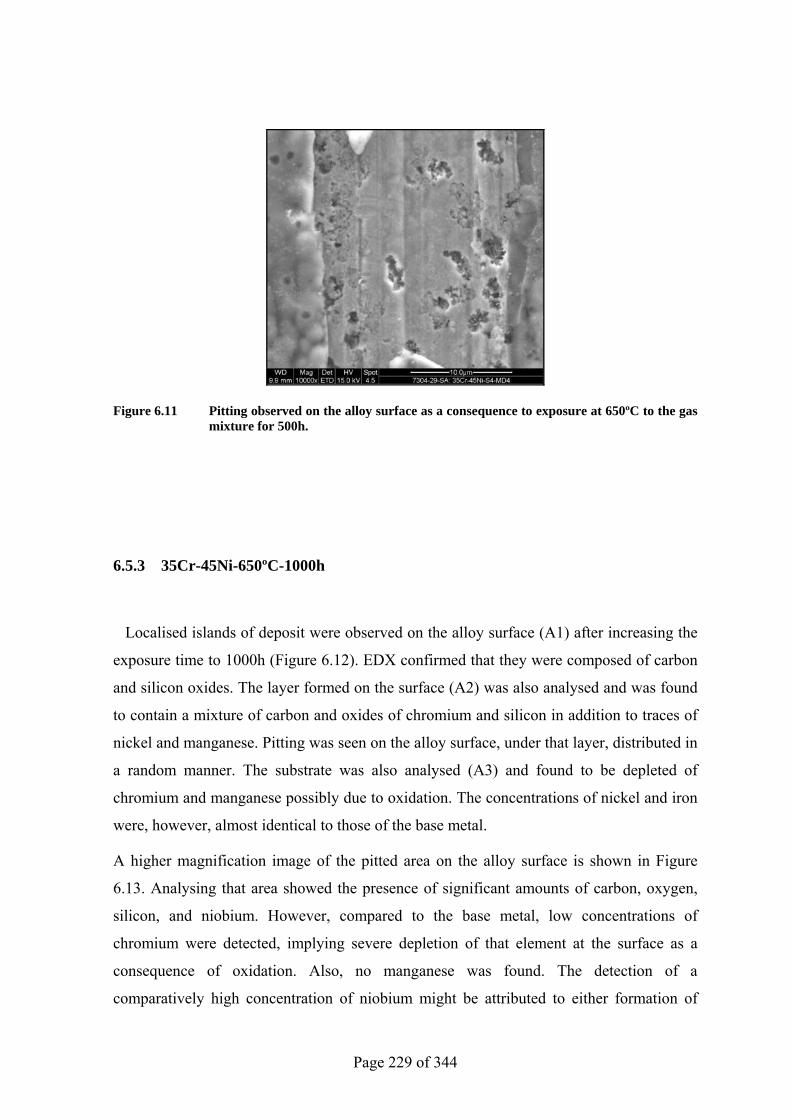
Page 229 of 344
Figure 6.11 Pitting observed on the alloy surface as a consequence to exposure at 650ºC to the gas mixture for 500h.
6.5.3 35Cr-45Ni-650ºC-1000h
Localised islands of deposit were observed on the alloy surface (A1) after increasing the
exposure time to 1000h (Figure 6.12). EDX confirmed that they were composed of carbon
and silicon oxides. The layer formed on the surface (A2) was also analysed and was found
to contain a mixture of carbon and oxides of chromium and silicon in addition to traces of
nickel and manganese. Pitting was seen on the alloy surface, under that layer, distributed in
a random manner. The substrate was also analysed (A3) and found to be depleted of
chromium and manganese possibly due to oxidation. The concentrations of nickel and iron
were, however, almost identical to those of the base metal.
A higher magnification image of the pitted area on the alloy surface is shown in Figure
6.13. Analysing that area showed the presence of significant amounts of carbon, oxygen,
silicon, and niobium. However, compared to the base metal, low concentrations of
chromium were detected, implying severe depletion of that element at the surface as a
consequence of oxidation. Also, no manganese was found. The detection of a
comparatively high concentration of niobium might be attributed to either formation of
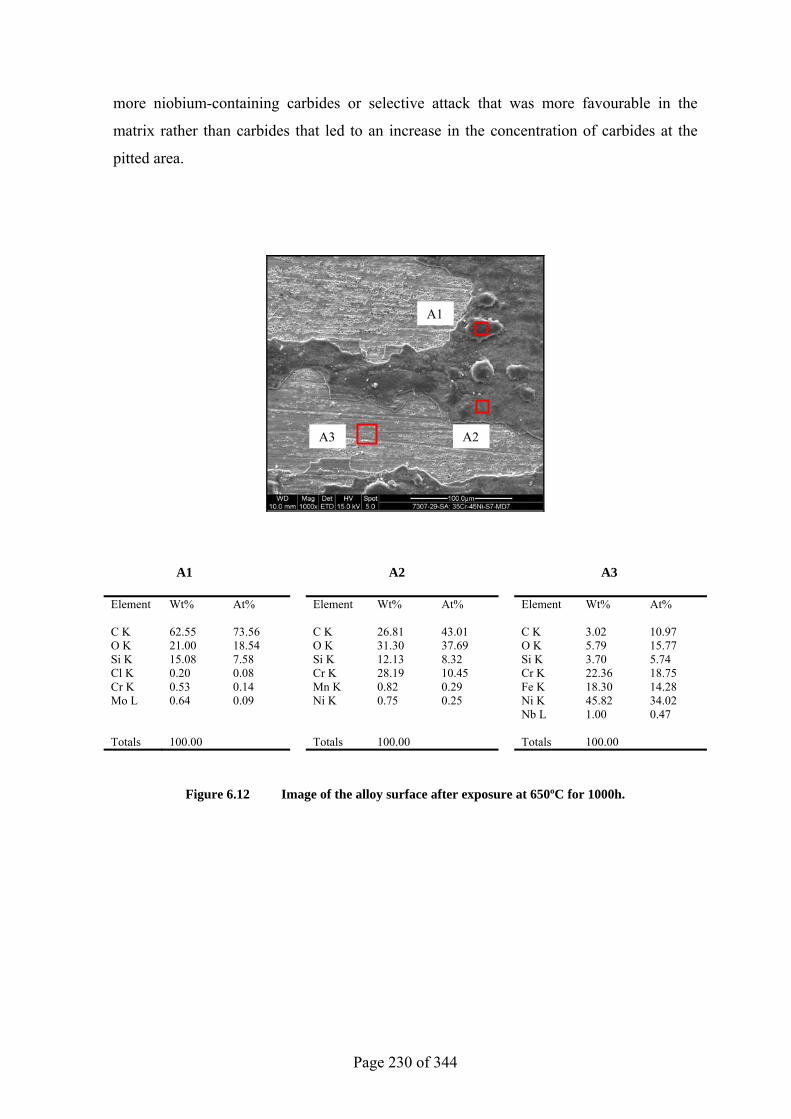
Page 230 of 344
more niobium-containing carbides or selective attack that was more favourable in the
matrix rather than carbides that led to an increase in the concentration of carbides at the
pitted area.
A1 A2 A3
Element Wt% At% Element Wt% At% Element Wt% At% C K 62.55 73.56 C K 26.81 43.01 C K 3.02 10.97 O K 21.00 18.54 O K 31.30 37.69 O K 5.79 15.77 Si K 15.08 7.58 Si K 12.13 8.32 Si K 3.70 5.74 Cl K 0.20 0.08 Cr K 28.19 10.45 Cr K 22.36 18.75 Cr K 0.53 0.14 Mn K 0.82 0.29 Fe K 18.30 14.28 Mo L 0.64 0.09 Ni K 0.75 0.25 Ni K 45.82 34.02 Nb L 1.00 0.47 Totals 100.00 Totals 100.00 Totals 100.00
Figure 6.12 Image of the alloy surface after exposure at 650ºC for 1000h.
A1
A2A3
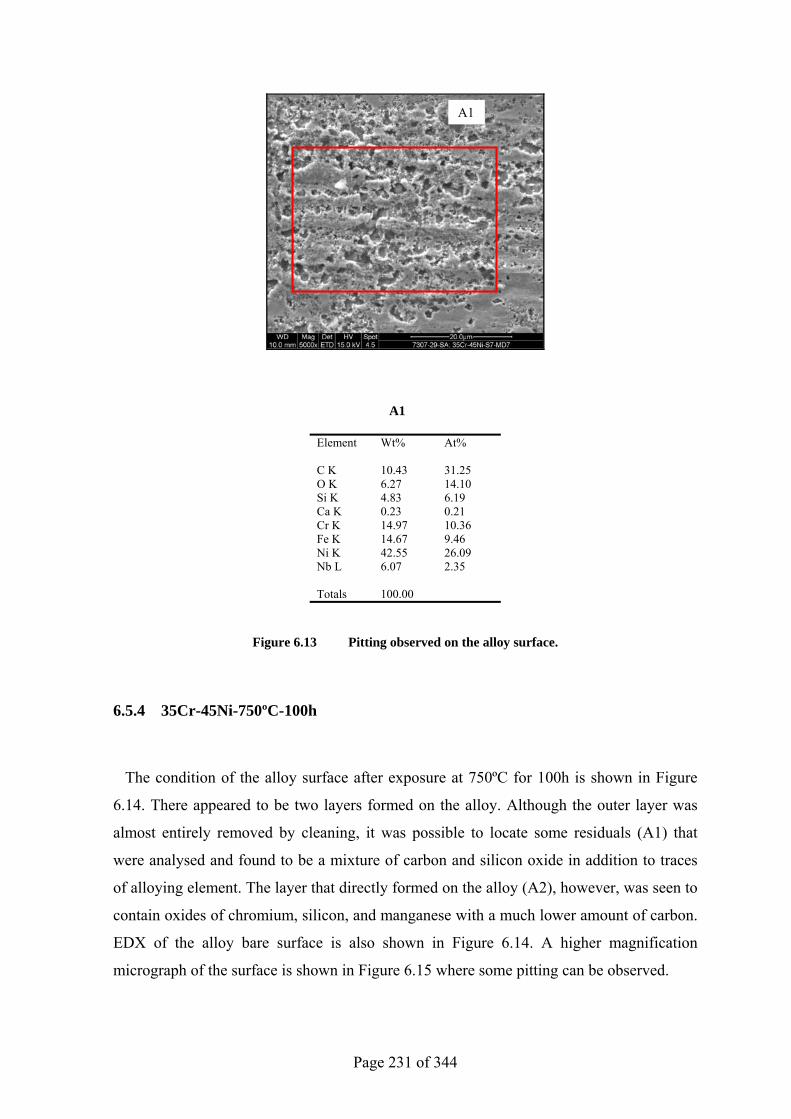
Page 231 of 344
A1
Element Wt% At% C K 10.43 31.25 O K 6.27 14.10 Si K 4.83 6.19 Ca K 0.23 0.21 Cr K 14.97 10.36 Fe K 14.67 9.46 Ni K 42.55 26.09 Nb L 6.07 2.35 Totals 100.00
Figure 6.13 Pitting observed on the alloy surface.
6.5.4 35Cr-45Ni-750ºC-100h
The condition of the alloy surface after exposure at 750ºC for 100h is shown in Figure
6.14. There appeared to be two layers formed on the alloy. Although the outer layer was
almost entirely removed by cleaning, it was possible to locate some residuals (A1) that
were analysed and found to be a mixture of carbon and silicon oxide in addition to traces
of alloying element. The layer that directly formed on the alloy (A2), however, was seen to
contain oxides of chromium, silicon, and manganese with a much lower amount of carbon.
EDX of the alloy bare surface is also shown in Figure 6.14. A higher magnification
micrograph of the surface is shown in Figure 6.15 where some pitting can be observed.
A1
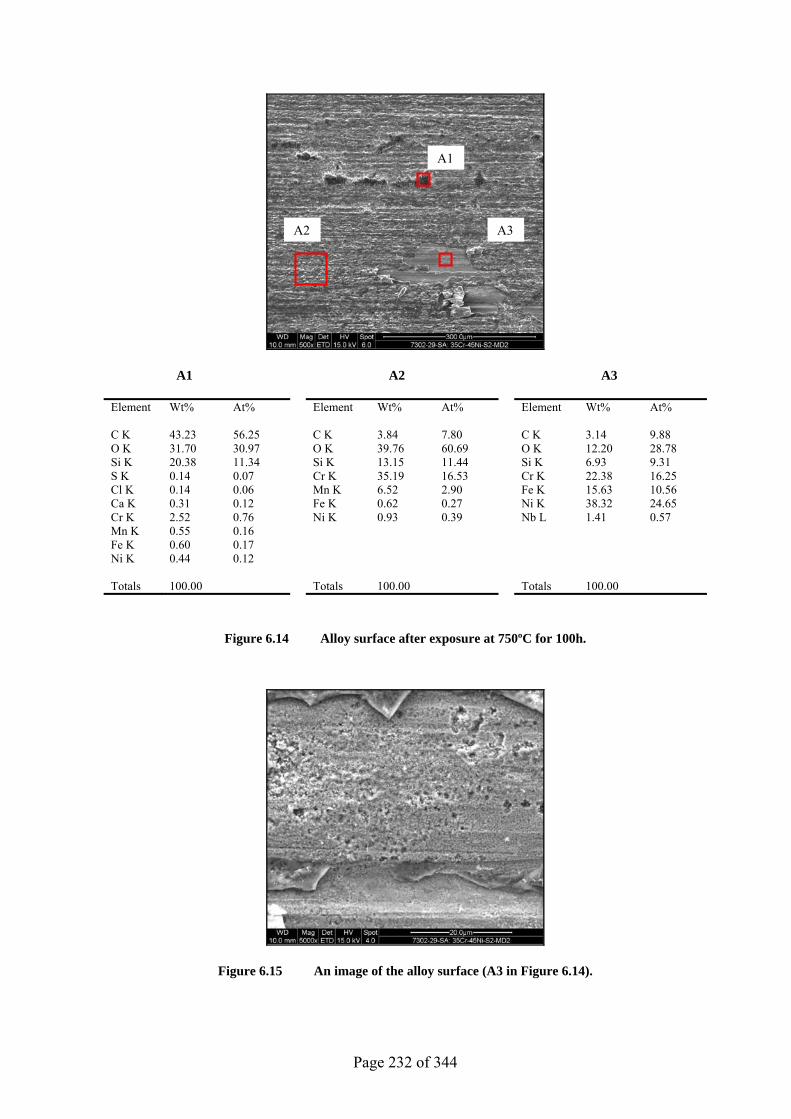
Page 232 of 344
A1 A2 A3
Element Wt% At% Element Wt% At% Element Wt% At% C K 43.23 56.25 C K 3.84 7.80 C K 3.14 9.88 O K 31.70 30.97 O K 39.76 60.69 O K 12.20 28.78 Si K 20.38 11.34 Si K 13.15 11.44 Si K 6.93 9.31 S K 0.14 0.07 Cr K 35.19 16.53 Cr K 22.38 16.25 Cl K 0.14 0.06 Mn K 6.52 2.90 Fe K 15.63 10.56 Ca K 0.31 0.12 Fe K 0.62 0.27 Ni K 38.32 24.65 Cr K 2.52 0.76 Ni K 0.93 0.39 Nb L 1.41 0.57 Mn K 0.55 0.16 Fe K 0.60 0.17 Ni K 0.44 0.12 Totals 100.00 Totals 100.00 Totals 100.00
Figure 6.14 Alloy surface after exposure at 750ºC for 100h.
Figure 6.15 An image of the alloy surface (A3 in Figure 6.14).
A1
A2 A3
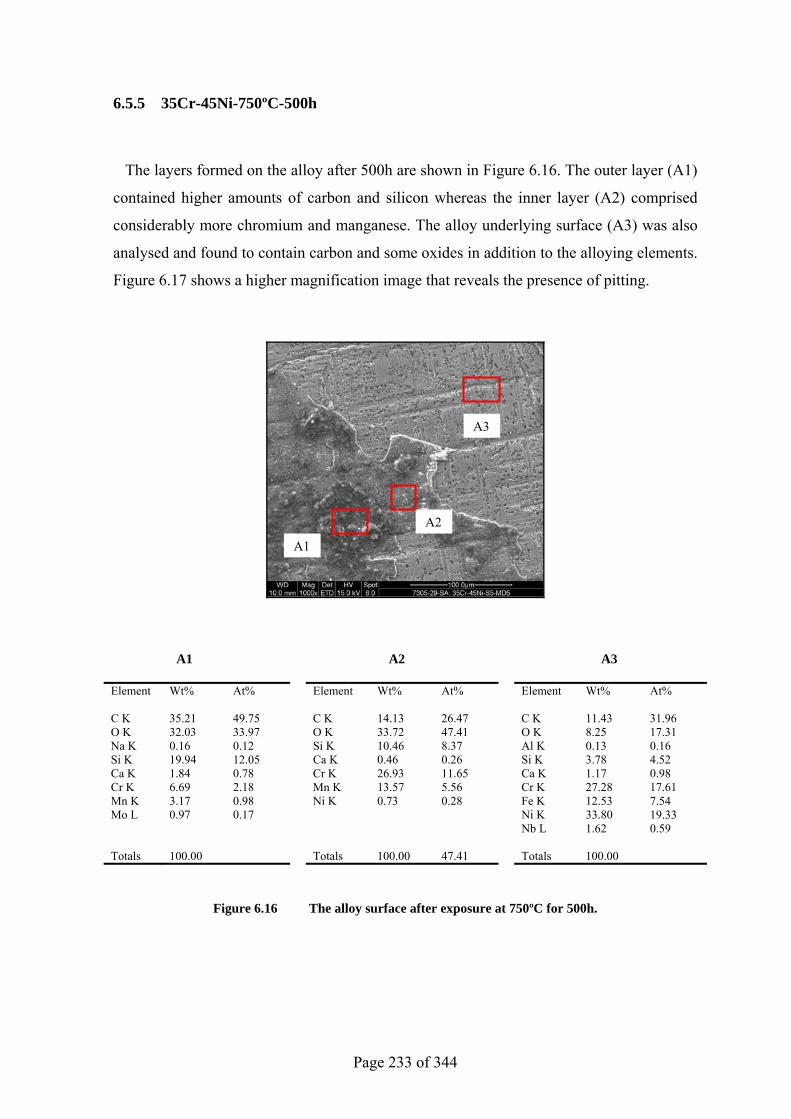
Page 233 of 344
6.5.5 35Cr-45Ni-750ºC-500h
The layers formed on the alloy after 500h are shown in Figure 6.16. The outer layer (A1)
contained higher amounts of carbon and silicon whereas the inner layer (A2) comprised
considerably more chromium and manganese. The alloy underlying surface (A3) was also
analysed and found to contain carbon and some oxides in addition to the alloying elements.
Figure 6.17 shows a higher magnification image that reveals the presence of pitting.
A1 A2 A3
Element Wt% At% Element Wt% At% Element Wt% At% C K 35.21 49.75 C K 14.13 26.47 C K 11.43 31.96 O K 32.03 33.97 O K 33.72 47.41 O K 8.25 17.31 Na K 0.16 0.12 Si K 10.46 8.37 Al K 0.13 0.16 Si K 19.94 12.05 Ca K 0.46 0.26 Si K 3.78 4.52 Ca K 1.84 0.78 Cr K 26.93 11.65 Ca K 1.17 0.98 Cr K 6.69 2.18 Mn K 13.57 5.56 Cr K 27.28 17.61 Mn K 3.17 0.98 Ni K 0.73 0.28 Fe K 12.53 7.54 Mo L 0.97 0.17 Ni K 33.80 19.33 Nb L 1.62 0.59 Totals 100.00 Totals 100.00 47.41 Totals 100.00
Figure 6.16 The alloy surface after exposure at 750ºC for 500h.
A1
A2
A3
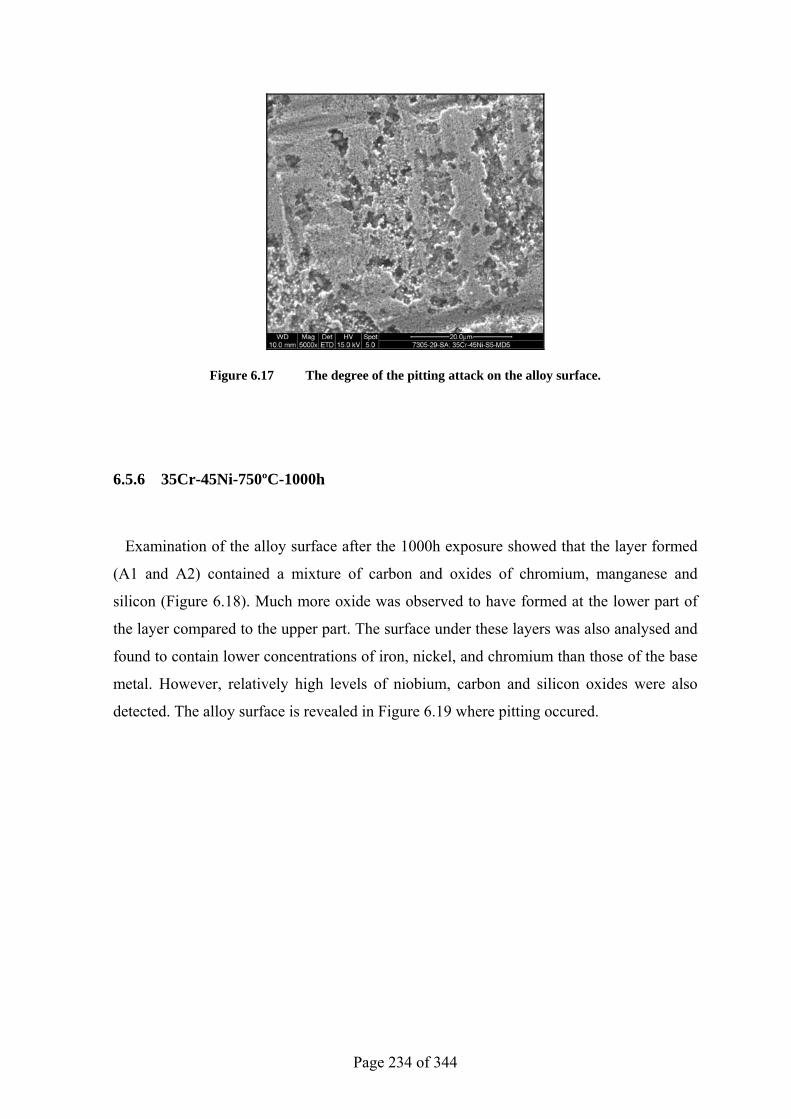
Page 234 of 344
Figure 6.17 The degree of the pitting attack on the alloy surface.
6.5.6 35Cr-45Ni-750ºC-1000h
Examination of the alloy surface after the 1000h exposure showed that the layer formed
(A1 and A2) contained a mixture of carbon and oxides of chromium, manganese and
silicon (Figure 6.18). Much more oxide was observed to have formed at the lower part of
the layer compared to the upper part. The surface under these layers was also analysed and
found to contain lower concentrations of iron, nickel, and chromium than those of the base
metal. However, relatively high levels of niobium, carbon and silicon oxides were also
detected. The alloy surface is revealed in Figure 6.19 where pitting occured.
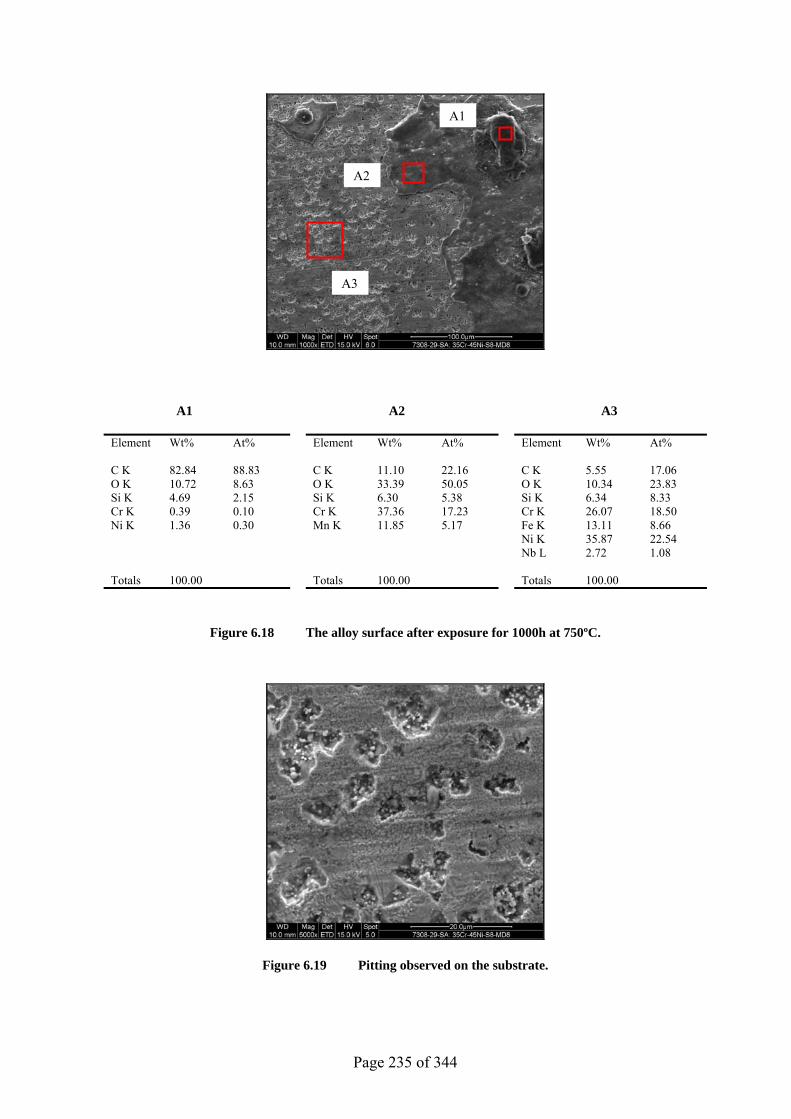
Page 235 of 344
A1 A2 A3
Element Wt% At% Element Wt% At% Element Wt% At% C K 82.84 88.83 C K 11.10 22.16 C K 5.55 17.06 O K 10.72 8.63 O K 33.39 50.05 O K 10.34 23.83 Si K 4.69 2.15 Si K 6.30 5.38 Si K 6.34 8.33 Cr K 0.39 0.10 Cr K 37.36 17.23 Cr K 26.07 18.50 Ni K 1.36 0.30 Mn K 11.85 5.17 Fe K 13.11 8.66 Ni K 35.87 22.54 Nb L 2.72 1.08 Totals 100.00 Totals 100.00 Totals 100.00
Figure 6.18 The alloy surface after exposure for 1000h at 750ºC.
Figure 6.19 Pitting observed on the substrate.
A1
A2
A3
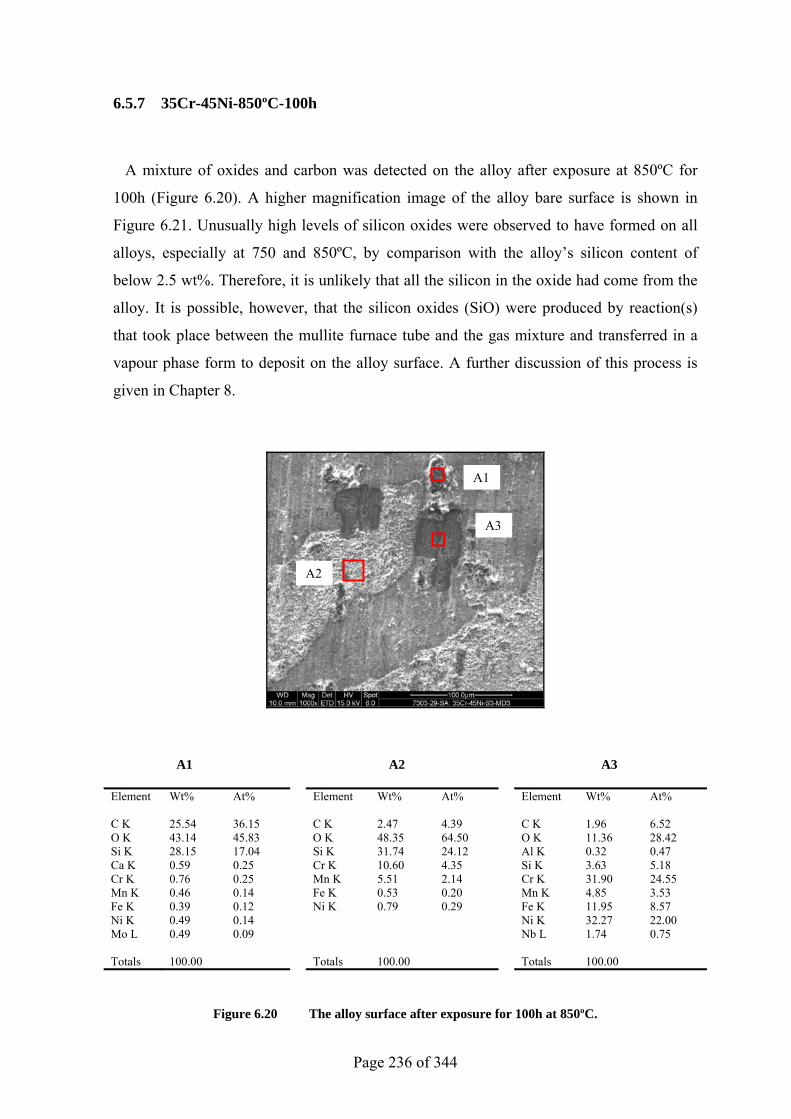
Page 236 of 344
6.5.7 35Cr-45Ni-850ºC-100h
A mixture of oxides and carbon was detected on the alloy after exposure at 850ºC for
100h (Figure 6.20). A higher magnification image of the alloy bare surface is shown in
Figure 6.21. Unusually high levels of silicon oxides were observed to have formed on all
alloys, especially at 750 and 850ºC, by comparison with the alloy’s silicon content of
below 2.5 wt%. Therefore, it is unlikely that all the silicon in the oxide had come from the
alloy. It is possible, however, that the silicon oxides (SiO) were produced by reaction(s)
that took place between the mullite furnace tube and the gas mixture and transferred in a
vapour phase form to deposit on the alloy surface. A further discussion of this process is
given in Chapter 8.
A1 A2 A3
Element Wt% At% Element Wt% At% Element Wt% At% C K 25.54 36.15 C K 2.47 4.39 C K 1.96 6.52 O K 43.14 45.83 O K 48.35 64.50 O K 11.36 28.42 Si K 28.15 17.04 Si K 31.74 24.12 Al K 0.32 0.47 Ca K 0.59 0.25 Cr K 10.60 4.35 Si K 3.63 5.18 Cr K 0.76 0.25 Mn K 5.51 2.14 Cr K 31.90 24.55 Mn K 0.46 0.14 Fe K 0.53 0.20 Mn K 4.85 3.53 Fe K 0.39 0.12 Ni K 0.79 0.29 Fe K 11.95 8.57 Ni K 0.49 0.14 Ni K 32.27 22.00 Mo L 0.49 0.09 Nb L 1.74 0.75 Totals 100.00 Totals 100.00 Totals 100.00
Figure 6.20 The alloy surface after exposure for 100h at 850ºC.
A1
A2
A3
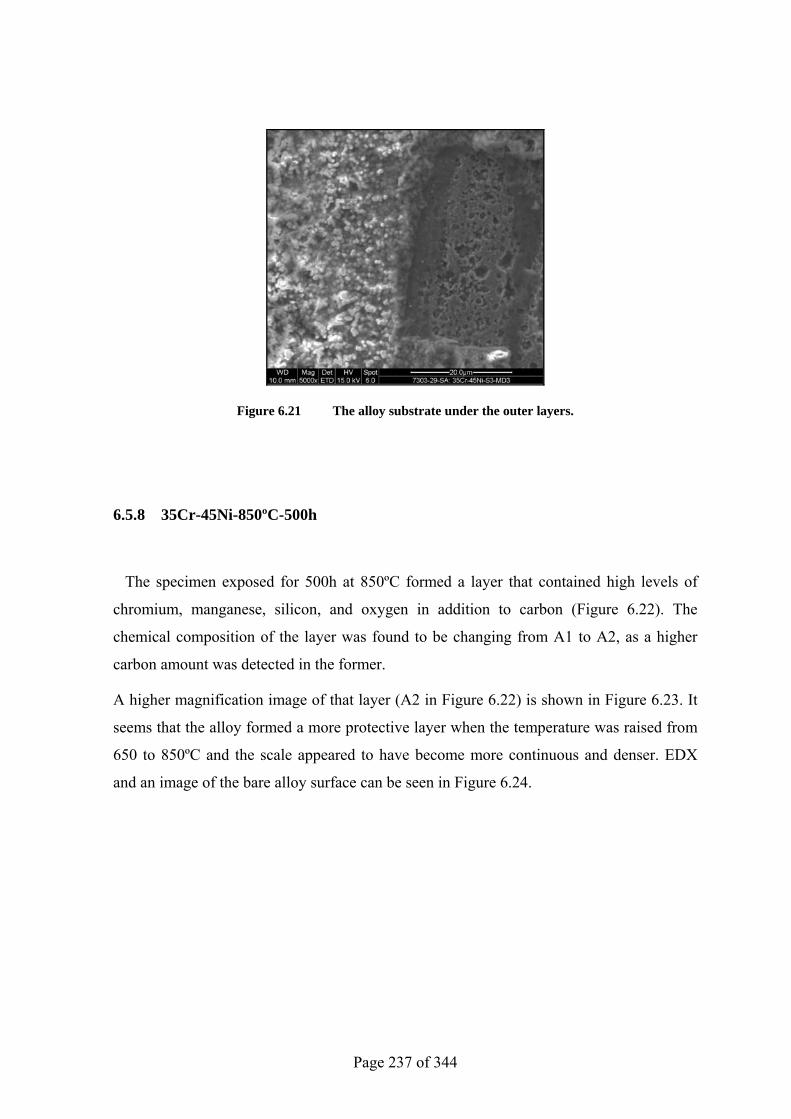
Page 237 of 344
Figure 6.21 The alloy substrate under the outer layers.
6.5.8 35Cr-45Ni-850ºC-500h
The specimen exposed for 500h at 850ºC formed a layer that contained high levels of
chromium, manganese, silicon, and oxygen in addition to carbon (Figure 6.22). The
chemical composition of the layer was found to be changing from A1 to A2, as a higher
carbon amount was detected in the former.
A higher magnification image of that layer (A2 in Figure 6.22) is shown in Figure 6.23. It
seems that the alloy formed a more protective layer when the temperature was raised from
650 to 850ºC and the scale appeared to have become more continuous and denser. EDX
and an image of the bare alloy surface can be seen in Figure 6.24.
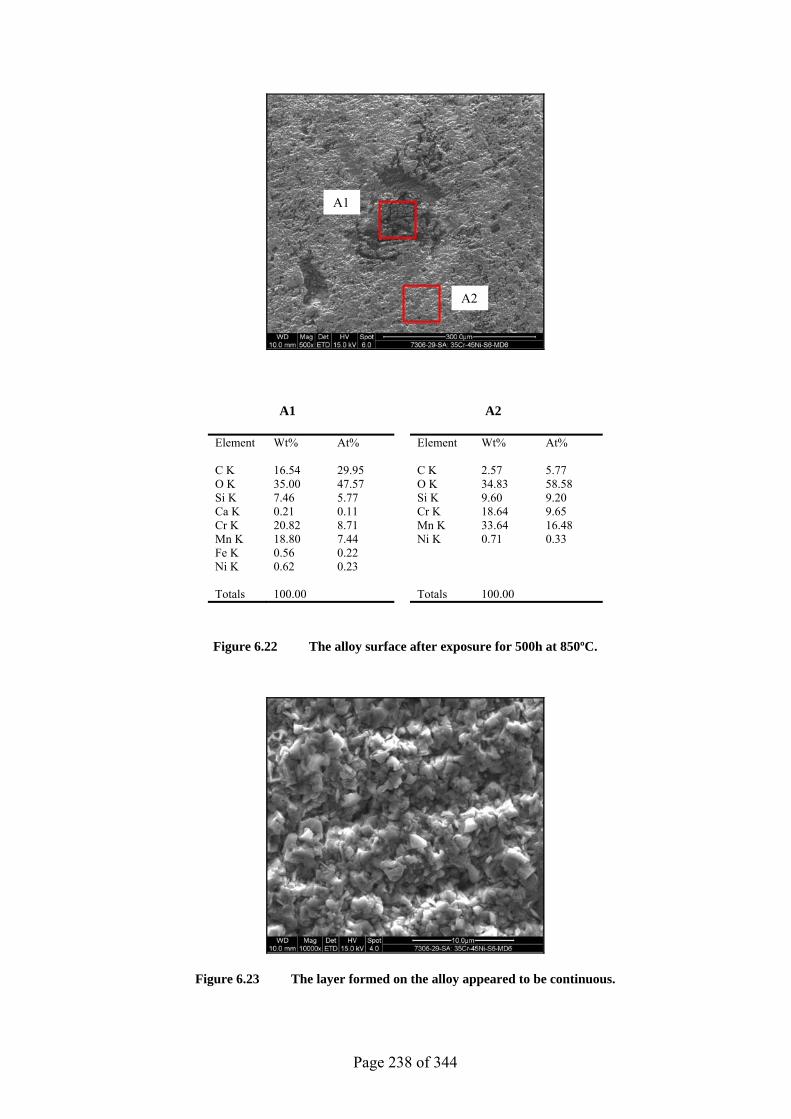
Page 238 of 344
A1 A2
Element Wt% At% Element Wt% At% C K 16.54 29.95 C K 2.57 5.77 O K 35.00 47.57 O K 34.83 58.58 Si K 7.46 5.77 Si K 9.60 9.20 Ca K 0.21 0.11 Cr K 18.64 9.65 Cr K 20.82 8.71 Mn K 33.64 16.48 Mn K 18.80 7.44 Ni K 0.71 0.33 Fe K 0.56 0.22 Ni K 0.62 0.23 Totals 100.00 Totals 100.00
Figure 6.22 The alloy surface after exposure for 500h at 850ºC.
Figure 6.23 The layer formed on the alloy appeared to be continuous.
A1
A2
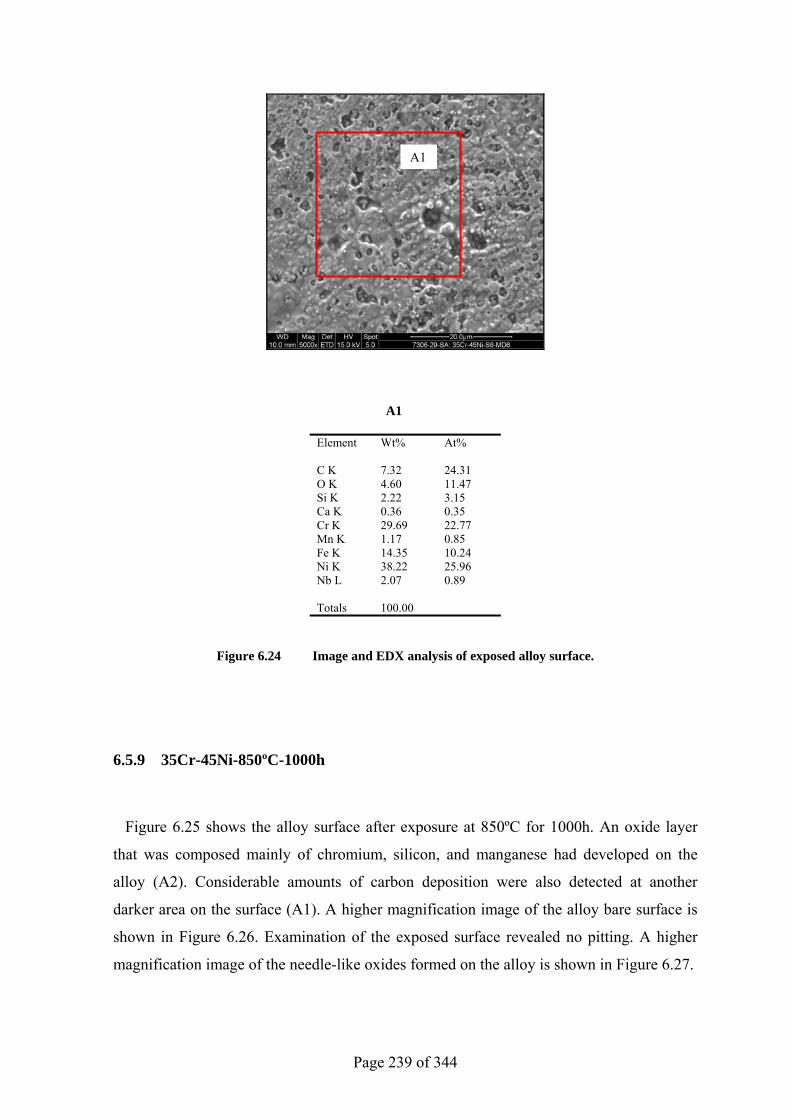
Page 239 of 344
A1
Element Wt% At% C K 7.32 24.31 O K 4.60 11.47 Si K 2.22 3.15 Ca K 0.36 0.35 Cr K 29.69 22.77 Mn K 1.17 0.85 Fe K 14.35 10.24 Ni K 38.22 25.96 Nb L 2.07 0.89 Totals 100.00
Figure 6.24 Image and EDX analysis of exposed alloy surface.
6.5.9 35Cr-45Ni-850ºC-1000h
Figure 6.25 shows the alloy surface after exposure at 850ºC for 1000h. An oxide layer
that was composed mainly of chromium, silicon, and manganese had developed on the
alloy (A2). Considerable amounts of carbon deposition were also detected at another
darker area on the surface (A1). A higher magnification image of the alloy bare surface is
shown in Figure 6.26. Examination of the exposed surface revealed no pitting. A higher
magnification image of the needle-like oxides formed on the alloy is shown in Figure 6.27.
A1
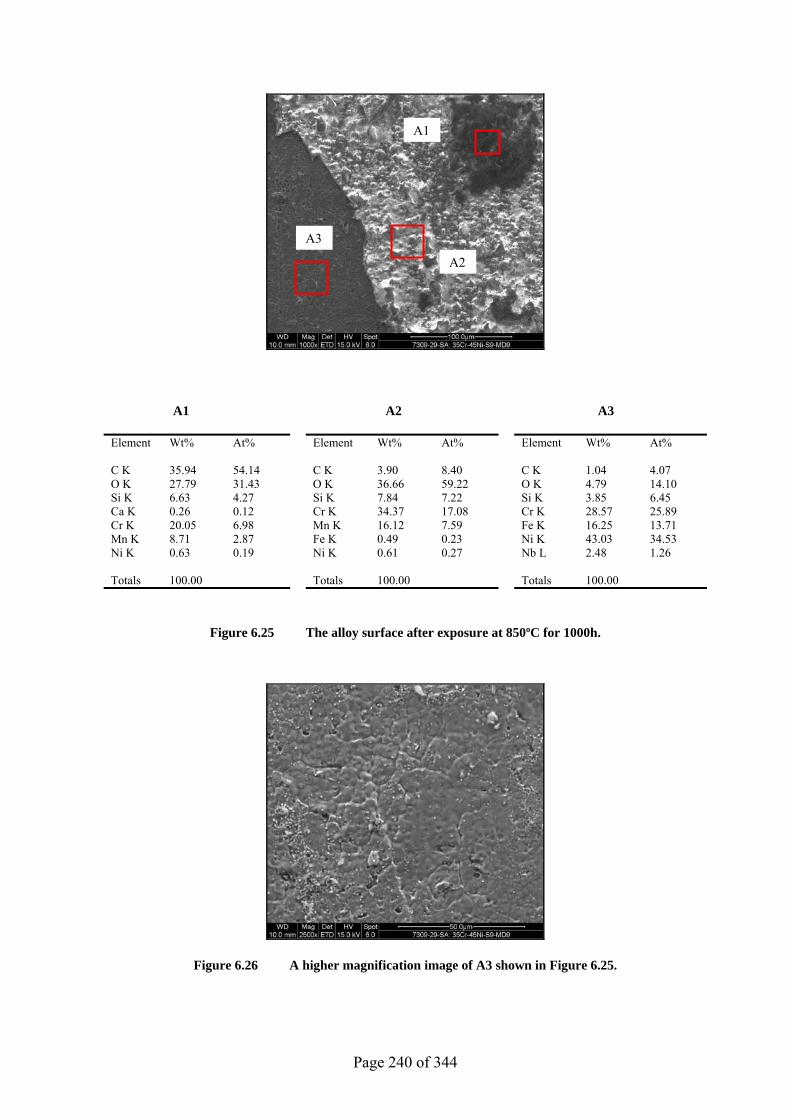
Page 240 of 344
A1 A2 A3
Element Wt% At% Element Wt% At% Element Wt% At% C K 35.94 54.14 C K 3.90 8.40 C K 1.04 4.07 O K 27.79 31.43 O K 36.66 59.22 O K 4.79 14.10 Si K 6.63 4.27 Si K 7.84 7.22 Si K 3.85 6.45 Ca K 0.26 0.12 Cr K 34.37 17.08 Cr K 28.57 25.89 Cr K 20.05 6.98 Mn K 16.12 7.59 Fe K 16.25 13.71 Mn K 8.71 2.87 Fe K 0.49 0.23 Ni K 43.03 34.53 Ni K 0.63 0.19 Ni K 0.61 0.27 Nb L 2.48 1.26 Totals 100.00 Totals 100.00 Totals 100.00
Figure 6.25 The alloy surface after exposure at 850ºC for 1000h.
Figure 6.26 A higher magnification image of A3 shown in Figure 6.25.
A1
A2
A3
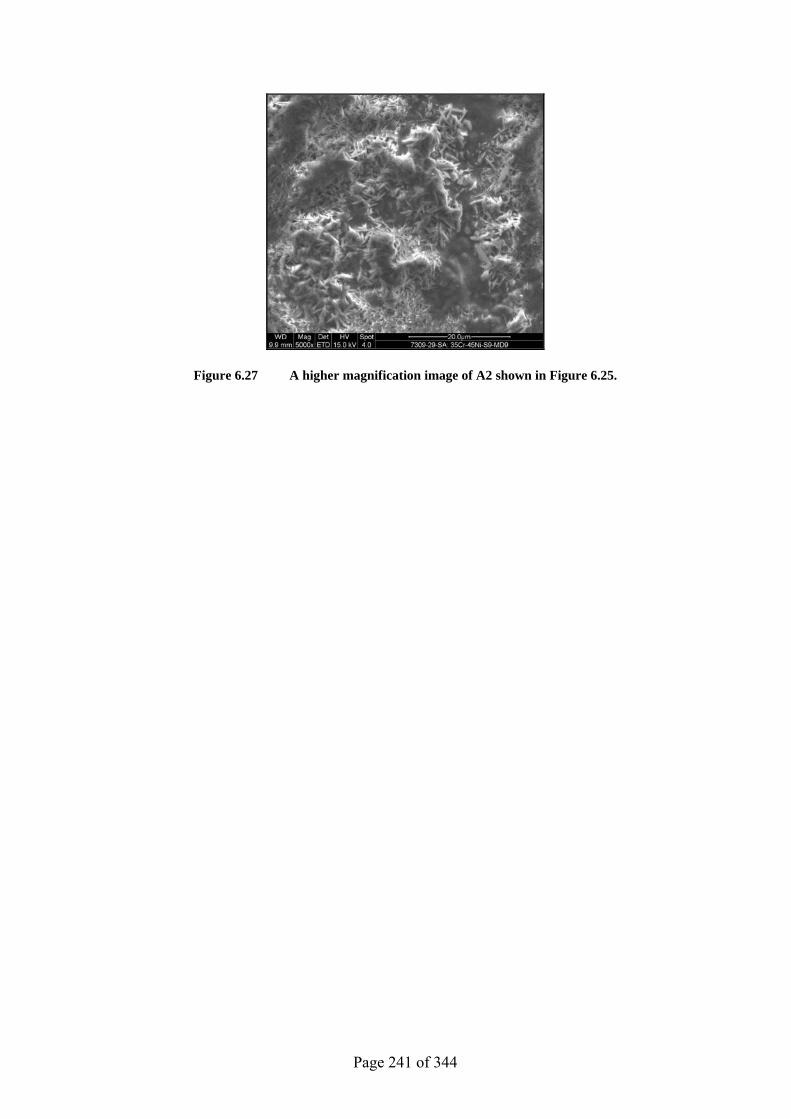
Page 241 of 344
Figure 6.27 A higher magnification image of A2 shown in Figure 6.25.
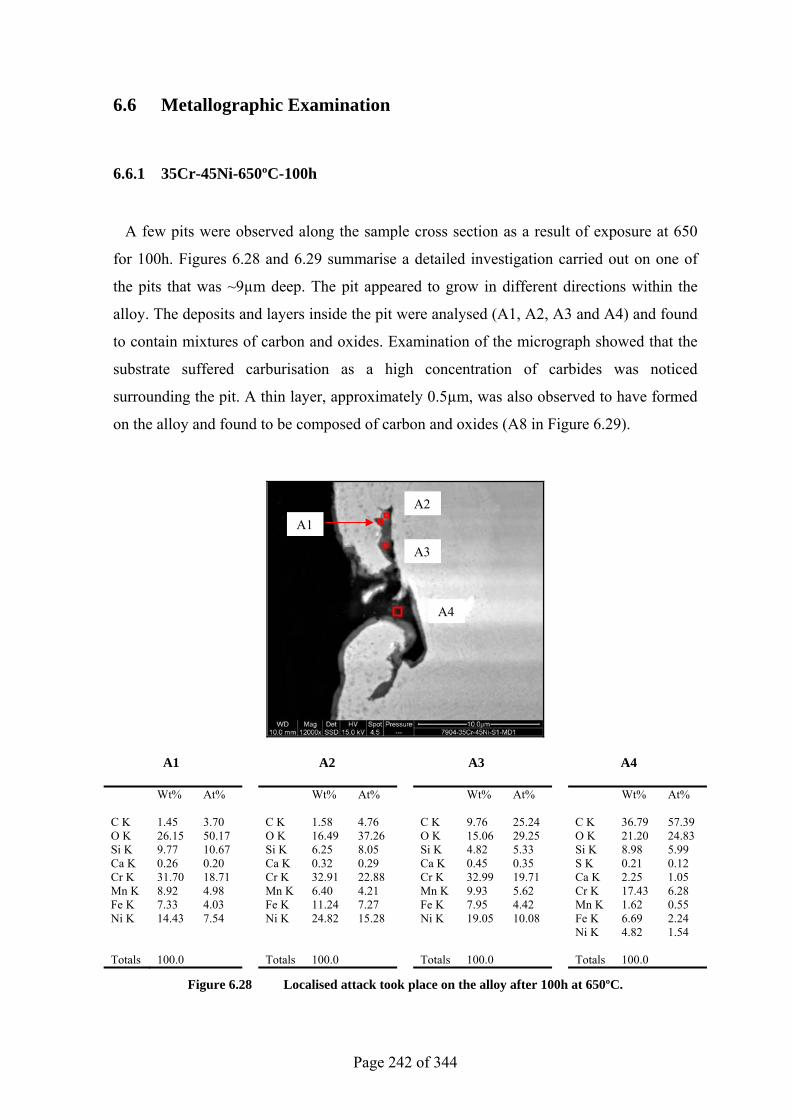
Page 242 of 344
6.6 Metallographic Examination
6.6.1 35Cr-45Ni-650ºC-100h
A few pits were observed along the sample cross section as a result of exposure at 650
for 100h. Figures 6.28 and 6.29 summarise a detailed investigation carried out on one of
the pits that was ~9µm deep. The pit appeared to grow in different directions within the
alloy. The deposits and layers inside the pit were analysed (A1, A2, A3 and A4) and found
to contain mixtures of carbon and oxides. Examination of the micrograph showed that the
substrate suffered carburisation as a high concentration of carbides was noticed
surrounding the pit. A thin layer, approximately 0.5µm, was also observed to have formed
on the alloy and found to be composed of carbon and oxides (A8 in Figure 6.29).
A1 A2 A3 A4
Wt% At% Wt% At% Wt% At% Wt% At% C K 1.45 3.70 C K 1.58 4.76 C K 9.76 25.24 C K 36.79 57.39 O K 26.15 50.17 O K 16.49 37.26 O K 15.06 29.25 O K 21.20 24.83 Si K 9.77 10.67 Si K 6.25 8.05 Si K 4.82 5.33 Si K 8.98 5.99 Ca K 0.26 0.20 Ca K 0.32 0.29 Ca K 0.45 0.35 S K 0.21 0.12 Cr K 31.70 18.71 Cr K 32.91 22.88 Cr K 32.99 19.71 Ca K 2.25 1.05 Mn K 8.92 4.98 Mn K 6.40 4.21 Mn K 9.93 5.62 Cr K 17.43 6.28 Fe K 7.33 4.03 Fe K 11.24 7.27 Fe K 7.95 4.42 Mn K 1.62 0.55 Ni K 14.43 7.54 Ni K 24.82 15.28 Ni K 19.05 10.08 Fe K 6.69 2.24 Ni K 4.82 1.54 Totals 100.0 Totals 100.0 Totals 100.0 Totals 100.0
Figure 6.28 Localised attack took place on the alloy after 100h at 650ºC.
A1 A2
A3
A4
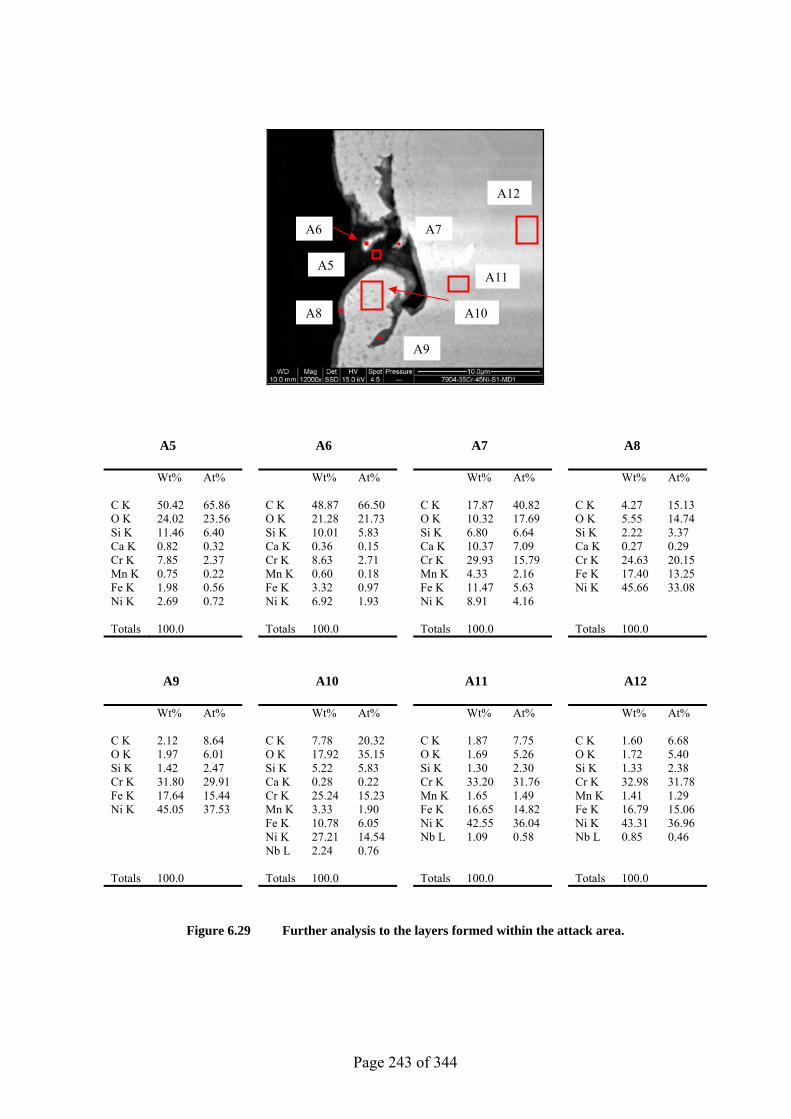
Page 243 of 344
A5 A6 A7 A8
Wt% At% Wt% At% Wt% At% Wt% At% C K 50.42 65.86 C K 48.87 66.50 C K 17.87 40.82 C K 4.27 15.13 O K 24.02 23.56 O K 21.28 21.73 O K 10.32 17.69 O K 5.55 14.74 Si K 11.46 6.40 Si K 10.01 5.83 Si K 6.80 6.64 Si K 2.22 3.37 Ca K 0.82 0.32 Ca K 0.36 0.15 Ca K 10.37 7.09 Ca K 0.27 0.29 Cr K 7.85 2.37 Cr K 8.63 2.71 Cr K 29.93 15.79 Cr K 24.63 20.15 Mn K 0.75 0.22 Mn K 0.60 0.18 Mn K 4.33 2.16 Fe K 17.40 13.25 Fe K 1.98 0.56 Fe K 3.32 0.97 Fe K 11.47 5.63 Ni K 45.66 33.08 Ni K 2.69 0.72 Ni K 6.92 1.93 Ni K 8.91 4.16 Totals 100.0 Totals 100.0 Totals 100.0 Totals 100.0
A9 A10 A11 A12
Wt% At% Wt% At% Wt% At% Wt% At% C K 2.12 8.64 C K 7.78 20.32 C K 1.87 7.75 C K 1.60 6.68 O K 1.97 6.01 O K 17.92 35.15 O K 1.69 5.26 O K 1.72 5.40 Si K 1.42 2.47 Si K 5.22 5.83 Si K 1.30 2.30 Si K 1.33 2.38 Cr K 31.80 29.91 Ca K 0.28 0.22 Cr K 33.20 31.76 Cr K 32.98 31.78 Fe K 17.64 15.44 Cr K 25.24 15.23 Mn K 1.65 1.49 Mn K 1.41 1.29 Ni K 45.05 37.53 Mn K 3.33 1.90 Fe K 16.65 14.82 Fe K 16.79 15.06 Fe K 10.78 6.05 Ni K 42.55 36.04 Ni K 43.31 36.96 Ni K 27.21 14.54 Nb L 1.09 0.58 Nb L 0.85 0.46 Nb L 2.24 0.76 Totals 100.0 Totals 100.0 Totals 100.0 Totals 100.0
Figure 6.29 Further analysis to the layers formed within the attack area.
A5
A6 A7
A8
A9
A10
A11
A12
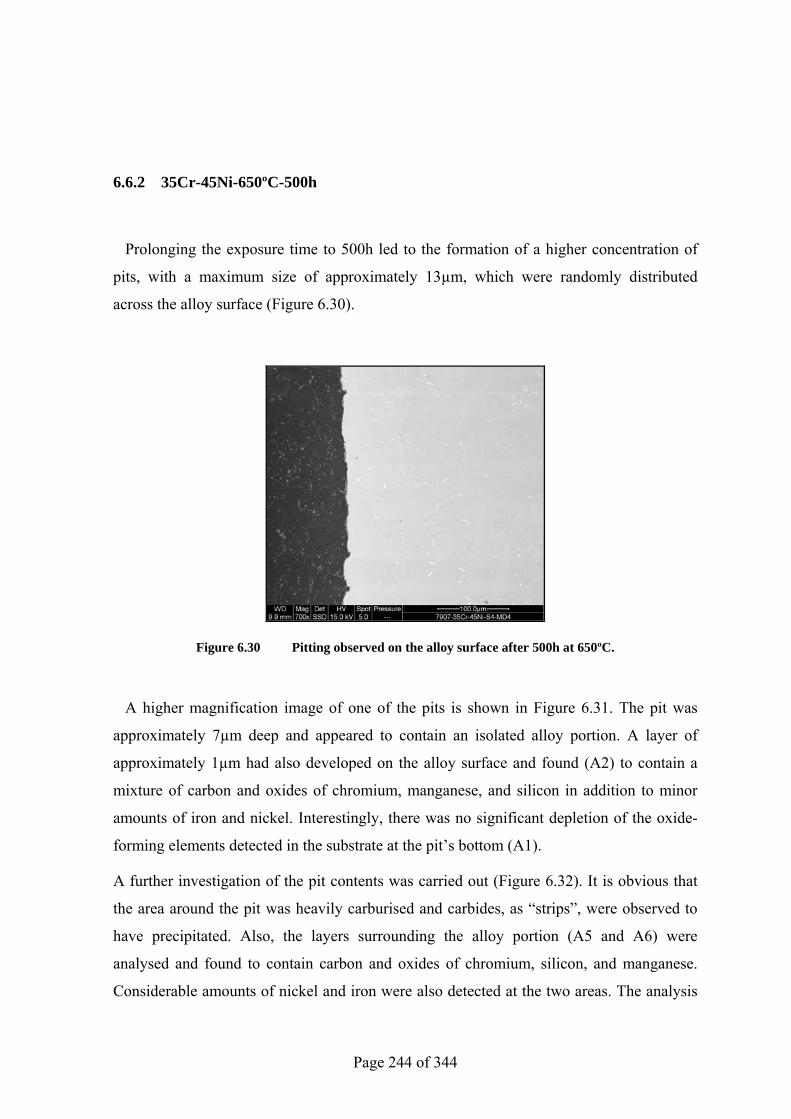
Page 244 of 344
6.6.2 35Cr-45Ni-650ºC-500h
Prolonging the exposure time to 500h led to the formation of a higher concentration of
pits, with a maximum size of approximately 13µm, which were randomly distributed
across the alloy surface (Figure 6.30).
Figure 6.30 Pitting observed on the alloy surface after 500h at 650ºC.
A higher magnification image of one of the pits is shown in Figure 6.31. The pit was
approximately 7µm deep and appeared to contain an isolated alloy portion. A layer of
approximately 1µm had also developed on the alloy surface and found (A2) to contain a
mixture of carbon and oxides of chromium, manganese, and silicon in addition to minor
amounts of iron and nickel. Interestingly, there was no significant depletion of the oxide-
forming elements detected in the substrate at the pit’s bottom (A1).
A further investigation of the pit contents was carried out (Figure 6.32). It is obvious that
the area around the pit was heavily carburised and carbides, as “strips”, were observed to
have precipitated. Also, the layers surrounding the alloy portion (A5 and A6) were
analysed and found to contain carbon and oxides of chromium, silicon, and manganese.
Considerable amounts of nickel and iron were also detected at the two areas. The analysis
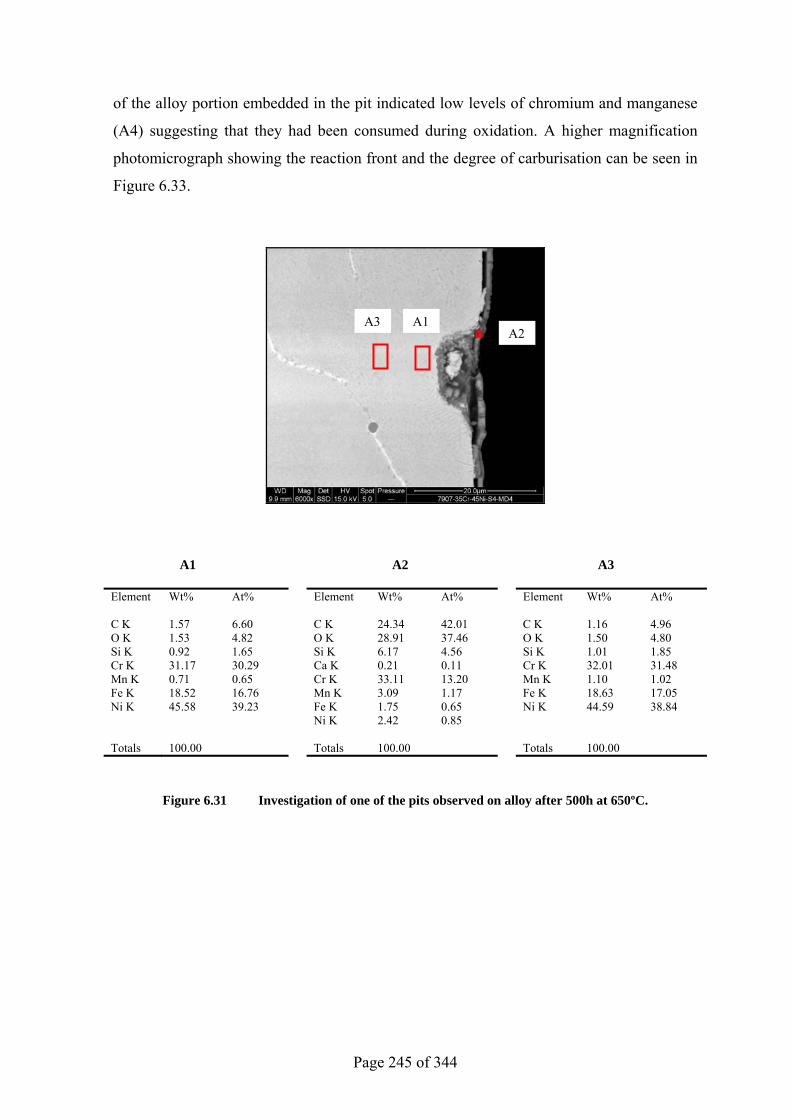
Page 245 of 344
of the alloy portion embedded in the pit indicated low levels of chromium and manganese
(A4) suggesting that they had been consumed during oxidation. A higher magnification
photomicrograph showing the reaction front and the degree of carburisation can be seen in
Figure 6.33.
A1 A2 A3
Element Wt% At% Element Wt% At% Element Wt% At% C K 1.57 6.60 C K 24.34 42.01 C K 1.16 4.96 O K 1.53 4.82 O K 28.91 37.46 O K 1.50 4.80 Si K 0.92 1.65 Si K 6.17 4.56 Si K 1.01 1.85 Cr K 31.17 30.29 Ca K 0.21 0.11 Cr K 32.01 31.48 Mn K 0.71 0.65 Cr K 33.11 13.20 Mn K 1.10 1.02 Fe K 18.52 16.76 Mn K 3.09 1.17 Fe K 18.63 17.05 Ni K 45.58 39.23 Fe K 1.75 0.65 Ni K 44.59 38.84 Ni K 2.42 0.85 Totals 100.00 Totals 100.00 Totals 100.00
Figure 6.31 Investigation of one of the pits observed on alloy after 500h at 650ºC.
A1A2
A3
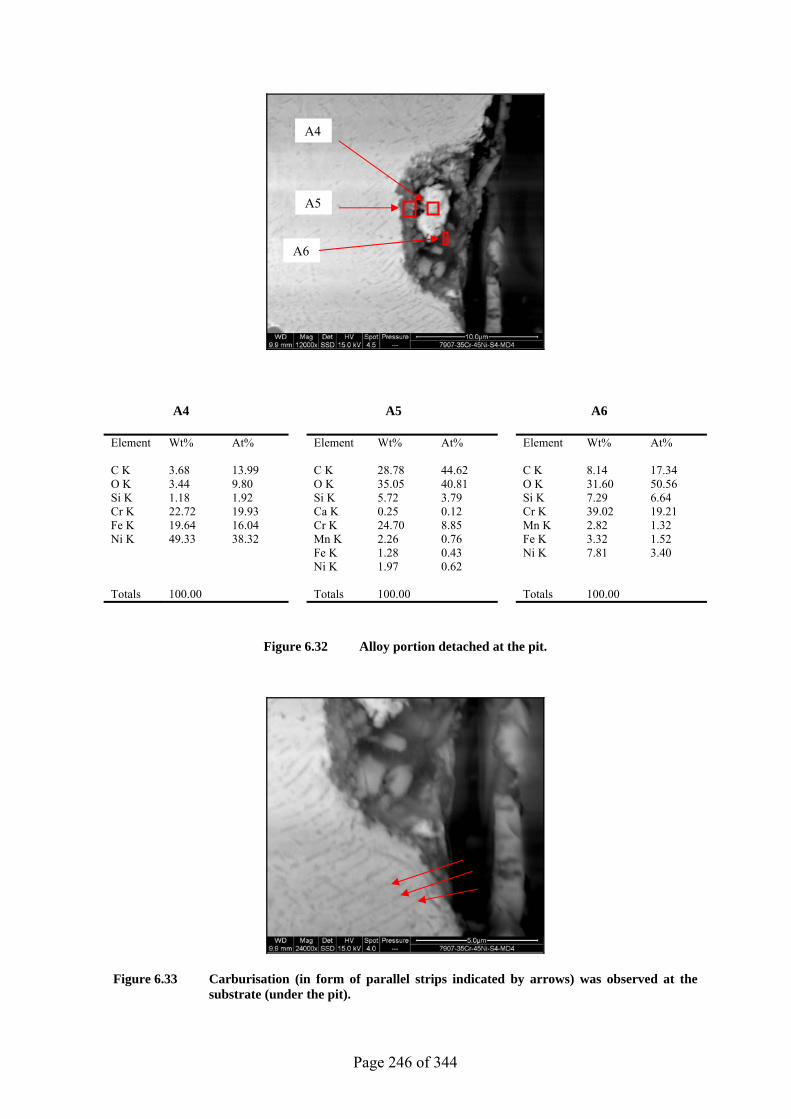
Page 246 of 344
A4 A5 A6
Element Wt% At% Element Wt% At% Element Wt% At% C K 3.68 13.99 C K 28.78 44.62 C K 8.14 17.34 O K 3.44 9.80 O K 35.05 40.81 O K 31.60 50.56 Si K 1.18 1.92 Si K 5.72 3.79 Si K 7.29 6.64 Cr K 22.72 19.93 Ca K 0.25 0.12 Cr K 39.02 19.21 Fe K 19.64 16.04 Cr K 24.70 8.85 Mn K 2.82 1.32 Ni K 49.33 38.32 Mn K 2.26 0.76 Fe K 3.32 1.52 Fe K 1.28 0.43 Ni K 7.81 3.40 Ni K 1.97 0.62 Totals 100.00 Totals 100.00 Totals 100.00
Figure 6.32 Alloy portion detached at the pit.
Figure 6.33 Carburisation (in form of parallel strips indicated by arrows) was observed at the substrate (under the pit).
A4
A6
A5
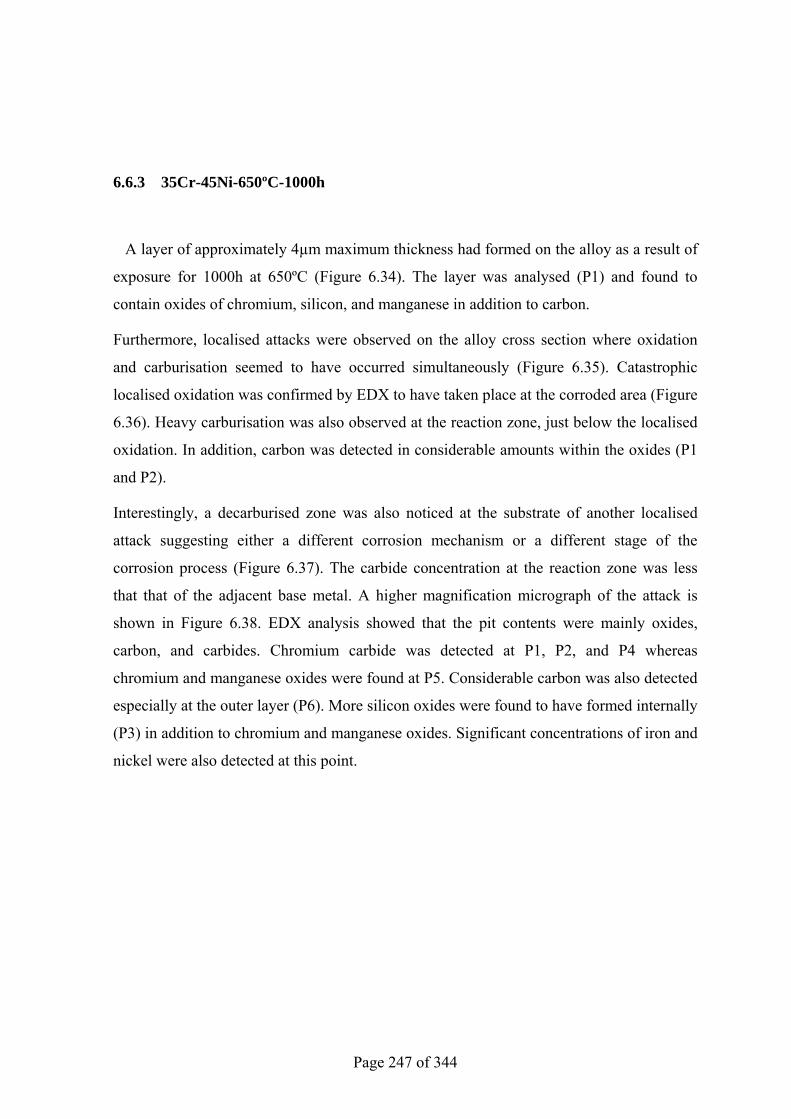
Page 247 of 344
6.6.3 35Cr-45Ni-650ºC-1000h
A layer of approximately 4µm maximum thickness had formed on the alloy as a result of
exposure for 1000h at 650ºC (Figure 6.34). The layer was analysed (P1) and found to
contain oxides of chromium, silicon, and manganese in addition to carbon.
Furthermore, localised attacks were observed on the alloy cross section where oxidation
and carburisation seemed to have occurred simultaneously (Figure 6.35). Catastrophic
localised oxidation was confirmed by EDX to have taken place at the corroded area (Figure
6.36). Heavy carburisation was also observed at the reaction zone, just below the localised
oxidation. In addition, carbon was detected in considerable amounts within the oxides (P1
and P2).
Interestingly, a decarburised zone was also noticed at the substrate of another localised
attack suggesting either a different corrosion mechanism or a different stage of the
corrosion process (Figure 6.37). The carbide concentration at the reaction zone was less
that that of the adjacent base metal. A higher magnification micrograph of the attack is
shown in Figure 6.38. EDX analysis showed that the pit contents were mainly oxides,
carbon, and carbides. Chromium carbide was detected at P1, P2, and P4 whereas
chromium and manganese oxides were found at P5. Considerable carbon was also detected
especially at the outer layer (P6). More silicon oxides were found to have formed internally
(P3) in addition to chromium and manganese oxides. Significant concentrations of iron and
nickel were also detected at this point.
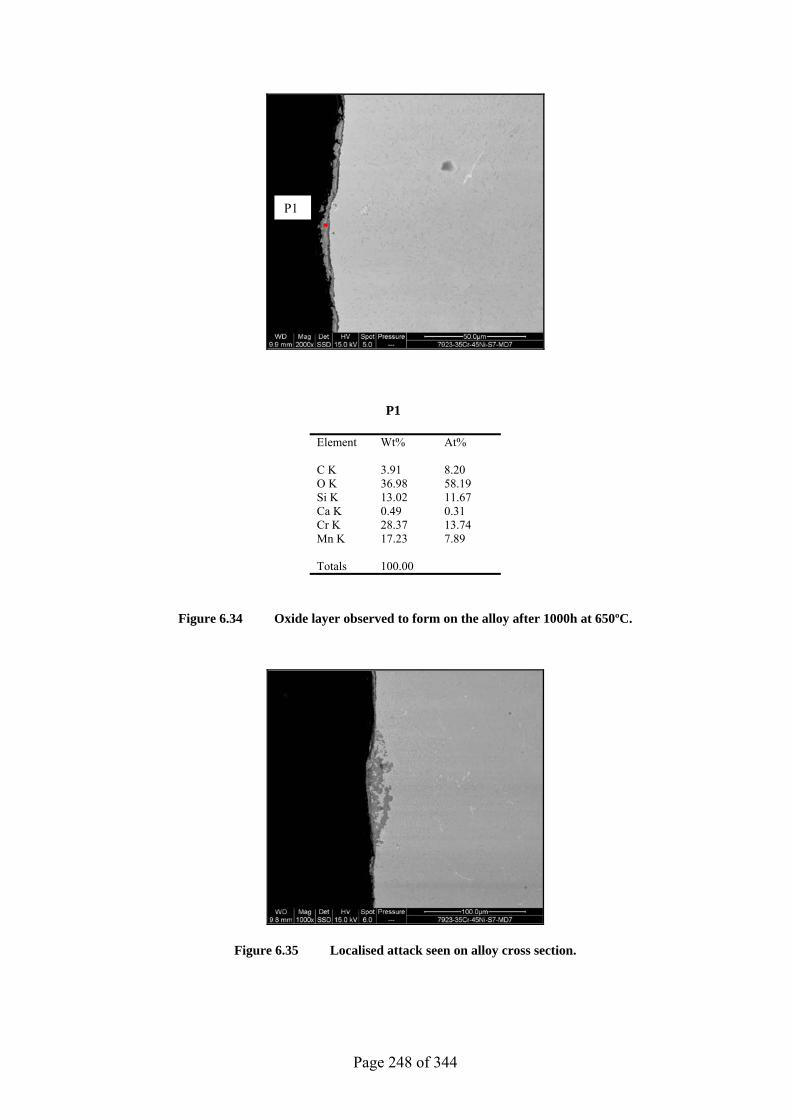
Page 248 of 344
P1
Element Wt% At% C K 3.91 8.20 O K 36.98 58.19 Si K 13.02 11.67 Ca K 0.49 0.31 Cr K 28.37 13.74 Mn K 17.23 7.89 Totals 100.00
Figure 6.34 Oxide layer observed to form on the alloy after 1000h at 650ºC.
Figure 6.35 Localised attack seen on alloy cross section.
P1
Page 249 of 344
P1 P2 P3
Element Wt% At% Element Wt% At% Element Wt% At% C K 12.09 27.05 C K 7.30 16.06 C K 1.07 2.49 O K 21.34 35.82 O K 31.96 52.74 O K 35.97 62.67 Na K 0.55 0.65 Na K 0.22 0.26 Na K 0.21 0.26 Mg K 0.50 0.55 Si K 1.54 1.45 Si K 3.04 3.02 Si K 5.01 4.80 Ca K 0.41 0.27 Cr K 55.03 29.51 S K 0.44 0.37 Cr K 42.58 21.62 Mn K 1.15 0.59 Ca K 2.27 1.52 Mn K 11.19 5.38 Fe K 0.72 0.36 Cr K 45.09 23.30 Fe K 2.61 1.24 Ni K 1.54 0.73 Mn K 1.61 0.79 Ni K 2.18 0.98 Nb L 1.27 0.38 Fe K 3.80 1.83 Ni K 7.30 3.34 Totals 100.00 Totals 100.00 Totals 100.00
Figure 6.36 Analysis of the localised attack.
P1
P2
P3
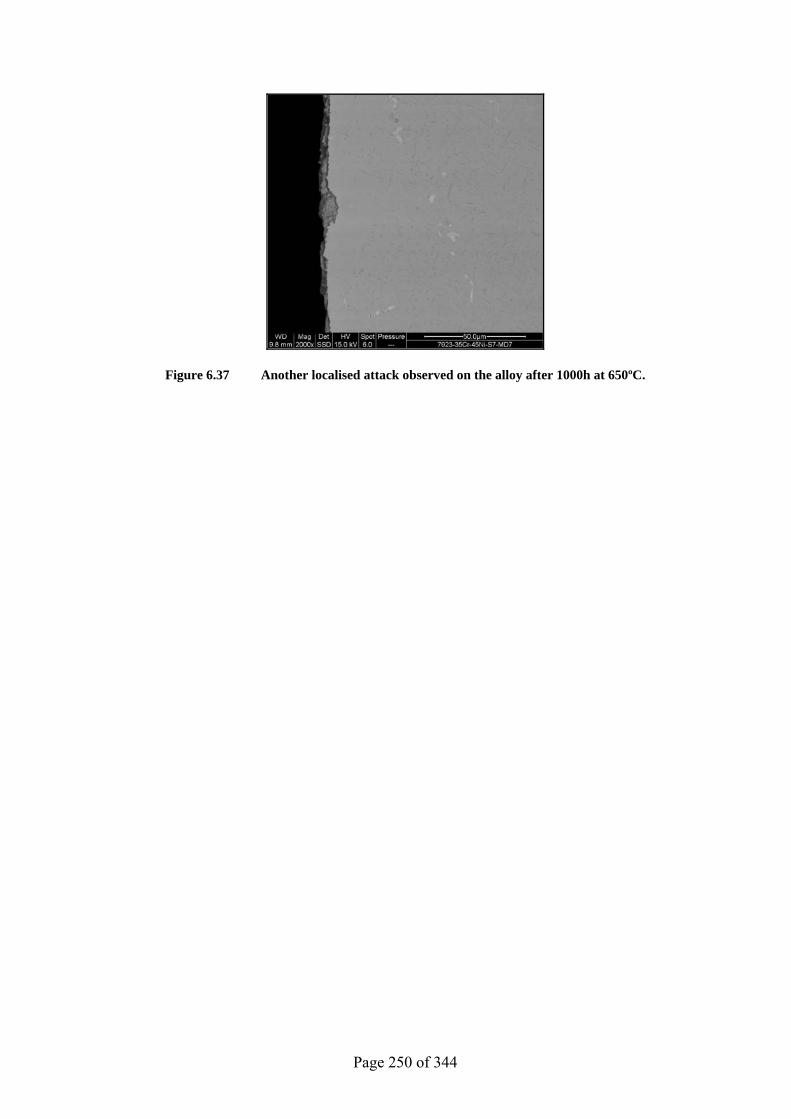
Page 250 of 344
Figure 6.37 Another localised attack observed on the alloy after 1000h at 650ºC.
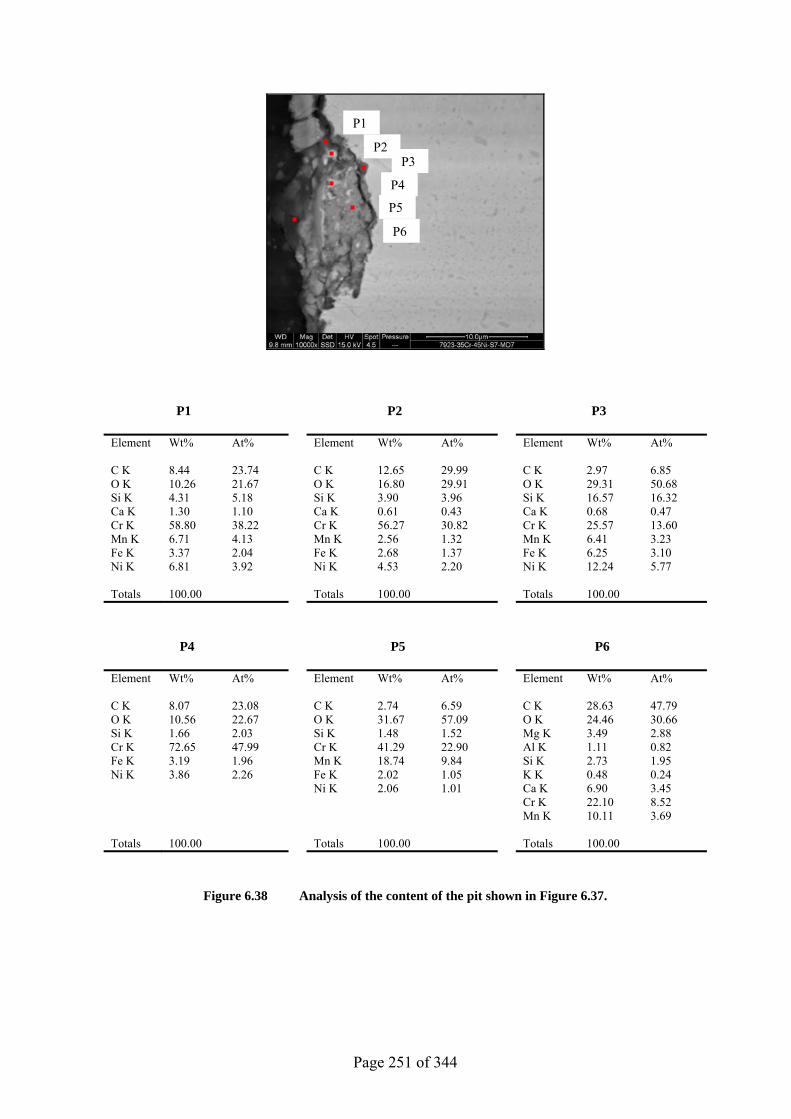
Page 251 of 344
P1 P2 P3
Element Wt% At% Element Wt% At% Element Wt% At% C K 8.44 23.74 C K 12.65 29.99 C K 2.97 6.85 O K 10.26 21.67 O K 16.80 29.91 O K 29.31 50.68 Si K 4.31 5.18 Si K 3.90 3.96 Si K 16.57 16.32 Ca K 1.30 1.10 Ca K 0.61 0.43 Ca K 0.68 0.47 Cr K 58.80 38.22 Cr K 56.27 30.82 Cr K 25.57 13.60 Mn K 6.71 4.13 Mn K 2.56 1.32 Mn K 6.41 3.23 Fe K 3.37 2.04 Fe K 2.68 1.37 Fe K 6.25 3.10 Ni K 6.81 3.92 Ni K 4.53 2.20 Ni K 12.24 5.77 Totals 100.00 Totals 100.00 Totals 100.00
P4 P5 P6
Element Wt% At% Element Wt% At% Element Wt% At% C K 8.07 23.08 C K 2.74 6.59 C K 28.63 47.79 O K 10.56 22.67 O K 31.67 57.09 O K 24.46 30.66 Si K 1.66 2.03 Si K 1.48 1.52 Mg K 3.49 2.88 Cr K 72.65 47.99 Cr K 41.29 22.90 Al K 1.11 0.82 Fe K 3.19 1.96 Mn K 18.74 9.84 Si K 2.73 1.95 Ni K 3.86 2.26 Fe K 2.02 1.05 K K 0.48 0.24 Ni K 2.06 1.01 Ca K 6.90 3.45 Cr K 22.10 8.52 Mn K 10.11 3.69 Totals 100.00 Totals 100.00 Totals 100.00
Figure 6.38 Analysis of the content of the pit shown in Figure 6.37.
P2
P1
P3
P4
P5
P6
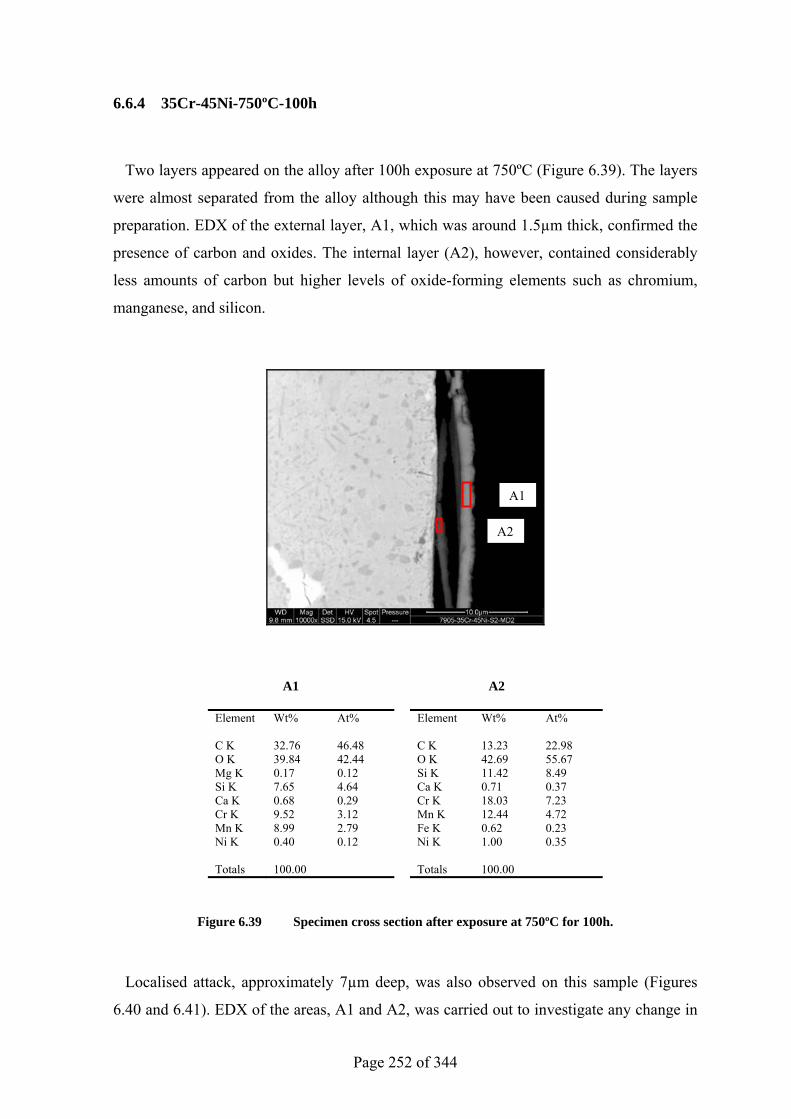
Page 252 of 344
6.6.4 35Cr-45Ni-750ºC-100h
Two layers appeared on the alloy after 100h exposure at 750ºC (Figure 6.39). The layers
were almost separated from the alloy although this may have been caused during sample
preparation. EDX of the external layer, A1, which was around 1.5µm thick, confirmed the
presence of carbon and oxides. The internal layer (A2), however, contained considerably
less amounts of carbon but higher levels of oxide-forming elements such as chromium,
manganese, and silicon.
A1 A2
Element Wt% At% Element Wt% At% C K 32.76 46.48 C K 13.23 22.98 O K 39.84 42.44 O K 42.69 55.67 Mg K 0.17 0.12 Si K 11.42 8.49 Si K 7.65 4.64 Ca K 0.71 0.37 Ca K 0.68 0.29 Cr K 18.03 7.23 Cr K 9.52 3.12 Mn K 12.44 4.72 Mn K 8.99 2.79 Fe K 0.62 0.23 Ni K 0.40 0.12 Ni K 1.00 0.35 Totals 100.00 Totals 100.00
Figure 6.39 Specimen cross section after exposure at 750ºC for 100h.
Localised attack, approximately 7µm deep, was also observed on this sample (Figures
6.40 and 6.41). EDX of the areas, A1 and A2, was carried out to investigate any change in
A1
A2
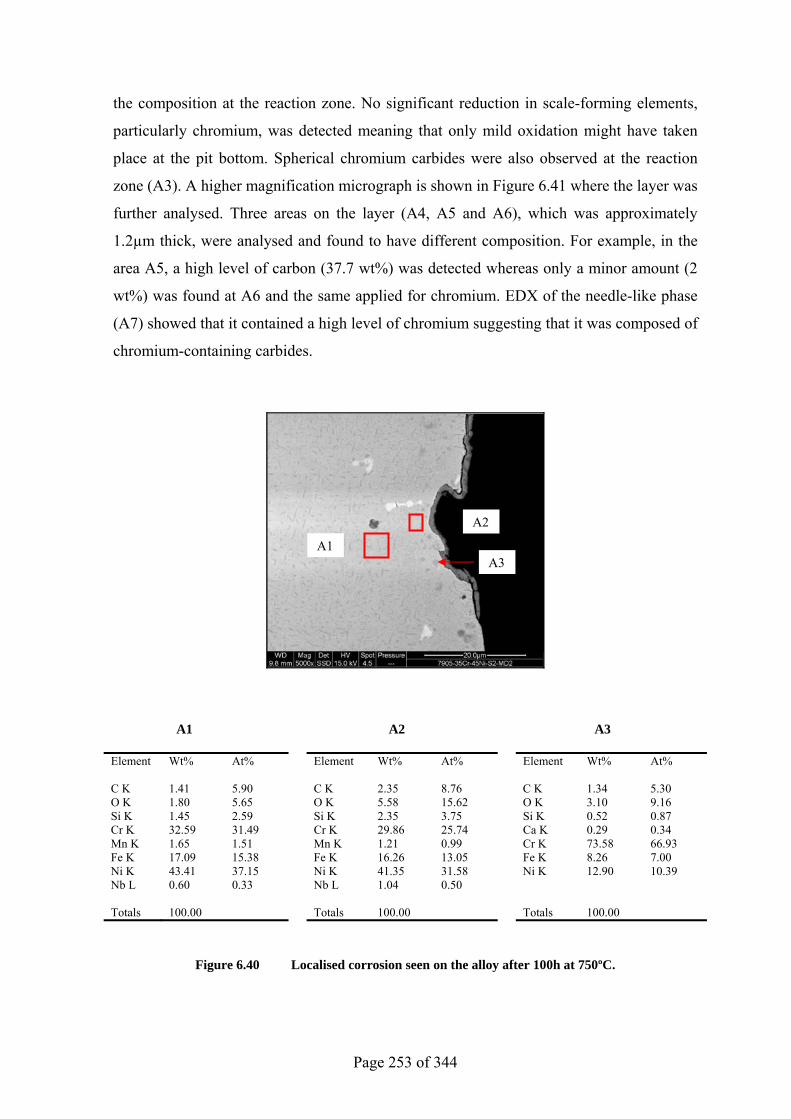
Page 253 of 344
the composition at the reaction zone. No significant reduction in scale-forming elements,
particularly chromium, was detected meaning that only mild oxidation might have taken
place at the pit bottom. Spherical chromium carbides were also observed at the reaction
zone (A3). A higher magnification micrograph is shown in Figure 6.41 where the layer was
further analysed. Three areas on the layer (A4, A5 and A6), which was approximately
1.2µm thick, were analysed and found to have different composition. For example, in the
area A5, a high level of carbon (37.7 wt%) was detected whereas only a minor amount (2
wt%) was found at A6 and the same applied for chromium. EDX of the needle-like phase
(A7) showed that it contained a high level of chromium suggesting that it was composed of
chromium-containing carbides.
A1 A2 A3
Element Wt% At% Element Wt% At% Element Wt% At% C K 1.41 5.90 C K 2.35 8.76 C K 1.34 5.30 O K 1.80 5.65 O K 5.58 15.62 O K 3.10 9.16 Si K 1.45 2.59 Si K 2.35 3.75 Si K 0.52 0.87 Cr K 32.59 31.49 Cr K 29.86 25.74 Ca K 0.29 0.34 Mn K 1.65 1.51 Mn K 1.21 0.99 Cr K 73.58 66.93 Fe K 17.09 15.38 Fe K 16.26 13.05 Fe K 8.26 7.00 Ni K 43.41 37.15 Ni K 41.35 31.58 Ni K 12.90 10.39 Nb L 0.60 0.33 Nb L 1.04 0.50 Totals 100.00 Totals 100.00 Totals 100.00
Figure 6.40 Localised corrosion seen on the alloy after 100h at 750ºC.
A1
A2
A3
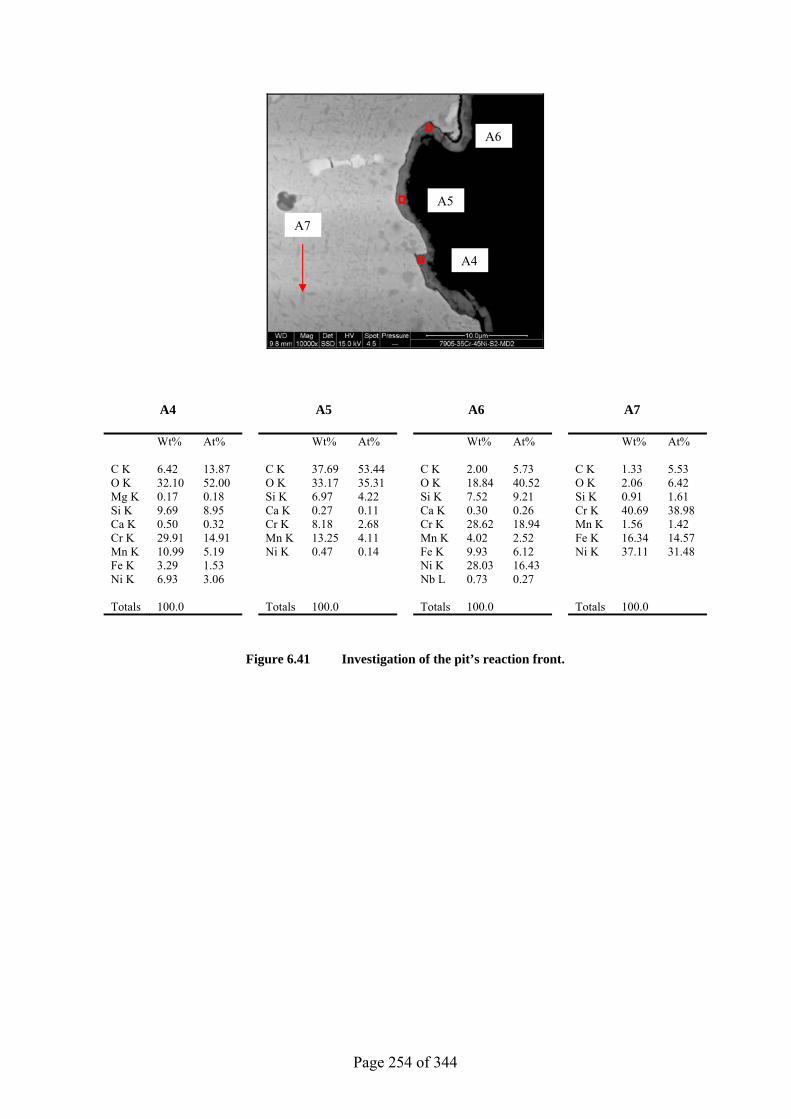
Page 254 of 344
A4 A5 A6 A7
Wt% At% Wt% At% Wt% At% Wt% At% C K 6.42 13.87 C K 37.69 53.44 C K 2.00 5.73 C K 1.33 5.53 O K 32.10 52.00 O K 33.17 35.31 O K 18.84 40.52 O K 2.06 6.42 Mg K 0.17 0.18 Si K 6.97 4.22 Si K 7.52 9.21 Si K 0.91 1.61 Si K 9.69 8.95 Ca K 0.27 0.11 Ca K 0.30 0.26 Cr K 40.69 38.98 Ca K 0.50 0.32 Cr K 8.18 2.68 Cr K 28.62 18.94 Mn K 1.56 1.42 Cr K 29.91 14.91 Mn K 13.25 4.11 Mn K 4.02 2.52 Fe K 16.34 14.57 Mn K 10.99 5.19 Ni K 0.47 0.14 Fe K 9.93 6.12 Ni K 37.11 31.48 Fe K 3.29 1.53 Ni K 28.03 16.43 Ni K 6.93 3.06 Nb L 0.73 0.27 Totals 100.0 Totals 100.0 Totals 100.0 Totals 100.0
Figure 6.41 Investigation of the pit’s reaction front.
A4
A5
A6
A7
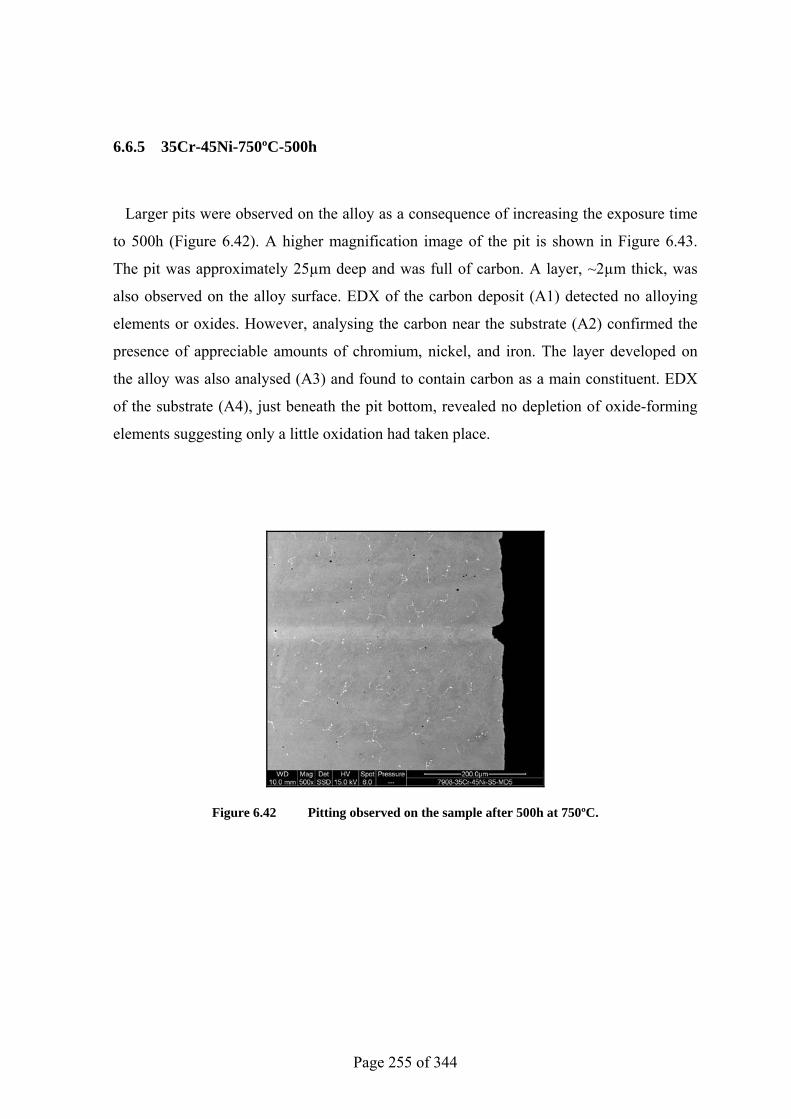
Page 255 of 344
6.6.5 35Cr-45Ni-750ºC-500h
Larger pits were observed on the alloy as a consequence of increasing the exposure time
to 500h (Figure 6.42). A higher magnification image of the pit is shown in Figure 6.43.
The pit was approximately 25µm deep and was full of carbon. A layer, ~2µm thick, was
also observed on the alloy surface. EDX of the carbon deposit (A1) detected no alloying
elements or oxides. However, analysing the carbon near the substrate (A2) confirmed the
presence of appreciable amounts of chromium, nickel, and iron. The layer developed on
the alloy was also analysed (A3) and found to contain carbon as a main constituent. EDX
of the substrate (A4), just beneath the pit bottom, revealed no depletion of oxide-forming
elements suggesting only a little oxidation had taken place.
Figure 6.42 Pitting observed on the sample after 500h at 750ºC.
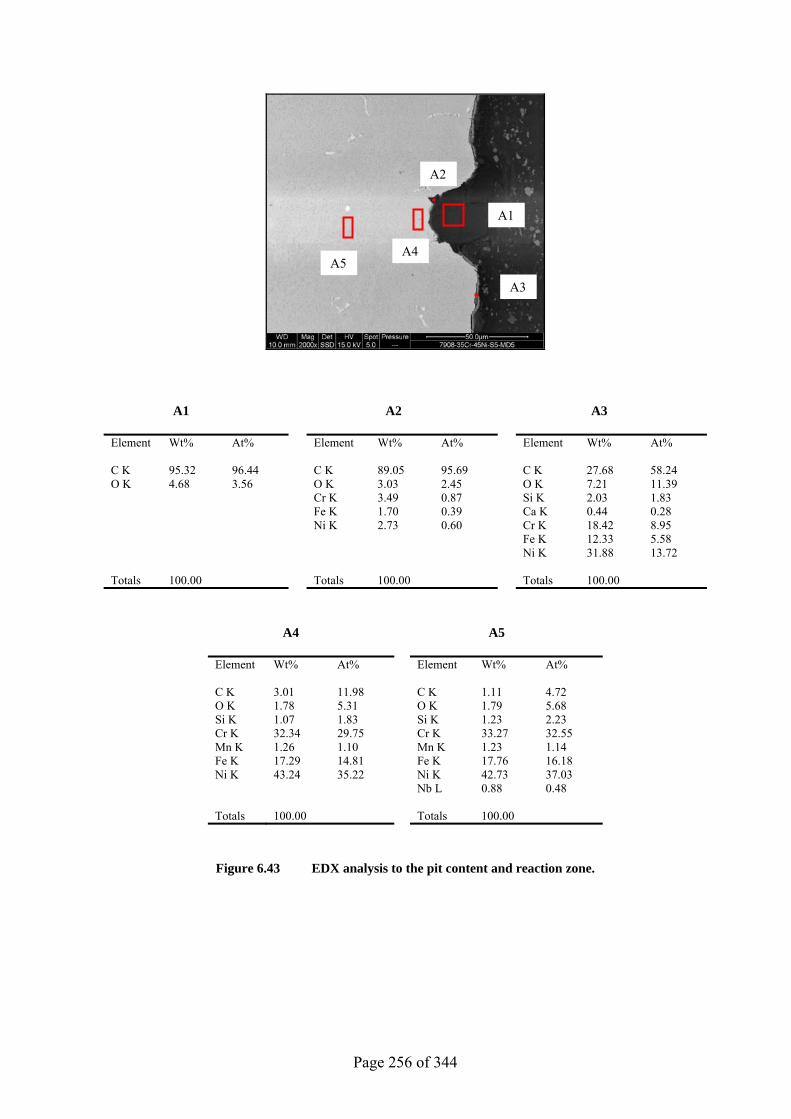
Page 256 of 344
A1 A2 A3
Element Wt% At% Element Wt% At% Element Wt% At% C K 95.32 96.44 C K 89.05 95.69 C K 27.68 58.24 O K 4.68 3.56 O K 3.03 2.45 O K 7.21 11.39 Cr K 3.49 0.87 Si K 2.03 1.83 Fe K 1.70 0.39 Ca K 0.44 0.28 Ni K 2.73 0.60 Cr K 18.42 8.95 Fe K 12.33 5.58 Ni K 31.88 13.72 Totals 100.00 Totals 100.00 Totals 100.00
A4 A5
Element Wt% At% Element Wt% At% C K 3.01 11.98 C K 1.11 4.72 O K 1.78 5.31 O K 1.79 5.68 Si K 1.07 1.83 Si K 1.23 2.23 Cr K 32.34 29.75 Cr K 33.27 32.55 Mn K 1.26 1.10 Mn K 1.23 1.14 Fe K 17.29 14.81 Fe K 17.76 16.18 Ni K 43.24 35.22 Ni K 42.73 37.03 Nb L 0.88 0.48 Totals 100.00 Totals 100.00
Figure 6.43 EDX analysis to the pit content and reaction zone.
A1
A2
A3
A4A5
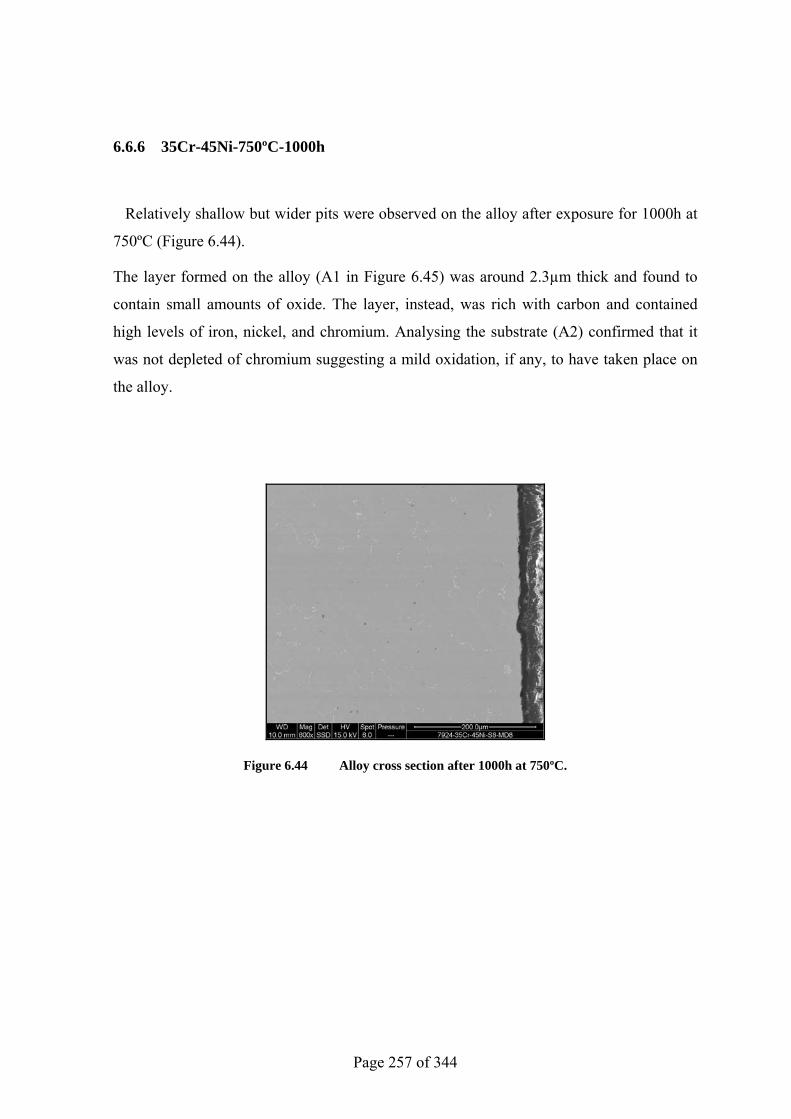
Page 257 of 344
6.6.6 35Cr-45Ni-750ºC-1000h
Relatively shallow but wider pits were observed on the alloy after exposure for 1000h at
750ºC (Figure 6.44).
The layer formed on the alloy (A1 in Figure 6.45) was around 2.3µm thick and found to
contain small amounts of oxide. The layer, instead, was rich with carbon and contained
high levels of iron, nickel, and chromium. Analysing the substrate (A2) confirmed that it
was not depleted of chromium suggesting a mild oxidation, if any, to have taken place on
the alloy.
Figure 6.44 Alloy cross section after 1000h at 750ºC.
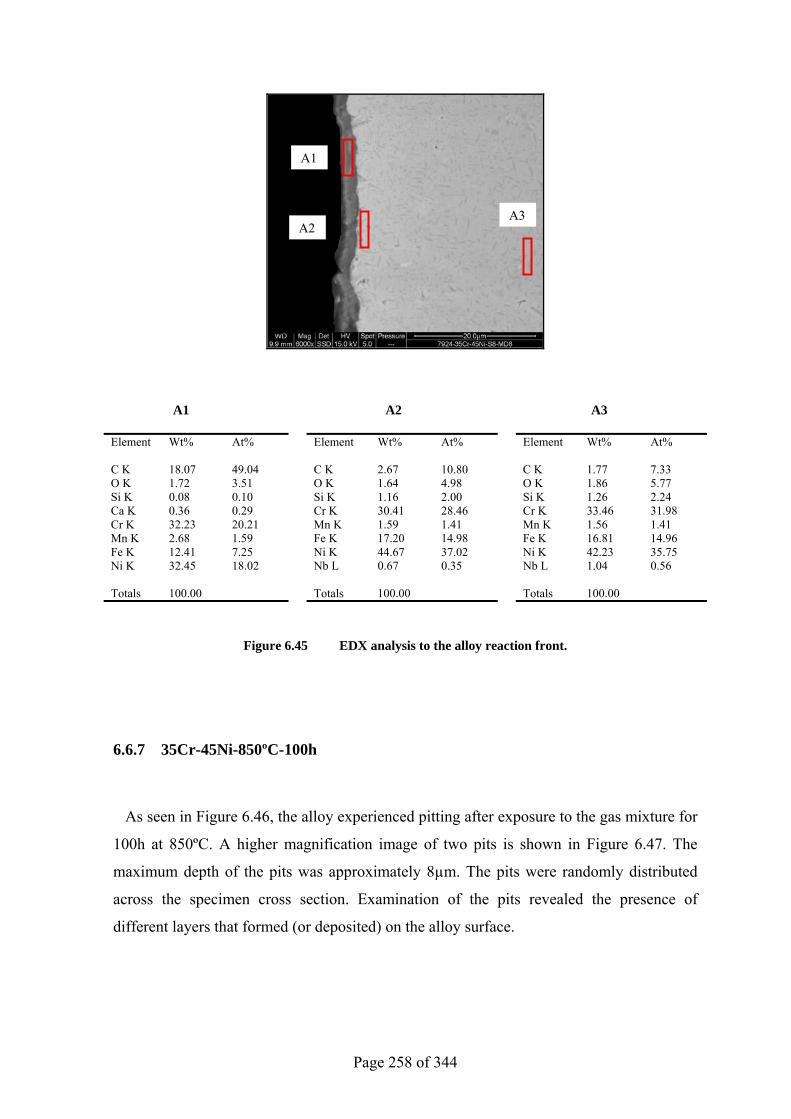
Page 258 of 344
A1 A2 A3
Element Wt% At% Element Wt% At% Element Wt% At% C K 18.07 49.04 C K 2.67 10.80 C K 1.77 7.33 O K 1.72 3.51 O K 1.64 4.98 O K 1.86 5.77 Si K 0.08 0.10 Si K 1.16 2.00 Si K 1.26 2.24 Ca K 0.36 0.29 Cr K 30.41 28.46 Cr K 33.46 31.98 Cr K 32.23 20.21 Mn K 1.59 1.41 Mn K 1.56 1.41 Mn K 2.68 1.59 Fe K 17.20 14.98 Fe K 16.81 14.96 Fe K 12.41 7.25 Ni K 44.67 37.02 Ni K 42.23 35.75 Ni K 32.45 18.02 Nb L 0.67 0.35 Nb L 1.04 0.56 Totals 100.00 Totals 100.00 Totals 100.00
Figure 6.45 EDX analysis to the alloy reaction front.
6.6.7 35Cr-45Ni-850ºC-100h
As seen in Figure 6.46, the alloy experienced pitting after exposure to the gas mixture for
100h at 850ºC. A higher magnification image of two pits is shown in Figure 6.47. The
maximum depth of the pits was approximately 8µm. The pits were randomly distributed
across the specimen cross section. Examination of the pits revealed the presence of
different layers that formed (or deposited) on the alloy surface.
A1
A2 A3
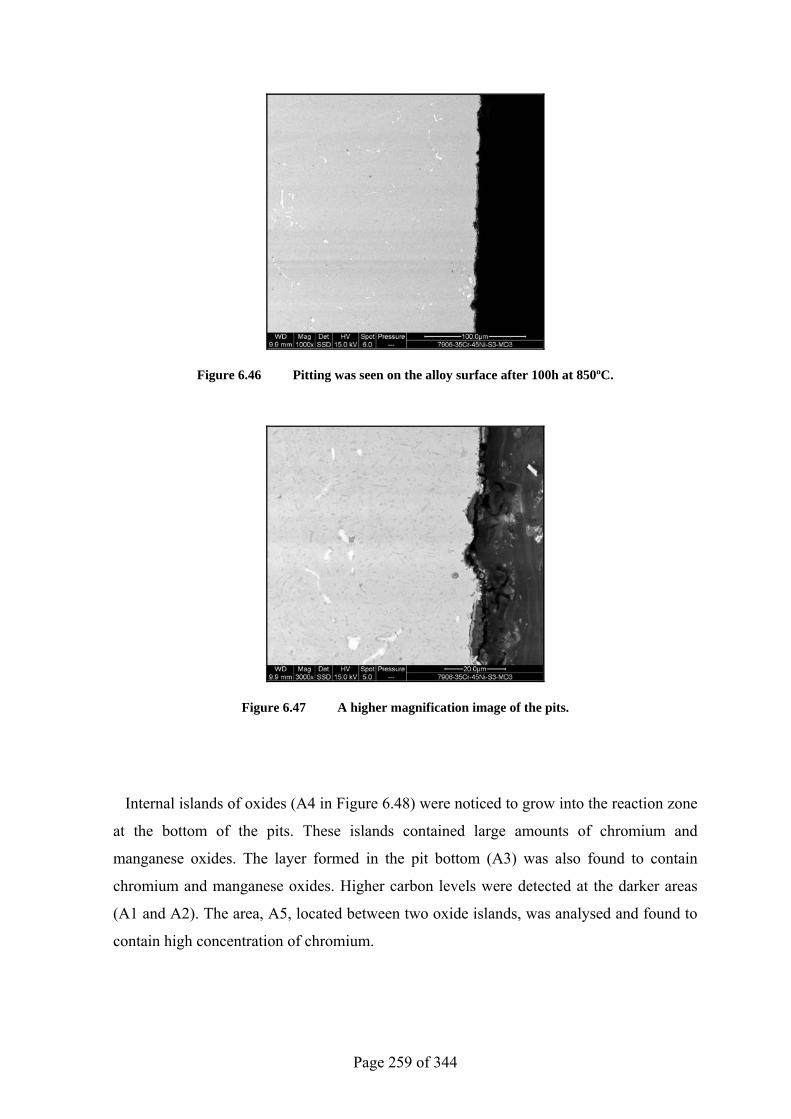
Page 259 of 344
Figure 6.46 Pitting was seen on the alloy surface after 100h at 850ºC.
Figure 6.47 A higher magnification image of the pits.
Internal islands of oxides (A4 in Figure 6.48) were noticed to grow into the reaction zone
at the bottom of the pits. These islands contained large amounts of chromium and
manganese oxides. The layer formed in the pit bottom (A3) was also found to contain
chromium and manganese oxides. Higher carbon levels were detected at the darker areas
(A1 and A2). The area, A5, located between two oxide islands, was analysed and found to
contain high concentration of chromium.
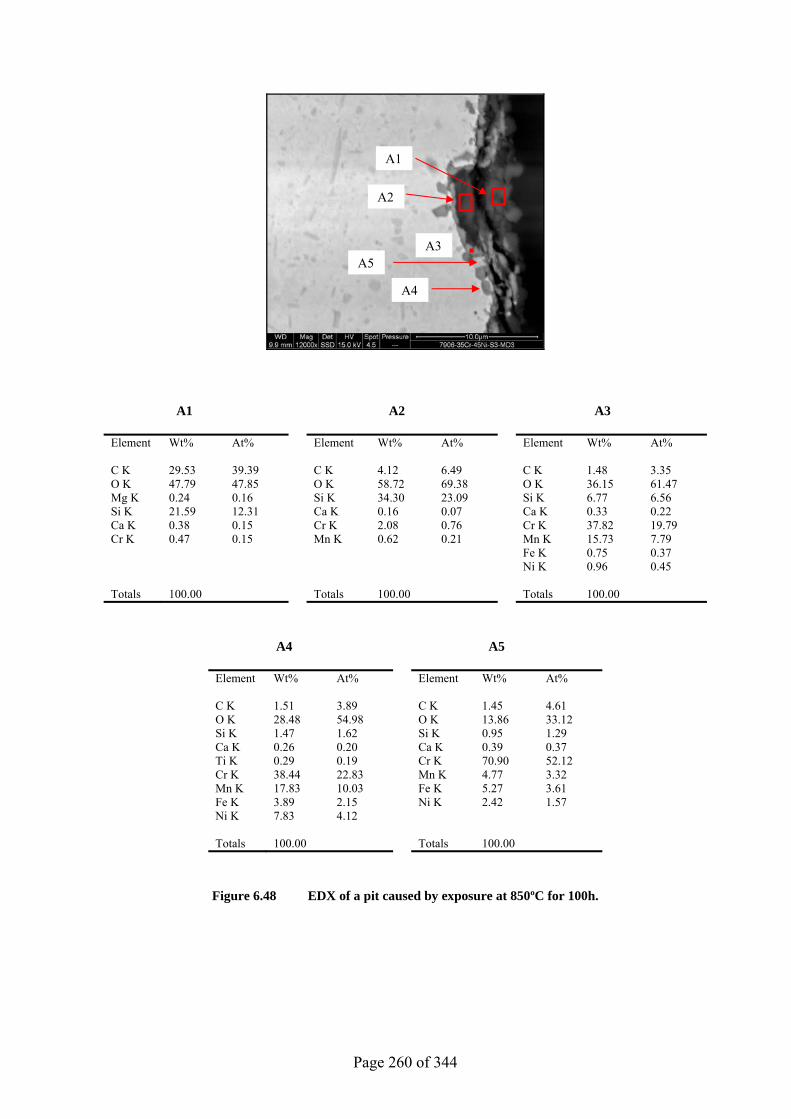
Page 260 of 344
A1 A2 A3
Element Wt% At% Element Wt% At% Element Wt% At% C K 29.53 39.39 C K 4.12 6.49 C K 1.48 3.35 O K 47.79 47.85 O K 58.72 69.38 O K 36.15 61.47 Mg K 0.24 0.16 Si K 34.30 23.09 Si K 6.77 6.56 Si K 21.59 12.31 Ca K 0.16 0.07 Ca K 0.33 0.22 Ca K 0.38 0.15 Cr K 2.08 0.76 Cr K 37.82 19.79 Cr K 0.47 0.15 Mn K 0.62 0.21 Mn K 15.73 7.79 Fe K 0.75 0.37 Ni K 0.96 0.45 Totals 100.00 Totals 100.00 Totals 100.00
A4 A5
Element Wt% At% Element Wt% At% C K 1.51 3.89 C K 1.45 4.61 O K 28.48 54.98 O K 13.86 33.12 Si K 1.47 1.62 Si K 0.95 1.29 Ca K 0.26 0.20 Ca K 0.39 0.37 Ti K 0.29 0.19 Cr K 70.90 52.12 Cr K 38.44 22.83 Mn K 4.77 3.32 Mn K 17.83 10.03 Fe K 5.27 3.61 Fe K 3.89 2.15 Ni K 2.42 1.57 Ni K 7.83 4.12 Totals 100.00 Totals 100.00
Figure 6.48 EDX of a pit caused by exposure at 850ºC for 100h.
A1
A2
A3
A4
A5
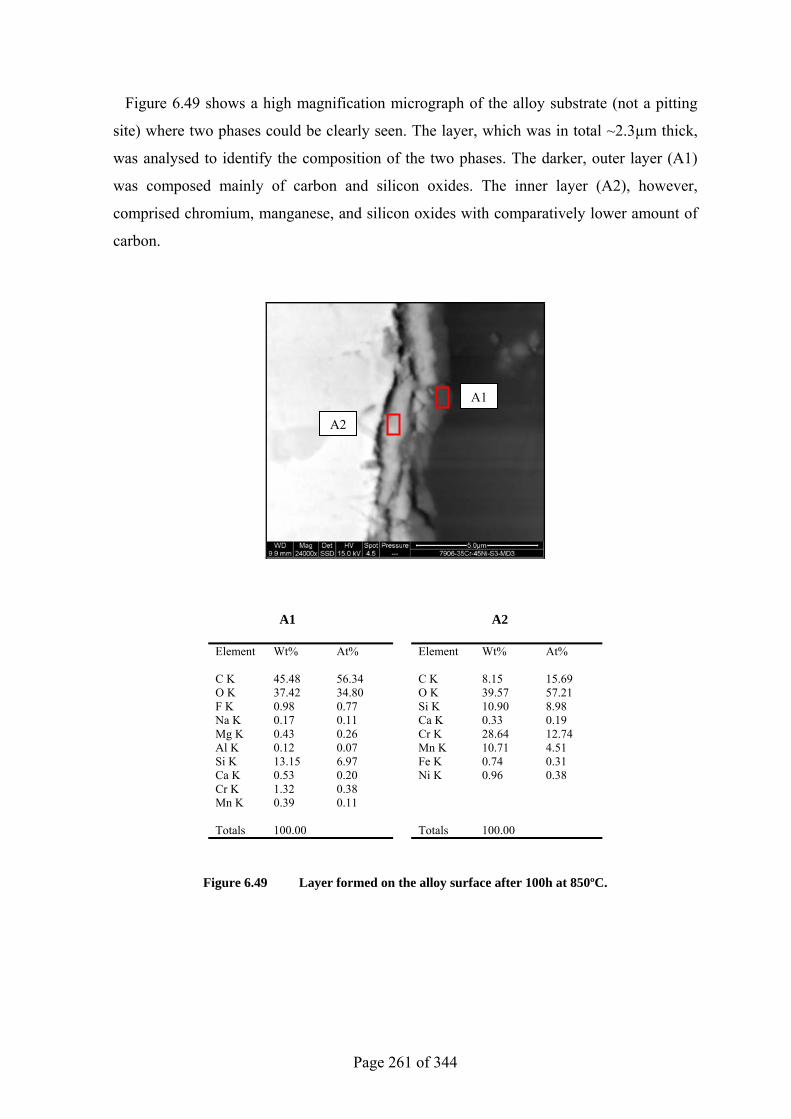
Page 261 of 344
Figure 6.49 shows a high magnification micrograph of the alloy substrate (not a pitting
site) where two phases could be clearly seen. The layer, which was in total ~2.3µm thick,
was analysed to identify the composition of the two phases. The darker, outer layer (A1)
was composed mainly of carbon and silicon oxides. The inner layer (A2), however,
comprised chromium, manganese, and silicon oxides with comparatively lower amount of
carbon.
A1 A2
Element Wt% At% Element Wt% At% C K 45.48 56.34 C K 8.15 15.69 O K 37.42 34.80 O K 39.57 57.21 F K 0.98 0.77 Si K 10.90 8.98 Na K 0.17 0.11 Ca K 0.33 0.19 Mg K 0.43 0.26 Cr K 28.64 12.74 Al K 0.12 0.07 Mn K 10.71 4.51 Si K 13.15 6.97 Fe K 0.74 0.31 Ca K 0.53 0.20 Ni K 0.96 0.38 Cr K 1.32 0.38 Mn K 0.39 0.11 Totals 100.00 Totals 100.00
Figure 6.49 Layer formed on the alloy surface after 100h at 850ºC.
A1
A2
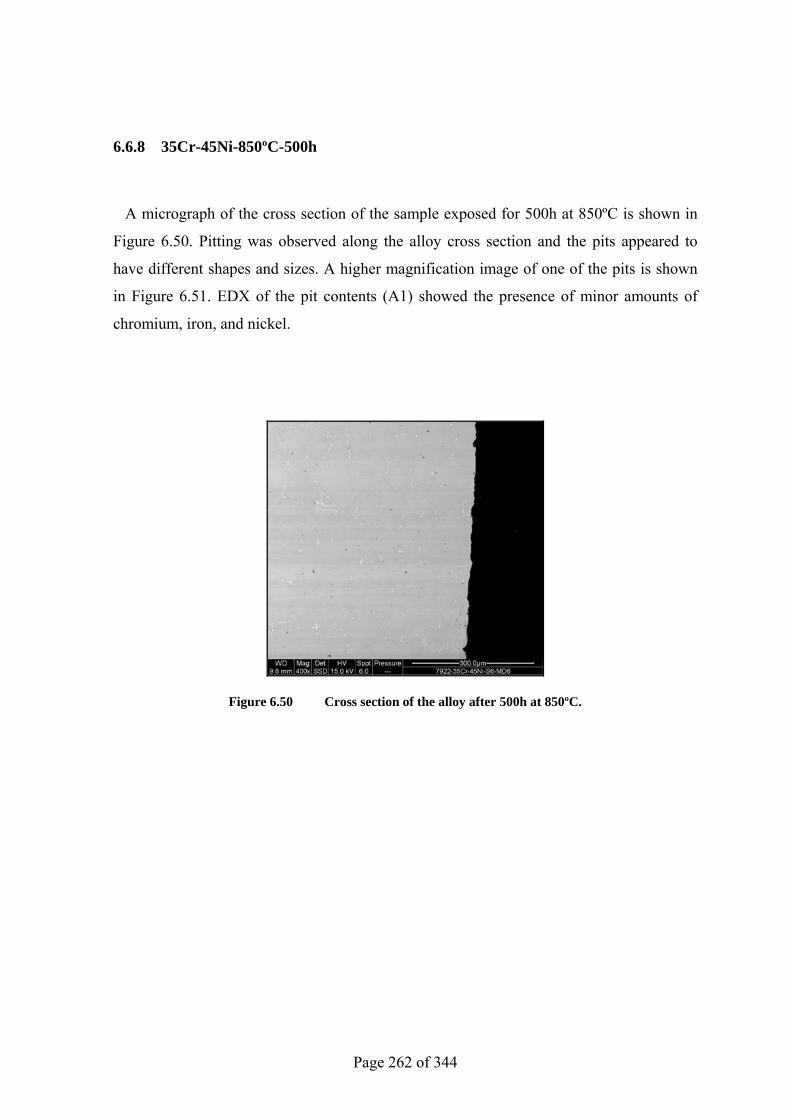
Page 262 of 344
6.6.8 35Cr-45Ni-850ºC-500h
A micrograph of the cross section of the sample exposed for 500h at 850ºC is shown in
Figure 6.50. Pitting was observed along the alloy cross section and the pits appeared to
have different shapes and sizes. A higher magnification image of one of the pits is shown
in Figure 6.51. EDX of the pit contents (A1) showed the presence of minor amounts of
chromium, iron, and nickel.
Figure 6.50 Cross section of the alloy after 500h at 850ºC.
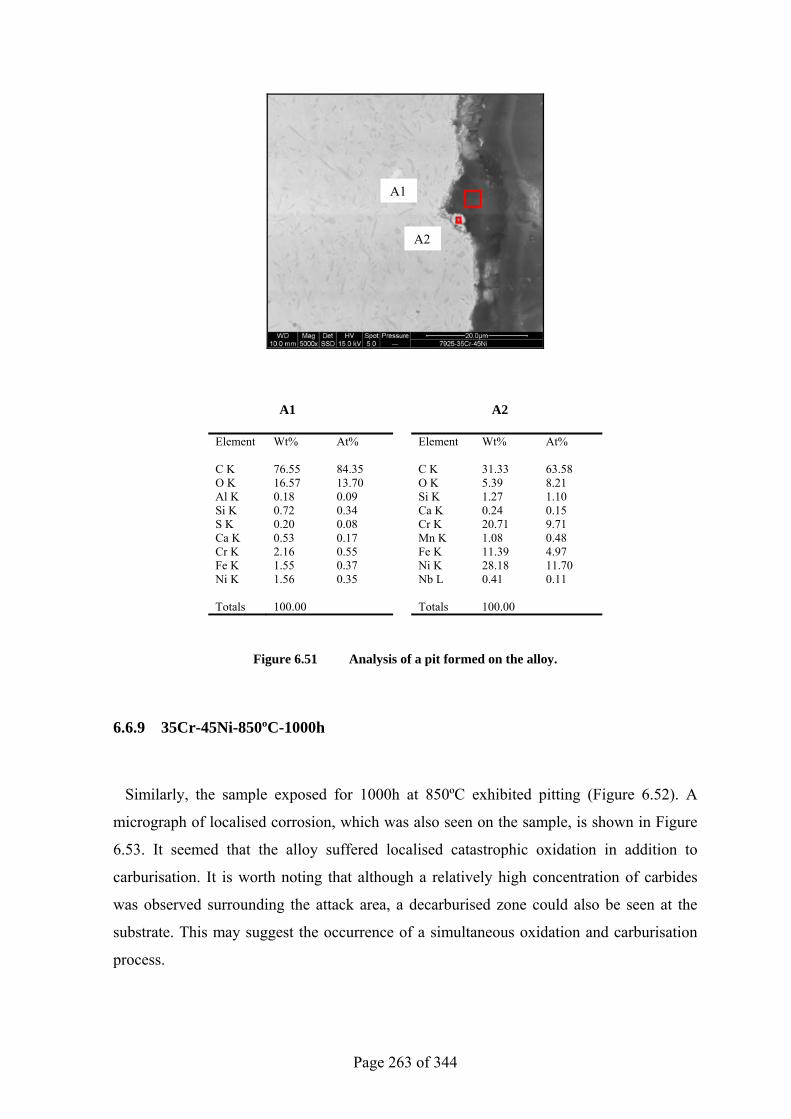
Page 263 of 344
A1 A2
Element Wt% At% Element Wt% At% C K 76.55 84.35 C K 31.33 63.58 O K 16.57 13.70 O K 5.39 8.21 Al K 0.18 0.09 Si K 1.27 1.10 Si K 0.72 0.34 Ca K 0.24 0.15 S K 0.20 0.08 Cr K 20.71 9.71 Ca K 0.53 0.17 Mn K 1.08 0.48 Cr K 2.16 0.55 Fe K 11.39 4.97 Fe K 1.55 0.37 Ni K 28.18 11.70 Ni K 1.56 0.35 Nb L 0.41 0.11 Totals 100.00 Totals 100.00
Figure 6.51 Analysis of a pit formed on the alloy.
6.6.9 35Cr-45Ni-850ºC-1000h
Similarly, the sample exposed for 1000h at 850ºC exhibited pitting (Figure 6.52). A
micrograph of localised corrosion, which was also seen on the sample, is shown in Figure
6.53. It seemed that the alloy suffered localised catastrophic oxidation in addition to
carburisation. It is worth noting that although a relatively high concentration of carbides
was observed surrounding the attack area, a decarburised zone could also be seen at the
substrate. This may suggest the occurrence of a simultaneous oxidation and carburisation
process.
A1
A2
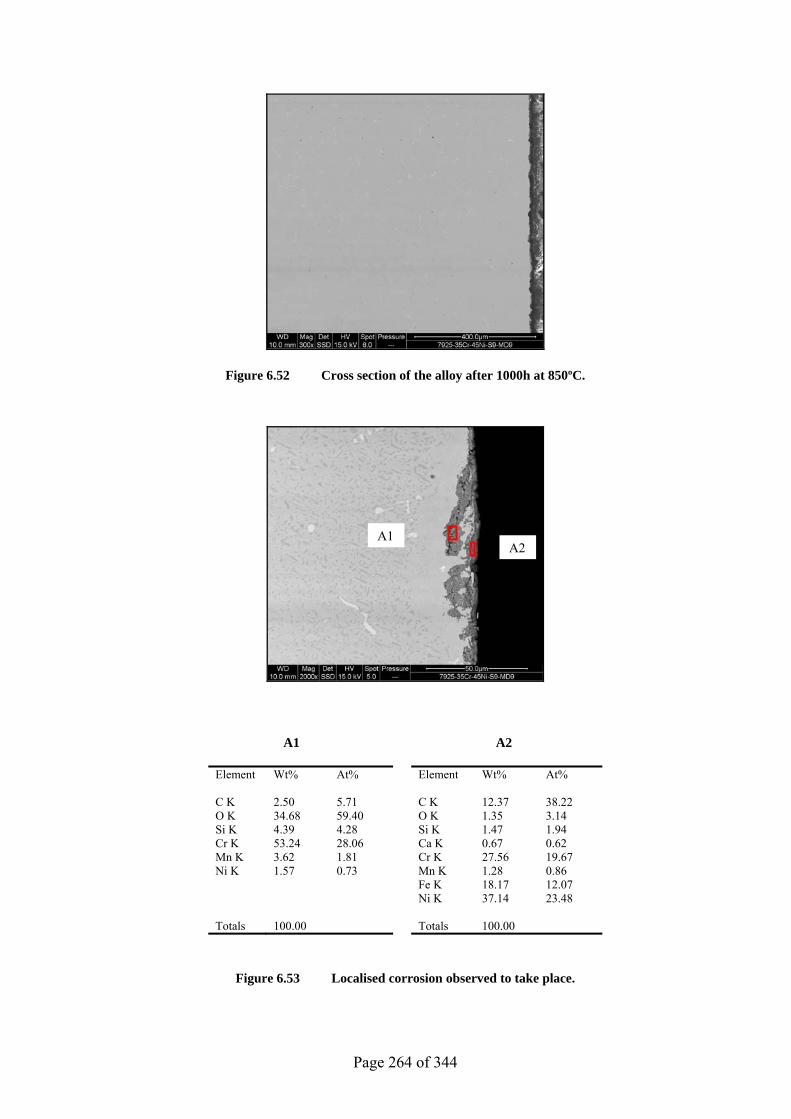
Page 264 of 344
Figure 6.52 Cross section of the alloy after 1000h at 850ºC.
A1 A2
Element Wt% At% Element Wt% At% C K 2.50 5.71 C K 12.37 38.22 O K 34.68 59.40 O K 1.35 3.14 Si K 4.39 4.28 Si K 1.47 1.94 Cr K 53.24 28.06 Ca K 0.67 0.62 Mn K 3.62 1.81 Cr K 27.56 19.67 Ni K 1.57 0.73 Mn K 1.28 0.86 Fe K 18.17 12.07 Ni K 37.14 23.48 Totals 100.00 Totals 100.00
Figure 6.53 Localised corrosion observed to take place.
A1A2
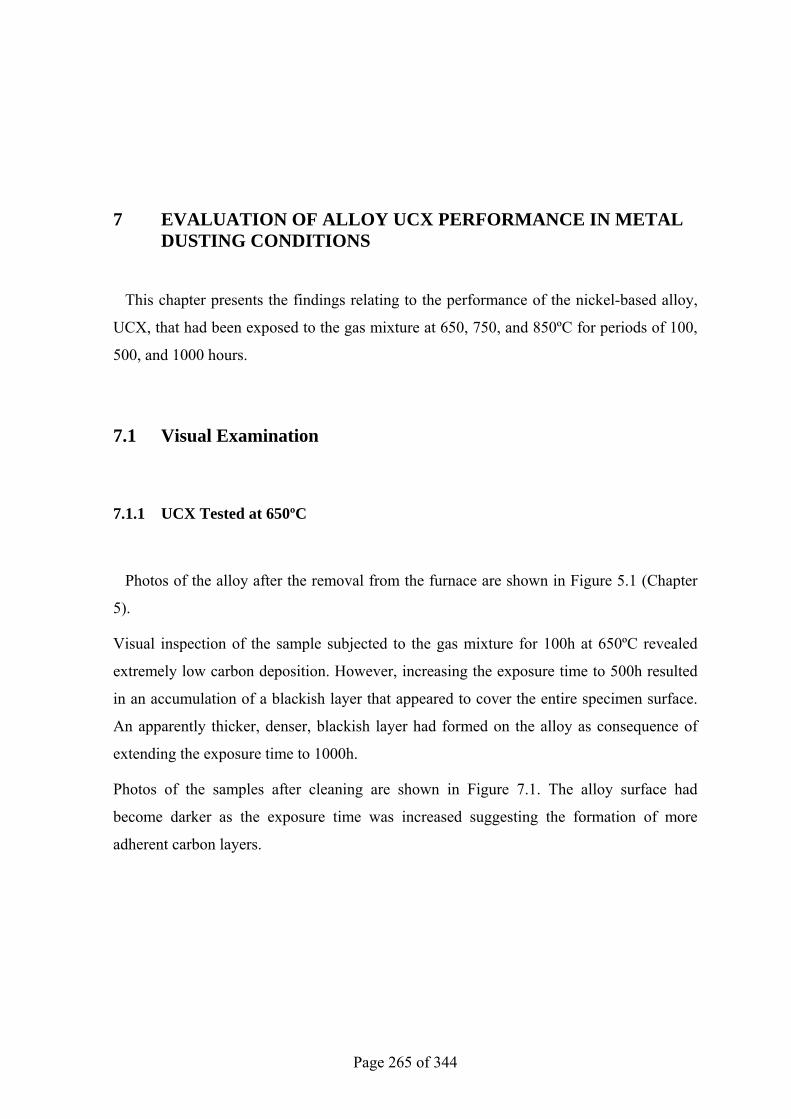
Page 265 of 344
7 EVALUATION OF ALLOY UCX PERFORMANCE IN METAL DUSTING CONDITIONS
This chapter presents the findings relating to the performance of the nickel-based alloy,
UCX, that had been exposed to the gas mixture at 650, 750, and 850ºC for periods of 100,
500, and 1000 hours.
7.1 Visual Examination
7.1.1 UCX Tested at 650ºC
Photos of the alloy after the removal from the furnace are shown in Figure 5.1 (Chapter
5).
Visual inspection of the sample subjected to the gas mixture for 100h at 650ºC revealed
extremely low carbon deposition. However, increasing the exposure time to 500h resulted
in an accumulation of a blackish layer that appeared to cover the entire specimen surface.
An apparently thicker, denser, blackish layer had formed on the alloy as consequence of
extending the exposure time to 1000h.
Photos of the samples after cleaning are shown in Figure 7.1. The alloy surface had
become darker as the exposure time was increased suggesting the formation of more
adherent carbon layers.
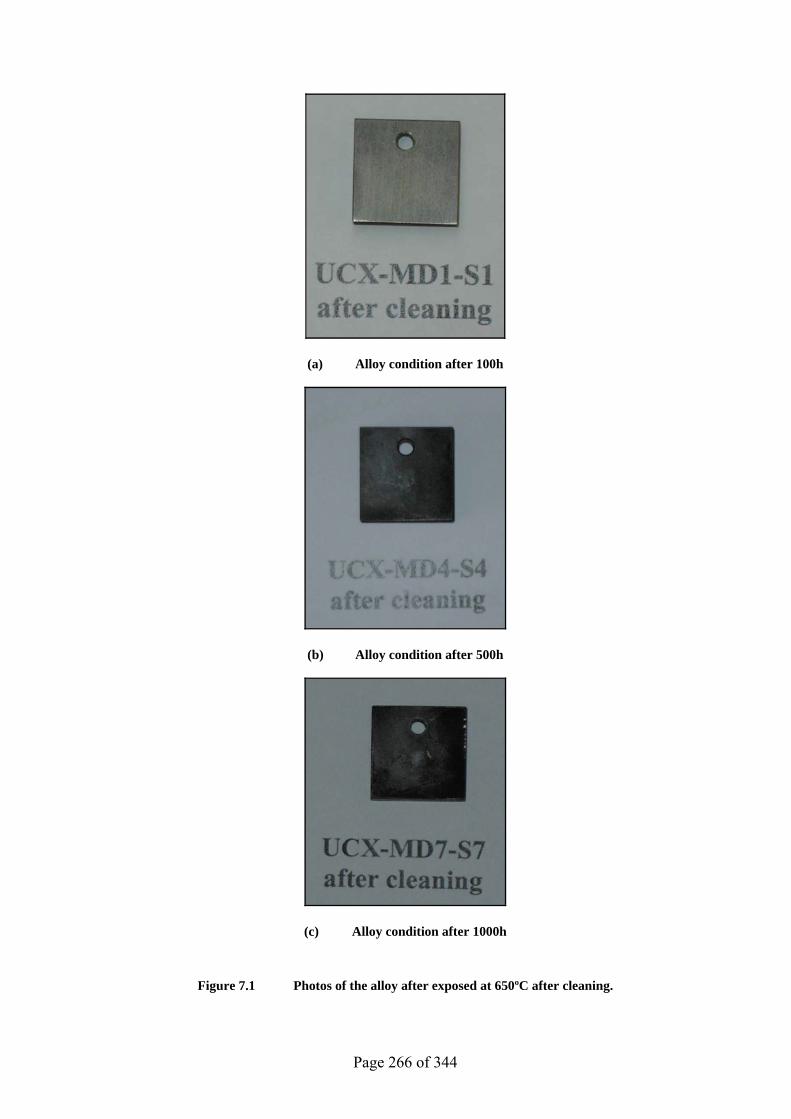
Page 266 of 344
(a) Alloy condition after 100h
(b) Alloy condition after 500h
(c) Alloy condition after 1000h
Figure 7.1 Photos of the alloy after exposed at 650ºC after cleaning.
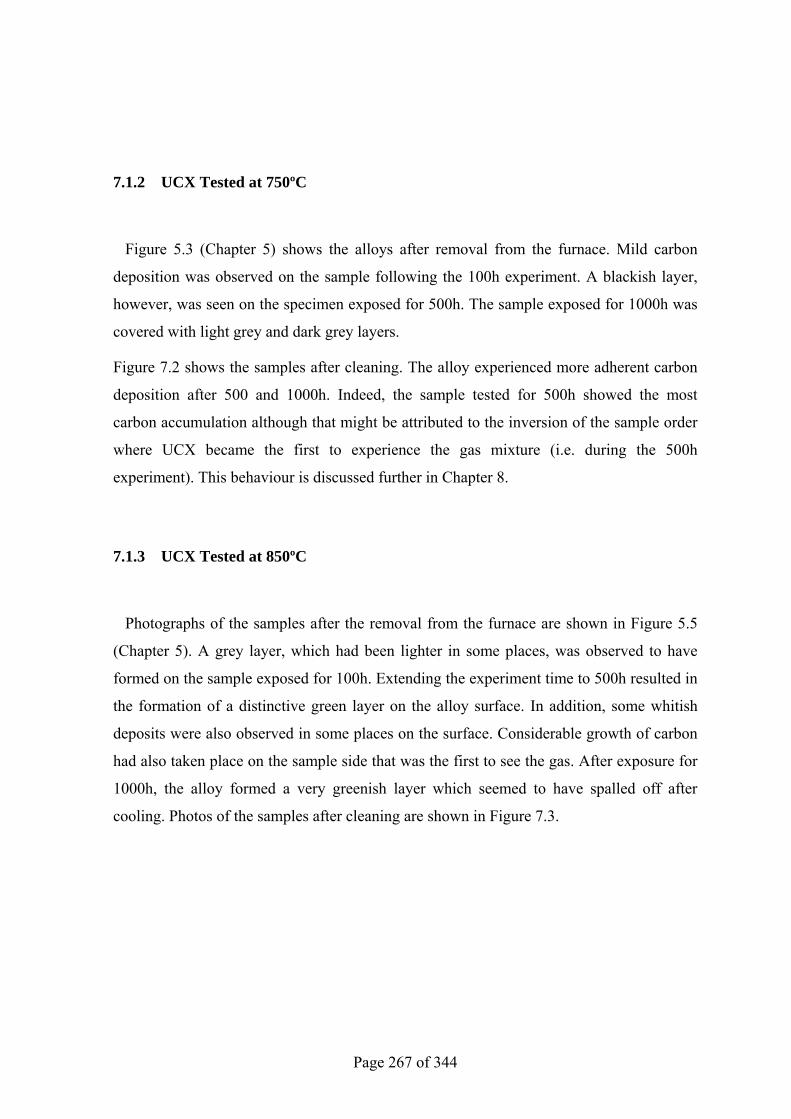
Page 267 of 344
7.1.2 UCX Tested at 750ºC
Figure 5.3 (Chapter 5) shows the alloys after removal from the furnace. Mild carbon
deposition was observed on the sample following the 100h experiment. A blackish layer,
however, was seen on the specimen exposed for 500h. The sample exposed for 1000h was
covered with light grey and dark grey layers.
Figure 7.2 shows the samples after cleaning. The alloy experienced more adherent carbon
deposition after 500 and 1000h. Indeed, the sample tested for 500h showed the most
carbon accumulation although that might be attributed to the inversion of the sample order
where UCX became the first to experience the gas mixture (i.e. during the 500h
experiment). This behaviour is discussed further in Chapter 8.
7.1.3 UCX Tested at 850ºC
Photographs of the samples after the removal from the furnace are shown in Figure 5.5
(Chapter 5). A grey layer, which had been lighter in some places, was observed to have
formed on the sample exposed for 100h. Extending the experiment time to 500h resulted in
the formation of a distinctive green layer on the alloy surface. In addition, some whitish
deposits were also observed in some places on the surface. Considerable growth of carbon
had also taken place on the sample side that was the first to see the gas. After exposure for
1000h, the alloy formed a very greenish layer which seemed to have spalled off after
cooling. Photos of the samples after cleaning are shown in Figure 7.3.
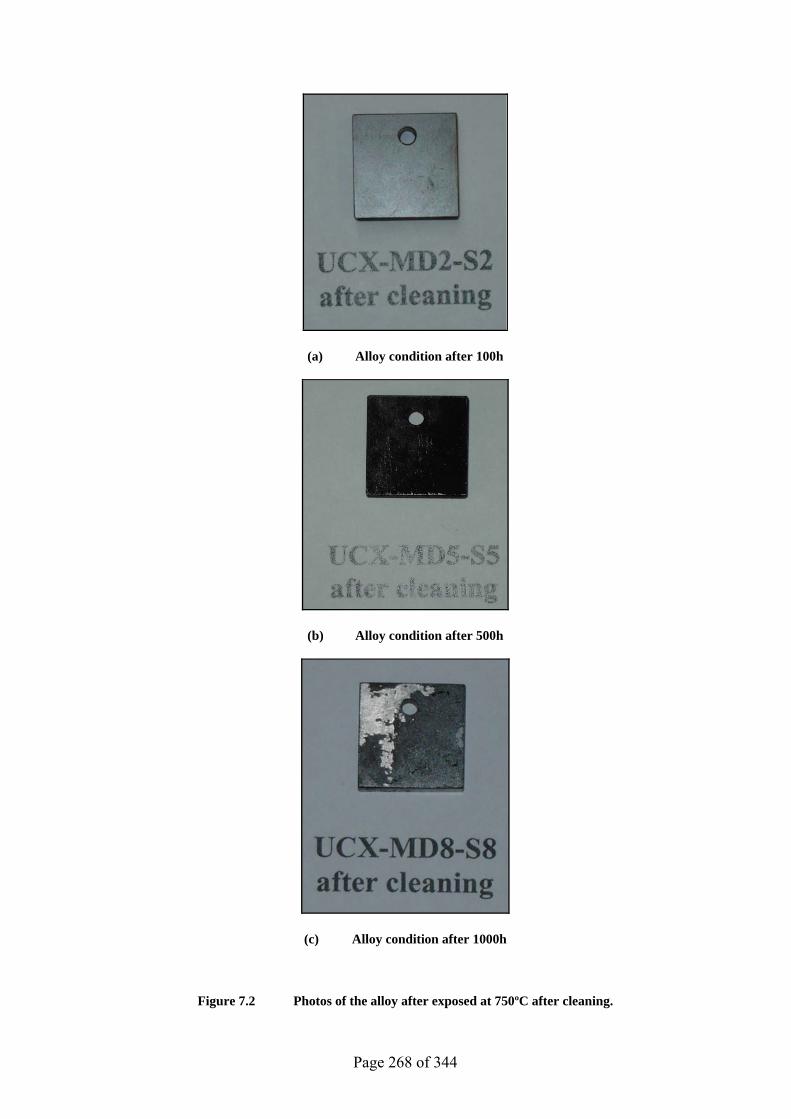
Page 268 of 344
(a) Alloy condition after 100h
(b) Alloy condition after 500h
(c) Alloy condition after 1000h
Figure 7.2 Photos of the alloy after exposed at 750ºC after cleaning.
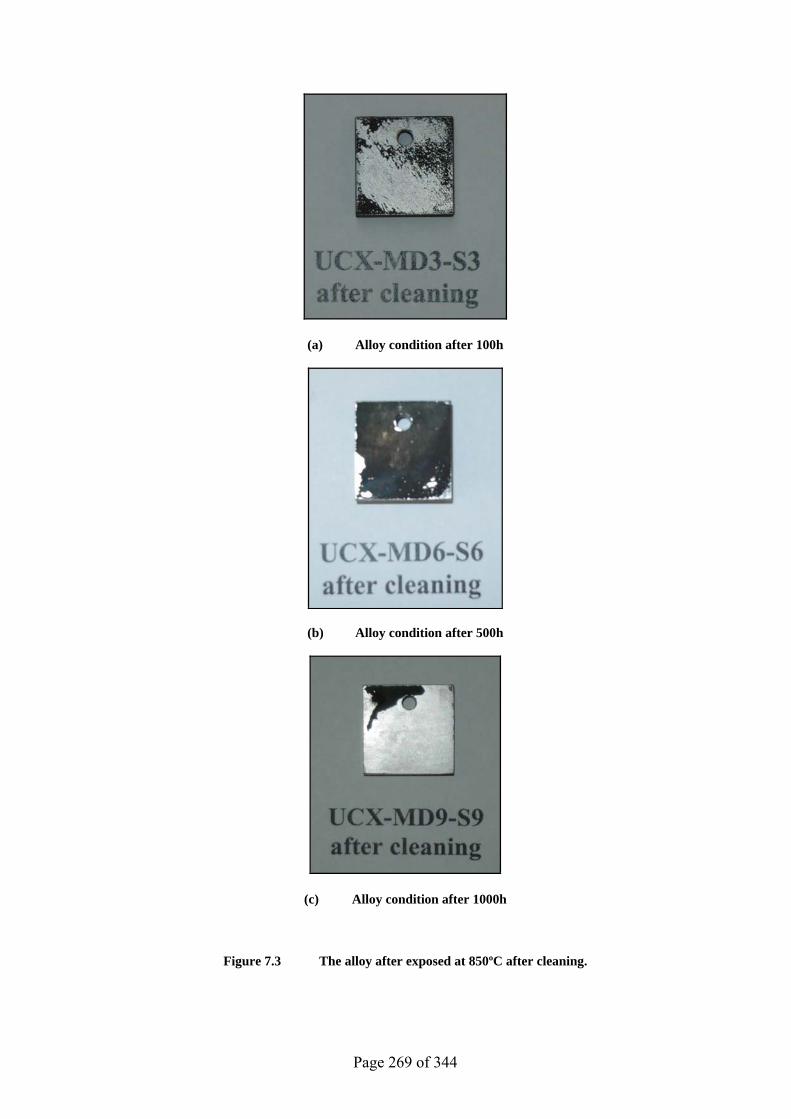
Page 269 of 344
(a) Alloy condition after 100h
(b) Alloy condition after 500h
(c) Alloy condition after 1000h
Figure 7.3 The alloy after exposed at 850ºC after cleaning.
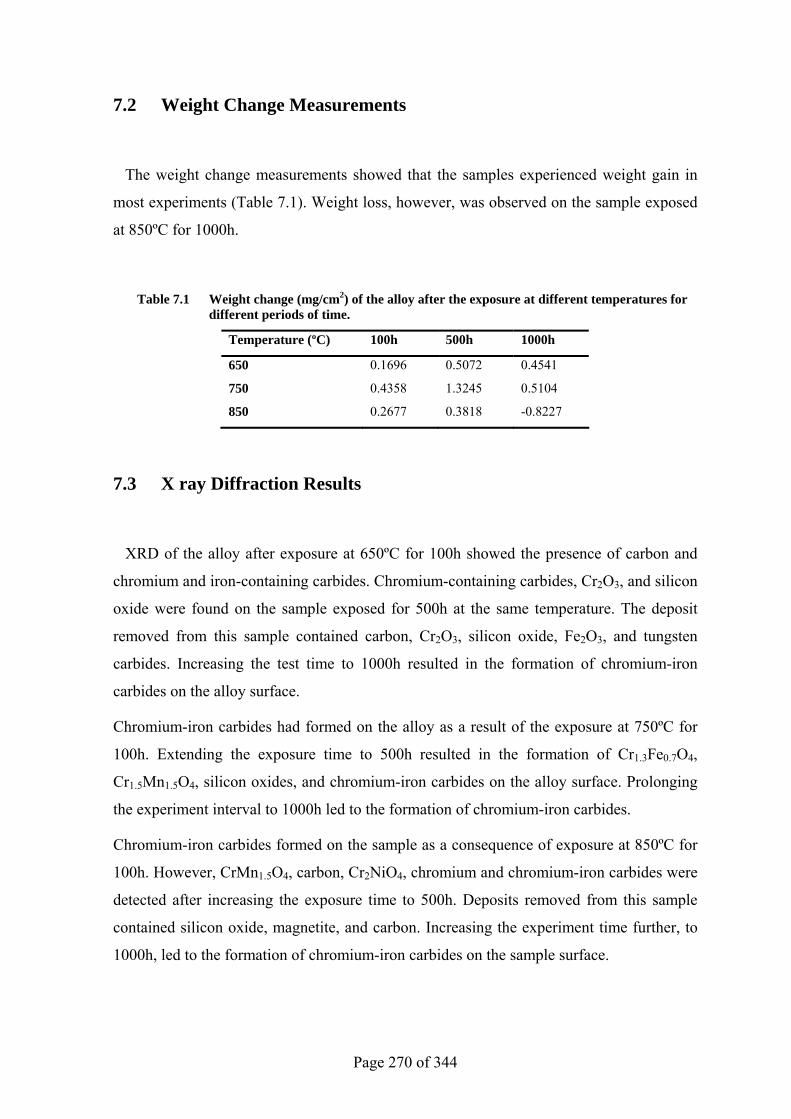
Page 270 of 344
7.2 Weight Change Measurements
The weight change measurements showed that the samples experienced weight gain in
most experiments (Table 7.1). Weight loss, however, was observed on the sample exposed
at 850ºC for 1000h.
Table 7.1 Weight change (mg/cm2) of the alloy after the exposure at different temperatures for different periods of time.
Temperature (ºC) 100h 500h 1000h
650 0.1696 0.5072 0.4541
750 0.4358 1.3245 0.5104
850 0.2677 0.3818 -0.8227
7.3 X ray Diffraction Results
XRD of the alloy after exposure at 650ºC for 100h showed the presence of carbon and
chromium and iron-containing carbides. Chromium-containing carbides, Cr2O3, and silicon
oxide were found on the sample exposed for 500h at the same temperature. The deposit
removed from this sample contained carbon, Cr2O3, silicon oxide, Fe2O3, and tungsten
carbides. Increasing the test time to 1000h resulted in the formation of chromium-iron
carbides on the alloy surface.
Chromium-iron carbides had formed on the alloy as a result of the exposure at 750ºC for
100h. Extending the exposure time to 500h resulted in the formation of Cr1.3Fe0.7O4,
Cr1.5Mn1.5O4, silicon oxides, and chromium-iron carbides on the alloy surface. Prolonging
the experiment interval to 1000h led to the formation of chromium-iron carbides.
Chromium-iron carbides formed on the sample as a consequence of exposure at 850ºC for
100h. However, CrMn1.5O4, carbon, Cr2NiO4, chromium and chromium-iron carbides were
detected after increasing the exposure time to 500h. Deposits removed from this sample
contained silicon oxide, magnetite, and carbon. Increasing the experiment time further, to
1000h, led to the formation of chromium-iron carbides on the sample surface.
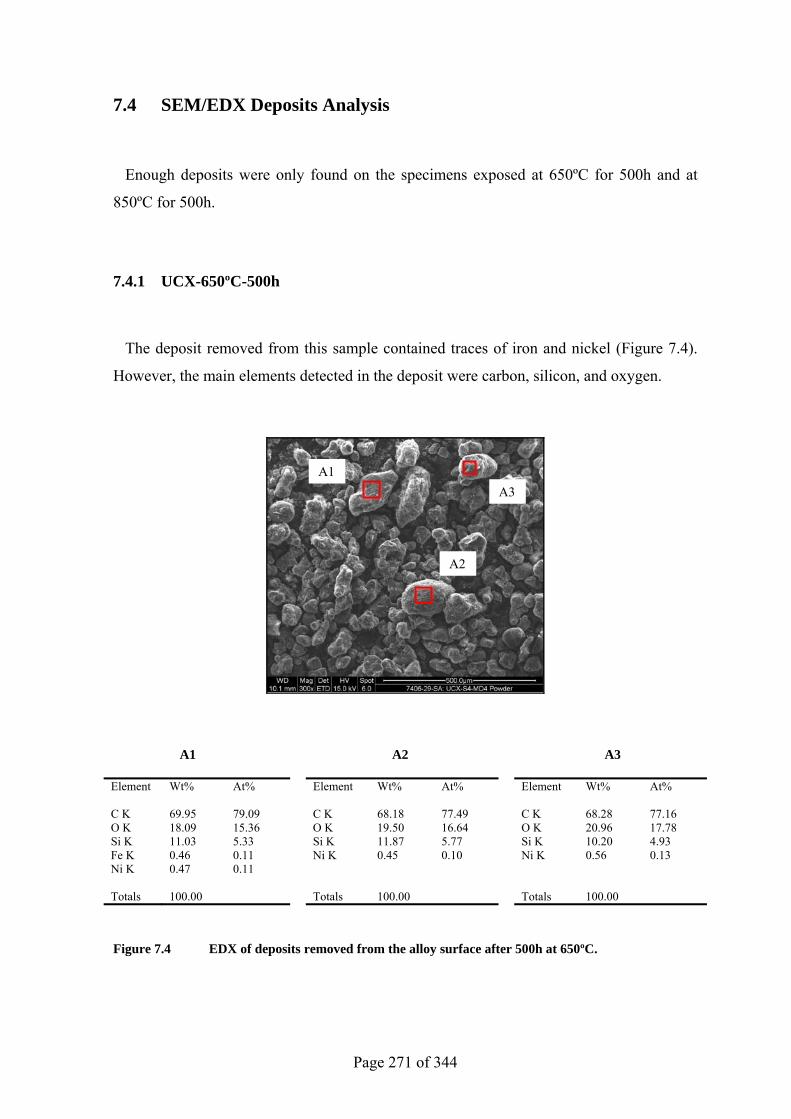
Page 271 of 344
7.4 SEM/EDX Deposits Analysis
Enough deposits were only found on the specimens exposed at 650ºC for 500h and at
850ºC for 500h.
7.4.1 UCX-650ºC-500h
The deposit removed from this sample contained traces of iron and nickel (Figure 7.4).
However, the main elements detected in the deposit were carbon, silicon, and oxygen.
A1 A2 A3
Element Wt% At% Element Wt% At% Element Wt% At% C K 69.95 79.09 C K 68.18 77.49 C K 68.28 77.16 O K 18.09 15.36 O K 19.50 16.64 O K 20.96 17.78 Si K 11.03 5.33 Si K 11.87 5.77 Si K 10.20 4.93 Fe K 0.46 0.11 Ni K 0.45 0.10 Ni K 0.56 0.13 Ni K 0.47 0.11 Totals 100.00 Totals 100.00 Totals 100.00
Figure 7.4 EDX of deposits removed from the alloy surface after 500h at 650ºC.
A1
A2
A3
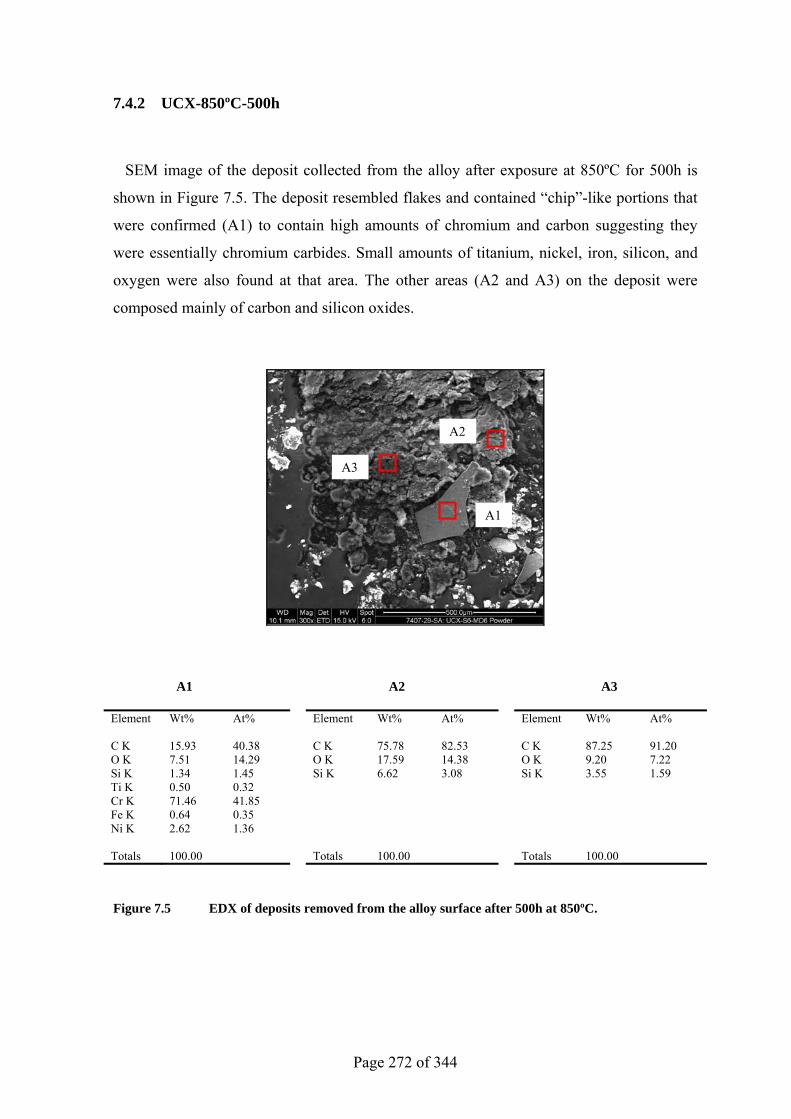
Page 272 of 344
7.4.2 UCX-850ºC-500h
SEM image of the deposit collected from the alloy after exposure at 850ºC for 500h is
shown in Figure 7.5. The deposit resembled flakes and contained “chip”-like portions that
were confirmed (A1) to contain high amounts of chromium and carbon suggesting they
were essentially chromium carbides. Small amounts of titanium, nickel, iron, silicon, and
oxygen were also found at that area. The other areas (A2 and A3) on the deposit were
composed mainly of carbon and silicon oxides.
A1 A2 A3
Element Wt% At% Element Wt% At% Element Wt% At% C K 15.93 40.38 C K 75.78 82.53 C K 87.25 91.20 O K 7.51 14.29 O K 17.59 14.38 O K 9.20 7.22 Si K 1.34 1.45 Si K 6.62 3.08 Si K 3.55 1.59 Ti K 0.50 0.32 Cr K 71.46 41.85 Fe K 0.64 0.35 Ni K 2.62 1.36 Totals 100.00 Totals 100.00 Totals 100.00
Figure 7.5 EDX of deposits removed from the alloy surface after 500h at 850ºC.
A1
A2
A3
Page 273 of 344
7.5 Surface Analyses
7.5.1 UCX-650ºC-100h
Figures 7.6 and 7.7 show the surface of the alloy after exposure at 650ºC for 100h. The
alloy was completely covered with a layer that was analysed and found to be composed of
oxides of chromium, silicon, and manganese (A3 in Figure 7.6). Considerable amounts of
nickel (11.9 wt%) and iron (1.8 wt%) were also detected. Some deposit islands that seemed
to be residuals from an external layer, which was possibly removed by cleaning, were also
analysed (A1 and A2) and found to have carbon as the main constituent with
comparatively low oxygen levels.
The alloy surface beneath the layer could not be examined as no area was found exposed.
Indeed, the layer chemical composition has varied from one place to the other (A2 and A3
in Figure 7.7). More carbon was detected mixing with the oxides at A2 unlike that found at
A3 where more oxides had developed.
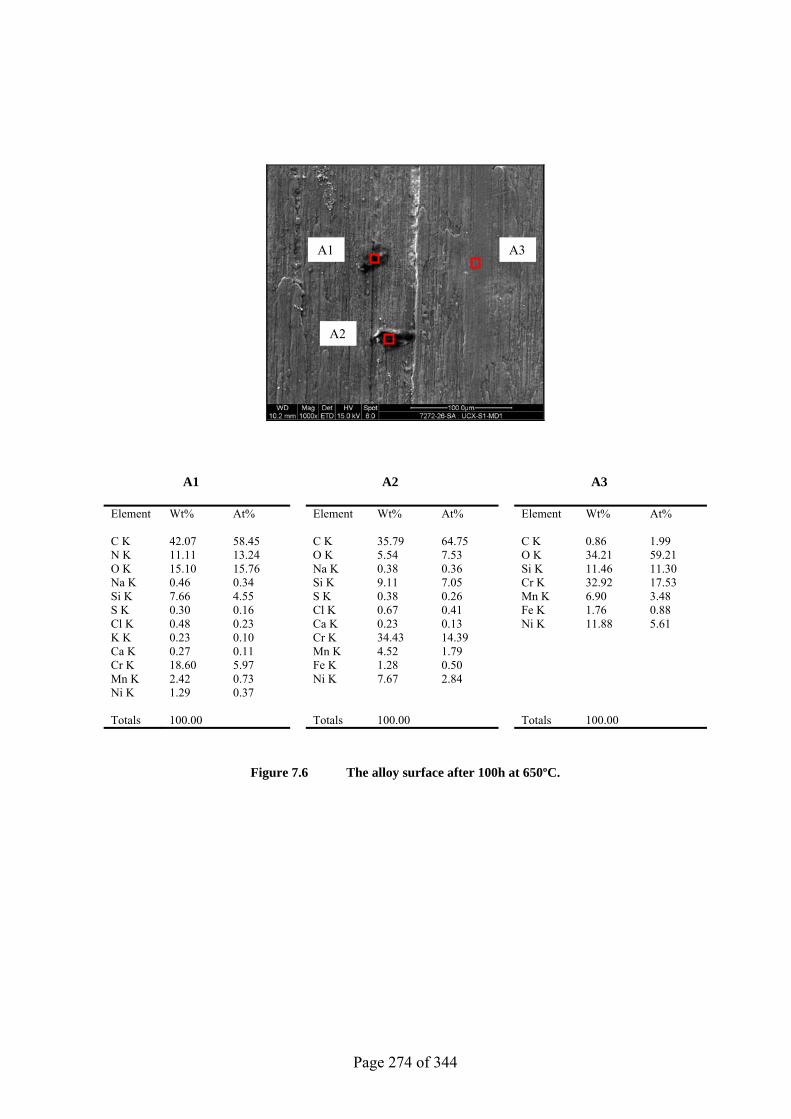
Page 274 of 344
A1 A2 A3
Element Wt% At% Element Wt% At% Element Wt% At% C K 42.07 58.45 C K 35.79 64.75 C K 0.86 1.99 N K 11.11 13.24 O K 5.54 7.53 O K 34.21 59.21 O K 15.10 15.76 Na K 0.38 0.36 Si K 11.46 11.30 Na K 0.46 0.34 Si K 9.11 7.05 Cr K 32.92 17.53 Si K 7.66 4.55 S K 0.38 0.26 Mn K 6.90 3.48 S K 0.30 0.16 Cl K 0.67 0.41 Fe K 1.76 0.88 Cl K 0.48 0.23 Ca K 0.23 0.13 Ni K 11.88 5.61 K K 0.23 0.10 Cr K 34.43 14.39 Ca K 0.27 0.11 Mn K 4.52 1.79 Cr K 18.60 5.97 Fe K 1.28 0.50 Mn K 2.42 0.73 Ni K 7.67 2.84 Ni K 1.29 0.37 Totals 100.00 Totals 100.00 Totals 100.00
Figure 7.6 The alloy surface after 100h at 650ºC.
A1
A2
A3
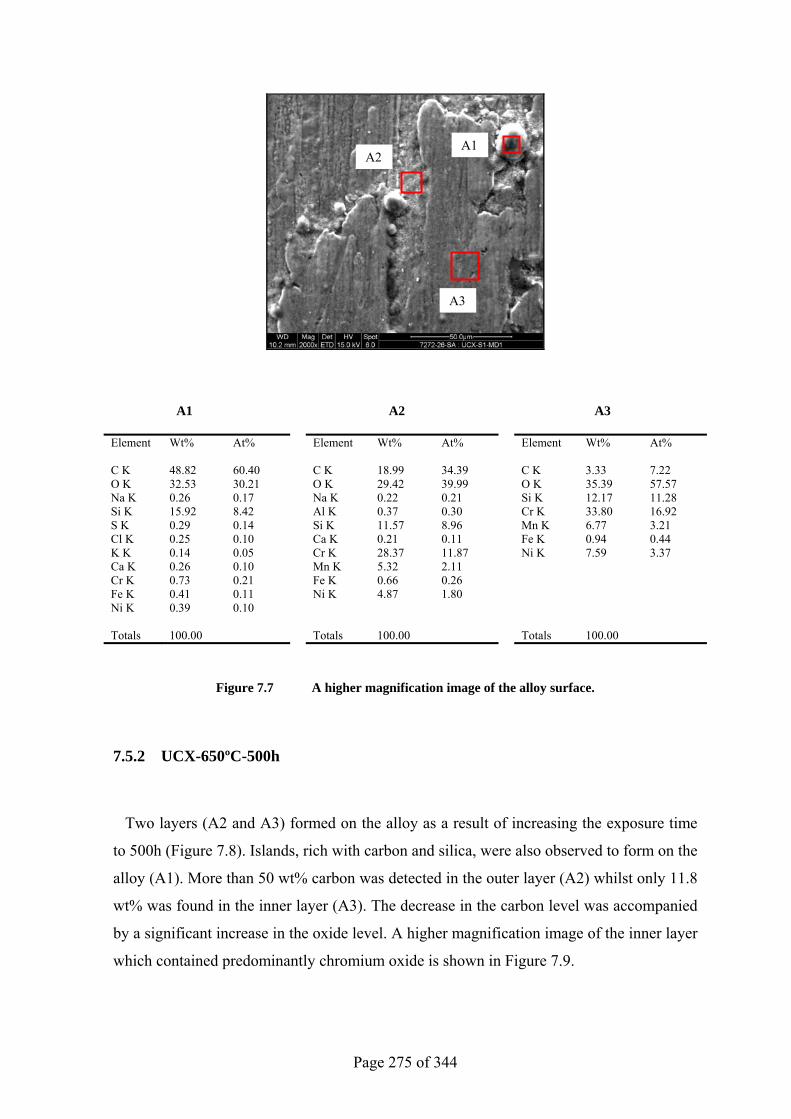
Page 275 of 344
A1 A2 A3
Element Wt% At% Element Wt% At% Element Wt% At% C K 48.82 60.40 C K 18.99 34.39 C K 3.33 7.22 O K 32.53 30.21 O K 29.42 39.99 O K 35.39 57.57 Na K 0.26 0.17 Na K 0.22 0.21 Si K 12.17 11.28 Si K 15.92 8.42 Al K 0.37 0.30 Cr K 33.80 16.92 S K 0.29 0.14 Si K 11.57 8.96 Mn K 6.77 3.21 Cl K 0.25 0.10 Ca K 0.21 0.11 Fe K 0.94 0.44 K K 0.14 0.05 Cr K 28.37 11.87 Ni K 7.59 3.37 Ca K 0.26 0.10 Mn K 5.32 2.11 Cr K 0.73 0.21 Fe K 0.66 0.26 Fe K 0.41 0.11 Ni K 4.87 1.80 Ni K 0.39 0.10 Totals 100.00 Totals 100.00 Totals 100.00
Figure 7.7 A higher magnification image of the alloy surface.
7.5.2 UCX-650ºC-500h
Two layers (A2 and A3) formed on the alloy as a result of increasing the exposure time
to 500h (Figure 7.8). Islands, rich with carbon and silica, were also observed to form on the
alloy (A1). More than 50 wt% carbon was detected in the outer layer (A2) whilst only 11.8
wt% was found in the inner layer (A3). The decrease in the carbon level was accompanied
by a significant increase in the oxide level. A higher magnification image of the inner layer
which contained predominantly chromium oxide is shown in Figure 7.9.
A1A2
A3
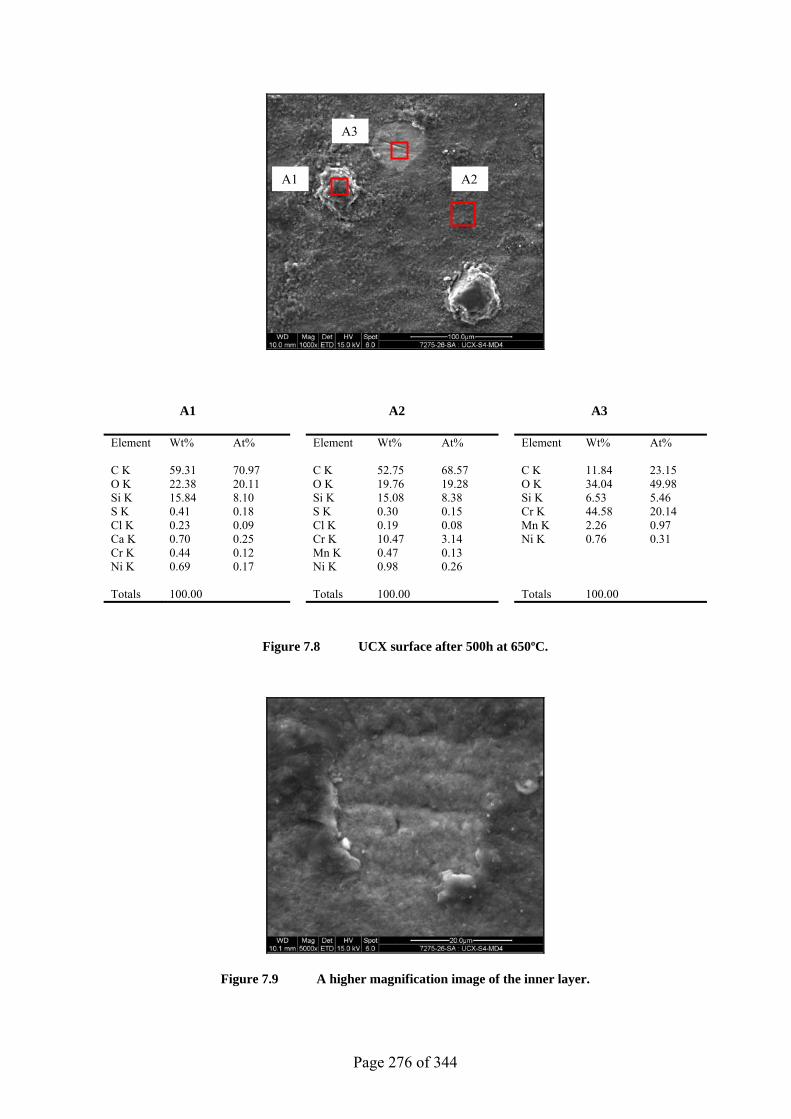
Page 276 of 344
A1 A2 A3
Element Wt% At% Element Wt% At% Element Wt% At% C K 59.31 70.97 C K 52.75 68.57 C K 11.84 23.15 O K 22.38 20.11 O K 19.76 19.28 O K 34.04 49.98 Si K 15.84 8.10 Si K 15.08 8.38 Si K 6.53 5.46 S K 0.41 0.18 S K 0.30 0.15 Cr K 44.58 20.14 Cl K 0.23 0.09 Cl K 0.19 0.08 Mn K 2.26 0.97 Ca K 0.70 0.25 Cr K 10.47 3.14 Ni K 0.76 0.31 Cr K 0.44 0.12 Mn K 0.47 0.13 Ni K 0.69 0.17 Ni K 0.98 0.26 Totals 100.00 Totals 100.00 Totals 100.00
Figure 7.8 UCX surface after 500h at 650ºC.
Figure 7.9 A higher magnification image of the inner layer.
A1
A3
A2
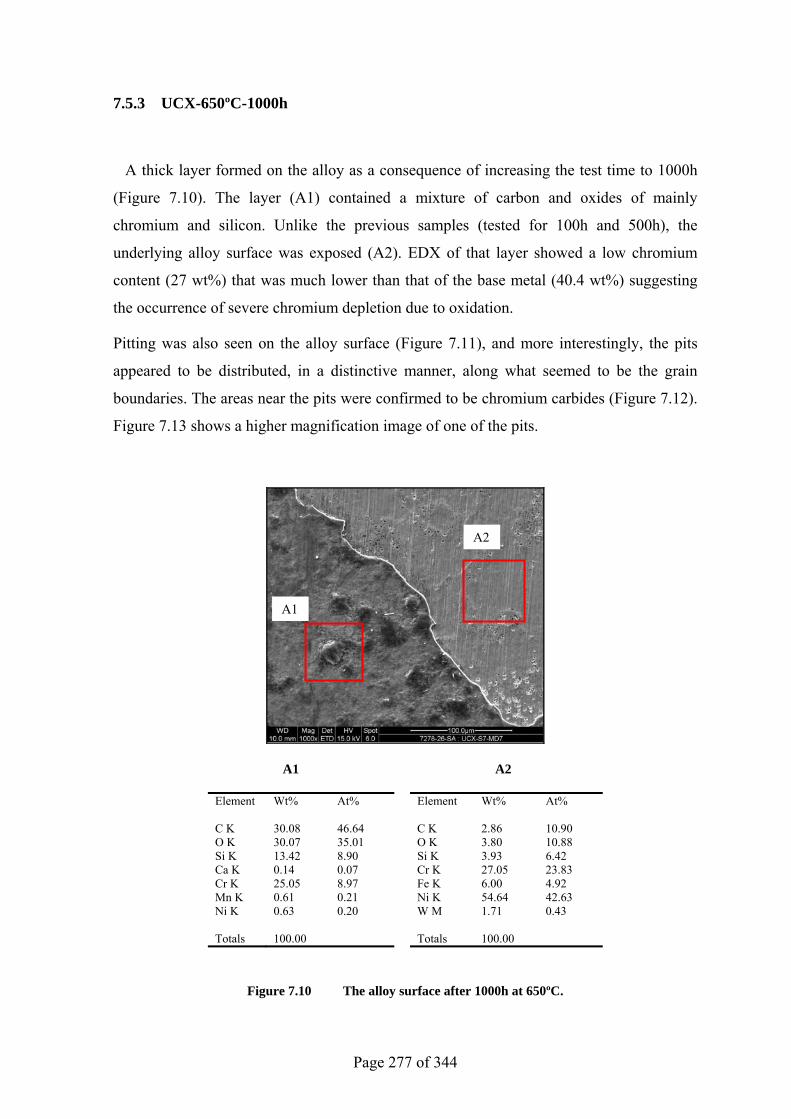
Page 277 of 344
7.5.3 UCX-650ºC-1000h
A thick layer formed on the alloy as a consequence of increasing the test time to 1000h
(Figure 7.10). The layer (A1) contained a mixture of carbon and oxides of mainly
chromium and silicon. Unlike the previous samples (tested for 100h and 500h), the
underlying alloy surface was exposed (A2). EDX of that layer showed a low chromium
content (27 wt%) that was much lower than that of the base metal (40.4 wt%) suggesting
the occurrence of severe chromium depletion due to oxidation.
Pitting was also seen on the alloy surface (Figure 7.11), and more interestingly, the pits
appeared to be distributed, in a distinctive manner, along what seemed to be the grain
boundaries. The areas near the pits were confirmed to be chromium carbides (Figure 7.12).
Figure 7.13 shows a higher magnification image of one of the pits.
A1 A2
Element Wt% At% Element Wt% At% C K 30.08 46.64 C K 2.86 10.90 O K 30.07 35.01 O K 3.80 10.88 Si K 13.42 8.90 Si K 3.93 6.42 Ca K 0.14 0.07 Cr K 27.05 23.83 Cr K 25.05 8.97 Fe K 6.00 4.92 Mn K 0.61 0.21 Ni K 54.64 42.63 Ni K 0.63 0.20 W M 1.71 0.43 Totals 100.00 Totals 100.00
Figure 7.10 The alloy surface after 1000h at 650ºC.
A2
A1
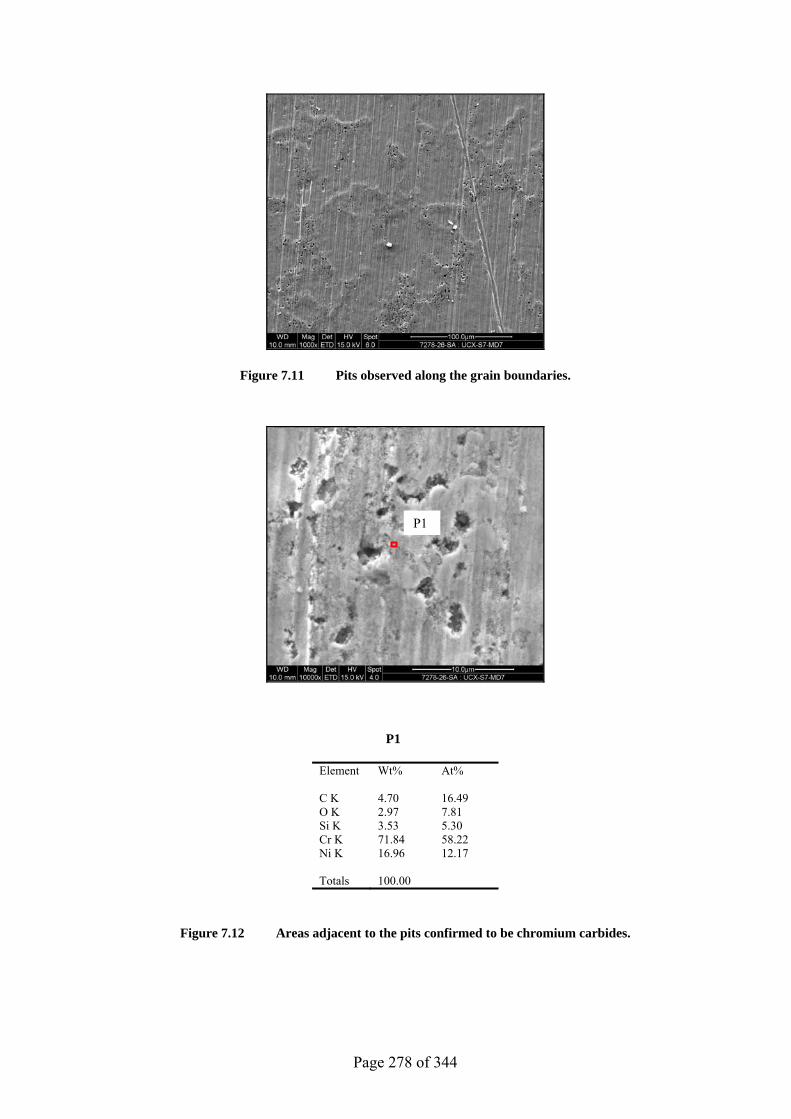
Page 278 of 344
Figure 7.11 Pits observed along the grain boundaries.
P1
Element Wt% At% C K 4.70 16.49 O K 2.97 7.81 Si K 3.53 5.30 Cr K 71.84 58.22 Ni K 16.96 12.17 Totals 100.00
Figure 7.12 Areas adjacent to the pits confirmed to be chromium carbides.
P1
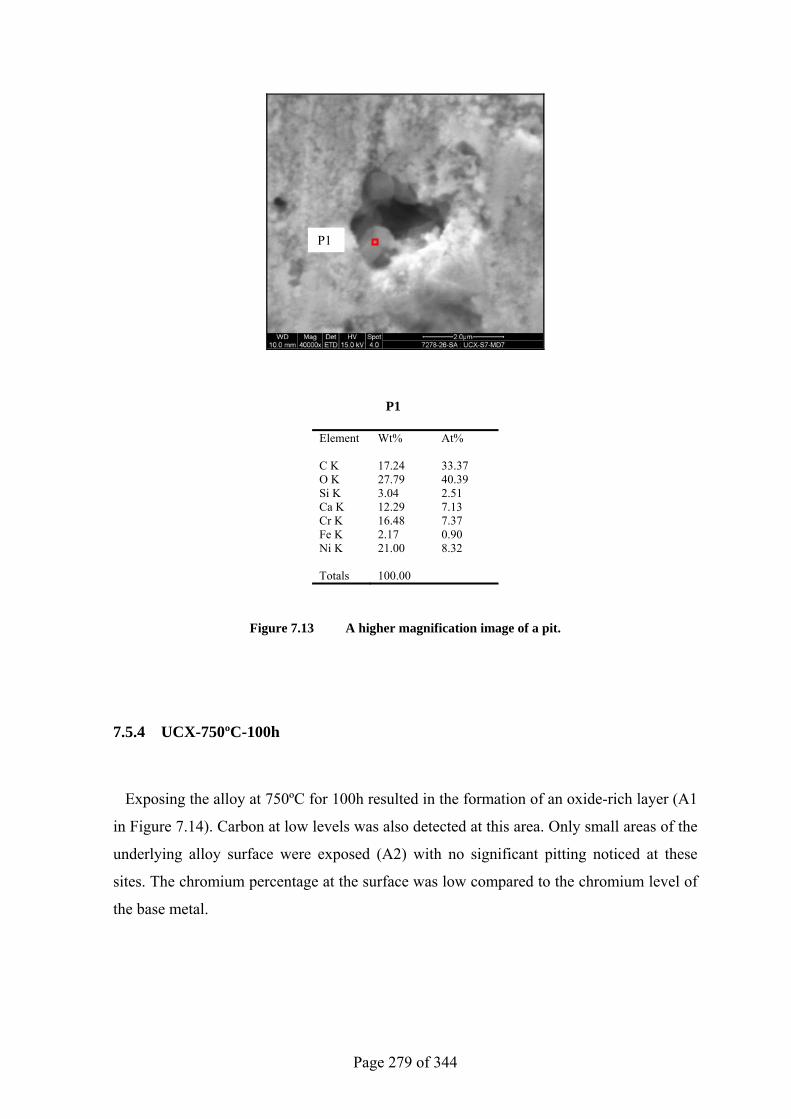
Page 279 of 344
P1
Element Wt% At% C K 17.24 33.37 O K 27.79 40.39 Si K 3.04 2.51 Ca K 12.29 7.13 Cr K 16.48 7.37 Fe K 2.17 0.90 Ni K 21.00 8.32 Totals 100.00
Figure 7.13 A higher magnification image of a pit.
7.5.4 UCX-750ºC-100h
Exposing the alloy at 750ºC for 100h resulted in the formation of an oxide-rich layer (A1
in Figure 7.14). Carbon at low levels was also detected at this area. Only small areas of the
underlying alloy surface were exposed (A2) with no significant pitting noticed at these
sites. The chromium percentage at the surface was low compared to the chromium level of
the base metal.
P1
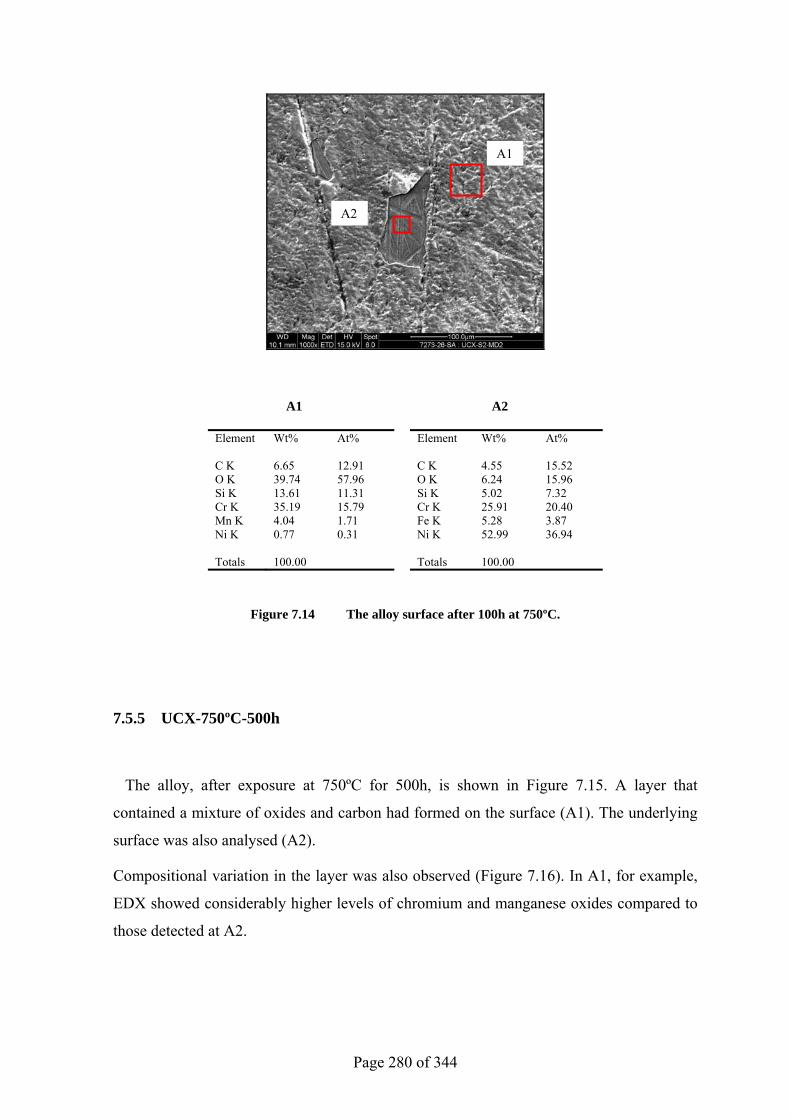
Page 280 of 344
A1 A2
Element Wt% At% Element Wt% At% C K 6.65 12.91 C K 4.55 15.52 O K 39.74 57.96 O K 6.24 15.96 Si K 13.61 11.31 Si K 5.02 7.32 Cr K 35.19 15.79 Cr K 25.91 20.40 Mn K 4.04 1.71 Fe K 5.28 3.87 Ni K 0.77 0.31 Ni K 52.99 36.94 Totals 100.00 Totals 100.00
Figure 7.14 The alloy surface after 100h at 750ºC.
7.5.5 UCX-750ºC-500h
The alloy, after exposure at 750ºC for 500h, is shown in Figure 7.15. A layer that
contained a mixture of oxides and carbon had formed on the surface (A1). The underlying
surface was also analysed (A2).
Compositional variation in the layer was also observed (Figure 7.16). In A1, for example,
EDX showed considerably higher levels of chromium and manganese oxides compared to
those detected at A2.
A1
A2
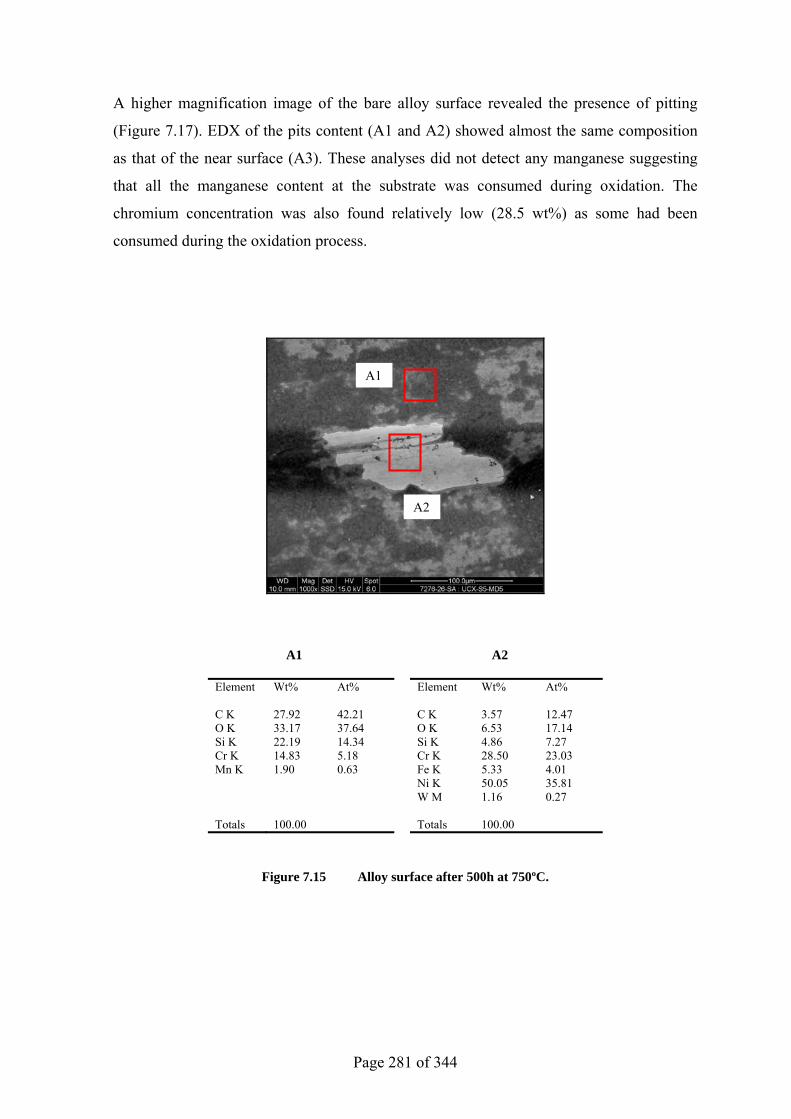
Page 281 of 344
A higher magnification image of the bare alloy surface revealed the presence of pitting
(Figure 7.17). EDX of the pits content (A1 and A2) showed almost the same composition
as that of the near surface (A3). These analyses did not detect any manganese suggesting
that all the manganese content at the substrate was consumed during oxidation. The
chromium concentration was also found relatively low (28.5 wt%) as some had been
consumed during the oxidation process.
A1 A2
Element Wt% At% Element Wt% At% C K 27.92 42.21 C K 3.57 12.47 O K 33.17 37.64 O K 6.53 17.14 Si K 22.19 14.34 Si K 4.86 7.27 Cr K 14.83 5.18 Cr K 28.50 23.03 Mn K 1.90 0.63 Fe K 5.33 4.01 Ni K 50.05 35.81 W M 1.16 0.27 Totals 100.00 Totals 100.00
Figure 7.15 Alloy surface after 500h at 750ºC.
A1
A2
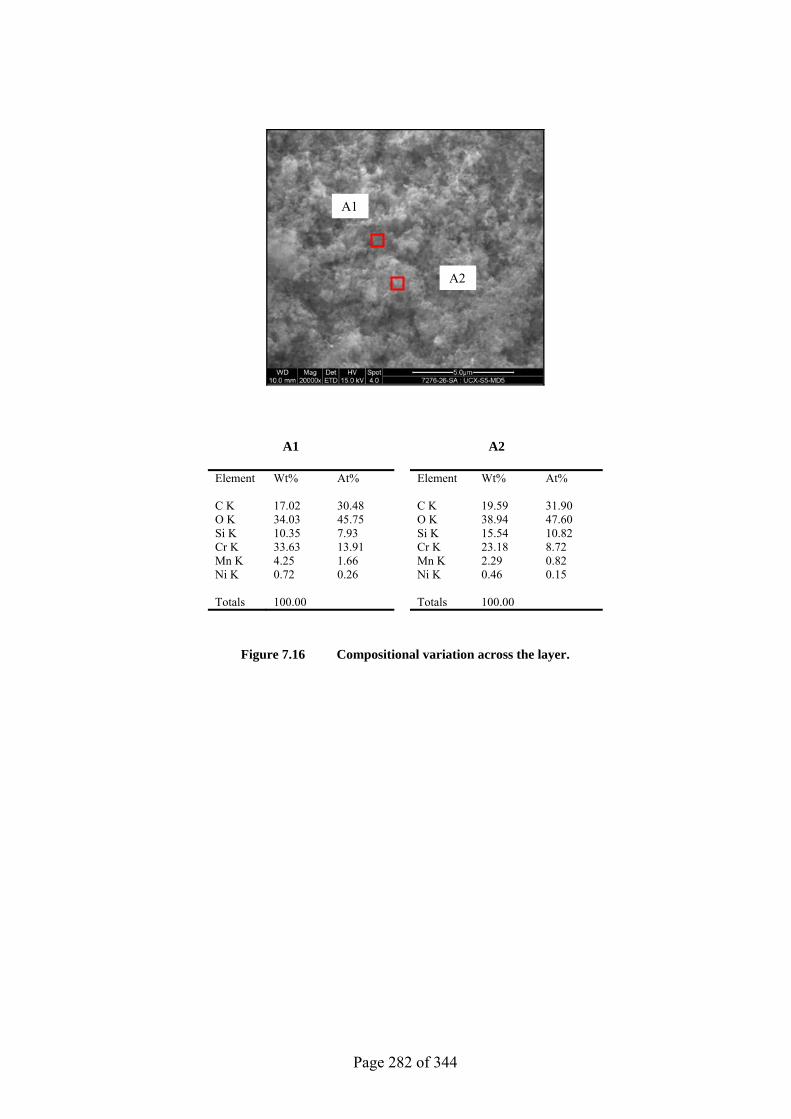
Page 282 of 344
A1 A2
Element Wt% At% Element Wt% At% C K 17.02 30.48 C K 19.59 31.90 O K 34.03 45.75 O K 38.94 47.60 Si K 10.35 7.93 Si K 15.54 10.82 Cr K 33.63 13.91 Cr K 23.18 8.72 Mn K 4.25 1.66 Mn K 2.29 0.82 Ni K 0.72 0.26 Ni K 0.46 0.15 Totals 100.00 Totals 100.00
Figure 7.16 Compositional variation across the layer.
A1
A2
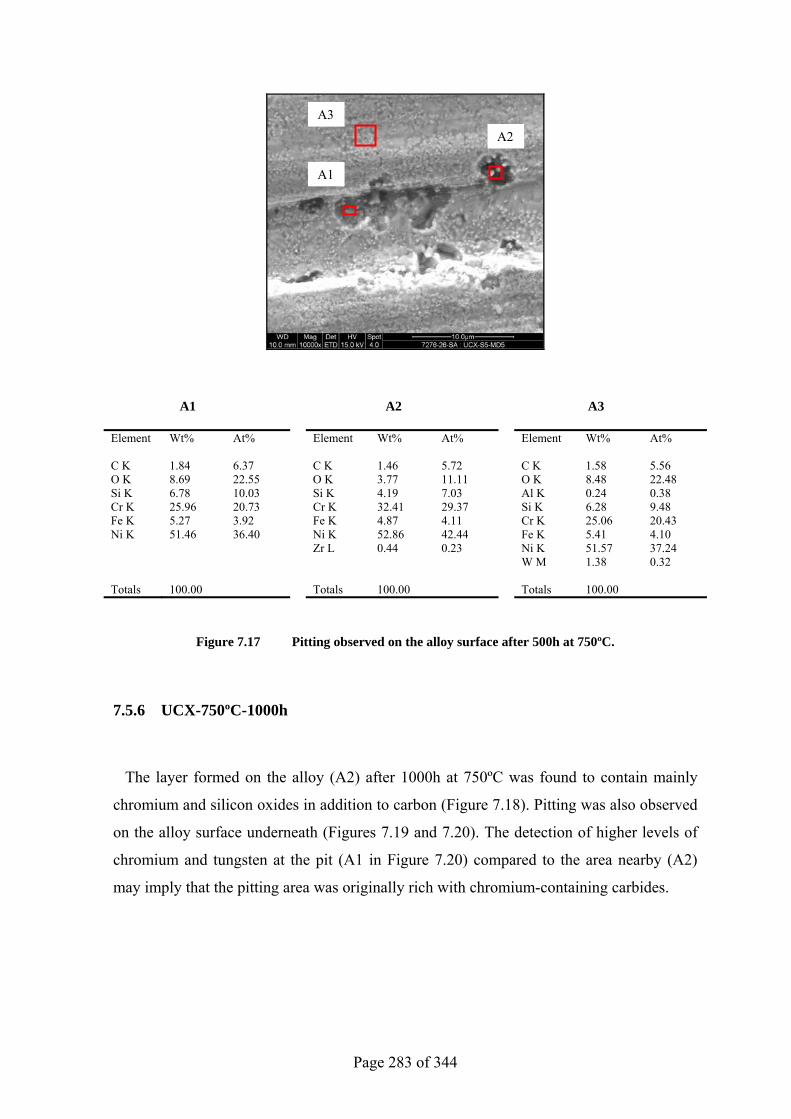
Page 283 of 344
A1 A2 A3
Element Wt% At% Element Wt% At% Element Wt% At% C K 1.84 6.37 C K 1.46 5.72 C K 1.58 5.56 O K 8.69 22.55 O K 3.77 11.11 O K 8.48 22.48 Si K 6.78 10.03 Si K 4.19 7.03 Al K 0.24 0.38 Cr K 25.96 20.73 Cr K 32.41 29.37 Si K 6.28 9.48 Fe K 5.27 3.92 Fe K 4.87 4.11 Cr K 25.06 20.43 Ni K 51.46 36.40 Ni K 52.86 42.44 Fe K 5.41 4.10 Zr L 0.44 0.23 Ni K 51.57 37.24 W M 1.38 0.32 Totals 100.00 Totals 100.00 Totals 100.00
Figure 7.17 Pitting observed on the alloy surface after 500h at 750ºC.
7.5.6 UCX-750ºC-1000h
The layer formed on the alloy (A2) after 1000h at 750ºC was found to contain mainly
chromium and silicon oxides in addition to carbon (Figure 7.18). Pitting was also observed
on the alloy surface underneath (Figures 7.19 and 7.20). The detection of higher levels of
chromium and tungsten at the pit (A1 in Figure 7.20) compared to the area nearby (A2)
may imply that the pitting area was originally rich with chromium-containing carbides.
A1
A2
A3
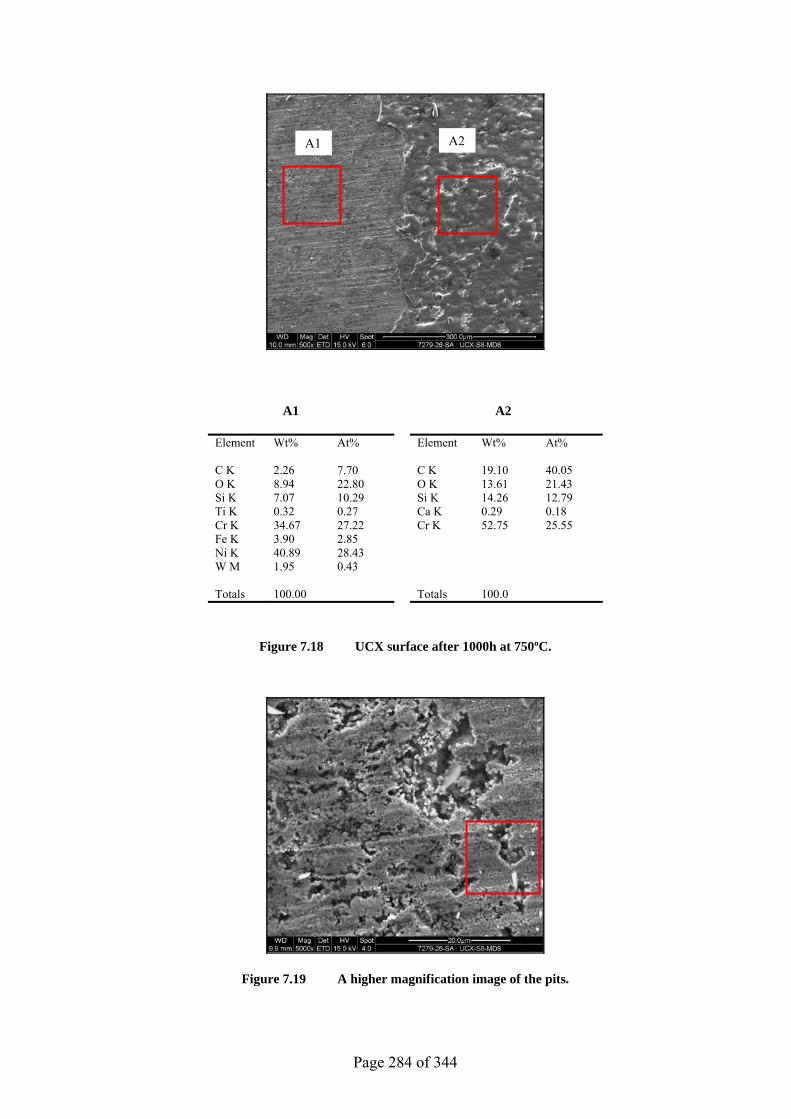
Page 284 of 344
A1 A2
Element Wt% At% Element Wt% At% C K 2.26 7.70 C K 19.10 40.05 O K 8.94 22.80 O K 13.61 21.43 Si K 7.07 10.29 Si K 14.26 12.79 Ti K 0.32 0.27 Ca K 0.29 0.18 Cr K 34.67 27.22 Cr K 52.75 25.55 Fe K 3.90 2.85 Ni K 40.89 28.43 W M 1.95 0.43 Totals 100.00 Totals 100.0
Figure 7.18 UCX surface after 1000h at 750ºC.
Figure 7.19 A higher magnification image of the pits.
A1 A2
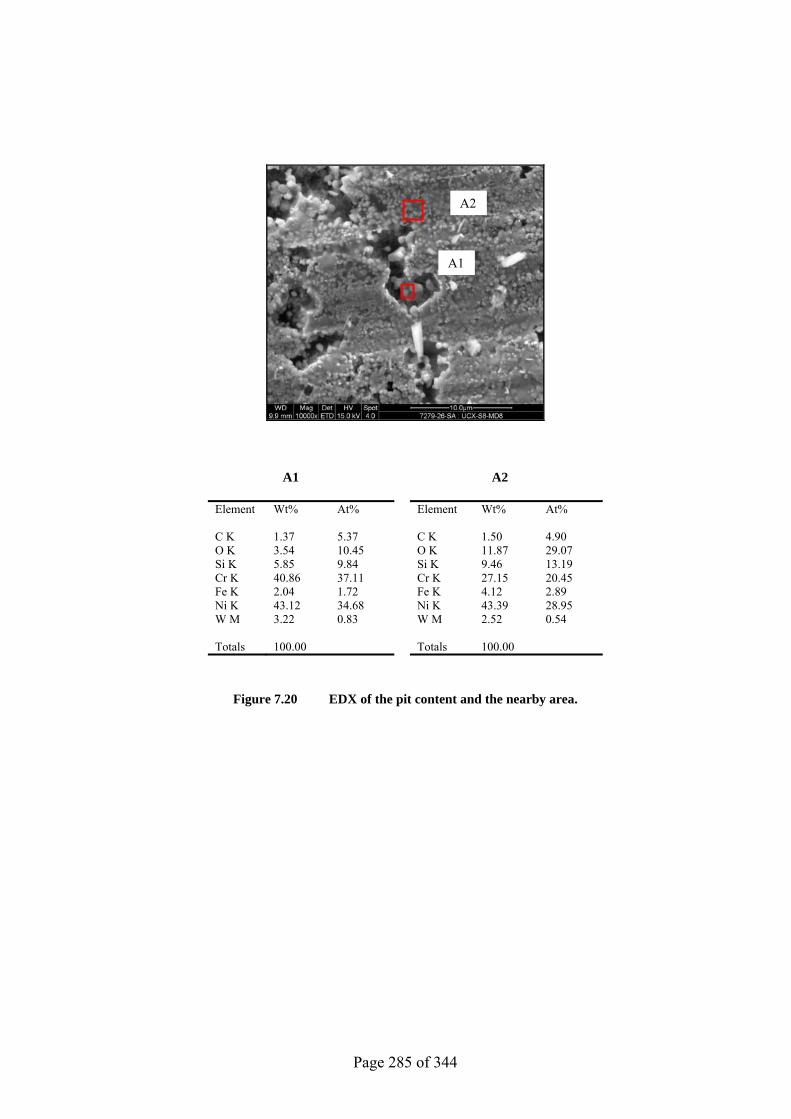
Page 285 of 344
A1 A2
Element Wt% At% Element Wt% At% C K 1.37 5.37 C K 1.50 4.90 O K 3.54 10.45 O K 11.87 29.07 Si K 5.85 9.84 Si K 9.46 13.19 Cr K 40.86 37.11 Cr K 27.15 20.45 Fe K 2.04 1.72 Fe K 4.12 2.89 Ni K 43.12 34.68 Ni K 43.39 28.95 W M 3.22 0.83 W M 2.52 0.54 Totals 100.00 Totals 100.00
Figure 7.20 EDX of the pit content and the nearby area.
A1
A2
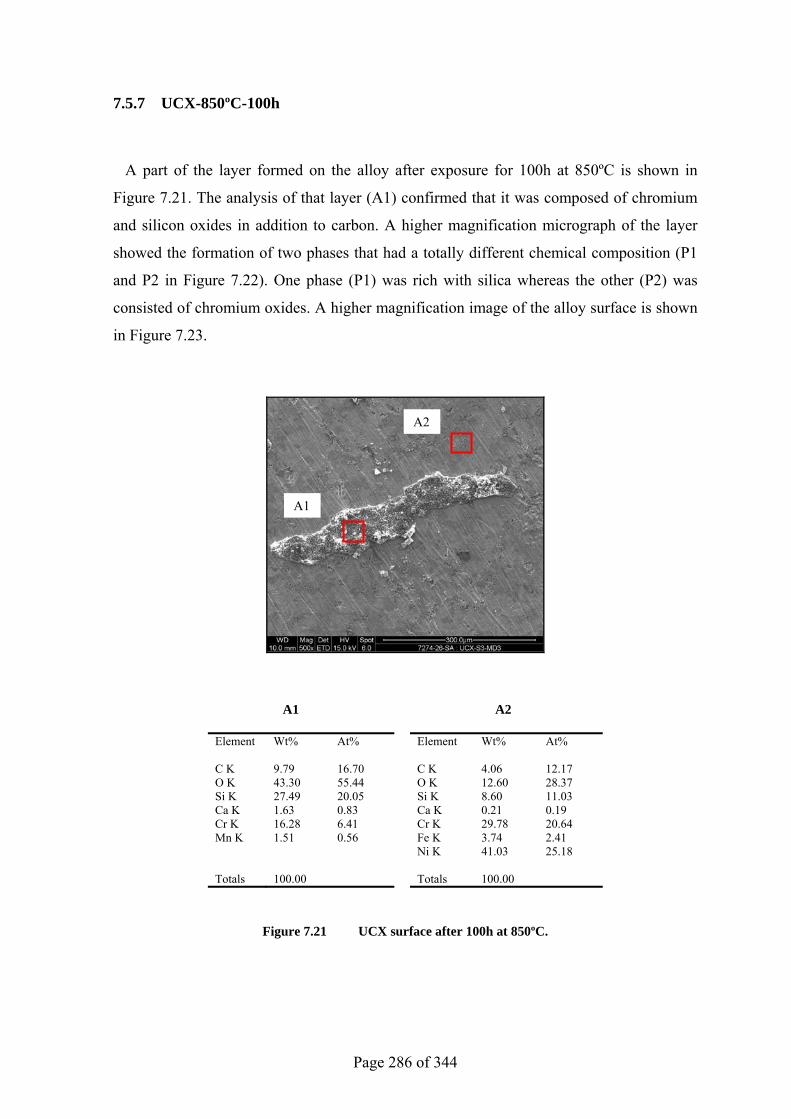
Page 286 of 344
7.5.7 UCX-850ºC-100h
A part of the layer formed on the alloy after exposure for 100h at 850ºC is shown in
Figure 7.21. The analysis of that layer (A1) confirmed that it was composed of chromium
and silicon oxides in addition to carbon. A higher magnification micrograph of the layer
showed the formation of two phases that had a totally different chemical composition (P1
and P2 in Figure 7.22). One phase (P1) was rich with silica whereas the other (P2) was
consisted of chromium oxides. A higher magnification image of the alloy surface is shown
in Figure 7.23.
A1 A2
Element Wt% At% Element Wt% At% C K 9.79 16.70 C K 4.06 12.17 O K 43.30 55.44 O K 12.60 28.37 Si K 27.49 20.05 Si K 8.60 11.03 Ca K 1.63 0.83 Ca K 0.21 0.19 Cr K 16.28 6.41 Cr K 29.78 20.64 Mn K 1.51 0.56 Fe K 3.74 2.41 Ni K 41.03 25.18 Totals 100.00 Totals 100.00
Figure 7.21 UCX surface after 100h at 850ºC.
A1
A2
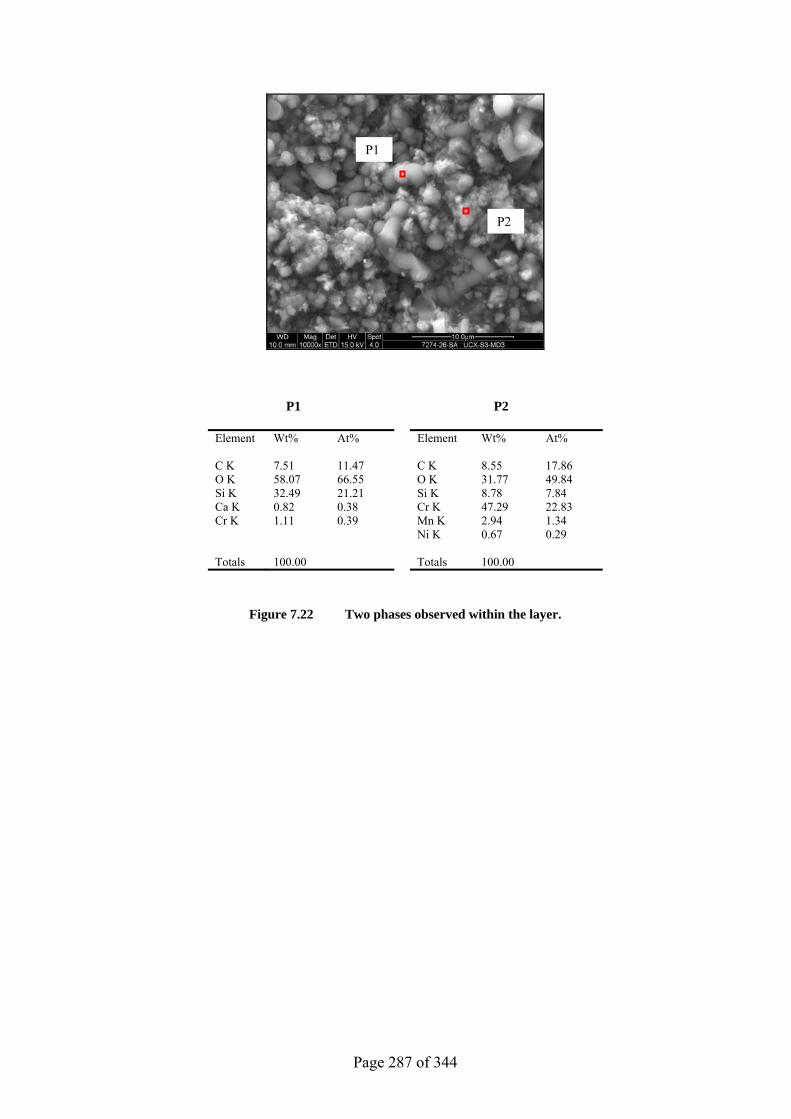
Page 287 of 344
P1 P2
Element Wt% At% Element Wt% At% C K 7.51 11.47 C K 8.55 17.86 O K 58.07 66.55 O K 31.77 49.84 Si K 32.49 21.21 Si K 8.78 7.84 Ca K 0.82 0.38 Cr K 47.29 22.83 Cr K 1.11 0.39 Mn K 2.94 1.34 Ni K 0.67 0.29 Totals 100.00 Totals 100.00
Figure 7.22 Two phases observed within the layer.
P1
P2
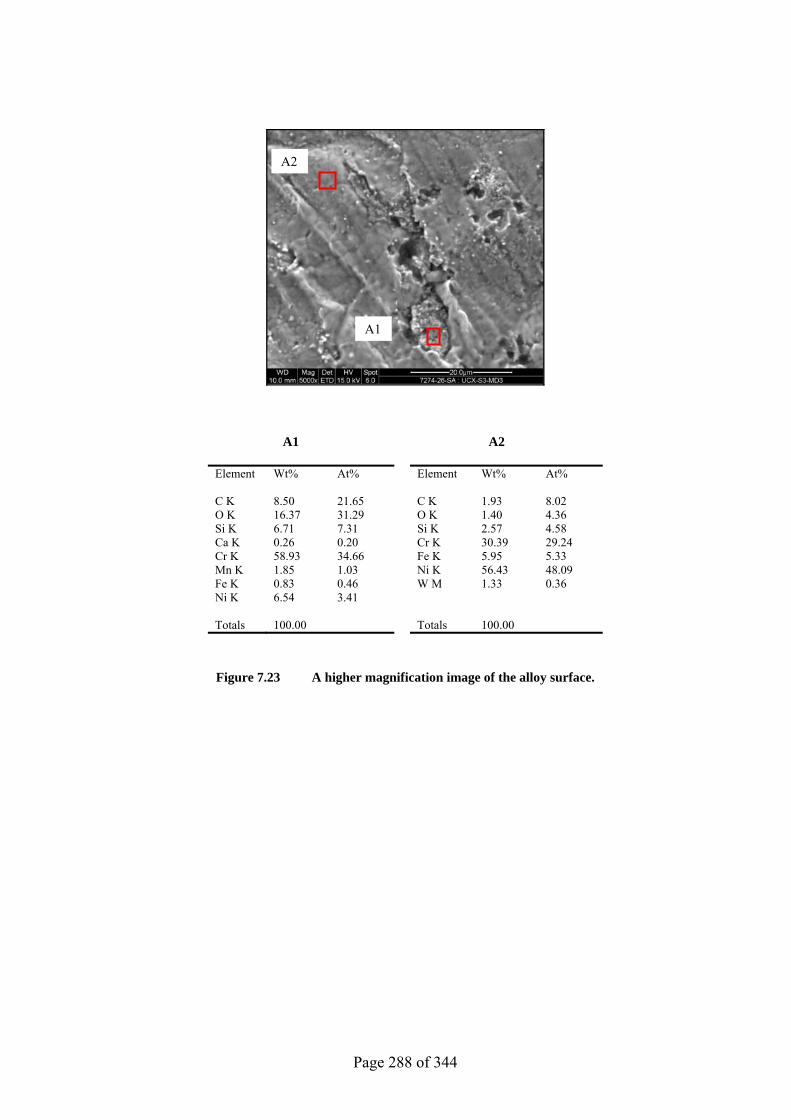
Page 288 of 344
A1 A2
Element Wt% At% Element Wt% At% C K 8.50 21.65 C K 1.93 8.02 O K 16.37 31.29 O K 1.40 4.36 Si K 6.71 7.31 Si K 2.57 4.58 Ca K 0.26 0.20 Cr K 30.39 29.24 Cr K 58.93 34.66 Fe K 5.95 5.33 Mn K 1.85 1.03 Ni K 56.43 48.09 Fe K 0.83 0.46 W M 1.33 0.36 Ni K 6.54 3.41 Totals 100.00 Totals 100.00
Figure 7.23 A higher magnification image of the alloy surface.
A1
A2
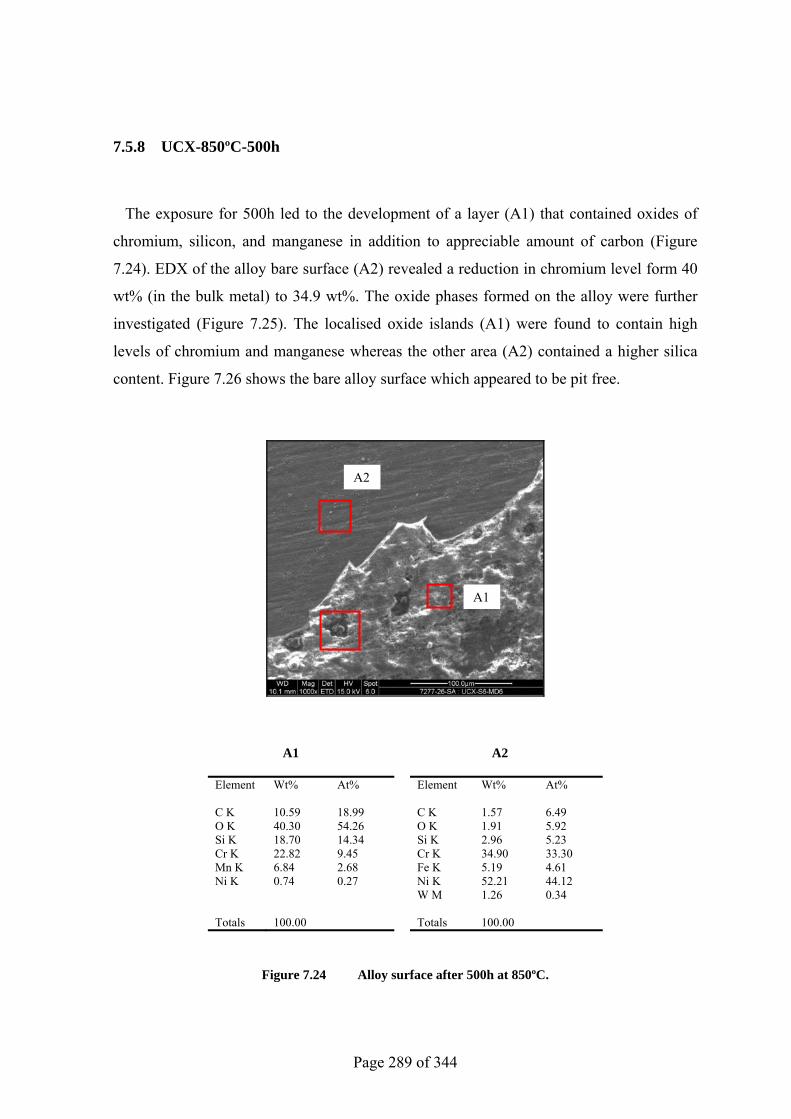
Page 289 of 344
7.5.8 UCX-850ºC-500h
The exposure for 500h led to the development of a layer (A1) that contained oxides of
chromium, silicon, and manganese in addition to appreciable amount of carbon (Figure
7.24). EDX of the alloy bare surface (A2) revealed a reduction in chromium level form 40
wt% (in the bulk metal) to 34.9 wt%. The oxide phases formed on the alloy were further
investigated (Figure 7.25). The localised oxide islands (A1) were found to contain high
levels of chromium and manganese whereas the other area (A2) contained a higher silica
content. Figure 7.26 shows the bare alloy surface which appeared to be pit free.
A1 A2
Element Wt% At% Element Wt% At% C K 10.59 18.99 C K 1.57 6.49 O K 40.30 54.26 O K 1.91 5.92 Si K 18.70 14.34 Si K 2.96 5.23 Cr K 22.82 9.45 Cr K 34.90 33.30 Mn K 6.84 2.68 Fe K 5.19 4.61 Ni K 0.74 0.27 Ni K 52.21 44.12 W M 1.26 0.34 Totals 100.00 Totals 100.00
Figure 7.24 Alloy surface after 500h at 850ºC.
A2
A1
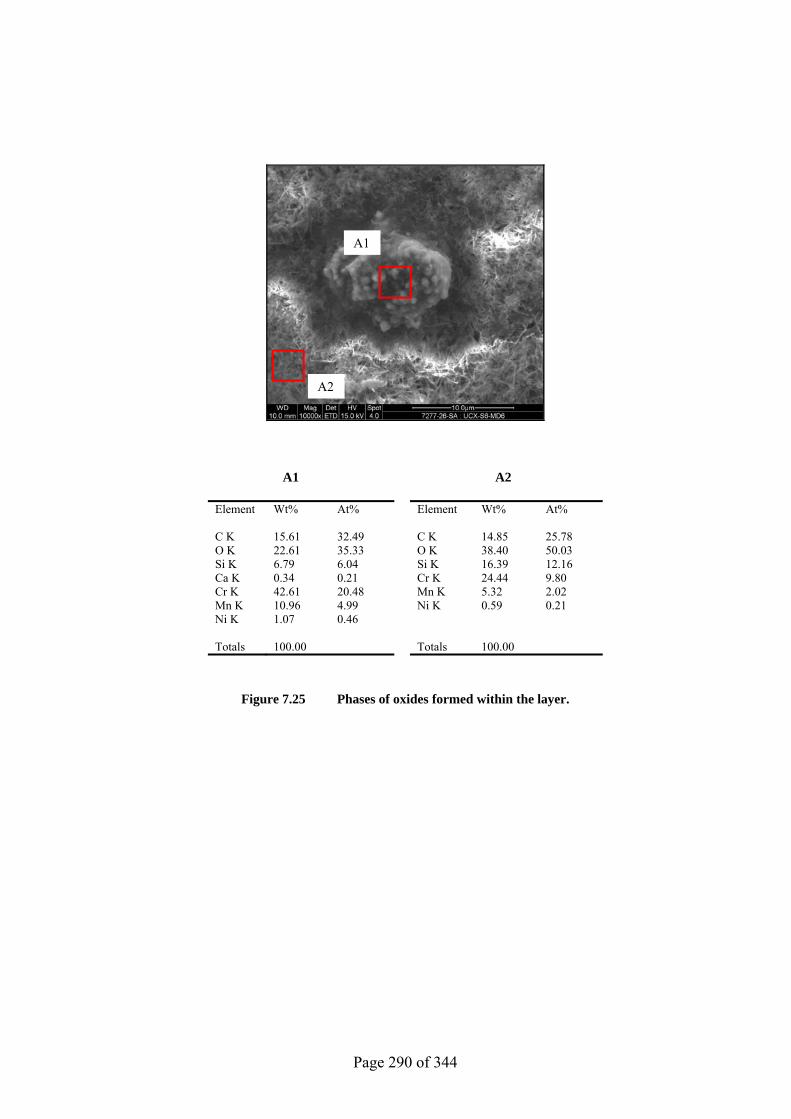
Page 290 of 344
A1 A2
Element Wt% At% Element Wt% At% C K 15.61 32.49 C K 14.85 25.78 O K 22.61 35.33 O K 38.40 50.03 Si K 6.79 6.04 Si K 16.39 12.16 Ca K 0.34 0.21 Cr K 24.44 9.80 Cr K 42.61 20.48 Mn K 5.32 2.02 Mn K 10.96 4.99 Ni K 0.59 0.21 Ni K 1.07 0.46 Totals 100.00 Totals 100.00
Figure 7.25 Phases of oxides formed within the layer.
A1
A2
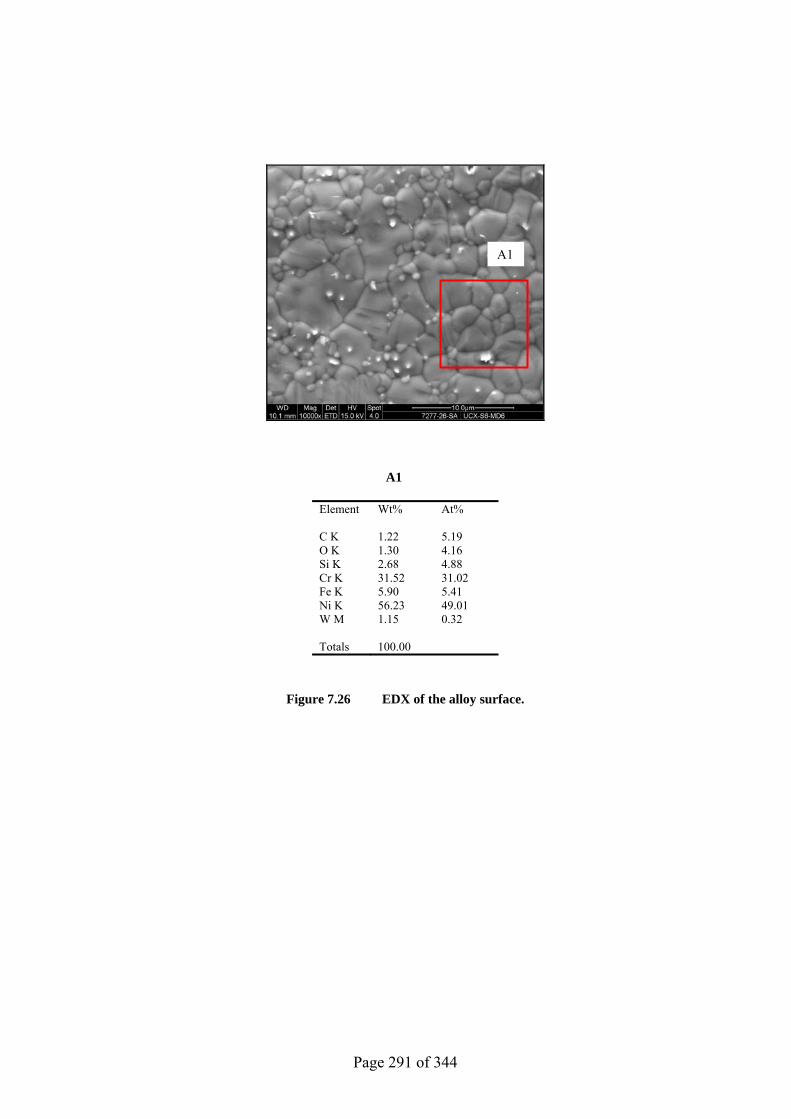
Page 291 of 344
A1
Element Wt% At% C K 1.22 5.19 O K 1.30 4.16 Si K 2.68 4.88 Cr K 31.52 31.02 Fe K 5.90 5.41 Ni K 56.23 49.01 W M 1.15 0.32 Totals 100.00
Figure 7.26 EDX of the alloy surface.
A1
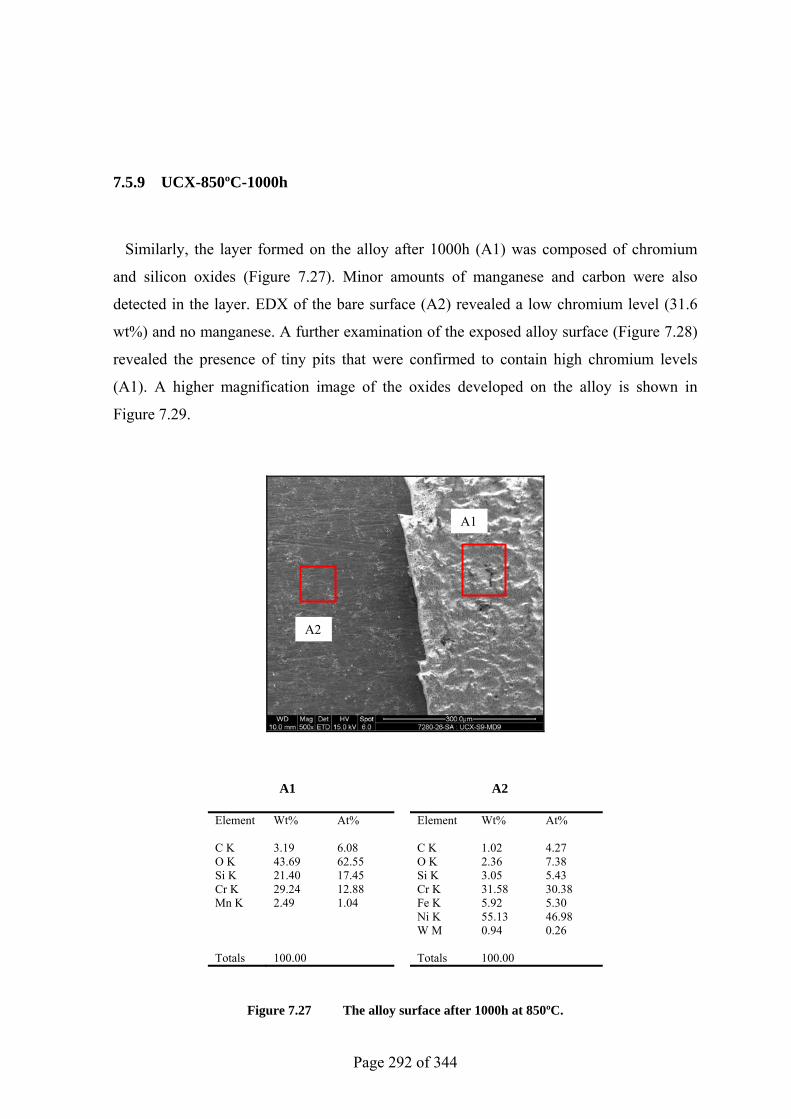
Page 292 of 344
7.5.9 UCX-850ºC-1000h
Similarly, the layer formed on the alloy after 1000h (A1) was composed of chromium
and silicon oxides (Figure 7.27). Minor amounts of manganese and carbon were also
detected in the layer. EDX of the bare surface (A2) revealed a low chromium level (31.6
wt%) and no manganese. A further examination of the exposed alloy surface (Figure 7.28)
revealed the presence of tiny pits that were confirmed to contain high chromium levels
(A1). A higher magnification image of the oxides developed on the alloy is shown in
Figure 7.29.
A1 A2
Element Wt% At% Element Wt% At% C K 3.19 6.08 C K 1.02 4.27 O K 43.69 62.55 O K 2.36 7.38 Si K 21.40 17.45 Si K 3.05 5.43 Cr K 29.24 12.88 Cr K 31.58 30.38 Mn K 2.49 1.04 Fe K 5.92 5.30 Ni K 55.13 46.98 W M 0.94 0.26 Totals 100.00 Totals 100.00
Figure 7.27 The alloy surface after 1000h at 850ºC.
A1
A2
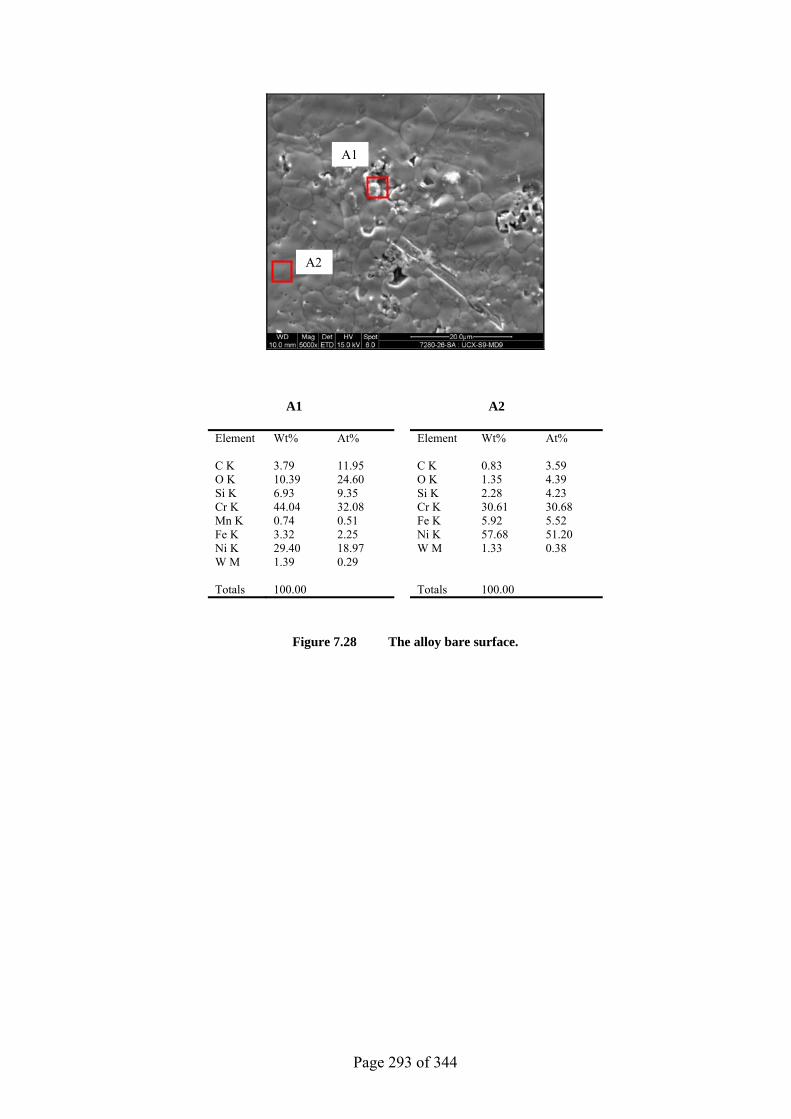
Page 293 of 344
A1 A2
Element Wt% At% Element Wt% At% C K 3.79 11.95 C K 0.83 3.59 O K 10.39 24.60 O K 1.35 4.39 Si K 6.93 9.35 Si K 2.28 4.23 Cr K 44.04 32.08 Cr K 30.61 30.68 Mn K 0.74 0.51 Fe K 5.92 5.52 Fe K 3.32 2.25 Ni K 57.68 51.20 Ni K 29.40 18.97 W M 1.33 0.38 W M 1.39 0.29 Totals 100.00 Totals 100.00
Figure 7.28 The alloy bare surface.
A1
A2
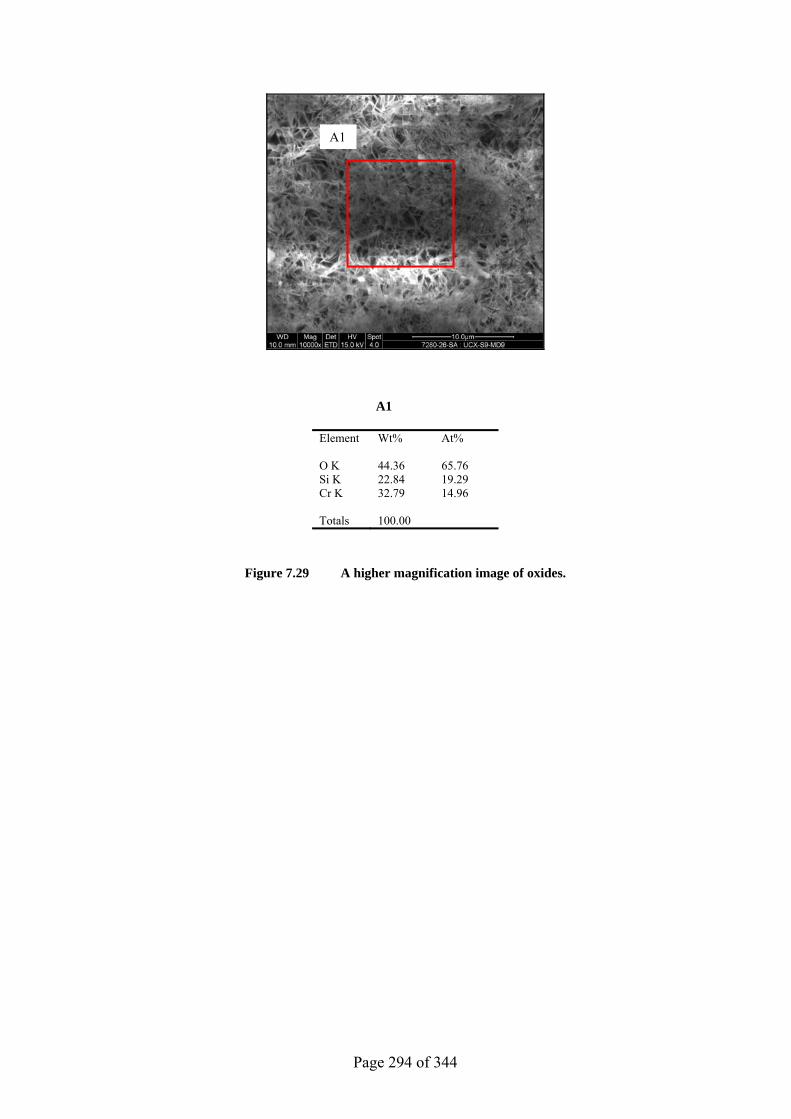
Page 294 of 344
A1
Element Wt% At% O K 44.36 65.76 Si K 22.84 19.29 Cr K 32.79 14.96 Totals 100.00
Figure 7.29 A higher magnification image of oxides.
A1
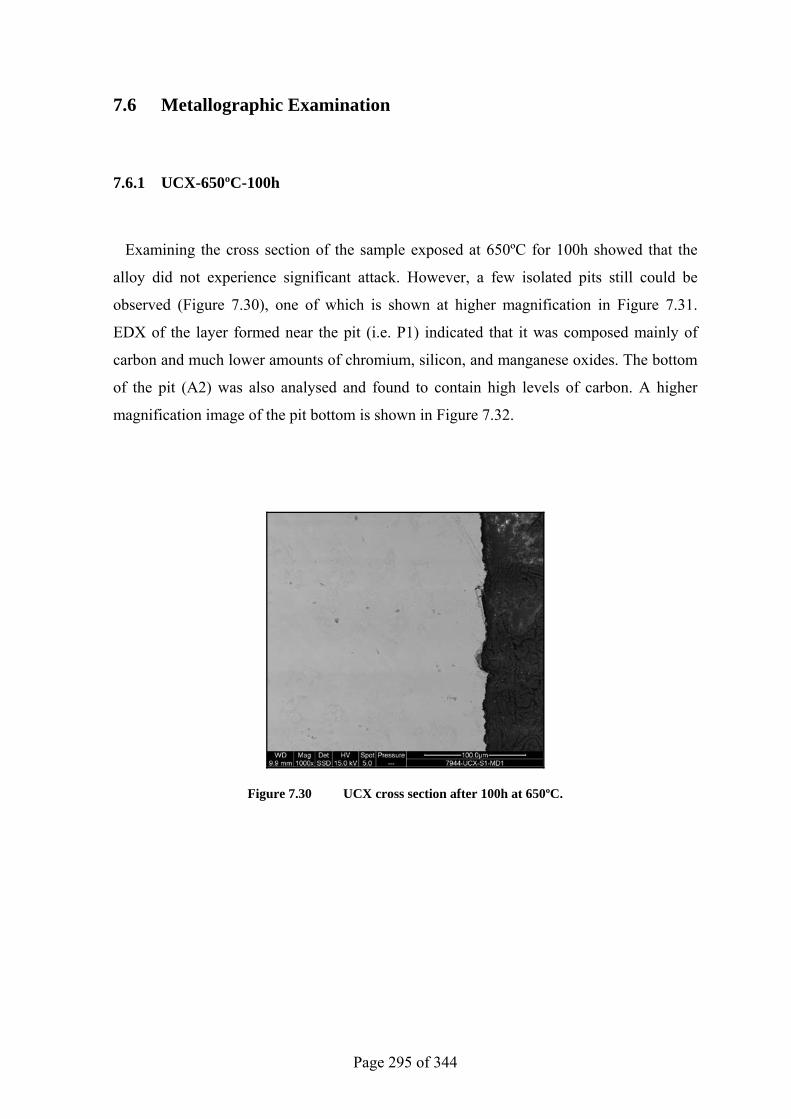
Page 295 of 344
7.6 Metallographic Examination
7.6.1 UCX-650ºC-100h
Examining the cross section of the sample exposed at 650ºC for 100h showed that the
alloy did not experience significant attack. However, a few isolated pits still could be
observed (Figure 7.30), one of which is shown at higher magnification in Figure 7.31.
EDX of the layer formed near the pit (i.e. P1) indicated that it was composed mainly of
carbon and much lower amounts of chromium, silicon, and manganese oxides. The bottom
of the pit (A2) was also analysed and found to contain high levels of carbon. A higher
magnification image of the pit bottom is shown in Figure 7.32.
Figure 7.30 UCX cross section after 100h at 650ºC.
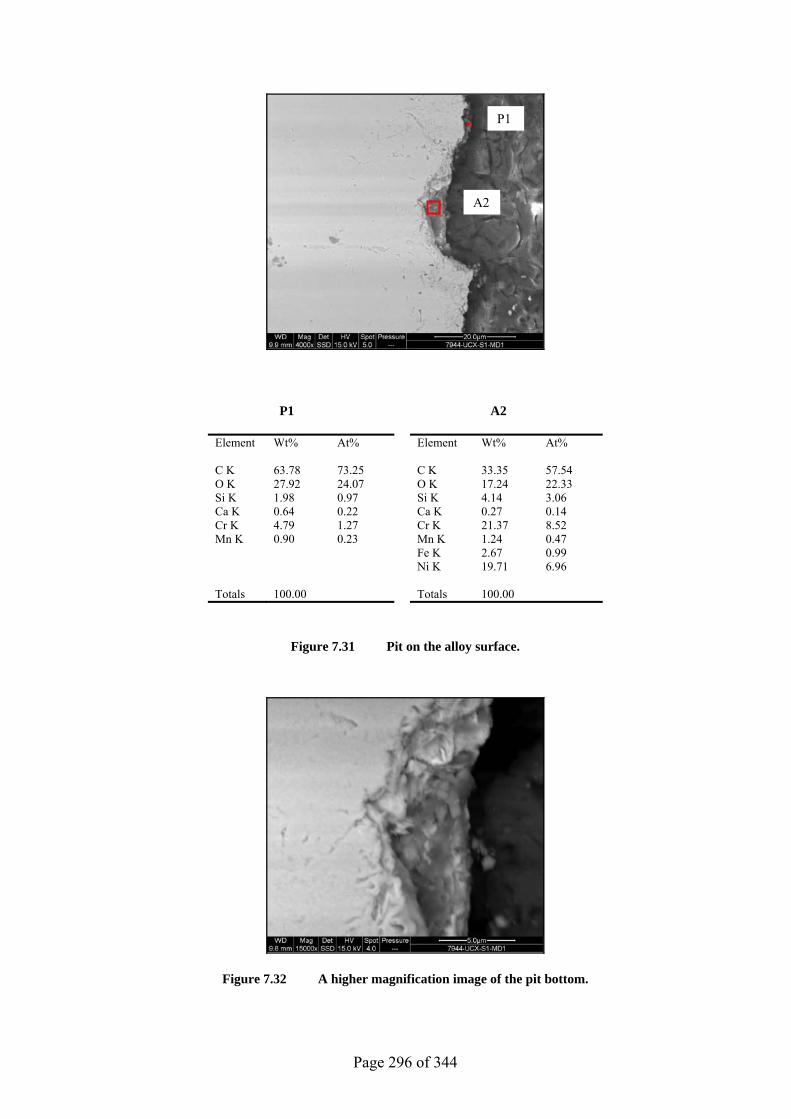
Page 296 of 344
P1 A2
Element Wt% At% Element Wt% At% C K 63.78 73.25 C K 33.35 57.54 O K 27.92 24.07 O K 17.24 22.33 Si K 1.98 0.97 Si K 4.14 3.06 Ca K 0.64 0.22 Ca K 0.27 0.14 Cr K 4.79 1.27 Cr K 21.37 8.52 Mn K 0.90 0.23 Mn K 1.24 0.47 Fe K 2.67 0.99 Ni K 19.71 6.96 Totals 100.00 Totals 100.00
Figure 7.31 Pit on the alloy surface.
Figure 7.32 A higher magnification image of the pit bottom.
P1
A2
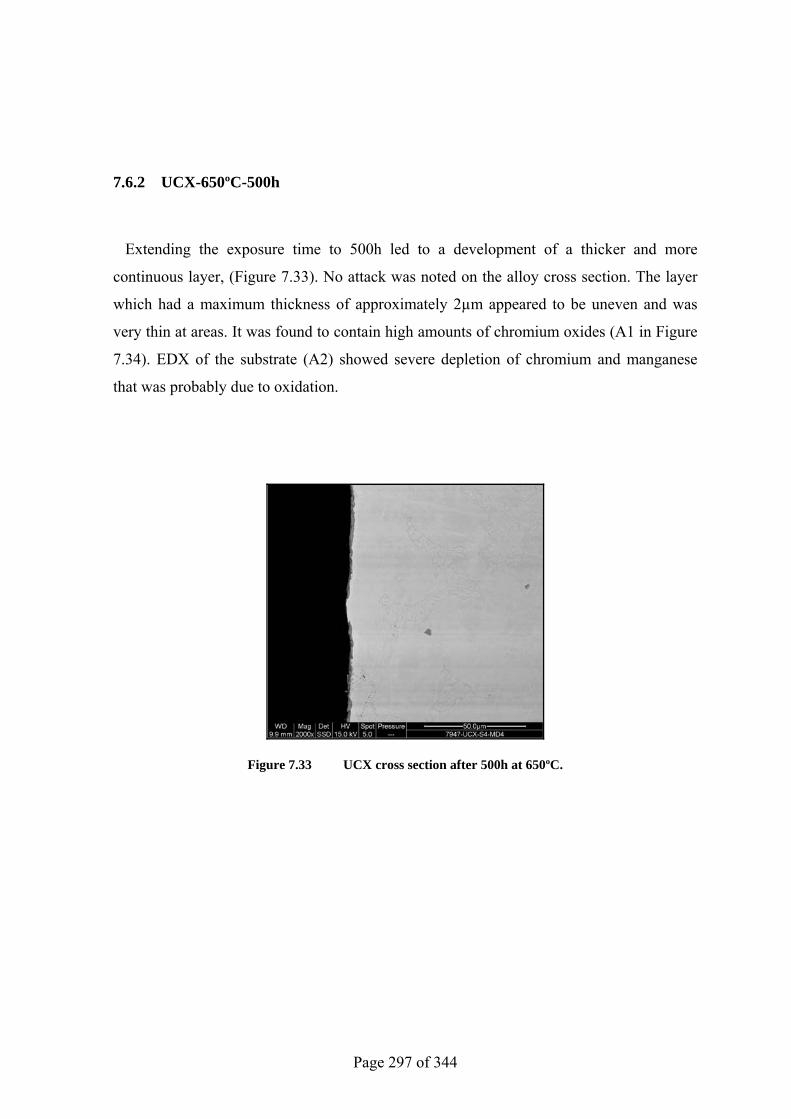
Page 297 of 344
7.6.2 UCX-650ºC-500h
Extending the exposure time to 500h led to a development of a thicker and more
continuous layer, (Figure 7.33). No attack was noted on the alloy cross section. The layer
which had a maximum thickness of approximately 2µm appeared to be uneven and was
very thin at areas. It was found to contain high amounts of chromium oxides (A1 in Figure
7.34). EDX of the substrate (A2) showed severe depletion of chromium and manganese
that was probably due to oxidation.
Figure 7.33 UCX cross section after 500h at 650ºC.
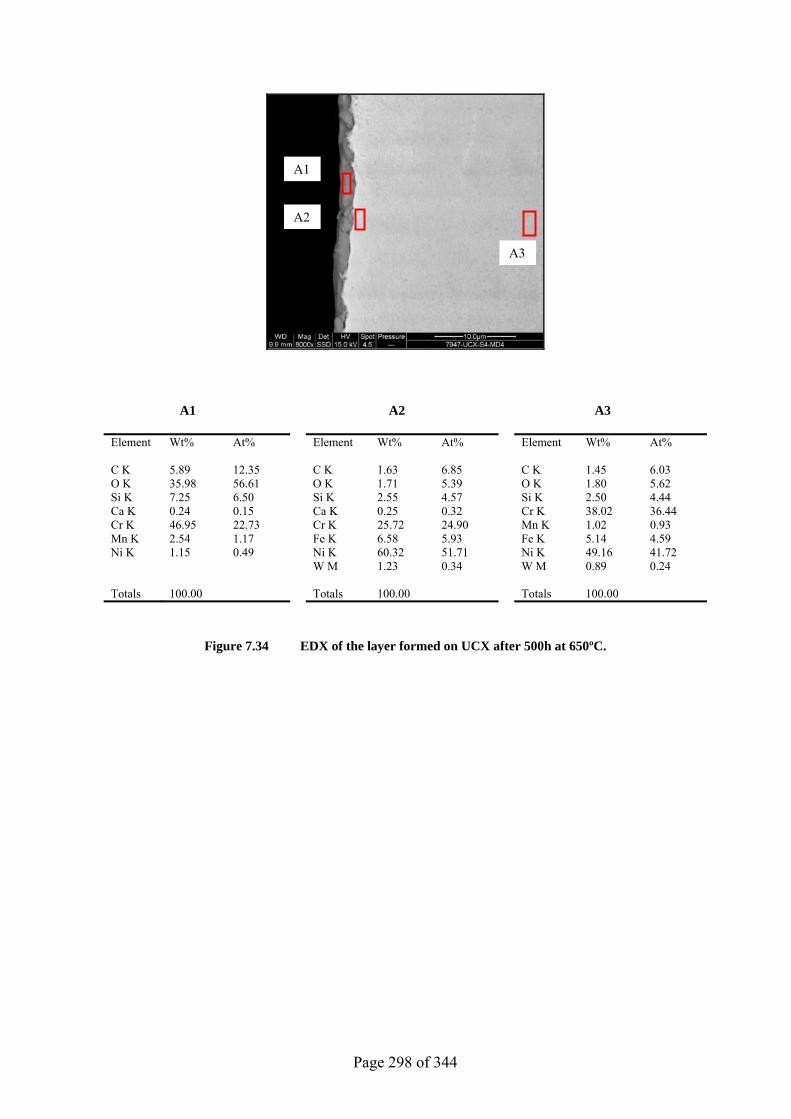
Page 298 of 344
A1 A2 A3
Element Wt% At% Element Wt% At% Element Wt% At% C K 5.89 12.35 C K 1.63 6.85 C K 1.45 6.03 O K 35.98 56.61 O K 1.71 5.39 O K 1.80 5.62 Si K 7.25 6.50 Si K 2.55 4.57 Si K 2.50 4.44 Ca K 0.24 0.15 Ca K 0.25 0.32 Cr K 38.02 36.44 Cr K 46.95 22.73 Cr K 25.72 24.90 Mn K 1.02 0.93 Mn K 2.54 1.17 Fe K 6.58 5.93 Fe K 5.14 4.59 Ni K 1.15 0.49 Ni K 60.32 51.71 Ni K 49.16 41.72 W M 1.23 0.34 W M 0.89 0.24 Totals 100.00 Totals 100.00 Totals 100.00
Figure 7.34 EDX of the layer formed on UCX after 500h at 650ºC.
A1
A2
A3
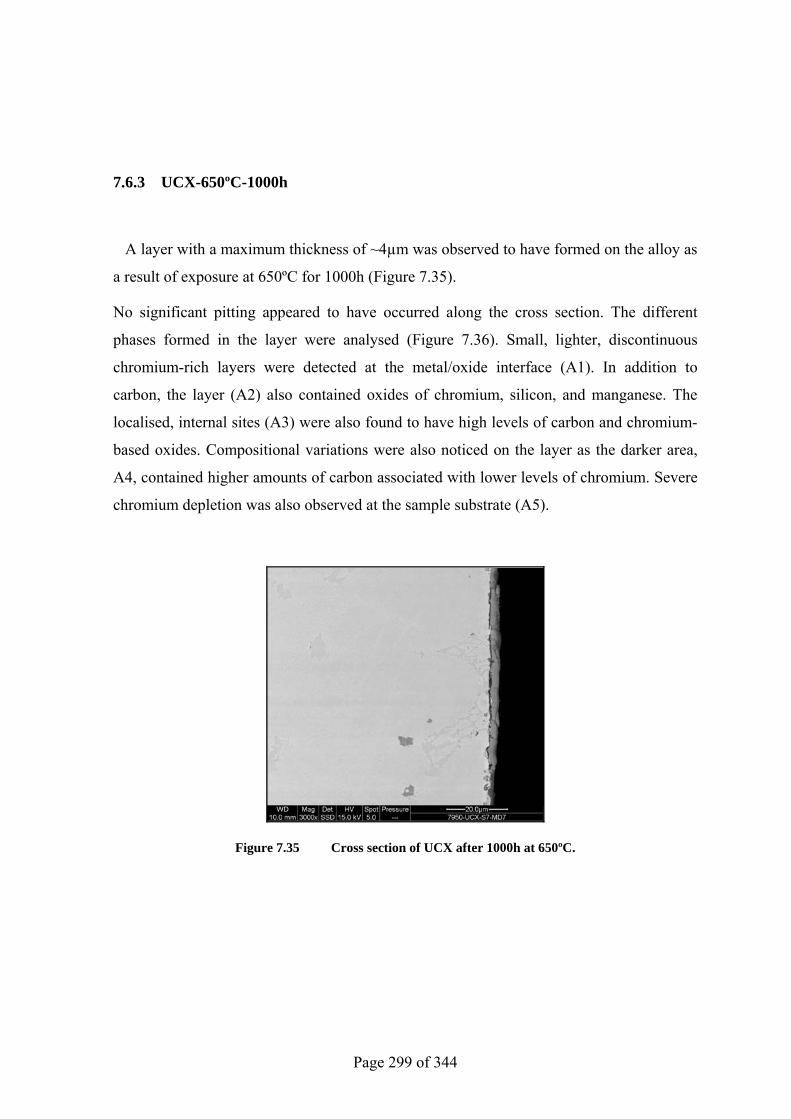
Page 299 of 344
7.6.3 UCX-650ºC-1000h
A layer with a maximum thickness of ~4µm was observed to have formed on the alloy as
a result of exposure at 650ºC for 1000h (Figure 7.35).
No significant pitting appeared to have occurred along the cross section. The different
phases formed in the layer were analysed (Figure 7.36). Small, lighter, discontinuous
chromium-rich layers were detected at the metal/oxide interface (A1). In addition to
carbon, the layer (A2) also contained oxides of chromium, silicon, and manganese. The
localised, internal sites (A3) were also found to have high levels of carbon and chromium-
based oxides. Compositional variations were also noticed on the layer as the darker area,
A4, contained higher amounts of carbon associated with lower levels of chromium. Severe
chromium depletion was also observed at the sample substrate (A5).
Figure 7.35 Cross section of UCX after 1000h at 650ºC.
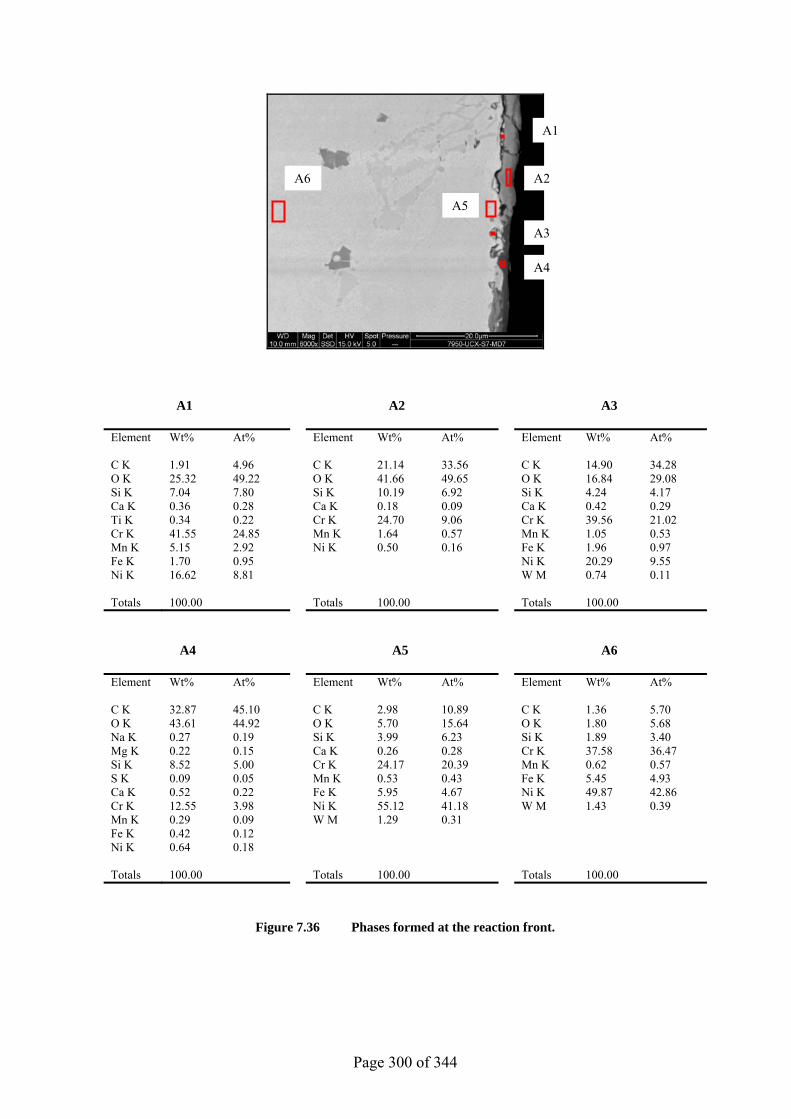
Page 300 of 344
A1 A2 A3
Element Wt% At% Element Wt% At% Element Wt% At% C K 1.91 4.96 C K 21.14 33.56 C K 14.90 34.28 O K 25.32 49.22 O K 41.66 49.65 O K 16.84 29.08 Si K 7.04 7.80 Si K 10.19 6.92 Si K 4.24 4.17 Ca K 0.36 0.28 Ca K 0.18 0.09 Ca K 0.42 0.29 Ti K 0.34 0.22 Cr K 24.70 9.06 Cr K 39.56 21.02 Cr K 41.55 24.85 Mn K 1.64 0.57 Mn K 1.05 0.53 Mn K 5.15 2.92 Ni K 0.50 0.16 Fe K 1.96 0.97 Fe K 1.70 0.95 Ni K 20.29 9.55 Ni K 16.62 8.81 W M 0.74 0.11 Totals 100.00 Totals 100.00 Totals 100.00
A4 A5 A6
Element Wt% At% Element Wt% At% Element Wt% At% C K 32.87 45.10 C K 2.98 10.89 C K 1.36 5.70 O K 43.61 44.92 O K 5.70 15.64 O K 1.80 5.68 Na K 0.27 0.19 Si K 3.99 6.23 Si K 1.89 3.40 Mg K 0.22 0.15 Ca K 0.26 0.28 Cr K 37.58 36.47 Si K 8.52 5.00 Cr K 24.17 20.39 Mn K 0.62 0.57 S K 0.09 0.05 Mn K 0.53 0.43 Fe K 5.45 4.93 Ca K 0.52 0.22 Fe K 5.95 4.67 Ni K 49.87 42.86 Cr K 12.55 3.98 Ni K 55.12 41.18 W M 1.43 0.39 Mn K 0.29 0.09 W M 1.29 0.31 Fe K 0.42 0.12 Ni K 0.64 0.18 Totals 100.00 Totals 100.00 Totals 100.00
Figure 7.36 Phases formed at the reaction front.
A5
A6
A4
A1
A3
A2
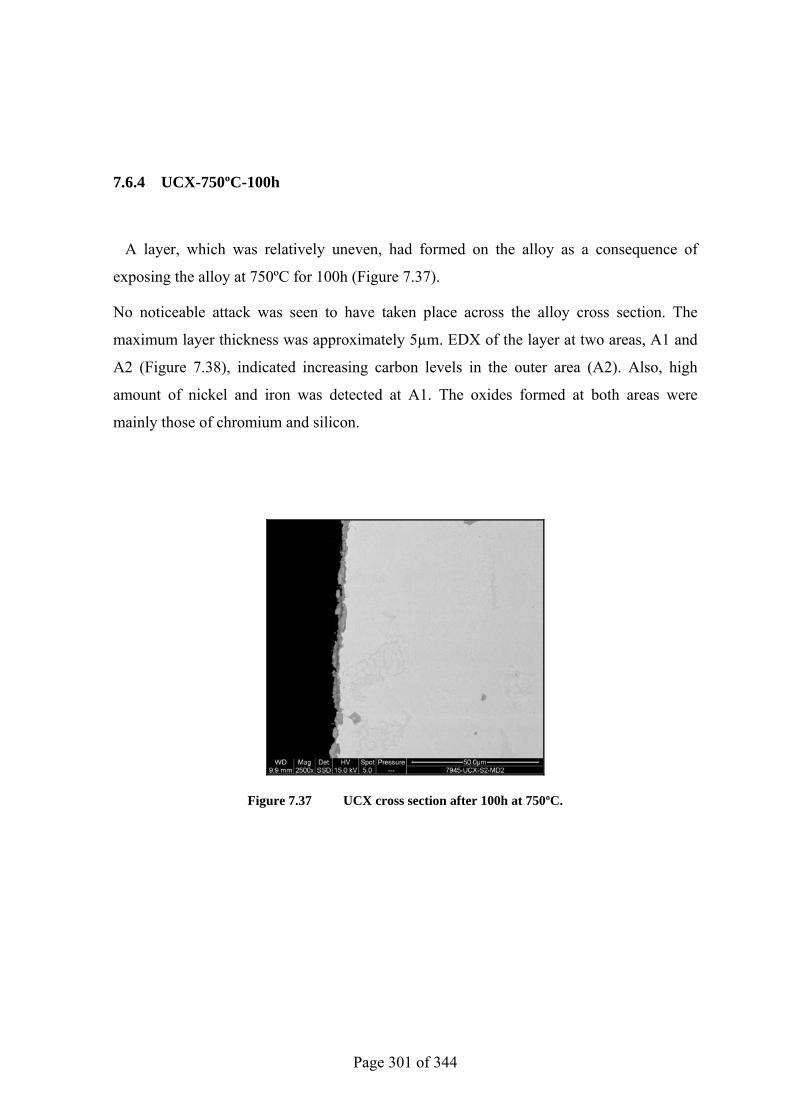
Page 301 of 344
7.6.4 UCX-750ºC-100h
A layer, which was relatively uneven, had formed on the alloy as a consequence of
exposing the alloy at 750ºC for 100h (Figure 7.37).
No noticeable attack was seen to have taken place across the alloy cross section. The
maximum layer thickness was approximately 5µm. EDX of the layer at two areas, A1 and
A2 (Figure 7.38), indicated increasing carbon levels in the outer area (A2). Also, high
amount of nickel and iron was detected at A1. The oxides formed at both areas were
mainly those of chromium and silicon.
Figure 7.37 UCX cross section after 100h at 750ºC.
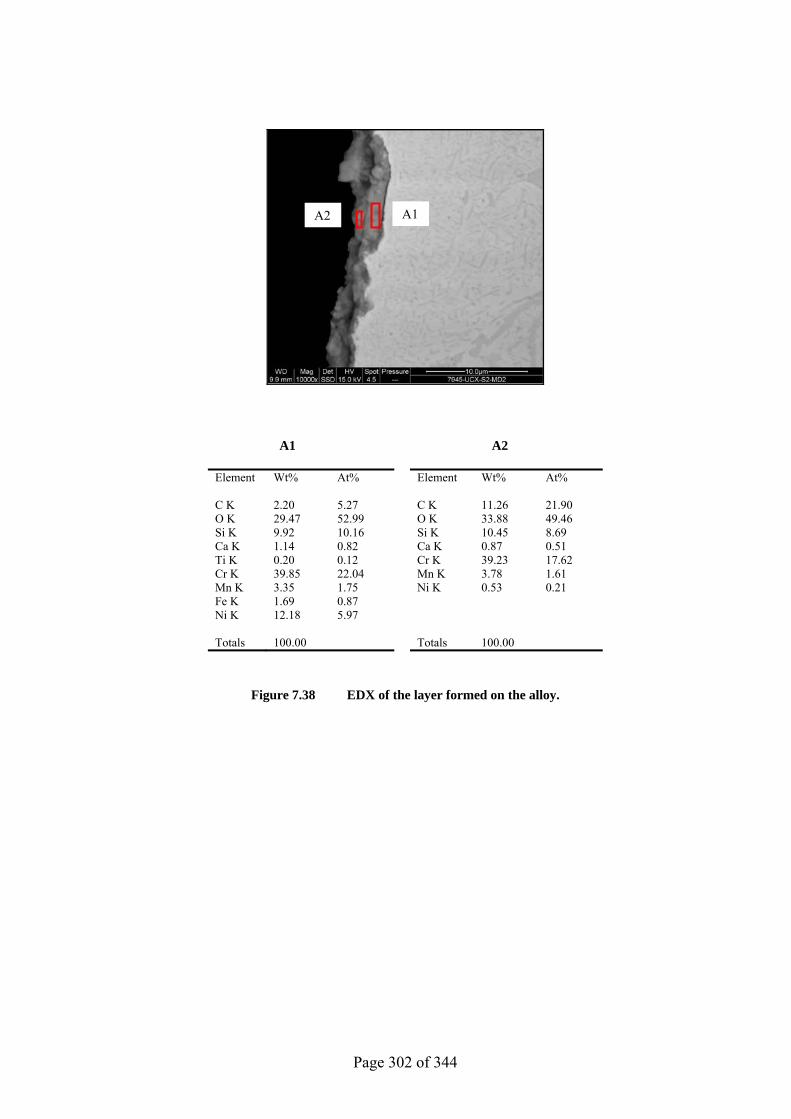
Page 302 of 344
A1 A2
Element Wt% At% Element Wt% At% C K 2.20 5.27 C K 11.26 21.90 O K 29.47 52.99 O K 33.88 49.46 Si K 9.92 10.16 Si K 10.45 8.69 Ca K 1.14 0.82 Ca K 0.87 0.51 Ti K 0.20 0.12 Cr K 39.23 17.62 Cr K 39.85 22.04 Mn K 3.78 1.61 Mn K 3.35 1.75 Ni K 0.53 0.21 Fe K 1.69 0.87 Ni K 12.18 5.97 Totals 100.00 Totals 100.00
Figure 7.38 EDX of the layer formed on the alloy.
A1A2
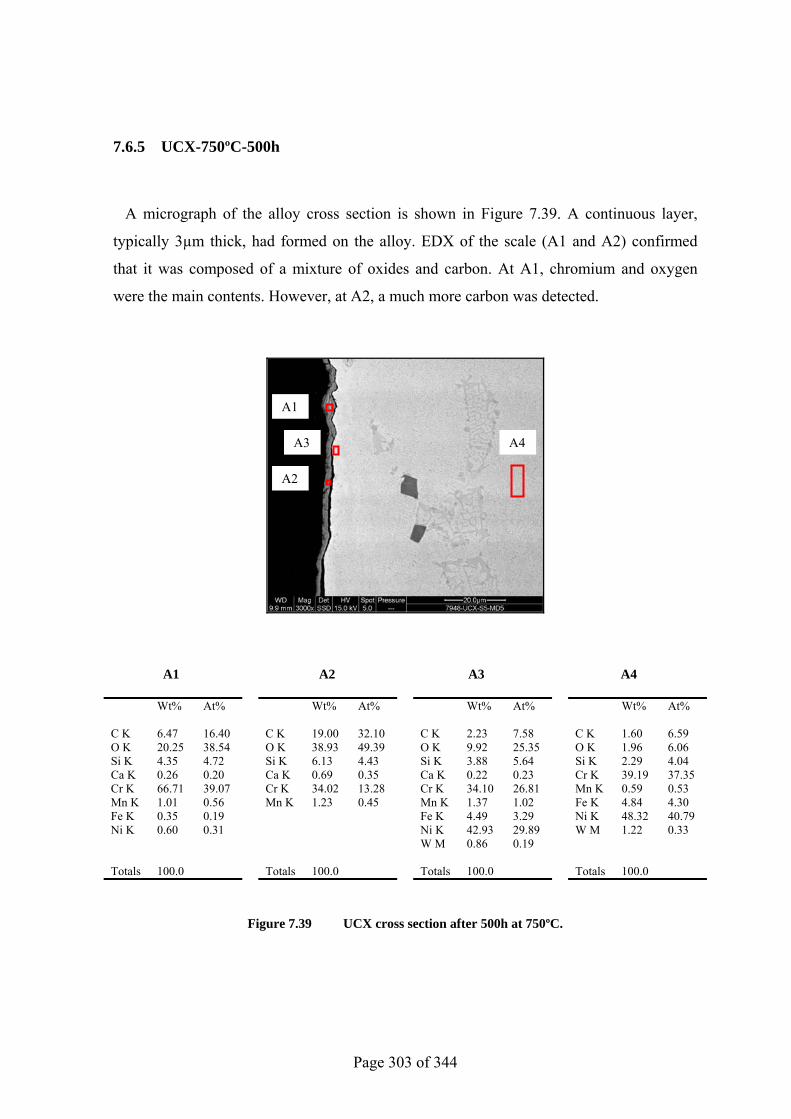
Page 303 of 344
7.6.5 UCX-750ºC-500h
A micrograph of the alloy cross section is shown in Figure 7.39. A continuous layer,
typically 3µm thick, had formed on the alloy. EDX of the scale (A1 and A2) confirmed
that it was composed of a mixture of oxides and carbon. At A1, chromium and oxygen
were the main contents. However, at A2, a much more carbon was detected.
A1 A2 A3 A4
Wt% At% Wt% At% Wt% At% Wt% At% C K 6.47 16.40 C K 19.00 32.10 C K 2.23 7.58 C K 1.60 6.59 O K 20.25 38.54 O K 38.93 49.39 O K 9.92 25.35 O K 1.96 6.06 Si K 4.35 4.72 Si K 6.13 4.43 Si K 3.88 5.64 Si K 2.29 4.04 Ca K 0.26 0.20 Ca K 0.69 0.35 Ca K 0.22 0.23 Cr K 39.19 37.35 Cr K 66.71 39.07 Cr K 34.02 13.28 Cr K 34.10 26.81 Mn K 0.59 0.53 Mn K 1.01 0.56 Mn K 1.23 0.45 Mn K 1.37 1.02 Fe K 4.84 4.30 Fe K 0.35 0.19 Fe K 4.49 3.29 Ni K 48.32 40.79 Ni K 0.60 0.31 Ni K 42.93 29.89 W M 1.22 0.33 W M 0.86 0.19 Totals 100.0 Totals 100.0 Totals 100.0 Totals 100.0
Figure 7.39 UCX cross section after 500h at 750ºC.
A1
A2
A3 A4
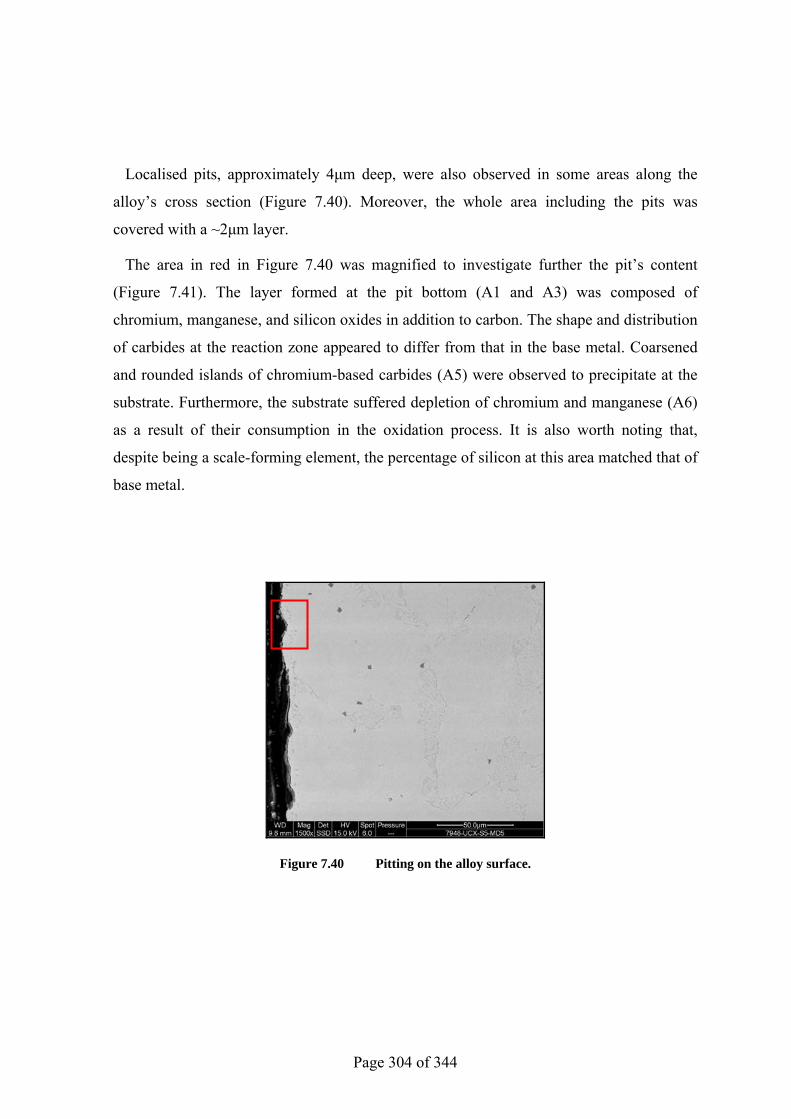
Page 304 of 344
Localised pits, approximately 4µm deep, were also observed in some areas along the
alloy’s cross section (Figure 7.40). Moreover, the whole area including the pits was
covered with a ~2µm layer.
The area in red in Figure 7.40 was magnified to investigate further the pit’s content
(Figure 7.41). The layer formed at the pit bottom (A1 and A3) was composed of
chromium, manganese, and silicon oxides in addition to carbon. The shape and distribution
of carbides at the reaction zone appeared to differ from that in the base metal. Coarsened
and rounded islands of chromium-based carbides (A5) were observed to precipitate at the
substrate. Furthermore, the substrate suffered depletion of chromium and manganese (A6)
as a result of their consumption in the oxidation process. It is also worth noting that,
despite being a scale-forming element, the percentage of silicon at this area matched that of
base metal.
Figure 7.40 Pitting on the alloy surface.
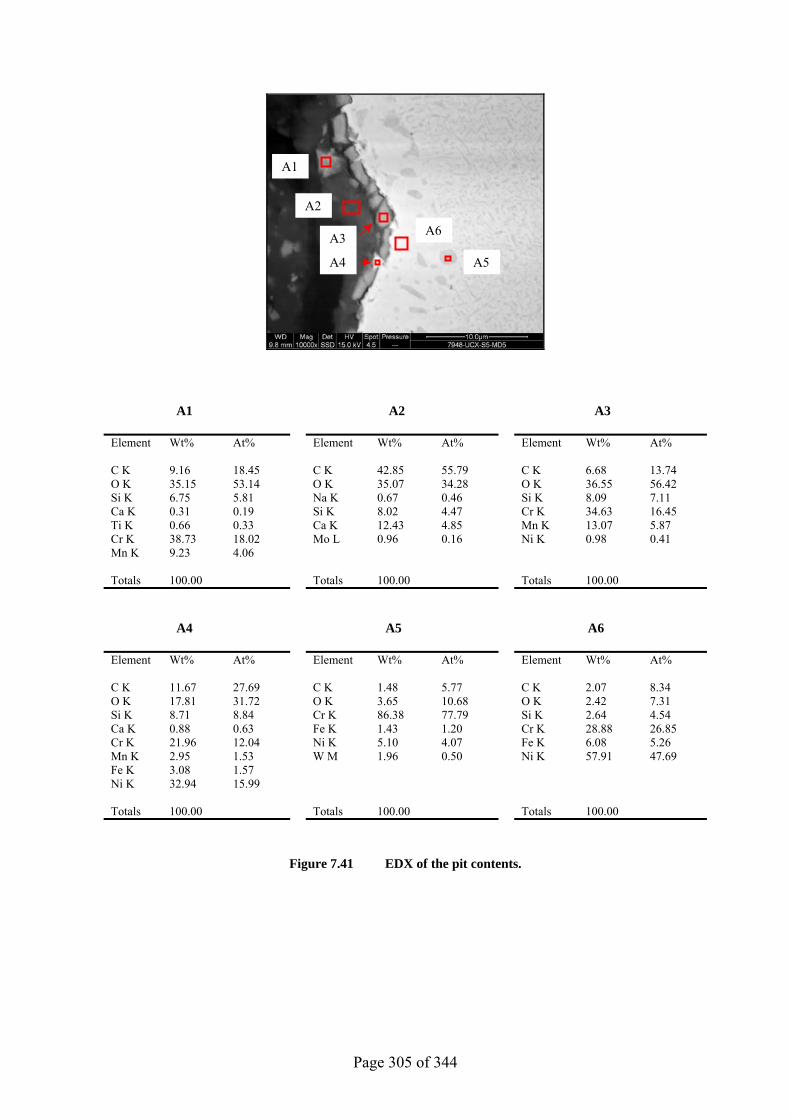
Page 305 of 344
A1 A2 A3
Element Wt% At% Element Wt% At% Element Wt% At% C K 9.16 18.45 C K 42.85 55.79 C K 6.68 13.74 O K 35.15 53.14 O K 35.07 34.28 O K 36.55 56.42 Si K 6.75 5.81 Na K 0.67 0.46 Si K 8.09 7.11 Ca K 0.31 0.19 Si K 8.02 4.47 Cr K 34.63 16.45 Ti K 0.66 0.33 Ca K 12.43 4.85 Mn K 13.07 5.87 Cr K 38.73 18.02 Mo L 0.96 0.16 Ni K 0.98 0.41 Mn K 9.23 4.06 Totals 100.00 Totals 100.00 Totals 100.00
A4 A5 A6
Element Wt% At% Element Wt% At% Element Wt% At% C K 11.67 27.69 C K 1.48 5.77 C K 2.07 8.34 O K 17.81 31.72 O K 3.65 10.68 O K 2.42 7.31 Si K 8.71 8.84 Cr K 86.38 77.79 Si K 2.64 4.54 Ca K 0.88 0.63 Fe K 1.43 1.20 Cr K 28.88 26.85 Cr K 21.96 12.04 Ni K 5.10 4.07 Fe K 6.08 5.26 Mn K 2.95 1.53 W M 1.96 0.50 Ni K 57.91 47.69 Fe K 3.08 1.57 Ni K 32.94 15.99 Totals 100.00 Totals 100.00 Totals 100.00
Figure 7.41 EDX of the pit contents.
A2
A3
A4
A6
A5
A1
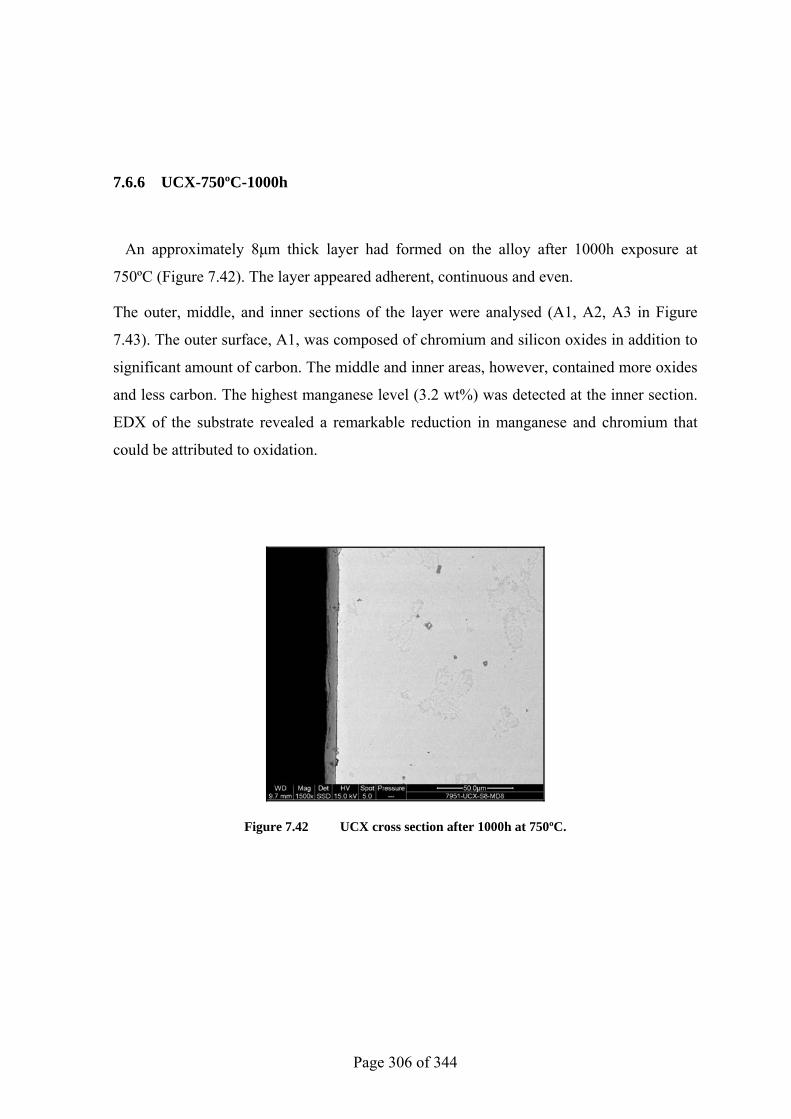
Page 306 of 344
7.6.6 UCX-750ºC-1000h
An approximately 8µm thick layer had formed on the alloy after 1000h exposure at
750ºC (Figure 7.42). The layer appeared adherent, continuous and even.
The outer, middle, and inner sections of the layer were analysed (A1, A2, A3 in Figure
7.43). The outer surface, A1, was composed of chromium and silicon oxides in addition to
significant amount of carbon. The middle and inner areas, however, contained more oxides
and less carbon. The highest manganese level (3.2 wt%) was detected at the inner section.
EDX of the substrate revealed a remarkable reduction in manganese and chromium that
could be attributed to oxidation.
Figure 7.42 UCX cross section after 1000h at 750ºC.
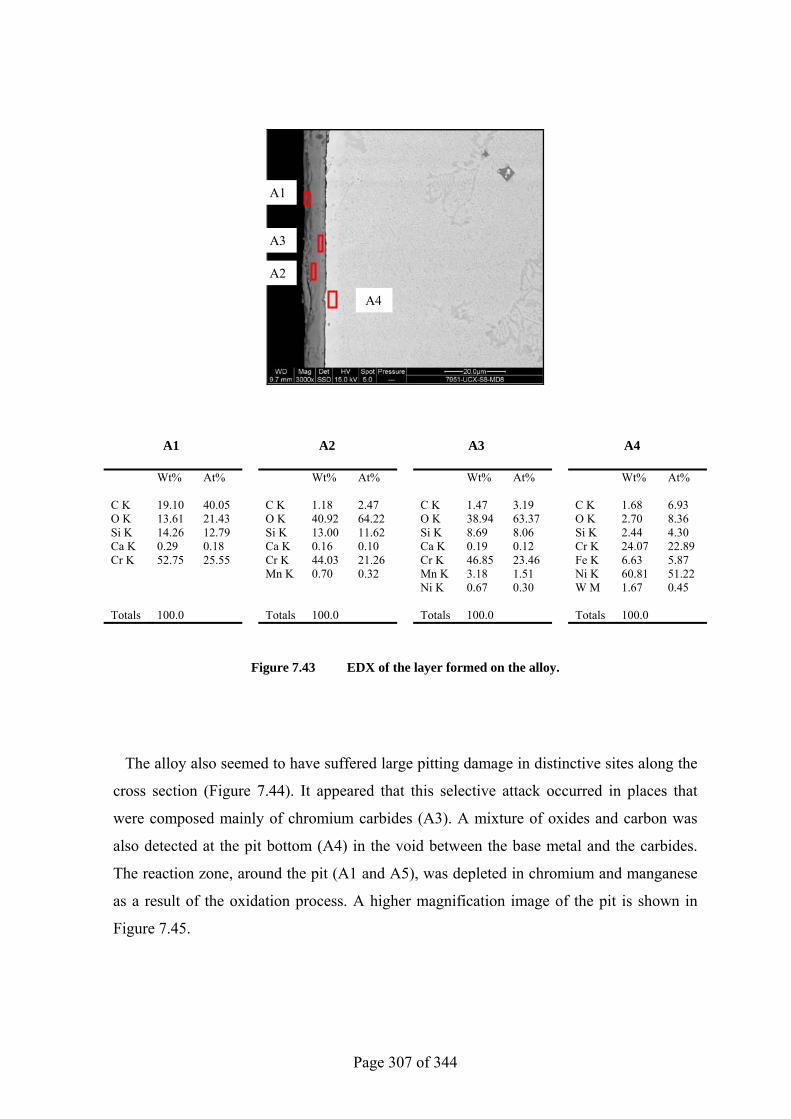
Page 307 of 344
A1 A2 A3 A4
Wt% At% Wt% At% Wt% At% Wt% At% C K 19.10 40.05 C K 1.18 2.47 C K 1.47 3.19 C K 1.68 6.93 O K 13.61 21.43 O K 40.92 64.22 O K 38.94 63.37 O K 2.70 8.36 Si K 14.26 12.79 Si K 13.00 11.62 Si K 8.69 8.06 Si K 2.44 4.30 Ca K 0.29 0.18 Ca K 0.16 0.10 Ca K 0.19 0.12 Cr K 24.07 22.89 Cr K 52.75 25.55 Cr K 44.03 21.26 Cr K 46.85 23.46 Fe K 6.63 5.87 Mn K 0.70 0.32 Mn K 3.18 1.51 Ni K 60.81 51.22 Ni K 0.67 0.30 W M 1.67 0.45 Totals 100.0 Totals 100.0 Totals 100.0 Totals 100.0
Figure 7.43 EDX of the layer formed on the alloy.
The alloy also seemed to have suffered large pitting damage in distinctive sites along the
cross section (Figure 7.44). It appeared that this selective attack occurred in places that
were composed mainly of chromium carbides (A3). A mixture of oxides and carbon was
also detected at the pit bottom (A4) in the void between the base metal and the carbides.
The reaction zone, around the pit (A1 and A5), was depleted in chromium and manganese
as a result of the oxidation process. A higher magnification image of the pit is shown in
Figure 7.45.
A1
A2
A4
A3
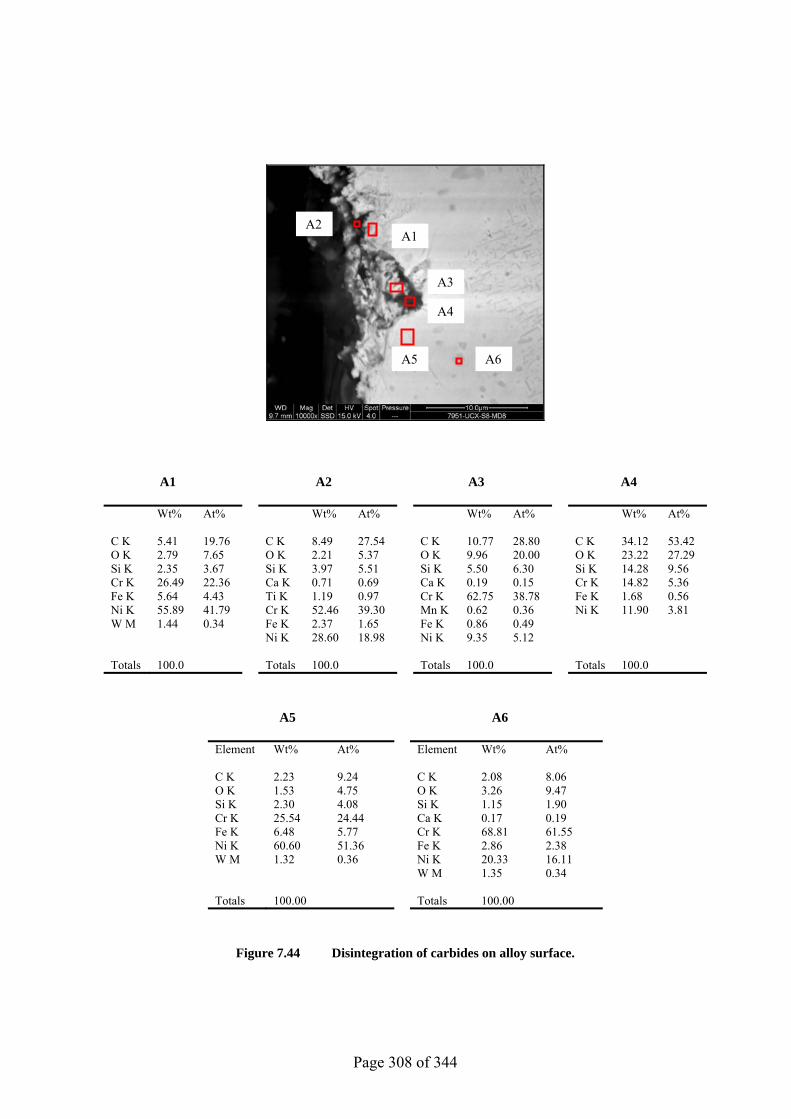
Page 308 of 344
A1 A2 A3 A4
Wt% At% Wt% At% Wt% At% Wt% At% C K 5.41 19.76 C K 8.49 27.54 C K 10.77 28.80 C K 34.12 53.42 O K 2.79 7.65 O K 2.21 5.37 O K 9.96 20.00 O K 23.22 27.29 Si K 2.35 3.67 Si K 3.97 5.51 Si K 5.50 6.30 Si K 14.28 9.56 Cr K 26.49 22.36 Ca K 0.71 0.69 Ca K 0.19 0.15 Cr K 14.82 5.36 Fe K 5.64 4.43 Ti K 1.19 0.97 Cr K 62.75 38.78 Fe K 1.68 0.56 Ni K 55.89 41.79 Cr K 52.46 39.30 Mn K 0.62 0.36 Ni K 11.90 3.81 W M 1.44 0.34 Fe K 2.37 1.65 Fe K 0.86 0.49 Ni K 28.60 18.98 Ni K 9.35 5.12 Totals 100.0 Totals 100.0 Totals 100.0 Totals 100.0
A5 A6
Element Wt% At% Element Wt% At% C K 2.23 9.24 C K 2.08 8.06 O K 1.53 4.75 O K 3.26 9.47 Si K 2.30 4.08 Si K 1.15 1.90 Cr K 25.54 24.44 Ca K 0.17 0.19 Fe K 6.48 5.77 Cr K 68.81 61.55 Ni K 60.60 51.36 Fe K 2.86 2.38 W M 1.32 0.36 Ni K 20.33 16.11 W M 1.35 0.34 Totals 100.00 Totals 100.00
Figure 7.44 Disintegration of carbides on alloy surface.
A2
A3
A4
A5 A6
A1
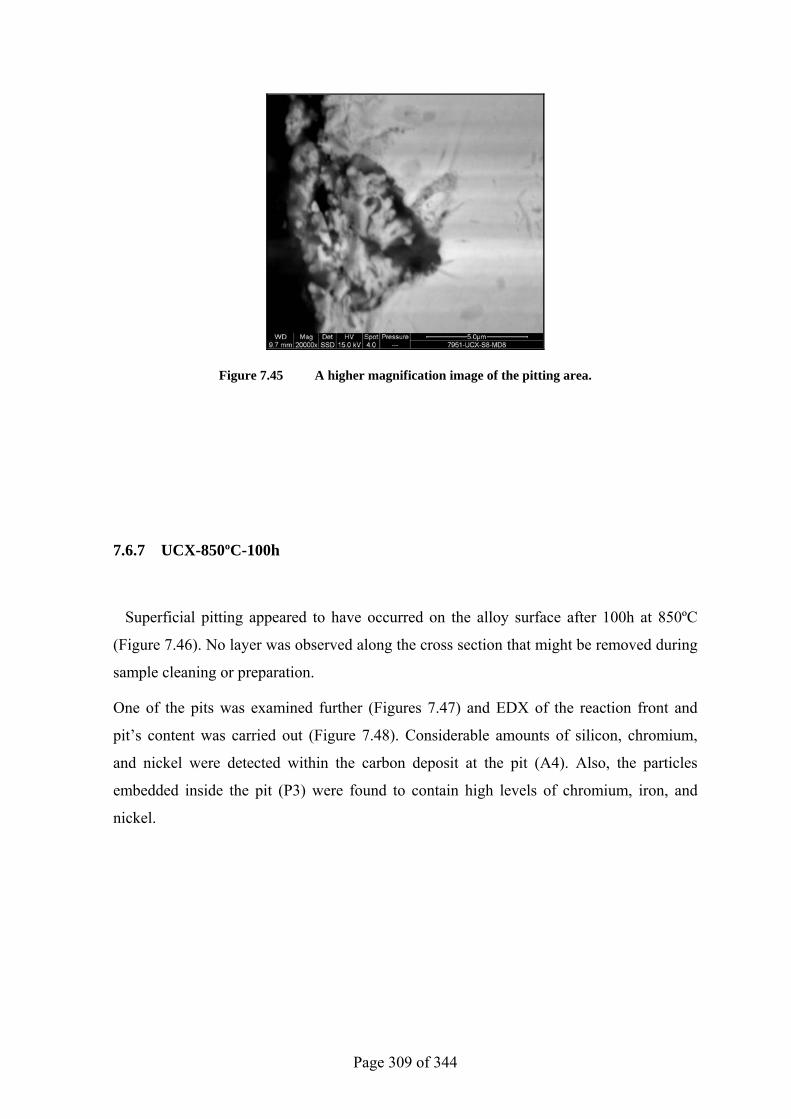
Page 309 of 344
Figure 7.45 A higher magnification image of the pitting area.
7.6.7 UCX-850ºC-100h
Superficial pitting appeared to have occurred on the alloy surface after 100h at 850ºC
(Figure 7.46). No layer was observed along the cross section that might be removed during
sample cleaning or preparation.
One of the pits was examined further (Figures 7.47) and EDX of the reaction front and
pit’s content was carried out (Figure 7.48). Considerable amounts of silicon, chromium,
and nickel were detected within the carbon deposit at the pit (A4). Also, the particles
embedded inside the pit (P3) were found to contain high levels of chromium, iron, and
nickel.
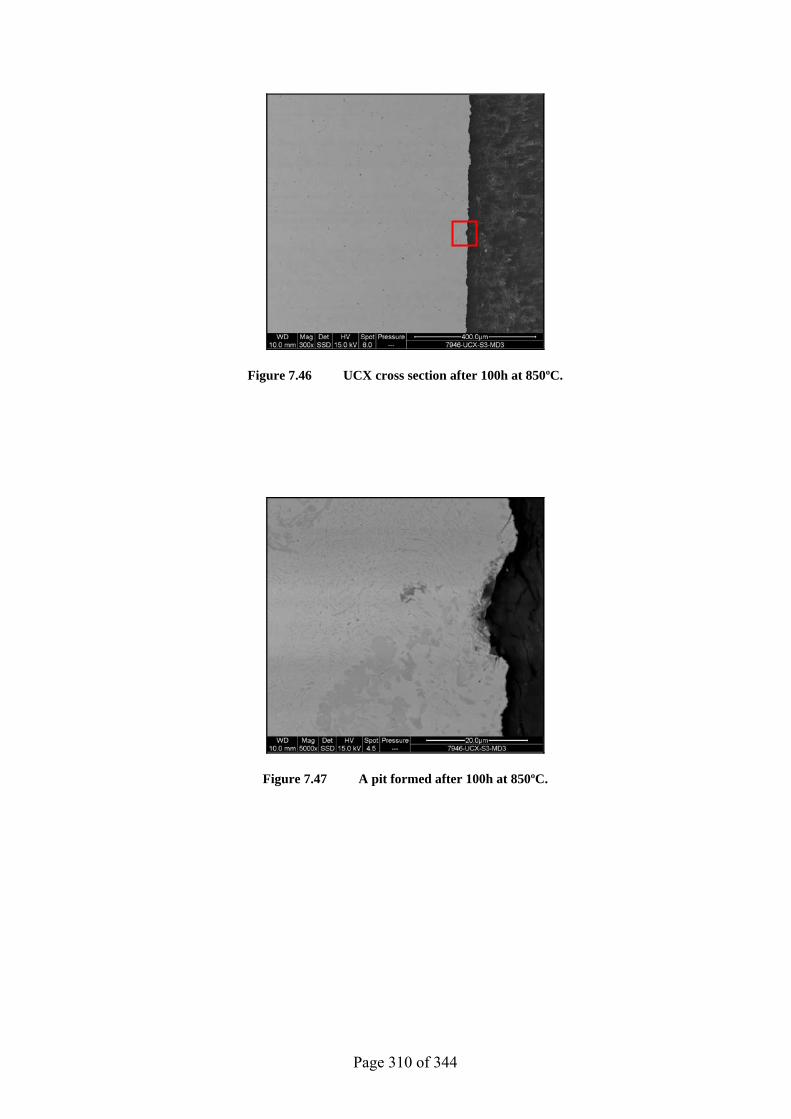
Page 310 of 344
Figure 7.46 UCX cross section after 100h at 850ºC.
Figure 7.47 A pit formed after 100h at 850ºC.
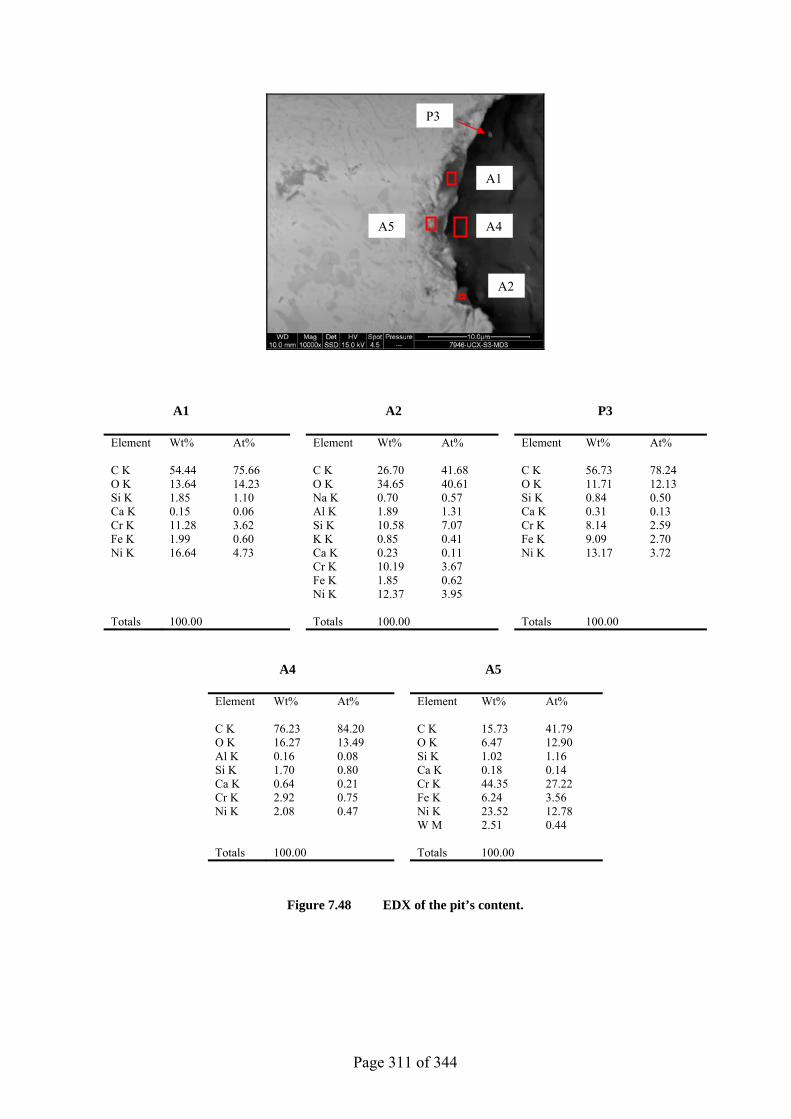
Page 311 of 344
A1 A2 P3
Element Wt% At% Element Wt% At% Element Wt% At% C K 54.44 75.66 C K 26.70 41.68 C K 56.73 78.24 O K 13.64 14.23 O K 34.65 40.61 O K 11.71 12.13 Si K 1.85 1.10 Na K 0.70 0.57 Si K 0.84 0.50 Ca K 0.15 0.06 Al K 1.89 1.31 Ca K 0.31 0.13 Cr K 11.28 3.62 Si K 10.58 7.07 Cr K 8.14 2.59 Fe K 1.99 0.60 K K 0.85 0.41 Fe K 9.09 2.70 Ni K 16.64 4.73 Ca K 0.23 0.11 Ni K 13.17 3.72 Cr K 10.19 3.67 Fe K 1.85 0.62 Ni K 12.37 3.95 Totals 100.00 Totals 100.00 Totals 100.00
A4 A5
Element Wt% At% Element Wt% At% C K 76.23 84.20 C K 15.73 41.79 O K 16.27 13.49 O K 6.47 12.90 Al K 0.16 0.08 Si K 1.02 1.16 Si K 1.70 0.80 Ca K 0.18 0.14 Ca K 0.64 0.21 Cr K 44.35 27.22 Cr K 2.92 0.75 Fe K 6.24 3.56 Ni K 2.08 0.47 Ni K 23.52 12.78 W M 2.51 0.44 Totals 100.00 Totals 100.00
Figure 7.48 EDX of the pit’s content.
A5 A4
P3
A2
A1
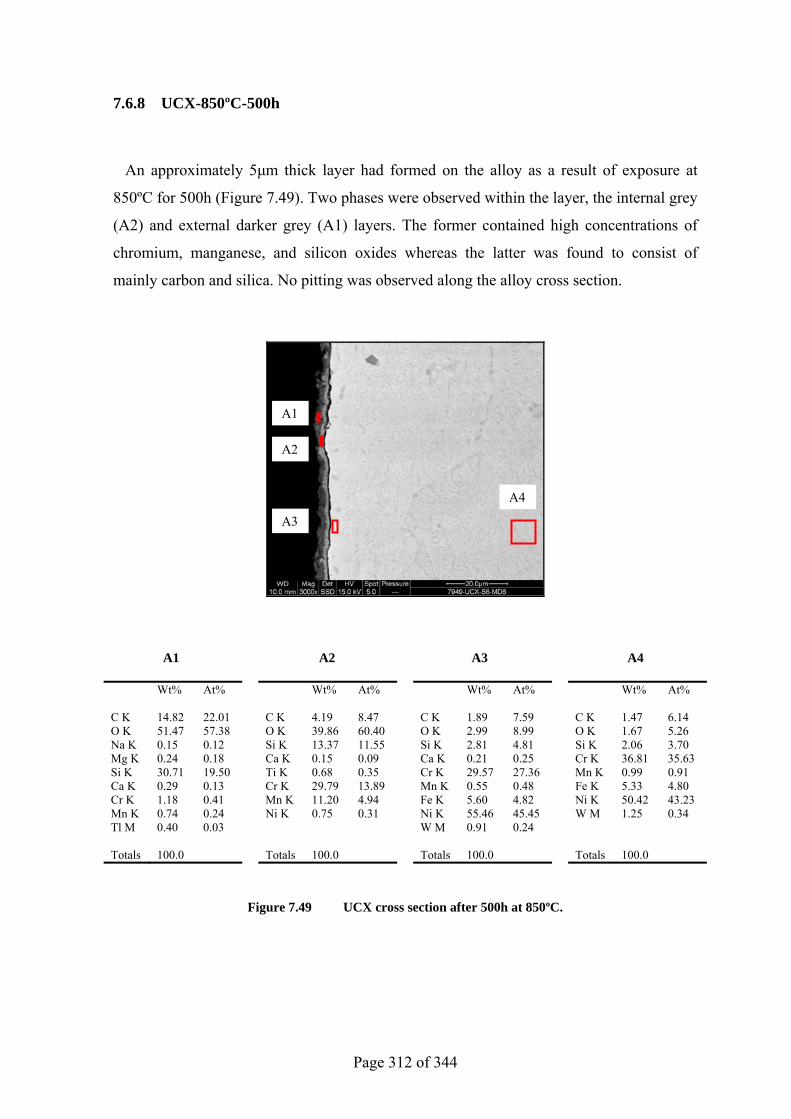
Page 312 of 344
7.6.8 UCX-850ºC-500h
An approximately 5µm thick layer had formed on the alloy as a result of exposure at
850ºC for 500h (Figure 7.49). Two phases were observed within the layer, the internal grey
(A2) and external darker grey (A1) layers. The former contained high concentrations of
chromium, manganese, and silicon oxides whereas the latter was found to consist of
mainly carbon and silica. No pitting was observed along the alloy cross section.
A1 A2 A3 A4
Wt% At% Wt% At% Wt% At% Wt% At% C K 14.82 22.01 C K 4.19 8.47 C K 1.89 7.59 C K 1.47 6.14 O K 51.47 57.38 O K 39.86 60.40 O K 2.99 8.99 O K 1.67 5.26 Na K 0.15 0.12 Si K 13.37 11.55 Si K 2.81 4.81 Si K 2.06 3.70 Mg K 0.24 0.18 Ca K 0.15 0.09 Ca K 0.21 0.25 Cr K 36.81 35.63 Si K 30.71 19.50 Ti K 0.68 0.35 Cr K 29.57 27.36 Mn K 0.99 0.91 Ca K 0.29 0.13 Cr K 29.79 13.89 Mn K 0.55 0.48 Fe K 5.33 4.80 Cr K 1.18 0.41 Mn K 11.20 4.94 Fe K 5.60 4.82 Ni K 50.42 43.23 Mn K 0.74 0.24 Ni K 0.75 0.31 Ni K 55.46 45.45 W M 1.25 0.34 Tl M 0.40 0.03 W M 0.91 0.24 Totals 100.0 Totals 100.0 Totals 100.0 Totals 100.0
Figure 7.49 UCX cross section after 500h at 850ºC.
A1
A2
A3
A4
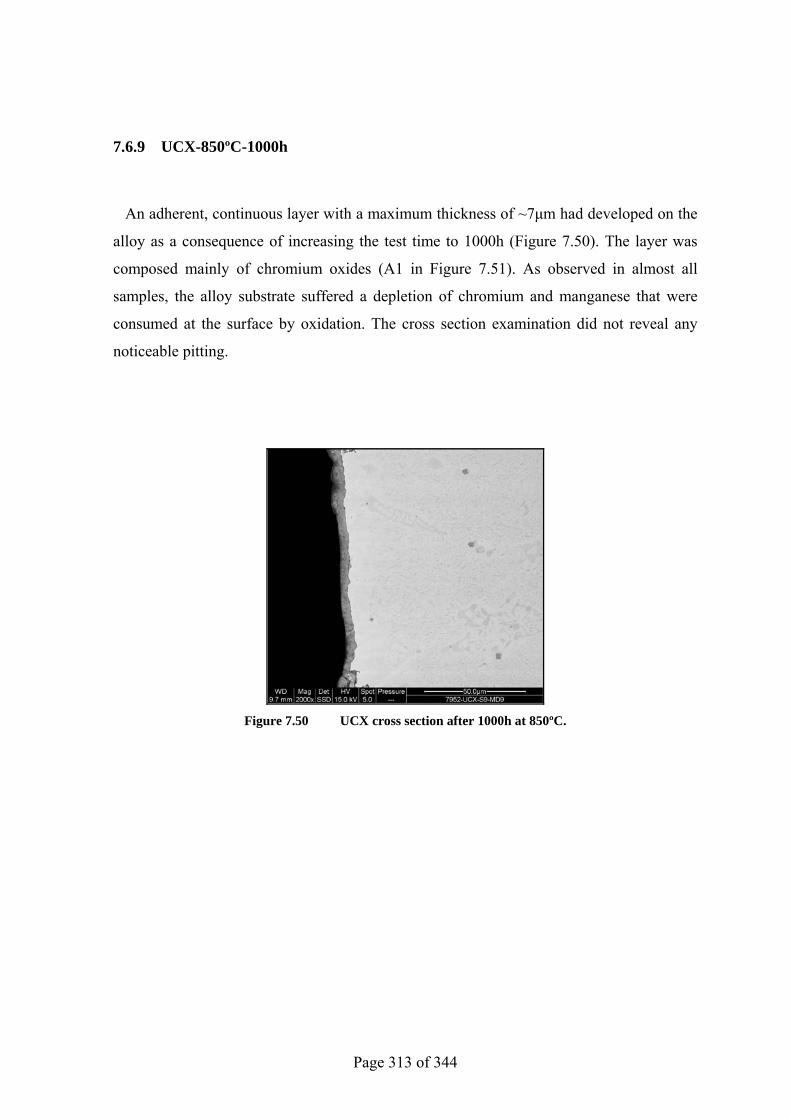
Page 313 of 344
7.6.9 UCX-850ºC-1000h
An adherent, continuous layer with a maximum thickness of ~7µm had developed on the
alloy as a consequence of increasing the test time to 1000h (Figure 7.50). The layer was
composed mainly of chromium oxides (A1 in Figure 7.51). As observed in almost all
samples, the alloy substrate suffered a depletion of chromium and manganese that were
consumed at the surface by oxidation. The cross section examination did not reveal any
noticeable pitting.
Figure 7.50 UCX cross section after 1000h at 850ºC.
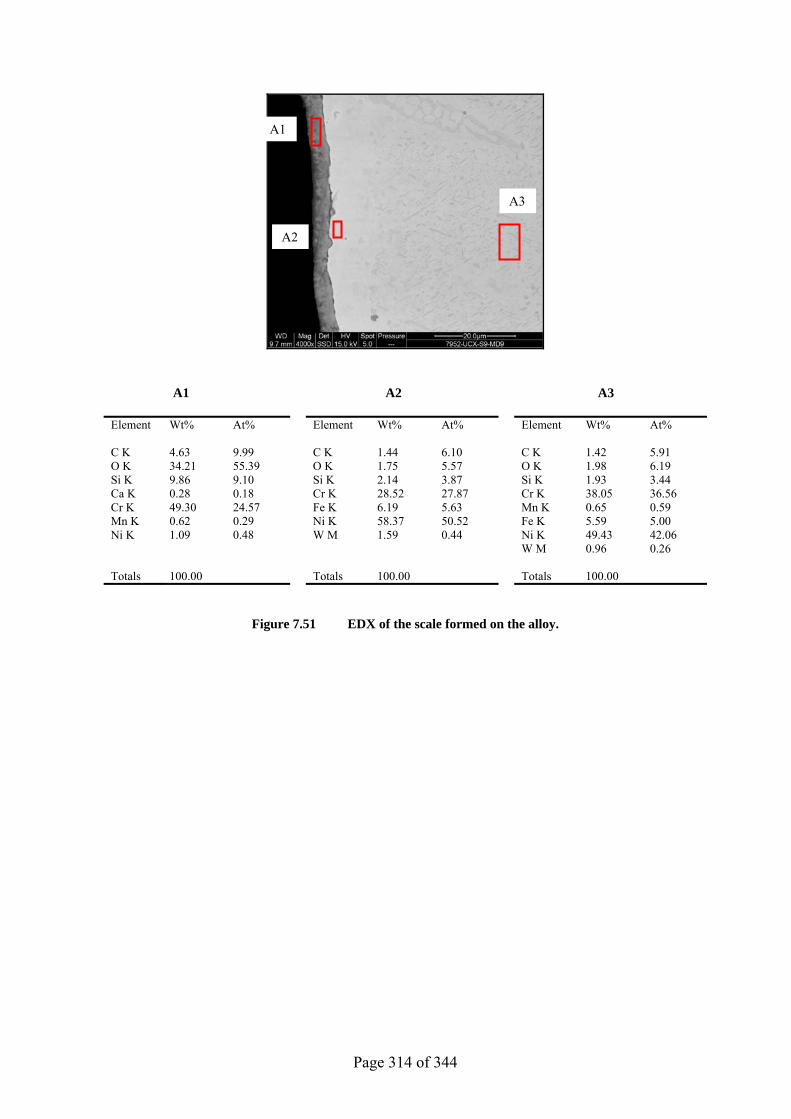
Page 314 of 344
A1 A2 A3
Element Wt% At% Element Wt% At% Element Wt% At% C K 4.63 9.99 C K 1.44 6.10 C K 1.42 5.91 O K 34.21 55.39 O K 1.75 5.57 O K 1.98 6.19 Si K 9.86 9.10 Si K 2.14 3.87 Si K 1.93 3.44 Ca K 0.28 0.18 Cr K 28.52 27.87 Cr K 38.05 36.56 Cr K 49.30 24.57 Fe K 6.19 5.63 Mn K 0.65 0.59 Mn K 0.62 0.29 Ni K 58.37 50.52 Fe K 5.59 5.00 Ni K 1.09 0.48 W M 1.59 0.44 Ni K 49.43 42.06 W M 0.96 0.26 Totals 100.00 Totals 100.00 Totals 100.00
Figure 7.51 EDX of the scale formed on the alloy.
A1
A3
A2
Page 315 of 344
8 METAL DUSTING OF HEAT-RESISTANT ALLOYS: DISCUSSION
8.1 Introduction
The purpose of this chapter is to discuss the results illustrated in previous chapters 5, 6,
and 7 and to evaluate and compare the alloys performance in the gas mixture at 650, 750,
and 850ºC for 100, 500, and 1000h. The mechanisms by which the attack took place are
also suggested.
8.2 Discussion
The highest amount of carbon deposition was observed on the alloys exposed at 650ºC
whereas the least was seen after exposure at 850ºC. For samples exposed at 750ºC for 500
and 1000h, carbon deposition was gradually lessening across the rack in agreement with
the gas flow direction. Increasing the exposure time also caused more carbon deposition
especially at 650 and 750ºC.
The formation of less carbon as a result of the temperature increase may be explained by
considering the thermodynamic aspects of the dominant carbon-producing reactions (i.e.
the carbon monoxide reduction (1.5) and the Boudouard reaction (1.11)) as well as the
temperature profile along the furnace tube at each temperature (Appendix C). For reactions
in equilibrium, the equilibrium constants were calculated using the software, HSC
Chemistry 6.0 (Figure 8.1). In general, the forward reactions are favourable at low
temperatures up to temperatures just below 700ºC. However, carbon deposition was also
observed on the alloys at temperatures above 700ºC implying that the reactions were
probably not in equilibrium.
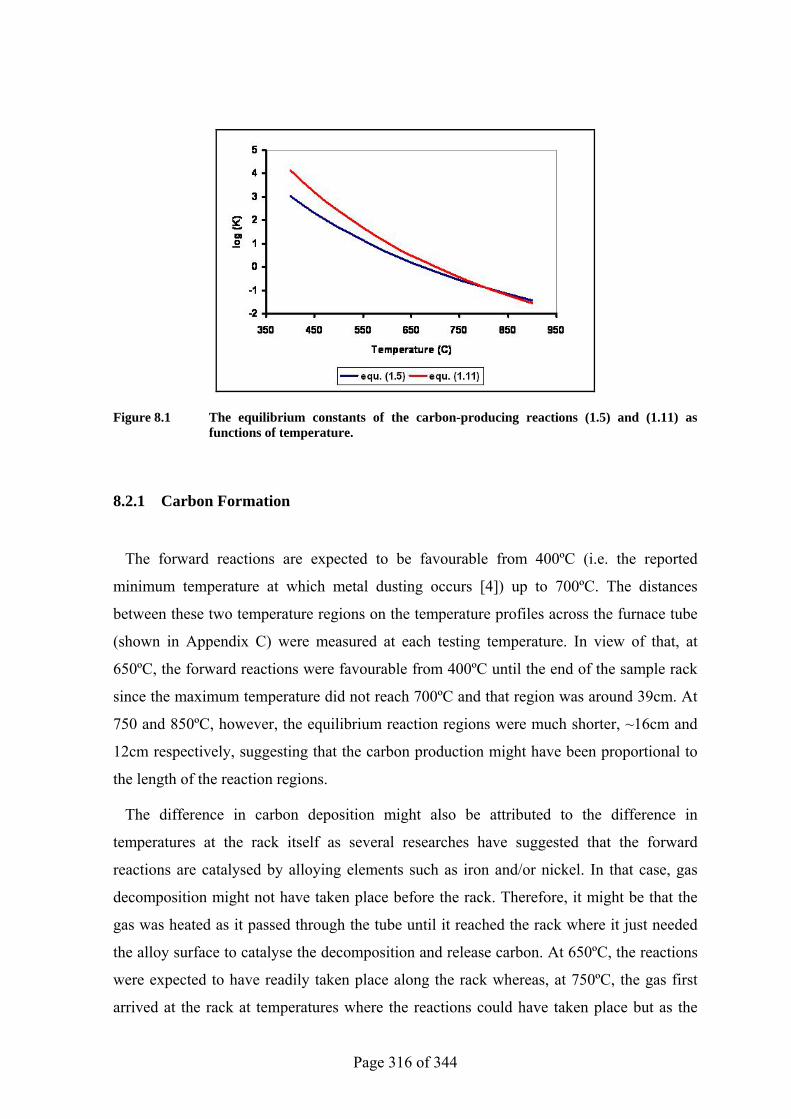
Page 316 of 344
Figure 8.1 The equilibrium constants of the carbon-producing reactions (1.5) and (1.11) as functions of temperature.
8.2.1 Carbon Formation
The forward reactions are expected to be favourable from 400ºC (i.e. the reported
minimum temperature at which metal dusting occurs [4]) up to 700ºC. The distances
between these two temperature regions on the temperature profiles across the furnace tube
(shown in Appendix C) were measured at each testing temperature. In view of that, at
650ºC, the forward reactions were favourable from 400ºC until the end of the sample rack
since the maximum temperature did not reach 700ºC and that region was around 39cm. At
750 and 850ºC, however, the equilibrium reaction regions were much shorter, ~16cm and
12cm respectively, suggesting that the carbon production might have been proportional to
the length of the reaction regions.
The difference in carbon deposition might also be attributed to the difference in
temperatures at the rack itself as several researches have suggested that the forward
reactions are catalysed by alloying elements such as iron and/or nickel. In that case, gas
decomposition might not have taken place before the rack. Therefore, it might be that the
gas was heated as it passed through the tube until it reached the rack where it just needed
the alloy surface to catalyse the decomposition and release carbon. At 650ºC, the reactions
were expected to have readily taken place along the rack whereas, at 750ºC, the gas first
arrived at the rack at temperatures where the reactions could have taken place but as the
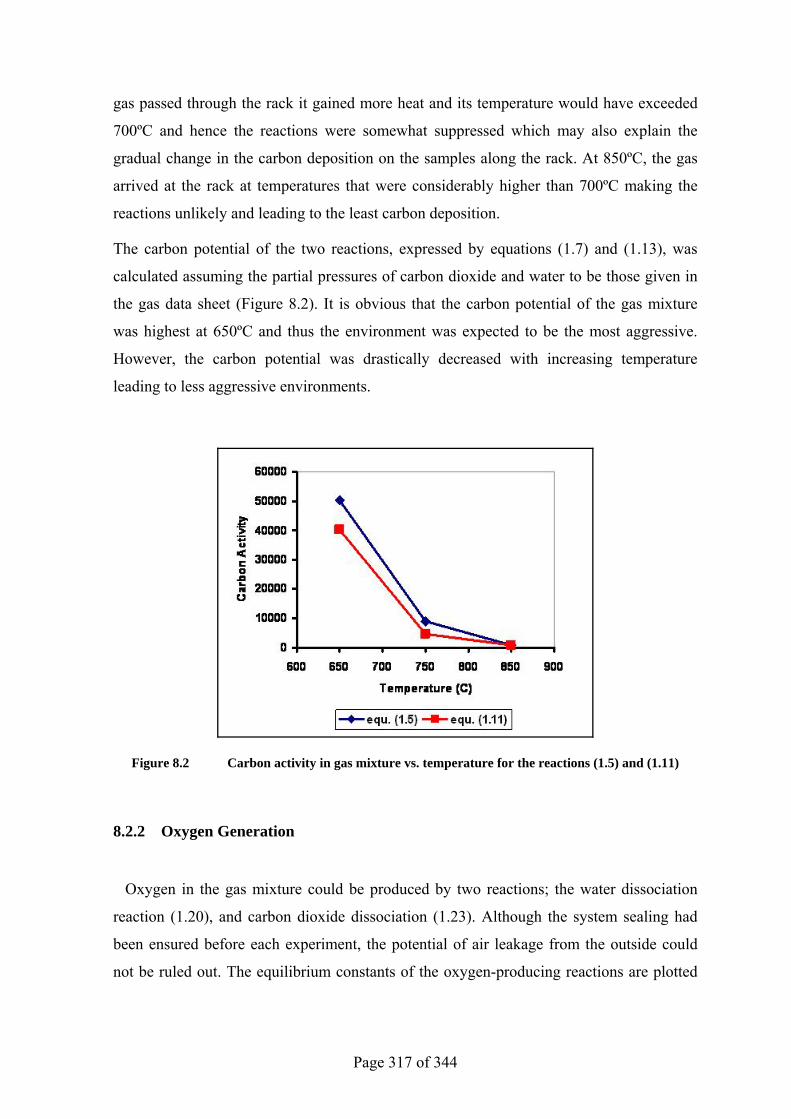
Page 317 of 344
gas passed through the rack it gained more heat and its temperature would have exceeded
700ºC and hence the reactions were somewhat suppressed which may also explain the
gradual change in the carbon deposition on the samples along the rack. At 850ºC, the gas
arrived at the rack at temperatures that were considerably higher than 700ºC making the
reactions unlikely and leading to the least carbon deposition.
The carbon potential of the two reactions, expressed by equations (1.7) and (1.13), was
calculated assuming the partial pressures of carbon dioxide and water to be those given in
the gas data sheet (Figure 8.2). It is obvious that the carbon potential of the gas mixture
was highest at 650ºC and thus the environment was expected to be the most aggressive.
However, the carbon potential was drastically decreased with increasing temperature
leading to less aggressive environments.
Figure 8.2 Carbon activity in gas mixture vs. temperature for the reactions (1.5) and (1.11)
8.2.2 Oxygen Generation
Oxygen in the gas mixture could be produced by two reactions; the water dissociation
reaction (1.20), and carbon dioxide dissociation (1.23). Although the system sealing had
been ensured before each experiment, the potential of air leakage from the outside could
not be ruled out. The equilibrium constants of the oxygen-producing reactions are plotted
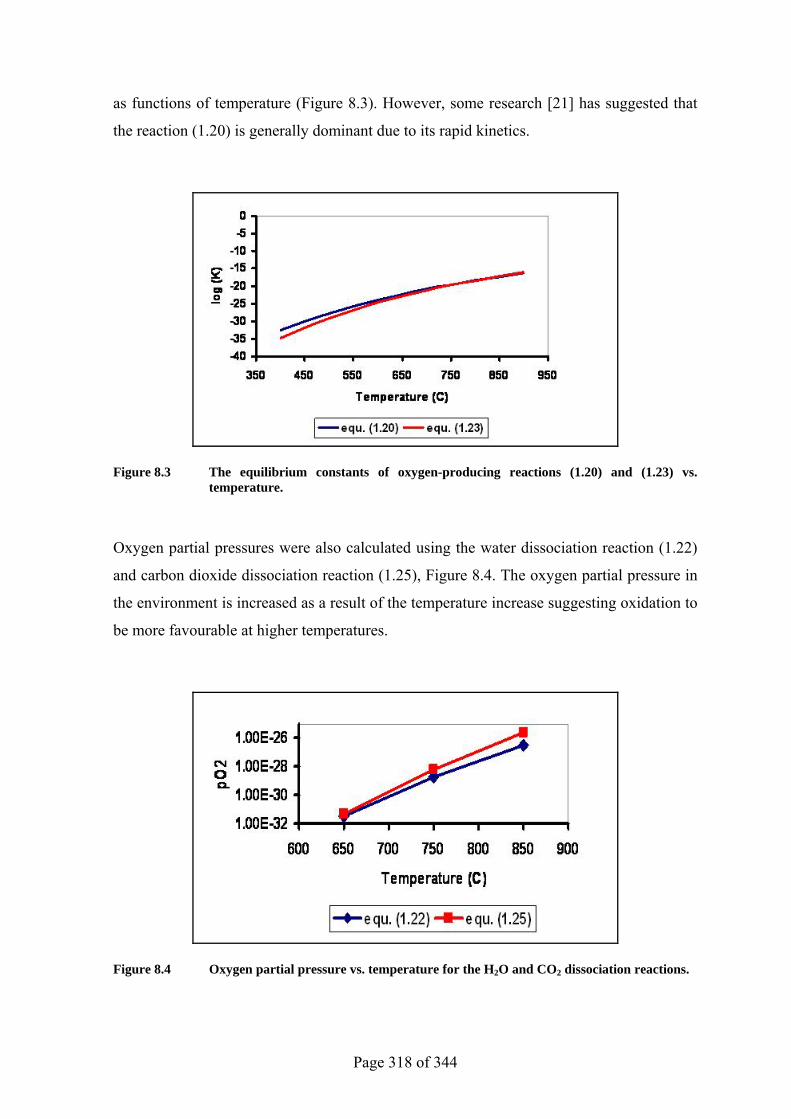
Page 318 of 344
as functions of temperature (Figure 8.3). However, some research [21] has suggested that
the reaction (1.20) is generally dominant due to its rapid kinetics.
Figure 8.3 The equilibrium constants of oxygen-producing reactions (1.20) and (1.23) vs. temperature.
Oxygen partial pressures were also calculated using the water dissociation reaction (1.22)
and carbon dioxide dissociation reaction (1.25), Figure 8.4. The oxygen partial pressure in
the environment is increased as a result of the temperature increase suggesting oxidation to
be more favourable at higher temperatures.
Figure 8.4 Oxygen partial pressure vs. temperature for the H2O and CO2 dissociation reactions.
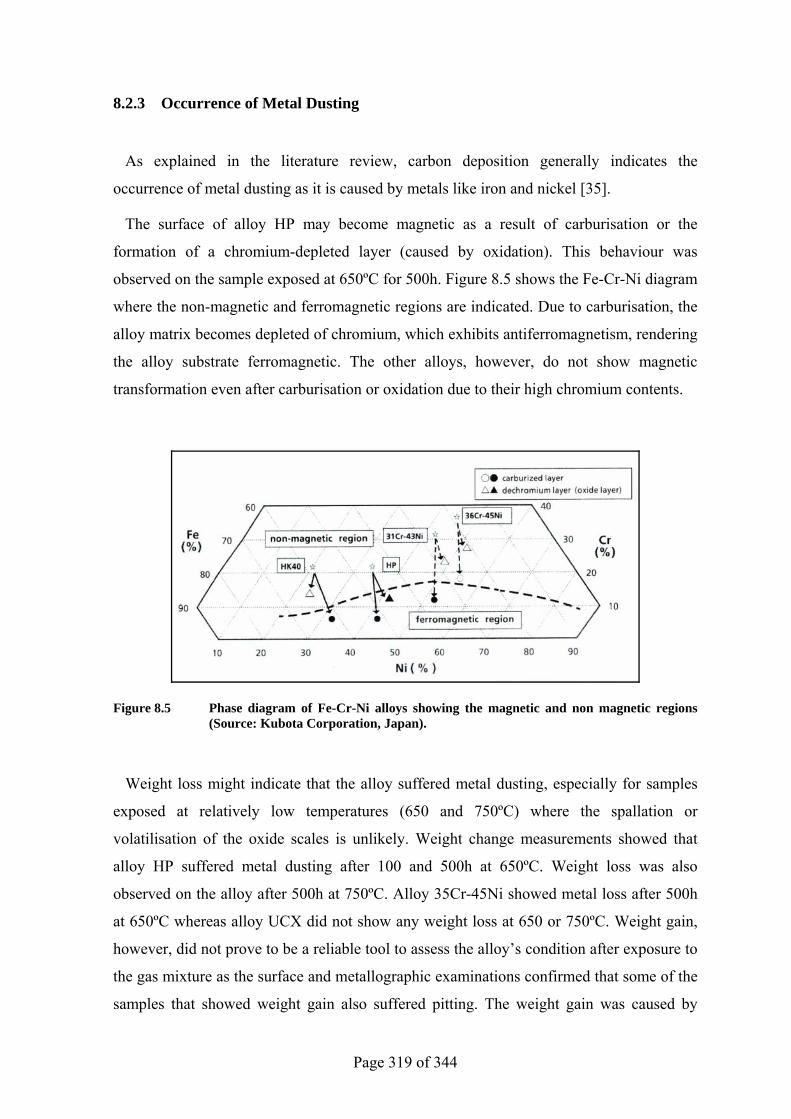
Page 319 of 344
8.2.3 Occurrence of Metal Dusting
As explained in the literature review, carbon deposition generally indicates the
occurrence of metal dusting as it is caused by metals like iron and nickel [35].
The surface of alloy HP may become magnetic as a result of carburisation or the
formation of a chromium-depleted layer (caused by oxidation). This behaviour was
observed on the sample exposed at 650ºC for 500h. Figure 8.5 shows the Fe-Cr-Ni diagram
where the non-magnetic and ferromagnetic regions are indicated. Due to carburisation, the
alloy matrix becomes depleted of chromium, which exhibits antiferromagnetism, rendering
the alloy substrate ferromagnetic. The other alloys, however, do not show magnetic
transformation even after carburisation or oxidation due to their high chromium contents.
Figure 8.5 Phase diagram of Fe-Cr-Ni alloys showing the magnetic and non magnetic regions (Source: Kubota Corporation, Japan).
Weight loss might indicate that the alloy suffered metal dusting, especially for samples
exposed at relatively low temperatures (650 and 750ºC) where the spallation or
volatilisation of the oxide scales is unlikely. Weight change measurements showed that
alloy HP suffered metal dusting after 100 and 500h at 650ºC. Weight loss was also
observed on the alloy after 500h at 750ºC. Alloy 35Cr-45Ni showed metal loss after 500h
at 650ºC whereas alloy UCX did not show any weight loss at 650 or 750ºC. Weight gain,
however, did not prove to be a reliable tool to assess the alloy’s condition after exposure to
the gas mixture as the surface and metallographic examinations confirmed that some of the
samples that showed weight gain also suffered pitting. The weight gain was caused by
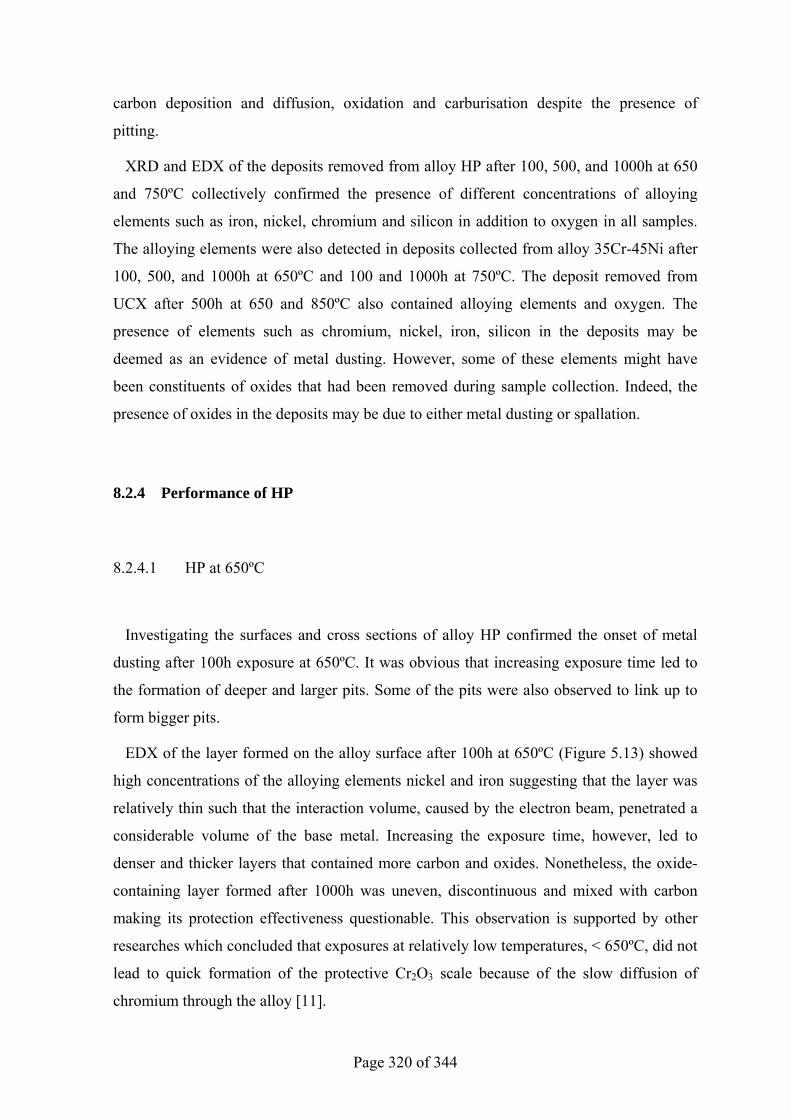
Page 320 of 344
carbon deposition and diffusion, oxidation and carburisation despite the presence of
pitting.
XRD and EDX of the deposits removed from alloy HP after 100, 500, and 1000h at 650
and 750ºC collectively confirmed the presence of different concentrations of alloying
elements such as iron, nickel, chromium and silicon in addition to oxygen in all samples.
The alloying elements were also detected in deposits collected from alloy 35Cr-45Ni after
100, 500, and 1000h at 650ºC and 100 and 1000h at 750ºC. The deposit removed from
UCX after 500h at 650 and 850ºC also contained alloying elements and oxygen. The
presence of elements such as chromium, nickel, iron, silicon in the deposits may be
deemed as an evidence of metal dusting. However, some of these elements might have
been constituents of oxides that had been removed during sample collection. Indeed, the
presence of oxides in the deposits may be due to either metal dusting or spallation.
8.2.4 Performance of HP
8.2.4.1 HP at 650ºC
Investigating the surfaces and cross sections of alloy HP confirmed the onset of metal
dusting after 100h exposure at 650ºC. It was obvious that increasing exposure time led to
the formation of deeper and larger pits. Some of the pits were also observed to link up to
form bigger pits.
EDX of the layer formed on the alloy surface after 100h at 650ºC (Figure 5.13) showed
high concentrations of the alloying elements nickel and iron suggesting that the layer was
relatively thin such that the interaction volume, caused by the electron beam, penetrated a
considerable volume of the base metal. Increasing the exposure time, however, led to
denser and thicker layers that contained more carbon and oxides. Nonetheless, the oxide-
containing layer formed after 1000h was uneven, discontinuous and mixed with carbon
making its protection effectiveness questionable. This observation is supported by other
researches which concluded that exposures at relatively low temperatures, < 650ºC, did not
lead to quick formation of the protective Cr2O3 scale because of the slow diffusion of
chromium through the alloy [11].
Page 321 of 344
The pits caused by exposure at 650ºC had initiated at the alloy matrix rather than the
primary carbides and also progressed through the matrix suggesting that the carbon
diffusion was much easier in the austenitic base metal compared to the carbides which
originally contain higher concentrations of carbon. This behaviour contradicts the metal
dusting mechanism suggested by Szakalos [17] which involves selective oxidation of the
carbides. Indeed, the stability of primary carbides in metal dusting conditions may suggest
the possibility of using carbide-rich films at alloy surfaces in order to improve their
resistance against metal dusting.
Most of the deposits within the pits contained particles of oxides and alloy that were
most probably the result of the disintegration of the alloy due to metal dusting. However,
whereas it is possible that the oxides might also have been removed during sample
preparation, it is unlikely that alloy particles were removed solely because of that. Instead,
it is thought that the alloy particles at the alloy substrate had been weakened as a
consequence of exposure to the gas mixture and might ultimately have been separated due
to cross sectioning.
The attack appeared to have progressed by a process that involved inward diffusion of
carbon followed by growth of very small, hair-like carbon filaments into the reaction front
which eventually led to carbon saturation and alloy disintegration that resulted in a fibrous,
sponge-like layer of approximately 1µm thickness (e.g. Figures 5.43 and 5.48). The
reaction front was covered with numerous micropits that were probably caused by carbon
diffusion and subsequent carbon growth into the substrate which in turn induced internal
high stresses on the alloy particles and ultimately caused them to disintegrate. The
presence of insignificant amounts of oxides at the bottom of the pits suggested that once
the attack had started, the oxide scale did not seem to have reformed (assuming it formed
before the attack) and that might have allowed the continuous progress of the attack. The
carbon deposition and subsequent saturation at the reaction front may have acted as a
barrier between the oxygen in the environment and the oxide-forming elements in the
alloy. Moreover, carburisation at the reaction zone might have halted the chromium
diffusion toward the surface by binding it in the form of chromium carbides.
The stabilities of chromium carbides can be predicted by considering the predominance
diagram (Figure 8.6). At equilibrium, carbides will form when the carbon and oxygen
activities of the environment are in Cr3C2, Cr7C3, and Cr23C6 regions. As shown in Figures
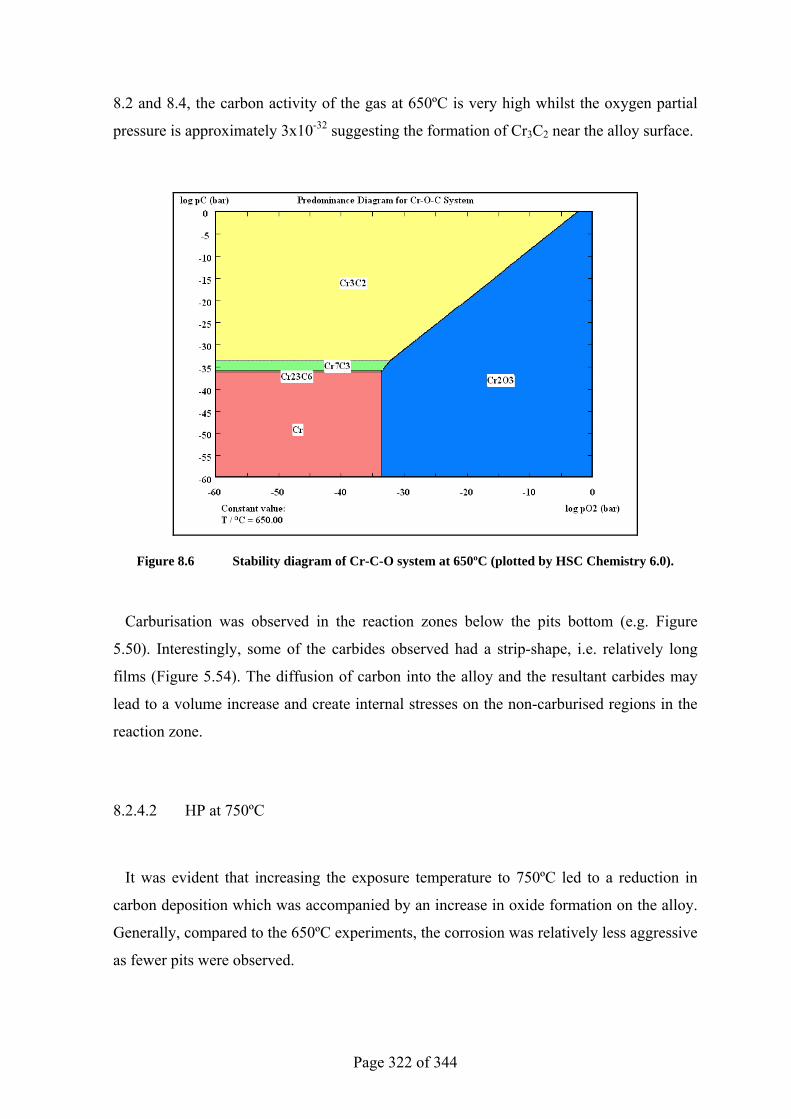
Page 322 of 344
8.2 and 8.4, the carbon activity of the gas at 650ºC is very high whilst the oxygen partial
pressure is approximately 3x10-32 suggesting the formation of Cr3C2 near the alloy surface.
Figure 8.6 Stability diagram of Cr-C-O system at 650ºC (plotted by HSC Chemistry 6.0).
Carburisation was observed in the reaction zones below the pits bottom (e.g. Figure
5.50). Interestingly, some of the carbides observed had a strip-shape, i.e. relatively long
films (Figure 5.54). The diffusion of carbon into the alloy and the resultant carbides may
lead to a volume increase and create internal stresses on the non-carburised regions in the
reaction zone.
8.2.4.2 HP at 750ºC
It was evident that increasing the exposure temperature to 750ºC led to a reduction in
carbon deposition which was accompanied by an increase in oxide formation on the alloy.
Generally, compared to the 650ºC experiments, the corrosion was relatively less aggressive
as fewer pits were observed.
Page 323 of 344
Isolated alloy particles were seen in the pits after 100h and layers of carbon and oxides
accumulated around them (e.g. Figure 5.56). Although these particles might have been
removed during sample preparation, it seemed that the attack was probably facilitated by
the precipitation of some carbide bands (e.g. Figure 5.59) that created internal stresses that
caused microcracking leading to carbon diffusion and oxidation-assisted crack
propagation.
The corrosion observed after 500h was somewhat different from that seen at 650ºC as a
mixture of chromium-based oxides and carbon was detected at the reaction front.
Moreover, a relatively uniform, heavily carburised zone, of about 20µm was discovered
surrounding the pit (Figure 5.60). Investigation of the reaction front revealed a shark’s
teeth-like pattern suggesting that the metal wastage process was progressing through the
formation of a high number of micropits. The process may have started with carbon
diffusion into the reaction zone leading to the formation of a high density of carbides.
Then, as the alloy substrate became supersaturated with carbon the reaction front started
disintegrating into a ~2µm layer that contained high concentrations of carbon, alloying
elements, and oxides. It is worth noting that although the primary carbides seemed more
resistant to the attack than the matrix, the carbides produced by carburisation did not
appear to retard the corrosion progression which might be attributed to the difference in the
morphology, shape, and/or size between the two carbides.
8.2.4.3 HP at 850ºC
The 850ºC samples showed the least attack accompanied by little carbon deposition and
the most oxide formation. The alloy reaction zone suffered carburisation after 100h and
some of the carbides precipitated in the form of relatively long bands (e.g. Figure 5.64).
A totally different type of attack took place on the alloy after 500h as localised, thick
layers containing mainly oxides, alloy particles, and niobium carbides were observed to
grow into the alloy (Figures 5.66 and 5.67). The alloy and carbide particles were embedded
and surrounded by the oxides, and the reaction zone, just below the attack, was heavily
carburised suggesting the combined action of oxidation and carburisation. Interestingly, an
outer oxide layer which also contained carbon appeared to form on the top of the localised
attack implying that the carbon must have diffused through that layer toward the alloy. It
Page 324 of 344
also appeared that the alloy area adjacent to the oxides was depleted of carbides which
might indicate that after carburisation oxidation took place consuming some chromium at
the nearby substrate. Collectively, this mechanism led to disintegration of the alloy and
caused removal of carbides, oxides, and alloy particles that contained mainly nickel and
iron. Although a similar attack was observed on the alloy after 1000h (Figure 5.69),
carburisation was not seen at the reaction zone suggesting that the processes were possibly
at a different stage. These findings agree with the studies that have strongly suggested that
metal dusting is significantly influenced by oxidation where it was observed that
simultaneous carburisation and oxidation exposure would lead to damage that appears
similar to metal dusting [43]. It has also been suggested that the metal dusting process is
controlled by the simultaneous reaction of carbon and oxygen with chromium.
The unusually high concentrations of silicon oxide detected on the alloy were unlikely to
have formed due to the silicon content in the alloy. Normally, the alloys tend to form
discontinuous silica layers at the substrate/Cr2O3 interface in order to improve the integrity
of the oxide scale. In the current case, however, the silicon oxides were found in abnormal
concentrations on the chromium-rich oxides. More details about the silicon role in
oxidation are given in Chapter 4.
The most probable source of silicon oxide was, however, the mullite furnace tube as
literature shows that mullite readily corrodes after exposure to strongly reducing
environments such as the gas mixture used in this research. These showed that hydrogen
can degrade mullite according to the reaction:
A16Si2O13(s) + 2H2 (g) → 3Al2O3(s) + 2SiO (g) + 2H2O (g) (8.1)
This reaction, which was quickened by increasing the temperature, led to the formation of
a porous alumina layer [126]. Also, mullite has reportedly disintegrated as a result of
exposure to CO following the reaction [127]:
A16Si2O13(s) + 2CO (g) → 3Al2O3(s) + 2SiO (g) + 2CO2 (g) (8.2)
Page 325 of 344
8.2.5 Performance of 35Cr-45Ni at all Temperatures
Pitting also occurred on this alloy after 650ºC, but to a lesser extent when compared with
HP, with an increasing pitting concentration with time. The alloy also formed more oxides
although the carbon was still detected in high concentrations. This alloy originally
contained a low carbon concentration compared to HP and UCX which might have
enhanced its resistance to the attack due to the ability to dissolve more carbon and
precipitate more carbide before the onset of the alloy disintegration.
Some of the pits were full of alloy particles separated from the base metal and
carburisation was observed in reaction zones (e.g. Figure 6.32). The attack observed on the
alloy after 1000h seemed to have involved simultaneous oxidation and carburisation
(Figure 6.35). Heavy carburisation was observed in the reaction zone, just below the
localised oxidation. A decarburised zone was however noticed in the reaction zone of
another localised attack suggesting either a different corrosion mechanism or a different
stage of the corrosion process (Figure 6.37). The oxides surrounded chromium-based
carbides in the pit and seemed to facilitate their removal from the alloy.
Only a few pits were observed on samples exposed at 750ºC. The mechanism by which
the attack took place did not seem to be different from that discussed at 650ºC after 100
and 500h. More oxides formed on the alloy as a result of increasing the temperature to
750ºC.
Slightly different pitting was seen after 100h at 850ºC where, in addition to the oxide
layer formed at the pit’s bottom, internal islands of oxides grew into the substrate (e.g.
Figure 6.48). The corrosion changed as a consequence of increasing the exposure time to
1000h where the alloy exhibited localised oxidation and carburisation (Figure 6.53). The
presence of a relatively high concentration of carbides surrounding the attack area and a
decarburised region between the carburised and oxidised zones may suggest the occurrence
of a simultaneous oxidation and carburisation process.
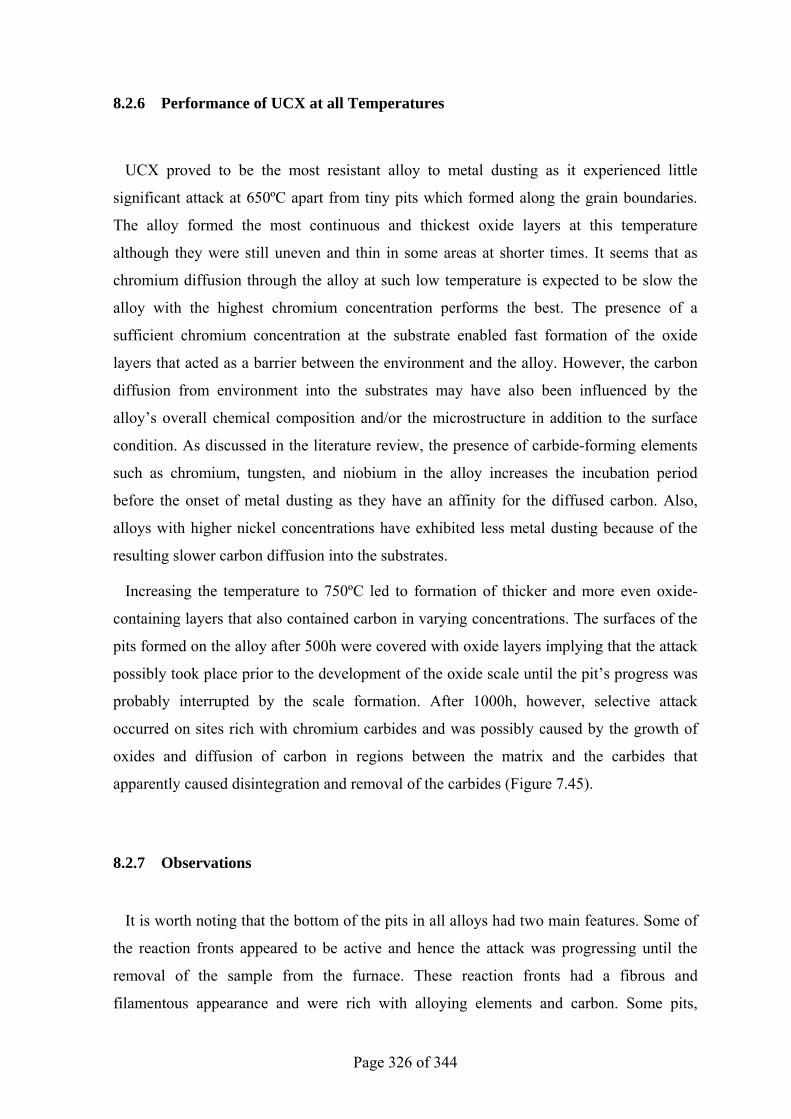
Page 326 of 344
8.2.6 Performance of UCX at all Temperatures
UCX proved to be the most resistant alloy to metal dusting as it experienced little
significant attack at 650ºC apart from tiny pits which formed along the grain boundaries.
The alloy formed the most continuous and thickest oxide layers at this temperature
although they were still uneven and thin in some areas at shorter times. It seems that as
chromium diffusion through the alloy at such low temperature is expected to be slow the
alloy with the highest chromium concentration performs the best. The presence of a
sufficient chromium concentration at the substrate enabled fast formation of the oxide
layers that acted as a barrier between the environment and the alloy. However, the carbon
diffusion from environment into the substrates may have also been influenced by the
alloy’s overall chemical composition and/or the microstructure in addition to the surface
condition. As discussed in the literature review, the presence of carbide-forming elements
such as chromium, tungsten, and niobium in the alloy increases the incubation period
before the onset of metal dusting as they have an affinity for the diffused carbon. Also,
alloys with higher nickel concentrations have exhibited less metal dusting because of the
resulting slower carbon diffusion into the substrates.
Increasing the temperature to 750ºC led to formation of thicker and more even oxide-
containing layers that also contained carbon in varying concentrations. The surfaces of the
pits formed on the alloy after 500h were covered with oxide layers implying that the attack
possibly took place prior to the development of the oxide scale until the pit’s progress was
probably interrupted by the scale formation. After 1000h, however, selective attack
occurred on sites rich with chromium carbides and was possibly caused by the growth of
oxides and diffusion of carbon in regions between the matrix and the carbides that
apparently caused disintegration and removal of the carbides (Figure 7.45).
8.2.7 Observations
It is worth noting that the bottom of the pits in all alloys had two main features. Some of
the reaction fronts appeared to be active and hence the attack was progressing until the
removal of the sample from the furnace. These reaction fronts had a fibrous and
filamentous appearance and were rich with alloying elements and carbon. Some pits,
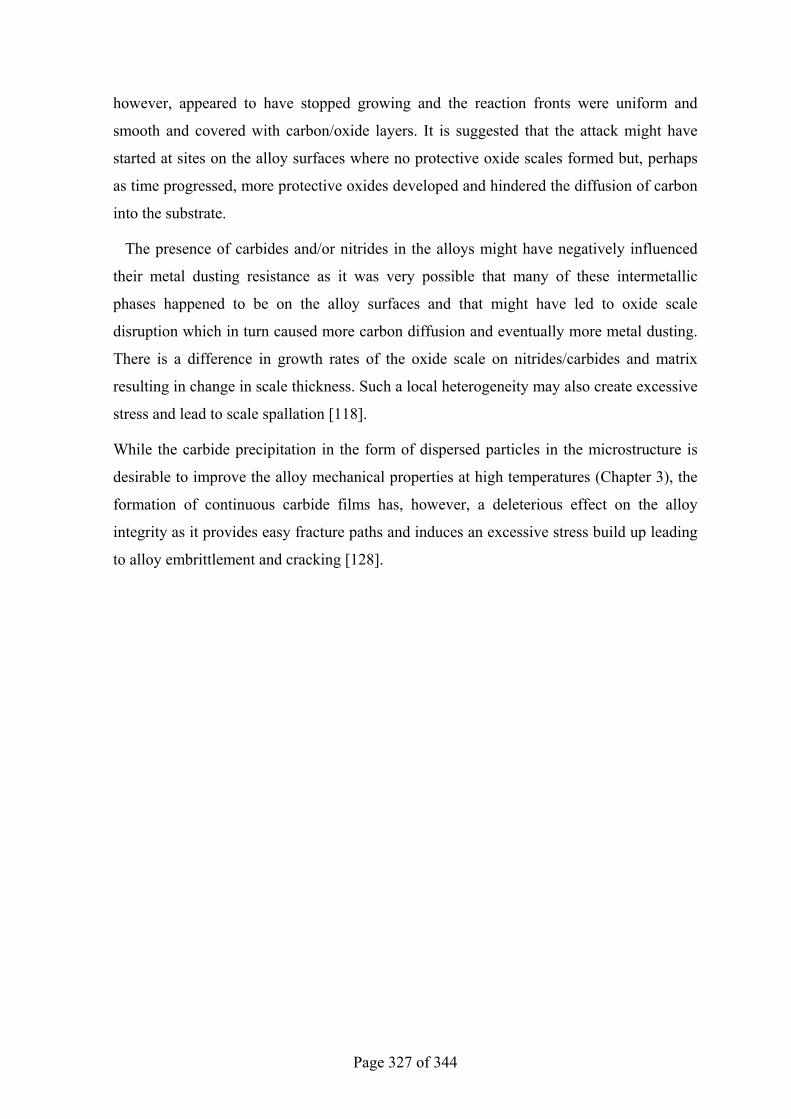
Page 327 of 344
however, appeared to have stopped growing and the reaction fronts were uniform and
smooth and covered with carbon/oxide layers. It is suggested that the attack might have
started at sites on the alloy surfaces where no protective oxide scales formed but, perhaps
as time progressed, more protective oxides developed and hindered the diffusion of carbon
into the substrate.
The presence of carbides and/or nitrides in the alloys might have negatively influenced
their metal dusting resistance as it was very possible that many of these intermetallic
phases happened to be on the alloy surfaces and that might have led to oxide scale
disruption which in turn caused more carbon diffusion and eventually more metal dusting.
There is a difference in growth rates of the oxide scale on nitrides/carbides and matrix
resulting in change in scale thickness. Such a local heterogeneity may also create excessive
stress and lead to scale spallation [118].
While the carbide precipitation in the form of dispersed particles in the microstructure is
desirable to improve the alloy mechanical properties at high temperatures (Chapter 3), the
formation of continuous carbide films has, however, a deleterious effect on the alloy
integrity as it provides easy fracture paths and induces an excessive stress build up leading
to alloy embrittlement and cracking [128].
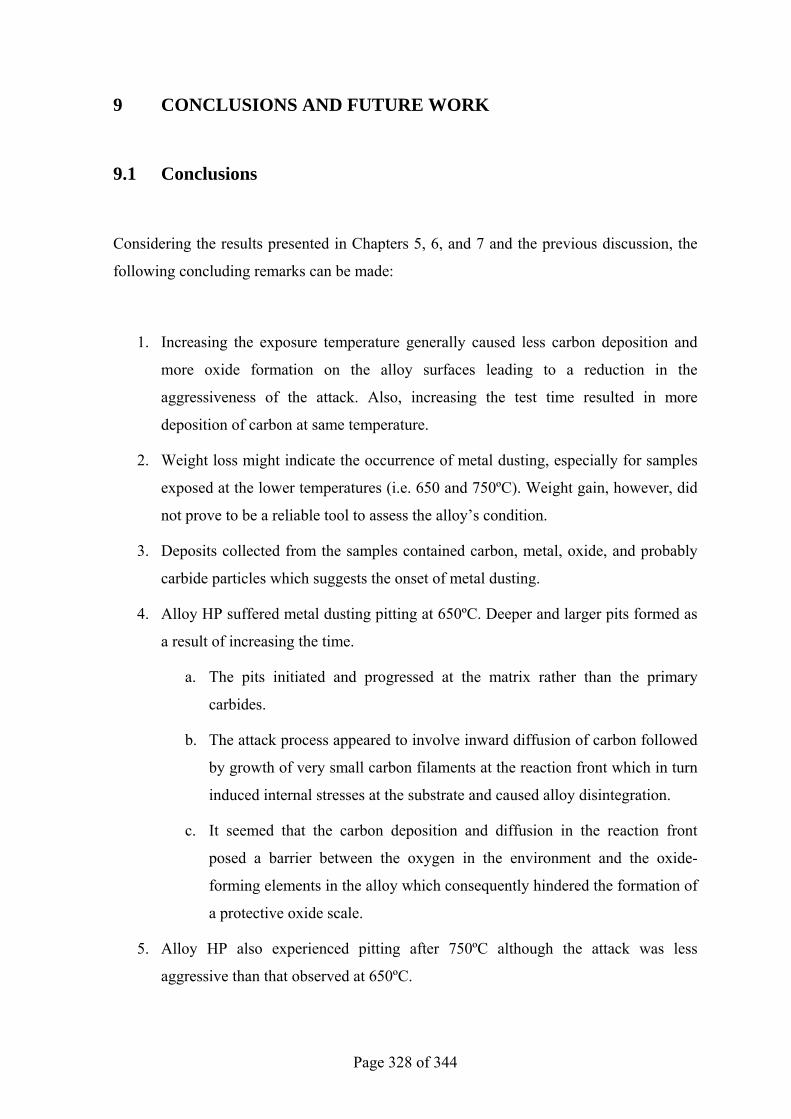
Page 328 of 344
9 CONCLUSIONS AND FUTURE WORK
9.1 Conclusions
Considering the results presented in Chapters 5, 6, and 7 and the previous discussion, the
following concluding remarks can be made:
1. Increasing the exposure temperature generally caused less carbon deposition and
more oxide formation on the alloy surfaces leading to a reduction in the
aggressiveness of the attack. Also, increasing the test time resulted in more
deposition of carbon at same temperature.
2. Weight loss might indicate the occurrence of metal dusting, especially for samples
exposed at the lower temperatures (i.e. 650 and 750ºC). Weight gain, however, did
not prove to be a reliable tool to assess the alloy’s condition.
3. Deposits collected from the samples contained carbon, metal, oxide, and probably
carbide particles which suggests the onset of metal dusting.
4. Alloy HP suffered metal dusting pitting at 650ºC. Deeper and larger pits formed as
a result of increasing the time.
a. The pits initiated and progressed at the matrix rather than the primary
carbides.
b. The attack process appeared to involve inward diffusion of carbon followed
by growth of very small carbon filaments at the reaction front which in turn
induced internal stresses at the substrate and caused alloy disintegration.
c. It seemed that the carbon deposition and diffusion in the reaction front
posed a barrier between the oxygen in the environment and the oxide-
forming elements in the alloy which consequently hindered the formation of
a protective oxide scale.
5. Alloy HP also experienced pitting after 750ºC although the attack was less
aggressive than that observed at 650ºC.
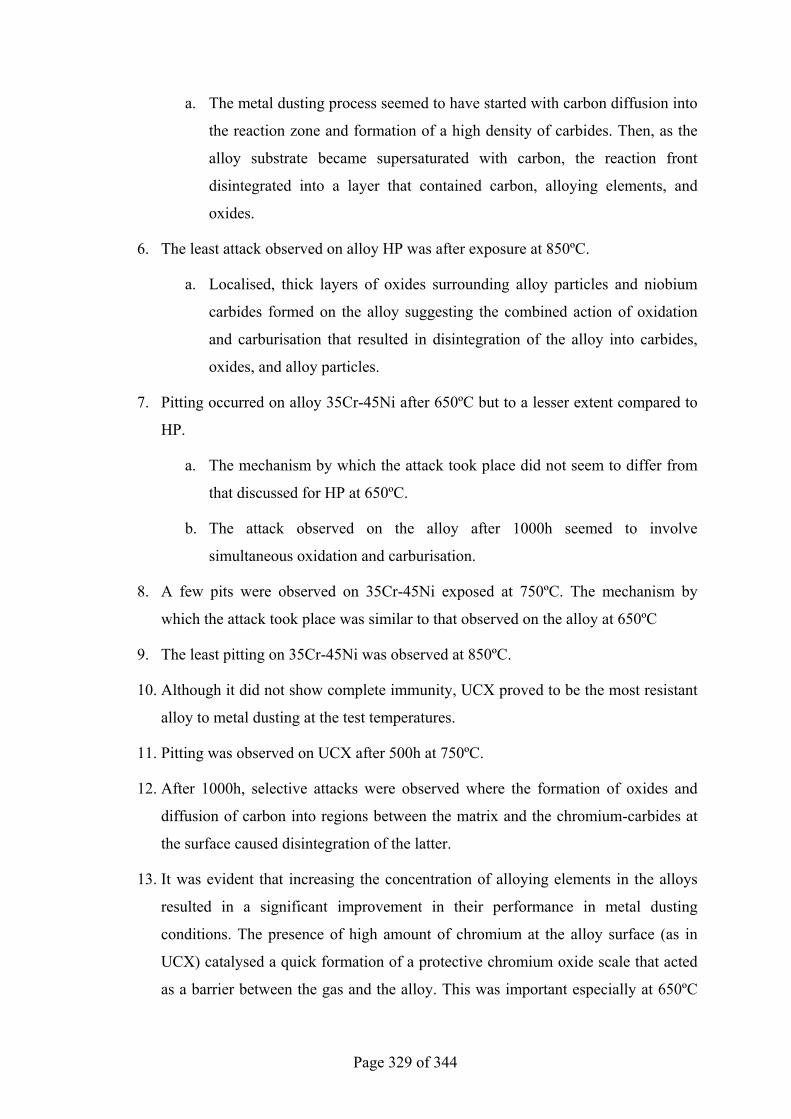
Page 329 of 344
a. The metal dusting process seemed to have started with carbon diffusion into
the reaction zone and formation of a high density of carbides. Then, as the
alloy substrate became supersaturated with carbon, the reaction front
disintegrated into a layer that contained carbon, alloying elements, and
oxides.
6. The least attack observed on alloy HP was after exposure at 850ºC.
a. Localised, thick layers of oxides surrounding alloy particles and niobium
carbides formed on the alloy suggesting the combined action of oxidation
and carburisation that resulted in disintegration of the alloy into carbides,
oxides, and alloy particles.
7. Pitting occurred on alloy 35Cr-45Ni after 650ºC but to a lesser extent compared to
HP.
a. The mechanism by which the attack took place did not seem to differ from
that discussed for HP at 650ºC.
b. The attack observed on the alloy after 1000h seemed to involve
simultaneous oxidation and carburisation.
8. A few pits were observed on 35Cr-45Ni exposed at 750ºC. The mechanism by
which the attack took place was similar to that observed on the alloy at 650ºC
9. The least pitting on 35Cr-45Ni was observed at 850ºC.
10. Although it did not show complete immunity, UCX proved to be the most resistant
alloy to metal dusting at the test temperatures.
11. Pitting was observed on UCX after 500h at 750ºC.
12. After 1000h, selective attacks were observed where the formation of oxides and
diffusion of carbon into regions between the matrix and the chromium-carbides at
the surface caused disintegration of the latter.
13. It was evident that increasing the concentration of alloying elements in the alloys
resulted in a significant improvement in their performance in metal dusting
conditions. The presence of high amount of chromium at the alloy surface (as in
UCX) catalysed a quick formation of a protective chromium oxide scale that acted
as a barrier between the gas and the alloy. This was important especially at 650ºC
Page 330 of 344
where the chromium diffusion through the alloy is anticipated to have been slow.
Furthermore, incorporating high percentage of nickel seemed to have enhanced the
alloys’ resistance owing to the slow diffusion of carbon in nickel.
14. The increase of nickel and chromium in the alloys was accompanied by a reduction
in iron content. Indeed, the presence of high concentration of iron, as in the case of
HP, might have resulted in the formation of unstable iron-containing oxides that
could be reduced by the gas mixture, thus aggravating the attack. The reduction of
the oxides resulted in exposure of the alloy bare surface and subsequently
deposition of more carbon that was catalysed by elements like iron.
15. The carbon low content in 35Cr-45Ni might well have had a beneficial effect on its
metal dusting behaviour. The alloy would contain a higher level of free carbide-
forming elements such as chromium and niobium which would bind with the
diffused carbon and as a consequent delay the onset of metal dusting.
16. The addition of other oxide and carbide-forming elements (e.g. Si, W, Nb, and
Mn) might have also improved the alloy’s performance in metal dusting. Silicon
oxide tends to form at the alloy/oxide scale interface and acts as a second defence
against carbon diffusion from the gas. Also, the formation of Mn-containing oxide
is thought to be beneficial in slowing down the carbon diffusion. Once carbon
diffused into the alloy, the presence of carbide formers became important. They
bind with carbon to form stable carbides and that would delay the onset of metal
dusting and increase the alloy useful life.
17. It was obvious that the presence of niobium and silicon in HP was not enough to
exhibit a good resistance to metal dusting. It should be, however, accompanied by
the addition of more nickel and chromium at the expense of iron and that was
evident in 35Cr-45Ni that showed a better behaviour in the gas mixture. Further
addition of nickel and chromium as well as tungsten resulted in the best
performance, as in the case of UCX.
18. The carburisation on alloy surfaces led to a volume increase and created internal
stresses on the non-carburised areas. Such stress generation might have contributed
to the disintegration of the alloys’ particles by pressing them out.
Page 331 of 344
19. The formation of continuous carbide films (strips) was observed in reaction zone
and that might provide easy fracture paths that may facilitate cracking and removal
of alloy particles.
20. Some of the attacks seemed to have possibly taken place before the development of
the oxide scale and the pit’s progress was then interrupted by the scale formation.
9.2 Future Work
In addition to the current literature, this research has clearly shown the need for further
investigation in order to gain a better understanding of metal dusting. The metal dusting
processes for iron and nickel-based alloys appeared to be complex and involved interaction
of mechanisms such as oxidation and carburisation. Furthermore, the nature of the attack
seemed to differ from one exposure temperature to the other and from one alloy to the
other.
It is strongly suggested there should be established standardised metal dusting testing and
characterisation procedures that cover the best practices accumulated over the years. This
will undoubtedly ensure a more accurate evaluation and comparison of the alloys and
provide a solid base for investigating the attack mechanism(s). More studies are also
necessary to bridge the knowledge gap concerning gas/alloy interaction and to establish
thermodynamic and kinetics correlations.
The temperature distribution across the working tube was naturally non uniform with the
middle being the hottest and the ends being the coldest which may have influenced the gas
decomposition rate and eventually the corrosion process. To overcome this, it is proposed
to design a system that has a more uniform temperature distribution, e.g. a modified
chamber furnace, which will ensure more accurate and reliable results at a given
temperature.
This investigation showed that carbon deposition on the alloys changed according to
exposure temperature and increased with time at the given gas composition and flow rate
(which was constant). Since it has been proposed that carbon accumulation on the alloy
surface is a precursor of metal dusting, it would be interesting to study the effect of altering
the carbon monoxide and hydrogen ratio in the gas on the carbon deposition and metal
Page 332 of 344
dusting. It would also be useful to relate the carbon deposition to the gas flow rate at a
given temperature.
Primary carbides were found to be more resistant to the attack than the matrix. This may
suggest that the alloy metal dusting behaviour is influenced by different distributions and
densities of carbides across the microstructure. The carbides role may be understood by
testing alloys with the same composition but different microstructure, e.g. fine, coarse,
equiaxed, and columnar grains. Furthermore, it would be meaningful to investigate the
behaviour of wrought and cast alloys that have similar composition since the cast alloys are
know to have inhomogeneous microstructure and suffer segregation of alloying elements.
Page 333 of 344
10 BIBLIOGRAPHY
[1] Jones, Richard T., Kenneth L. Baumert, Metal Dusting-An Overview of Current Literature, NACE International, Corrosion 2001, Paper No. 01372.
[2] E. Pippel, J. Woltersdrof and R. Schneider, Micromechanisms of Metal Dusting on Fe-Base and Ni-Base alloys, , Materials and Corrosion 49, 309-316 (1998).
[3] R. F. Hochman, Catastrophic Deterioration of High Temperature Alloys in Carbonaceous Atmospheres, Georgia Inst. of Technology, Proc.-Electrochem. Soc. (1976), 77-1 (Proc. Symp. Prop High Temp. Alloys, 1976), pp. 715-732.
[4] Baker, Brian A. and Gaylord D. Smith, Metal Dusting Behaviour of High Temperature Alloys, NACE International, Corrosion 99, Paper No. 54.
[5] Agarwal, D.C., U. Brill and Jutta Kloewer, Recent Results on Metal Dusting of Nickel Base Alloys and Some Applications, NACE International, Corrosion 2001, Houston.
[6] Lai, George Y., High-Temperature Corrosion of Engineering Alloys, ASM International, 1997, USA.
[7] Kelly, James, Jason Wilson, and Devin Wachowiak, Metal Dusting a.k.a Carbon Rot in the Heat Treat Industry, 50 years, July 2004.
[8] Hrivnak, Ivan, Lubomir Caplovic, Gejza Bakay, and Aurel Bitter, Metal Dusting of Inlet Tube Made of Alloy 800, Kovove Mater. 43, 2005, 290-299.
[9] Levi, T.P., N. Briggs, I. Minchington and C.W. Thomas, A Study of the Relationship Between Metal Dusting and Pressure, NACE International, Corrosion 2001, Paper No. 01375.
[10] Natesan, K., Z. Zeng, V.A. Maroni, W. K. Soppet, and D. L. Rink, Metal Dusting Research at Argonne National Laboratory, Argonne National Laboratory, June 2002, USA.
[11] Grabke, H. J., M. Spiegel, Occurrence of Metal Dusting-Referring to Failures Cases, Materials and Corrosion 2003, 54, No. 10, pp. 799-804.
Page 334 of 344
[12] Di Gabriele, F., J. R. Bernstein, M. M. Al-Qhatani, Z. Liu, M. P. Jordan, J. A. Richardson and F. H. Stott, Study of the Metal Dusting Behaviour of High Temperature Alloys, Materials and Corrosion, 2003, 54, No. 11.
[13] Robert F. Hochman, “Metal Dusting” Catastrophic Deterioration of Metals and Alloys in Carbonaceous Gases, 6th I.C.M.C., Sydney, pp. 1-5, 1975.
[14] Klarstrom, D.L. and S.K. Srivastava, Selection of High Performance Alloys for High Temperature Corrosion Environments, NACE International, Corrosion 2005, Paper No. 05421.
[15] Baker, B.A., G.D. Smith, V.W.Hartmann, L.E.Shoemaker, and S.A. McCoy, Nickel-Base Material Solutions to Metal Dusting, NACE International, Corrosion 2002, Paper No. 02394.
[16] Mirabal, Edmundo, Carlos Molina, Anelsy Mayorga and Jorge L. Hau, Fireside Carburisation of Stainless Steel Furnace Tubes, NACE International, Corrosion 99, Paper No. 80.
[17] Szakalos, Peter, Mechanisms of Metal Dusting, Doctoral Thesis, Department of Material Science and Engineering, Division of Corrosion Science, Royal Institute of Technology, Sweden AND Swedish Institute for Metals Research, Sweden, 2004.
[18] Klower, J., H. J. Grabke, E.M. Muller-Lorenz, and D.C. Agarwal, Metal Dusting and Carburisation Resistance of Nickel Base Alloys, NACE International, Corrosion 97, Paper No. 139.
[19] Ravestein, M. H., Metal Dusting in Catalytic Reforming Furnace Tubes, NACE International, Corrosion 97, Paper No. 496.
[20] Fabiszewski, A.S., W.R. Watkins, J.J.Hoffman, and S.W.Dean, The Effect of Temperature and Gas Composition on the Metal Dusting Susceptibility of Various Alloys, NACE International, Corrosion 2000, Paper No. 00532.
[21] Grabke, H. J., Metal Dusting, Materials and Corrosion 2003, 54, No. 10.
[22] Nishiyama, Y., N. Otsuka, T. Kudo, and O. Miyahara, Metal Dusting of Nickel Base Alloys in Simulated Syngas Mixtures, NACE International, Corrosion 2003, Paper No. 03471.
Page 335 of 344
[23] Dean, Sheldon W., Calculation of Carbon Activities and Related Values for Project ANL -02/05, MTI Project 138-00, Dean Corrosion Technology, Inc., 2002.
[24] Baker, Brian A. and Gaylord D. Smith, Alloy Selection for Environments Which Promote Metal Dusting, NACE International, Corrosion 2000, Paper No. 00257.
[25] Holland, M.L. and H. J. De Bruyn, Metal Dusting Failures in Methane Reforming Plant, Int. J. Pres. Ves. & Piping 66 (1996) 125-133.
[26] Schueler, Robert C., Metal Dusting, Hydrocarbon Processing, August 1972.
[27] Grabke, H.J., R. Krajak and J.C. Nava Paz, On the Mechanism of Catastrophic Carburisation: “Metal Dusting”, Corrosion Science, Vol. 35, Nos 5-8, pp. 1141-1150, 1993.
[28] Chun, C.M., and T.A. Ramanarayanan, Metal Dusting Corrosion of Low Chromium Steels, Oxidation of Metals, Vol. 62, Nos. 112, August 2004.
[29] Schneider, A., J. Zhang, and G. Inden, Metal Dusting of Binary Fe-Al Alloys in CO-H2-H2O Gas Mixtures, JCSE, Volume 6, Paper H043, 2003.
[30] Collin, R., S. Gunnarson, and D. Thulin, A Mathematical Model for Predicting Carbon Concentration Profiles of Gas-Carburised Steel, Journal of The Iron and Steel Institute, October 1972.
[31] Grabke, H.J., Kinetics of Oxygen Transfer from Dioxide to the surface of Iron, 928; 1965, Amsterdam, North Holland Publishing Co., Ber der Bunsenges. Fur phys. Chemie, 1967,71,1067.
[32] Grabke, H. J., Ber der Bunsenges. Fur phys. Chemie, 1965, 69,409.
[33] Chun and T. A. Ramanarayanan, Metal Dusting Corrosion of Austenitic 304 Stainless Steel, Journal of the Electrochemical Society, 152 (5) B169-B177 (2005).
[34] Steurbaut, C., H. J. Grabke, D. Stobbe, F. R. van Buren, S. J. Korf, and J. Defrancq, Kinetic Studies of Coke Formation and Removal on HP40 in Cycled Atmospheres at High Temperatures, Materials and Corrosion 49, 352-359 (1998).
Page 336 of 344
[35] Muller-Lorenz, E.M., H.J. Grabke and M. Zinke, Metal Dusting Resistance of Welded Nickel Based Alloys, EUROCORR 2001.
[36] Turkdogan, E. T. and J. R. Vinters, Catalytic Effect of Iron on Decomposition of Carbon Monoxide: I. Carbon Deposition in H2-CO Mixtures, Metallurgical Transactions, volume 5, pp. 11-19, 1974.
[37] Olsson, R. G. and E. T. Turkdogan, Catalytic Effect of Iron on Decomposition of Carbon Monoxide:II. Effect of Additions of H2, H2O, CO2, SO2 and H2S, Metallurgical Transactions, volume 5, pp. 21-26, 1974.
[38] Tillack, D. J., and J. E. Guthrie, Wrought and Cast Heat Resistant Stainless Steels and Nickel Alloys for the Refining and Petrochemical Industries, Nickel Institute Technical Series # 10071.
[39] Baker, B. A., V. W. Hartmann, and S. A. McCoy, A new Nickel Base Alloy for Resisting Metal Dusting Attack, Special Metals Corporation, www.specialmetals.com/documents.
[40] Kirchheiner, R., and J. L. Jimenez Solar, Correlation of Oxidation, Carburisation and Metal Dusting; “Controlling Corrosion by Corrosion”, NACE International, Corrosion 2001, Paper No. 01374.
[41] Schutze, M., C. Rosado, and F. Dettenwanger, Protection of Steels against Metal Dusting Attack by Coating, EUROCORR 2001.
[42] Wei, Q., E. Pippel, J. Woltersdrof and H.J. Grabke, Microprocesses of Coke Formation in Metal Dusting, Materials and Corrosion 50, 628-633 (1999).
[43] De Bruyn, Hendrik J., Emil H. Edwin and Stein Brendryen, Apparent Influence of Steam on Metal Dusting, NACE International, Corrosion 2001, Paper No. 01383.
[44] Pippel, E., J. Woltersdorf, and H. J. Grabke, Microprocesses of Metal Dusting on Iron-Nickel Alloys and Their Dependence on Composition, Materials and Corrosion 2003, 54, No. 10, 747-751. .
[45] Grabke, Hans Jurgen, Else Marie Muller-Lorenz, and Andre Schneider, Review-Carburisation and Metal Dusting on Iron, ISIJ International, Vol. 41 (2001), Supplement, pp. S1-S8.
Page 337 of 344
[46] A. Schneider, Iron Layer Formation during Cementite Decomposition in Carburising Atmospheres, Corrosion Science 44 (2002) 2353-2365.
[47] Jiang, D. E. and Emily A. Carter, Effects of Alloying on the Chemistry of CO and H2S on Fe Surfaces, J. Phys. Chem. B 2005, 109, 20469-20478.
[48] R. F. Hochman, Basic Studies of Metal Deterioration (“Metal Dusting”) in Carbonaceous Environments at Elevated Temperatures, Proceedings of the Fourth International Congress on Metallic Corrosion, NACE (1972), pp. 260-263.
[49] Szakálos, P., M Lundberg and R. Pettersson, The Role of Discontinuous Precipitation in Metal Dusting, Materials Science Forum Vols. 461-464 (2004) pp 561-570.
[50] Szakálos, P., M Lundberg and R. Pettersson, Metal Dusting on an Alumina Forming Ni-base Alloy, Corrosion Science 48 (2006) 1679-1695.
[51] Toh, C.H., P.R. Munroe, and D.J. Young, Metal Dusting of Fe-Cr and Fe-Ni-Cr Alloys under Cyclic Conditions, Oxidation of Metals, Vol. 58, Nos. ½, August 2002.
[52] Zeng, Z., and K. Natesan, Relationship between the Growth of Carbon Nanofilaments and Metal Dusting Corrosion, Chem. Mater 2005, 17, 3794-3801.
[53] Zhang, J., A. Schneider, and G. Inden, Characterisation of the Coke formed during Metal Dusting of Iron in CO-H2-H2O gas mixtures, Corrosion Science 45(2003) 1329-1341.
[54] LeFrancois, P. A. and W. B. Hoyt, Chemical Thermodynamics of High Temperature Reaction in Metal Dusting Corrosion, Corrosion 19 (1963), pp. 360t-368t.
[55] Hotcman, R. F. and J. H. Burson, The Fundamentals of Metal Dusting, III. API Division of Refining Proceedings 46, (1966), pp. 331-334.
[56] H.J. Grabke, Nickel-Based Alloys in Carbonaceous Gases, Corrosion-Vol. 56, No.8, 801-808, 2000.
[57] Chun, C. M., J. M. Mumford, and T. A. Ramanarayanan, Metal Dusting Corrosion of Cobalt, Journal of the Electrochemical Society, 150 (2) B76-B82 (2003).
Page 338 of 344
[58] Chun, C. M., J. M. Mumford, and T. A. Ramanarayanan, Mechanism of Metal Dusting Corrosion of Iron, Journal of the Electrochemical Society, 149 (7) B348-B355 (2002).
[59] Chun, C. M., J. D. Mumford, and T. A. Ramanarayanan, Carbon Induced Corrosion of Nickel Anode, Journal of Electrochemical Society, 147 (10) 3680-3686 (2000).
[60] Motin, M.A.A., P.R. Munroe, M.P. Brady and D.J. Young, Metal Dusting of ferrite Fe-Ge in the absence of cementite, Scripta Materialia 56 (2007) 281-284.
[61] Zhang, J., A. Schneider and G. Inden, Metal dusting of iron in CO-H2-H2O gas mixtures at 600°C, Volume 6 Paper 100, JCSE, 2004.
[62] Grabke, H.J., Carburisation, Carbide Formation, Metal Dusting, Coking, MTAEC 9, 36(6)297(2002).
[63] Grabke, H. J., and E. M. Muller-Lorenz, Occurrence and Prevention of Metal Dusting on Stainless Steels, NACE International, Corrosion 2001, Paper No. 01373.
[64] Maier, Mark, and James F. Norton, Studies Concerned with the Metal Dusting of Fe-Cr-Ni Materials, NACE International, Corrosion 99, Paper No. 75.
[65] Toh,Chin Hock, Metal Dusting on Heat-resistant alloys under Thermal Cyclic Conditions, A thesis submitted for the degree of doctor of philosophy, University of New South Wales, December 2002, www.library.unsw.edu.au.
[66] De Bruyn, Hendrik J., and Michael L. Holland, Materials Experience in a Methane Reforming Plant, NACE International, Corrosion 98, Paper No. 429.
[67] Klarstrom, Dwaine L., Hans J. Grabke, and Larry D. Paul, The Metal Dusting Behaviour of Several High Temperature Nickel Based Alloys, NACE International, Corrosion 2001, Paper No. 01379.
[68] Di Gabriele, F., F. H. Stott, J. R. Bernstein and Z. Liu, Characterisation of Several Nickel Base Alloys in Metal Dusting Environments, JCSE, Volume 6, Paper H009, 2003.
Page 339 of 344
[69] Agarwal, D. C. and Ulrich Brill, Performance of Alloy 602CA (UNS N06025) in High Temperature Environment up to 1200°C (=2200°F), NACE International, Corrosion 2000, Paper No. 00521.
[70] Elliott, Peter, Materials Performance in High Temperature Environments-Making the Choice, NACE International, Corrosion 2000, Paper No. 00527.
[71] Elliott, Peter, Choose Materials for High-Temperature Environments, www.aiche.org/cep, 2001.
[72] Baker, B. A. and G. D. Smith, Metal Dusting in Laboratory Environment- Alloying Addition Effect, www.specialmetals.com/documents.
[73] Li, B. and B. Gleeson, Effects of Minor Elements on the Cyclic Oxidation Behaviour of Commercial Fe-bas 800-Series Alloys, Oxidation of Metals, Vol. 62, Nos. 112, 2004.
[74] Zhang, Jianqiang and David J. Young, Effect of copper on metal dusting of austenitic stainless steels, Corrosion Science 49 (2007) 1450-1467.
[75] Wolf, I, H. J. Grabke, and P. Schmidt, Carbon Transport Through Oxide Scales on Fe-Cr Alloys, Oxidation of Metals 29, Nos. ¾, (1988), pp. 289-306.
[76] Jones, Richard T., An Overview of Metal Dusting, MTI Project 133-99, Materials Technology Institute, Inc., 2000.
[77] O. Coreno-Alonso, A. Duffus-Scott, C. Zanchez-Cornejo, J. Coreno-Alonso, F. Sanchez-de Jesus, and A. Bolarin-Miro, On the effect of σ-phase formation during metal dusting, Materials Chemistry and Physics 84(2004) 20-28.
[78] Brill, U., G. K. Grossmann, and T. Kremser, Corrosion Behaviour of the Ni-Cr-Si Alloy 45 TM (UNS N 06045) in High Temperature Applications, NACE International, Corrosion 2001, Paper 01156.
[79] Ramanathan, L.V., Role of Rare Earth Elements on the High Temperature Oxidation Behaviour of Fe-Cr, Ni-Cr and Ni-Cr-Al Alloys, Corrosion Science, Vol. 35, Nos5-8, pp. 871-878, 1993.
[80] Yuan, Z. X., Z. S. Yu, P. Tan, and S. H. Song, Effect of Rare Earths on the Carburisation of Steel, Materials Science and Engineering A267 (1999) 162-166.
Page 340 of 344
[81] Elliott, P., A practical Guide to High Temperature Alloys, Materials and Design, Vol. 12, No. 6, 1991.
[82] Kelly, James, Metal Dusting in the Heat Treating Industry, Stainless Steel World Conference, 1999.
[83] Kelly, James, Metal Dusting Causes HRA Headaches, Rolled Alloys, Temperance, Mich, http://industrialheating.com.
[84] Grabke, H. J, Corrosion by Carbonaceous Gases, Carburisation and Metal Dusting, and Methods of Prevention, Materials at High Temperatures 17(4) 483-487, 2000.
[85] Grabke, H. J., E. M. Muller-Lorenz, S. Strauss, E. Pippel and J. Woltersdorf, Effects of Grain Size, Cold Working, and Surface Finish on the Metal Dusting Resistance of Steels, Oxidation of Metals, Vol. 50, Nos. 3/4, 1998.
[86] Palasantzas, G., H. J. Kooij, J. Th. M. DeHosson, Carbon Induced Metal Dusting of Iron-Nickel-Chromium Alloy Surfaces: A Scanning Auger Microscopy Study, Applied Surface Science 229 (2004) 190-196.
[87] Smith, P. J., O. Van der Biest, and J. Corish, The Initial Stages of High-Temperature Corrosion of Fe-Cr-Ni and Cr-Ni Alloys in a Carburizing Atmosphere of Low Oxygen Partial Pressure, Oxidation of Metals, Vol. 24, Nos. 1/2 , 1985.
[88] Voisey, K. T., Z. Liu, and F.H. Stott, Inhibition of Metal Dusting of Alloy 800H by Laser Surface Melting, Applied Surface Science, 2005, www.sciencedirect.com.
[89] Baker, B.A. and G.D Smith, Metal Dusting of Nickel Containing Alloys, NACE International, Corrosion 98, Paper No. 445.
[90] Schmid, Bernd, John Charles Walmsley, Oystein Grong, and Rolf Odegard, Microscale Investigations of the Metal-Dusting Corrosion Mechanism on Mild Steel, Metallurgical and Materials Transactions A, volume 34A, 2003, 345-354.
[91] Broutin, P., F. Ropital, M.F. Reyniers and G. F. Froment, Anticoking Coatings for High Temperature Petrochemical Reactors, Oil & Gas Science and Technology, Vol. 54 (1999), No. 33, pp. 375-385.
Page 341 of 344
[92] Natesan, K., Z. Zeng, W. K. Soppet, and D. L. Rink, Metal Dusting Behaviour of Coatings, Argonne National Laboratory, USA, 2002
[93] Voisey, K. T., Z. Liu, and F. H. Stott, Inhibition of Metal Dusting using Thermal Spray Coatings and Laser Treatment, Surface and Coating Technology, 2005, www.sciencedirect.com.
[94] Bayer, George T., Surface Engineered Coatings for Metal Dusting, NACE International, Corrosion 2001, Paper No. 01387.
[95] Trimm, D. L., Control of Coking, Chem. Eng. Proces., 18(1984) 137-148.
[96] Zeng, Z, K. Natesan, abd M. Grimsditch, Effect of Oxide Scale Compositions on Metal Dusting Corrosion of Fe-Based Alloys, Corrosion-Vol. 60, No. 7,pp. 632-642, NACE International, July 2004.
[97] Natesan, K. and Z. Zeng, Metal Dusting Performance of Structural Alloys, NACE International, Corrosion2005, Paper No. 05409.
[98] Cai, Haiyong, Andrzej Krzywicki, Michael C. Oballa, Coke Formation in Steam Crackers for Ethylene Production, Chemical Engineering and Processing 41 (2002) 199-214.
[99] Coking Behaviour of Cracking Tube Materials for Ethylene Plants, Sumitomo Metal Industries Ltd., Japan.
[100] Corrosion (3rd Edition) – Volume 2-Nickel and its Alloys: Carburisation and Attack by Carbon Containing Gases, 7:126-131, Elsevier, 1994.
[101] Juarez-Islas, J.A., B. Campillo, N. Chaudhary, R. Mendoza, and A. Gonzalez, High Temperature Corrosion of Austenitic Stainless Steel Coils in A Direct Reduction Plant in Mexico, NACE International, Corrosion 96, Paper No. 425.
[102] H. J. Grabke, Metal Dusting of Low- and High- Alloy Steels, Corrosion –Vol. 51, No. 9, 711-720, 1995.
[103] Heat Resistant Alloy KHR35C-Hi Si: Alloy Data Sheet, Kubota Corporation, Japan, 2003.
Page 342 of 344
[104] Heat Resistant Alloy KHR45 LC: Alloy Data Sheet, Kubota Corporation, Japan, 2003.
[105] Heat Resistant Alloy UCX: Alloy Data Sheet, Kubota Corporation, Japan, 2003.
[106] Mill Sheet of KHR35C-Hi Si, KHR45 LC, and UCX, Kubota Corporation, Japan, 2005.
[107] A Working Party Report on Guidelines for Methods of Testing and Research in High Temperature Corrosion, European Federation of Corrosion Publications, Number 14, The Institute of Materials, 1995.
[108] Dillinger, L., R. D. Buchheit, J.A. VanEcho, D.B.Roach and A. M. Hall, Microstructures of Heat-resistant alloys, Battelle Memorial Institute-Columbus Laboratories, Alloy Casting Institute Division, Steel Founders’ Society of America, 1970.
[109] Metallography and Microstructures, ASM International Handbook, Volume 9, USA, 2004.
[110] Wu, X. Q., H.M. Jing, Y. G. Zheng, Z. M. Yao, W. Ke and Z. Q. Hu, The Eutectic Carbides and Creep Rupture Strength of 25Cr20Ni Heat Resistant Steel Tubes Centrifugally Cast with Different Solidification Conditions, Materials Science and Engineering, A293 (2000) 252-260.
[111] Abada, Ahmad, Why Do Heat-resistant alloys Fail? , Steeltech Ltd., Grand Rapids, Mich./Advanced Centrifugals Ltd., Cambridge, Wis.
[112] Raul Alejandro Pedro Ibanez, Gloria Dulce de Almeida Soares, Luiz Henrique de Almeida, and Iain Le May, “Effect of Si Content on the Microstructure of Modified-HP Austenitic Steels” Materials Characterisation, 30:243-249(1993).
[113] Knowles, D. M., C. W. Thomas, D. J. Keen, and Q. Z. Chen, “In service embrittlement of cast 20Cr30Ni1Nb components used in steam reformer applications” , International Journal of Pressure Vessels and Piping, 81 (2004) 499-506.
[114] Alloying, Understanding the Basics, Edited by J. R. Davis, ASM International, USA, 2001.
Page 343 of 344
[115] Rohrig, Klaus, Castings from Stainless Steels and Nickel Base Alloys, Consultant to the Nickel Development Institute, Germany.
[116] Stott, F. H., MSc (Corrosion Science and Engineering) Course: High Temperature Degradation and Protection Module, 2001-2002, UMIST, Manchester, UK.
[117] Khanna, A. S., Introduction to High Temperature Oxidation and Corrosion, ASM International, 2002.
[118] Stott, F. H., The Protective Action of Oxide Scales in Gaseous Environments at High Temperatures, Rep. Prog. Phys. 50(1987) 861-913.
[119] Riffard, F., H. Buscail, E. Caudron, R. Cueff, C. Issartel, S. El Messki, and S. Perrier, Peculiar high temperature corrosion behaviour of AISI 304 stainless steel at 900ºC, EuroCorr2005, Lisbon, Portugal.
[120] Li, Bintgtao and B. Gleeson, Effects of Silicon on the Oxidation Behaviour of Commercial Chromia-Forming Alloys, Nace International, Corrosion 2002, Paper No. 02393.
[121] Li, Bintgtao and B. Gleeson, Effects of Minor Elements on Cyclic-Oxidastion Behaviour of Commercial Fe-base 800-series Alloys, Oxidation of Metals, Vol. 62, Nos. 1/2, 2004.
[122] Douglass, D. L. and J. S. Armijo, The Effect of Silicon and Manganese on the Oxidation Mechanism of Ni-20Cr, Oxidation of Metals, Vol. 2, No. 2, pp. 207-231, 1970.
[123] Holcomb, Gordon R. and David E. Alman, The Effect of Manganese Additions on the Reactive Evaporation of Chromium in Ni-Cr Alloys, Albany Research Center, U.S. Department of Energy, www.osti.gov.
[124] Ramanathan, L. V., Role of Rare-Earth Elements on High Temperature Oxidation Behaviour of Fe-Cr, Ni-Cr and Ni-Cr-Al Alloys, Corrosion Science, Vol. 35, Nos. 5-8, pp. 871-878, 1993.
[125] Birks, N. and G. H. Meier, Introduction to High Temperature Oxidation of Metals, Edward Arnold Ltd, 1983.

Page 344 of 344
[126] Herbell, Thomas P., David R. Hull, and Anita Garg, Hot Hydrogen Exposure Degradation of the Strength of Mullite, NASA, http://gltrs.grc.nasa.gov.
[127] F. A. Costa Oliveira, High Temperature Corrosion of Ceramic Foam Radiant Gas Burners, EuroCorr 2005, paper 125, Lisbon.
[128] Wang, Frances and Derek O. Northwood, The Effect of Carbon Content on the Microstructure of an Experimental Heat-Resistant Steel, Materials Characterisation, 31:3-10(1993).