European
www.ejconline.com
European Journal of Cancer 41 (2005) 28–44
Journal of
Cancer
Review
Meta-analysis of risk factors for cutaneous melanoma: I.Common and atypical naevi
Sara Gandini a,*, Francesco Sera b, Maria Sofia Cattaruzza c, Paolo Pasquini d,Damiano Abeni d, Peter Boyle e, Carmelo Francesco Melchi d
a Department of Epidemiology and Biostatistics, European Institute of Oncology IRCCS, Via Ripamonti 435, 20141 Milan, Italyb Molecular and Nutritional Epidemiology Unit, CSPO, Scientific Institute of Tuscany, Via di San Salvi 12, 50135 Florence, Italy
c Department of Public Health Sciences, University La sapienza, Piazzale, Aldo Moro 5, 00185 Rome, Italyd Immacolata Dermatological Institute, (IDI) IRCCS, Via dei Monti di Creta 104, 00167 Rome, Italy
e International Agency for Research on Cancer, Lyon, France
Received 30 June 2004; received in revised form 20 September 2004; accepted 14 October 2004
Available online 24 November 2004
Abstract
A systematic meta-analysis of observational studies of melanoma and one of the most important risk factors, the number of
naevi, was conducted in order to clarify aspects of the aetiology of this disease. Following a systematic literature search, relative
risks (RRs) were extracted from 46 studies published before September 2002. Dose–response random effects models were used to
obtain pooled estimates. Sub-group analysis and meta-regression were carried out to explore sources of between-study variation
and bias. Sensitivity analyses investigated the reliability of the results and any publication bias. Number of common naevi was con-
firmed an important risk factor with a substantially increased risk associated with the presence of 101–120 naevi compared with <15
(pooled Relative Risk (RR) = 6.89; 95% Confidential Interval (CI): 4.63, 10.25) as was the number of atypical naevi (RR = 6.36
95%; CI: 3.80, 10.33; for 5 versus 0). The type of study and source of cases and controls were two study characteristics that signif-
icantly influenced the estimates. Case-control studies, in particular when the hospital was the source for cases or controls, appeared
to present much lower and more precise estimates than cohort studies.
� 2004 Elsevier Ltd. All rights reserved.
Keywords: Melanoma; Naevus; Meta-analysis; Epidemiology; Review literature
1. Introduction
The incidence of cutaneous malignant melanoma(melanoma) has been increasing worldwide in Caucasian
populations for several decades; between the early 1960s
and the late 1980s annual increments of 3–7% were ob-
served in 24 populations of mainly European origin [1],
making melanoma the most rapidly increasing cancer in
0959-8049/$ - see front matter � 2004 Elsevier Ltd. All rights reserved.
doi:10.1016/j.ejca.2004.10.015
* Corresponding author. Tel.: +39 02 57489819; fax: +39 02
57489922.
E-mail address: [email protected] (S. Gandini).
white populations, except for lung cancer in women [2].
However, there are recent trends showing a deceleration
or levelling-off of the rate of increase in melanoma riskin cohorts born after 1950 in some of these populations
[3–7]. As a result of the increasing incidence, melanoma
is now one of the more common cancers in white popu-
lations. It ranks fourth, in men and third in women in
high incidence areas such as Australia and New Zealand
(non-Maoris) and about sixth in medium incidence areas
like the white populations of the United States (US),
Scandinavia and parts of Canada [8]. In the US, mela-noma is the most common cancer in the ‘‘25–29 year’’
age group in females, and the second most common can-
S. Gandini et al. / European Journal of Cancer 41 (2005) 28–44 29
cer (after breast cancer) in the ‘‘30–34 year’’ age group
[9].
A systematic meta-analysis of all published aetiolog-
ical studies from 1966 to 2002 was carried out to assess
all the major risk factors for cutaneous malignant mela-
noma: exposure to ultraviolet sun radiations, sunburns,indicators of actinic damage, family history of mela-
noma, phenotype characteristics, pigmented lesions
and skin type. This systematic review of the literature
to conduct a comprehensive meta-analysis for all main
risk factors on melanoma allowed an in-depth explora-
tion of the associations and interactions among the risk
factors and provided some clues with regard to the Epi-
demiology of melanoma by looking extensively at theinconsistencies and variability in the estimates. Meta-
analyses permit questions to be asked such as whether
the association of melanoma with some risk factors
may depend on the composition of the population under
study, the level of exposure in the study population, the
definition of disease employed in the studies, or the
methodological quality of the studies.
In this manuscript, we present the results of a meta-analysis on cutaneous melanoma risk and common mel-
anocytic and atypical naevi. Among Caucasians, a fairly
large body of evidence suggested that the number of
melanocytic naevi represents a very good predictor for
cutaneous malignant melanoma and that atypical naevi
may play an independent role [10–16]. Risk of mela-
noma rises with increasing number and clinical atypia
of naevi, from a small risk in those with few commonnaevi, to a higher risk in those with larger numbers of
common naevi, to a very high risk in those with multi-
ple, clinically atypical naevi [17].
2. Patients and methods
2.1. Definition of the outcome and exposures
The outcome of this systematic meta-analysis was his-
tologically confirmed melanoma, which is commonly di-
vided into four histological types. These are superficial
spreading melanoma, nodular melanoma, lentigo mal-
igna melanoma and acral lentiginous melanoma. Most
melanomas (around 90%) are cutaneous lesions (superfi-
cial spreading and nodular melanomas). Mucosal mela-noma and melanomas located on the palms, digits, soles,
and nail beds (where acral lentiginous melanoma is
found) are unique because they cannot be directly attrib-
utable to sun exposure and a different aetiology is in-
volved [18]. Lentigo maligna melanoma, i.e., the
invasive form of lentigo maligna, is related to substan-
tial and repeated exposures over many years.
A melanocytic naevus is a benign tumour of melano-cytes and naevus cells, which produce melanin, the
brown-black skin pigment.
In 1990, the International Agency for Research on
Cancer (IARC) proposed a detailed protocol to stan-
dardise methodologies in naevus epidemiological stud-
ies. It defined countable melanocytic lesions as
‘‘brown to black pigmented macules or papules which
are reasonably well defined and are darker in colourthan the surrounding skin. Countable lesions do not
have the features of freckles, solar lentigines, sebor-
rhoeic keratoses, cafe-au-lait spots, or non-melanocytic
lesions’’.
Atypical naevi, present in 2–5% of Caucasian adults,
are usually larger than common naevi with a more varie-
gated appearance. The IARC protocol for identifying
and recording naevi in epidemiological studies uses thefollowing criteria to identify atypical naevi: there must
be a macular component in at least one area; in addition,
at least three of the following features must be present:
(a) border not well defined, (b) size 5 mm or more, (c)
colour variegated, (d) contour uneven, (e) presence of
erythema.
The term ‘‘atypical naevus’’ is frequently used clini-
cally raising the suspicion of naevi likely to be hidingunderlying dysplasia within benign congenital or ac-
quired naevi, whereas there is a poor concordance be-
tween the diagnosis of atypical naevi using the clinical
phenotype and the histological criteria.
Subjects were classified as having a positive family
history of melanoma if they reported one, or more, af-
fected first-degree relative. Families with multiple cases
of melanoma often exhibit the dysplastic naevus syn-drome, a syndrome characterised by multiple atypical
moles that continue to appear in adulthood. It was re-
ported worldwide that persons with the atypical mole
(dysplastic naevus) syndrome are at much higher in-
creased risk. Greene [19] estimates that a person who
has dysplastic naevi and at least two family members
with melanoma has a 500-fold increase in their mela-
noma risk. However, so few people have this syndromethat in unselected series they account for less than 5% of
the total melanoma incidence. Furthermore, one must
take into account the fact that, in many of these families,
dysplastic naevi as well as environmental factors are in-
volved. In this work, we did not consider studies that
analysed cases with atypical mole syndrome because
these subjects are already monitored with particular
care.
2.2. Data sources, search strategy and selection of articles
Bibliographic searches were conducted using two dat-
abases until September 30, 2002:
1. MEDLINE (National Library of Medicine,
Bethesda, MD, USA ) using PUBMED(www.nlm.nih.gov/entrez/query.fcgi) as the query
interface, from January 1966.
30 S. Gandini et al. / European Journal of Cancer 41 (2005) 28–44
2. EMBASE (Elsevier Science, Amsterdam, Holland)
using OVID (www.ovid.com/) as the query interface,
from January 1988.
No language restrictions were applied. The MED-
LINE search was conducted using the following keywords: nevi*, naevi*, nevo*, naevo*, nevu*, naevu*, mole,
moles, pigmented lesion*, skin lesion*, cutaneous lesion*,
melanocytic lesion*, in combination with melanoma and
case control*, case-control*, cohort*, cross-section*,
cross-section*, follow up stud*, follow-up stud*. Succes-
sively, we used the following mesh term: naevus, moles
associated with melanoma and case-control studies, co-
hort studies, cross-sectional studies, and prospective stud-
ies. Similar strategies were used to search EMBASE.
The search was limited to human studies only.
Other sources were found in the reference lists of the
retrieved articles and preceding reviews on the topic [20–
23]. All the retrieved references were entered into the
bibliography management software Reference Manager
9 [24] to facilitate the search for duplicate references.
Primary inclusion criteria were developed for theselection of all relevant articles, which were: case-con-
trol, cohort or cross-sectional studies published as an
original article. Ecological studies, case reports, reviews
and editorials were not considered eligible. On the basis
of primary inclusion criteria, the initial relevance of all
retrieved articles was evaluated by one of us on the basis
of the title and abstract.
At the second step, some further inclusion criteriawere identified, to obtain a group of studies, each with
at least minimal information and comparable results:
1. The studies had to provide sufficient information to
estimate the Relative Risk (RR) and 95% Confidence
Intervals (CI) (i.e. they had to publish the Odds
Ratios (ORs) or RRs or crude data and correspond-
ing standard errors, variance, CIs or P-value of thesignificance of the estimates) for the number of com-
mon and/or atypical naevi.
2. The studies had to be independent in order to avoid
giving double weight to some studies.
3. For the naevi counts, the results reported had to be
comparable. For this reason, the study [48], which
analysed the presence of only large naevi in twins
was excluded. Congenital naevi were not consideredin this meta-analysis because the presence of large
congenital naevi is associated with a very high risk
of melanoma and such patients already need to be
monitored with particular care, whereas there are
many anamnestic difficulties in finding small congen-
ital naevi [23]. Tucker et al. [14], Rodenas et al. [25]
and Grob et al. [16] reported ORs separated for com-
mon naevi with diameters smaller and greater than 5mm separately; the first estimate was included in the
meta-analysis. Bain et al. [26] showed two estimates
of risk for palpable and total self-reported naevus
count; the first one was considered for the meta-anal-
ysis, but the choice was considered unimportant
because, as stated in the paper, both may be biased.
4. It was necessary that the populations studied to be
homogeneous, at least for the main risk factors formelanoma. Studies could include only cutaneous mel-
anoma and papers [27,28] which considered only
cases of palms, plantar foot and vulva were excluded
because a distinct aetiology for non-sun-exposed sites
was suggested [29]. Studies [30,31] conducted exclu-
sively on melanoma in young subjects (aged less than
19 years) were excluded because they are few in num-
ber, as melanoma in childhood is very rare. Child-hood melanoma very often arises from a giant
naevus that exhibits different pathological character-
istics and children with Xeroderma Pigmentosa [19]
are subject to completely different risk factors, that
are mainly genetic [30]. Furthermore, the mean age
of the study population, for the other papers included
in the meta-analysis, was around 50 years.
Instead of using strict inclusion criteria or quality
scores to deal with differences among the studies, we
decided to consider wide inclusion criteria in order to
start from the premise of using as much data as possible.
This allowed us more data in order to investigate more
closely any possible sources of variations and inconsis-
tencies, heterogeneity analysis being the primary issue
to take into consideration for this meta-analysis. Bycontrast, the inclusion and exclusion of single studies
was evaluated in the sensitivity analysis to investigate
their influence on the pooled results and to exclude
any potential biases.
2.3. Extraction and unification of the data
A questionnaire was developed to collect some infor-mation about each study:
� General information: year of publication, study
design, study location, latitude of the region and
mean age of the study population.
� Exposure information: definition of common naevi
used, definition of atypical naevi used, body region
where the naevi were counted, number and professionof observers and categorisations adopted.
� Case information: inclusion or exclusion of specific
histological types of melanoma, inclusion of cases
with family history of melanoma, number and source
of cases, participation rates of cases and percentages
of fair-skinned people in the cases and controls.
� Case-control study information: number and source
of controls, matching design, blinding of interviewersand response rates of controls.
S. Gandini et al. / European Journal of Cancer 41 (2005) 28–44 31
� Follow-up information: source study population,
years of follow-up, blinding on exposure status and
completeness of follow-up.
� Statistical information: statistical methods used,
adjusting for confounding variables (demographic
factors such as age and gender, baseline host charac-teristics such as hair, eye and skin colour and inherent
tendency to burn or tan easily, atypical moles, com-
mon moles, sun exposure) and type of effect estimates
(OR, RR, and standardised incidence ratio) with cor-
responding measures of precision, according to the
specific exposure category.
All of this information was used to investigate heter-ogeneity and in the sensitivity analysis.
The distinction among the various measures of RR
(e.g. OR, rate ratio and risk ratio) was ignored on the
assumption that melanoma is a rare disease. Conse-
quently, every measure of association, adjusted for the
maximum number of confounding variables concerning
each level of naevi count, and the corresponding CI were
translated into log RR (log(RR)) and correspondingvariance with the formula proposed by Greenland in
[32]. When estimates were not available from the paper,
they were calculated from the published crude data. To
obtain the standard error of the log odd ratio (SE(lo-
g(OR))) from the crude data, Woolf�s formula was
implemented. For Standardised Incidence Rates (SIR),
the number of cases could be used to estimate the stan-
dard error of the log(SIR). If only the P-value was pub-lished then a ‘‘test-based’’ estimate was considered [32].
Results from the population controls were chosen for
the analysis where data from case-control studies were
presented separately for hospital and population con-
trols. Patients, who were hospitalised even for other dis-
eases, may be unrepresentative of the exposure
distribution in the source population [36].
2.4. Data analysis strategy
The data obtained were used for the statistical analy-
sis performed in a two-step procedure.
In the first-step, a linear model was fitted, within each
study, to estimate the RR, per one naevus of increase.
The model was fitted according to the method proposed
by Greenland and Longnecker in [37], which providesthe natural logarithm of RR, and an estimator of its
standard error (SE(log(RR))), requiring the estimates
and the number of subjects at each category of naevi
counts. This dose–response model takes into account
the fact that the estimates for separate naevi categories
depend on the same reference group. When the number
of subjects at each category of naevi count was not
available from the papers, coefficients were calculatedignoring the correlation between the estimates of risk
in the separate exposure levels.
Since the count of naevi was given by a range, we had
to assign to each class the number of naevi correspond-
ing to the midpoint of the range, in order to obtain a nu-
meric value representing each category. Highest
categories of naevi count are often open, therefore, a va-
lue for the maximum number of naevi had to be speci-fied. When no information about the distribution of
common naevi was available, a fix value of 125 was
set as the maximum number. The effect of this assign-
ment on this estimate was evaluated in the sensitivity
analysis. For the upper categories of atypical naevi,
the same amplitude as the preceding category was as-
signed, because the risk estimate is more sensitive to
changes of small numbers of atypical naevi. A dichoto-mous categorisation was also evaluated. Marrett et al.
[38] used a self-administered whole-body diagram to as-
sess naevus density with qualitative indications and the
four categories ‘‘none’’, ‘‘few’’, ‘‘moderate’’ and ‘‘many’’
were transposed into the following numerical categories:
‘‘0’’, ‘‘1–24’’, ‘‘25–49’’ and ‘‘50+’’, respectively.
In the second-step, the summarised RR was esti-
mated pooling the study-specific estimates by the classi-cal fixed effects and random effects models [32,39]. The
homogeneity of the effect across studies is assessed using
the large sample test based on the Q (Chi-squared) sta-
tistic [32,39]. A further analysis was carried out estimat-
ing pooled RR for common and atypical naevi together,
through the bivariate approach proposed by van Hou-
welingen et al. [40]. Covariance between common and
atypical naevi risk estimates was not available, and inde-pendence was assumed in the model. An estimate of the
covariance was obtained from the model. Log (RR) was
fitted with Proc MIXED in SAS [41].
Possible sources of heterogeneity were investi-
gated; sub-group analyses and analysis of variance
models were carried out to investigate between-study
heterogeneity. Main effects and interactions between
the factors were explored by an analysis of variancemodel. Proc GLM in SAS was used to fit the ran-
dom effect models on the log(RR) [41]. Sensitivity
analysis was carried out to evaluate whether the re-
sults could have been influenced by violations of the
inclusion criteria, variations in assignments for mid-
points and upper limits, or changes on sub-group
heterogeneity analysis. The influence of single papers
was also assessed.Finally, the hypothesis that publication bias might
affect the validity of the estimates was tested by fun-
nel-plot-based approaches using the adjusted rank cor-
relation method (Begg�s method) [42] and linear
regression analysis on radial plot (Egger�s method)
[43]. ‘‘Trim and fill’’ [44] and Copas and Shi [45]
methods were also applied. Estimates of the likely
number of missing studies and of the adjusted RRs,calculated by inputting suspected missing studies, were
provided.

32 S. Gandini et al. / European Journal of Cancer 41 (2005) 28–44
3. Results
3.1. Literature search and selection
After elimination of duplicates, we obtained five
hundred and ninety studies from the MEDLINE andEMBASE searches. Using primary inclusion criteria,
fifty-seven articles were identified to be potentially in-
cluded in the meta-analysis; thirteen additional articles
were identified by means of the reference bibliographics,
thereby totalling seventy articles. Of those, forty-six
were identified as fulfilling the secondary inclusion crite-
ria. The total number of datasets analysed was higher
(forty-seven) because MacKie et al. [46] reported ad-justed OR separately for males and females and these
were considered as two independent estimates.
3.2. Study characteristics
An overview of the forty-seven datasets included in
the selected group is given in Table 1. These forty-seven
datasets included a total of 10 499 cases and 14 256 con-trols. Among the thirty-eight datasets dealing with com-
mon naevi, twenty-six presented the risk estimates for
the whole body naevus count and seventeen for naevi
counts on the arms. Twenty-seven datasets published
the risk estimates for atypical naevi. Twenty-four studies
were carried out in European countries, fourteen in
North America, seven in Australia and one in Argen-
tina. There were eight cohort studies, all dealing withatypical naevi, thirty-seven case-control studies and
two nested case-control studies.
Eleven case-control studies were hospital-based (both
cases and controls were from hospitals), whereas eight
were population-based (both cases and controls were
from the population). Six studies comprised hospital
cases with controls drawn from the population, five
comprised cases drawn from the population and con-trols from hospitals, two used controls drawn from vis-
itors to hospitals and one used controls drawn from the
neighbourhood. Three case-control studies used both,
i.e., population and hospital-based controls. For one
study, information on source of cases and controls was
not available.
Of the thirty-eight datasets dealing with common
naevi, nine presented estimates of risk based on a self-assessment of the naevi count, while for all the twenty-
seven datasets on atypical naevi, the assessment of the
naevi count was performed by physicians.
Of the total number of papers on common naevi
only, five presented estimates adjusted for chronic sun
exposure, eighteen adjusted for intermittent sun expo-
sure, twenty-seven adjusted for phenotypic or photo-
typical factors and one [33] published data with only acrude estimate. Of the total number of the papers on
atypical naevi only, five presented estimates adjusted
for chronic sun exposure, eight adjusted for intermittent
sun exposure, twenty-two adjusted for phenotypic or
photo-typical factors and three [33,23,35] published data
with only a crude estimate.
3.3. Relative risk estimates
Calculated dose–response RRs estimates and their
corresponding 95% CIs for the melanoma risk, associ-
ated with common naevi on the whole body and arms,
are presented in Figs. 1 and 2, respectively. RRs for
atypical naevi and melanoma are presented in Fig. 3.
We found that v2 estimates, which evaluate between-
study heterogeneity, were all significant (v2 = 181.97, de-grees of freedom (df) = 25, P < 0.001, for common naevi
on the whole body; v2 = 111.74, df = 16, P < 0.001, for
common naevi on arms; v2 = 390.148, df = 27, P <
0.001, for atypical naevi). This is an indication that the
homogeneity assumption is probably not correct and
random effects models were performed for common
naevi on the whole body, common naevi on the arms
and for atypical naevi, to take into account the variationamong the studies.
Pooled RRs and CIs, calculated from dose–response
models, for common naevi (whole body and arms) are
presented for the different classes in Table 2. In Table
3, pooled RRs are described for the thirteen studies that
presented a dichotomous categorisation (absence/pres-
ence) of atypical naevi and for the fifteen studies that
published results for a continuous type of categorisa-tion. Statistically significant associations were found be-
tween naevi (common and atypical) count and
melanoma. Summary estimates for common naevi,
counted on whole body, indicate a significant risk for
melanoma even for a medium-low number of naevi,
indicated by the category ‘‘16–40’’ naevi compared with
‘‘0–15’’ naevi (pooled RR = 1.47; 95% CI: 1.36, 1.59).
People with very high naevi density (‘‘101–120’’ naevi)present a highly significant risk, almost seven times
greater (pooled RR = 6.89; 95% CI: 4.63, 10.25) than
people with very few naevi (‘‘0–15’’ naevi).
The count on an anatomical region (arms) confirms
the association between common naevi and melanoma.
Risk for people with (‘‘11–15’’) common naevi on their
arms is almost five times greater than risk for people
with no naevi on arms (pooled RR = 4.82; 95% CI:3.05, 7.62).
Atypical naevi count is confirmed to be a highly sig-
nificant risk factor for melanoma. Presence of any atyp-
ical naevus increased the risk 10-fold compared with the
absence of atypical naevi (RR = 10.12; 95% CI: 5.04,
20.32). Even summary RRs for having only one atypical
naevus are already considerable (RR = 1.60; 95% CI:
1.38, 1.85), rising up to 10.49 (95% CI: 5.05, 21.76) for5 atypical naevi (Table 3).

Table 1
Characteristics of the studies on melanocytic naevi and melanoma
First author Year of
publication
Country Study
design
No. of
cases
No. of
controls
Cases
source
Controls
source
Common naevi Atypical
naeviBody Arms
Rhodes [47] 1980 USA CC 138 217 N.A. N.A. – – Yes
Beral [66] 1983 Australia CC 287 574 Hosp Pop Yes – –
Holman [18] 1984 Australia CC 511 511 Pop Pop – Yes –
Green [10] 1985 Australia CC 183 183 Pop Pop – Yesa -
Sorahan [67] 1985 England CC 58 182 Hosp Hosp – Yesa –
Elwood [68] 1986 England CC 83 83 Pop Hosp Yes Yes –
Swerdlow[11] 1986 Scotland CC 180 197 Hosp Hosp Yes Yes –
Cristofolini [69] 1987 Italy CC 103 205 Hosp Hosp Yes – Yes
Holly [12] 1987 USA CC 121 139 Hosp Hosp Yes – Yes
Bain [26] 1988 USA N CC 98 190 Pop Pop – Yes –
Osterlind [70] 1988 Denmark CC 474 926 Pop Pop – Yes –
Roush [71] 1988 Australia CC 246 134 Hosp Pop + hosp Yes – Yes
Garbe [72] 1989 Germany CC 200 200 Hosp Hosp Yes – Yes
MacKie [46]
Women
1989 Scotland CC 181 181 Pop Hosp Yes – Yes
MacKie [46]
Men
1989 Scotland CC 99 99 Pop Hosp Yes – Yes
Rigel [73] 1989 USA Co 1 281 – – – – Yes
Dubin [74] 1990 USA CC 289 527 Hosp Hosp Yes – –
Elwood [75] 1990 England CC 195 195 Pop Hosp – Yes –
Grob [16] 1990 France CC 207 295 Hosp Pop Yes Yesa Yes
Augustsson [76] 1991 Sweden CC 121 378 Pop Pop Yes – Yes
Halpern [77] 1991 USA CC 105 181 Hosp Pop Yes – Yes
Tiersten [53] 1991 USA Co 4 157 – – – – Yes
Weiss [78] 1991 Germany CC 1079 778 Hosp Hosp Yes – Yes
Marrett [38] 1992 Canada CC 583 608 Pop Pop Yes – –
Zaridze [79] 1992 Russia CC 96 96 Hosp Visit to hosp – Yes –
Halpern [80] 1993 USA Co 2 89 – – – – Yes
MacKie [55] 1993 Scotland Co 5 116 – – – – Yes
Autier [81] 1994 Bel, Fr, Ger. CC 420 447 Hosp Neigh. – Yes –
Garbe [82] 1994 Ger, Au, Swi. CC 513 498 Hosp Hosp Yes – Yes
Kang [83] 1994 USA Co 2 155 – – – – Yes
Marghoob [54] 1994 USA Co – 124 – – – – Yes
White [84] 1994 USA CC 256 273 Pop Pop – Yes –
Westerdahl [85] 1995 Sweden CC 400 640 Pop Pop – Yesa –
Bataille [86] 1996 England CC 426 416 Pop Hosp Yes – Yes
Chen [87] 1996 USA CC 548 494 Pop Pop – Yes –
Grulich [13] 1996 Australia CC 242 276 Hosp Pop + hosp Yes Yes Yes
Rodenas [25] 1996 Spain CC 105 138 Hosp Visit to hosp Yes – Yes
Dabkowski [33] 1997 Poland CC 74 300 Hosp Pop Yes – Yes
Kelly [88] 1997 Australia Co 20 278 – – – – Yes
Moore [34] 1997 USA N CC 69 69 Pop Pop Yes – Yes
Tucker [14] 1997 USA CC 716 1014 Hosp Hosp Yes – Yes
Carli [63] 1999 Italy CC 131 176 Hosp Pop Yes – Yes
Snels [89] 1999 Holland Co 3 166* – – – – Yes
Mastrangelo [90] 2000 Italy CC 99 104 Hosp Pop – Yes –
Naldi [91] 2000 Italy CC 542 538 Hosp Hosp Yes – –
Landi [92] 2001 Italy CC 183 179 Hosp Pop + hosp Yesb – Yes
Loria [93] 2001 Argentina CC 101 249 Hosp Hosp Yes Yes –
N.A., not available; Pop, population; Hosp, Hospital; Neigh., neighbourhood; CC, case-control study; Co, cohort study; N CC, nested case-control;
Bel, Fr, Ger: Belgium, France and Germany; Ger, Au, Swi.: Germany, Austria and Switzerland; Visit to hosp: visitors to hospitals; USA, United
States of America.a Only one arm.b Only back* Cohort size.
S. Gandini et al. / European Journal of Cancer 41 (2005) 28–44 33
To make a more reliable comparison between the two
types of naevi, a further analysis was conducted on the
nineteen studies that published both estimates only, on
both commonandatypical naevi. This bivariate approach
gave us an indication of a substantial correlation
(r = 0.36), suggesting that risk for common naevi and
the risk for atypical naevi are correlated. We obtained
similar results to the ones obtained in the univariate
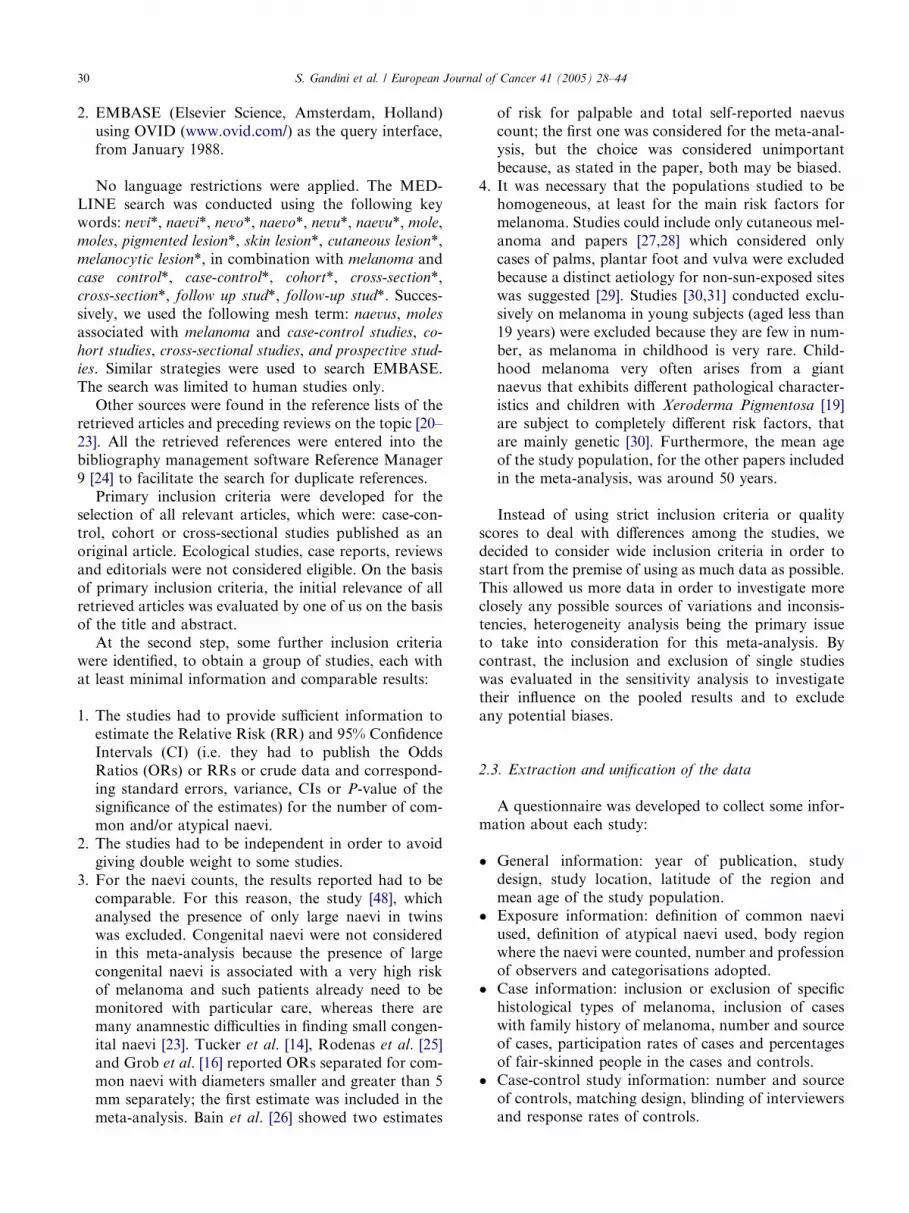
Fig. 1. Dose–response Relative Risks (RRs) and 95% Confidence Intervals (CIs(95% CIs were calculated using SE(log RR) (standard error of the log
add ratio), estimated from the published CI with the formula proposed by Greenland in [37].)) of Melanoma associated with Common naevi (whole
body). m, male; f, female.
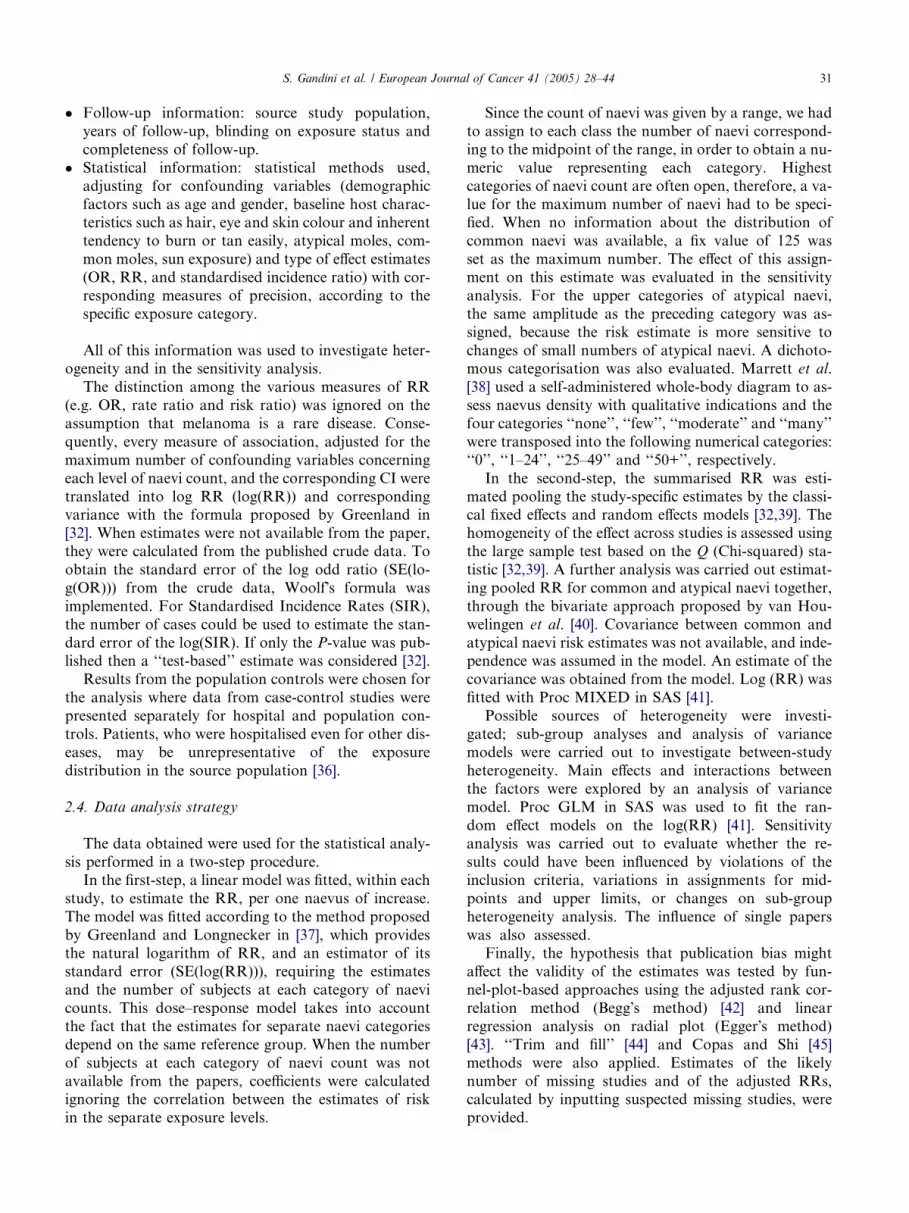
Fig. 2. Dose–response Relative Risks (RRs) and 95% Confidence Intervals (CIs (95% CIs were calculated using SE(log RR), estimated from the
published CI with the formula proposed by Greenland in [37].)) of Melanoma associated with Common naevi (Arms).
34 S. Gandini et al. / European Journal of Cancer 41 (2005) 28–44
analysis: the pooled estimate for the increase of one atyp-
ical naevus (RR = 1.51 and 95% CI: 1.37, 1.67) is much
higher (P < 0.001) than that for the increase of one
common naevus (RR = 1.02 and 95% CI: 1.01, 1.02).
3.4. Heterogeneity
Studies included in this work vary in a number
of aspects of their design and analysis. As previ-
ously stated, several factors, which may have in-
duced differences in outcomes, were investigated
with sub-group analyses and analysis of variance
models.
Heterogeneity may be investigated in several ways.
When we looked at the v2 tests that evaluated any differ-ences among groups (this compared pooled estimates of
each subgroup with the overall pooled estimate) [32], we
noticed that nearly all of the factors considered contrib-

Fig. 3. Dose–response Relative Risks (RRs) and 95% Confidence Intervals (CIs (95% CIs were calculated using SE(log RR), estimated from the
published CI with the formula proposed by Greenland in [37].)) of Melanoma associated with Atypical naevi.
Table 2
Pooled estimates for risk of melanoma for an increasing number of
common naevi
No. naevi RR Lower 95% CI Upper 95% CI
Whole body
0–15 1.00
16–40 1.47 1.36 1.59
41–60 2.24 1.90 2.64
61–80 3.26 2.55 4.15
81–100 4.74 3.44 6.53
101–120 6.89 4.63 10.25
Arms
0 1.00
1–5 1.44 1.29 1.60
5–10 2.48 1.90 3.23
11–15 4.82 3.05 7.62
For whole body, No. of studies = 26, Heterogeneity v2 = 181.970,
P < 0.001.For arms, No. of studies = 17, Heterogeneity v2 = 111.738,
P < 0.001.
No., number; 95% CI, 95% Confidence Interval; RR, Relative Risk.
Table 3
Pooled estimates of melanoma risk for increasing number of atypical naevi
Naevi N. RR Lower 95% CI
Dichotomous 13
Absent 1.00
Present 10.12 5.04
Continuous 15
0 1.00
1 1.60 1.38
2 2.56 1.91
3 4.10 2.64
4 6.55 3.65
5 10.49 5.05
N., number of studies.
S. Gandini et al. / European Journal of Cancer 41 (2005) 28–44 35
uted significantly to the between-subgroup heterogeneity(data not shown). Among studies considering common
naevi in all body, only ‘‘dichotomisation of exposure’’
and ‘‘adjustment for chronic sun’’ did not explain any
between-study variability (v2 = 0.451 with P = 0.502
and v2 = 0.011 with P = 0.918, respectively). In publica-
tions analysing atypical naevi, ‘‘adjustment for intermit-
tent sun exposure’’ and ‘‘adjustment for chronic sun
exposure’’ did not seem to play a significant role(v2 = 1.721 with P = 0.19 and v2 = 0.133 with
P = 0.715, respectively).
We investigated between-study heterogeneity by
meta-regression on common naevi over the entire body,
on the arms, and on atypical naevi. In order to make
comparisons among factors considered for the heteroge-
neity analysis, we had to consider the ‘‘per naevus’’ anal-
ysis to obtain comparable estimates. RR estimates, forone common and atypical naevus, by sub-group factors,
are shown in Tables 4 and 5, respectively. One study [47]
in all body
Upper 95% CI Heterogeneous v2 P-value for v2
85.34 <0.001
20.32
221.87 <0.001
1.85
3.43
6.35
11.75
21.76
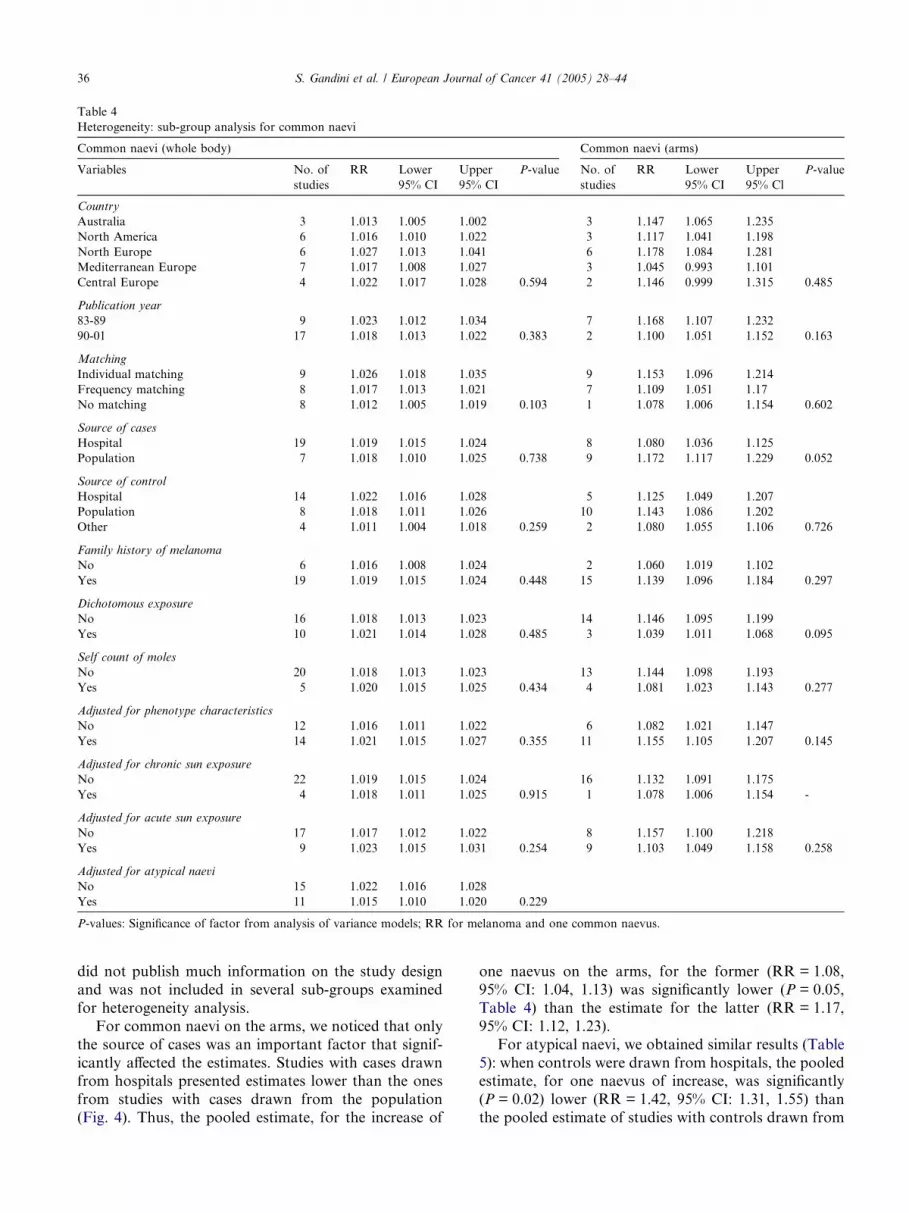
Table 4
Heterogeneity: sub-group analysis for common naevi
Common naevi (whole body) Common naevi (arms)
Variables No. of
studies
RR Lower
95% CI
Upper
95% CI
P-value No. of
studies
RR Lower
95% CI
Upper
95% Cl
P-value
Country
Australia 3 1.013 1.005 1.002 3 1.147 1.065 1.235
North America 6 1.016 1.010 1.022 3 1.117 1.041 1.198
North Europe 6 1.027 1.013 1.041 6 1.178 1.084 1.281
Mediterranean Europe 7 1.017 1.008 1.027 3 1.045 0.993 1.101
Central Europe 4 1.022 1.017 1.028 0.594 2 1.146 0.999 1.315 0.485
Publication year
83-89 9 1.023 1.012 1.034 7 1.168 1.107 1.232
90-01 17 1.018 1.013 1.022 0.383 2 1.100 1.051 1.152 0.163
Matching
Individual matching 9 1.026 1.018 1.035 9 1.153 1.096 1.214
Frequency matching 8 1.017 1.013 1.021 7 1.109 1.051 1.17
No matching 8 1.012 1.005 1.019 0.103 1 1.078 1.006 1.154 0.602
Source of cases
Hospital 19 1.019 1.015 1.024 8 1.080 1.036 1.125
Population 7 1.018 1.010 1.025 0.738 9 1.172 1.117 1.229 0.052
Source of control
Hospital 14 1.022 1.016 1.028 5 1.125 1.049 1.207
Population 8 1.018 1.011 1.026 10 1.143 1.086 1.202
Other 4 1.011 1.004 1.018 0.259 2 1.080 1.055 1.106 0.726
Family history of melanoma
No 6 1.016 1.008 1.024 2 1.060 1.019 1.102
Yes 19 1.019 1.015 1.024 0.448 15 1.139 1.096 1.184 0.297
Dichotomous exposure
No 16 1.018 1.013 1.023 14 1.146 1.095 1.199
Yes 10 1.021 1.014 1.028 0.485 3 1.039 1.011 1.068 0.095
Self count of moles
No 20 1.018 1.013 1.023 13 1.144 1.098 1.193
Yes 5 1.020 1.015 1.025 0.434 4 1.081 1.023 1.143 0.277
Adjusted for phenotype characteristics
No 12 1.016 1.011 1.022 6 1.082 1.021 1.147
Yes 14 1.021 1.015 1.027 0.355 11 1.155 1.105 1.207 0.145
Adjusted for chronic sun exposure
No 22 1.019 1.015 1.024 16 1.132 1.091 1.175
Yes 4 1.018 1.011 1.025 0.915 1 1.078 1.006 1.154 -
Adjusted for acute sun exposure
No 17 1.017 1.012 1.022 8 1.157 1.100 1.218
Yes 9 1.023 1.015 1.031 0.254 9 1.103 1.049 1.158 0.258
Adjusted for atypical naevi
No 15 1.022 1.016 1.028
Yes 11 1.015 1.010 1.020 0.229
P-values: Significance of factor from analysis of variance models; RR for melanoma and one common naevus.
36 S. Gandini et al. / European Journal of Cancer 41 (2005) 28–44
did not publish much information on the study design
and was not included in several sub-groups examined
for heterogeneity analysis.
For common naevi on the arms, we noticed that only
the source of cases was an important factor that signif-
icantly affected the estimates. Studies with cases drawnfrom hospitals presented estimates lower than the ones
from studies with cases drawn from the population
(Fig. 4). Thus, the pooled estimate, for the increase of
one naevus on the arms, for the former (RR = 1.08,
95% CI: 1.04, 1.13) was significantly lower (P = 0.05,
Table 4) than the estimate for the latter (RR = 1.17,
95% CI: 1.12, 1.23).
For atypical naevi, we obtained similar results (Table
5): when controls were drawn from hospitals, the pooledestimate, for one naevus of increase, was significantly
(P = 0.02) lower (RR = 1.42, 95% CI: 1.31, 1.55) than
the pooled estimate of studies with controls drawn from
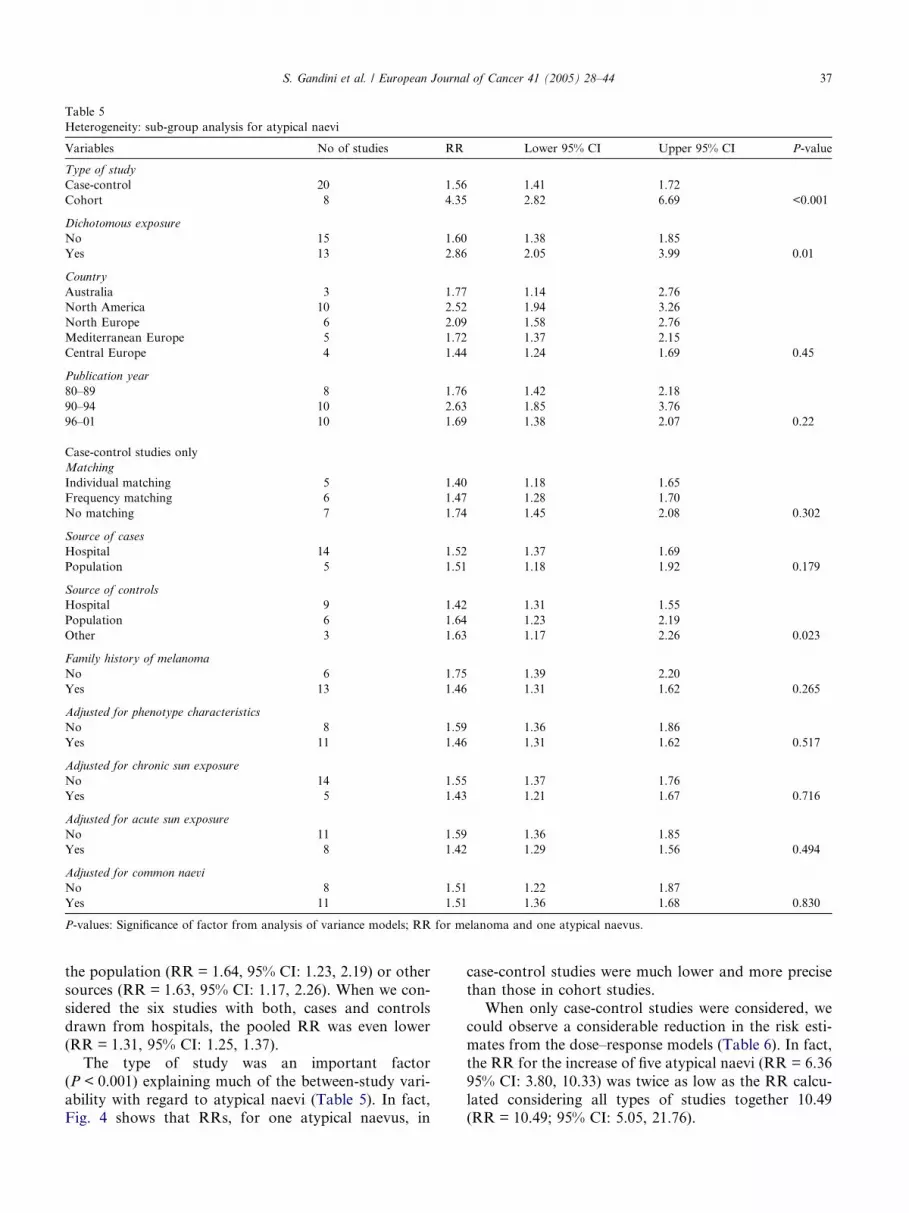
Table 5
Heterogeneity: sub-group analysis for atypical naevi
Variables No of studies RR Lower 95% CI Upper 95% CI P-value
Type of study
Case-control 20 1.56 1.41 1.72
Cohort 8 4.35 2.82 6.69 <0.001
Dichotomous exposure
No 15 1.60 1.38 1.85
Yes 13 2.86 2.05 3.99 0.01
Country
Australia 3 1.77 1.14 2.76
North America 10 2.52 1.94 3.26
North Europe 6 2.09 1.58 2.76
Mediterranean Europe 5 1.72 1.37 2.15
Central Europe 4 1.44 1.24 1.69 0.45
Publication year
80–89 8 1.76 1.42 2.18
90–94 10 2.63 1.85 3.76
96–01 10 1.69 1.38 2.07 0.22
Case-control studies only
Matching
Individual matching 5 1.40 1.18 1.65
Frequency matching 6 1.47 1.28 1.70
No matching 7 1.74 1.45 2.08 0.302
Source of cases
Hospital 14 1.52 1.37 1.69
Population 5 1.51 1.18 1.92 0.179
Source of controls
Hospital 9 1.42 1.31 1.55
Population 6 1.64 1.23 2.19
Other 3 1.63 1.17 2.26 0.023
Family history of melanoma
No 6 1.75 1.39 2.20
Yes 13 1.46 1.31 1.62 0.265
Adjusted for phenotype characteristics
No 8 1.59 1.36 1.86
Yes 11 1.46 1.31 1.62 0.517
Adjusted for chronic sun exposure
No 14 1.55 1.37 1.76
Yes 5 1.43 1.21 1.67 0.716
Adjusted for acute sun exposure
No 11 1.59 1.36 1.85
Yes 8 1.42 1.29 1.56 0.494
Adjusted for common naevi
No 8 1.51 1.22 1.87
Yes 11 1.51 1.36 1.68 0.830
P-values: Significance of factor from analysis of variance models; RR for melanoma and one atypical naevus.
S. Gandini et al. / European Journal of Cancer 41 (2005) 28–44 37
the population (RR = 1.64, 95% CI: 1.23, 2.19) or other
sources (RR = 1.63, 95% CI: 1.17, 2.26). When we con-
sidered the six studies with both, cases and controls
drawn from hospitals, the pooled RR was even lower
(RR = 1.31, 95% CI: 1.25, 1.37).
The type of study was an important factor
(P < 0.001) explaining much of the between-study vari-
ability with regard to atypical naevi (Table 5). In fact,Fig. 4 shows that RRs, for one atypical naevus, in
case-control studies were much lower and more precise
than those in cohort studies.
When only case-control studies were considered, we
could observe a considerable reduction in the risk esti-
mates from the dose–response models (Table 6). In fact,
the RR for the increase of five atypical naevi (RR = 6.36
95% CI: 3.80, 10.33) was twice as low as the RR calcu-
lated considering all types of studies together 10.49(RR = 10.49; 95% CI: 5.05, 21.76).
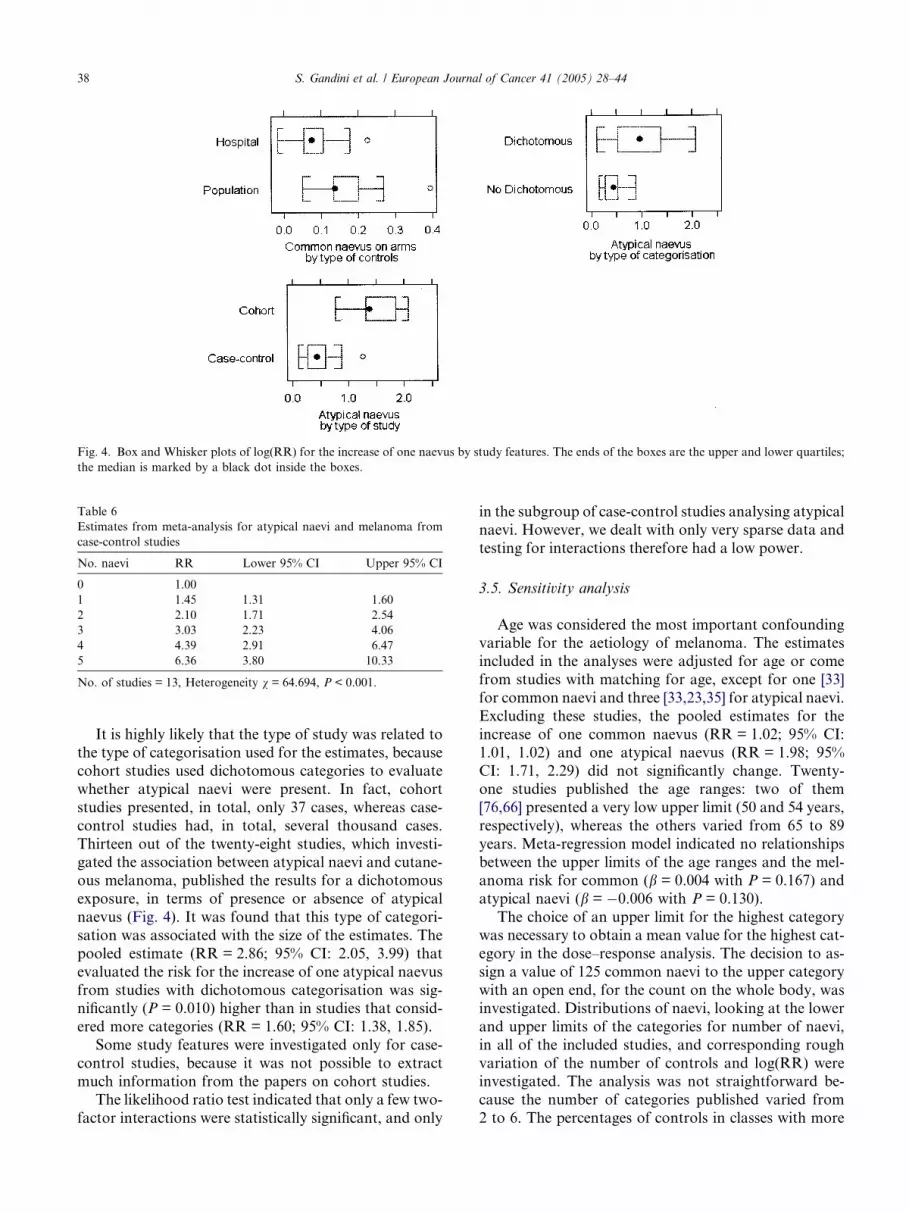
Fig. 4. Box and Whisker plots of log(RR) for the increase of one naevus by study features. The ends of the boxes are the upper and lower quartiles;
the median is marked by a black dot inside the boxes.
Table 6
Estimates from meta-analysis for atypical naevi and melanoma from
case-control studies
No. naevi RR Lower 95% CI Upper 95% CI
0 1.00
1 1.45 1.31 1.60
2 2.10 1.71 2.54
3 3.03 2.23 4.06
4 4.39 2.91 6.47
5 6.36 3.80 10.33
No. of studies = 13, Heterogeneity v = 64.694, P < 0.001.
38 S. Gandini et al. / European Journal of Cancer 41 (2005) 28–44
It is highly likely that the type of study was related to
the type of categorisation used for the estimates, because
cohort studies used dichotomous categories to evaluate
whether atypical naevi were present. In fact, cohort
studies presented, in total, only 37 cases, whereas case-
control studies had, in total, several thousand cases.
Thirteen out of the twenty-eight studies, which investi-gated the association between atypical naevi and cutane-
ous melanoma, published the results for a dichotomous
exposure, in terms of presence or absence of atypical
naevus (Fig. 4). It was found that this type of categori-
sation was associated with the size of the estimates. The
pooled estimate (RR = 2.86; 95% CI: 2.05, 3.99) that
evaluated the risk for the increase of one atypical naevus
from studies with dichotomous categorisation was sig-nificantly (P = 0.010) higher than in studies that consid-
ered more categories (RR = 1.60; 95% CI: 1.38, 1.85).
Some study features were investigated only for case-
control studies, because it was not possible to extract
much information from the papers on cohort studies.
The likelihood ratio test indicated that only a few two-
factor interactions were statistically significant, and only
in the subgroup of case-control studies analysing atypical
naevi. However, we dealt with only very sparse data and
testing for interactions therefore had a low power.
3.5. Sensitivity analysis
Age was considered the most important confoundingvariable for the aetiology of melanoma. The estimates
included in the analyses were adjusted for age or come
from studies with matching for age, except for one [33]
for common naevi and three [33,23,35] for atypical naevi.
Excluding these studies, the pooled estimates for the
increase of one common naevus (RR = 1.02; 95% CI:
1.01, 1.02) and one atypical naevus (RR = 1.98; 95%
CI: 1.71, 2.29) did not significantly change. Twenty-one studies published the age ranges: two of them
[76,66] presented a very low upper limit (50 and 54 years,
respectively), whereas the others varied from 65 to 89
years. Meta-regression model indicated no relationships
between the upper limits of the age ranges and the mel-
anoma risk for common (b = 0.004 with P = 0.167) and
atypical naevi (b = �0.006 with P = 0.130).
The choice of an upper limit for the highest categorywas necessary to obtain a mean value for the highest cat-
egory in the dose–response analysis. The decision to as-
sign a value of 125 common naevi to the upper category
with an open end, for the count on the whole body, was
investigated. Distributions of naevi, looking at the lower
and upper limits of the categories for number of naevi,
in all of the included studies, and corresponding rough
variation of the number of controls and log(RR) wereinvestigated. The analysis was not straightforward be-
cause the number of categories published varied from
2 to 6. The percentages of controls in classes with more

Table 7
List of papers excluded with reasons for exclusion
First author, Year [Ref.] Main reasons for exclusion [Ref.]
Nordlung, 1985 [94] Not independent from Roush, 1988 [71]
Dubin, 1986 [95] Not independent from Dubin 1990 [74]
Green, 1986 [96] Not independent from Green, 1985 [10]
Rigel, 1988 [97] Not independent from Rigel, 1989 [73]
Weinstock, 1989 [98] Not independent from Bain, 1988 [26]
Osterlind, 1990 [99] Not independent from Osterlind, 1988 [70]
Augustsson, 1991 [100] Not independent from Augustsson,
1991 [76]
Weiss, 1991 [78] Not independent from Weiss, 1990 [35]
Kruger, 1992 [101] Not independent from Garbe, 1989 [72]
Stierner, 1992 [62] Not independent from Augustsson,
1991 [76]
Zaridze, 1992 [102] Not independent from Zaridze, 1992 [79]
Schneider, 1994 [103] Not independent from Moore, 1997 [34]
Carli, 1995 [104] Not independent from Carli, 1999 [63]
Rieger, 1995 [105] Not independent from Garbe, 1994 [82]
Carli, 1996 [106] Not independent from Carli, 1999 [63]
Rodenas, 1997 [107] Not independent from Rodenas, 1996 [25]
Rolon, 1997 [27] Only plantar melanoma
Whiteman, 1997 [30] Melanoma in children less than 15 years
Bataille, 1998 [15] Not independent from Bataille, 1996 [86]
Green, 1999 [28] Only melanoma of soles and palms
Masback, 1999 [108] Not independent from Westerdahl,
1995 [85]
Cockburn, 2001 [48] Estimates of risk only for large naevi
in twins
Landi, 2002 [109] Not independent from Landi, 2001 [92]
Youl, 2002 [31] Melanoma in adolescents (15–19 years)
S. Gandini et al. / European Journal of Cancer 41 (2005) 28–44 39
than 100 naevi were very low (from 2% to 7%). The
studies with three categories, where the mean lowest
limit for the highest category was 53 naevi, presented a
mean percentage of controls in the upper categories of
18. The studies which consider four categories, and in
which the mean lowest limit for the highest categorywas 87 naevi, showed that the mean percentage of con-
trols in the upper category decreased to 8; in the two
studies that published six categories, where the mean
lowest limit for the-highest category was 110 naevi, the
percentages of controls in the upper categories was only
4.5. Thus, we noticed that by increasing the number of
categories, the mean percentage of controls decreased
in the upper category and its lower limit was augmented.This suggests that the distribution of naevi is not very
different among the studies with a different number of
categories. Moreover, eight studies in total, considered
100 naevi as the lowest limit for the upper category.
Therefore, an upper limit of 125 was considered as a rea-
sonable intermediate value because it includes all possi-
ble situations and it may be a reasonable choice for
studies with a lower number of categories.Pooled random effect estimates, obtained by assign-
ing alternative upper limits for the open-end categories,
were sensitive to changes in assignments (for an increase
of one naevus the estimates were: RR = 1.022, 95% CI:
1.02, 1.03, for an upper limit of 100; RR = 1.019, 95%
CI:1.015, 1.023, for an upper limit of 125; RR = 1.017,
95% CI: 1.013, 1.020, for an upper limit of 150). As
can be seen, there is a clear decreasing trend in theRR estimates with increasing numbers for the upper
category.
The impact of the inclusion criteria was analysed
(Table 7). Five studies were excluded for different reasons
that were not related to dependence from other studies:
Youl et al. [31] and Whiteman et al. [30] were excluded
because they only published estimates for melanoma in
children and adolescents, Cockburn et al. [48] was notconsidered because only the risk for large naevi (larger
than a pencil eraser) in twins was estimated, while Green
et al. [28] and Rolon et al. [27] were not included because
mainly acral melanomas were considered in their stud-
ies. The pooled random effects estimate for the increase
of one common naevus did not change when Green et al.
[28], Youl et al. [31] and Whiteman et al. [30] were in-
cluded in the analysis (RR = 1.020; 95% CI: 1.016,1.023). Only a slight difference was observed in the
RR, for an increase of one common naevus on the arms,
when Rolon et al. [27] was included in the analysis
(RR = 1.13 with 95% CI: 1.09, 1.17; and RR = 1.12 with
95% CI: 1.08; 1.16; with and without Rolon [27], respec-
tively). When we considered large naevi (larger than a
pencil eraser), defined in the Cockburn paper [48], as
atypical naevi, and we included in the analysis the esti-mate published for dyzygous twins together with esti-
mates published for large naevi (P5 mm) published by
Youl et al. [31] and Whiteman et al. [30], a slight de-
crease was observed (RR = 1.86; 95% CI: 1.65, 2.09;
whereas the overall estimate was RR = 1.96 with 95%
CI: 1. 71, 2.26 for each atypical naevus).
Following the observations of some authors [49,50],
the method of assessment of naevi is an important as-
pect of the study design when considering the inclusion
criteria. In fact, self-assessment of the number of melan-ocytic naevi is difficult to perform accurately, as this is
severely underestimated [49]. However, from heteroge-
neity analysis (Table 4), we could observe that the
pooled RR for common naevi on whole body
(RR = 1.020; 95% CI: 1.015, 1.025), from the studies
(n = 5) with self-assessment of the naevi count, was sim-
ilar (P = 0.434) to the pooled estimate obtained from
studies (n = 20) with an assessment of the naevi countby physician (RR = 1.018; 95% CI: 1.013, 1.023). For
the naevi count on arms, similar results were found.
The pooled estimate from the studies (n = 4) with self-
assessment (RR = 1.081; 95% CI: 1.023, 1.143) was not
significantly different (P = 0.277) from the pooled RR
from the studies (n = 13) with assessment by the physi-
cian (RR = 1.144; 95% CI: 1.098, 1.193).
3.6. Publication bias
Investigation of publication bias, for common naevi
counted on the whole body, gave us some indications

40 S. Gandini et al. / European Journal of Cancer 41 (2005) 28–44
that some studies without significant results were not
published. The standard errors decreased as the size of
the study increased and the plot showed a trend for
smaller studies to report more positive results than the
larger studies. The basic idea of the funnel plot ap-
proaches is that there should be no relationship betweenthe study outcome and study size; the relationship that
we observed was probably simply an artefact of the pro-
cess of selecting these studies (publication bias). Rank
correlation analysis of the funnel plot by Begg�s method
[51], suggested a highly significant effect of publication
bias (P = 0.008). Similarly, linear regression analysis
by Egger�s method [43] indicated a general trend to-
wards asymmetry of the funnel plot (P = 0.004). Sensi-tivity analysis proposed by Copas and Shy [45] showed
that, if the likely number of unpublished studies in-
creased, the estimates of the RR should decrease quite
sharply. Thus, the ‘‘Trim and fill’’ analysis [44] indicated
that the number of missing studies may be five and their
inclusion would lead to a lower pooled estimate
(RR = 1.016; 95% CI: 1.012, 1.020).
Exploration among studies on atypical naevi alsoshowed that smaller studies tended to report a greater
RR than results in general (P = 0.019). Similarly, a lin-
ear regression analysis (Egger�s method) indicated a
trend towards asymmetry of the funnel plot
(P < 0.001). Using the ‘‘Trim and fill’’ analysis, four
studies were identified in order to achieve symmetry of
the funnel plot. When the analysis was restricted to
case-control studies, no missing studies were identified.The method proposed by Copas and Shi gave an indica-
tion of a continuous estimate of less than 2, as being rea-
sonably consistent with the data. For example, with a
RR = 1.54 (95% CI: 1.29, 1.84), we got a P-value for
publication bias of 0.09.
Finally, no asymmetry on the funnel plot was ob-
served for common naevi counted on arms with Begg�smethod (P = 0.39) and linear regression analysis on thefunnel plot (Egger�s method) (P = 0.241). Sensitivity
analysis proposed by Copas and Shy indicated a possi-
ble missing study, but adding this new study did not
change the pooled RR significantly (RR = 1.12; 95%
CI: 1.07, 1.17).
4. Discussion
One of the main problems with studies on naevi is
that of ensuring valid counts. In 1990, IARC proposed
a detailed protocol to standardise the methodologies in
studies on naevi. However, even with a greater degree
of standardisation, problems arise in the inter-observer
variation: up to approximately 10% of the variation in
the full body counts may be due to this [52]. We ob-served great heterogeneity in the methods of counting
naevi: self-assessment, the interviewer counting raised
naevi on the arms and full body examinations conducted
by trained clinicians. In our analysis, self-assessment of
the number of common melanocytic naevi did not seem
to have significantly affected the estimates. The pooled
estimate from the studies with self-assessment of naevi
count was found to be very similar to the estimate ob-tained from studies with assessment of naevi count by
physicians. Moreover, as long as the error rates in
counting are similar in the different phenotype or sun
exposure groups, this will not represent a source of error
in determining the aetiology of naevi.
In the heterogeneity analysis, it was seen that studies
with hospital-based controls presented lower estimates,
especially the ones with cases drawn from hospitals. Itis likely that these studies published more reliable esti-
mates because the assessment of naevi was usually much
more precise in the hospital-based studies. Population-
based studies used weak and over-simplified measures
of the naevus count, such as self-assessment by the sub-
jects or a very limited examination, and, overall, the
data may be deficient in terms of details provided by a
skilled examination.RRs extracted from cohort studies were much higher
than ORs published in case-control studies. The popula-
tions of the two types of studies were probably different.
Several characteristics were analysed and it was noted
that mean age of cases in the case-control studies and
in the cohort studies was significantly (P < 0.001) differ-
ent: 50.9 and 34.9, respectively (fifteen case-control stud-
ies and seven cohort studies published information onthe age of subjects). Three [53–55] out of eight cohort
studies included high-risk patients and the younger age
of cases can be explained by predominantly genetic
factors.
In many epidemiological studies, the naevus density
was consistently correlated with pigmentary traits, and
with intense sun exposure and a history of sunburns
[56–59]. In the heterogeneity analysis of this work,adjustment for sunlight indicators and other phenotypic
factors did not seem to play an important role in
explaining the variability in the estimates. However,
the relationship between naevi, sun exposure and pheno-
typic factors is certainly complex. In fact, individuals
who are prone to burning (red hair, dense freckling, very
sensitive skin) may avoid sun exposure and develop
fewer naevi than might be expected [52]. Moreover, itwas suggested that the relationship between sun expo-
sure and melanocytic naevi might have a parabolic
dose–response curve [38].
In this meta-analysis, as in Ford�s overview [60],
which analysed the association of melanoma with a fam-
ily history of the disease, the familial risk appeared to be
essentially independent of the total naevus count. This
result in the case-control studies may be explained bythe low prevalence of a family history of melanoma
among controls (the percentage in controls, calculated
S. Gandini et al. / European Journal of Cancer 41 (2005) 28–44 41
on the nine studies that published this information, was
3.7%).
The results obtained from the meta-analysis con-
firmed that, the number of common naevi and atypical
naevi are very important independent risk factors for
the occurrence of melanoma. The risk for people witha very high number of naevi (‘‘101–120’’ naevi) was
found to be highly significant, almost seven times
greater (pooled RR = 6.89; 95% CI: 4.63, 10.25) than
for people with very few naevi (‘‘0–15’’ naevi). Subjects
with five atypical naevi presented a risk that was six
times higher than people with no atypical naevi (RR =
6.52; 95% CI: 3.78, 11.25). Several possible mechanisms
were suggested for this increased risk [61].Numerous moles might indicate a greater genetic ten-
dency to form melanoma. Although no major gene con-
ferring an increasing risk has been identified, except for
CDKN2A and CDK4 in melanoma-prone families, the
possibility that some of the genes associated with naevi
may play a direct role in melanoma progression cannot
be excluded.
In addition, multiple naevi might indicate that previ-ous exposure to environmental agents, such as increased
sun exposure, has occurred, thereby independently caus-
ing both a large number of moles and an increased risk
of melanoma formations. Analysis of two case-control
studies showed evidence of a role for sun exposure in
the development of naevus and atypical naevus [62].
However, we did not find any significant difference in
the naevi count risk by country, even if the incidencevaried 10-fold between study areas, and this may suggest
that number of naevi and sun exposure act multiplica-
tively on the melanoma risk.
Finally, the hypothesis that melanocytes in naevi are
particularly prone to undergo malignant transformation
is supported by pathological studies in which two-thirds
to three-quarters of patients with melanomas reported
previous lesions and 25–50% had histological confirma-tion of an associated naevus. Thus, at least some naevi,
if not all, are likely to be precursors of melanoma [63].
A recent study [64] suggested an interesting hypothe-
sis on sun exposure and naevi, based on a ‘‘divergent
pathway’’ model for melanoma occurring on different
body sites. It was found that melanomas on the head
and neck were more likely to arise in people with few
naevi, many solar keratoses, and who presented highlevels of occupational sun exposure. In contrast, mela-
nomas of the same histological type arising on the trunk
tended to occur among people with many naevi, few so-
lar keratoses, and lower levels of occupational sun expo-
sure. They suggested that after initiation by sunlight,
melanocytes of naevus-prone individuals are induced
to proliferate and become neoplastic with little (if any)
further requirement for sun exposure. In contrast, peo-ple with a low tendency to develop naevi require ongo-
ing exposure to sunlight to drive the development of
melanoma, beyond that required for initiation. Among
these people, melanomas will tend to be on sun-exposed
body sites and will be associated with chronic sun
exposure.
It is not yet clear if the sun exposure pattern plays a
pertinent role, independent of the body sites involved.However, the role of sun exposure was analysed in a sep-
arate meta-analysis of all publications on melanoma
[110], which also investigated all heterogeneity factors
that may have influenced the estimates.
The aetiology of naevi is complex. It varies by naevus
type, and is probably due to the interaction of multiple
genes and environmental factors. Understanding the
aetiology of naevi, and the changes in naevi during tu-mour progression, may be the next important advance
in gaining an understanding of the aetiology of
melanoma.
The number of common naevi and atypical naevi
were shown to be very important risk factors for the
occurrence of the melanoma. The efficacy of periodic
surveillance, combined with total cutaneous photogra-
phy, could be verified on subjects at high-risk, definedconsidering these features [23,65].
Conflict of interest statement
The authors have no conflict of interest to disclose.
Acknowledgements
It is a pleasure to acknowledge that his work was con-
ducted within the framework of support from the Italian
Association for Cancer Research (Associazone Italiana
per la Ricerca sul Cancro) and Italian Ministry for Uni-
versity and Scientific and Technological Research
(MURST) (‘‘Ministero Istruzione Universita e Ricerca’’),as part of the project ‘‘PNR per le Tecnologie in oncolo-
gia Tema 2 1998: Sviluppo di metodologie innovative
per la prevenzione (primaria e secondaria) delle neopla-
sie’’, Grant No. 66002.
References
1. Armstrong BK, Kricker A, English DR. Sun exposure and skin
cancer. Australas J Dermatol 1997, 38(Suppl. 1), S1–S6.
2. Boyle P, Maisonneuve P, Dore JF. Epidemiology of malignant
melanoma. Brit Med Bull 1995, 51, 523–547.
3. Newnham A, Moller H. Trends in the incidence of cutaneous
malignant melanomas in the south east of england 1960–1998. J
Public Health Med 2003, 24, 268–275.
4. Bulliard J-L, Cox B. Cutaneous malignant melanoma in New
Zealand: trends by anatomical site, 1969–1993. Int J Epidemiol
2000, 29, 416–423.
42 S. Gandini et al. / European Journal of Cancer 41 (2005) 28–44
5. Jemal A, Devesa SS, Hartge P, et al. Recent trends in cutaneous
melanoma incidence among whites in the United States. J Natl
Cancer Inst 2001, 93, 678–683.
6. Bulliard J-L, Cox B, Semenciw R. Trends by anatomic site in the
incidence of cutaneous malignant melanoma in Canada, 1969–
1993. Cancer Causes Control 1999, 10, 407–416.
7. Marrett LD, Nguyen HL, Armstrong BK. Trends in the
incidence of cutaneous malignant melanoma in New South
Wales, 1983–1996. Int J Cancer 2001, 92, 457–462.
8. Parkin, Whelan SL, Ferlay J, et al. Cancer incidence in V
continents, vol. VII. IARC, 1997., 143.
9. Gloster HM, Broadland DG. The epidemiology of skin cancer.
Dermatol Surg 1996, 22, 217–226.
10. Green A, MacLennan R, Siskind V. Common acquired naevi
and the risk of malignant melanoma. Int J Cancer 1985, 35,
297–300.
11. Swerdlow AJ, English J, MacKie RM, et al. Benign melanocytic
naevi as a risk factor for malignant melanoma. Br Med J (Clin
Res Ed) 1986, 292, 1555–1559.
12. Holly EA, Kelly JW, Shpall SN, et al. Number of melanocytic
nevi as a major risk factor for malignant melanoma. J Am Acad
Dermatol 1987, 17, 459–468.
13. Grulich AE, Bataille V, Swerdlow AJ, et al. Naevi and pigmen-
tary characteristics as risk factors for melanoma in a high-risk
population: a case-control study in New South Wales, Australia.
Int J Cancer 1996, 67, 485–491.
14. Tucker MA, Halpern A, Holly EA, et al. Clinically recognized
dysplastic nevi. A central risk factor for cutaneous melanoma.
JAMA 1997, 277, 1439–1444.
15. Bataille V, Grulich A, Sasieni P, et al. The association between
naevi and melanoma in populations with different levels of sun
exposure: a joint case-control study of melanoma in the UK and
Australia. Br J Cancer 1998, 77, 505–510.
16. Grob JJ, Gouvernet J, Aymar D, et al. Count of benign
melanocytic nevi as a major indicator of risk for nonfamilial
nodular and superficial spreading melanoma. Cancer 1990, 66,
387–395.
17. MacKie RM, McHenry P, Hole D. Accelerated detection with
prospective surveillance for cutaneous malignant melanoma in
high-risk groups. Lancet 1993, 341, 1618–1620.
18. Holman CD, Armstrong BK. Pigmentary traits, ethnic origin,
benign nevi, and family history as risk factors for cutaneous
malignant melanoma. J Natl Cancer Inst 1984, 72, 257–266.
19. Greene MH, Clark WHJ, Tucker MA, et al. High risk of
malignant melanoma in melanoma-prone families with dysplastic
nevi. Ann Intern Med 1985, 102, 458–465.
20. Slade J, Marghoob AA, Salopek TG, et al. Atypical mole
syndrome: risk factor for cutaneous malignant melanoma and
implications for management. J Am Acad Dermatol 1995, 32,
479–494.
21. Swerdlow AJ, Green A. Melanocytic naevi and melanoma: an
epidemiological perspective. Br J Dermatol 1987, 117, 137–146.
22. Green A. Swerdlow AJ. Epidemiology of melanocytic nevi.
Epidemiol Rev 1989, 11, 204–221.
23. Rhodes AR, Weinstock MA, Fitzpatrick TB, et al. Risk factors
for cutaneous melanoma. A practical method of recognizing
predisposed individuals. JAMA 1987, 258, 3146–3154.
24. Reference Manager. 8.51. Barkeley, USA, ISI Researchsoft,
2003.
25. Rodenas JM, Delgado-Rodriguez M, Herranz MT, et al. Sun
exposure, pigmentary traits, and risk of cutaneous malignant
melanoma: a case-control study in a Mediterranean population.
Cancer Causes Control 1996, 7, 275–283.
26. Bain C, Colditz GA, Willett WC, et al. Self-reports of mole
counts and cutaneous malignant melanoma in women: method-
ological issues and risk of disease. Am J Epidemiol 1988, 127,
703–712.
27. Rolon PA, Kramarova E, Rolon HI, et al. Plantar melanoma: a
case-control study in Paraguay. Cancer Causes Control 1997, 8,
850–856.
28. Green A, McCredie M, MacKie R, et al. A case-control study of
melanomas of the soles and palms (Australia and Scotland).
Cancer Causes Control 1999, 10, 21–25.
29. Grob JJ, Stern RS, McKie RM, et al. IARC monographs on the
evaluation of carcinogenic risks to humans-Solar and ultraviolet
radiation. IARC, Lyon, France, 1992.
30. Whiteman DC, Valery P, McWhirter W, et al. Risk factors for
childhood melanoma in Queensland, Australia. Int J Cancer
1997, 70, 26–31.
31. Youl P, Aitken J, Hayward N, et al. Melanoma in adolescents: a
case-control study of risk factors in Queensland, Australia. Int J
Cancer 2002, 98, 92–98.
32. Greenland S. Quantitative methods in the review of epidemiol-
ogic literature. Epidemiol Rev 1987, 9, 1–30.
33. Dabkowski J, Omulecki A, Zalewska A. Identification of
melanoma risk factors in the Polish population. Dermatol Surg
1997, 23, 1039–1042.
34. Moore DH, Patterson HW, Hatch F, et al. Case-control study of
malignant melanoma among employees of the Lawrence Liver-
more National Laboratory. Am J Ind Med 1997, 32,
377–391.
35. Weiss J, Garbe C, Bertz J, et al. Risk factors for the development
of malignant melanoma in West Germany. Results of a multi-
center-case control study. Hautarzt 1990, 41, 309–313.
36. Rothman KJ. Modern epidemiology. Boston, MA, USA,
1986.
37. Greenland S, Longnecker M. Methods for trend estimation from
summarized dose-response data, with applications to meta-
analysis. Am J Epidemiol 1992, 135, 1301–1309.
38. Marrett LD, King WD, Walter SD, et al. Use of host factors to
identify people at high risk for cutaneous malignant melanoma
[published erratum appears in Can Med Assoc J 1992 Dec
15;147(12):1764]. CMAJ 1992, 47, 445–453.
39. DerSimonian R, Laird N. Meta-analysis in clinical trials. Control
Clin Trials 1986, 7, 177–188.
40. van Houwelingen HC, Arends LR, Stijnen T. Advanced methods
in meta-analysis: multivariate approach and meta-regression.
Stat Med 2002, 21, 589–624.
41. SAS Institute Inc. SAS Windows version. (8.02). Gary, NC,
1999.
42. Begg CB, Mazumdar M. Operating characteristics of a rank
correlation test for publication bias. Biometrics 1994, 50,
1088–1101.
43. Egger M, Smith GD, Schneider M, et al. Bias in meta-analysis
detected by a simple, graphical test. BMJ 1997, 315, 629–634.
44. Duval S, Tweedie R. Trim and fill: a simple funnel-plot-based
method of testing and adjusting for publication bias in meta-
analysis. Biometrics 2000, 56, 455–463.
45. Copas JB, Shi JQ. A sensitivity analysis for publication bias in
systematic reviews. Stat Metheds Med Res 2001, 10, 251–265.
46. MacKie RM, Freudenberger T, Aitchison TC. Personal risk-
factor chart for cutaneous melanoma. Lancet 1989, 2, 487–490.
47. Rhodes AR, Sober AJ, Milm MC, et al. Possible risk factors for
primary cutaneous malignant melanoma. Clin Res 1980, 28,
252–252.
48. Cockburn M, Black W, McKelvey W, et al. Determinants of
melanoma in a case-control study of twins (United States).
Cancer Causes Control 2001, 12, 615–625.
49. Buettner PG, Garbe C. Agreement between self-assessment of
melanocytic nevi by patients and dermatologic examination. Am
J Epidemiol 2000, 151, 72–77.
50. Little P, Keefe M, White J. Self screening for risk of melanoma:
validity of self mole counting by patients in a single general
practice. BMJ 1995, 310, 912–916.
S. Gandini et al. / European Journal of Cancer 41 (2005) 28–44 43
51. Begg CB, Mazumdar M. Operating characteristics of a rank
correlation test for publication bias. Biometrics 1994, 50,
1088–1099.
52. Gallagher RP, McLean DI. The epidemiology of acquired
melanocytic nevi. A brief review. Dermatol Clin 1995, 13,
595–603.
53. Tiersten AD, Grin CM, Kopf AW, et al. Prospective follow-up
for malignant melanoma in patients with atypical-mole (dysplas-
tic-nevus) syndrome. J Dermatol Surg Oncol 1991, 17, 44–48.
54. Marghoob AA, Kopf AW, Rigel DS, et al. Risk of cutaneous
malignant melanoma in patients with �classic� atypical-mole
syndrome. A case-control study. Arch Dermatol 1994, 130,
993–998.
55. MacKie RM, McHenry P, Hole D. Accelerated detection with
prospective surveillance for cutaneous malignant melanoma in
high-risk groups. Lancet 1993, 341, 1618–1620.
56. Green A, Siskind V, Hansen ME, et al. Melanocytic nevi in
schoolchildren in Queensland. J Am Acad Dermatol 1989, 20,
1054–1060.
57. Gallagher RP, McLean DI, Yang CP, et al. Suntan, sunburn,
and pigmentation factors and the frequency of acquired melan-
ocytic nevi in children. Similarities to melanoma: the Vancouver
Mole Study. Arch Dermatol 1990, 126, 770–776.
58. Coombs BD, Sharpies KJ, Cooke KR, et al. Variation and
covariates of the number of benign nevi in adolescents. Am J
Epidemiol 1992, 136, 344–355.
59. Dennis LK, White E, Lee JA, et al. Constitutional factors and
sun exposure in relation to nevi: a population-based cross-
sectional study. Am J Epidemiol 1996, 143, 248–256.
60. Ford D, Bliss JM, Swerdlow AJ, et al. Risk of cutaneous
melanoma associated with a family history of the disease. The
International Melanoma Analysis Group (IMAGE). Int J Cancer
1995, 62, 377–381.
61. Kanzler MH, Mraz-Gernhard S. Primary cutaneous malignant
melanoma and its precursor lesions: diagnostic and therapeutic
overview. J Am Acad Dermatol 2001, 45, 260–276.
62. Stierner U, Augustsson A, Rosdahl I, et al. Regional distribu-
tion of common and dysplastic naevi in relation to melanoma site
and sun exposure. A case-control study. Melanoma Res 1992, 1,
367–375.
63. Carli P. Cutaneous melanoma histologically associated with a
nevus and melanoma de novo have a different profile of risk:
results from a case-control study. J Am Acad Dermatol 1999, 40,
549–557.
64. Whiteman DC, Watt P, Purdie DM, et al. Melanocytic nevi,
solar keratoses, and divergent pathways to cutaneous melanoma.
J Natl Cancer Inst 2003, 95, 806–812.
65. Rhodes AR. Public education and cancer of the skin. What do
people need to know about melanoma and nonmelanoma skin
cancer. Cancer 1995, 75, 613–636.
66. Beral V, Evans S, Shaw H, et al. Cutaneous factors related to
the risk of malignant melanoma. Br J Dermatol 1983, 109,
165–172.
67. Sorahan T, Grimley RP. The aetiological significance of sunlight
and fluorescent lighting in malignant melanoma: a case-control
study. Br J Cancer 1985, 52, 765–769.
68. Elwood JM. Malignant melanoma in relation to moles, pigmen-
tation and exposure to fluorescent and other lighting sources. Br
J Cancer 1986, 53, 65–74.
69. Cristofolini M, Franceschi S, Tasin L, et al. Risk factors for
cutaneous malignant melanoma in a northern Italian population.
Int J Cancer 1987, 39, 150–154.
70. Osterlind A, Tucker MA, Hou-Jensen K, et al. The Danish case-
control study of cutaneous malignant melanoma. I. Importance
of host factors. Int J Cancer 1988, 42, 200–206.
71. Roush GC. Independence of dysplastic nevi from total nevi in
determining risk for non-familial melanoma. Prev Med.
72. Garbe C, Kruger S, Stadler R, et al. Markers and relative risk in
a German population for developing malignant melanoma. Int J
Dermatol 1989, 28, 517–523.
73. Rigel DS, Rivers JK, Kopf AW, et al. Dysplastic nevi. Markers
for increased risk for melanoma. Cancer 1989, 63, 386–389.
74. Dubin N, Pasternack BS, Moseson M. Simultaneous assessment
of risk factors for malignant melanoma and non-melanoma skin
lesions, with emphasis on sun exposure and related variables. Int
J Epidemiol 1990, 19, 811–819.
75. Elwood JM, Whitehead SM, Davison J, et al. Malignant
melanoma in England: risks associated with naevi, freckles,
social class, hair colour, and sunburn. Int J Epidemiol 1990, 19,
801–810.
76. Augustsson A, Stierner U, Rosdahl I, et al. Common and
dysplastic naevi as risk factors for cutaneous malignant mela-
noma in a Swedish population. Acta Derm Venereol 1991, 71,
518–524.
77. Halpern AC, Guerry D, Elder DE, et al. Dysplastic nevi as risk
markers of sporadic. A case-control study (nonfamilial) mela-
noma. Arch Dermatol 1991, 127, 995–999.
78. Weiss J, Bertz J, Jung EG. Malignant melanoma in southern
Germany: different predictive value of risk factors for melanoma
subtypes. Dermatologica 1991, 183, 109–113.
79. Zaridze D, Mukeria A, Duffy S. Risk factors for skin Melanoma
in Moscow (letter). Int J Cancer 1992, 52, 159–161.
80. Halpern AC, Guerry D, Elder DE, et al. A cohort study of
melanoma in patients with dysplastic nevi. J Invest Dermatol
1993, 100, 346S–349S.
81. Autier P, Dore JF, Lejeune F, et al. Recreational exposure to
sunlight and lack of information as risk factors for cutaneous
malignant melanoma. Results of an European Organization for
Research and Treatment of Cancer (EORTC) case-control study
in Belgium, France and Germany. The EORTC Malignant
Melanoma Cooperative Group. Melanoma Res 1994, 4,
79–85.
82. Garbe C, Buttner P, Weiss J, et al. Risk factors for developing
cutaneous melanoma and criteria for identifying persons at risk:
multicenter case-control study of the Central Malignant Mela-
noma Registry of the German Dermatological Society. J Invest
Dermatol 1994, 102, 695–699.
83. Kang S, Barnhill RL, Mihm Jr MC, et al. Melanoma risk in
individuals with clinically atypical nevi. Arch Dermatol 1994, 130,
999–1001.
84. White E, Kirkpatrick CS, Lee JA. Case-control study of
malignant melanoma in Washington State. I. Constitutional
factors and sun exposure. Am J Epidemiol 1994, 139,
857–868.
85. Westerdahl J, Olsson H, Masback A, et al. Is the use of
sunscreens a risk factor for malignant melanoma. Melanoma Res
1995, 5, 59–65.
86. Bataille V, Bishop JA, Sasieni P, et al. Risk of cutaneous
melanoma in relation to the numbers, types and sites of naevi: a
case-control study. Br J Cancer 1996, 73, 1605–1611.
87. Chen YT, Dubrow R, Holford TR, et al. Malignant melanoma
risk factors by anatomic site: a case-control study and polychot-
omous logistic regression analysis. Int J Cancer 1996, 67,
636–643.
88. Kelly JW, Yeatman JM, Regalia C, et al. A high incidence
of melanoma found in patients with multiple dysplastic naevi
by photographic surveillance. Med J Aust 1997, 167,
191–194.
89. Snels DG, Hille ET, Gruis NA, et al. Risk of cutaneous
malignant melanoma in patients with nonfamilial atypical nevi
from a pigmented lesions clinic. J Am Acad Dermatol 1999, 40,
686–693.
90. Mastrangelo G, Rossi CR, Pfahlberg A, et al. Is there a relation-
ship between influenza vaccinations and risk of melanoma?

44 S. Gandini et al. / European Journal of Cancer 41 (2005) 28–44
A population-based case-control study. Eur J Epidemiol 2000, 16,
777–782.
91. Naldi L, Lorenzo IG, Parazzini F, et al. Pigmentary traits,
modalities of sun reaction, history of sunburns, and melanocytic
nevi as risk factors for cutaneous malignant melanoma in the
Italian population: results of a collaborative case-control study.
Cancer 2000, 88, 2703–2710.
92. Landi MT, Baccarelli A, Calista D, et al. Combined risk factors
for melanoma in a Mediterranean population. Br J Cancer 2001,
85, 1304–1310.
93. Loria D, Matos E. Risk factors for cutaneous melanoma: a case-
control study in Argentina. Int J Dermatol 2001, 40, 108–114.
94. Nordlung JJ. Demographic study of clinically atypical (dysplas-
tic) nevi in patients with melanoma and comparison subjects.
Cancer Res 1985, 45, 1855–1861.
95. Dubin N. Epidemiology of malignant melanoma: pigmentary
traits,ultraviolet radiation and identification of high-risk popu-
lations. Rec Res Cancer Res 1986, 102, 56–75.
96. Green A, Bain C, McLennan R, et al. Risk factors for cutaneous
melanoma in Queensland. Recent Results Cancer Res 1986, 102,
76–97.
97. Rigel DS. Risk gradient for malignant melanoma in individuals
with dysplastic nevi. Lancet 1988, 1, 352–353.
98. Weinstock MA, Colditz GA, Willett WC, et al. Moles and site-
specific risk of nonfamilial cutaneous malignant melanoma in
women. J Natl Cancer Inst 1989, 81, 948–952.
99. Osterlind A. Malignant melanoma in Denmark. Occurrence and
risk factors. Acta Oncol 1990, 29, 833–854.
100. Augustsson A, Stierner U, Rosdahl I, et al. Melanocytic naevi in
sun-exposed and protected skin in melanoma patients and
controls. Acta Derm Venereol 1991, 71, 512–517.
101. Kruger S, Garbe C, Buttner P, et al. Epidemiologic evidence for
the role of melanocytic nevi as risk markers and direct precursors
of cutaneous malignant melanoma. Results of a case control
study in melanoma patients and nonmelanoma control subjects.
J Am Acad Dermatol 1992, 26, 920–926.
102. Zaridze DG, Mukeriia AF, Basieva TK, et al. The role of
endogenous and exogenous factors in the etiology of skin
melanoma. Vopr Onkol 1992, 38, 141–147.
103. Schneider JS, Moore DH, Sagebiel RW. Risk factors for
melanoma incidence in prospective follow-up. The importance
of atypical (dysplastic) nevi. Arch Dermatol 1994, 130,
1002–1007.
104. Carli P, Biggeri A, Giannotti B. Malignant melanoma in Italy:
risks associated with common and clinically atypical melanocytic
nevi. J Am Acad Dermatol 1995, 32, 734–739.
105. Rieger E, Soyer HP, Garbe C, et al. Overall and site-specific risk
of malignant melanoma associated with nevus counts at different
body sites: a multicenter case-control study of the German
Central Malignant-Melanoma Registry. Int J Cancer 1995, 62,
393–397.
106. Carli P, Biggeri A, De G, et al. Clinically atypical nevi and
melanoma risk. Giomale haliano di Dermatologia e Venereologia
1996, 130, 294.
107. Rodenas JM, Delgado-Rodriguez M, Farinas-Alvarez C, et al.
Melanocytic nevi and risk of cutaneous malignant melanoma in
southern Spain. Am J Epidemiol 1997, 145, 1020–1029.
108. Masback A, Westerdahl J, Ingvar C, et al. Clinical and
histopathological characteristics in relation to aetiological risk
factors in cutaneous melanoma: a population-based study.
Melanoma Res 1999, 9, 189–197.
109. Landi MT, Baccarelli A, Tarone RE, et al. DNA repair,
dysplastic nevi, and sunlight sensitivity in the development of
cutaneous malignant melanoma. J Natl Cancer Inst 2002, 94,
94–101.
110. Gandini S, Sera F, Cattaruzza MS, et al. Meta-analysis of risk
factors for cutaneous melanoma: II. Sun exposure. Eur J Cancer
2005, 41, this issue.