Medieval Warm Period, Little Ice Age and 20th century
temperature variability from Chesapeake Bay
T.M. Cronin a,*, G.S. Dwyer b, T. Kamiya c, S. Schwede a, D.A. Willard a
aNational Center, MS 926A, U.S. Geological Survey, Reston, VA 20192, USAbEarth and Ocean Sciences, Nicholas School of the Environment and Earth Sciences, Duke University, Durham, NC 27708, USA
cDepartment of Geology, Kanazawa University, Kanazawa, Japan
Received 15 July 2001; accepted 29 May 2002
Abstract
We present paleoclimate evidence for rapid ( < 100 years) shifts of f 2–4 jC in Chesapeake Bay (CB) temperature
f2100, 1600, 950, 650, 400 and 150 years before present (years BP) reconstructed from magnesium/calcium (Mg/Ca)
paleothermometry. These include large temperature excursions during the Little Ice Age (f1400–1900 AD) and the Medieval
Warm Period (f800–1300 AD) possibly related to changes in the strength of North Atlantic thermohaline circulation (THC).
Evidence is presented for a long period of sustained regional and North Atlantic-wide warmth with low-amplitude temperature
variability between f450 and 1000 AD. In addition to centennial-scale temperature shifts, the existence of numerous
temperature maxima between 2200 and 250 years BP (average f70 years) suggests that multi-decadal processes typical of the
North Atlantic Oscillation (NAO) are an inherent feature of late Holocene climate. However, late 19th and 20th century
temperature extremes in Chesapeake Bay associated with NAO climate variability exceeded those of the prior 2000 years,
including the interval 450–1000 AD, by 2–3 jC, suggesting anomalous recent behavior of the climate system.
D 2002 Elsevier Science B.V. All rights reserved.
Keywords: Paleoclimatology; Holocene; Medieval Warm Period; Little Ice Age; 20th Century climate; North Atlantic Oscillation
1. Introduction
Observational (Jones et al., 1999), modeling (San-
ter et al., 1996; Stott et al., 2000; Levitus et al., 2000)
and paleoclimate (Mann et al., 1999; Crowley, 2000)
studies show that a portion of the secular trend of
rising 20th century mean annual temperatures is
anthropogenic in origin, reflecting the influence of
greenhouse trace gases. These and other studies have
led to a consensus that 20th century mean annual
Northern Hemisphere temperatures exceed those of
the last 1000 years, including the period known as the
Medieval Warm Period (MWP) f1000–1300 AD,
and cannot be explained solely by solar and volcanic
forcing. However, it is still not yet clear to what
degree 20th century temperature variability is anom-
alous in the context of natural centennial and multi-
decadal climate variability related to changes in the
North Atlantic’s thermohaline circulation (THC). For
example, changes in the hydrological balance in high
latitudes have been linked to centennial-scale changes
in THC during the Medieval Warm Period and Little
0921-8181/02/$ - see front matter D 2002 Elsevier Science B.V. All rights reserved.
PII: S0921 -8181 (02 )00161 -3
* Corresponding author. Tel.: +1-703-648-6363; fax: +1-703-
648-6953.
E-mail address: [email protected] (T.M. Cronin).
www.elsevier.com/locate/gloplacha
Global and Planetary Change 36 (2003) 17–29
Ice Age (e.g., Keigwin,1996). Processes such as the
North Atlantic Oscillation (NAO), a measure of the
normalized sea level pressure difference (SLP) be-
tween the Azores and Iceland, is also a major source
multi-decadal wintertime Northern Hemispheric cli-
mate variability that has been associated with changes
in North Atlantic thermohaline circulation (Dickson et
al., 1996). Although annually resolved tree ring and
ice core records have been successful in reconstruct-
ing NAO-associated processes during the Little Ice
Age (LIA, Cook et al., 1998; Delworth and Mann,
2000; Cullen et al., 2001), these records deal mainly
with changes in SLP and do not cover the important
period prior to 1000 AD.
In this paper, we present a 2200-year paleoclimate
record of sea-surface temperature (SST) in Chesa-
peake Bay in the Mid-Atlantic region of the US
(Fig. 1), to compare 20th century temperature varia-
bility with that during the Medieval Warm Period and
Little Ice Age. Chesapeake Bay is ideal for obtaining
a long-term paleoclimate record for several reasons.
It is located in a region influenced by multi-decadal,
NAO-associated SST and air temperature variability
(Hurrell, 1996; Kapala et al., 1998). Positive NAO
values are associated with strengthened westerlies
across the Atlantic and positive temperature anoma-
lies over the western subtropical North Atlantic, as
well as much of northern Europe (Hurrell and Van
Loon, 1997; Kapala et al., 1998). High sedimentation
rates during the last several thousand years (f1–3
cm year� 1 sincef1800 AD; 0.2–1.0 cm year� 1
prior to 1800) yield a stratigraphic record, which has
a temporal resolution unavailable in most deep-sea
records. Further, the bay contains a nearly complete
Holocene sedimentary record (Cronin et al., 2000)
and thus extends farther back than most tree ring
records. Finally, bay sediments contain abundant
faunal, floral and geochemical proxies of dissolved
oxygen (Karlsen et al., 2000), salinity (Cronin et al.,
2000), and terrestrial vegetation (Willard et al., in
press), which show that it is sensitive to climate
fluctuations.
2. Chesapeake Bay temperatures
Chesapeake Bay is an elongate (f300 km), shal-
low (average depth f8.2 m), partially mixed estuary
with a deep axial channel (10 to f70 m) and a two-
layer stratified circulation in which inflowing ocean
water underlies lower salinity water influenced by
fresh water river discharge (Pritchard, 1967). Large-
scale circulation in the bay is driven mainly by
gravitational processes and to a lesser extent, wind,
tides, and topography (Boicourt et al., 1999). Water
temperatures are under the combined influence of
oceanic source water originating in S–SW flowing
continental shelf waters with occasional incursions of
slope water onto the shelf (Beardsley and Boicourt,
1981) and regional atmospheric temperatures. Sea-
sonal and interannual variability can be examined
using the bay instrumental record of temperature,
which extends back to 1949 (Chesapeake Bay Pro-
gram, 2001). There is an annual temperature range
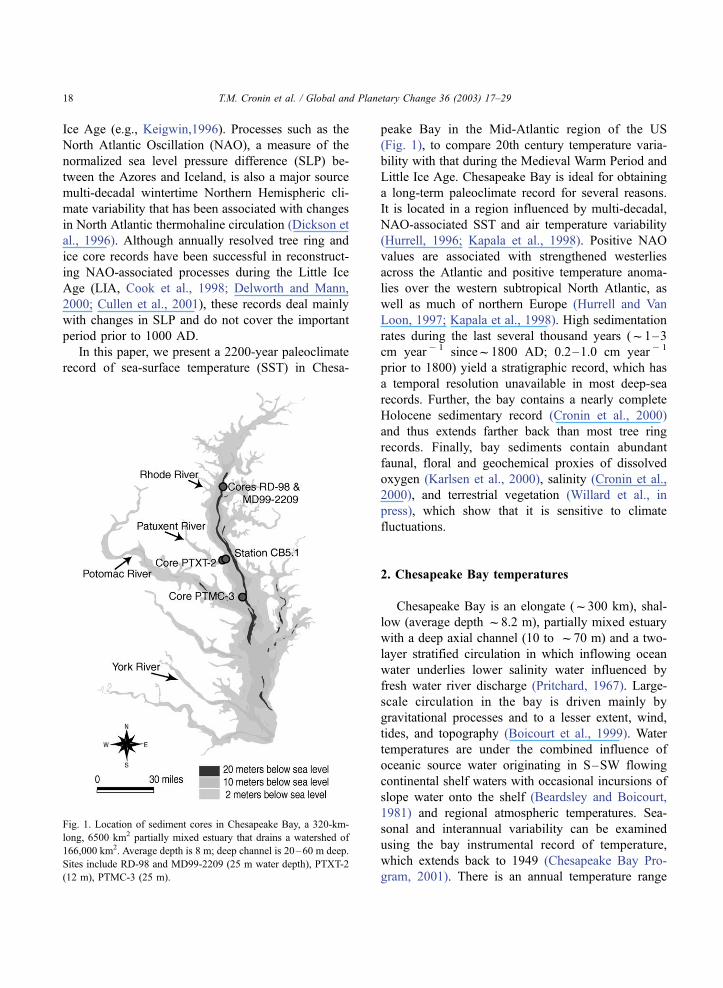
Fig. 1. Location of sediment cores in Chesapeake Bay, a 320-km-
long, 6500 km2 partially mixed estuary that drains a watershed of
166,000 km2. Average depth is 8 m; deep channel is 20–60 m deep.
Sites include RD-98 and MD99-2209 (25 m water depth), PTXT-2
(12 m), PTMC-3 (25 m).
T.M. Cronin et al. / Global and Planetary Change 36 (2003) 17–2918
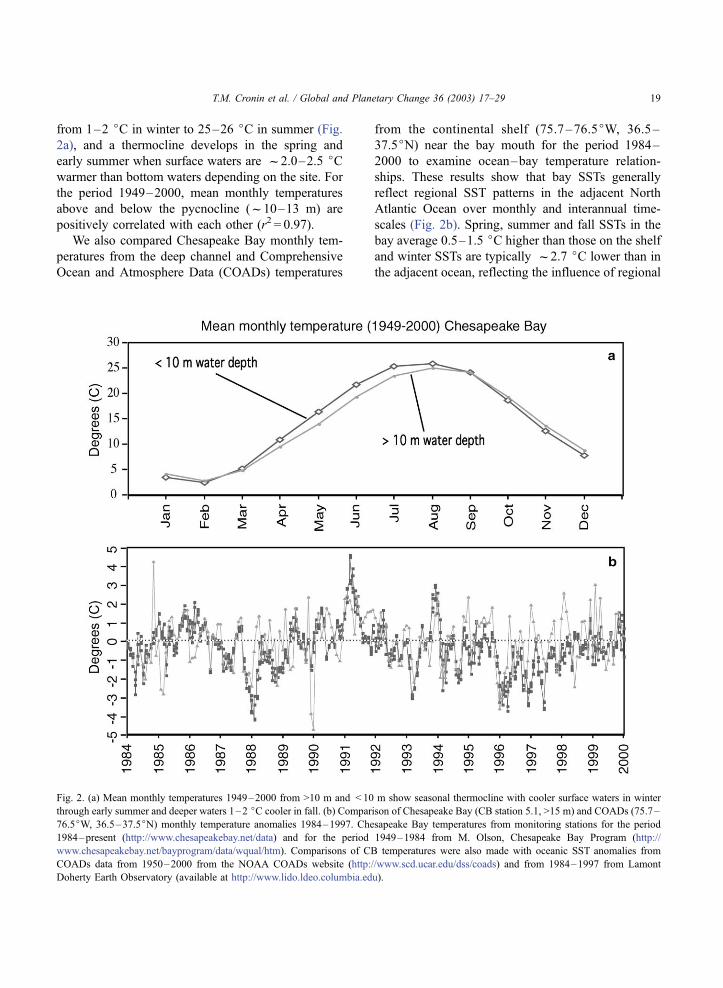
from 1–2 jC in winter to 25–26 jC in summer (Fig.
2a), and a thermocline develops in the spring and
early summer when surface waters are f2.0–2.5 jCwarmer than bottom waters depending on the site. For
the period 1949–2000, mean monthly temperatures
above and below the pycnocline (f10–13 m) are
positively correlated with each other (r2 = 0.97).
We also compared Chesapeake Bay monthly tem-
peratures from the deep channel and Comprehensive
Ocean and Atmosphere Data (COADs) temperatures
from the continental shelf (75.7–76.5jW, 36.5–
37.5jN) near the bay mouth for the period 1984–
2000 to examine ocean–bay temperature relation-
ships. These results show that bay SSTs generally
reflect regional SST patterns in the adjacent North
Atlantic Ocean over monthly and interannual time-
scales (Fig. 2b). Spring, summer and fall SSTs in the
bay average 0.5–1.5 jC higher than those on the shelf
and winter SSTs are typically f2.7 jC lower than in
the adjacent ocean, reflecting the influence of regional
Fig. 2. (a) Mean monthly temperatures 1949–2000 from >10 m and < 10 m show seasonal thermocline with cooler surface waters in winter
through early summer and deeper waters 1–2 jC cooler in fall. (b) Comparison of Chesapeake Bay (CB station 5.1, >15 m) and COADs (75.7–
76.5jW, 36.5–37.5jN) monthly temperature anomalies 1984–1997. Chesapeake Bay temperatures from monitoring stations for the period
1984–present (http://www.chesapeakebay.net/data) and for the period 1949–1984 from M. Olson, Chesapeake Bay Program (http://
www.chesapeakebay.net/bayprogram/data/wqual/htm). Comparisons of CB temperatures were also made with oceanic SST anomalies from
COADs data from 1950–2000 from the NOAA COADs website (http://www.scd.ucar.edu/dss/coads) and from 1984–1997 from Lamont
Doherty Earth Observatory (available at http://www.lido.ldeo.columbia.edu).
T.M. Cronin et al. / Global and Planetary Change 36 (2003) 17–29 19
atmospheric conditions on bay temperatures. Over
decadal timescales, COADs winter and spring records
from off the mouth of the bay extending back to 1880
exhibit a pattern of oceanic warming during the
1930–1940s, cooling in the 1960s, and warming since
the 1970s. This pattern is well-known from prior
studies of the North Atlantic climatology (Dickson
and Namias, 1976; Deser and Blackmon, 1993) and
may be associated with NAO-atmospheric variability
and changes in the convective renewal of intermediate
and deep water in the Greenland and Labrador Seas
(Dickson et al., 1996).
3. Mg/Ca temperature calibration
We reconstructed spring CB SST using the mag-
nesium/calcium (Mg/Ca) proxy method as a paleo-
thermometer (Chivas et al., 1986). The Mg/Ca
method is widely used in paleoclimatology and
relies on the thermodependence of the uptake of
magnesium into the calcitic shells of microfossils
(Dwyer et al., 1995; Lear et al., 2000). Mg/Ca ratios
in ostracode (Crustacea) shells are influenced by the
water temperature in which the shell is secreted and
the Mg/Ca ratio in the water. Whereas Mg/Ca ratios
may vary in certain estuaries (Dwyer and Cronin,
2001), Mg/Ca ratios in Chesapeake Bay mesohaline
water of 10–23 ppt (the average salinity at cores
sites) is relatively invariant (f4.6–4.9 versus 5.1
mmol/mol for seawater). Thus, Mg/Ca variability in
fossil shells can be attributed to changes in water
temperature.
To calibrate Mg/Ca ratios to water temperature, we
measured Mg/Ca ratios of shells of three related
species of the shallow water genus Loxoconcha using
direct current plasma (DCP) emission spectrometry
following the cleaning and analytical procedures
discussed in Dwyer et al. (1995). Loxoconcha is a
cosmopolitan, taxonomically well-known genus
whose stratigraphic record extends to the Paleocene.
Specimens used in the calibration data set were
obtained from three sources (Fig. 3). The first group
came from seagrass (Zostera marina) samples taken
monthly in 1999 near the mouth of the York River, a
tributary located in southern Chesapeake Bay. These
samples yielded populations of the epiphytal species
Loxoconcha matagordensis (Cronin et al., in press).
The second group included specimens of the related
species Loxoconcha sp. obtained from the Chesa-
peake Bay deep channel in June and September
1999 on cruises of the R/V Orion and from the
continental shelf off the mouth of the bay. Loxocon-
cha sp. populations inhabit the inner shelf and poly-
haline regions of Atlantic estuaries into which they
migrate with inflowing saline Atlantic shelf water.
Most downcore specimens used to reconstruct Hol-
ocene paleotemperature history were Loxoconcha sp.
The third group included Loxoconcha impressa
obtained from surface sediments collected on the
continental shelf during a large study in the 1960s
of Atlantic shelf and slope surface sediments and
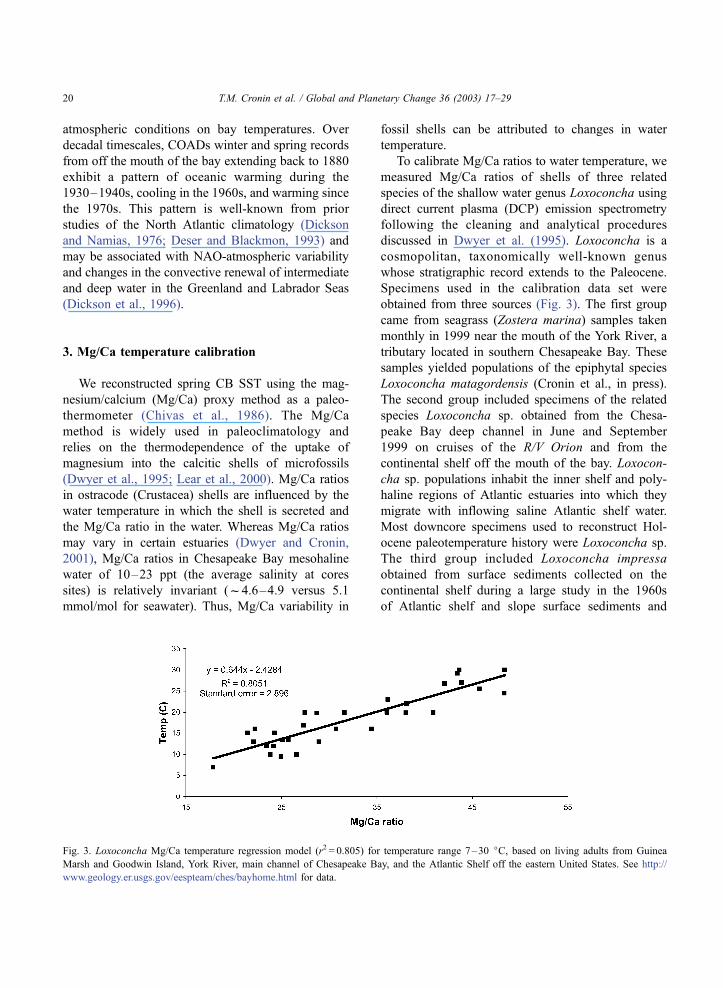
Fig. 3. Loxoconcha Mg/Ca temperature regression model (r2 = 0.805) for temperature range 7–30 jC, based on living adults from Guinea
Marsh and Goodwin Island, York River, main channel of Chesapeake Bay, and the Atlantic Shelf off the eastern United States. See http://
www.geology.er.usgs.gov/eespteam/ches/bayhome.html for data.
T.M. Cronin et al. / Global and Planetary Change 36 (2003) 17–2920
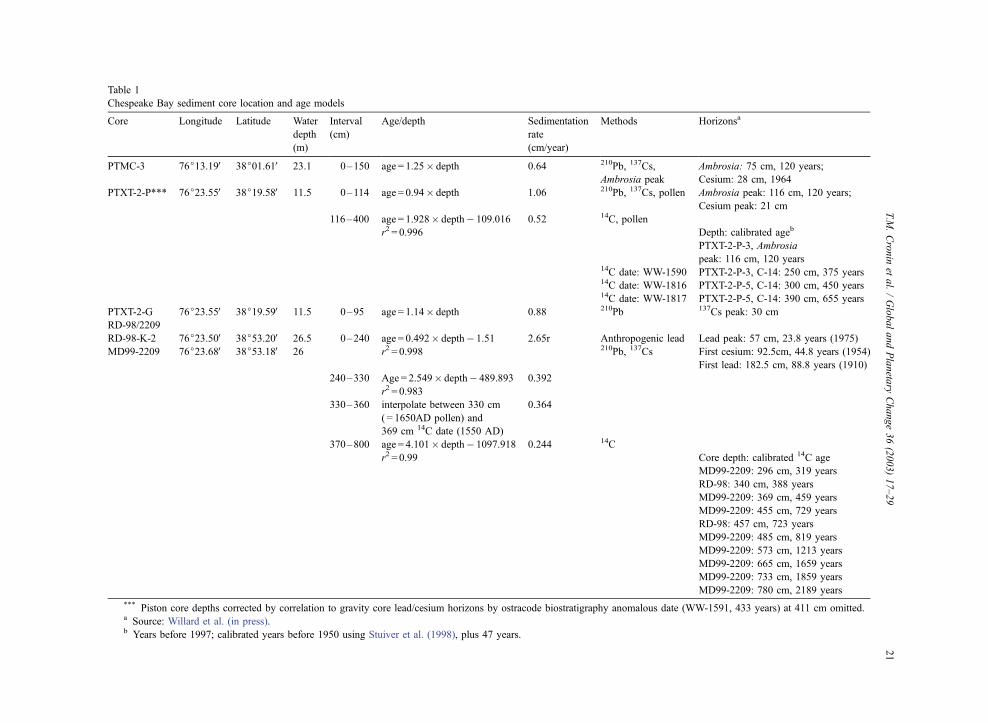
Table 1
Chespeake Bay sediment core location and age models
Core Longitude Latitude Water
depth
(m)
Interval
(cm)
Age/depth Sedimentation
rate
(cm/year)
Methods Horizonsa
PTMC-3 76j13.19V 38j01.61V 23.1 0–150 age = 1.25� depth 0.64 210Pb, 137Cs,
Ambrosia peak
Ambrosia: 75 cm, 120 years;
Cesium: 28 cm, 1964
PTXT-2-P*** 76j23.55V 38j19.58V 11.5 0–114 age = 0.94� depth 1.06 210Pb, 137Cs, pollen Ambrosia peak: 116 cm, 120 years;
Cesium peak: 21 cm
116–400 age = 1.928� depth� 109.016 0.52 14C, pollen
r2 = 0.996 Depth: calibrated ageb
PTXT-2-P-3, Ambrosia
peak: 116 cm, 120 years14C date: WW-1590 PTXT-2-P-3, C-14: 250 cm, 375 years14C date: WW-1816 PTXT-2-P-5, C-14: 300 cm, 450 years14C date: WW-1817 PTXT-2-P-5, C-14: 390 cm, 655 years
PTXT-2-G 76j23.55V 38j19.59V 11.5 0–95 age = 1.14� depth 0.88 210Pb 137Cs peak: 30 cm
RD-98/2209
RD-98-K-2 76j23.50V 38j53.20V 26.5 0–240 age = 0.492� depth� 1.51 2.65r Anthropogenic lead Lead peak: 57 cm, 23.8 years (1975)
MD99-2209 76j23.68V 38j53.18V 26 r2 = 0.998 210Pb, 137Cs First cesium: 92.5cm, 44.8 years (1954)
First lead: 182.5 cm, 88.8 years (1910)
240–330 Age = 2.549� depth� 489.893 0.392
r2 = 0.983
330–360 interpolate between 330 cm
( = 1650AD pollen) and
369 cm 14C date (1550 AD)
0.364
370–800 age = 4.101� depth� 1097.918 0.244 14C
r2 = 0.99 Core depth: calibrated 14C age
MD99-2209: 296 cm, 319 years
RD-98: 340 cm, 388 years
MD99-2209: 369 cm, 459 years
MD99-2209: 455 cm, 729 years
RD-98: 457 cm, 723 years
MD99-2209: 485 cm, 819 years
MD99-2209: 573 cm, 1213 years
MD99-2209: 665 cm, 1659 years
MD99-2209: 733 cm, 1859 years
MD99-2209: 780 cm, 2189 years
*** Piston core depths corrected by correlation to gravity core lead/cesium horizons by ostracode biostratigraphy anomalous date (WW-1591, 433 years) at 411 cm omitted.a Source: Willard et al. (in press).b Years before 1997; calibrated years before 1950 using Stuiver et al. (1998), plus 47 years.
T.M
.Cronin
etal./GlobalandPlaneta
ryChange36(2003)17–29
21
fauna (Valentine, 1971). Specimens of L. impressa
come from 37 to 44jN latitude and provide a cool-
water end member for the Loxoconcha Mg/Ca tem-
perature calibration.
Our ecological studies of populations of L.
matagordensis living in Chesapeake Bay (Cronin
et al., in press) confirm those of previous workers
(Kamiya, 1988) and show that the majority of
adults secrete their shells during a 5–6-week spring
breeding season. However, during this period, water
temperatures in the bay rise about 10 jC and we
cannot determine exactly when in the spring adults
were secreted. Consequently, some fossil adult shells
may represent early spring or summer growth and
we use averaging of downcore Mg/Ca-based paleo-
temperatures to obtain estimates of mean spring
SSTs.
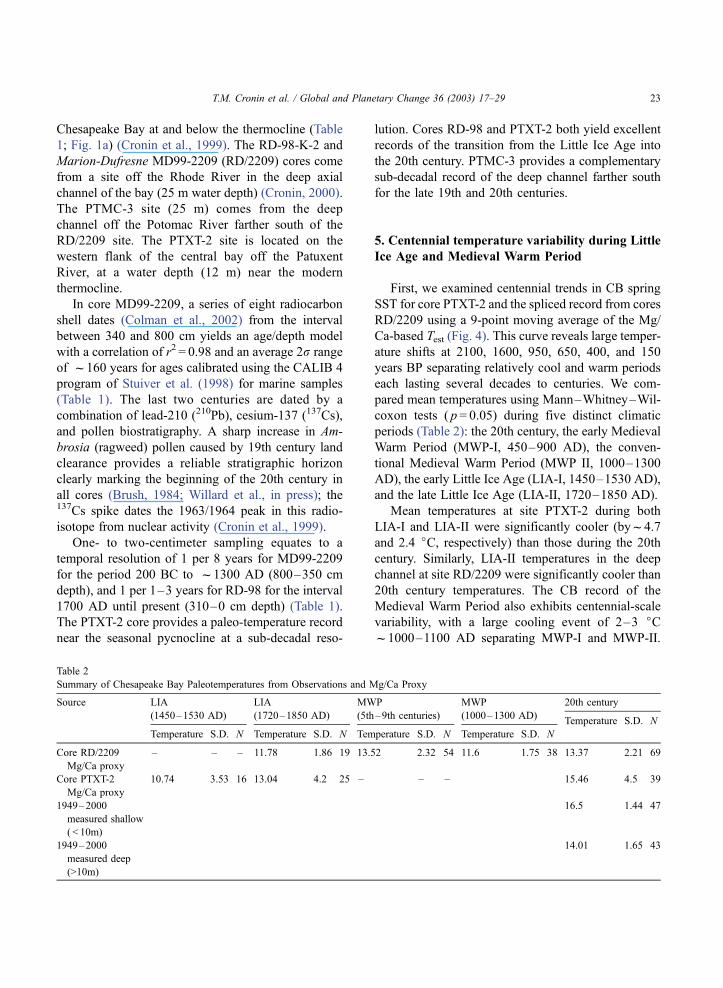
A total of 21 samples covering a temperature range
from 7 to 30 jC were used to obtain the Mg/Ca
temperature relationship:
Tspring ¼ 0:644�Mg=Ca� 2:428 ðr2 ¼ 0:81Þ:
The standard error for this regression model is
f2.9 jC. This Mg/Ca temperature relationship based
on field collections is supported by studies of sub-
tropical populations of Loxoconcha from Florida Bay
(Dwyer and Cronin, 2001) and culturing of specimens
grown under controlled temperature and salinity con-
ditions in the laboratory (Dwyer et al., 2002). Our
results also suggest that there is little interspecific
variability in Mg/Ca ratios at least for temperate
species of Loxoconcha, although additional studies
of shell chemistry for tropical members of the genus
might extend the calibration for application in low
latitudes.
Chesapeake Bay Mg/Ca ratios and station data
used in the calibration and downcore paleotempera-
tures are available from http://www.geology.er.usgs.
gov/eespteam/ches/bayhome.html and NOAA’s
National Geophysical Data Center, World Data Center
for Paleoclimatology.
4. Stratigraphy and chronology
Four sediment cores taken between 1996 and 2000
were chosen to capture the temperature history of
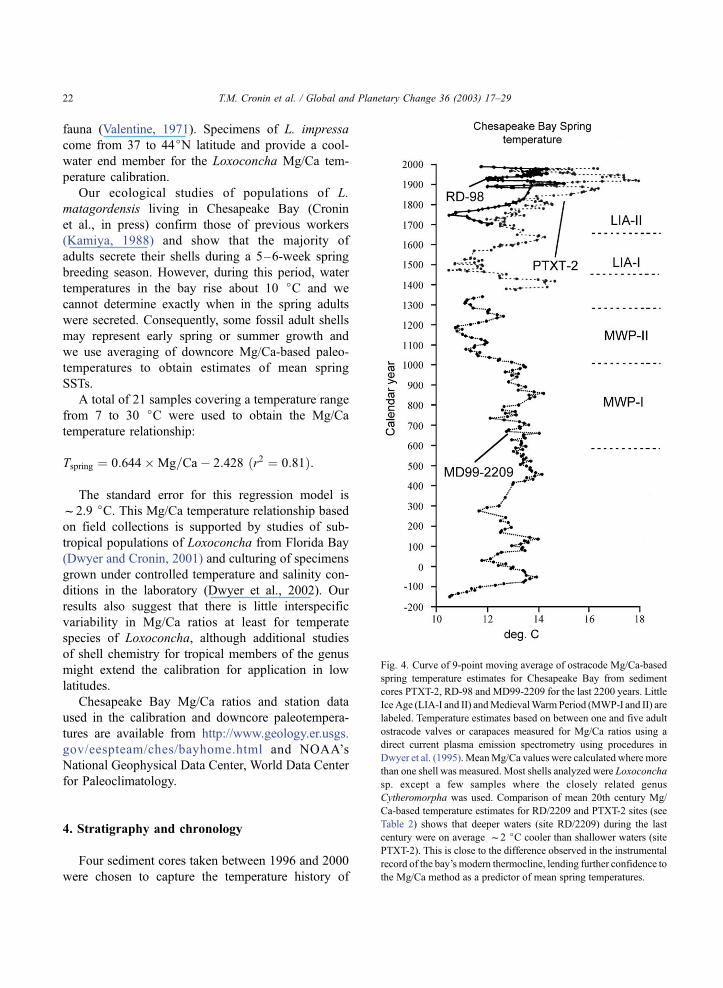
Fig. 4. Curve of 9-point moving average of ostracode Mg/Ca-based
spring temperature estimates for Chesapeake Bay from sediment
cores PTXT-2, RD-98 and MD99-2209 for the last 2200 years. Little
Ice Age (LIA-I and II) andMedievalWarmPeriod (MWP-I and II) are
labeled. Temperature estimates based on between one and five adult
ostracode valves or carapaces measured for Mg/Ca ratios using a
direct current plasma emission spectrometry using procedures in
Dwyer et al. (1995). MeanMg/Ca values were calculated where more
than one shell was measured. Most shells analyzed were Loxoconcha
sp. except a few samples where the closely related genus
Cytheromorpha was used. Comparison of mean 20th century Mg/
Ca-based temperature estimates for RD/2209 and PTXT-2 sites (see
Table 2) shows that deeper waters (site RD/2209) during the last
century were on average f2 jC cooler than shallower waters (site
PTXT-2). This is close to the difference observed in the instrumental
record of the bay’s modern thermocline, lending further confidence to
the Mg/Ca method as a predictor of mean spring temperatures.
T.M. Cronin et al. / Global and Planetary Change 36 (2003) 17–2922
Chesapeake Bay at and below the thermocline (Table
1; Fig. 1a) (Cronin et al., 1999). The RD-98-K-2 and
Marion-Dufresne MD99-2209 (RD/2209) cores come
from a site off the Rhode River in the deep axial
channel of the bay (25 m water depth) (Cronin, 2000).
The PTMC-3 site (25 m) comes from the deep
channel off the Potomac River farther south of the
RD/2209 site. The PTXT-2 site is located on the
western flank of the central bay off the Patuxent
River, at a water depth (12 m) near the modern
thermocline.
In core MD99-2209, a series of eight radiocarbon
shell dates (Colman et al., 2002) from the interval
between 340 and 800 cm yields an age/depth model
with a correlation of r2 = 0.98 and an average 2r range
of f160 years for ages calibrated using the CALIB 4
program of Stuiver et al. (1998) for marine samples
(Table 1). The last two centuries are dated by a
combination of lead-210 (210Pb), cesium-137 (137Cs),
and pollen biostratigraphy. A sharp increase in Am-
brosia (ragweed) pollen caused by 19th century land
clearance provides a reliable stratigraphic horizon
clearly marking the beginning of the 20th century in
all cores (Brush, 1984; Willard et al., in press); the137Cs spike dates the 1963/1964 peak in this radio-
isotope from nuclear activity (Cronin et al., 1999).
One- to two-centimeter sampling equates to a
temporal resolution of 1 per 8 years for MD99-2209
for the period 200 BC to f1300 AD (800–350 cm
depth), and 1 per 1–3 years for RD-98 for the interval
1700 AD until present (310–0 cm depth) (Table 1).
The PTXT-2 core provides a paleo-temperature record
near the seasonal pycnocline at a sub-decadal reso-
lution. Cores RD-98 and PTXT-2 both yield excellent
records of the transition from the Little Ice Age into
the 20th century. PTMC-3 provides a complementary
sub-decadal record of the deep channel farther south
for the late 19th and 20th centuries.
5. Centennial temperature variability during Little
Ice Age and Medieval Warm Period
First, we examined centennial trends in CB spring
SST for core PTXT-2 and the spliced record from cores
RD/2209 using a 9-point moving average of the Mg/
Ca-based Test (Fig. 4). This curve reveals large temper-
ature shifts at 2100, 1600, 950, 650, 400, and 150
years BP separating relatively cool and warm periods
each lasting several decades to centuries. We com-
pared mean temperatures using Mann–Whitney–Wil-
coxon tests ( p = 0.05) during five distinct climatic
periods (Table 2): the 20th century, the early Medieval
Warm Period (MWP-I, 450–900 AD), the conven-
tional Medieval Warm Period (MWP II, 1000–1300
AD), the early Little Ice Age (LIA-I, 1450–1530 AD),
and the late Little Ice Age (LIA-II, 1720–1850 AD).
Mean temperatures at site PTXT-2 during both
LIA-I and LIA-II were significantly cooler (byf4.7
and 2.4 jC, respectively) than those during the 20th
century. Similarly, LIA-II temperatures in the deep
channel at site RD/2209 were significantly cooler than
20th century temperatures. The CB record of the
Medieval Warm Period also exhibits centennial-scale
variability, with a large cooling event of 2–3 jCf1000–1100 AD separating MWP-I and MWP-II.
Table 2
Summary of Chesapeake Bay Paleotemperatures from Observations and Mg/Ca Proxy
Source LIA LIA MWP MWP 20th century
(1450–1530 AD) (1720–1850 AD) (5th–9th centuries) (1000–1300 AD)
Temperature S.D. N Temperature S.D. N Temperature S.D. N Temperature S.D. N
Temperature S.D. N
Core RD/2209
Mg/Ca proxy
– – – 11.78 1.86 19 13.52 2.32 54 11.6 1.75 38 13.37 2.21 69
Core PTXT-2
Mg/Ca proxy
10.74 3.53 16 13.04 4.2 25 – – – 15.46 4.5 39
1949–2000
measured shallow
( < 10m)
16.5 1.44 47
1949–2000
measured deep
(>10m)
14.01 1.65 43
T.M. Cronin et al. / Global and Planetary Change 36 (2003) 17–29 23
Mean 20th century CB temperature at RD/2209 was
significantly warmer than those during the cooler
MWP-II (f1000–1300 AD), but not warmer than
mean temperatures during MWP-I (450–900 AD),
which experienced two notable temperature maxima
f450 and 850 AD.
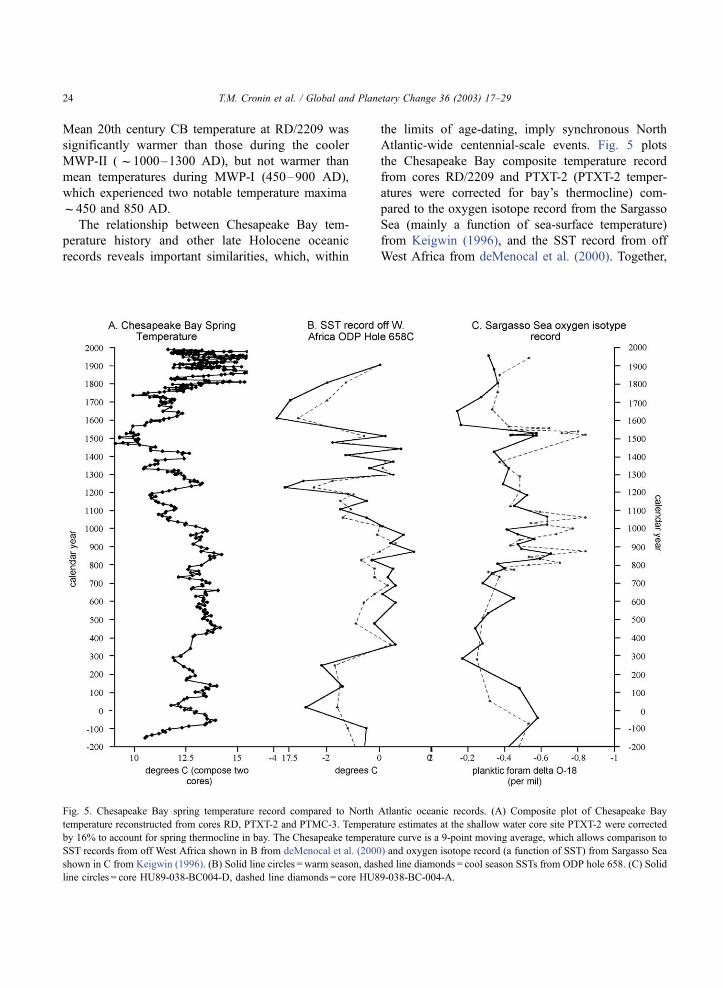
The relationship between Chesapeake Bay tem-
perature history and other late Holocene oceanic
records reveals important similarities, which, within
the limits of age-dating, imply synchronous North
Atlantic-wide centennial-scale events. Fig. 5 plots
the Chesapeake Bay composite temperature record
from cores RD/2209 and PTXT-2 (PTXT-2 temper-
atures were corrected for bay’s thermocline) com-
pared to the oxygen isotope record from the Sargasso
Sea (mainly a function of sea-surface temperature)
from Keigwin (1996), and the SST record from off
West Africa from deMenocal et al. (2000). Together,
Fig. 5. Chesapeake Bay spring temperature record compared to North Atlantic oceanic records. (A) Composite plot of Chesapeake Bay
temperature reconstructed from cores RD, PTXT-2 and PTMC-3. Temperature estimates at the shallow water core site PTXT-2 were corrected
by 16% to account for spring thermocline in bay. The Chesapeake temperature curve is a 9-point moving average, which allows comparison to
SST records from off West Africa shown in B from deMenocal et al. (2000) and oxygen isotope record (a function of SST) from Sargasso Sea
shown in C from Keigwin (1996). (B) Solid line circles =warm season, dashed line diamonds = cool season SSTs from ODP hole 658. (C) Solid
line circles = core HU89-038-BC004-D, dashed line diamonds = core HU89-038-BC-004-A.
T.M. Cronin et al. / Global and Planetary Change 36 (2003) 17–2924
the records indicate generally cool temperatures from
200 BC until about 300 AD, a sustained period of
relatively high temperatures from 400 AD peaking
about 900–1000 AD, progressive cooling until
1150–1200 AD, and a strong temperature minimum
between 1450 and 1600 AD. Keigwin (1996) and
deMenocal et al. (2000) estimated that oceanic SSTs
in the Sargasso Sea and off western Africa during
Little Ice Age events were f1 to 3 jC cooler than
today, although these records do not have the reso-
lution to reconstruct a detailed LIA SST record.
However, Winter et al. (2000) determined that during
LIA-II (1700 and 1815 AD), Caribbean SSTs were
2–4 jC cooler than present on the basis of coral
oxygen isotopic data. The timing of the two LIA
cool events in Chesapeake Bay is also remarkably
similar to those seen in hemispheric LIA atmospheric
temperatures during the mid to late 1400s and the
1600s and the early 1700s (Mann et al., 1999). In
fact, the steep fall in Northern Hemisphere temper-
atures to a minimum f1450–1500 AD was postu-
lated by Mann et al. (1999) to represent the start of
the LIA. It thus appears that the Chesapeake record
captures centennial-scale temperature oscillations
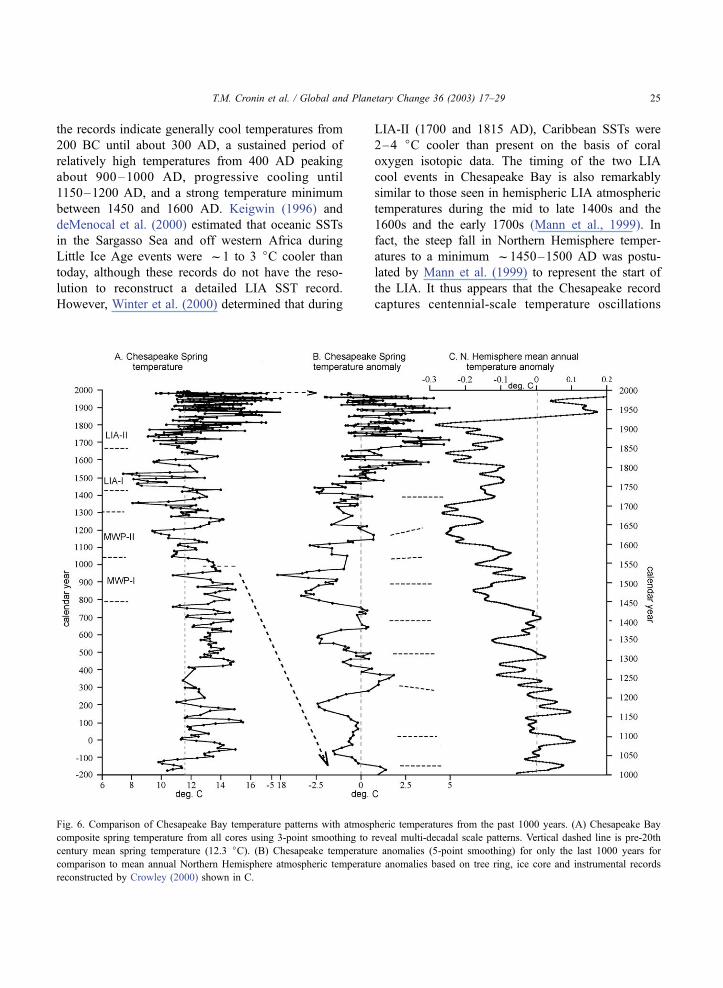
Fig. 6. Comparison of Chesapeake Bay temperature patterns with atmospheric temperatures from the past 1000 years. (A) Chesapeake Bay
composite spring temperature from all cores using 3-point smoothing to reveal multi-decadal scale patterns. Vertical dashed line is pre-20th
century mean spring temperature (12.3 jC). (B) Chesapeake temperature anomalies (5-point smoothing) for only the last 1000 years for
comparison to mean annual Northern Hemisphere atmospheric temperature anomalies based on tree ring, ice core and instrumental records
reconstructed by Crowley (2000) shown in C.
T.M. Cronin et al. / Global and Planetary Change 36 (2003) 17–29 25
characteristic of much of the North Atlantic region,
allowing for age uncertainty in the Chesapeake and
oceanic records.
6. Multi-decadal variability
The CB temperature record also allows us to com-
pare 20th century multi-decadal climate processes to
long-term patterns of Northern hemispheric temper-
atures (Fig. 6). The 3-point smoothing of the 2200-year
composite temperature shown on the left side in Fig. 6
reveals numerous (f25–26) brief temperature excur-
sions between 200 BC and 1750 AD with many warm
events rising 4–6 jC above the pre-20th century mean
spring temperature of 12.3 jC (Fig. 6). Although we
caution that the exact timing of each warm event cannot
be determined, and some extremes may represent shell
secretion early or late in the spring season, these multi-
decadal temperature excursions average out to one
every 70–75 years. It also is noteworthy that temper-
ature maxima during the early MWP-I vary within
about a 1 jC envelope near 14 jC and that these are
f 2–3 jC cooler than the maxima of the past 200
years. Thus, whereas mean temperatures duringMWP-
I and the 20th century were comparable, the 20th
century experienced greater temperature extremes than
at any time during the past 2200 years.
The last 1000 years of Chesapeake Bay temper-
atures are compared in Fig. 6B and C to a smoothed
record of mean Northern Hemisphere atmospheric
temperature anomaly reconstructed by Crowley
(2000) from instrumental and tree ring and ice core
proxy data (see also Mann et al., 1999). The Ches-
apeake SST and atmospheric records differ in type of
proxy used (Mg/Ca paleothermometry versus tree
ring, ice core and instrumental measurements), the
seasons (spring versus mean annual temperature), and
the temporal resolution (decadal versus annual).
Nonetheless, there are many similarities between the
two curves. Between 1000 and 1700 AD, we observe
nine nearly synchronous SST and atmospheric tem-
perature maxima (shown by dashed lines), an early
18th century rise in temperature, a 19th century LIA
minimum and a cooling in the 1960s. Although the
unprecedented rise in 20th century mean atmospheric
temperatures in Fig. 6C is not as dramatic in the
Chesapeake Bay composite SST record, temperatures
from the shallow water Chesapeake core (PTXT-2,
Fig. 4) may better represent atmospheric conditions
than the deeper part of the bay. More generally, bay
temperature maxima since f1850 AD are the warm-
est of the past 2000 years is consistent with instru-
mental oceanic records (Deser and Blackmon, 1993;
Levitus et al., 2000).
7. Discussion
Our results indicate that the eastern United States is
sensitive to large centennial and multi-decadal changes
in regional oceanic and atmospheric temperature dur-
ing the late Holocene. One mechanism causing that
could account for periodic centennial-scale temper-
ature shifts of 2–4 jC that are generally synchronous
throughout the North Atlantic Ocean involves changes
in the strength of North Atlantic thermohaline circu-
lation. Bond et al. (1993, 1999) documented 1500 year
F 500 year climate cycles related to changes in THC
during the last glacial period (70,000–20,000), and
Bond et al. (1997) and Bianchi and McCave (1999)
discovered similar but dampened cycles during the
Holocene interglacial period (10,000–present). These
cycles are believed to be partially responsible for
Medieval Warm Period warmth (enhanced THC)
(Broecker, 2001) and Little Ice Age cooling (weak-
ened THC) in the North Atlantic’s subtropical gyre
(Keigwin, 1996), the Caribbean (Winter et al., 2000),
and throughout the North Atlantic region (deMenocal
et al., 2000). In fact, the approximately 1500 years
between the inception f450 and 1800 AD of two
multi-century periods of warm temperatures in Ches-
apeake Bay suggest that our data may capture the last
Holocene 1500-year cycle (see Keigwin, 1996). There
is additional evidence from sea level records (e.g.,
Varekamp and Thomas, 1998) that rapid regional
warming f1800 AD was accompanied by accelerated
sea level rise at the end of the Little Ice Age, about
1750–1850 AD, thus preceding large-scale fossil fuel
burning. Much of this natural variability may be
attributed to low-frequency THC variability, with
some contribution from solar and volcanic forcing
(i.e., Crowley, 2000).
The ultimate causes of Holocene changes in THC
in the North Atlantic region are still unclear. Direct
forcing by solar and volcanic processes are respon-
T.M. Cronin et al. / Global and Planetary Change 36 (2003) 17–2926
sible for mean annual atmospheric temperature
anomalies years of only + 0.2 and � 0.5 jC, res-
pectively, during the last 1000 years (Free and
Robock,1999; Crowley, 2000), and are unlikely to
explain the magnitude of observed temperature shifts.
However, Bond et al. (2001) recently argued that
centennial-scale solar variability might initiate late
Holocene climate changes, which in turn are amplified
by oceanic processes. Rahmstorf (1995) has shown
using a general circulation ocean model that even
small changes in hydrological cycling, such as
changes in freshwater inflow in high latitudes, can
lead to changes in thermohaline circulation and tem-
peratures changes of several degrees within only a few
years.
Multi-decadal temperature changes observed in CB
during the last 2200 years, while smaller in magnitude
than centennial shifts, can also be attributed to atmos-
phere–ocean coupling influencing surface tempera-
tures and thermohaline circulation in the modern
North Atlantic Ocean. For example, observed and
model simulations of 20th century decadal climate
variability off the eastern United States show SST
anomalies of 0.5 to >1 jC (Kushnir, 1994; Delworth,
1996; Latif, 1998). Dickson et al. (1996) advanced the
theory that NAO-related atmospheric forcing influen-
ces oceanic convection in the Labrador, Sargasso and
Greenland Seas causing multi-decadal-scale changes
in the production and export of North Atlantic deep
water. Keigwin and Pickart (1999) have suggested
that, at least conceptually, both millennial and NAO-
scale changes in surface and deep slope water currents
in the Laurentian Fan involve changes in the strength
of Denmark Strait overflow and Labrador Sea deep
waters. These processes, which appear to be reflected
in 20th century trends in oceanic temperatures includ-
ing warming over the past 50 years (Levitus et al.,
2000), could influence Chesapeake Bay source water
originating in the Scotian Shelf region, as well as
atmospheric temperatures.
The approximate 70-year spacing of CB temper-
ature maxima, while needing verification in other
oceanic records, also lends support to the idea that
NAO processes may be responsible for the observed
patterns. Delworth and Mann (2000) identified a 70-
year mode of SST variability in both observation/
proxy data going back 300 years and in simulations
using the Geophysical Fluid Dynamics Lab (GFDL)
atmosphere–ocean model. Tree ring records from the
North Atlantic region (Cook et al., 1998; Cullen et al.,
2001), Greenland ice core records (Appenzeller et al.,
1998) and Mid-Atlantic precipitation/salinity records
(Cronin et al., 2000) all yield evidence for multi-
decadal atmospheric variability in the North Atlantic
region over 60- to 90-year periods.
Finally, the evidence for a long period of warmth
f450–900 AD, when Chesapeake Bay SSTs were
comparable to, but did not exceed mean 20th century
conditions, is particularly important in the context of
understanding 20th century warmth. Several studies
present convincing evidence that 20th century atmos-
pheric temperatures are anomalously warm relative to
those covering the past 1000 years (Mann et al., 1999;
Crowley, 2000). These 1000-year records have pro-
vided the baseline against which the international
community has compared the unprecedented 20th
century warming (Houghton et al., 2001). However,
it appears from Chesapeake Bay and other less
detailed North Atlantic oceanic temperature records
that much of the period between 1000 and 1900 AD
was cool relative to the preceding period f450–
1000 AD.
If the Chesapeake record for the period 450–1000
AD is viewed as a baseline for comparison to 19th and
20th century temperatures in lieu of pre-1000 AD
atmospheric records, then the magnitude of recent
Chesapeake temperature extremes are larger than
those observed even during the relative warmth
1000–1500 years ago. Although this result may be
partially due to greater sampling resolution in the last
two centuries, it is nonetheless consistent with evi-
dence from other studies suggesting that recent dec-
adal climate variability in the North Atlantic region is
extreme relative to long-term patterns and may be in
part anthropogenic in origin. For example, Cullen et
al. (2001) described anomalous patterns of 20th cen-
tury sea level pressure reconstructed from 300-year
tree ring records for the north Atlantic region. Sim-
ilarly, modeling studies suggest that early 20th century
ocean warming is anomalous and in part anthropo-
genic in origin (Delworth and Knutson, 2000). The
seemingly anomalous behavior of 20th temperature
patterns, if confirmed by additional records from high
sedimentation rate ocean margin and deep sea regions
for the pre-1000 AD period, suggest human influence
and would complicate efforts to predict future climate
T.M. Cronin et al. / Global and Planetary Change 36 (2003) 17–29 27
variability associated with multi-decadal climate pro-
cesses (Griffies and Bryan, 1997).
Acknowledgements
We are grateful to S. Colman, A. Zimmerman and
J. Bratton for RD98 core samples, Y. Balut, E. Michel,
R. Younger, R. Kerhin for shipboard assistance, and
C. Vann, A. Lavenburg, C. Nytch, B. Berry-Niekirk,
K. Moore, for sampling and analyses. H. Dowsett, R.
Najjar, L. Wingard, W. Boicourt, J. Buzas and two
anonymous reviewers provided helpful comments on
the manuscript. We thank T. Crowley for data on 20th
century climate trends, S. Worley for COADs data, the
World Data Center for Sargasso Sea and West African
isotopic and SST data, and M. Olson for Chesapeake
Bay temperatures.
References
Appenzeller, C., Stocker, T.F., Anklin, M., 1998. North Atlantic
Oscillation recorded in Greenland ice cores. Science 282,
446–448.
Beardsley, R.C., Boicourt, W.C., 1981. On estuarine and continen-
tal-shelf circulation in the middle Atlantic Bight. In: Warren,
B.A., Wunsch, C. (Eds.), Evolution of Physical Oceanography,
Scientific Survey in Honor of H. Stommel. MIT Press, Cam-
bridge, MA, pp. 198–241.
Bianchi, G.G., McCave, I., 1999. Holocene periodicity in North
Atlantic climate and deep-ocean flow south of Iceland. Nature
397, 515–517.
Boicourt, W.C, Kuzmic, M., Hopkins, T.S., 1999. The inland sea:
circulation of Chesapeake Bay and the Northern Adriatic. In:
Malone, T.C., Malej, A., Harding Jr., L.W., Smodlaka, N., Turn-
er, R.E. (Eds.), Amer. Geophys. Union Coastal and Estuarine.
Studies, vol. 55, pp. 81–129.
Bond, G.C., Heinrich, H., Broecker, W., Labeyrie, L., McManus, J.,
Andrews, J., Huon, S., Jantaschik, R., Clasen, S., Simet, C.,
Tedesco, K., Klas, M., Bonani, G., Ivy, S., 1993. Evidence for
massive discharge of icebergs into the North Atlantic Ocean
during the last glacial. Nature 360, 245–249.
Bond, G., Showers, W., Cheseby, M., Lotti, R., Almasi, P., deMe-
nocal, P., Priore, P., Cullen, H., Hadjas, I., Bonani, G., 1997. A
pervasive millennial-scale cycle in North Atlantic Holocene and
glacial climates. Science 278, 1257–1266.
Bond, G.C., Showers, W., Elliot, M., Evans, M., Lotti, R., Haj-
das, I., Bonani, G., Johnson, S., 1999. The North Atlantic 1-2
kyr climate rhythm: relation to Heinrich events, Dansgaard–
Oeschger cycles and the Little Ice Age. Am. Geophys. Union
Monogr. 112, 35–58.
Bond, G., Kromer, B., Beer, J., Muscheler, R., Evans, M.N., Show-
ers, W., Hoffman, S., Lotti-Bond, R., Hajdas, I., Bonani, G.,
2001. Persistent solar influence on North Atlantic climate during
the Holocene. Science 294, 2130–2136.
Broecker, W.S., 2001. Was the Medieval Warm Period global? Sci-
ence 291, 1497–1499.
Brush, G., 1984. Stratigraphic evidence of eutrophication in an
estuary. Water Resour. Res. 20, 531–541.
Chesapeake Bay Program 2001. (http://www.chesapeakebay.net/
bayprogram/data/wqual/htm).
Chivas, A.R., DeDeckker, P., Shelley, J.M.G., 1986. Magnesium
content of non-marine ostracod shells: a new palaeosalinometer
and palaeothermometer. Palaeogeogr. Palaeoclimatol. Palaeoe-
col. 54, 43–61.
Colman, S.M., Baucom, P., Bratton, J.F., Cronin, T.M., McGee-
hin, J.P., Willard, D., Zimmerman, A.R., Vogt, P.R., 2002.
Radiocarbon dating, chronologic framework, and changes in
accumulation rates of Holocene estuarine sediments from
Chesapeake Bay. Quat. Res. 57, 58–70.
Cook, E., D’Arrigo, R.D., Briffa, K.R., 1998. A reconstruction of
the North Atlantic Oscillation using tree-ring chronologies from
North America and Europe. Holocene 8, 9–17.
Cronin, T.M. (Ed.), 2000. Initial report on IMAGES V cruise of the
Marion-Dufresne to the Chesapeake Bay June 20–22, 1999.
USGS Open-File Report 00-306.
Cronin, T.M., Colman, S., Willard, D., Kerhin, R., Holmes, C.,
Karlsen, A., Ishman, S., Bratton, J., 1999. Interdisciplinary en-
vironmental project probes Chesapeake Bay down to the core.
EOS, Trans. Am. Geophys. Union 80, 237, 240–241.
Cronin, T.M., Willard, D., Karlsen, A., Ishman, S., Verardo, S.,
McGeehin, J., Kerhin, R., Holmes, C., Colman, S., Zimmerman,
A., 2000. Climatic variability in the eastern United States over
the past millennium from Chesapeake Bay sediments. Geology
28, 3–6.
Crowley, T.J., 2000. Causes of climate change over the past 1000
years. Science 289, 270–277.
Cullen, H.M., D’Arrigo, R.D., Cook, E.R., Mann, M.E., 2001.
Multiproxy reconstructions of the North Atlantic Oscillation.
Paleoceanography 16, 27–39.
Delworth, T.L., 1996. North Atlantic interannual variability in a
coupled ocean–atmosphere model. J. Clim. 9, 2356–2375.
Delworth, T.L., Knutson, T.R., 2000. Simulation of early 20th cen-
tury global warming. Science 287, 2246–2250.
Delworth, T.L., Mann, M., 2000. Observed and simulated multi-
decadal variability in the Northern Hemisphere. Clim. Dyn.
16, 661–676.
deMenocal, P., Ortiz, J., Guilderson, T., Sarnthein, M., 2000. Co-
herent high- and low-latitude climate variability during the Hol-
ocene warm period. Science 288, 2198–2202.
Deser, C., Blackmon, M.L., 1993. Surface climate variations over
the North Atlantic Ocean during winter: 1900–1989. J. Clim. 6,
1743–1753.
Dickson, R.R., Namias, J., 1976. North American influences on the
circulation and climate of the North American sector. Mon.
Weather Rev. 104, 1255–1265.
Dickson, R., Lazier, J., Meincke, J., Rhines, P., Swift, J., 1996.
Long-term coordinated changes in the convective activity of
the North Atlantic. Prog. Oceanogr. 38, 241–295.
T.M. Cronin et al. / Global and Planetary Change 36 (2003) 17–2928
Dwyer, G.S., Cronin, T.M., 2001. Ostracode shell chemistry as a
paleosalinity proxy in Florida Bay. In: Wardlaw, B. (Ed.), Bul-
letins of American Paleontology, vol. 361, pp. 249–276.
Dwyer, G.S., Cronin, T.M., Baker, P.A., Raymo, M.E., Buzas, J.,
Correge, T., 1995. North Atlantic deepwater temperature change
during Late Pliocene and late Quaternary climatic cycles. Sci-
ence 270, 1347–1351.
Dwyer, G.S., Cronin, T.M., Baker, P.A., 2002. Trace elements in
marine ostracodes. In: Holmes, J.A., Chivas, A.R. (Eds.), Amer-
ican Geophysical Union Monograph, vol. 131, pp. 205–225.
Free, M., Robock, A., 1999. Global warming in the context of the
Little Ice Age. J. Geophys. Res. 104 (D16), 19057–19070.
Griffies, S.M., Bryan, K., 1997. Predictability of North Atlantic
multi-decadal climate variability. Science 275, 181–184.
Hurrell, J.W., 1996. Influence of variations in extratropical winter-
time teleconnections on Northern Hemisphere temperature.
Geophys. Res. Lett. 23, 665–668.
Hurrell, J.W., Van Loon, H., 1997. Decadal variations in climate
associated with the North Atlantic Oscillation. Clim. Change 36,
301–326.
Houghton, J.T., Ding, Y., Griggs, D.J., Noguer, M., van der Lin-
den, P.J., Xiaosu, D., 2001. Climate Change 2001: The Scien-
tific Basis, Contribution of Working Group I to the Third
Assessment Report of the Intergovermental Panel on Climate
Change (IPCC). Cambridge Univ. Press, UK, p. 944.
Jones, P.D., New, M., Parker, D.E., Martin, S., Rigor, I.G., 1999.
Surface air temperature and its changes over the past 150 years.
Rev. Geophys. 37 (2), 173–199.
Kamiya, T., 1988. Contrasting population ecology of two species of
Loxoconcha (Ostracoda, Crustacea) in recent Zostera (eelgrass)
beds: adaptive differences between phytal and bottom-dwelling
species. Micropaleontology 34, 316–331.
Kapala, A., Machel, H., Flohn, H., 1998. Behaviour of the centres
of action above the Atlantic since 1881: Part II. Associations
with regional climate anomalies. Int. J. Climatol. 188, 23–36.
Karlsen, A.W., Cronin, T.M., Ishman, S.E., Willard, D.A.,
Holmes, C.W., Marot, M., Kerhin, R., 2000. Historical trends
in Chesapeake Bay dissolved oxygen based on benthic fora-
minifera from sediment cores. Estuaries 23, 488–508.
Keigwin, L., 1996. The Little Ice Age and Medieval Warm Period in
the Sargasso Sea. Science 274, 1504–1508.
Keigwin, L., Pickart, R.S., 1999. Slope water current over the Lau-
rentian fan on interannual to millennial time scales. Science 286,
520–523.
Kushnir, Y., 1994. Interdecadal variations in the North Atlantic sea
surface temperature and associated atmospheric conditions. J.
Clim. 7, 141–157.
Latif, M., 1998. Dynamics of interdecadal variability in coupled
ocean–atmosphere models. J. Clim. 11, 602–624.
Lear, C.H., Elderfield, H., Wilson, P.A., 2000. Cenozoic deep-sea
temperatures and global ice volumes from Mg/Ca in benthic
foraminiferal calcite. Science 287, 269–273.
Levitus, S., Antonov, J.I., Boyer, T.P., Stephens, C., 2000. Warming
of the world ocean. Science 287, 2225–2229.
Mann, M.E., Bradley, R.S., Hughes, M.K., 1999. Northern Hemi-
sphere temperature during the past millennium: inferences, un-
certainties, and limitations. Geophys. Res. Lett. 26, 759–762.
Pritchard, D.W., 1967. Observations of circulation in coastal plain
estuaries. In: Lauff, G.H. (Ed.), Estuaries. Am. Assoc. Advance
Sci., Washington, D.C., pp. 37–44.
Rahmstorf, S., 1995. Bifurcations of the Atlantic thermohaline cir-
culation in response to changes in the hydrological cycle. Nature
378, 145–149.
Santer, B.D., Taylor, K.E., Wigley, T.M.L., Johns, T.C., Jones, P.D.,
Karoly, D.J, Mitchell, J.F.B., Oort, A.H., Penner, J.E., Ramasw-
amy, V., Schwarzkopf, M.D., Stouffer, R.J., Tett, S., 1996. A
search for human influence on the thermal structure of the at-
mosphere. Nature 382, 39–46.
Stott, P.A., Tett, S.F.B., Jones, G.S., Allen, M.R., Mitchell, J.F.B.,
Jenkins, G.J., 2000. External control of 20th century temper-
ature by natural and anthropogenic forcings. Science 290,
2133–2137.
Stuiver, M., Reimer, P.J., Braziunas, T.F., 1998. High-precision ra-
diocarbon age calibration for terrestrial and marine samples.
Radiocarbon 40, 1127–1151.
Valentine, P.C., 1971. Climatic implication of a late Pleistocene
ostracode assemblage from southeastern Virginia. U. S. Geol.
Surv. Prof. Pap. 683-D, D1–D28.
Varekamp, J.C., Thomas, E., 1998. Climate change and the rise and
fall of sea level over the millennium. EOS, Trans. Am. Geophys.
Union 69, 73–75.
Willard, D.A., Cronin, T.M., Verardo, S., in press. Late Holocene
climate and ecosystem variability from Chesapeake Bay sedi-
ment cores. Holocene. The Holocene 13.
Winter, A., Ishioroshi, H., Watanabe, T., Oba, T., Christy, J., 2000.
Caribbean sea surface temperatures: two-to-three degrees cooler
than present during the Little Ice Age. Geophys. Res. Lett. 27,
3365–3368.
T.M. Cronin et al. / Global and Planetary Change 36 (2003) 17–29 29