Presented by Michael R. Gee President and Founder Arete Leadership Consulting Prepared by Alexander J. Gee
Strategies for growth and competitiveness
in the Global economy:
Top Growth Opportunities
August 12, 2010
Michael@
AreteLeadershipConsulting.com
404-275-1514

Topics of Discussion
1) World Global Growth Forecasts 2) “Follow the Money” Global Capital Flows 3) US Industry & Labor Market Trends 4) US Venture Capital Investments 5) Africa: The Lion Awakens 6) Global Strategic Alliance Partnering 7) Next Steps & Summary 8) Questions
2
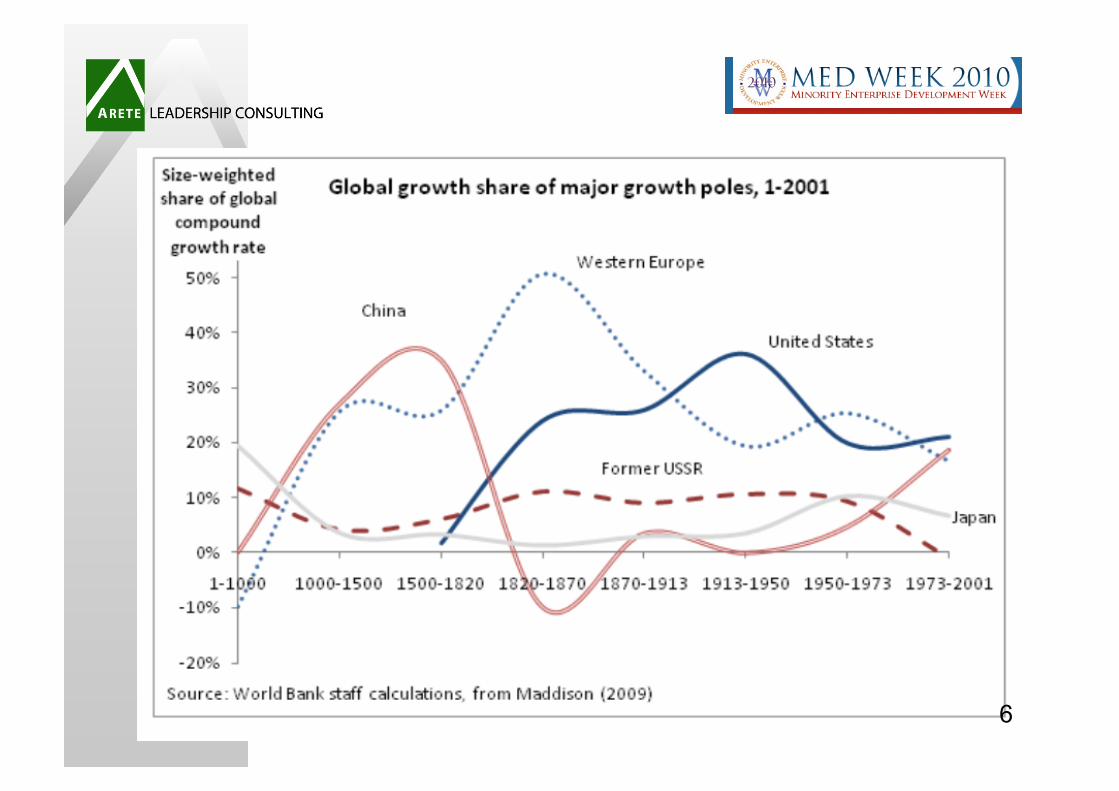
WORLD GLOBAL FORECAST
SECTION 1
3

IMF Global Forecast
4
Slow recovery from deep global recession, emerging and developing countries leading the way out…
“Follow The Money” Global Capital Flows
Section 2
5
Arete Leadership Tools
Why Partner? • To Grow Revenues Faster
• To Lower Costs and Reduce Risks
• To Provide Greater Value to Customers
What should I focus on? • Joint Selling • Co-Branding • Technology Alignment • Joint Customer Solutions • Sell to Balance of Trade
Arete helps organizations create transformational visions of the future 6
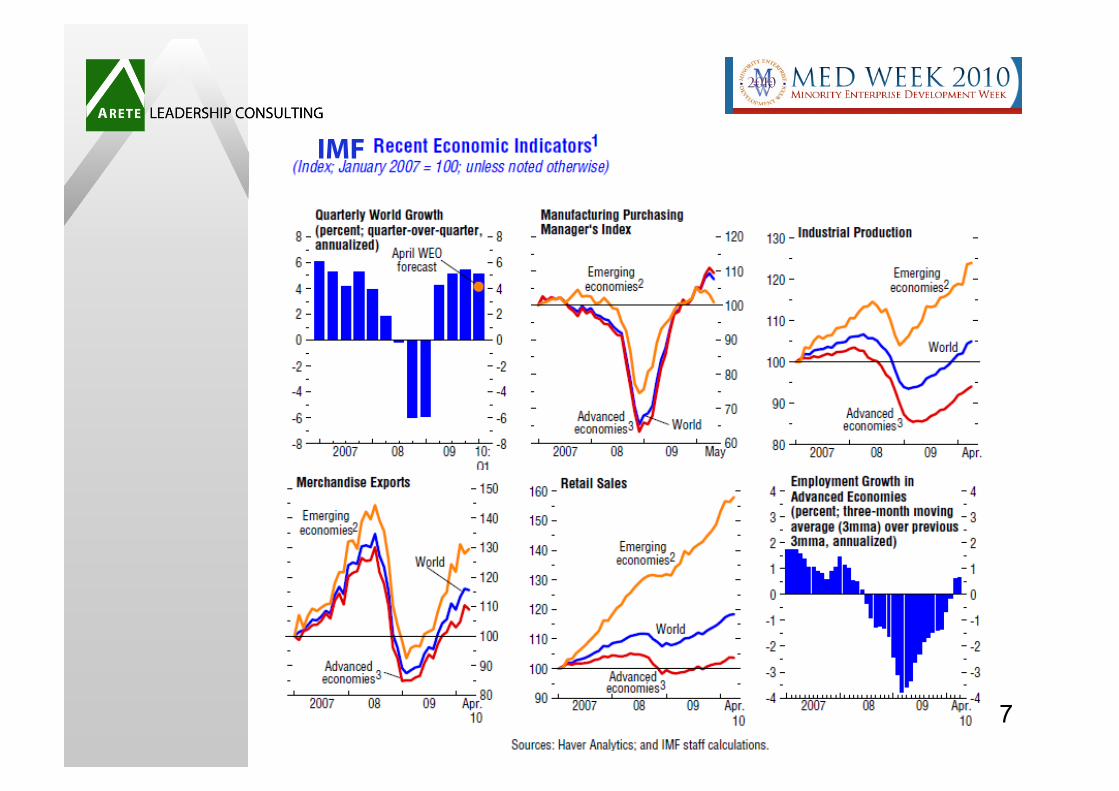
IMF
7

8

US Industry & Labor Market Trends
Section 3
9
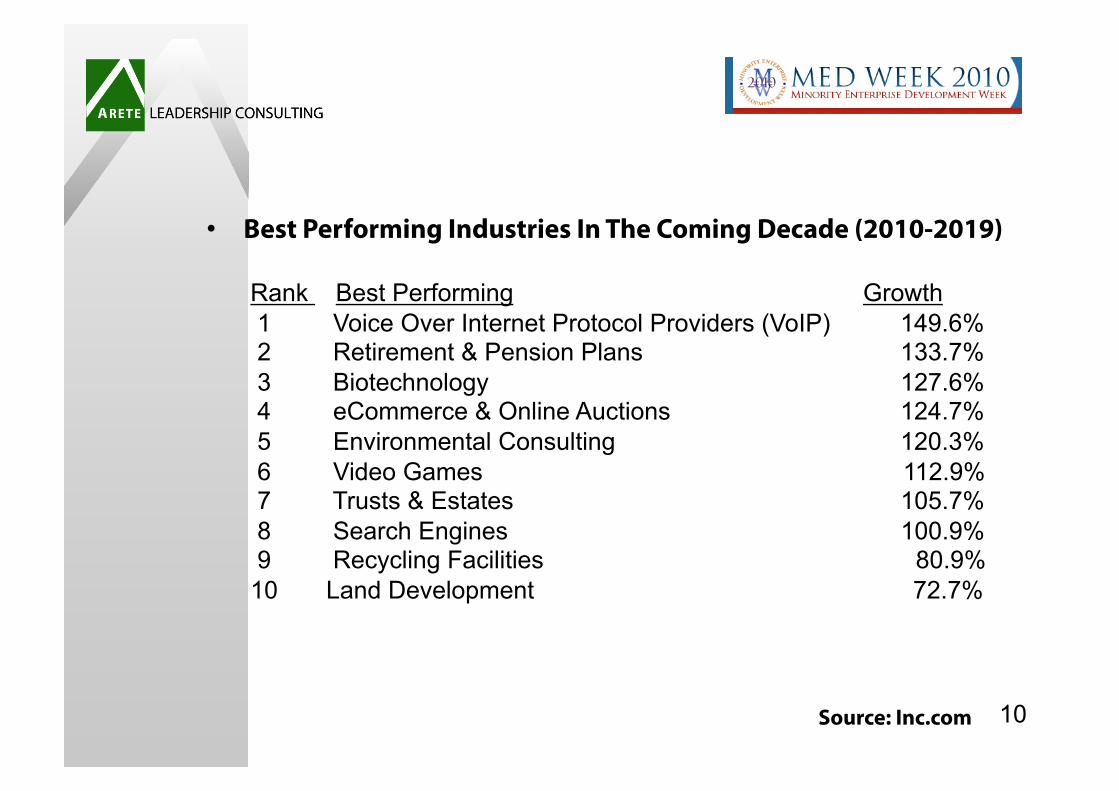
• Best Performing Industries In The Coming Decade (2010-2019)
Rank Best Performing Growth 1 Voice Over Internet Protocol Providers (VoIP) 149.6% 2 Retirement & Pension Plans 133.7% 3 Biotechnology 127.6% 4 eCommerce & Online Auctions 124.7% 5 Environmental Consulting 120.3% 6 Video Games 112.9% 7 Trusts & Estates 105.7% 8 Search Engines 100.9% 9 Recycling Facilities 80.9% 10 Land Development 72.7%
Source: Inc.com 10

• Worst Performing Industries In The Coming Decade (2010-2019)
Rank WorstPerforming Growth 1 Wired Telecommunications Carriers -52.0% 2 Tank & Armored Vehicle Manufacturing -51.9% 3 Vacuum, Fan & Small Household Appliance Manufacturing -34.4% 4 DVD, Game & Video Rental -32.8% 5 Photofinishing -31.5% 6 Lighting & Bulb Manufacturing -26.8% 7 Telecommunications Resellers -26.4% 8 Laminated Plastics Manufacturing -25.3% 9 Synthetic Fiber Manufacturing -24.6%
• 10 Wire & Spring Manufacturing -24.5%
11 Source: Inc.com
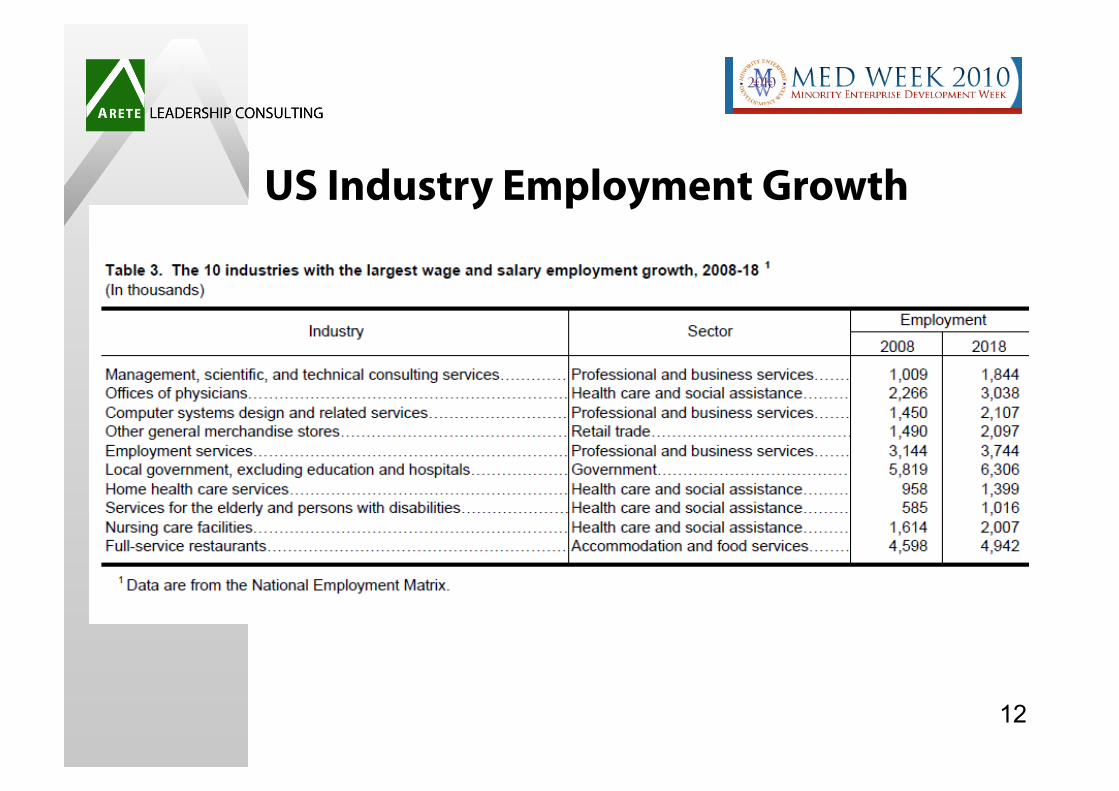
US Industry Employment Growth
12
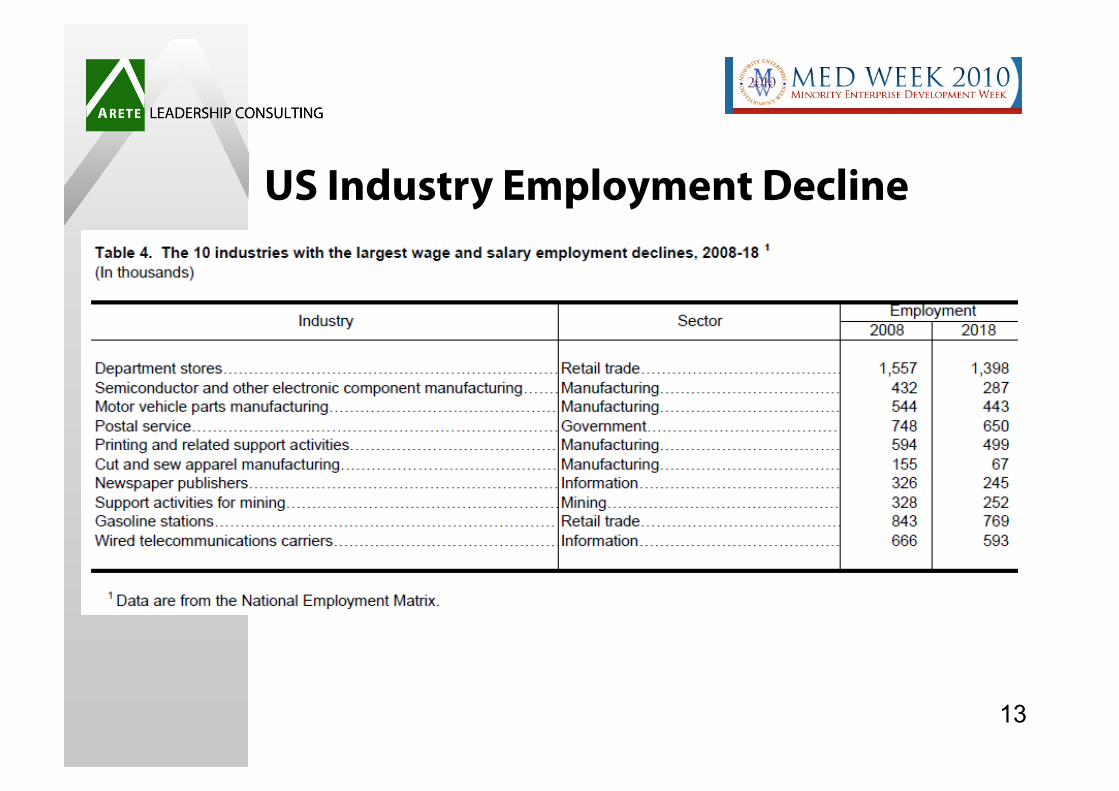
US Industry Employment Decline
13
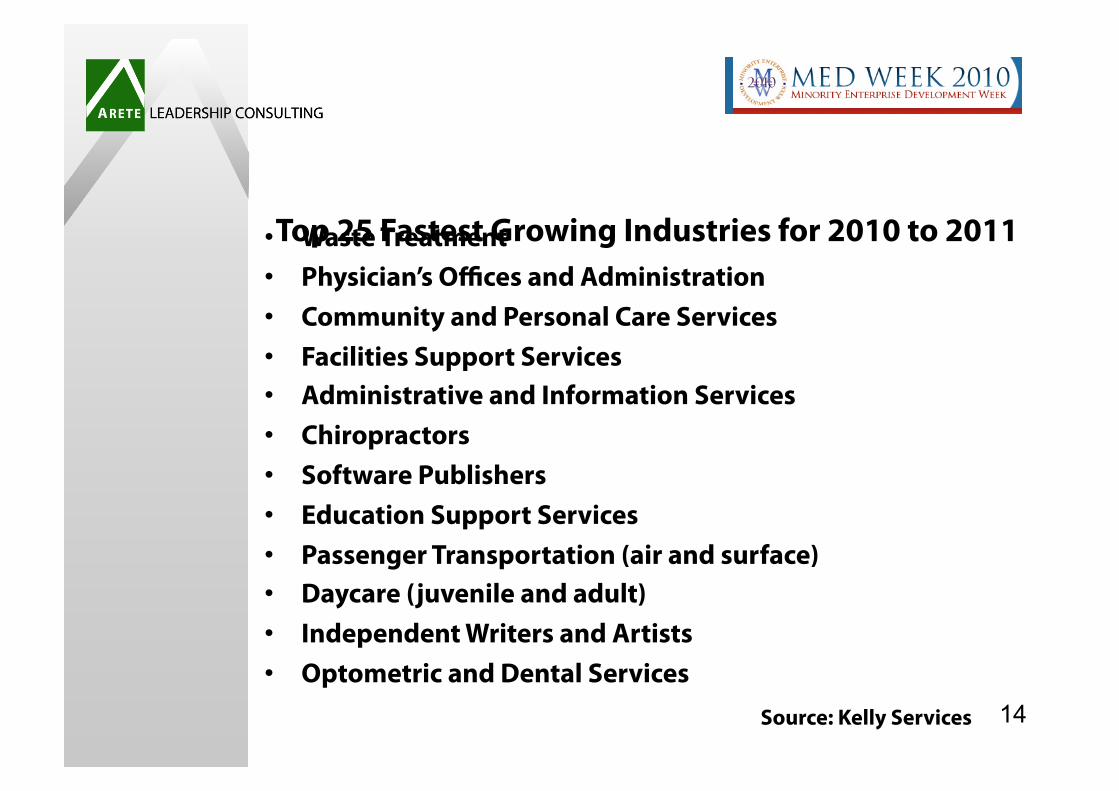
Top 25 Fastest Growing Industries for 2010 to 2011 • Waste Treatment • Physician’s Offices and Administration • Community and Personal Care Services • Facilities Support Services • Administrative and Information Services • Chiropractors • Software Publishers • Education Support Services • Passenger Transportation (air and surface) • Daycare (juvenile and adult) • Independent Writers and Artists • Optometric and Dental Services
Source: Kelly Services 14
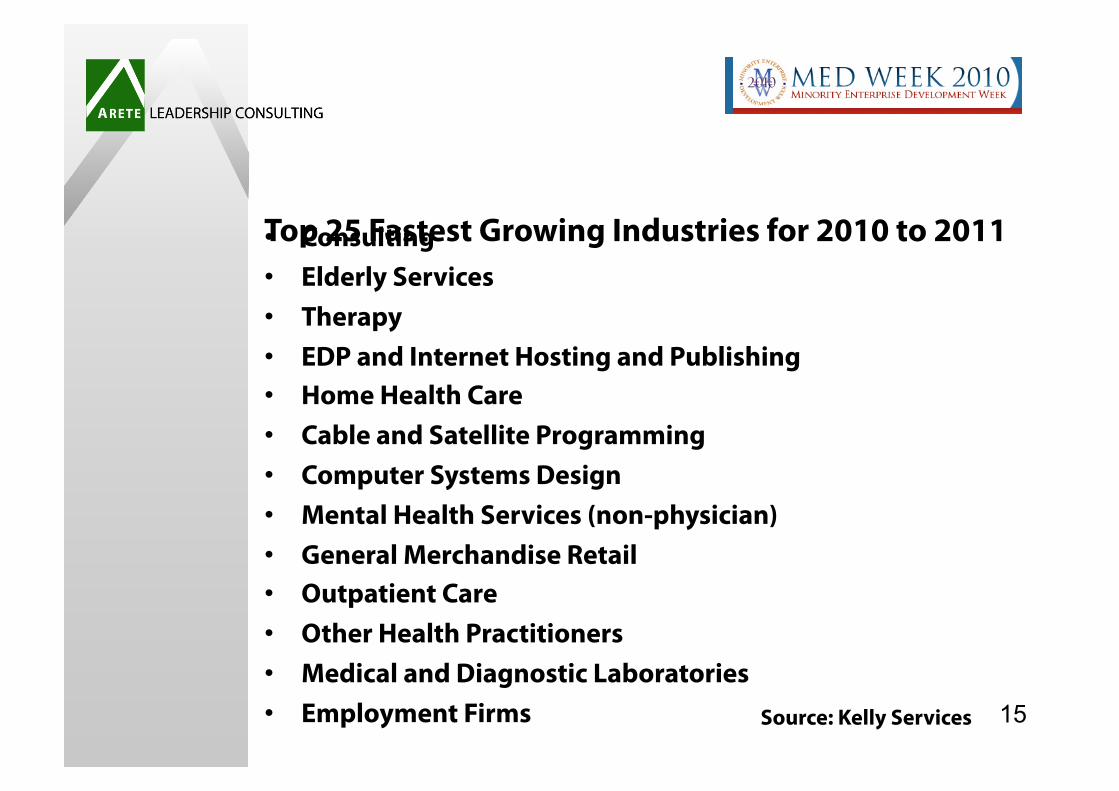
Top 25 Fastest Growing Industries for 2010 to 2011 • Consulting • Elderly Services • Therapy • EDP and Internet Hosting and Publishing • Home Health Care • Cable and Satellite Programming • Computer Systems Design • Mental Health Services (non-physician) • General Merchandise Retail • Outpatient Care • Other Health Practitioners • Medical and Diagnostic Laboratories • Employment Firms Source: Kelly Services 15
US Venture Capital Investments Section 4
16
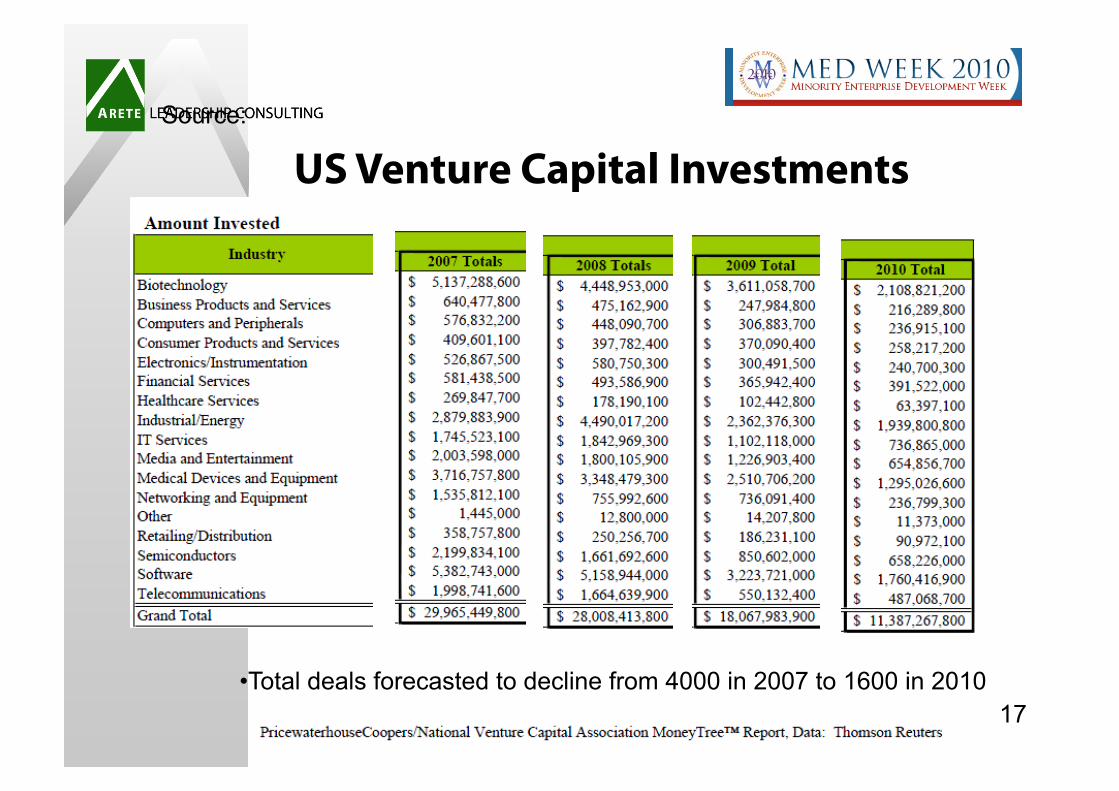
US Venture Capital Investments
• Total deals forecasted to decline from 4000 in 2007 to 1600 in 2010
Source:
17
18
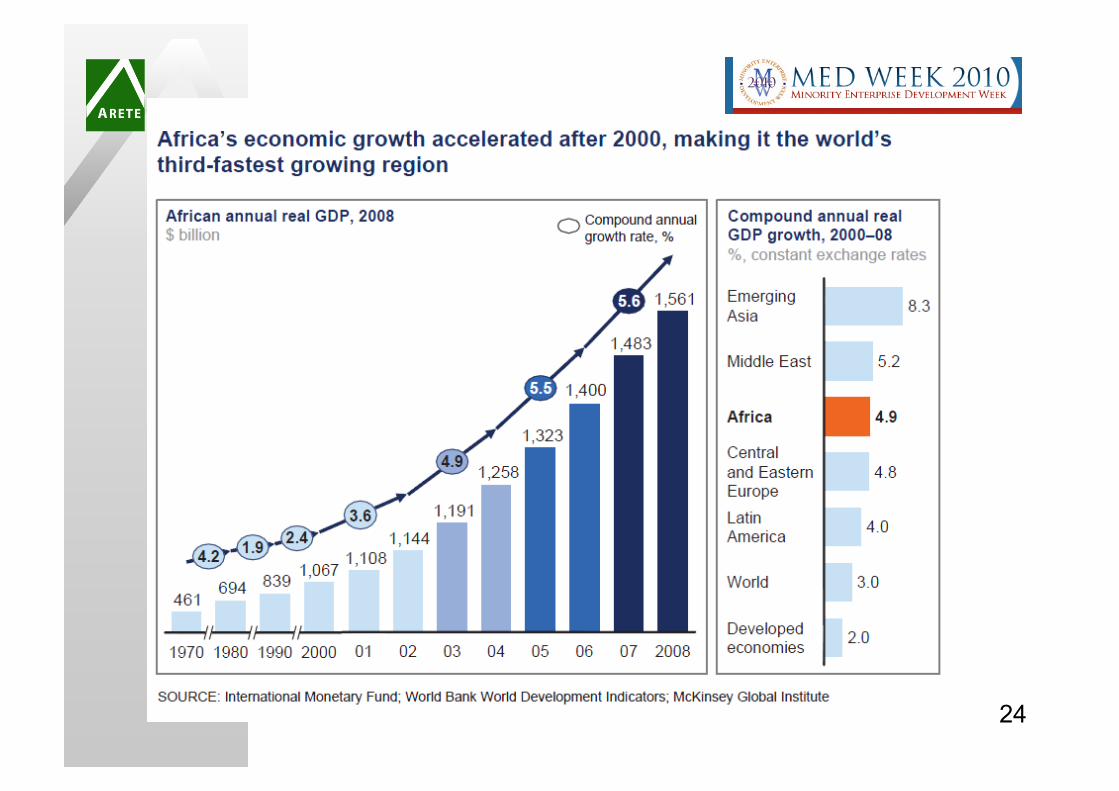
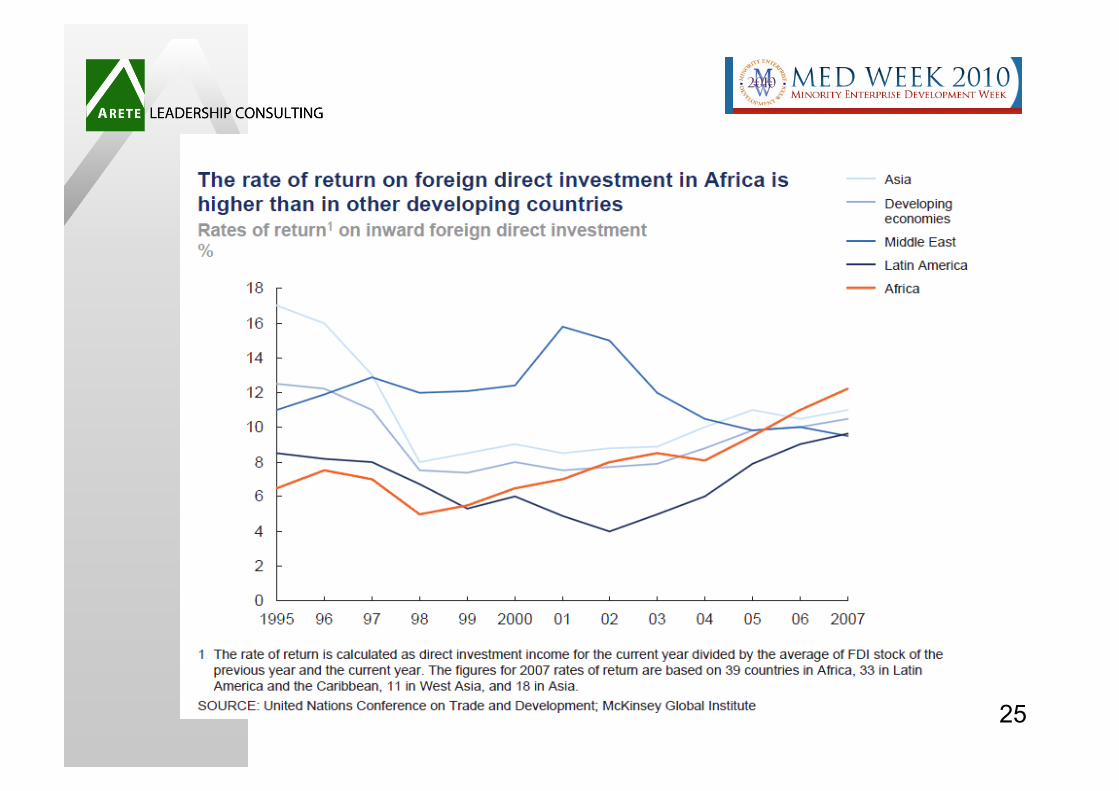
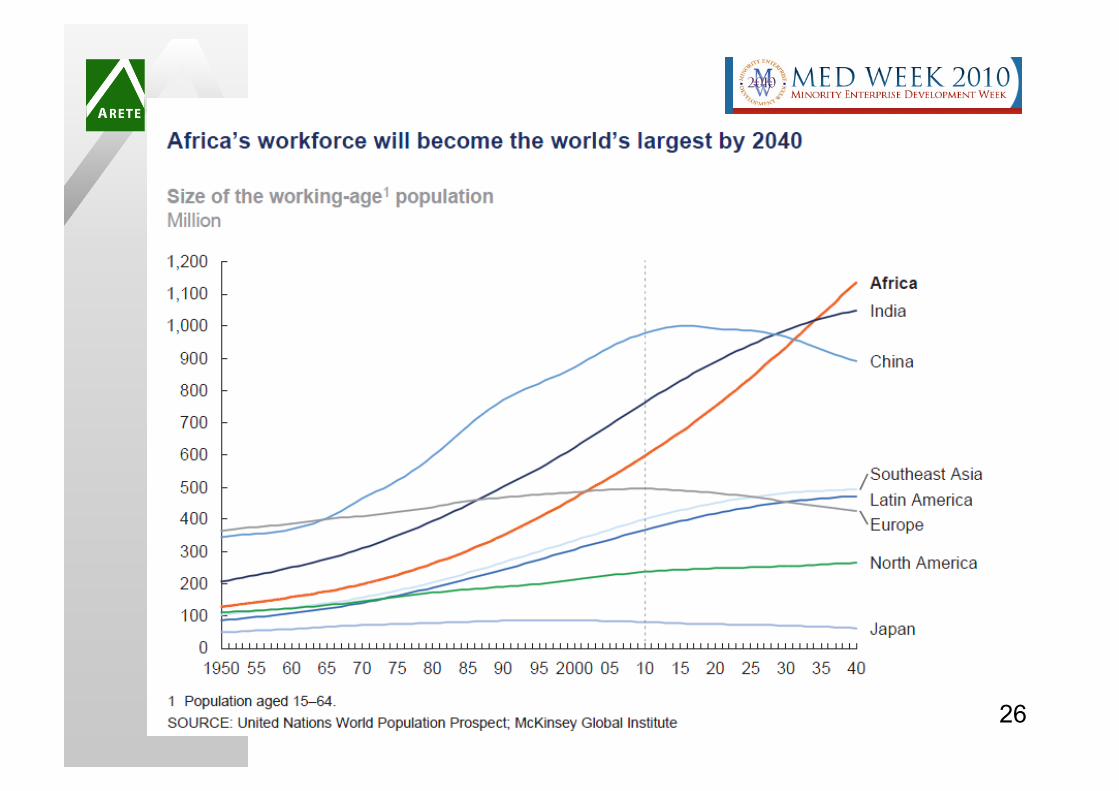
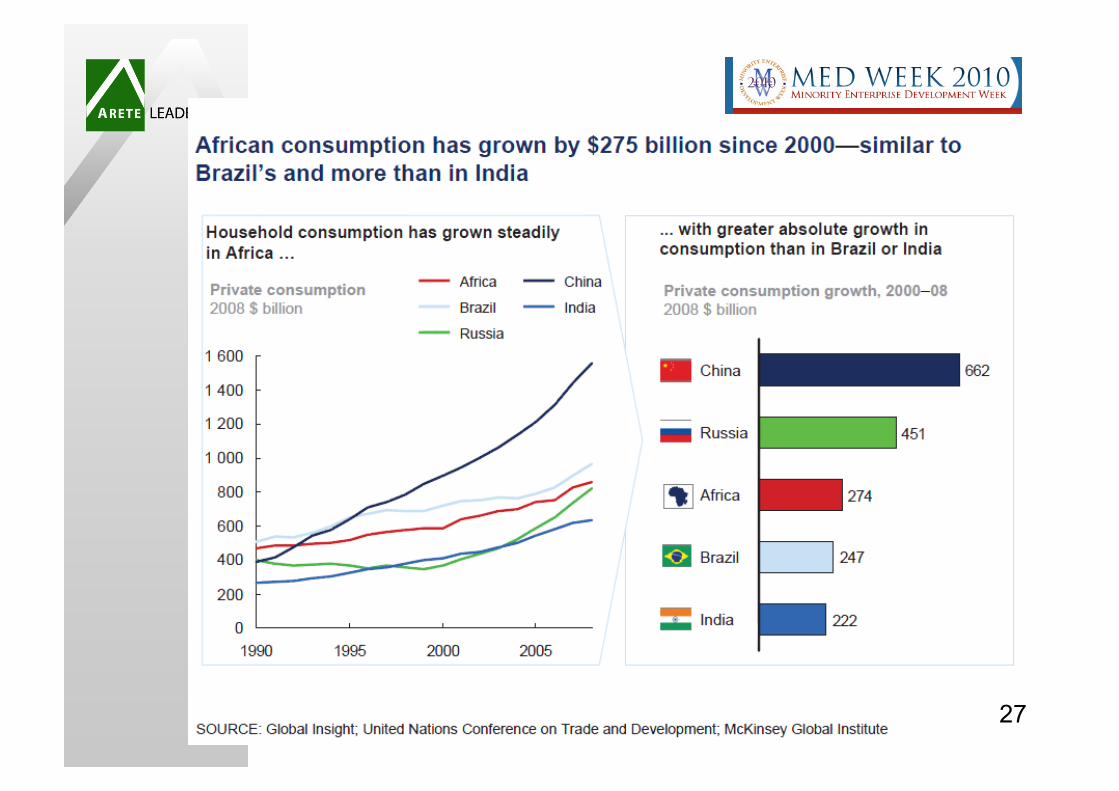
Africa – “The Lion Awakens” Section 5
19

20

21

22
23
24
25
26
27

Global Strategic Alliance Partnerships
Section 7
28
Arete Leadership Tools
Why Partner? • To Grow Revenues Faster
• To Lower Costs and Reduce Risks
• To Provide Greater Value to Customers
What should I focus on? • Joint Selling • Co-Branding • Technology Alignment • Joint Customer Solutions • Sell to Balance of Trade
Arete helps organizations create transformational visions of the future 29
Arete Business Partner Best Practices Marketing & Sales • Research • Messaging • Sales Support and Training • Target Account Planning • Performance Measurements
Product Solutions • Roadmap Alignment • Industry Solutions • Product Integrations • Innovation Investments • Sales Channel Offerings
Operations • Supply Chain Logistics • Manufacturing Efficiencies • Integrated IT Systems • Coordinated Service Support • TQM Practices
“Arete (Greek) in its basic sense, means goodness,
excellence or virtue of any kind. The Act of living up to
one’s full potential.”
30
TARGET MARKET DEFINITION
The ability to clearly define your target market impacts your sales success.
1. Demographics (the basic facts) 2. Psychographics (the “fit factors”) 3. Enabling Conditions (challenges, issues, problems,
goals, objectives, strategic imperatives)
31
Clarifying Your Value Proposition
Understanding how your customer benefits from using your product or service is essential in clarifying your value proposition. Use this worksheet to determine the value of your offering.
1. Establish the customer’s current situation. Without your product or service, how do your prospective customers do things today?
2. Define the problem or gaps with their current solution. What problems does your offering solve? What opportunities does this create?
3. Clarify the business implications. Explore the “ripple effect”. Find other areas in their company that are impacted by the above problems or gaps.
4. Determine the value of making a change. What’s the payoff from using your product, service or solutions? Tangible value? Intangible value? Opportunity costs?
32
Offering Assessment
• What are the primary benefits of your offering? • If an organization is not using your products services
or solutions, what problems are they likely encountering?
• If an organization doesn’t use your offering, what opportunities might they be missing out on?
• List the characteristics of those companies and countries whose current situation could be dramatically improved by your products or services.
33

Delivering Customer Value
PARTNER INPUTS
Joint Product Integrations
Co-Branding
Coordinated TQM Practices
Packaged Solutions
Cross Company Business Planning
Complementary Sales Channels
Diversity Supplier Value Chain 34
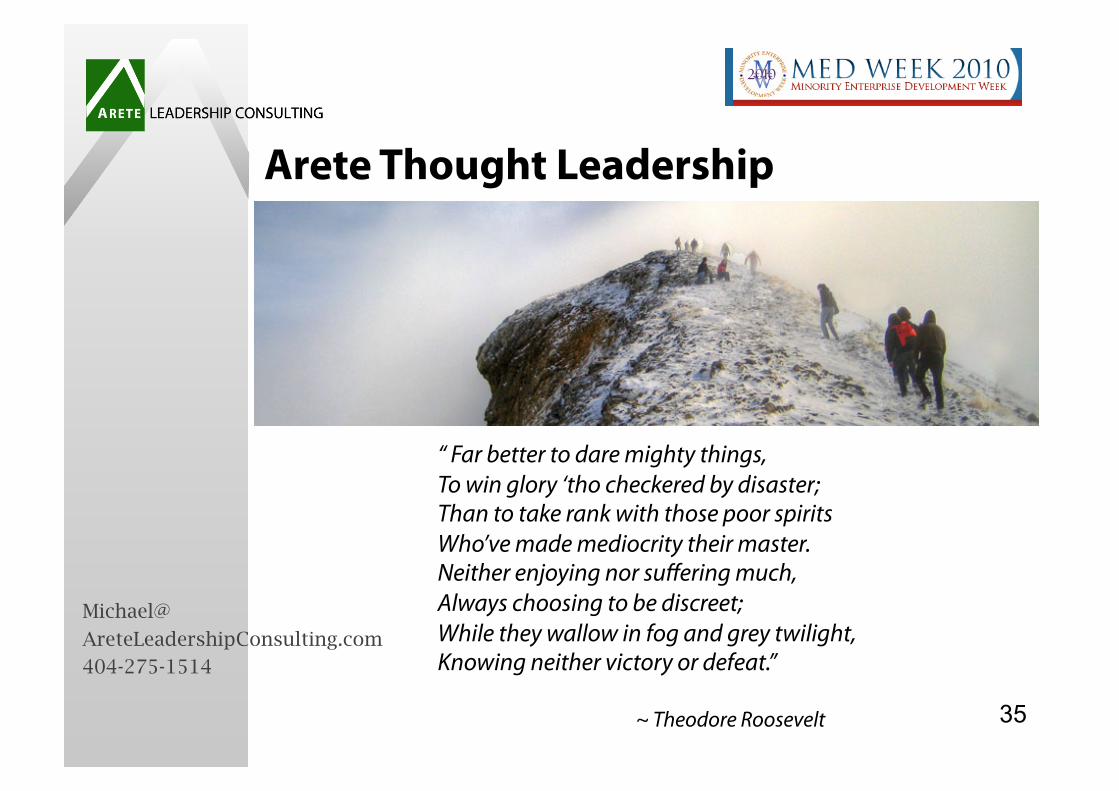
Arete Thought Leadership
“ Far better to dare mighty things, To win glory ‘tho checkered by disaster; Than to take rank with those poor spirits Who’ve made mediocrity their master. Neither enjoying nor suffering much, Always choosing to be discreet; While they wallow in fog and grey twilight, Knowing neither victory or defeat.” ~ Theodore Roosevelt 35
Michael@
AreteLeadershipConsulting.com
404-275-1514

Appendix
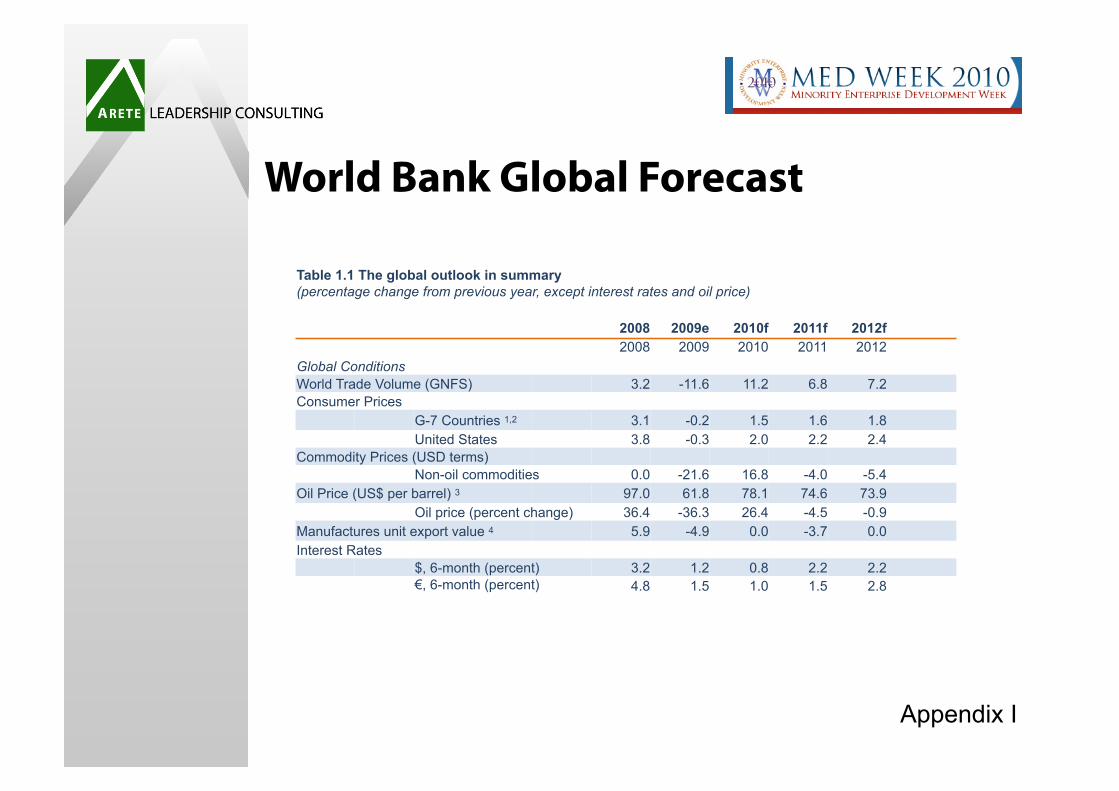
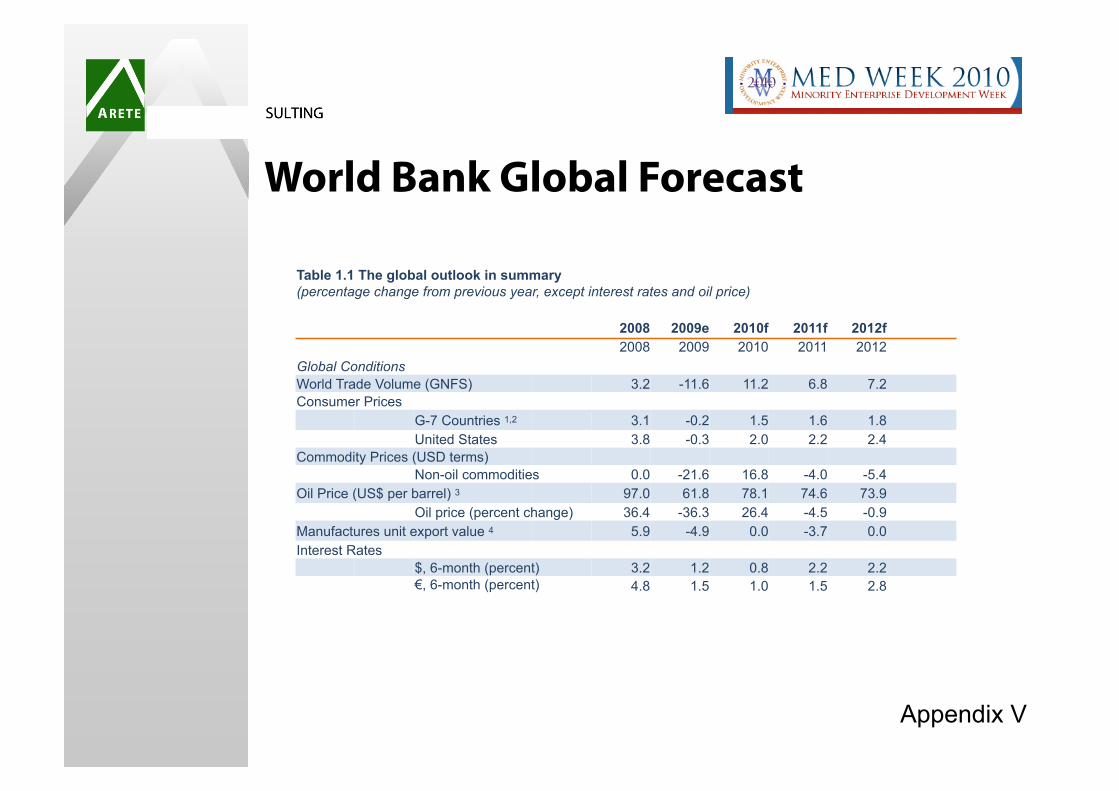
World Bank Global Forecast
Table 1.1 The global outlook in summary (percentage change from previous year, except interest rates and oil price) 2008 2009e 2010f 2011f 2012f 2008 2009 2010 2011 2012 Global Conditions World Trade Volume (GNFS) 3.2 -11.6 11.2 6.8 7.2 Consumer Prices G-7 Countries 1,2 3.1 -0.2 1.5 1.6 1.8 United States 3.8 -0.3 2.0 2.2 2.4 Commodity Prices (USD terms) Non-oil commodities 0.0 -21.6 16.8 -4.0 -5.4 Oil Price (US$ per barrel) 3 97.0 61.8 78.1 74.6 73.9 Oil price (percent change) 36.4 -36.3 26.4 -4.5 -0.9 Manufactures unit export value 4 5.9 -4.9 0.0 -3.7 0.0 Interest Rates $, 6-month (percent) 3.2 1.2 0.8 2.2 2.2 €, 6-month (percent) 4.8 1.5 1.0 1.5 2.8
Appendix I
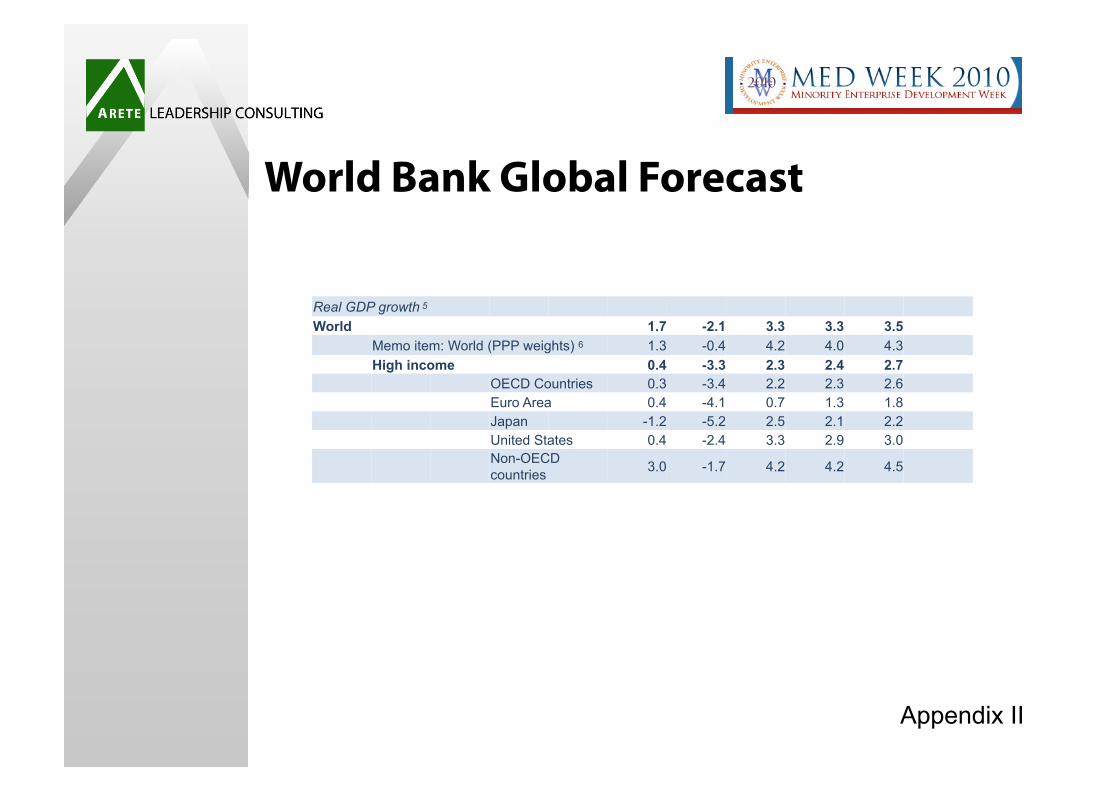
World Bank Global Forecast
Real GDP growth 5 World 1.7 -2.1 3.3 3.3 3.5 Memo item: World (PPP weights) 6 1.3 -0.4 4.2 4.0 4.3 High income 0.4 -3.3 2.3 2.4 2.7 OECD Countries 0.3 -3.4 2.2 2.3 2.6 Euro Area 0.4 -4.1 0.7 1.3 1.8 Japan -1.2 -5.2 2.5 2.1 2.2 United States 0.4 -2.4 3.3 2.9 3.0
Non-OECD countries 3.0 -1.7 4.2 4.2 4.5
Appendix II
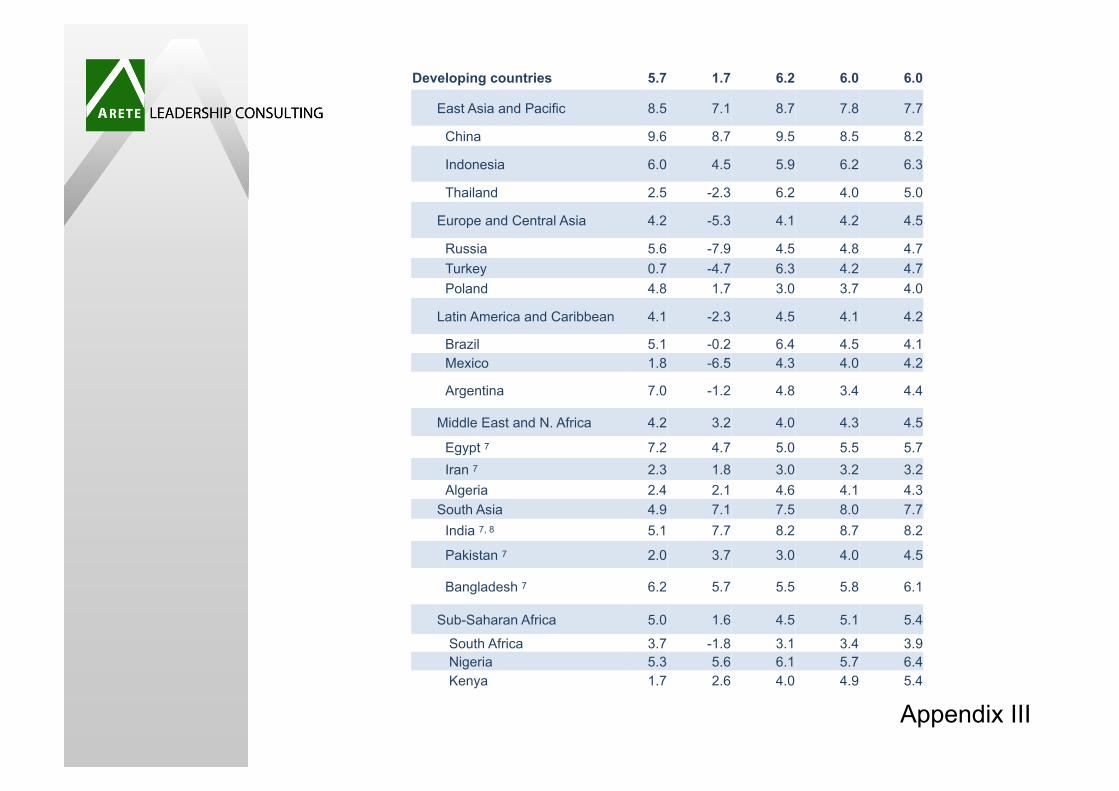
Developing countries 5.7 1.7 6.2 6.0 6.0
East Asia and Pacific 8.5 7.1 8.7 7.8 7.7
China 9.6 8.7 9.5 8.5 8.2
Indonesia 6.0 4.5 5.9 6.2 6.3
Thailand 2.5 -2.3 6.2 4.0 5.0
Europe and Central Asia 4.2 -5.3 4.1 4.2 4.5
Russia 5.6 -7.9 4.5 4.8 4.7 Turkey 0.7 -4.7 6.3 4.2 4.7 Poland 4.8 1.7 3.0 3.7 4.0
Latin America and Caribbean 4.1 -2.3 4.5 4.1 4.2
Brazil 5.1 -0.2 6.4 4.5 4.1 Mexico 1.8 -6.5 4.3 4.0 4.2
Argentina 7.0 -1.2 4.8 3.4 4.4
Middle East and N. Africa 4.2 3.2 4.0 4.3 4.5
Egypt 7 7.2 4.7 5.0 5.5 5.7 Iran 7 2.3 1.8 3.0 3.2 3.2 Algeria 2.4 2.1 4.6 4.1 4.3 South Asia 4.9 7.1 7.5 8.0 7.7 India 7, 8 5.1 7.7 8.2 8.7 8.2
Pakistan 7 2.0 3.7 3.0 4.0 4.5
Bangladesh 7 6.2 5.7 5.5 5.8 6.1
Sub-Saharan Africa 5.0 1.6 4.5 5.1 5.4
South Africa 3.7 -1.8 3.1 3.4 3.9 Nigeria 5.3 5.6 6.1 5.7 6.4 Kenya 1.7 2.6 4.0 4.9 5.4
Appendix III

World Bank Global Forecast
International capital flows to developing countries (% of GDP) Developing countries
Net private and official inflows 4.5 3.1
Net private inflows (equity + debt) 4.3 2.7 3.0 3.1 3.2
East Asia and Pacific 3.1 2.2 2.1 2.2 2.5
Europe and Central Asia 7.8 2.6 4.0 4.2 4.1
Latin America and Caribbean 4.0 3.0 3.5 3.2 3.3
Middle East and N. Africa 1.9 1.8 2.5 2.8 2.6
South Asia 3.6 3.9 3.4 3.2 3.4
Sub-Saharan Africa 3.0 4.0 3.6 3.8 4.2
Appendix IV
World Bank Global Forecast
Table 1.1 The global outlook in summary (percentage change from previous year, except interest rates and oil price) 2008 2009e 2010f 2011f 2012f 2008 2009 2010 2011 2012 Global Conditions World Trade Volume (GNFS) 3.2 -11.6 11.2 6.8 7.2 Consumer Prices G-7 Countries 1,2 3.1 -0.2 1.5 1.6 1.8 United States 3.8 -0.3 2.0 2.2 2.4 Commodity Prices (USD terms) Non-oil commodities 0.0 -21.6 16.8 -4.0 -5.4 Oil Price (US$ per barrel) 3 97.0 61.8 78.1 74.6 73.9 Oil price (percent change) 36.4 -36.3 26.4 -4.5 -0.9 Manufactures unit export value 4 5.9 -4.9 0.0 -3.7 0.0 Interest Rates $, 6-month (percent) 3.2 1.2 0.8 2.2 2.2 €, 6-month (percent) 4.8 1.5 1.0 1.5 2.8
Appendix V
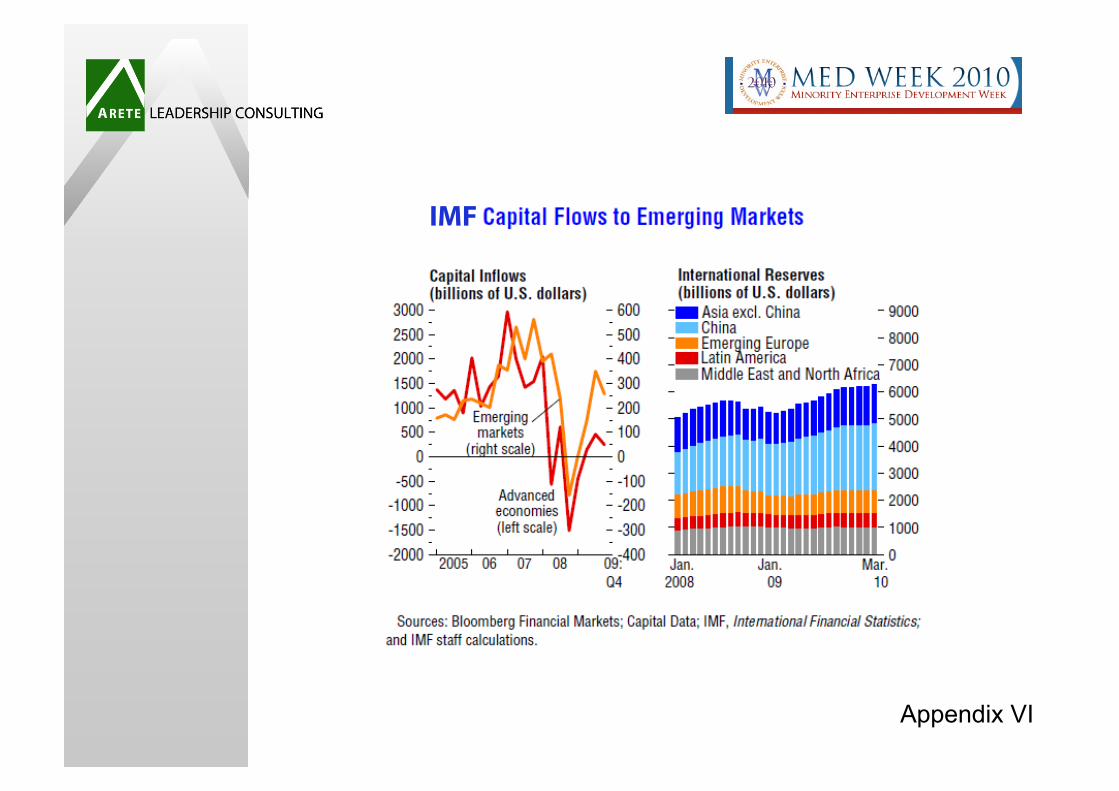
IMF
Appendix VI
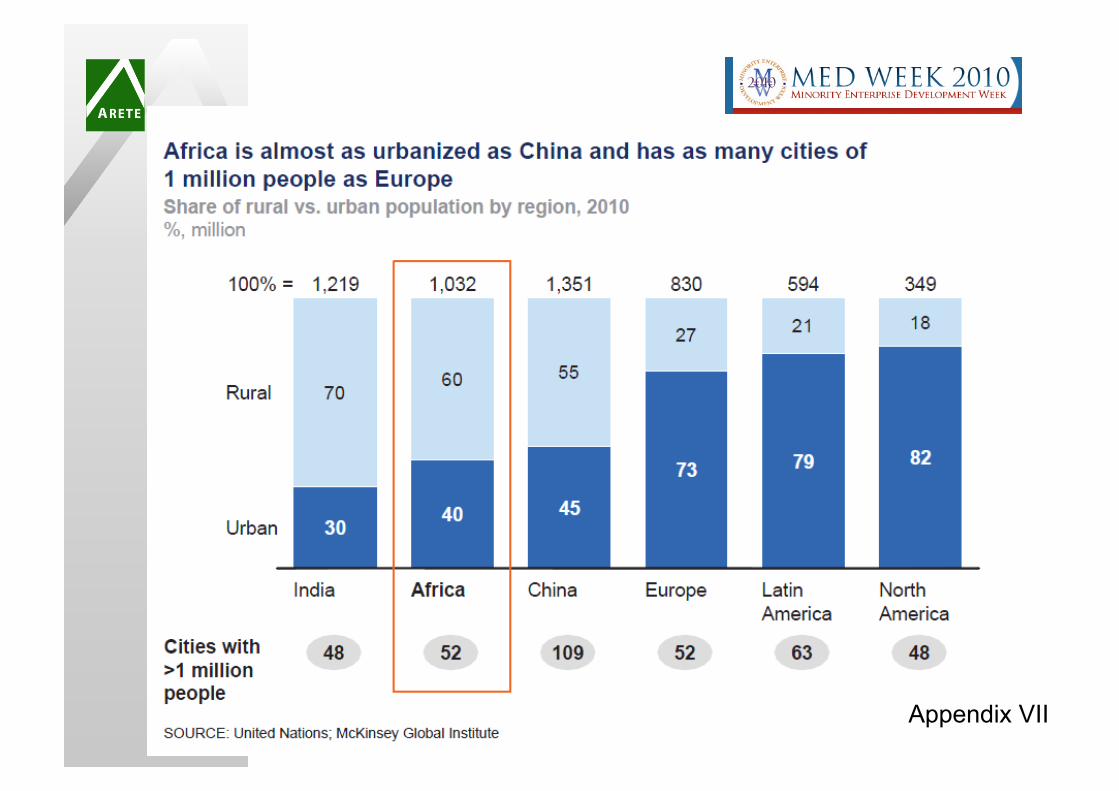
Appendix VII

Appendix VIII
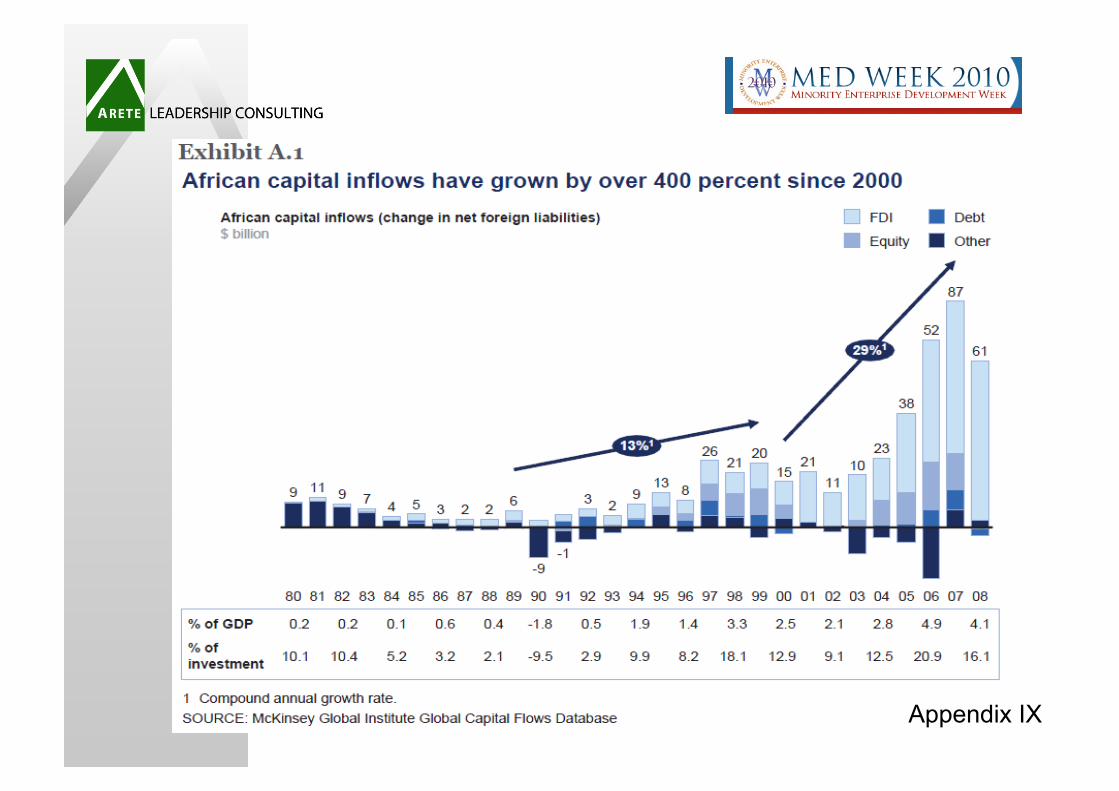
Appendix IX
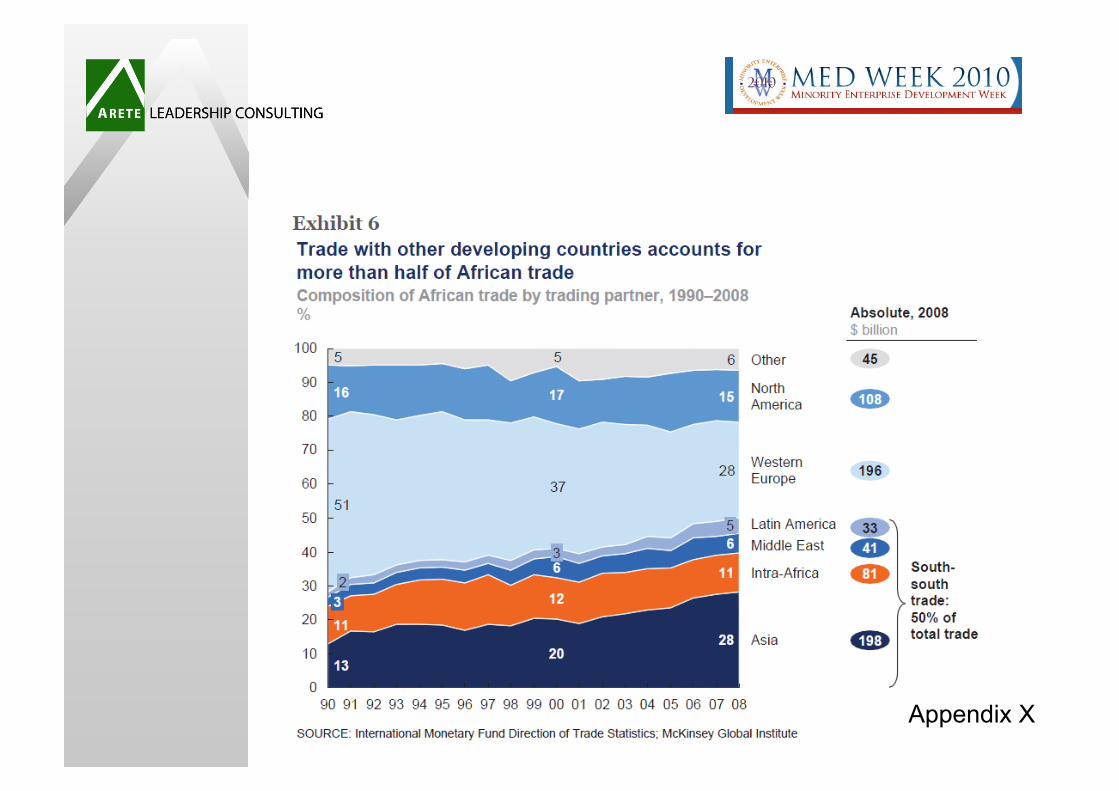
Appendix X

![Becoming Self-Sufficient - Arete Computer Consulting files/Becoming_Self-Sufficient[1].pdf · Becoming Self-Sufficient by Pandemic Flu Information Contributor “Dr Dave” Revised](https://static.cupdf.com/doc/110x72/5fb6cfb78f7f890677749bc3/becoming-self-sufficient-arete-computer-filesbecomingself-sufficient1pdf.jpg)