103 Soubir Das, Varun Asthana
International Journal of Engineering Technology Science and Research
IJETSR
www.ijetsr.com
ISSN 2394 – 3386
Volume 4, Issue 1
January 2017
Mechanical and Chemical Activation of Fly Ash for Drilling
Fluid Applications
Soubir Das
Assistant Professor, Department of Petroleum
Engineering, Chandigarh University, Mohali
(Punjab)-India
Varun Asthana
Well Engineer, Greka Drilling Ltd.A-401,
Bengal Shrishti Complex, Durgapur
(W.B.)-India
ABSTRACT
Oil and gas industry strives to be technologically
advanced, commercially/economically feasible &
profitable by adhering to standard industrial Health,
Safety and Environment (HSE) rules and regulations
thereby enforcing all its operational practice to conserve
environment. Drilling industry uses chemicals, polymers
or natural products to design drilling fluids for cleaning
the wellbore in drilling process. Basic effort is to find a
suitable replacement of bentonite in drilling fluid
additive. Fly ash- a byproduct of coal fired electric
power stations, is proposed to be one such replacements
to bentonite. It also supports its co-disposal with other
drilling waste materials. This paper focusses on
chemical, structural, and morphological changes in fly
ash properties with mechanical activation using high
energy planetary ball mill and chemical activation by
reaction with alkali at 80-110ºC. Mechanical activation
results in an increase in amorphous nature, specific
surface area and surface roughness, as evident by
analytical measurements using FT-IR, XRD and SEM-
EDX techniques. Characterization and chemical
activation of fly ash in terms of composition, mineralogy,
surface chemistry and reactivity is of fundamental
importance in the development of various applications of
fly ash in oil and gas industry. The chemical activation of
Fly ash performed by reaction with alkali, results in
increased cation-exchange capacity and leaching of
several metal ions from silico-aluminate skeleton. The
properties of fly ash at nano scale may be altered after
chemical and physical activation.
1. INTRODUCTION
Fly ash is an industrial by-product, generated during
the combustion of coal for energy production by
coal-fired steam power plants. With the growing
demand for energy, more and more ash is being
generated. In India 75% of electricity is generated
by coal based thermal power plants, according to
the data revealed in the table, provided by
Government of India 112 million tons of this kind
of waste is produced in India during 2005-06 of
which 4mt is released into the atmosphere (Janwal,
2003). Percentage ash utilization of the total ash
generated in different countries amounts to more
than 85% in west Germany, 100% in Denmark,
85% in France, 50% in UK, 45% in China and 38%
in India. Kalra et al. (1997) have reported that Fly
Ash production in India will exceed 140 million
tons by 2020. The rest has to be disposed of, with
the concomitant problems of space, risk of air
pollution, leaching and ensuing pollution of inland
and marine water (Carlson, 1993).
Country
Fly ash
production
(million tons per
year)
Fly ash
utilization
(%)
India 112 38
China 100 45
USA 75 65
Germany 40 85
UK 15 50
Australia 10 8
Canada 6 75
France 3 85
Denmark 2 100
Italy 2 100
Netherland 2 100
Source: http://www.tifac.org.in [accessed 26.07.08]
Because of the environmental problems presented
by the fly ash, considerable research has been
undertaken on the subject worldwide. This called

104 Soubir Das, Varun Asthana
International Journal of Engineering Technology Science and Research
IJETSR
www.ijetsr.com
ISSN 2394 – 3386
Volume 4, Issue 1
January 2017
for development of strategies to encourage and
establish technological concepts which will ensure
consumption of fly ash in bulk.
Micro and Nano technologies are emerging
technologies with the potential to meet above
challenges and effect revolutionary changes in
several aspects of the oil and gas industry, such as
exploration, drilling, production, enhanced oil
recovery, refining and distribution. Specifically,
advancements in nanotechnology have led to
development of significantly enhanced enabling
materials, tools, and devices with features and
characteristics that cannot be matched by
conventional technologies. Research and
development in nanotechnology has exploited the
unique combinations of mechanical, thermal,
electronic, optical, magnetic, and chemical
properties observed at the nano-length scale (Kong
and Ohadi, 2010).
The efficient utilization of Fly Ash (FA) needs
ultrafine grinding of coarser FA (called mechanical
activation of FA) for the enhancement of the
concrete performance. Rigorous studies have been
made to produce ultrafine FA particles by selecting
appropriate mill and milling parameters and the
details have been studied by Bouzoubaa et al., 1997;
Kumar and Kumar, 2004; Kumar et al., 2007; Paul
et al., 2007; Aydın et al., 2010; Li et al., 2010.
Usually, high energy milling by planetary ball mill,
vibratory mill with balls and rings, and attrition mill
was used for ultrafine grinding, which helps to
improve the bulk and surface properties of FA
without altering the overall chemistry of the FA
particles (Boldyrev, 2006). In general, crystalline
character reduces with the increase in milling time,
which enhances the surface activity of FA with the
formation of Si-OH functional group (Paul et al.,
2007). Though the mechanical activation of FA ash
through ultrafine grinding was studied in details by
several authors, but the time required to produce the
desired fineness of FA was significantly high and it
was in the tune of 2 h - 96 h (Bouzoubaa et al.,
1997; Paul et al., 2007; Aydın et al., 2010; Li et al.,
2010). The increased grinding time of coarser FA in
high energy mills depends not only on its crystalline
character (i.e., the presence of quartz, mullite and
hematite), but also influenced by the selection of
milling parameters. (Kurlov and Gusev, 2014).
In addition, a huge amount of electrical energy is
consumed in during operating of planetary ball mill
and it is difficult to make in large scale due to
mechanical difficulties. Therefore, it is important to
fix the optimum values of various milling
variables, such as the rotational speed of vial and
sun, ball loading, ball diameter and particle load to
minimize power requirement for efficient operation
at moderate scale. Mio et al (2004) determined the
critical rotation-to-revolution speed ratio of vial and
sun for effective grinding of gibbsite powder
sample. Patil and Anandhan (2015) studied wet
grinding of FA using laboratory scale planetary ball
mill and determined the influence of weight ratio of
balls to powder on crystallite size, particle size and
specific surface area. Planetary ball mill also
provides the uniform mixing during milling
followed by repeated deformation and fracture of
the particles during collision with the balls and
entrapment of particles between the inner walls of
the vial and the balls (Patil, Shanmugharaj,
Anandhan, 2015).
In last four decades, considerable amount of works
have done to predict the milling performance of ball
mill though detailed mathematical modeling and
simulation using population based
phenomenological grinding kinetic mathematical
model. Though the comprehensive studies have
been made by several investigators to determine the
critical mill speed and optimum power requirement
to operate planetary ball, but there is very limited
information available on mathematical modeling to
describe the milling simulation through particle
breakage kinetics using high energy planetary ball
mill, which will help immensely the scale-up
studies of planetary ball mill using laboratory or
pilot plant data. In addition, planetary ball milling
simulation will also help to improve the control and
the efficiency of milling operation in large scale
production with enhanced mechanical activation of
FA through the improvement of product quality. In
this regard, Bilgili et al (2006) carried out the nano-
milling of pigments agglomerate and investigated
breakage kinetics as well as mechanisms using size-
discrete population balance models, but this study
was applicable to laboratory scale stirred media mill
only.
Time variant mechanically activated FA was
evaluated by quantifying the bulk properties
(elemental analysis, particle size distribution, %
crystallinity, crystallite size, functionality, porosity,
conductivity) and surface properties (specific

105 Soubir Das, Varun Asthana
International Journal of Engineering Technology Science and Research
IJETSR
www.ijetsr.com
ISSN 2394 – 3386
Volume 4, Issue 1
January 2017
surface area, surface energy, morphology). The
phenomenological grinding kinetic mathematical
model derived from the population balance
considerations was employed to determine grinding
mechanism in nano size region. The specific rate of
breakage and primary breakage distribution
functions of FA were determined from laboratory
scale dry batch grinding data through
i. Direct evaluation of experimental batch grinding
data using single size fraction and
ii. Back-calculation method using time variant
product size distribution along with distributed feed
size (i.e., heterogeneous mixture of coarse-fine
feed) under fixed mill speed and FA/ball loading.
Breakage parameters were determined using simple
genetic algorithm (SGA) by minimizing the
normalized weighted sum-of-square errors between
the actual and model predicted computed values.
Breakage parameters determined from both the
techniques were compared to determine the
breakage mechanism of FA. Finally, specific power
consumption during milling was calculated and
compared with actual power consumption.
The properties of fly ash at nano scale may be
altered after chemical and physical activation.
Characterization and functionalization of fly ash in
terms of composition, mineralogy, surface
chemistry and reactivity is of fundamental
importance in the development of various
applications of fly ash in petroleum Industry.
2. EXPERIMENTAL WORK
Fly ash is a pozzolanic material and it is an
admixture of several mineral oxides (Henry et al.,
1999). Coal fired thermal power plants produces
huge amount of fly ash and generates world’s
largest quantity of industrial solid wastes, which
creates severe waste disposal problem and
recognized as an environmental pollutant. Usually,
the utilization of fly ash is determined by their
physical and chemical properties which include
fineness, particle size, particle size distribution,
specific surface area, particle shape, hardness,
freeze-thaw resistance, and activity in aqueous
suspension etc. Fly Ash sample for present study
has been collected form Bokaro Thermal Power
Station, Bokaro, India.
Presence of nanoparticles can have a marked effect
on the rheological properties of solutions. There is a
reduction in interfacial tension as a result of
nanoparticles presence at the interfacial layers. The
properties of functionalized nano fly ash may be
altered after chemical and physical activation.
Upon addition of the functionalized nanoparticles,
or going to the nanoscale size, the properties of the
base fluid such as density, viscosity, thermal
conductivity and specific heat can be tuned towards
the optimum levels (Zhang et al., 2005). Essentially,
nanoscale particles are suspended in the liquid
phase, such as oil, water, or conventional fluid
mixture, in low volumetric fractions. The
nanoparticles used in the design of such fluids are
preferably inorganic with properties of no
dissolution or aggregation in the liquid
environment. They can be designed to be
compatible with reservoir fluids and are
environmentally friendly.
In this study, fly ash will be analyzed first for the
elemental analysis. The mineral composition of fly
ash as oxides in weight percent will be estimated.
Virgin fly ash is usually composed of SiO2, Al2O3,
Fe2O3, CaO and TiO2. Morphological analysis of
fly ash using Scanning Electron Microscope (SEM)
has also been carried out.
The fly ash will then be subjected to float and sink
test to collect low specific gravity fly ash as a float,
which will then be micronized in a gyratory mill.
2.1. MECHANICAL ACTIVATION:
Mechanical activation of fly ash sample was carried
out through ultrafine grinding, using high energy
planetary ball mill (Pictor-EGOMA high energy
planetary ball mill). It consists a central disk (sun
disk) in which smaller diameter disks (vial) are
mounted containing the holding mechanics for the
milling breakers. Here, the number of vials are two,
lined with tungsten carbide having total (V) 1000
cm3 capacity and the fraction of the mill volume
filled with media at rest (J) is 33%. The fraction of
the volume filled by fly ash (U) is 3 Austin et al.,
(1976 and 1984) and Yildirim et al., (1999).
Rotational speed of vial is controlled by the speed
of sun. The critical speed of vial was calculated
according to Watanable (1999) and operating speed
of vial was maintained at 70% of the critical speed.
For given J, V and U, optimum speed of vial was
found to be 130 rpm and corresponding to this vial
speed, sun speed was found to be 32 rpm.

106 Soubir Das, Varun Asthana
International Journal of Engineering Technology Science and Research
IJETSR
www.ijetsr.com
ISSN 2394 – 3386
Volume 4, Issue 1
January 2017
Mill was stopped at regular interval of time and
grinded FA was analyzed for characterization. In
addition, grinded FA was undergone through sieve
analysis to know the particle size distribution at
given interval of grinding time.
After obtaining nano-sized fly ash, it will be
subjected for chemical treatment for
functionalization. Functionalization will have to be
carried out in such a way that it will give the similar
properties of bentonite (montmorillonite) with
negatively charged tetrahedral-octahedral-
tetrahedral (T-O-T) platelets. As fly ash particles
are spherical in nature (instead of platelets
structures of bentonite) with oxides of silicon and
aluminum in the surface, it is possible to
functionalize to generate negative functional groups
at the fly ash surface. For this, chemical having
zwitterions characteristics may solve this purpose.
After successful functionalization, bonding between
reactive functional groups and silica will be
confirmed by Fourier Transformed Infra-Red
(FTIR) analyzer. Cation-exchange capacity of the
functionalized fly ash will be determined by the
standard methylene blue test.
Therefore, to use fly ash for drilling fluid
applications efficiently, following methodology will
be adopted:
I. Elemental and morphological analysis of fly
ash, which is collected from a coal fired
thermal plant.
II. Classification of fly ash into small and
narrow distribution for enhanced grinding.
III. Grinding of washed and dried float in a
gyratory mill to produce nano- scale fly ash
particles.
IV. Particle size distribution, elemental and
morphological analysis of grinded fly ash.
V. Mathematical model for the determination of
breakage kinetics of fly ash particle after
nano-grinding.
VI. Functionalization of nano-fly ash with
suitable reactants to generate active sites on
fly ash surface, which is similar or better
surface properties as compared to the API
bentonite (montmorillonite).
VII. Estimation of reactive functional groups and
surface properties of the functionalized nano-
fly ash particles.
VIII. Determination of adsorption kinetics of
functional groups onto nano fly ash.
IX. Rheological studies of the functionalized
nano-fly ash in aqueous suspension.
2.1.1. BATCH GRINDING MODEL
Among the various approaches developed to model
and analyze the batch grinding processes,
continuous-time and size-discretized population
balance model (PBM) involving specific rate of
breakage (S) and primary breakage distribution
function (b), proposed by Reid (1965), was used in
the present study to fit the sieve analysis data in
nano-sized region. The equations describing batch
grinding kinetics for well mixed grinding operation
are given by
(dm1 (t))/dt=-S1m1(t);for uppermost seive (i.e.,i=1)
with maximum particle size (1a)
dm1 t
dt= −S1m1 t ; for uppermost seive i. e. , i =
1 with maximum particle size(1a)
dm i t
dt= −Simi t bi,jSjmj t i−1
j=1 ; for 2 ≤ i ≤ n
(1b)
dmn +1 t
dt= bn+1,jSjmj t n
j=1 ; for pan i. e. , i =
n+1 with minimum particle size(1c)where,bi,j =
Bi,j – Bi+1,j, n > 𝑖 > 𝑗 (1d)bn+1,j = Bn,j, j = n(1e)
Eq. 1a is a linear time variant material balance
equation for the uppermost sieve, whereas Eqs. 1b
and 1c are the linear time variant integral-
differential material balance equation for the sieves
other than uppermost sieve and pan, respectively.
Eq. 1d represents individual breakage function of
next to uppermost sieve to penultimate sieve and
Eq. 1e represents individual breakage function of
last sieve. In above equation, Si is the specific rate
of breakage of particles with fraction of materials
with ith size particles that have been broken in time
interval t and t+dt, whereas bi,j is size-discretized
primary breakage distribution function of particles
with fraction of materials with jth particle size that
have been broken in time interval t and t+dt and
reported to size interval i. Above equation is a
powerful means of data analysis of the grinded
products with varying particle sizes in term of finite
size interval by sieve analysis with the assumption
that particle breakage follows linear kinetic model
i.e., the specific rate of breakage and the primary
breakage distribution functions are independent of
the size of the particles present in the mill.

107 Soubir Das, Varun Asthana
International Journal of Engineering Technology Science and Research
IJETSR
www.ijetsr.com
ISSN 2394 – 3386
Volume 4, Issue 1
January 2017
2.1.1.1. Estimation of breakage parameters by
direct experimental method
To determine the specific rate of breakage (Si) and
the primary breakage distribution function (bi,j),
direct experimental method is employed for a given
fixed size class of FA (for example, xi) that has
been grinded in planetary ball mill. The grinded
materials were then analyzed by sieve analysis to
determine the mass fraction in the uppermost sieve
(i.e., i = 1) and other than uppermost sieves (i.e., 2 ≤
i ≤ n+1) with time. The time variant size fraction
data in different sieves is very useful to determine
both Si and bi,j.
2.1.1.2. Estimation of specific rate of breakage
(Si)
Usually, particle breakage rate follows first order
breakage kinetics and Si is independent of time,
which is determined from the slope of the following
integral form of Eq. 1a, i.e.,
ln m1 t = ln m1 0 − S1t (2)
The specific breakage-rate for different size of
particles (i.e., Si) was determined experimentally by
grinding ith size particle (i.e., xi) and measuring the
fraction of ith size particle retained in the
uppermost screen with time [i.e., m1(t)]. For the
fixed milling environment (i.e., fixed mill diameter,
mill speed, ball diameter, ball loading and FA
particle hold-up), the value of Si increases with size,
but it passes through a maximum and thereby falls
rapidly for the particles with larger sizes. Austin et
al. (1984b) correlated the variation of Si with
particle size (xi) by the following empirical
equation:
Si = A x i
x0
α 1
1+ xiμ
λ (3)
Where, x0 = standard reference size; xi = the size of
the uppermost ith screen, which differs when
different size class material was used for grinding;
A, α and µ = material and milling condition
dependent constants and λ = a positive index,
representing the fall of Si value with the increase in
particle size (xi). The second part of Eq. 3
represents the deviation from the straight line and
this value is closer to unity for the grinding of
smaller size particles, whereas it approaches to zero
for very large particles which will be broken easily
by the grinding media.
Our main aim to get the nano fly ash by grinding
with planetary ball mill and the expression for the
specific breakage-rate for different size of particles
(i.e., Si) in our case is;
Si = A x i
x0
α
(4)
From the Eq.4 it is quite clear that on further
increasing in grinding time the size will reduce.
2.1.1.3. Estimation of the primary breakage
distribution function (bi,j)
The breakage function represents the distribution of
products in all ith screens with size xi (i.e., below
the uppermost screen) resulting from the breakage
of uniformly sized materials from the uppermost
screen with size xj. This function is frequently used
in the form of cumulative function, i.e.,Bi,j =
bk,jik=n ,, which is the cumulative weight fraction
of material broken products with size xi resulting
from the uppermost screen with size xj. The
breakage distribution function in cumulative form
was expressed by Austin and Luckie (1972), which
is given by L.G. Austin, P.T. Luckie, Powder
Technol. 5
Bi,j = φ x i
x j+1
γ
+ 1 − φ x i
x j+1
β
; n ≥ i > 𝑗
(5a)
Bi,j = 1; i ≤ j (5b)
Where, φ, γ and β are constants and depend on the
characteristic of the material.
Therefore, the bi,jvalues can be obtained knowing
the cumulative breakage function and expressed by
the following form, i.e.,
bi,j = Bi,j−Bi+1,j (5c)
Where, Bn+1,j = 0 and bn,j = Bn,j
To evaluate constants in Eq. 4a (i.e., φ, γ and β), the
values of Bi,j were obtained from screen analysis
data using BII method of Austin and Luckie (1972).
The Bi,1 was obtained by the following equation:
Bi,1 =log 1−Pi 0 1−P i t
log 1−P2 0 1−P2 t ; i > 1 (6)
where, Pi(t) is the fraction of material accumulated
in the sieve less than upper size interval of size i at
time t.
Similarly, Bi,2(i> 2), Bi,3 (i> 3)…. were obtained
using formula similar to Eq. (5).
The mathematical model for the batch grinding of
FA is presented by Eqs. 1a-1c, and it is expressed

108 Soubir Das, Varun Asthana
International Journal of Engineering Technology Science and Research
IJETSR
www.ijetsr.com
ISSN 2394 – 3386
Volume 4, Issue 1
January 2017
by the following ordinary differential equations
(ODEs) involving state and decision variables,
which is written as
dy
dt= f y, u ; y t = 0 = y0 (7)
where, y is the state variable vector given by
y = m1, m2 , m3 ,… , mn+1 T (8)
and u is the decision variable vector, which is
related to grinding-rate (Si) and grinding function
(bi,j).
ODEs in Eqs. 1a-1c constitute an initial value
problem (IVP), which is integrated for any given
values of Si.
2.1.2. FT-IR SPECTROSCOPY
STUDIES:
In this present study, average percent amorphous
character was considered as 90.0%. Fourier
Transform Infrared Spectrometer (FTIR) is
frequently used for quantitative estimation of
reaction products (SreenandanandGuria 2012). Fly
ash, grinded with High Energy Planetary Ball Mill
(Pictor-EGOMA) and samples were taken with
different grinding time. These samples were
monitored using FTIR (Model: Perkin Elmer
Spectrum two) by recording the strong absorbance
peak of asymmetrical stretching vibration of Si-O-
Si group at -1044cm-1 (Dwivedi et al., 2012).
Typical FTIR spectral data were obtained under
following scanning conditions during spectral
analysis:
I. Wave Number: 4000-400cm-1
II. Resolution : 4cm-1
III. Number of scans: 64
IV. Scan speed : 0.63
V. Detector: Ge coated KBr pellet. The sample
chamber was purged with dried nitrogen at 120 cm3
s-1flow rates before analysis. Typical FTIR
spectrum of silica in virgin fly ash is shown in
experimental section.
2.1.3. MORPHOLOGICAL STUDIES:
The shape, size, surface structure of virgin ground
and fly ash were studied using the Scanning
Electron Microscopy (SEM) Method.
Morphological analysis of virgin fly ash was
performed using SEM (Model: FESEM-Carl Zeiss,
Supra-55 VP and SDD X MAX 50 EDS, UK).
Energy Dispersive X-ray spectroscope (EDX)
analysis using SEM was also carried out for
elemental analysis of fly ash. The figure shows the
SEM images of virgin as well as ground fly ash.
The virgin fly ash samples are mostly spherical in
shape and have diameter of 10μm approx. The
morphology of fly ash depends upon combustion
temperature and cooling rate. At the time of
combustion the inorganic materials in fly ash
become fluid-like whereas they get solidified after.
The operating temperature in the furnace often
exceeds 1400˚C in the pulverized coal fired boilers.
The minerals present in the coal may oxidize,
decompose, fuse, disintegrate, or agglomerate at
this high temperature, which result in different
morphologies to the generated fly ash. Irregular
shaped, unburnt, larger carbon particles may have
also been seen along with spherically shaped solids.
Due to the inter-particle fusion during rapid cooling
agglomerated spheres and irregularly shaped
amorphous particles can also be detected.
2.1.4. X-RAY DIFFRACTION
STUDIES:
The characterization of fly ash sample was carried
out using XRD (Bruker D8 Focus) and XRD of fly
ash was taken in a wide range of the Bragg angle 2θ
(10˚≤2θ≤80˚) with Cu-Kα radiation (λ=1.54Ȧ) at a
slow scanning rate of 0.5/min (Kishi and Toraya,
2004).
2.2. CHEMICAL ACTIVATION:
2.2.1. CATION EXCHANGE CAPACITY:
The total amount of cations adsorbed expressed as a
mill equivalent per hundred grams of dry clay is
called the Base Exchange Capacity or Cation
Exchange Capacity (CEC).
The cation exchange capacity of clay and the
cations present in the clay at exchangeable positions
are most important as they can lead to good
colloidal activities for clay. Here we can consider
fly ash as a substituent for clay (montmorillonite). It
has a high cation exchange capacity, swells greatly,
and form viscous suspensions at low concentration
of clay particularly when sodium isin exchangeable
position.
2.2.1.1. METHYLENE BLUE TEST:
The amount of Montmorillonite present in the
drilling fluid can be determined by the Methylene
Blue Test (MBT). This test describes that the
amount of methylene blue die adsorbed by the clays
which intern is a function of their Cation Exchange
Capacity (CEC). Among all the clays

109 Soubir Das, Varun Asthana
International Journal of Engineering Technology Science and Research
IJETSR
www.ijetsr.com
ISSN 2394 – 3386
Volume 4, Issue 1
January 2017
montmorillonite has the highest cation exchange
capacity as this test can be carried out to determine
the amount of montmorillonite in a particular type
of Drilling Fluid. Here in this project fly ash is used
as the substitute of the clay material.
The Methylene Blue Capacity can be denoted by the
number of cm3of methylene blue solution
(0.01meq/cm3) added per cm
3 of mud.
The methylene blue capacity of a drilling fluid is an
indication of the amount of reactive clays (bentonite
or drilled solids) present as determined by the
methylene blue test (MBT). The methylene blue
capacity gives an estimate of the total cation
exchange capacity (CEC) of the solids in the
drilling fluid. The methylene blue capacity and the
cation exchange capacity are not necessarily
equivalent, with the methylene blue capacity
normally being somewhat less than the actual cation
exchange capacity. Methylene blue solution is
added to a sample of drilling fluid which has been
treated with hydrogen peroxide and acidified until
saturation is noted by the formation of a “ring”
around a drop of solids placed on filter paper.
Drilling fluids frequently contain substances in
addition to reactive clays that also absorb methylene
blue dye. Pre-treatment with hydrogen peroxide
removes these effects from organic materials such
as lignosulfonates, lignites, cellulosic polymers and
polyacrylates, etc.
2.2.1.1.1. EQUIPMENT AND
MATERIALS:
a. Red Knob for Bleeder Valve
b. 12.5 cm Filter Paper; Whatman Grade 1
c. Glass Graduated Cylinder; 50 mL × 1 mL
d. Glass-Tip Syringe; 2cc
e. Glass Pipet; 1 mL × 1/100 mL
f. Glass Pipet; 10 mL × 1/10 mL
g. Pipet Aid; Safety Bulb
h. 250 mL Erlenmeyer Flask
i. Hot Plate; 230V
j. 6" Glass Stirring Rod; Qty: 2
k. Methylene Blue Solution; 1 mL - 0.01 ME; 16
oz.; 500 mL
l. Hydrogen Peroxide; 3%; 8 oz.; 250 mL
m. Deionized Water; 8 oz.; 250 mL
n. Sulfuric Acid; 5N; 8 oz.; 250 mL
o. Fly Ash Sample
2.2.1.1.2. PROCEDURE:
1. With the syringe, 2.0 mL of fly ash solution was
added to the erlenmeyer flask. Air or gas
entrained in the solution must be removed prior
to injection. Vigorously stir the fly ash solution
to avoid the effect of suspended particles and
quickly draw the fly ash solution into the
syringe. Then slowly discharge the syringe back
into the fly ash solution keeping the tip
submerged. Again draw the solution into the
syringe and deliver exactly 2.0 mL of fluid to
the flask. If less than 2.0 mL or more than 10.0
mL of methylene blue solution will be required,
the volume of fly ash solution sample may be
increased or decreased to a more convenient
size.
2. 10 mL of deionized water was then added to the
erlenmeyer flask.
3. 15 mL of 3% hydrogen peroxide was added to
the flask.
4. 0.5 mL of 5N sulfuric acid was then added to
the mixture.
5. Using the hot plate, solution was boiled gently
for 10 minutes. It was not allowed to boil to
dryness.
6. The mixture was diluted to about 50 mL using
deionized water.
7. Methylene blue solution was added to the flask
in increments of 0.5 mL. After each addition of
methylene blue solution swirl the contents of
the flask for about 30 seconds. If the
approximate amount of methylene blue dye was
known from previous testing, then larger
increments may be used at the beginning of the
procedure.
8. While the solids were still suspended, one drop
of liquid was collected with the stirring rod and
placed as a drop on the filter paper. The initial
end point of the titration was reached when the
dye appears as a blue turquoise ring
surrounding the dyed solids.
9. When the blue tint halo spreading from the spot
wass detected, the flask was shaken for an
additional 2 minutes and another drop was
placed on the filter paper. If the blue ring is
again evident, the final endpoint had been
reached.

110 Soubir Das, Varun Asthana
International Journal of Engineering Technology Science and Research
IJETSR
www.ijetsr.com
ISSN 2394 – 3386
Volume 4, Issue 1
January 2017
10. If the blue ring does not appear, then continue
as before until a drop taken after 2 minutes
shows the blue tint halo.
3. RESULT AND DISCUSSION
3.1 Determination of breakage parameters
by direct experimental method
3.1.1 Grinding rate function
Figure 1: First-order plot for batch dry grinding
of feed 60⨯100 mesh of fly ash
Grindin
g
Time(m
in)
Size Of Mesh
60/
100
100/
150
150/
200
200/
400
400/
600
0 1 1 1 1 1
10 0.1653 0.35 0.46 0.65 0.67032
20 0.0273
2 0.07 0.09 0.38 0.44933
30 0.0045
2 0.016 0.032 0.23 0.30119
40 0.08 0.2019
50 0.057 0.13534
Table 1: Data of size of mesh with diffrent
grinding time
The first-order grinding relation for the loss of
weight from the first size interval is
𝑤1 𝑡1 = 𝑤1(0)𝑒−𝑠1𝑡 (9)
As screening of blank sample (without grinding),
there is always a small passing through smaller
screen. In the present case, about 3% of the mass
fraction is passed through the 100 mesh sieve when
60⨯100 mesh size fly ash is subjected to sieving
and the value of 𝑤1(0), in the example , 0.97 and a
plot of 𝑤1(𝑡) on a log scale versus t on a linear
scale will be a straight line which is shown in the
above Figure (4). A data which is found from the
grinding of feed fly ash of size 60⨯100 with
different grinding time is first plotted as 𝑤1(𝑡) on a
log scale versus t on a linear scale and a straight line
drawn through the points which is shown above in
Figure (1).
Extrapolation back t=0 gives the value of𝑤1(0).
This value is always less than 1 due to sieving error.
From the first-order grinding relation and with the
help of Figure (4), one can determine the value of
specific rate of breakage (Si). From the
experimental data of specific rate of breakage (Si), a
log-log plot is generated with respective sieve size
xi.
Figure 2: Specific rate of breakage of ore in
ASTM standard sieve
Table 2: Data for comparison of Specific rate of
breakage with different particle size
Particle Size
(Xi)
Specific Rate of Breakage(Si)
Experimental Model
(Austin)
150 0.18 0.153617
106 0.14 0.115316
75 0.12 0.086654
20 0.06 0.029083
5 0.04 0.009254
As the grinding time increases fly ash went finer
and finer and due to which the general equation of
specific rate of breakage i.e., Eq. (3) becomes
Si = A x i
x0
α
(10)
0.001
0.01
0.1
1
10
0 10 20 30 40 50 60
Wei
ght f
ract
ion
of fe
ed le
ft u
nbro
ken
W(t
)/W
(0)
Time of grinding (min)
60X100
100X150
150X200
200X400
400X600

111 Soubir Das, Varun Asthana
International Journal of Engineering Technology Science and Research
IJETSR
www.ijetsr.com
ISSN 2394 – 3386
Volume 4, Issue 1
January 2017
Where, xi is the upper size of the screen interval
indexed by i and Aand α are the model parameters
that depend on the properties of the material and the
grinding conditions. From the above equation, the
fitted values were A= 0.120min-1
, α= 0.956.
From Eq.(6) the primary breakage distribution
values were first estimated than results were fitted
to the Eq. 5(a). The values were fitted in a plot for
breakage distribution parameter as in shown in
Figure 6. The values of φ =0.25, γ =0.265625 and β
=2.46782 represent the characteristic of fly ash.
Figure 3: Cumulative primary breakage distribution
calculated from short time 60⨯100, dry grinding
Table 3: Experimental Data in Comparison with
Austin Model
Dimensionless
Size(Xi/Xj)
Fraction less then size (Bi,j)
Model Experimental
1 1 1
0.706667 0.546358367 0.583532
0.5 0.343532668 0.349092
0.253333 0.1989195 0.184185
0.133333 0.151581625 0.159591
3.2 FT-IR Spectroscopy Analysis:
Figure 4: FT-IR Spectroscopy Studies Of Virgin
and Grinded Fly Ash
Figure 7 shows the FTIR spectra of fresh i.e. virgin
and ball milled (Milled by high energy planetary
ball mill) fly ash. The peak at 1043cm-1
corresponds
to Si-O-Si stretching and vibration. The Crystalline
phase in fly ash, i.e. Quartz (SiO2) is expected to
break down during the milling process. This is
evidenced by decreasing peak intensity with respect
to increasing the milling time. The peak at 3448cm-1
was insignificant in case of virgin fly ash where has
to be taken into account for ground fly ash. This
peak denotes the presence of Silanol (Si-OH)
functional group in the fly ash sample as grinding
time increases. The peak intensity at this
wavenumber increases with increase in milling
time, which describes the breaking of quartz
structure and formation of Silanol (Si-OH) groups.
This is the evidence of change in surface properties
of fly ash during the progress of milling operations.
3.3 Scanning Electron Microscopy (SEM) &
Energy Dispersive X-ray spectroscope (EDX)
Analysis
As the Figure 8 shows in SEM analysis, it has been
seen that the particle size decreases as the grinding
time increases.
Figure 5 (a): SEM Analysis of Virgin Fly Ash
Figure 5 (b): Grinded Fly Ash after 30 min
0.1
1
0.1 1
Frac
tion
Less
Tha
n Si
ze, B
i,j
Dimensionless Size, Xi/Xj
Bi,j(experimental)
Bi,j(Austin model)
0
0.2
0.4
0.6
0.8
1
1.2
2007001200170022002700320037004200
Ab
sorb
an
ce (A
.U.)
Wave number (cm-1)
0 min
30 min
60 min
90 min
120 min
150 min
3448
1043

112 Soubir Das, Varun Asthana
International Journal of Engineering Technology Science and Research
IJETSR
www.ijetsr.com
ISSN 2394 – 3386
Volume 4, Issue 1
January 2017
Figure 5 (c): Grinded Fly Ash after 60 min
Figure 5 (d): Grinded Fly Ash after 90 min
Figure 5 (e): Grinded Fly Ash after 120 min
Figure 5 (f): Grinded Fly Ash after 150 min
Table 4: EDX analysis of grinded fly ash
Meth
od
Composition (weight %)
Time
min
Mg
O
Al2O3 SiO2 K2O CaO TiO2 Fe2O3
SEM
-
EDX
0 0.71 29.27 54.93 1.68 0.53 2.88 10
30 0.67 28.6 56.41 1.42 0.5 2.6 9.8
60 0.55 27.95 56.43 1.48 0.66 2 8
90 0.51 27.89 59.04 1.52 0.43 2.05 5.29
120 0.51 26.89 61 1.65 0.52 2.22 6.51
150 0.41 26.98 61.97 1.53 0.52 2.3 5.69
The variation of the fly ash constituents with
different milling time is shown in the table. It is
important to see that the percentage of alumina
decreases as the percentage of silica increases with
the increase in milling time.TiO2 percentage
decreases up to the milling time of 60min as an
increase can be seen afterwards significantly.
3.4 X-RAY Diffraction Studies
A typical XRD spectrum of virgin and grinded fly
ash sample is shown in the Figure 9, 10.
Figure 6: Compositional X-ray Diffractogram of
Fly Ash
0
5000
10000
15000
20000
25000
30000
35000
40000
0 10 20 30 40 50 60 70 80 90 100
In
ten
sity (
A.U
)
2 θ (˚)
M Mullite
Q Quartz
H Heamatite
Ca Calcite
M
Q
Q
CaM MQ
M
QQCa HM
113 Soubir Das, Varun Asthana
International Journal of Engineering Technology Science and Research
IJETSR
www.ijetsr.com
ISSN 2394 – 3386
Volume 4, Issue 1
January 2017
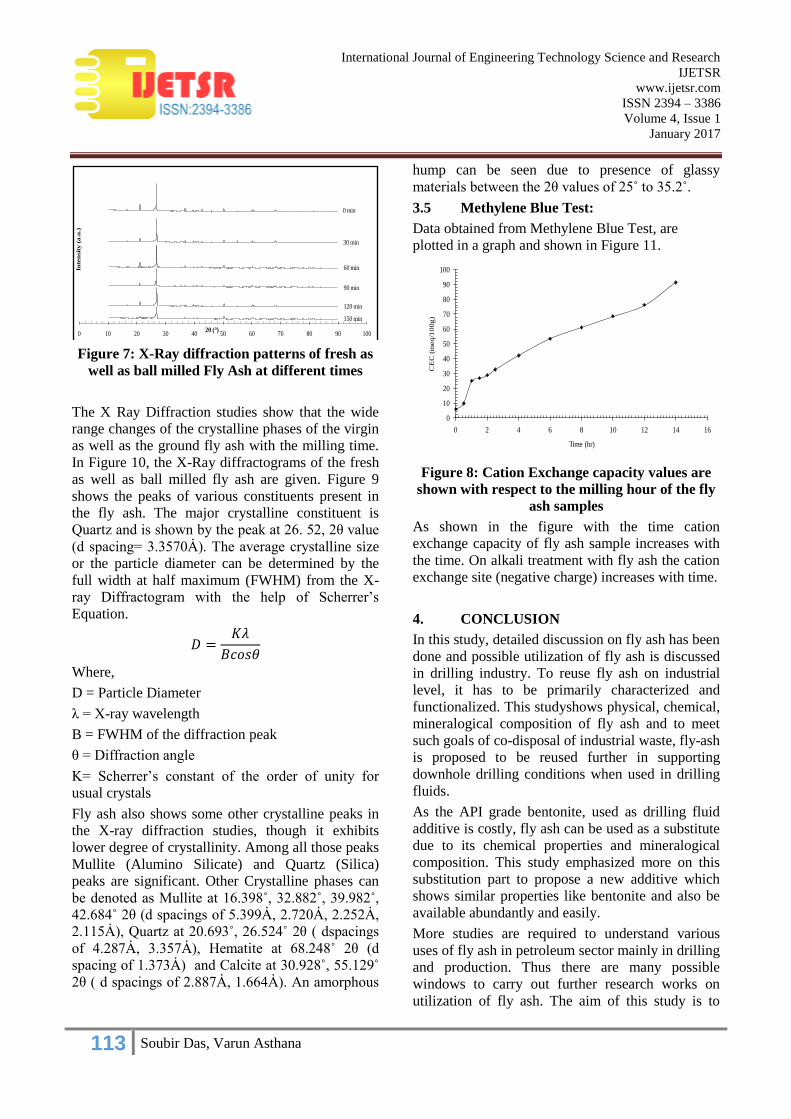
Figure 7: X-Ray diffraction patterns of fresh as
well as ball milled Fly Ash at different times
The X Ray Diffraction studies show that the wide
range changes of the crystalline phases of the virgin
as well as the ground fly ash with the milling time.
In Figure 10, the X-Ray diffractograms of the fresh
as well as ball milled fly ash are given. Figure 9
shows the peaks of various constituents present in
the fly ash. The major crystalline constituent is
Quartz and is shown by the peak at 26. 52, 2θ value
(d spacing= 3.3570Ȧ). The average crystalline size
or the particle diameter can be determined by the
full width at half maximum (FWHM) from the X-
ray Diffractogram with the help of Scherrer’s
Equation.
𝐷 =𝐾𝜆
𝐵𝑐𝑜𝑠𝜃
Where,
D = Particle Diameter
λ = X-ray wavelength
B = FWHM of the diffraction peak
θ = Diffraction angle
K= Scherrer’s constant of the order of unity for
usual crystals
Fly ash also shows some other crystalline peaks in
the X-ray diffraction studies, though it exhibits
lower degree of crystallinity. Among all those peaks
Mullite (Alumino Silicate) and Quartz (Silica)
peaks are significant. Other Crystalline phases can
be denoted as Mullite at 16.398˚, 32.882˚, 39.982˚,
42.684˚ 2θ (d spacings of 5.399Ȧ, 2.720Ȧ, 2.252Ȧ,
2.115Ȧ), Quartz at 20.693˚, 26.524˚ 2θ ( dspacings
of 4.287Ȧ, 3.357Ȧ), Hematite at 68.248˚ 2θ (d
spacing of 1.373Ȧ) and Calcite at 30.928˚, 55.129˚
2θ ( d spacings of 2.887Ȧ, 1.664Ȧ). An amorphous
hump can be seen due to presence of glassy
materials between the 2θ values of 25˚ to 35.2˚.
3.5 Methylene Blue Test:
Data obtained from Methylene Blue Test, are
plotted in a graph and shown in Figure 11.
Figure 8: Cation Exchange capacity values are
shown with respect to the milling hour of the fly
ash samples
As shown in the figure with the time cation
exchange capacity of fly ash sample increases with
the time. On alkali treatment with fly ash the cation
exchange site (negative charge) increases with time.
4. CONCLUSION
In this study, detailed discussion on fly ash has been
done and possible utilization of fly ash is discussed
in drilling industry. To reuse fly ash on industrial
level, it has to be primarily characterized and
functionalized. This studyshows physical, chemical,
mineralogical composition of fly ash and to meet
such goals of co-disposal of industrial waste, fly-ash
is proposed to be reused further in supporting
downhole drilling conditions when used in drilling
fluids.
As the API grade bentonite, used as drilling fluid
additive is costly, fly ash can be used as a substitute
due to its chemical properties and mineralogical
composition. This study emphasized more on this
substitution part to propose a new additive which
shows similar properties like bentonite and also be
available abundantly and easily.
More studies are required to understand various
uses of fly ash in petroleum sector mainly in drilling
and production. Thus there are many possible
windows to carry out further research works on
utilization of fly ash. The aim of this study is to
0 10 20 30 40 50 60 70 80 90 100
In
ten
sit
y (
a.u
.)
2θ ( )
0 min
30 min
60 min
90 min
120 min
150 min
0
10
20
30
40
50
60
70
80
90
100
0 2 4 6 8 10 12 14 16C
EC
(m
eq/1
00
g)
Time (hr)

114 Soubir Das, Varun Asthana
International Journal of Engineering Technology Science and Research
IJETSR
www.ijetsr.com
ISSN 2394 – 3386
Volume 4, Issue 1
January 2017
provide a little help to proceed with further research
work on this topic.
5. ACKNOWLEDGMENTS
We are very grateful to Dr. Chandan Guria,
Associate Professor, Department Of Petroleum
Engineering, IIT(ISM) Dhanbad, Dilip Kumar
Rajak, SRF, Department Of Petroleum Engineering,
IIT (ISM) Dhanbad for all their guidance and
support. We are also thankful to the Department Of
Petroleum Engineering, IIT(ISM), Dhanbad.
6. REFERENCES 1. Kumar ,S., Kumar, R., 2011. Mechanical activation
of fly ash: Effect on reaction, structure and
properties of resulting geopolymer.Ceram. Int. 37,
533-541.
2. Kurlov, A.S.,Gusev, A.I., 2014. High-energy
milling of nonstoichiometric carbides: Effect of
nonstoichiometry on particle size of nanopowders.J.
Alloys Compd.582, 108-118.
3. Conner, Jesse R., Hoeffner, Steve, L., 1998. A
Critical Review of Stabilization/ Solidification
Technology. Environ. Sci. Technol. 28(4), 397-462.
4. Datta, A., Rajamani, R. K., 2002. A direct approach
of modeling batch grinding in ball mills using
population balance principles and impact energy
distribution. Int. J. Miner. Process. 64, 181- 200.
5. Tangsathitkulchai,C.,2002. Acceleration of particle
breakage rates in wet batch ball milling. Powder
Technol. 124, 67-75.
6. Gon,i,S.,Guerrero,A., Luxa´n, M.P.,Macı´as, A.,
2003. Activation of the fly ash pozzolanic reaction
by hydrothermal conditions. Cem. Concr. Res. 33,
1399-1405.
7. Mangialardi, T. 2003. Disposal of MSWI fly ash
through a combined
8. washing-immobilisation process. J. Hazard. Mater.
B98, 225-240.
9. Fuerstenau, D.W., Abouzeid, A.Z.M ,Phatak,P.B.,
2010. Effect of particulate environment on the
kinetics and energetics of dry ball milling. Int. J.
Miner. Process.97, 52-58.
10. Sakthivel, R., Jayasankar, K., Das, S.K., Das, B.,
Mishra, B.K. 2011. Effect of planetary ball milling
on phase transformation of a silica-rich iron ore.
Powder Technol. 208, 747-751.
11. Langana, B.W.,Weng, K.,Warda, M.A. 2002. Effect
of silica fume and fly ash on heat of hydration of
Portland cement. Cem. Concr. Res. 32,1045-1051.
12. Mio, H., Kano, J.,Saito ,F., Kaneko,K., 2002. Effects
of rotational direction and rotation-to-revolution
speed ratio in planetary ball milling. Mat. Sci. Eng.
A332, 75-80.
13. Capece, M., Bilgili,E., Dave,R., 2011. Identification
of the breakage rate and distribution parameters in a
non-linear population balance model for batch
milling. Powder Technol. 208, 195-204.
14. Chindaprasirt, P., Homwuttiwong, S.,
Sirivivatnanon,V., 2004. Influence of fly ash
fineness on strength, drying shrinkage and sulfate
resistance of blended cement mortar. Cem. Concr.
Res.34, 1087-1092.
15. Patil, A.G., Anandhan,S., 2015. Influence of
planetary ball milling parameters on the mechano-
chemical activation of fly ash. Powder Technol.281,
151-158.
16. Boldyrev, VV., 2006. Mechanochemistry and
mechanical activation of solids. Russ. Chem. Rev.
75(3), 177-189.
17. Bilgili, E., Scarlett, B., 2005. Population balance
modeling of non-linear effects in milling processes.
Powder Technol. 153, 59-71.
18. Paul, K.T., Satpathy, S.K., Manna, I., Chakraborty,
K.K., Nando, G.B., 2007. Preparation and
Characterization of Nano structured Materials from
Fly Ash: A Waste from Thermal Power Stations, by
High Energy Ball Milling. Nanoscale Res Lett. 2,
397-404.
19. Burmeister, C.F., Kwade, A., 2013. Process
engineering with planetary ball mills. Chem. Soc.
Rev.
20. Li, G., 2004. Properties of high-volume fly ash
concrete incorporating nano-SiO2. Cem. Concr. Res.
34, 1043-1049.
21. Kumar, R., Kumar, S., Mehrotra,S.P., 2007.
Towards sustainable solutions for fly ash through
mechanical activation. Resources, Conservation and
Recycling. 52, 157-179.
22. Sreenandhan, J., Guria, C., 2011. Rapid Monitoring
of Bis-phenol A Diglycidyle Ether formation trough
by-product estimation- A study by Fourier
Transform Infra-Red Spectroscopy.
willyonlinelibrary.com.
23. Chancey, R.T., Stutzman, P., Juenger, M.C.G.,
Fowler, D.W., 2010. Comprehensive phase
characterization of crystalline and amorphous phases
of a Class F fly ash. Cem. Concr. Res. 40, 146-156.
24. Gomesa, S., Françoisa, M., Abdelmoulab, M.,
Refaitb, Ph., Pellissierc,C., Evrarda,O., 1999.
Characterization of magnetite in silico-aluminous fly
ash by SEM, TEM, XRD, magnetic susceptibility,
and Mössbauer spectroscopy. Cem. Concr. Res. 29,
1705-17011.
25. Ferna´ndez-Jimeneza, A., de la Torreb, A.G.,
Palomoa, A., Lo ´pez-Olmob, G., Alonsoa, M.M.,
Aranda, M.A.G., 2006. Quantitative determination

115 Soubir Das, Varun Asthana
International Journal of Engineering Technology Science and Research
IJETSR
www.ijetsr.com
ISSN 2394 – 3386
Volume 4, Issue 1
January 2017
of phases in the alkali activation of fly ash. Part I.
Potential ash reactivity. Fuel. 85, 625-634.
26. Ward,C.R.,French,D., 2006. Determination of glass
content and estimation of glass composition in fly
ash using quantitative X-ray diffractometry. Fuel.
85, 2268-2277.
27. Matsunaga,T., Kim,J.K.,Hardcastle,S., Rohatgi
,P.K., 2002. Crystallinity and selected properties of
fly ash particles. Mat. Sci. Eng.A. A325, 333-343.
28. Henmi.T., 1987. Increase in Cation Exchange
capacity of coal fly ash by alkali treatment. Clay
Science. 6, 277-282.
29. Singer,A.,Berkgaut, V., 1995. Cation Exchange
Properties of Hydrothermally Treated Coal Fly Ash.
Environ. Sci. Techno. 29, 1748-1753.
30. Hang, P.T., Brindley, G.W., 1970. Methelene Blue
absorption by clay minerals. Determination of
Surface Areas and Cation Exchange Capacity (Clay-
Organic Studies XVIII). Clay and Clay Minerals.18,
203-212.
31. Foner,H.A., Robl,T.L. James, Hower,C.,Graham,
U.M., 1999. Characterization of fly ash from Israel
with reference to its possible utilization. Fuel. 78,
215-223.
32. Sarkar,A.,Ranoa,R., Mishra,K.K.,Sinha,I.N. 2005.
Particle size distribution profile of some Indian fly
ash-a comparative study to assess their possible uses.
Fuel Process. Technol. 86, 1221-1238.
33. Yildirim,K.,Cho,H.,Austin,L.G., 1999. The
modeling of dry grinding of quartz in tumbling
media mills. Powder Technol. 105, 210-221.
34. Austin, L.G., Lukie, P.T., 1972. Methods for
determination of breakage distribution parameters.
Powder Technol. 5, 215-222.
35. Austin, L.G., Julianeli, K., de Souza, A.S.,
Schneider, C.L. 2007. Simulation of wet ball milling
of iron ore at Carajas, Brazil. Int. J. Miner. Process.
84, 157-171.
7. AUTHOR INFORMATION
Corresponding Author: Mr. Soubir Das
Note: The author declare no competing financial
interest.