Measuring the Impact of Lean Techniques onPerformance Indicators in Logistics Operations
Zur Erlangung des akademischen Grades eines
Doktors der Ingenieurwissenschaften
der Fakultät für Maschinenbau
des Karlsruher Instituts für Technologie (KIT)
genehmigte
Dissertation
von
Dipl.-Wirt.-Ing. Payam Dehdari
Tag der mündlichen Prüfung: 11.06.2013Hauptreferent: Prof. Dr.-Ing. K. FurmansKoreferentin: Prof. Dr.-Ing. B. Deml


Vorwort
Die vorliegende Arbeit entstand während meiner Tätigkeit als Pro-jektleiter in der Zentralstelle Logistik bei der Robert Bosch GmbH.Ich möchte mich an dieser Stelle bei allen Personen bedanken, diezum Gelingen dieser Arbeit beigetragen haben.Herrn Prof. Dr.-Ing. Kai Furmans, Leiter des Instituts für Förder-technik und Logistiksysteme, gilt mein besonderer Dank für dieÜbernahme des Hauptreferats sowie für die Unterstützung meinerTätigkeit als externer Doktorand. Der Begriff “scharfes Nachdenken”hat erst durch seine Fragen an Bedeutung für mich gewonnen undsomit eine erfolgreiche Promotion ermöglicht.Frau Prof. Dr.-Ing. Barbara Deml danke ich für die Übernahme desKorreferats und Herrn Prof. Dr. Robert Stieglitz danke ich für dieÜbernahme des Prüfungsvorsitzes.Mein herzlicher Dank gilt den Hunderten von beteiligten Personender Studie Warehouse Excellence. Ohne deren harte Arbeit in denLogistikzentren wäre die Basis dieser Arbeit nie gegeben gewesen.Außerdem möchte ich insbesondere Herrn Dr. Karl Nowak als Men-tor von Warehouse Excellence danken. Bei Herrn Dr. Wlcek be-danke ich mich ausdrücklich für seine Rolle als Treiber des Projektesund für das mir entgegen gebrachte große Vertrauen. Herrn Dr.-Ing.Beha bin ich für sein Coaching dankbar. Erst dadurch füllte sich dasWort Lean für mich mit Inhalt. Melanie Schwab und Dr.-Ing. Chris-tian Huber bin ich für die endlosen Diskussionen und die Korrekturdes Manuskripts dankbar. Verena Pluhar, Stefan Keiber, PatrikSpalt, Martin Kreuser, Darian Achenbach, Marius Oehms, LauraAulmann, David Geissler und Alexander Lingen, die Ihre Abschluss-arbeit im Rahmen von Warehouse Excellence geschrieben oder alswissenschaftliche Hilfskraft tätig waren, gilt mein besonderer Dank.
i

Ohne deren Arbeit wäre Warehouse Excellence nicht das, was esheute ist.Mein tiefster Dank gilt meiner Familie, die in dieser Welt verteilt istund ohne deren Liebe all das nicht möglich wäre.Zuletzt möchte ich mich aufrichtig bei allen meinen Freunden, Bekann-ten und meiner Familie für die letzte Jahre entschuldigen, wo es ofthieß: “Sorry, ich kann nicht mit ich muss an meiner Diss arbeiten.”Das hat mich am meisten geprägt, denn ich hatte vergessen, waswichtig ist.
Stuttgart, Mai 2013 Payam Dehdari
ii
KurzfassungPayam Dehdari
Messung des Einflusses von LeanTechniken auf Leistungskennzahlen inLogistikzentren
Die Wurzeln von Lean Techniken reichen über 50 Jahre zurück undbefinden sich in den Produktionssystemen der japanischen Automo-bilindustrie. Mehrere umfassende und tiefgreifende Studien bestäti-gen den positiven Einfluss von Lean Techniken auf Leistungskenn-zahlen im Produktionsumfeld. Studien im Lagerumfeld beleuchtenden Zusammenhang hingegen nur unzureichend. Somit besteht zurzeiteine Lücke zwischen den Erkenntnisstand des Einfluss von LeanTechniken auf Leistungskennzahlen im Produktionsumfeld verglichenzum Lagerumfeld.Das Ziel dieser Arbeit ist es dazu beizutragen, die erwähnte Lückezu schließen. Dies soll Entscheider dazu motivieren und dabei un-terstützen, Lean Techniken im Lagerumfeld zu etablieren.Damit dies erreicht wird, wurde vom Jahresende 2010 bis zum Jahre-sanfang 2012 eine Studie mit 16 Lägern in einer Beobachtungs-gruppe und 56 Lägern in einer Kontrollgruppe durchgeführt. Einintensives Befähigungsprogram sicherte ab, dass die Beobachtungs-gruppe Lean Techniken in ihrer Führungskultur, kontinuierlichenVerbesserungsarbeit und operativen Prozessen etablierte.Die Qualität der Umsetzung wurde mit Hilfe eines Lean Lager-assessments, das im Rahmen dieser Arbeit entwickelt wurde, be-
iii
Kurzfassung
wertet. Dieses Lean Lagerassessment basiert auf einer neuen Gener-ation von Assessments, die im Produktionsumfeld genutzt werden.Der Lean Reifegrad aller teilnehmenden Läger wurde anhand desLean Lagerassessments vor und nach dem Projekt aufgenommen.Zusätzlich wurden Leistungskennzahlen vom Jahresanfang 2010 biszum Jahresende 2011 ermittelt.Die Messergebnisse des Lean Reifegrads und die erhobenen Leis-tungskennzahlen wurden mithilfe deskriptiver Statistik verglichenund mit nichtparametrischen zwei Stichprobentests analysiert. DasErgebnis war eine hohe signifikante positive Entwicklung der Leis-tungskennzahlen und des Lean Reifegrads der Beobachtungsgruppe.Daraus wird abgeleitet, dass der Lean Reifegrad eine positive Wirkungauf Leistungskennzahlen hat. Ein genauer mathematischer Zusam-menhang konnte nicht ermittelt werden. Weiterhin wurde beobachtet,dass die Beobachtungsgruppe eine im Vergleich zur Kontrollgruppestärkere Entwicklung des Lean Reifegrads und der Leistungskenn-zahlen aufweist.Dieses Ergebnis trägt dazu bei, die Lücke zwischen dem Erkennt-nisstand über die Wirkung von Lean Techniken auf Leistungskenn-zahlen im Produktionsumfeld zum Lagerumfeld zu schließen. Ent-scheider sind dadurch aufgefordert, sich auf die Etablierung von LeanTechniken im Lagerumfeld zu konzentrieren. Denn eine entschei-dende positive Entwicklung des Lean Reifegrads, die sich positiv aufLeistungskennzahlen wirkt, ist in einem Zeitraum von einem Jahrmöglich.
iv

AbstractPayam Dehdari
Measuring the Impact of LeanTechniques on Performance Indicators inLogistics Operations
The roots of lean techniques date back 50 years to the productionsystems of the Japanese automotive production industry. Severalin-depth studies have verified the positive impact of lean techniqueson performance indicators in production environments. Studies per-formed on warehouse environments have only partially confirmedthis. Up until now, there has been more evidence supporting thepositive impact of lean techniques on performance indicators in pro-duction environments than in warehouse environments.The purpose of this thesis is to help close the gap between the dis-parities in the level of evidence mentioned above. Closing this gapshould cause decision makers to support the implementation of leantechniques in the warehouse environment. To this end, a study wasconducted from the end of 2010 until the beginning of 2012 that in-cluded 16 warehouses in an observation group and 56 warehouses ina control group. An intensive empowerment program ensured thatthe observation group established the lean philosophy in their lead-ership, continuous improvement work, and operational processes.Lean maturity measurements were carried out using a lean ware-house assessment tool that was developed for this study. The leanwarehouse assessment tool is based on a new generation of assess-
v

Abstract
ments that are used in the production environment. Each participat-ing warehouse was measured before and at the end of the project aspart of the assessment. In addition to this, performance indicatorswere measured from the beginning of 2010 until the end of 2011.The lean maturity results and the performance indicators were com-pared using descriptive statistics and analyzed using two samplenon-parametric hypothesis tests. The result was a highly significantpositive development of the productivity performance indicators andthe lean maturity level within the observation group. This indicatesthat the positive lean maturity development had an impact on theperformance indicators. Further research and analysis was done todetermine if a higher lean maturity resulted in a higher performancedevelopment. The result was that a positive relation between higherlean maturity and better developed performance indicators couldbe determined. A functional relation between the lean maturityand performance indicators could not be established. Finally, theobservation group showed better results in the lean maturity andperformance indicators compared to the control group.These results help close the gap in the evidence and encourage deci-sion makers to concentrate on lean activities within logistics opera-tions. A major lean maturity development that results in a positivehigh performance indicator development is possible within the spanof a year in the warehouse environment.
vi

Contents
Kurzfassung iii
Abstract v
1 Introduction 11.1 Problem Description . . . . . . . . . . . . . . . . . . 21.2 Hypotheses . . . . . . . . . . . . . . . . . . . . . . . 41.3 Organization of the Thesis . . . . . . . . . . . . . . . 9
2 The Lean Philosophy in the Warehouse Environment 132.1 Genesis of Lean . . . . . . . . . . . . . . . . . . . . . 132.2 Warehousing at a Glance . . . . . . . . . . . . . . . 152.3 Warehouse versus Production Environment . . . . . 162.4 LeanWarehousing: Transferring Lean Production into
the Warehouse . . . . . . . . . . . . . . . . . . . . . 19
3 Literature Review: Measuring the Impact of Lean 213.1 Measuring the Impact of Lean on Production . . . . 213.2 Measuring the Impact of Lean on Warehousing . . . 223.3 Tools for Measuring Lean Warehousing . . . . . . . 25
3.3.1 Lean Warehousing Maturity Assessments . . 253.3.2 Lean Warehousing Performance Indicators . 29
3.4 Conclusion of the Literature Review . . . . . . . . . 32
4 Bosch Logistics Warehouse Assessment 354.1 Development of the Bosch Logistics Warehouse As-
sessment . . . . . . . . . . . . . . . . . . . . . . . . . 35
vii

Contents
4.2 Structure of the Bosch Logistic Warehouse Assessment 364.3 Intermediate Result: Measuring Systematic . . . . . 43
5 Design of the Experiment 475.1 Warehouse Excellence Group - the Observation Sam-
ple . . . . . . . . . . . . . . . . . . . . . . . . . . . . 475.1.1 The Warehouse Excellence Project - Lean Em-
powerment . . . . . . . . . . . . . . . . . . . 485.2 Control Group . . . . . . . . . . . . . . . . . . . . . 555.3 Method for Testing the Hypotheses . . . . . . . . . . 56
6 Analyzing the Lean Impact 616.1 Statistical Background . . . . . . . . . . . . . . . . . 61
6.1.1 Choosing the Goodness of Fit Test . . . . . . 626.1.2 Choosing the Non-Parametric Test . . . . . 63
6.2 Analysis of Lean Maturity Development . . . . . . . 656.2.1 Lean Maturity Development of the Warehouse
Excellence Group . . . . . . . . . . . . . . . . 656.2.2 The Warehouse Excellence Group versus the
Control Group . . . . . . . . . . . . . . . . . 886.2.3 Intermediate Result: Lean Improvement . . . 101
6.3 Analyzing the Impact on Productivity . . . . . . . . 1026.3.1 Productivity Development of the Warehouse
Excellence Group . . . . . . . . . . . . . . . 1036.3.2 Productivity Development of the Warehouse
Excellence Group versus Control Group . . . 1096.3.3 Intermediate Result: Productivity Improvement111
6.4 Review the Hypotheses . . . . . . . . . . . . . . . . . 1126.4.1 Review of Hypothesis I . . . . . . . . . . . . 1146.4.2 Review of Hypothesis II . . . . . . . . . . . . 1146.4.3 Review of Hypothesis III . . . . . . . . . . . 1156.4.4 Review of Hypothesis IV . . . . . . . . . . . . 115
7 Summary & Conclusion 117
viii
Contents
Bibliography 127
A Appendix - Warehouse Excellence Group Data Sheet 137
B Appendix - Control Group Data Sheet 139
C Appendix - Assessment Questionaire 141
D Appendix - Warehouse Excellence Group Assessment Re-sults 157
E Appendix - Warehouse Excellence Group KPR 161
F Appendix - Control Group Assessment Results 165
G Appendix - Control Group KPR 171
H Appendix - Warehouse Excellence Projects Overview 175
ix

1 IntroductionKarl Popper was one of the most important philosophers of the 20thcentury (Dykes, 1999, p.1). He believed that whenever a theoryappears to be the only possible solution to a problem, people haveto take this as a sign that the theory has not been understood or thatthe problem was never intended to be solved (Lass, 1984, p.XIV).At the beginning of the 20th century, many managers believed thatthe theory of mass production was the only efficient method for pro-duction (Huber, 2011, p.1). Taiichi Ohno saw the sign that Poppermentioned and questioned the efficiency of the theory of mass pro-duction. Working during the time of the tough economic challengesthat the Japanese industry faced after World War ll, Ohno believedthat it was possible to surpass the conventional style of mass pro-duction and produce value for the customer with less waste and withhigher efficiency (Ohno, 1988, p.2). Motivated by his belief, Ohnodeveloped the Toyota Production System (TPS) (Ohno, 1988; Liker,2004, p.4).In the second phase of the International Motor Vehicle Program(IMVP), scientists benchmarked the Toyota Production System (Hol-weg, 2007) with the mass production methods of other automotivecompanies. Within the scope of this detailed study, they analyzedthe effectiveness of the TPS and determined the superiority of theTPS over traditional production systems (Womack, 2007). Dur-ing the IMVP, John Krafcik coined the term “Lean Production”(Cusumano, 1994) to describe the philosophy behind the TPS. Partsof this lean philosophy were transferred to other functional plant ar-eas and industrial sectors. Terms such as “Lean Management” and“Lean Administration” also came into being (Bell and Orzen, 2011;
1

1 Introduction
Zidel, 2006; Pfeiffer and Weiß, 1994).Elements of the lean philosophy also eventually found their way intothe warehouse environment (Augustin, 2009; Dehdari et al., 2011;Spee and Beuth, 2012; Furmans and Wlcek, 2012). The majority ofreports that analyze lean techniques within the warehouse are basedon pilot studies with a low sample size or even single pilot projectexperience reports.
1.1 Problem DescriptionIn-depth studies that analyze the impact of lean techniques in pro-duction environments are usually based on a combination of threeevaluation techniques:
• Measurement of the lean maturity• Measurement of the performance indicators• Comparison of the samples with each other
In addition to five other research areas, the IMVP analyzed the ma-turity of the production systems within plants. The scientists alsoanalyzed the development of major performance indicators. Theseperformance indicators either focused on one research area or onseveral overarching research areas. The last phase of the researchinvolved a comparison of the data between plants with the TPSand plants with traditional production systems. The results of thecomparison showed that the sample with the TPS had superior per-formance indicators.With these results, the IMVP asserted that the comparison demon-strated a positive impact of the TPS on major performance indi-cators. Other studies have backed up the positive impact of leantechniques on performance indicators in the production environment(Bidgoli, 2004; Hofer et al., 2012; Fullerton et al., 2003; Oeltjenbruns,
2
1.1 Problem Description
2000; Liker, 2004).This also means that the comparison of lean maturity results (inde-pendent variables) with the development of performance indicators(dependent variables) between different samples is a verified methodfor proving the superiority of the TPS in the production environ-ment.As stated earlier, lean techniques have also found their way intothe warehouse environment but the conditions of the warehouse en-vironment differ from those in the production environment. Onedifference is that the less technical nature of the warehouse allowsmore options for process changes. Another difference is that thehigher degree of manual work in a warehouse causes larger fluctua-tions in cycle times. Further differences are highlighted in Dehdariand Schwab (2012). Therefore, the question is raised if the leantechniques that were developed for the production environment areapplicable in the warehouse environment.However, some of the verified measurement techniques used in theproduction environment are also used in studies in the warehouseenvironment. Most studies, such as Reuter (2009), use a majorperformance indicator to measure the impact of the lean techniques.The Reuter study, and other similar studies that will be discussed inchapter 3, does not include a measurement of the lean maturity of theoperation that improves the performance indicator (Reuter, 2009).Other studies, such as Sobanski and Mahfouz, used an assessment toanalyze the lean maturity but did not relate it to the developmentof the performance indicator (Sobanski, 2009; Mahfouz, 2011).All of the known in-depth, verified, and reliable studies that measurethe impact of lean techniques on the production environment wereperformed using a combination of the above-mentioned evaluationtechniques. The known studies on the warehouse environment mea-sure performance indicators but they do not compare their resultswith the results of a measurement of the lean maturity or they donot compare different samples with each other. Some other stud-ies measure the lean maturity but do not link it with the devel-
3

1 Introduction
opment of the performance indicators. A comparison of warehouseperformance indicators for warehouses that improve the lean matu-rity with warehouses that use other techniques is not known. Thismeans that the applicability of verified measurement techniques forthe impact of lean techniques in warehouses is still being studied.Thus, this thesis will help to close the gap between the disparitiesin the level of evidence for the impact of lean techniques on per-formance indicators within the production environment comparedwith the warehouse environment. This thesis will also evaluate theapplicability of using verified measuring methods in production forthe warehouse environment.I hope that by contributing to closing the gap in the levels of evi-dence, I can help companies make the decision to invest in resourcesfor establishing lean techniques within the warehouse environment.This should result in benefits for them because the lean maturity inwarehouses today is low and the high potential for improvement isknown (Furmans and Wlcek, 2012).
1.2 Hypotheses
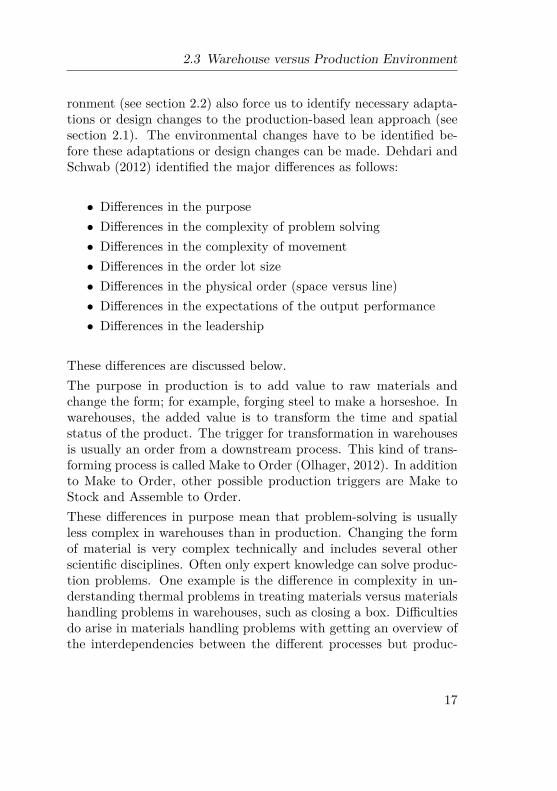
The research presented in this thesis is based on four hypotheseswhich help to close the gap in the level of evidence for the impact oflean techniques on performance indicators. The hypotheses are de-scribed below. A coordinate system was used to show the differencebetween the hypotheses. An indicator for the lean maturity and anindicator for the performance development were used to test a hy-pothesis. The independent variable lean maturity is located on theabscissa. The dependent variable performance development is lo-cated on the ordinate. It also has to be noticed that the expectationlevel for a clear relation between the lean maturity and performanceindicator rises from hypothesis I till hypothesis IV. This hypothesislead us to discover the relationship between the lean maturity andperformance indicators step by step .
4

1.2 Hypotheses
Hypothesis I: Lean has a positive impact on performanceindicators but we do not expect to know if a higher level oflean maturity has a higher influence on performance indi-cators.
Hypothesis I is shown in figure 1.1. To test Hypothesis I, warehousesthat improved their lean maturity were analyzed. For Hypothesis Ito be true, no warehouse that shows a positive lean maturity couldshow a negative development of performance indicators and therecan be no evidence that a higher lean maturity also implies a higherpositive impact on the development of the performance indicators.In the example shown in figure 1.1, WH 2 has a lower performancedevelopment with a higher lean maturity development than WH 1.In conclusion, I restrict myself to show a positive impact withoutthe necessary evidence to show higher lean maturity leads to higherperformance indicator improvement.
5
1 Introduction
Performance Indicator Development (relative)
Lean Maturity Points Achieved (absolute)
WH 1
WH 2
WH 3
WH 4
(0,0)
Hypothesis 1: Lean has a positive impact on performance indicator development
Possible Warehouse Position
Impossible Warehouse Position
WH: Warehouse
Figure 1.1: Hypothesis I
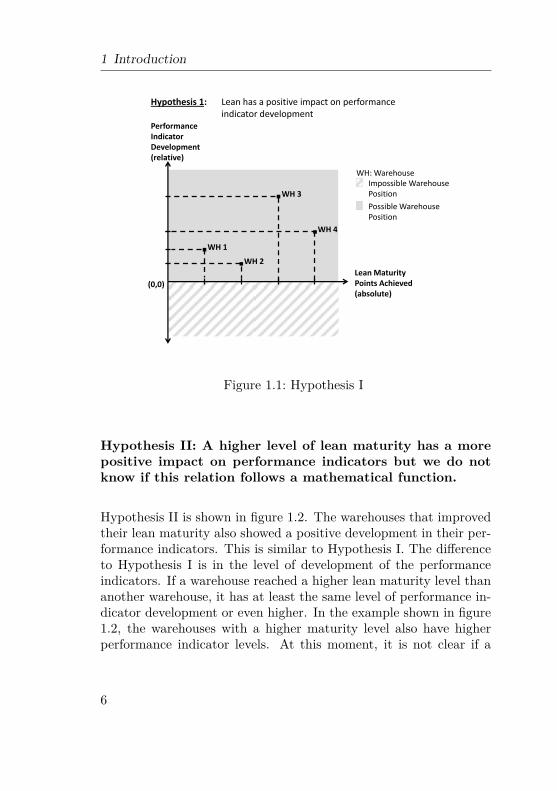
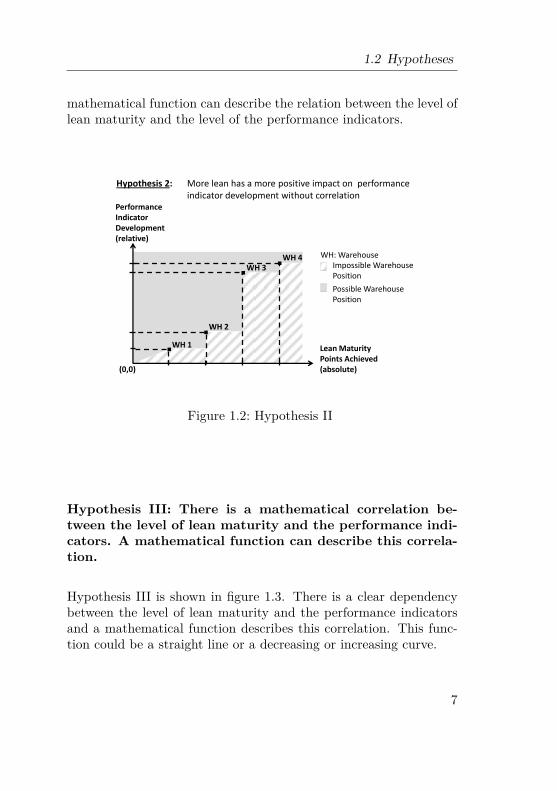
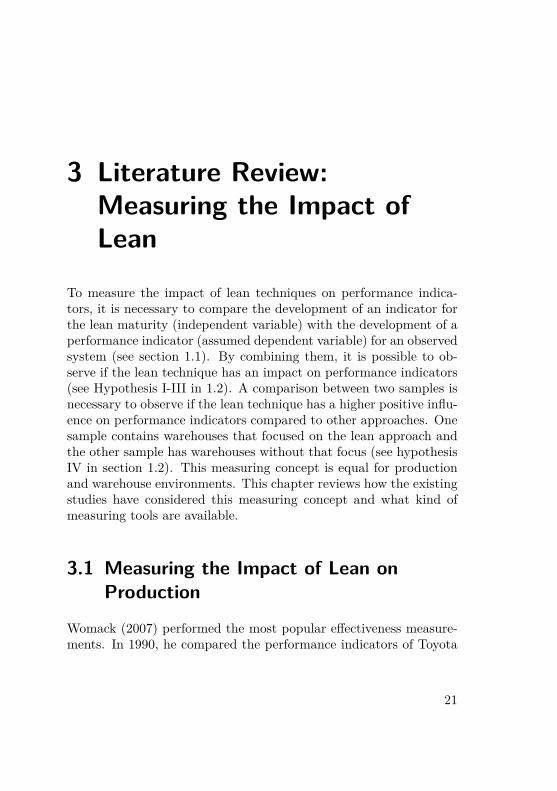
Hypothesis II: A higher level of lean maturity has a morepositive impact on performance indicators but we do notknow if this relation follows a mathematical function.
Hypothesis II is shown in figure 1.2. The warehouses that improvedtheir lean maturity also showed a positive development in their per-formance indicators. This is similar to Hypothesis I. The differenceto Hypothesis I is in the level of development of the performanceindicators. If a warehouse reached a higher lean maturity level thananother warehouse, it has at least the same level of performance in-dicator development or even higher. In the example shown in figure1.2, the warehouses with a higher maturity level also have higherperformance indicator levels. At this moment, it is not clear if a
6
1.2 Hypotheses
mathematical function can describe the relation between the level oflean maturity and the level of the performance indicators.
Performance Indicator Development (relative)
Lean Maturity Points Achieved (absolute)
WH 1
WH 2
WH 3 WH 4
(0,0)
Possible Warehouse Position
Impossible Warehouse Position
WH: Warehouse
Hypothesis 2: More lean has a more positive impact on performance indicator development without correlation
Figure 1.2: Hypothesis II
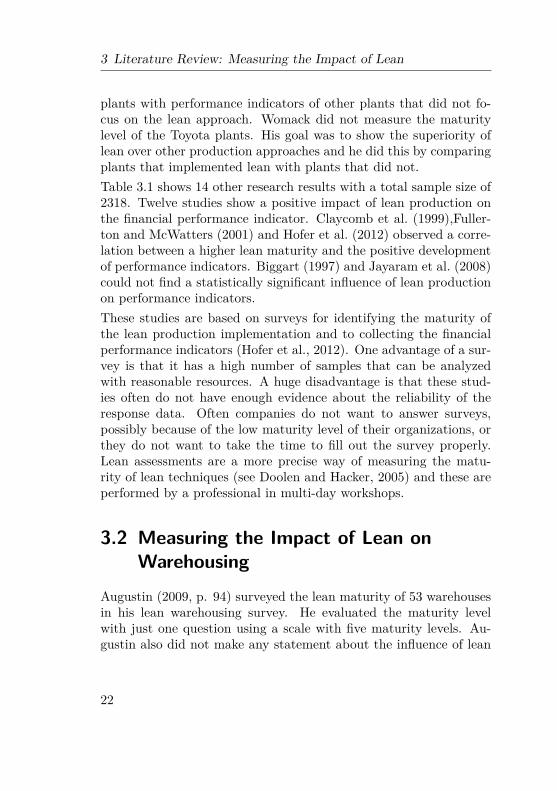
Hypothesis III: There is a mathematical correlation be-tween the level of lean maturity and the performance indi-cators. A mathematical function can describe this correla-tion.
Hypothesis III is shown in figure 1.3. There is a clear dependencybetween the level of lean maturity and the performance indicatorsand a mathematical function describes this correlation. This func-tion could be a straight line or a decreasing or increasing curve.
7

1 Introduction
Performance Indicator Development (relative)
Lean Maturity Points Achieved (absolute)
WH 1
WH 2
WH 3
WH 4
(0,0)
WH: Warehouse
Hypothesis 3: Positive correlation between the lean maturity level and performance indicator development
Functional Correlation Graph
Figure 1.3: Hypothesis III
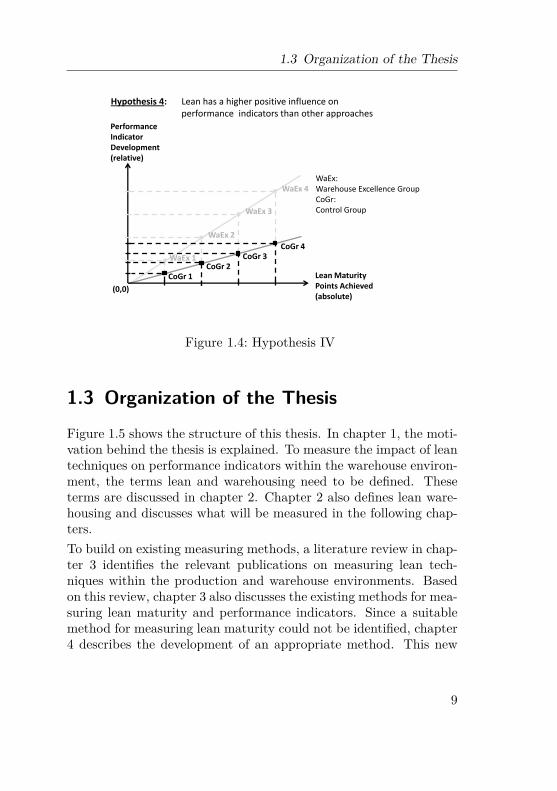
Hypothesis IV: Lean techniques have a higher positive im-pact on performance indicators than other approaches.
Hypothesis IV is shown in figure 1.4. The assumption in HypothesisIV is that a group of warehouses that focuses on and improves theirlean activities have a higher positive performance indicator develop-ment than warehouses that use other approaches or anything at all,instead of a focused lean development program.
8
1.3 Organization of the Thesis
Performance Indicator Development (relative)
CoGr 4
CoGr 1 CoGr 2
CoGr 3
(0,0)
WaEx: Warehouse Excellence Group CoGr: Control Group
Lean Maturity Points Achieved (absolute)
WaEx 1
WaEx 2
WaEx 3
WaEx 4
Hypothesis 4: Lean has a higher positive influence on performance indicators than other approaches
Figure 1.4: Hypothesis IV
1.3 Organization of the Thesis
Figure 1.5 shows the structure of this thesis. In chapter 1, the moti-vation behind the thesis is explained. To measure the impact of leantechniques on performance indicators within the warehouse environ-ment, the terms lean and warehousing need to be defined. Theseterms are discussed in chapter 2. Chapter 2 also defines lean ware-housing and discusses what will be measured in the following chap-ters.To build on existing measuring methods, a literature review in chap-ter 3 identifies the relevant publications on measuring lean tech-niques within the production and warehouse environments. Basedon this review, chapter 3 also discusses the existing methods for mea-suring lean maturity and performance indicators. Since a suitablemethod for measuring lean maturity could not be identified, chapter4 describes the development of an appropriate method. This new
9

1 Introduction
appropriate method combined with a method that was identified formeasuring the performance indicators is used as the system of mea-surement for this thesis. The design of experiment used to test thehypotheses is defined in chapter 5 and the measurement and inter-pretation of data is presented in chapter 6. Chapter 7 rounds outthe thesis with a conclusion and critical discussion.
10

1.3 Organization of the Thesis
Analyzing the Lean Impact
Motivation and Hypotheses
What is Lean?
What is Warehousing?
Lean Warehousing
Status Measuring Lean Production
Status Assessments
Developing the Bosch Logistics Warehouse Assessment
Design of the Experiment
Descriptive Analyses Inferential Analyses
Summary & Conclusion
1.
2.
3.
4.
5.
6.
7. I know now.
I measure and
interpret.
How do I want to measure?
I want to know...
What do I want to measure?
Status Measuring Lean Warehousing
Status Performance Indicators
Leading Thoughts
Review the Hypotheses
Figure 1.5: Structure of the thesis
11

1 Introduction
12
2 The Lean Philosophy in theWarehouse Environment
This chapter first highlights the roots of the lean approach andpresents the related milestone literature (see section 2.1). To trans-fer the lean approach to the warehouse environment, it is necessaryto understand the definition, processes, and types of warehouses (seesection 2.2). Using that knowledge, it is possible to highlight the ma-jor differences between the production and warehouse environments(see section 2.3). Finally, it is possible to derive the definition oflean warehousing from the perceptions.
2.1 Genesis of LeanDiscipline and avoidance of waste is deep-rooted in the Japaneseculture (Lebra and Lebra, 1986, p. 70). This is even reflected in thedaily life of the Japanese. For example, when a Japanese chef filetsa salmon to make sashimi he uses the cropped and unused parts ofthe salmon as ingredients for a soup and does not dispose of them.Against this cultural background and the aftermath of World War II,Taiichi Ohno assessed the mass production system of the Americanautomobile industry. At that time, the majority of the companiesin the automotive industry applied the mass production philoso-phy strengthened by the circumstance of increasing demands (Ohno,1988, p.1)(Liker, 2004, p.24). The industry believed that mass pro-duction was the most efficient way to fulfill customer demand. Ohno,however, did not share the view of the overwhelming majority.
13

2 The Lean Philosophy in the Warehouse Environment
Ohno saw several forms of waste in the American way and had astrong desire to avoid waste and improve the processes. To servecustomer needs with high product variation was one of his desiresbut this was simply less profitable when mass production was in use.Out of that desire and need he developed the Toyota ProductionSystem (TPS) to enable his organization to meet customer demandin a more efficient way. With the Toyota Production System, heestablished a new culture within Toyota and proved its strength inthe oil crisis in 1973. During the oil crisis, which caused decreasingdemands, other Japanese industry sectors followed Toyota’s methodof production (Ohno, 1988; Liker, 2004, p. xiii).The Toyota Production System received worldwide attention afterthe publication in 1990 of the Womack book The Machine thatChanged the World (Womack, 2007). Other publications like Bösen-berg and Metzen (1993), Liker (2004), Pfeiffer and Weiß (1994),Rother and Shook (2008), Rother and Kinkel (2009), and Womackand Jones (2004) discussed the lean philosophy from different an-gles. Dehdari et al. (2011) analyzed several key literature sourcesand identified the constituents of lean production. The eliminationof waste using a structured continuous improvement cycle is the keyelement in the literature. Furmans and Wlcek (2012) divided thiscontinuous improvement cycle into low and high frequent improve-ment cycles. The low frequent improvement cycle is an analytic andsystematic method resulting from the derivation of the target valuestreams from their implementation. After implementation, the highfrequent improvement cycle stabilizes the implemented standard andimproves it again in a systematic and analytical way. In additionto this, Furmans and Wlcek (2012) identified seven success factorsfor using lean techniques in the warehouse environment. These areleadership, value stream planning, standardisation, work place de-sign, visualisation, work force management, and sustainable problemsolving.
14

2.2 Warehousing at a Glance
2.2 Warehousing at a Glance
Section 2.1 identified the roots of the lean philosophy in the Japaneseautomotive industry sector. To measure the impact of lean tech-niques in the warehouse environment, it is necessary to base theresearch on a definition of the function of a warehouse along withan understanding of the processes within warehouses and the iden-tification of different types of relevant warehouses. This sectiontakes valid definitions for the function of a warehouse, warehouseprocesses, and types of warehouses from the key literature for thepurpose of this thesis.Gudehus and Kotzab (2012, p. 19) state that the function of awarehouse in a logistics network is to transfer, store and commissiongoods. Bartholdi and Hackman (2011, p. 5), ten Hompel et al.(2007, p. 50), Arnold et al. (2008, p. 373) use similar definitionsfor the function. Bartholdi and Hackman (2011, p. 5) mentionedthe space and time synchronization function of a warehouse withina supply chain. ten Hompel et al. (2007, p. 50) add the change ofstatus of goods to their definition. Arnold et al. (2008, p. 373) viewthe warehouse from a broader angle. They assert that the function ofa warehouse is, in fact, is to disrupt the supply chain. The EuropeanNorm EN 14943 (2005) defines the function of a warehouse as a spacethat is designed to receive, store, and distribute goods. This thesiswill focus on the processes within a warehouse and not on the role ofthe warehouse within a supply chain. For this reason, this thesis willuse the European Norm EN 14943 as the definition for the functionof a warehouse.The three processes mentioned in the European Norm EN 14943standard are detailed by Arnold et al. (2008, p. 379). In addi-tion to many other information processes, Arnold et al. (2008, p.379) defined the receipt, storage and retrieval, picking, packing, andshipping of goods as the major processes in a warehouse. Bartholdiand Hackman (2011, p. 24), ten Hompel et al. (2007, p. 53), andGudehus and Kotzab (2012, p. 19) supported this definition with
15
2 The Lean Philosophy in the Warehouse Environment
their own. The VDI 3629 (2005)guideline differs from this defini-tion because it excludes the packing process as a major warehouseprocess.Regarding the information processes mentioned by Arnold et al.(2008, p. 379), the VDI guideline overlaps mainly with Arnold etal. (2008, p. 379). Bartholdi and Hackman (2011, p. 28) overlapwith the control process and ten Hompel et al. (2007, p. 53) overlapwith the identification process. Gudehus and Kotzab (2012, p. 19)do not identify the information processes as major warehouses pro-cesses. This thesis will focus on the definition given by Arnold et al.(2008, p. 379) regarding the processes within warehouses because itis the one that is the most validated by the above-mentioned authorsand guidelines.The definition of the different kinds of warehouse types is based on acombination and emphasis of the different major processes. Arnoldet al. (2008, p. 376) distinguishes eight categories with 29 warehousetypes. The most common warehouse types in the industry sectorare production warehouses and warehouses for product distribution.Since the intent of this thesis is to test the hypotheses that are validfor all warehouses, no distinction will be made between the differentwarehouse types.
2.3 Warehouse versus ProductionEnvironment
An innovation is often designed for one specific environment. Awristwatch, for example, was originally designed for use on land. Ifit is to be used under water, the designer needs to understand the en-vironmental changes and determine if design changes are necessary.The wristwatch, then, must be waterproof and resistant against saltwater. It may also possess other features like an altitude meter.Environmental changes between a production and warehouse envi-
16
2.3 Warehouse versus Production Environment
ronment (see section 2.2) also force us to identify necessary adapta-tions or design changes to the production-based lean approach (seesection 2.1). The environmental changes have to be identified be-fore these adaptations or design changes can be made. Dehdari andSchwab (2012) identified the major differences as follows:
• Differences in the purpose• Differences in the complexity of problem solving• Differences in the complexity of movement• Differences in the order lot size• Differences in the physical order (space versus line)• Differences in the expectations of the output performance• Differences in the leadership
These differences are discussed below.The purpose in production is to add value to raw materials andchange the form; for example, forging steel to make a horseshoe. Inwarehouses, the added value is to transform the time and spatialstatus of the product. The trigger for transformation in warehousesis usually an order from a downstream process. This kind of trans-forming process is called Make to Order (Olhager, 2012). In additionto Make to Order, other possible production triggers are Make toStock and Assemble to Order.These differences in purpose mean that problem-solving is usuallyless complex in warehouses than in production. Changing the formof material is very complex technically and includes several otherscientific disciplines. Often only expert knowledge can solve produc-tion problems. One example is the difference in complexity in un-derstanding thermal problems in treating materials versus materialshandling problems in warehouses, such as closing a box. Difficultiesdo arise in materials handling problems with getting an overview ofthe interdependencies between the different processes but produc-
17

2 The Lean Philosophy in the Warehouse Environment
tion also faces this problem at times. However, it is important toremember that a lower complexity does not mean a simple complex-ity.The lot size that is processed in the warehouse is usually one. Thereason for this is that when an order is placed by a customer an-other customer does not usually place exactly the same order. Thesame order means the same products in the same quantity. The lotsize in production can be one but the lot size is often higher to savechangeover time or because the production is not mature enough toperform fast changeovers. Higher productivity within the lot can beachieved because of the higher lot size. The higher lot size in pro-duction also implies a higher degree of repetitive work for employeesand, conversely, a lower degree of repetitive work in warehouses.The lower degree of repetitive work causes higher fluctuation in theworking cycles.Production machines manufacture goods in the same quantity andsame quality over a long period of time. This is done because of thelot size and the purpose of adding value to raw materials. Machinesare very rare in the warehouse environment. Employees are humanbeings and, like all human beings, they do not work as precisely as amachine for a long period of time. The result is a higher fluctuationin quantity and quality compared to the work of a machine withinthe warehouse.The physical environment of production employees is often struc-tured in the form of a line. One workplace follows another work-place. The workplace is designed with less moving complexity forthe worker to ensure higher productivity. The worker usually hasa fixed workplace that does not require much walking. In ware-houses, these processes are structured in an area that is based onthe space required for storing products. This means that the pickerhas to make different kinds of movements when picking goods fromthe area. This fact and the lower degree of repetitiveness mean thatwarehouse employees have to make more complex movements thanproduction employees. In other words, the warehouse environment
18

2.4 Lean Warehousing: Transferring Lean Production into the Warehouse
has longer and higher fluctuating working cycles.The longer and more volatile working cycles also mean that thereare usually no set expectations about the output performance inwarehouses. If the estimated level is not reached, the warehouseleader accepts this situation. In production, failure to reach theestimated level will at least result in questions being raised by theleader on the shop floor.The leadership also changes in the warehouse environment. In pro-duction, the leader has an overview of his staff when they are inthe production line. Direct communication with all of his workersis possible with only a few restrictions. In the warehouse, the work-ers are spread all around. Direct communication with the workersis much more restricted. Another problem occurs in the warehousebecause the processes are not usually synchronized and the workerschange their work and their locations throughout the day. A workermight pick goods in the morning and pack them in the afternoon.This means that the worker reports to two different leaders withinone shift. In the production environment, the worker stays at oneproduction station the whole day.These environmental changes have to be taken into considerationwhen implementing the lean philosophy in the warehouse environ-ment.
2.4 Lean Warehousing: Transferring LeanProduction into the Warehouse
Section 2.1 identified that the key element of the lean philosophy isthe elimination of waste using a structured continuous improvementcycle. The environmental changes (see section 2.2) in the warehouseenvironment (see section 2.3) make it necessary to modify the leanphilosophy. More volatile and longer working cycles require an in-crease in the focus on measuring and controlling the processes. Pro-
19

2 The Lean Philosophy in the Warehouse Environment
cess controlling has to be done in a systematic and analytical way.The shop floor leaders face the challenge of workers being spreadaround the warehouse. Since it is not possible to lead the work-ers directly, a structured continuous improvement cycle has to beconsidered.Leadership, measuring, and the driving of improvements in a sys-tematic and analytic way all play an important role when trans-ferring lean approaches from the production environment into thewarehouse environment. Dehdari et al. (2011) considered this in hisdefinition of lean warehousing:
Lean warehousing is a leadership concept. This con-cept aims at a permanent, systematic, analytic, sustain-able, and measurable improvement of processes in thewarehouse environment. This happens with the con-tribution of all employees and with the goal of gainingawareness of perfection in each corporate action.
20
3 Literature Review:Measuring the Impact ofLean
To measure the impact of lean techniques on performance indica-tors, it is necessary to compare the development of an indicator forthe lean maturity (independent variable) with the development of aperformance indicator (assumed dependent variable) for an observedsystem (see section 1.1). By combining them, it is possible to ob-serve if the lean technique has an impact on performance indicators(see Hypothesis I-III in 1.2). A comparison between two samples isnecessary to observe if the lean technique has a higher positive influ-ence on performance indicators compared to other approaches. Onesample contains warehouses that focused on the lean approach andthe other sample has warehouses without that focus (see hypothesisIV in section 1.2). This measuring concept is equal for productionand warehouse environments. This chapter reviews how the existingstudies have considered this measuring concept and what kind ofmeasuring tools are available.
3.1 Measuring the Impact of Lean onProduction
Womack (2007) performed the most popular effectiveness measure-ments. In 1990, he compared the performance indicators of Toyota
21
3 Literature Review: Measuring the Impact of Lean
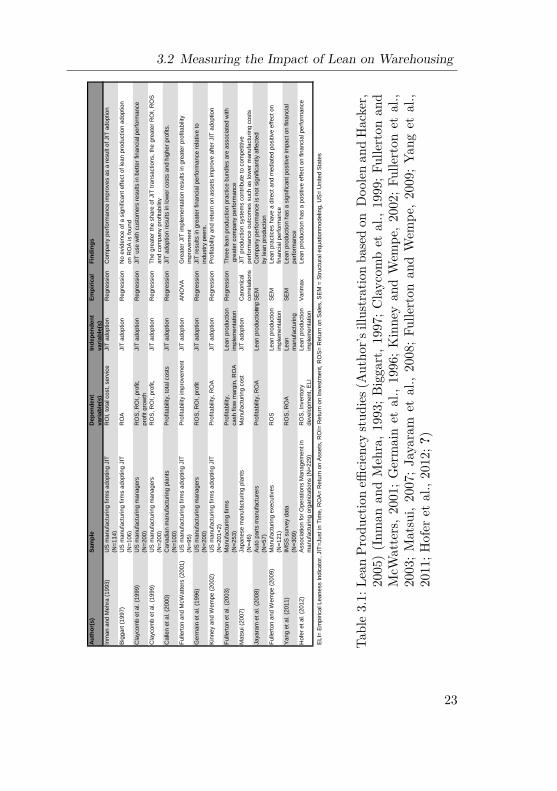
plants with performance indicators of other plants that did not fo-cus on the lean approach. Womack did not measure the maturitylevel of the Toyota plants. His goal was to show the superiority oflean over other production approaches and he did this by comparingplants that implemented lean with plants that did not.Table 3.1 shows 14 other research results with a total sample size of2318. Twelve studies show a positive impact of lean production onthe financial performance indicator. Claycomb et al. (1999),Fuller-ton and McWatters (2001) and Hofer et al. (2012) observed a corre-lation between a higher lean maturity and the positive developmentof performance indicators. Biggart (1997) and Jayaram et al. (2008)could not find a statistically significant influence of lean productionon performance indicators.These studies are based on surveys for identifying the maturity ofthe lean production implementation and to collecting the financialperformance indicators (Hofer et al., 2012). One advantage of a sur-vey is that it has a high number of samples that can be analyzedwith reasonable resources. A huge disadvantage is that these stud-ies often do not have enough evidence about the reliability of theresponse data. Often companies do not want to answer surveys,possibly because of the low maturity level of their organizations, orthey do not want to take the time to fill out the survey properly.Lean assessments are a more precise way of measuring the matu-rity of lean techniques (see Doolen and Hacker, 2005) and these areperformed by a professional in multi-day workshops.
3.2 Measuring the Impact of Lean onWarehousing
Augustin (2009, p. 94) surveyed the lean maturity of 53 warehousesin his lean warehousing survey. He evaluated the maturity levelwith just one question using a scale with five maturity levels. Au-gustin also did not make any statement about the influence of lean
22
3.2 Measuring the Impact of Lean on Warehousing
Au
tho
r(s)
Sam
ple
Dep
en
den
t
vari
ab
le(s
)
Ind
ep
en
den
t
vari
ab
le(s
)
Em
pir
ical
Fin
din
gs
Inm
an a
nd M
ehra
(1993)
US
manufa
ctu
ring f
irm
s a
dopting J
IT
(N=
114)
RO
I, t
ota
l cost,
serv
ice
JIT
adoption
Regre
ssio
nC
om
pany p
erf
orm
ance im
pro
ves a
s a
result o
f JIT
adoption
Big
gart
(1997)
US
manufa
ctu
ring f
irm
s a
dopting J
IT
(N=
106)
RO
AJIT
adoption
Regre
ssio
nN
o e
vid
ence o
f a s
ignific
ant
eff
ect
of
lean p
roduction a
doption
on R
OA
is f
ound
Cla
ycom
b e
t al. (
1999)
US
manufa
ctu
ring m
anagers
(N=
200)
RO
S,
RO
I, p
rofit,
pro
fit
gro
wth
JIT
adoption
Regre
ssio
nJIT
use w
ith c
usto
mers
results in b
ett
er
financia
l perf
orm
ance
Cla
ycom
b e
t al. (
1999)
US
manufa
ctu
ring m
anagers
(N=
200)
RO
S,
RO
I, p
rofit,
JIT
adoption
Regre
ssio
nT
he g
reate
r th
e s
hare
of
JIT
tra
nsactions,
the g
reate
r R
OI, R
OS
and c
om
pany p
rofita
bili
ty
Calle
n e
t al. (
2000)
Canadia
n m
anufa
ctu
ring p
lants
(N=
100)
Pro
fita
bili
ty,
tota
l costs
JIT
adoption
Regre
ssio
nJIT
adoption r
esults in low
er
costs
and h
igher
pro
fits
.
Fulle
rton a
nd M
cW
att
ers
(2001)
US
manufa
ctu
ring f
irm
s a
dopting J
IT
(N=
95)
Pro
fita
bili
ty im
pro
vem
ent
JIT
adoption
AN
OV
AG
reate
r JIT
im
ple
menta
tion r
esults in g
reate
r pro
fita
bili
ty
impro
vem
ent
Germ
ain
et
al. (
1996)
US
manufa
ctu
ring m
anagers
(N=
200)
RO
S,
RO
I, p
rofit
JIT
adoption
Regre
ssio
nJIT
results in g
reate
r financia
l perf
orm
ance r
ela
tive t
o
industr
y p
eers
.
Kin
ney a
nd W
em
pe (
2002)
US
manufa
ctu
ring f
irm
s a
dopting J
IT
(N=
201×
2)
Pro
fita
bili
ty,
RO
AJIT
adoption
Regre
ssio
nP
rofita
bili
ty a
nd r
etu
rn o
n a
ssets
im
pro
ve a
fter
JIT
adoption
Fulle
rton e
t al. (
2003)
Manufa
ctu
ring f
irm
s
(N=
253)
Pro
fita
bili
ty,
cash f
low
marg
in,
RO
A
Lean p
roduction
imple
menta
tion
Regre
ssio
nT
hre
e lean p
roduction p
ractice b
undle
s a
re a
ssocia
ted w
ith
gre
ate
r com
pany p
erf
orm
ance
Mats
ui (2
007)
Japanese m
anufa
ctu
ring p
lants
(N=
46)
Manufa
ctu
ring c
ost
JIT
adoption
Canonic
al
corr
ela
tions
JIT
pro
duction s
yste
ms c
ontr
ibute
to c
om
petitive
perf
orm
ance o
utc
om
es s
uch a
s low
er
manufa
ctu
ring c
osts
Jayara
m e
t al. (
2008)
Auto
part
s m
anufa
ctu
rers
(N=
57)
Pro
fita
bili
ty,
RO
ALean p
roduction im
ple
menta
tion
SE
MC
om
pany p
erf
orm
ance is n
ot
sig
nific
antly a
ffecte
d
by lean p
roduction
Fulle
rton a
nd W
em
pe (
2009)
Manufa
ctu
ring e
xecutives
(N=
121)
RO
SLean p
roduction
imple
menta
tion
SE
MLean p
ractices h
ave a
direct
and m
edia
ted p
ositiv
e e
ffect
on
financia
l perf
orm
ance
Yang e
t al. (
2011)
IMS
S s
urv
ey d
ata
(N=
309)
RO
S,
RO
ALean
manufa
ctu
ring
SE
MLean p
roduction h
as a
sig
nific
ant
positiv
e im
pact
on f
inancia
l
perf
orm
ance
Hofe
r et
al. (
2012)
Associa
tion f
or
Opera
tions M
anagem
ent
in
manufa
ctu
ring o
rganiz
ations (
N=
229)
RO
S,
Invento
ry
develo
pm
ent,
ELI
Lean p
roduction
imple
menta
tion
Varim
ax
Lean p
roduction h
as a
positiv
e e
ffect
on f
inancia
l perf
orm
ance
ELI=
Em
piric
al Leaness Indic
ato
r, J
IT=
Just
in T
ime,
RO
A=
Retu
rn o
n A
ssets
, R
OI=
Retu
rn o
n Investm
ent,
RO
S=
Retu
rn o
n S
ale
s,
SE
M =
Str
uctu
ral equationm
odelin
g,
US
= U
nited S
tate
s
Table3.1:
Lean
Prod
uctio
neffi
ciency
stud
ies(
Autho
r’sillustrationba
sedon
Doo
lenan
dHacker,
2005)(Inm
anan
dMeh
ra,1
993;
Biggart,1
997;
Claycom
bet
al.,1999;F
ullerton
and
McW
atters,2
001;
Germainet
al.,1996;K
inne
yan
dWem
pe,2
002;
Fullerton
etal.,
2003;Matsui,2007;Jayaram
etal.,2008;Fu
llerton
andWem
pe,2009;Ya
nget
al.,
2011;H
ofer
etal.,2012;?
)
23

3 Literature Review: Measuring the Impact of Lean
warehousing on performance indicators. Overboom et al. (2010) de-veloped a more detailed assessment for his study that was based onqualitative measures. He published a method for measuring leanmaturity that was based on his analyses of Web pages, a question-naire, and structured interviews of two logistics service providers.However, like Augustin, Overboom did not establish a link betweenlean maturity and performance indicators. Sobanski (2009) also de-veloped a lean assessment for his warehouses within his study. Heverified his assessment and the correlation between subjects with asample size of 25 warehouses. Standard processes and visual man-agement were two of the areas he studied. He assumed a positiveimpact of lean on performance indicators for his study. Sobanski(2009) did not test his assumption by relating the assessment re-sults to the performance indicators of the warehouses.The lack of lean maturity assessments that also consider performanceindicators motivated Mahfouz (2011) to develop a new lean assess-ment for his study. He evaluated a leanness index with a sample sizeof five warehouses in Ireland. The Mahfouz study was also based ona questionnaire but it included some operational and tactical per-formance indicators. The cycle time is an example of an operationalperformance indicator and the number of on-time delivery orders isan example of a tactical performance indicator. Mahfouz used theperformance indicators to quantify the results of the lean maturityassessment. He did not analyze the effect of lean approaches onoperational or even financial performance indicators.Augustin (2009), Sobanski (2009) and Mahfouz (2011) concentratedon measuring the level of lean maturity. The level of performance in-dicator development was considered in the Mahfouz study but onlyto support the level of evidence of the lean maturity. The Distri-bution Center Reference Model (DCRM) (see Wisser, 2009) focuseson the level of performance indicators. The DCRM is based on avery sophisticated metric of performance indicators for generatingan assertion about the leanness of a warehouse. Unfortunately, theDCRM does not include a metric to evaluate the maturity of the
24
3.3 Tools for Measuring Lean Warehousing
lean techniques.
3.3 Tools for Measuring Lean Warehousing
Data for the abscissa and ordinate is required to test the hypothesesthat were defined in section 1.2. Section 3.1 demonstrated that thesekinds of comparisons are a mature and standard way of analysingthe impact of lean approaches on performance indicators. Section3.2 showed that there is a gap between the warehouse environmentand the production environment in terms of the level of evidence ofthe lean impact on performance indicators.Two different measurement tools are necessary to close this gap.The first measurement tool is used to evaluate the maturity of thelean approach in the warehouse environment and the other is used tomeasure the performance indicators. The existing tools are discussedbelow.
3.3.1 Lean Warehousing Maturity Assessments
Maturity assessments make it possible to allocate the relative posi-tion of a selected domain within a maturity model. The maturitymodel consists of a set of criteria that are often ordered on a five-point Likert scale. Usually, level one represents the minimum re-quirement and five represents the highest achievable maturity level(Bruin et al., 2005).Most assessments verify if a standard has been documented but lackthe questions that would verify if the written standard is also exe-cuted. If a high level of evidence of the maturity of a selected ware-house is required, it is also necessary to test the execution. Severallean maturity assessments are in use today.The first step in identifying the most suitable lean maturity assess-ment for this thesis was to get an overview of the existing maturity
25
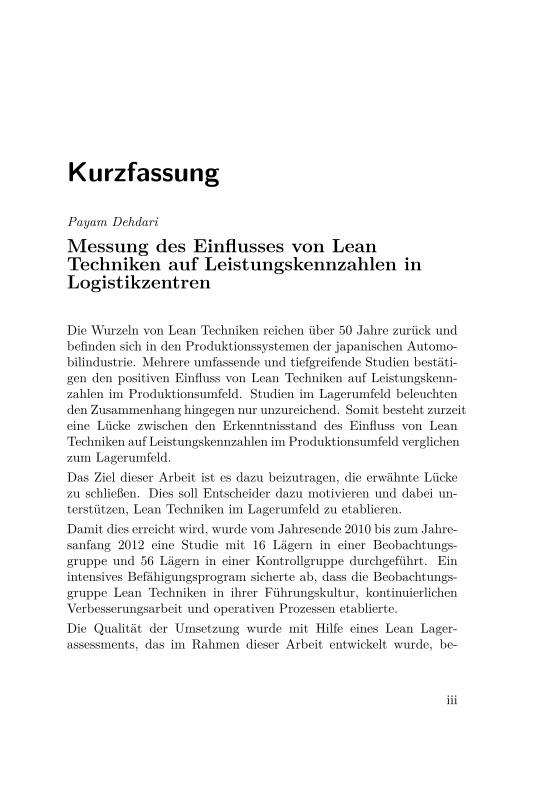
3 Literature Review: Measuring the Impact of Lean
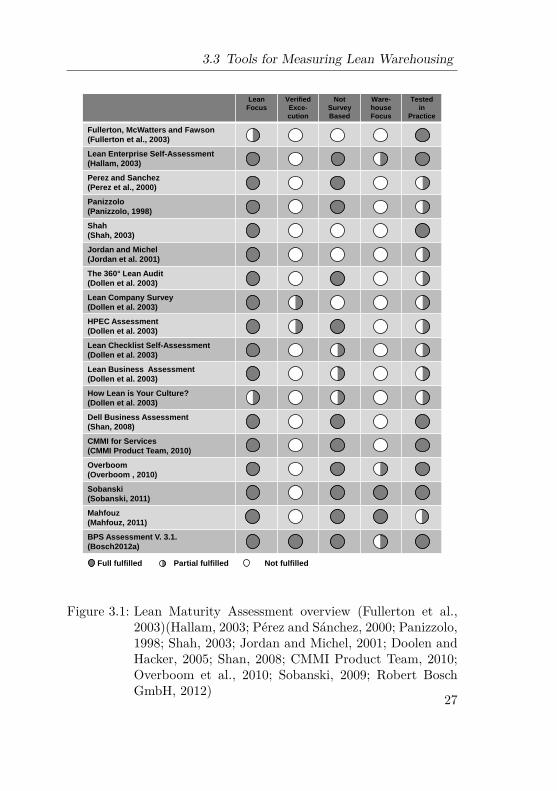
assessments. More than 70 maturity assessments were identified byreviewing and researching three scientific databases and the inter-net and by questioning experts. Seventeen maturity assessments re-mained after the assessments that did not focus on the lean approachwere eliminated. Figure 3.1 shows these 17 assessments. These 17lean maturity assessments were evaluated again using five criteriawith three levels of fulfillment: fully, partially, and not.The first criterion is Lean Focus. This criterion questioned the depthof lean focus. If, for example, an assessment only asks questionsabout the Just in Time implementation and no other lean tech-niques, then this assessment would partially fulfill the first criterion.The second criterion is Verified Execution, which identifies if the ma-turity assessment verified the execution of the lean approach. Thisis related to the point mentioned earlier that most assessments onlydetermine if a standard is documented. The third criterion is NotSurvey Based and this examines the collection of the data. The datais more reliable and objective if it is not survey based and if it is pro-vided by different individuals in the warehouse. The fourth criterion,Warehouse Focus, determines the depth of the focus on warehouseoperations. For example, this criterion is used to determine if theassessment evaluates the warehouses processes (see section 2.2). Thefifth criterion is Tested in Practice and the purpose of this criterionis to determine if the assessment asks questions about the testing oflean techniques in practice.Fullerton et al. (2003) focused on the lean approach but they onlycovered the Just in Time technique with their research and missedothers. Fullerton et al. (2003) did not focus on warehouse operationsand instead focused on the production environment.The Lean Enterprise Self-Assessment Tool (LESAT) was developedby researchers of the Massachusetts Institute of Technology (MIT).The LESAT is based on the Capability Maturity Model for Soft-ware (CMM) and focuses on the lean enterprise and not, specifically,on the warehouse environment. The strength of the CMM is thatit is not survey based and it was developed by science for use in
26
3.3 Tools for Measuring Lean Warehousing
Full fulfilled Partial fulfilled Not fulfilled
Lean
Focus
Verified
Exce-
cution
Not
Survey
Based
Ware-
house
Focus
Tested
in
Practice
Fullerton, McWatters and Fawson
(Fullerton et al., 2003)
Lean Enterprise Self-Assessment
(Hallam, 2003)
Perez and Sanchez
(Perez et al., 2000)
Panizzolo
(Panizzolo, 1998)
Shah
(Shah, 2003)
Jordan and Michel
(Jordan et al. 2001)
The 360° Lean Audit
(Dollen et al. 2003)
Lean Company Survey
(Dollen et al. 2003)
HPEC Assessment
(Dollen et al. 2003)
Lean Checklist Self-Assessment
(Dollen et al. 2003)
Lean Business Assessment
(Dollen et al. 2003)
How Lean is Your Culture?
(Dollen et al. 2003)
Dell Business Assessment
(Shan, 2008)
CMMI for Services
(CMMI Product Team, 2010)
Overboom
(Overboom , 2010)
Sobanski
(Sobanski, 2011)
Mahfouz
(Mahfouz, 2011)
BPS Assessment V. 3.1.
(Bosch2012a)
Figure 3.1: Lean Maturity Assessment overview (Fullerton et al.,2003)(Hallam, 2003; Pérez and Sánchez, 2000; Panizzolo,1998; Shah, 2003; Jordan and Michel, 2001; Doolen andHacker, 2005; Shan, 2008; CMMI Product Team, 2010;Overboom et al., 2010; Sobanski, 2009; Robert BoschGmbH, 2012)
27
3 Literature Review: Measuring the Impact of Lean
the aerospace industry. It has also been verified and modified sev-eral times (Hallam, 2003). Pérez and Sánchez (2000) and Panizzolo(1998) used field-based surveys but they did not cover all warehouseoperations. They verified their theory with the help of a small sam-ple size in Spain and Italy. Shah (2003) and Jordan and Michel(2001) did have higher sample sizes but their research is based onthe survey-based approach. They also did not focus on warehousingoperations.In addition to six scientific research-based lean assessments that arealso considered in this section, Doolen and Hacker (2005) describedseveral lean maturity tools that were developed and used in theindustrial environment. None of them focused on warehouse oper-ations but two of them partially verify the execution of the leanapproach. The Lean Company Survey and HPEC questioned therole of the performance indicator to determine the outcome of leanimplementation. Shan (2008) and the CMMI Product Team (2010)also did not focus on warehouse operations but these assessmentsare often used in practice.As discussed in chapter 3, Overboom et al. (2010), Sobanski (2009),and Mahfouz (2011) developed lean warehousing assessments. Theirassessments failed to cover major warehouse operations (see section2.2) or were not conducted with a large enough sample size (Mah-fouz, 2011). In addition to this, their research does not determine if astandard has been executed. This is missing in all of the assessmentsthat have been analysed so far.Robert Bosch GmbH (2012) developed the only lean maturity assess-ment that has a focus on the existence and execution of implementedlean techniques and verified them with performance indicators. Thisassessment has been used multiple times in more than 290 plants indifferent business sectors all over the world. This assessment is notsurvey based. Unfortunately, it focuses on production and only cov-ers some of the warehouse processes that are mentioned in section2.2.
28
3.3 Tools for Measuring Lean Warehousing
3.3.2 Lean Warehousing Performance Indicators
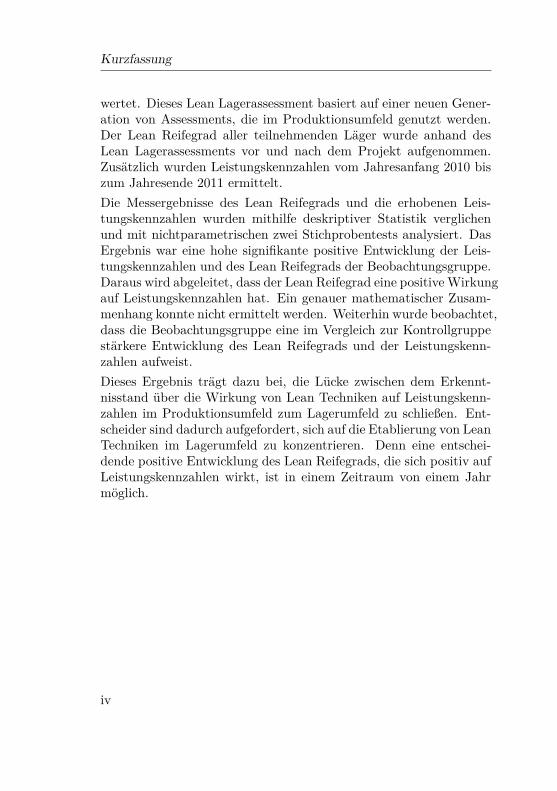
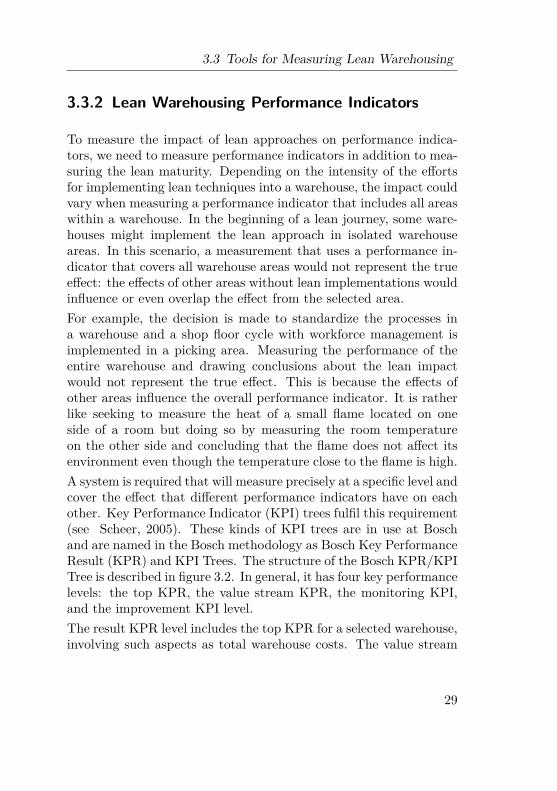
To measure the impact of lean approaches on performance indica-tors, we need to measure performance indicators in addition to mea-suring the lean maturity. Depending on the intensity of the effortsfor implementing lean techniques into a warehouse, the impact couldvary when measuring a performance indicator that includes all areaswithin a warehouse. In the beginning of a lean journey, some ware-houses might implement the lean approach in isolated warehouseareas. In this scenario, a measurement that uses a performance in-dicator that covers all warehouse areas would not represent the trueeffect: the effects of other areas without lean implementations wouldinfluence or even overlap the effect from the selected area.For example, the decision is made to standardize the processes ina warehouse and a shop floor cycle with workforce management isimplemented in a picking area. Measuring the performance of theentire warehouse and drawing conclusions about the lean impactwould not represent the true effect. This is because the effects ofother areas influence the overall performance indicator. It is ratherlike seeking to measure the heat of a small flame located on oneside of a room but doing so by measuring the room temperatureon the other side and concluding that the flame does not affect itsenvironment even though the temperature close to the flame is high.A system is required that will measure precisely at a specific level andcover the effect that different performance indicators have on eachother. Key Performance Indicator (KPI) trees fulfil this requirement(see Scheer, 2005). These kinds of KPI trees are in use at Boschand are named in the Bosch methodology as Bosch Key PerformanceResult (KPR) and KPI Trees. The structure of the Bosch KPR/KPITree is described in figure 3.2. In general, it has four key performancelevels: the top KPR, the value stream KPR, the monitoring KPI,and the improvement KPI level.The result KPR level includes the top KPR for a selected warehouse,involving such aspects as total warehouse costs. The value stream
29

3 Literature Review: Measuring the Impact of Lean
KPR level describes the costs for the different value streams withinthe warehouse, including such aspects as the cost for distributing afull pallet. The KPI for a specific area within the warehouse is mea-sured at the monitoring level. For example, the KPI could evaluatethe productivity of the packaging area or the value stream for thecost for distributing a full pallet. The most detailed measuring isdone at the improvement level. These measurements could includethe quantity of pallets that packer one is packing today. The KPIat the improvement level are usually used for concrete improvementwork.All of these levels are linked with each other. Changes in one levelwill be transmitted to the other levels. For example, the productiv-ity KPI of one packaging team will influence the productivity KPIof the total packaging area and even the total cost KPR of the en-tire warehouse but with less intensity because other teams, like thepickers, also influence the total cost of the warehouse.The purpose of this thesis is to measure the impact of lean ap-proaches on performance indicators. By measuring this, we have toconsider that lean is not something that decision makers want tohave and they can buy and then it is done. Usually, a seed has tobe planted in a specific area of the warehouse. If the people aroundthis seed take care of it, it will grow and spread around the wholewarehouse. This will take time and, as long it is not spread aroundthe whole warehouse, the specific area where it grows has to be mea-sured. The effect of this area might have such a big impact on theKPR that it can be noticed by observing the KPR.A KPR/KPI Tree can be used to recognize the impact in the differentareas and at the different levels. The four levels of the KPR/KPITree make it possible to measure the impact of implemented leantechniques with different levels of penetration.The full implementation of a KPR/KPI Tree with all four levelswithin a warehouse is rare today. The KPIs for the improvementlevel are usually used for concrete improvement work and are oftennot measured constantly. The value stream KPRs are difficult to
30
3.3 Tools for Measuring Lean Warehousing
Val
ue
Cont
ribu
tion
Tota
l War
ehou
se
Cost
sD
eliv
ery
Serv
ice
Qua
lity
...G
EZ...
...D
ir.
Pro
duct
ivit
y
Nee
ded
wor
king
ho
urs
POT
Plan
ed
Unp
lane
d
Num
ber
of
wor
kers
OEE
POT
...
EZ RE EPEI
...LO...
...
Org
aniz
ed
dow
ntim
eTe
chni
cal
Qua
lity
loss
esC/
O lo
sses
Lack
of
mat
eria
lLa
ck o
f per
sonn
el
Part
out
of
tole
ranc
e
Pick
ing
Pack
agin
g...
Are
a 1
Are
a 2
...
...
...
Prod
ucti
vity
wor
ker
1pl
ace
1
Prod
ucti
vity
w
orke
r 2
plac
e 2
...
Re
su
lt K
PR
VS
-KP
R
Mo
nit
ori
ng
KP
I
Imp
rov
em
en
t K
PI
Figu
re3.2:
KPR
/KPI
Tree
exam
ple
31
3 Literature Review: Measuring the Impact of Lean
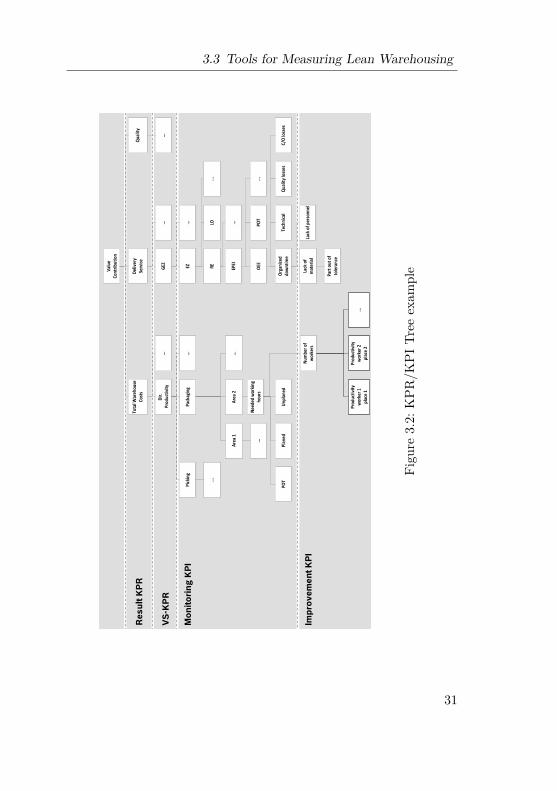
measure within warehouses because several, if not hundreds, of valuestreams are merged in the warehouse. Resources are usually notdedicated to one value stream and one task often influence severalvalue streams. As a result, a precise measurement would take ahuge amount of effort. The monitoring KPIs are also hard to find inwarehouses even though they take less effort to measure. Since thestructure of a warehouse is based on functional areas, leaders allocatecapacities to these areas and usually know the daily output. Becausethis is known, if the monitoring KPI are implemented they usuallystill focus on one area and do not cover all areas of the warehouse.Even result KPRs are not common in each warehouse but they arethe most common performance indicators that are measured.A fully implemented KPR/KPI Tree in each warehouse would bedesirable for a precise measurement. Considering the current statusof the available performance indicators in warehouses, it is realisticto focus on the result KPR and monitoring KPI if they are available.
3.4 Conclusion of the Literature Review
The studies in the production environment analysed the impact oflean techniques on performance indicators. Several studies with ahigh sample size analysed the impact by combining the results oflean maturity studies and performance indicators. A positive impactof lean techniques on performance indicators is backed by severalindependent studies (see section 3.1).Some studies could be found in the warehouse environment thatanalysed the lean maturity using a lean assessment. Other stud-ies analysed performance indicators to determine the lean matu-rity. Unlike the production environment, no study was found inthe warehouse environment that combined the two factors: neitherin pure lean warehouses for analysing a correlation between highermaturity and higher performance nor between lean warehouses andwarehouses without lean techniques for analysing how each group
32

3.4 Conclusion of the Literature Review
performs (see section 3.2).In addition to this, the existing lean maturity assessments for ware-houses do not fulfil the desired minimum criteria (see subsection3.3.1). The Bosch Production System Assessment V. 3.1 has thehighest level of fulfilment of the criteria but it does not focus solelyon warehouse operations.In conclusion, there is a huge gap between the levels of evidencefor the impact of lean techniques on performance indicators in thedifferent environments. It is not currently possible to determinethe impact of lean approaches on performance indicators within thewarehouse environment. Thus, a new study is needed to close thisgap in evidence and analyse the hypotheses described in section 1.2.Unfortunately, none of the existing lean maturity assessments thatfocus on warehouses are adequate enough to fulfil the desired mini-mum criteria. The Bosch Production System Assessment V. 3.1 hasthe highest level of fulfilment of the criteria but it focuses on produc-tion and only covers some of the warehouse processes as mention ear-lier. An adaption of this assessment for the warehouse environmentwould fulfil the desired criteria and enable further studies within thissubject.
33

3 Literature Review: Measuring the Impact of Lean
34

4 Bosch Logistics WarehouseAssessment
Within the scope of this study, the Bosch Production System Assess-ment V. 3.1 was adapted for the warehouse environment and trans-formed into the Bosch Logistics Warehouse Assessment (BLWA).The BLWA was developed for the Warehouse Excellence project ofBosch in the beginning of the year 2010 (compare also Dehdari etal. 2012). Several sources and experts were consulted for the trans-formation of the Bosch Production System Assessment V. 3.1 intothe BLWA.The company Bosch and the Warehouse Excellence project will bediscussed later in chapter 5. This chapter describes the develop-ment and then the structure of the assessment. The purpose of thischapter is to give a general overview of how the assessment works.
4.1 Development of the Bosch LogisticsWarehouse Assessment
The BLWA was developed in several steps. In the first step, thekey literature for the lean approach was re-evaluated (see section2.1). The main components of the lean approach that needed to beassessed in the warehouse assessment were identified based on thedefined requirements. The existing lean maturity assessments thatfocused on the warehouse environments (see section 3.2) were alsoanalyzed. The goal was to find the components that could be used
35

4 Bosch Logistics Warehouse Assessment
for the Bosch Logistics Warehouse Assessment.The second step involved the creation of a new structure. The BoschProduction System Assessment V. 3.1 only focused on some ware-house operations. The warehouse processes (see section 2.2) thatwere not covered by the processes in the Bosch Production SystemAssessment V. 3.1 were included. Matched with the content of theliterature and other assessments, the first draft of the BLWA wasfinalized.The first draft of the BLWA was reviewed by experts from the BoschProduction System. After their feedback was included, guideline-based interviews were used to have the first draft checked by expertsfrom several organizational levels within Bosch. These experts in-cluded representatives from the corporate level, the business unit,warehouse leaders, and shop floor personnel. Experts from the Karl-sruhe Institute of Technology were also questioned.A test version of the BLWA was released after the feedback fromthe interviews was incorporated. The test version was tested inthree warehouses. The feedback from the test version was takeninto consideration and, after a final review by the corporate BoschProduction System expert team, the BLWA was released.
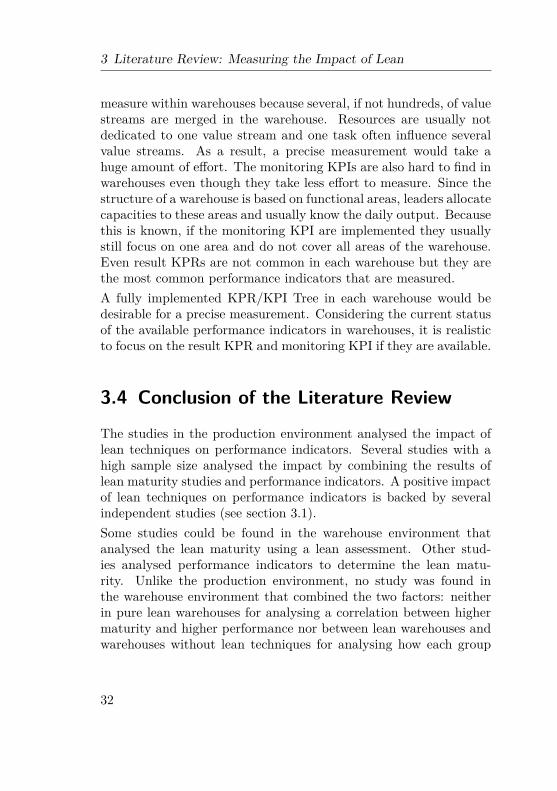
4.2 Structure of the Bosch LogisticWarehouse Assessment
The structure of the BLWA is shown in figure 4.1.The structure is divided into three segments: the Continuous Im-provement Process (CIP), overall subjects, and warehouse processes.The CIP consists of the System-CIP and Point-CIP, which are Bosch-specific terms that were developed by Bosch Production System ex-perts (Robert Bosch GmbH, 2012).The System-CIP pertains to process and value stream design. Itaims to capture the current value stream status with techniques
36
4.2 Structure of the Bosch Logistic Warehouse Assessment
CIP Overall Subjects
Warehouse Processes
3.6
Inco
min
g G
oo
ds
3.5
Sto
rage
3.
4 P
icki
ng
3.3
Pac
kagi
ng
3.2
Out
goin
g G
oo
ds
3.1
Ove
rhea
d
1.1
Sys
tem
- C
IP
Vor
schl
ag 2
– n
icht
bla
u au
f bla
u
1.2
Po
int -
CIP
2.1
Failu
re P
reve
ntio
n S
yste
m
2.2
Em
plo
yee
Invo
lvem
ent
2.3
Sta
ndar
dize
d W
ork
Figu
re4.1:
Bosch
LogisticsWareh
ouse
Assessm
entstructure
37
4 Bosch Logistics Warehouse Assessment
like value stream mapping (Rother and Shook, 2008), layouts, andspaghetti diagrams (Flinchbaugh, 2009). The value stream targetcan also be designed using the true north alignment and the busi-ness requirements of the selected warehouse. System-CIP projectswith target conditions must be defined to close the gap betweenstatus and target. Target conditions consist of a standard, a perfor-mance indicator goal, and a stabilization criterion. The standard hasto be defined, easy to understand, described clearly, and displayedon-site. It also must be possible for workers to meet the standardand it must be measurable. The measurability of the standard isimportant because the second element of the target condition, theperformance indicator, would not make any sense otherwise. Com-prehensive limits also have to be defined to describe the stabilizationcriterion. Finally, adherence to common standards, guidelines, andlegal restrictions has to be ensured. Once these target conditionshave been implemented, they are handed over to the Point-CIP.The Point-CIP is a method for process stabilization and improve-ment. It is comprised of five elements: target condition, quick re-action system, regular communication, sustainable problem solving,and process confirmation. This method continues to be used untilthe stabilization criteria are met permanently.The definition for the Point-CIP target condition is the same asthe one for the System-CIP. The quick reaction system consists ofa trigger for reactions, defined responsibilities, measures, and anescalation scheme. The following questions are used to define a quickreaction system:
• Who? - Responsible person for taking action – starting at theoperator level
• How long? - Time limit for problem solving at each level• What? - Systematic description of measures, how to documentfacts
• How? - Problem solving method to be used
38
4.2 Structure of the Bosch Logistic Warehouse Assessment
• Output? - Records to be created (for example, problem solvingsheet)
• Valid? - 24 hours, Monday to Sunday
Regular communication consists of the definition of the participants,the tools used, and a schedule. Regular communication can be es-tablished at many points within a warehouse: it can be definedat different hierarchical levels or in different areas. An aligned se-quence of the various types of regular communication supports theinput and output of information for the different meetings. Regularcommunication supports the process of sustainable problem solvingand the exchange of information between all departments by rulesdefined at all levels.The following elements are important for sustainable problem solv-ing: a root cause analysis, sustainable countermeasures, sustainableproof of rollout to other areas, prevention of re-occurrences, and astandardization of the result. Sustainable problem solving should bedone in a team with problem solving experts, leaders from the area,and shop floor workers.Process confirmation is a verification of the adherence of the oper-ators to a standard. It also contains an analysis of any deviationsfrom the standard that occurred. Standards have to be checked fre-quently because of fluctuating process outputs, varying parts (forexample, changing the combination of parcels), and changing oper-ators (compare also section 2.3).The strength of the System-CIP and the Point-CIP is the linkingand combination of the elements with each other. The followingreal-world example will make this clear. The System-CIP cyclehighlighted that a new milk run was necessary in one of Bosch’sproduction warehouses in the south of Europe. The target condi-tion for the new milk run was defined: a timetable, a cycle time of 16minutes for the route, and plus or minus 1 minute as the stabiliza-tion criterion. After the milk run was implemented and the workers
39

4 Bosch Logistics Warehouse Assessment
were trained, the target condition was handed over to the Point-CIP. Hours after the implementation, the milk run driver reached astation on his route with a 1.5 minutes delay. The quick reactionsystem helped the milk run driver react accurately. He escalated thedelay to his supervisor and asked for the support of another worker.The quick reaction system also defined that he had to documentthe delay using the questions mentioned above in a regular commu-nication. In the next regular communication, the supervisor askedthe driver for the information about the delay of the milk run andbecause this was a newly defined critical implementation he decidedto establish a problem solving team to understand why the milk runcame late. After investigating the problem in a structured way, theteam discovered that the milk run collided with another milk runevery second or third cycle. They performed some tests and pro-posed a solution to reschedule the new milk run. After discussingthis proposal in the standard management meeting, the standardof the milk run was changed. As part of the process confirmation,the cycle time adherence was checked daily for three months. Theproblem was only considered to be solved permanently if the milkrun did not come late again during this time period.The roots of the System-CIP and the Point-CIP are in the Japaneseautomotive production systems. A lot of the lean systematic men-tioned in section 2.1 by various authors, and in particular, ana-lyzed and summarized by Dehdari and Schwab (2012) is covered bySystem- and Point-CIP. For example, the general topics of failureprevention systems, employee involvement, and standardized work.The main warehouses processes in the assessment represent the pro-cesses described in chapter 2.2. Only input and output are includedunder storage. A detailed list of the topics that are covered is shownin the figures 4.2 and 4.3.The topics also have subtopics. To cover each subtopic, several crite-ria have to be assessed with different maturity levels. The maturitylevels start at 0 and go up to the level 4. The higher the level, themore challenging and mature the criteria. Each criterion has a con-
40

4.2 Structure of the Bosch Logistic Warehouse Assessment
1.1
Syste
m-C
IP
1.2
Po
int-
CIP
2.1
Fa
ilu
re
Pre
ven
tio
n S
yste
m
2.2
Em
plo
yee
Inv
olv
em
en
t
2.3
Sta
nd
ard
ized
Wo
rk
Busin
ess
requirem
ents
Ta
rget
conditio
nW
ork
Conte
nt
Involv
em
ent
Covera
ge o
f
Sta
ndard
ized W
ork
Valu
e S
tream
pla
nnin
g
Quic
k r
eactio
n
syste
mV
isualiz
atio
nT
arg
et
Deplo
ym
ent
Te
am
Lead
Vis
ualiz
atio
n
Identificatio
n o
f
impro
vem
ent
activitie
s
Regula
r
com
munic
atio
n
Qualif
icatio
n /
Tra
inin
gQ
ualif
icatio
n
Defin
itio
n o
f
targ
et
conditio
ns
Susta
inable
pro
ble
m s
olv
ing
Syste
m-C
IP p
roje
cts
Pro
cess
confirm
atio
n
Poin
t C
IP a
reas
Ta
rget
derivatio
nK
PI-
eff
ect
Err
or
rate
Multi-skill
ed
Opera
tors
Sta
bili
ty
Syste
m C
IP c
ycle
sQ
ualit
y o
f
pro
ble
m s
olv
ing
Opera
tor
Involv
em
ent
5S
Sta
tus
Impro
vem
ent
focus
Leaders
hip
Involv
em
ent
Pro
ductivity
Leaders
hip
involv
em
ent
VS
M-Q
ualit
y
Ta
rget
achie
vem
ent1.
CIP
2.
Overa
ll S
ub
jects
Conception Execution
Figu
re4.2:
Bosch
Logistic
Wareh
ouse
Assessm
entTo
pics
Part
1
41

4 Bosch Logistics Warehouse Assessment
3.1
Overh
ead
3.2
Ou
tgo
ing
Go
od
s
3.3
Packag
ing
3.4
Pic
kin
g
3.5
Sto
rag
e
3.6
Inc
om
ing
Go
od
s
Qualific
atio
nO
rganiz
atio
nP
ackaged G
ood
Pic
kin
g P
rocess
Sto
rage
Te
chnic
/Layout
Receiv
ing P
rocess
Te
chnic
al E
quip
ment
Packagin
g M
ate
rial
Org
aniz
atio
nal S
yste
mS
tora
ge C
riteria
Entry
/Bookin
g
Vis
ualiz
atio
nP
ackagin
g P
rocess
Info
rmatio
n S
yste
mIn
vento
ry M
anagem
ent
Inspectio
n
Vis
ualiz
atio
nV
isualiz
atio
nV
isualiz
atio
nV
isualiz
atio
n
Tim
e w
indow
adhere
nce
Lead tim
e o
f the
packagin
g p
rocess
Lead tim
e o
f the
pic
kin
g p
rocess
Lead tim
e o
f the
sto
rage p
rocess
Tim
e w
indow
adhere
nce o
f
receiv
ing
Bala
ncin
g o
f com
ple
te
ship
pin
g p
rocesses
Packagin
g e
rror ra
teP
ickin
g e
rror ra
teS
tora
ge e
rror ra
teB
ala
ncin
g o
f receiv
ing
pro
cesses
Lead tim
e o
f the
ship
pin
g p
rocess
Lead tim
e o
f the re
ceiv
ing
pro
cess
Dis
patc
h e
rror ra
teR
eceiv
ing e
rror ra
te
Handlin
g s
teps
Handlin
g s
teps
ConceptionExecution
3. W
are
ho
us
e P
rocesses
Figure4.3:B
oschLogistic
Warehouse
Assessm
entTopics
Part2
42
4.3 Intermediate Result: Measuring Systematic
cept dimension and an execution dimension that are linked together.This link ensures that the documented standard will be checked tosee if it is executed. Figure 4.4 explains the relationship betweentopics, components, criteria, and maturity levels. The link betweenconcept and execution is explained by the example in figure 4.5. Inthis figure, the standard for time windows is asked for at the con-ceptual stage. During execution, the adherence to the time windowis sought.
4.3 Intermediate Result: MeasuringSystematic
To evaluate the impact of lean techniques accurately, we need tomeasure the maturity of the lean entity and the performance changewith performance indicators. Chapter 4 identifies a gap between thematurity of the methodology measuring the impact of leanness in aproduction environment and that in a warehouse environment. De-tailed measurements are needed to gain reliable knowledge. This iswhy section 3.3.1 identifies BPS Assessment V3.1 as the most precisein terms of the requirements. However, an adaption was necessarybecause it was designed for the production environment. The BLWAfulfills these adaptation needs. Together with the KPR/KPI Tree(see sub section 3.3.2), accurate measurement techniques are nowavailable to test the hypotheses described in section 1.2.
43

4 Bosch Logistics Warehouse AssessmentW
are
ho
us
e A
naly
sis
1.0
M
atu
rity L
evel
Po
ints
W
eig
ht-
ing
Overa
ll
Po
ints
N
o.
To
pic
0
1
2
3
4
3.6
Incoming Goods
CONCEPT
Req
uire
men
ts
Req
uire
men
ts
Req
uire
men
ts
Req
uire
men
ts
Req
uire
men
ts
R
ece
ivin
g P
roce
ss:
Tim
e w
ind
ow
s d
efin
ed fo
r
- the re
ce
ivin
g (e
.g. tru
ck a
rrival, u
nlo
adin
g,
depa
rture
)
or
- the b
oo
kin
g p
roce
ss (in
cl. P
ut-a
wa
y).
Rece
ivin
g P
roce
ss:
Tim
e w
ind
ow
s d
efin
ed fo
r
- the re
ceiv
ing (e
.g. tru
ck a
rrival,
unlo
adin
g,
depa
rture
) in
a re
petitive
pa
ttern
with
ma
x. 3h p
er tru
ck
an
d
- the b
ookin
g pro
cess (in
cl. P
ut-a
wa
y).
Rece
ivin
g P
roce
ss:
- as le
vel
2
- Sta
nd
ard
ize
d w
ork
is d
escrib
ed (e
.g. S
tanda
rdiz
ed
Work
sheet) fo
r the co
mple
te re
ceiv
ing pro
cess,
in w
hich
the p
ack
ing unit is
ha
ndle
d.
- Re
packin
g a
ctiv
ities a
re re
duce
d by d
efin
ed p
ackin
g
pre
scrip
tion
s fo
r supplie
rs.
Rece
ivin
g P
roce
ss:
- as le
vel
3
- Opera
tors
are
work
ing >
90
% o
f their w
ork
time
acco
rdin
g sta
nda
rdiz
ed w
ork
.
1
0.5
0.5
*(1*2
)
=
1
R
ece
ivin
g P
roce
ss:
- The re
ceiv
ing (e
.g. tru
ck a
rrival, u
nlo
adin
g,
bookin
g
pro
cess, p
ut-a
wa
y) is d
one in
a re
pe
titive
patte
rn.
Rece
ivin
g P
roce
ss:
- The re
ce
ivin
g is
contro
lled by ta
kte
d M
ilk-R
uns w
ith
fixed tim
es.
- Sta
nd
ard
ize
d o
pe
ratio
nal p
roce
du
res a
re d
efin
ed fo
r
the co
mple
te re
ceiv
ing pro
cess.
Rece
ivin
g P
roce
ss:
- as le
vel
2
- The s
tan
dard
s a
lso co
nta
in ta
rge
t Cyce
l-time
s fo
r
ea
ch p
roce
dure
, w
hic
h a
re s
ynch
ron
ized to
the M
ik-R
un
frequency
.
- Re
packin
g a
ctiv
ities a
re re
duce
d by d
efin
ed p
ackin
g
pre
scrip
tion
s fo
r supplie
rs.
Rece
ivin
g P
roce
ss:
- as le
vel
3
- Opera
tors
pro
cessin
g a
pa
ckin
g unit a
re w
ork
ing >
90
%
of th
eir w
ork
time a
ccord
ing sta
nda
rdiz
ed w
ork
. 2
E
ntry/B
ookin
g:
- Tw
o-le
vel
entry.
Entry/B
ookin
g:
- as le
vel
1
- En
try in
the s
yste
m is
done n
ot m
ore
than
on
e d
ay
afte
r goods a
re re
ceiv
ed
.
Entry/B
ookin
g:
- Sin
gle
-leve
l entry
- Entry in
the s
yste
m is
done n
ot m
ore
tha
n h
alf a
day
afte
r goods a
re re
ceiv
ed
.
Entry/B
ookin
g:
- as le
vel
3
- Entry in
the s
yste
m is
done n
ea
rly at th
e s
am
e tim
e a
s
goods a
re re
ceive
d (n
ot m
ore
tha
n 2
hours
late
r). 3
In
spectio
n:
- Inspectio
n in
ten
sity
depends o
n fa
ilure
rate
of s
up
plie
r
or co
mpa
rable
criteria
.
Inspectio
n:
- Supplie
r deliv
er
alre
ady fille
d out a
nd s
igned c
on
trol
do
cu
me
nts
with
their g
oods.
Inspectio
n:
- Fre
e tic
ke
t (Fre
ipa
ss) fo
r audite
d s
upplie
rs (e
. g. s
kip
-
quota
afte
r a d
efin
ed s
chem
e).
Inspectio
n:
- as le
vel
3
0
V
isua
liza
tion:
- Pla
nn
ed
an
d a
ctu
al tim
e w
ind
ow
s (e
.g. re
ceiv
ing
boa
rd) fo
r rece
ivin
g pro
cess a
re vis
ua
lize
d.
- Nu
mb
er o
f para
llel p
lan
ne
d tim
e w
ind
ow
s p
er h
ou
r is
mea
sure
d a
nd vis
ua
lized (e
.g. tru
ck a
rrival a
nd d
epa
rture
win
dow
s/h
).
- Vis
ua
lized la
ne
s fo
r inco
min
g goods (m
ark
ed flo
or a
nd
wa
ll labels
)
Vis
ua
liza
tion:
- Pla
nned a
nd a
ctua
l time w
indo
ws (e
.g. re
ceiv
ing boa
rd)
for re
ceiv
ing pro
cess a
nd
bookin
g p
roce
ss a
re
visua
lized
.
- Le
ad
time
of th
e re
ceiv
ing a
nd b
ookin
g p
roce
ss p
er
truck vis
ua
liza
tion
.
Vis
ua
liza
tion:
- as le
vel
2
- Wo
rk in
stru
ctio
n (T
arg
et T
ime a
nd S
tanda
rdiz
ed
Work
sheet) a
re a
vaila
ble
a
t work
pla
ces.
Vis
ua
liza
tion:
- as le
vel
3
3
V
isua
liza
tion:
- Pla
nn
ed
an
d a
ctu
al p
oin
t of tim
e (e
.g. re
ceiv
ing
boa
rd) fo
r rece
ivin
g pro
cess a
re vis
ua
lized
.
- Nu
mb
er o
f para
llel p
lanned re
ce
ivin
gs p
er h
ou
r is
mea
sure
d a
nd vis
ua
lized (e
.g. m
ilkru
nds/h
).
- Vis
ua
lized la
ne
s fo
r inco
min
g goods (m
ark
ed flo
or a
nd
wa
ll labels
).
Vis
ua
liza
tion:
- Pla
nned a
nd a
ctua
l poin
t of tim
e fo
r rece
ivin
g pro
cess
an
d b
ookin
g pro
cess a
re vis
ua
lize
d.
- Le
ad
time
of th
e re
ceiv
ing a
nd b
ookin
g p
roce
ss p
er
truck vis
ua
liza
tion
.
Vis
ua
liza
tion:
- as le
vel
2
- Wo
rk in
stru
ctio
n (P
QI a
nd S
tanda
rdiz
ed W
ork
sheet)
are
ava
ilable
a
t work
pla
ces.
Vis
ua
liza
tion:
- as le
vel
3
3
Avera
ge o
f all a
ch
ieved
po
ints
in c
on
cep
t level
2
EXECUTION
Req
uire
men
ts
Req
uire
men
ts
Req
uire
men
ts
Req
uire
men
ts
Req
uire
men
ts
Po
ints
Tim
e w
indo
w a
dhere
nce
of re
ceiv
ing:
> 7
0%
sch
edule
a
dhere
nce
(check
last m
onth
).
Tim
e w
indo
w a
dhere
nce
of re
ceiv
ing:
> 9
0%
sch
edule
a
dhere
nce
(check
last m
onth
).
Tim
e w
indo
w a
dhere
nce
of re
ceiv
ing:
> 9
0%
sch
edule
a
dhere
nce
(check
last 3
mo
nth
s).
Tim
e w
indo
w a
dhere
nce
of re
ceiv
ing:
- as le
vel
3
1
B
ala
ncin
g o
f rece
ivin
g pro
cesses:
- Wo
rk lo
ad
bala
nce
thro
ughout
the d
ay is
me
asu
red
(on b
asis
of p
ara
llel a
rriving supplie
s).
Ba
lancin
g o
f rece
ivin
g pro
cesses:
- Work
loa
d b
ala
nce
thro
ughout th
e d
ay w
as im
pro
ve
d.
Curre
nt le
vel
bette
r tha
n s
tartin
g le
vel
6 m
on
ths a
go
.
Ba
lancin
g o
f rece
ivin
g pro
cesses:
- Work
loa
d b
ala
nce
thro
ughout th
e d
ay w
as im
pro
ved,
positive
tre
nd o
r at a
sta
ble
targ
et le
vel
sin
ce m
in. 6
mo
nth
s.
Ba
lancin
g o
f rece
ivin
g pro
cesses:
- work
loa
d b
ala
nce
thro
ughout th
e d
ay w
as im
pro
ved,
positive
tre
nd s
ince
th
e la
st 1
2 m
onth
s o
r at a
sta
ble
targ
et le
vel
sin
ce m
in.
12
mo
nth
s.
0
Lea
d tim
e o
f the re
ceiv
ing pro
cess:
- Ave
rag
e le
ad
time
of th
e re
ceiv
ing pro
cess fo
r all
pa
cka
gin
g u
nits
is m
easu
red
.
Lea
d tim
e o
f the re
ceiv
ing pro
cess:
- The a
vera
ge le
ad tim
e o
f all p
ack
agin
g u
nits
is s
table
above
targ
et le
vel
or s
how
s a
positive
tre
nd o
ver th
e p
ast
6 m
on
ths.
Lea
d tim
e o
f the re
ceiv
ing pro
cess:
- The a
vera
ge le
ad tim
e o
f pa
cka
gin
g u
nits
is s
table
above
targ
et le
vel
or s
how
s a
positive
tre
nd o
ver th
e p
ast
12
mo
nth
s.
Lea
d tim
e o
f the re
ceiv
ing pro
cess:
- The a
vera
ge le
ad tim
e o
f pa
cka
gin
g u
nits
is s
table
above
targ
et le
vel
or s
how
s a
positive
tre
nd o
ver th
e p
ast
24
mo
nth
s.
0
R
ece
ivin
g erro
r rate
:
- Fa
ilure
s ca
used in
the re
ceiv
ing pro
cess a
re
me
asu
red
.
- A ta
rget le
vel
wa
s d
efin
ed.
Rece
ivin
g erro
r rate
:
- The e
rror ra
te is
sta
ble
or s
how
s a
positiv
e tre
nd fo
r
more
tha
n 6
mo
nth
s.
Rece
ivin
g erro
r rate
:
- The e
rror ra
te is
sta
ble
or s
how
s a
positiv
e tre
nd fo
r
more
tha
n 1
2 m
on
ths.
Rece
ivin
g erro
r rate
:
- The e
rror ra
te is
sta
ble
or s
how
s a
positiv
e tre
nd fo
r
more
tha
n 2
4 m
on
ths.
1
H
andlin
g s
teps:
- Ha
ndlin
g s
teps a
re co
unte
d.
Ha
ndlin
g s
teps:
- Reductio
n of h
andlin
g ste
ps o
n a
vera
ge e
very
6
mo
nth
s.
Ha
ndlin
g s
teps:
- Reductio
n of h
andlin
g ste
ps o
n a
vera
ge e
very
3
mo
nth
s.
Ha
ndlin
g s
teps:
- Reductio
n of h
andlin
g ste
ps o
n a
vera
ge e
ve
ry
mo
nth
s.
2
Avera
ge o
f all a
ch
ieved
po
ints
in e
xec
utio
n le
vel
1
Cu
rren
tly a
ch
ieve
d m
atu
rity le
vel in
sp
ecific
su
bto
pic
Ea
ch
line
rep
res
en
ts a
sp
ecific
su
bto
pic
, wh
os
e m
atu
rity le
ve
l is e
va
lua
ted
To
rea
ch
a
ce
rtain
ma
turity
lev
el in
a
su
bto
pic
,
the
pro
ce
ss
ha
s to
fulfill
the
sp
ecific
req
uire
-
me
nts
of
tha
t lev
el
A
su
bto
pic
is e
va
lu-
ate
d b
y
the
nu
mb
er
of its
ach
iev
ed
ma
turity
lev
el
Figure4.4:B
LWA
linkbetw
eenexecution
andconcept
44
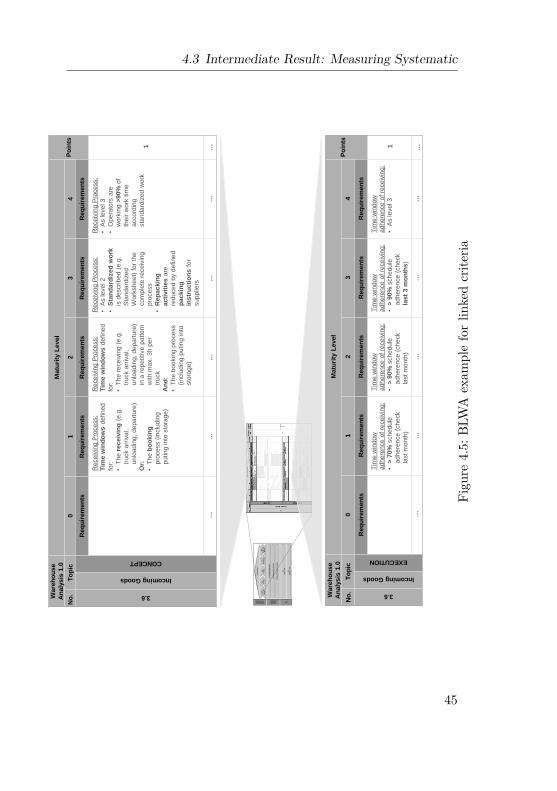
4.3 Intermediate Result: Measuring Systematic
CIPOverall
Subjects
Warehouse
Processes
3.6
Inco
min
g
Go
od
s
3.5
Sto
rag
e
3.4
Pic
kin
g
3.3
Packag
ing
3.2
Ou
tgo
ing
Go
od
s
3.1
Overh
ead
1.1
Syste
m -
CIP
1.2
Po
int -
CIP
2.1
Fail
ure
Pre
ven
tio
n S
yste
m
2.2
Em
plo
yee I
nvo
lvem
en
t
2.3
Sta
nd
ard
ized
Wo
rk
Ware
ho
use
An
aly
sis
1.0
M
atu
rity
Level
Po
ints
N
o.
To
pic
0
1
2
3
4
3.6
Incoming Goods
CONCEPT
Req
uir
em
en
ts
Req
uir
em
en
ts
Req
uir
em
en
ts
Req
uir
em
en
ts
Req
uir
em
en
ts
R
eceiv
ing P
rocess:
Tim
e w
ind
ow
s d
efined
for:
•T
he r
eceiv
ing
(e.g
.
truck a
rriv
al,
unlo
adin
g,
depart
ure
)
Or:
•T
he b
oo
kin
g
pro
cess (
inclu
din
g
puting into
sto
rage)
Receiv
ing P
rocess:
Tim
e w
ind
ow
s d
efined
for:
•T
he r
eceiv
ing (
e.g
.
truck a
rriv
al,
unlo
adin
g,
depart
ure
)
in a
repetitive p
attern
with m
ax.
3h p
er
truck
An
d:
•T
he b
ookin
g p
rocess
(inclu
din
g p
uting into
sto
rage)
Receiv
ing P
rocess:
•A
s level 2
•S
tan
dard
ized
wo
rk
is d
escribed (
e.g
.
Sta
ndard
ized
Work
sheet)
for
the
com
ple
te r
eceiv
ing
pro
cess
•R
ep
ackin
g
acti
vit
ies a
re
reduced b
y defined
packin
g
instr
ucti
on
s f
or
supplie
rs
Receiv
ing
Pro
cess:
•A
s level 3
•O
pera
tors
are
work
ing >
90%
of
their w
ork
tim
e
accord
ing
sta
ndard
ized w
ork
1
…
…
…
…
…
…
Ware
ho
use
An
aly
sis
1.0
M
atu
rity
Level
Po
ints
N
o.
To
pic
0
1
2
3
4
3.6
Incoming Goods
EXECUTION
Req
uir
em
en
ts
Req
uir
em
en
ts
Req
uir
em
en
ts
Req
uir
em
en
ts
Req
uir
em
en
ts
T
ime w
indow
adhere
nce o
f re
ceiv
ing:
•>
70%
schedule
adhere
nce (
check
last m
onth
)
Tim
e w
indow
adhere
nce o
f re
ceiv
ing:
•>
90%
schedule
adhere
nce (
check
last m
onth
)
Tim
e w
indow
adhere
nce o
f re
ceiv
ing:
•>
90%
schedule
adhere
nce (
check
last
3 m
on
ths
)
Tim
e w
indow
adhere
nce o
f re
ceiv
ing:
•A
s level 3
1
…
…
…
…
…
…
Figu
re4.5:
BLW
Aexam
pleforlin
kedcrite
ria
45

4 Bosch Logistics Warehouse Assessment
46
5 Design of the Experiment
The previous chapters identified and developed the measuring met-hod. This chapter discusses the design of the experiment of thisstudy. This means that we get to know the structure of the obser-vation sample and the control sample that are parts of the designof the experiment. This includes the sample sizes, the warehousetypes (see section 2.2) and geographic regions of the warehouse lo-cations. The use of the measuring methods identified and developedin section 4.3 are also described. The analysis of the samples inthis chapter should make it possible to determine the validity of thedefined hypotheses (see section 1.2) in chapter 6.
5.1 Warehouse Excellence Group - theObservation Sample
The Bosch Group is a supplier of technology and services in theareas of automotive and industrial technology, consumer goods, andbuilding technology. These broad areas form a good cross section ofthe economy. The Bosch Group is made up of Robert Bosch GmbHalong with its roughly 350 subsidiaries and regional companies insome 60 countries, including over 800 warehouses. Nearly half ofthe Bosch warehouses are operated by Bosch and the other half arerun by logistics service providers.The performance of these warehouses is crucial to the success of thecompany. High delivery performance targets and quality require-ments have to be fulfilled. These warehouses also cause significant
47

5 Design of the Experiment
costs. However, a Bosch internal observation study showed a gap inthe lean maturity level between the production and warehouse envi-ronment. In order to close this gap, the Bosch Group established apilot project to test and evaluate the adaptation of the Bosch Pro-duction System to the warehouse environment. The Bosch Groupalso decided that an additional goal of the project was to measurethe impact of the Bosch Production System on performance indica-tors. This impact measurement would form the basis for the decisionfor a worldwide rollout that would affect all 800 warehouses.The Bosch Group named the pilot project Warehouse Excellence.The Warehouse Excellence group was chosen randomly and con-sisted of 16 warehouses located in seven countries. These were com-prised of six distribution warehouses, seven plant warehouses, andthree raw material warehouses. These 16 warehouses handle threedifferent kind of businesses. The different businesses are automotivetechnology goods, industrial technology and consumer goods, andbuilding technology. Fourteen warehouses out of the 16 warehousesare single user warehouses and handle one business. Two of the 16warehouses are multi-user warehouses and each of them handle twodifferent businesses. In total, two are involved in industrial technol-ogy, 10 warehouses handle automotive technology, and six deal withconsumer goods and building technology.Eight of the warehouses were operated by Bosch and another eightby logistics service providers. These included three of the five biggestlogistics service providers in the world as measured by the turnover.All other detailed structural information are given in appendix Aand appendix B.
5.1.1 The Warehouse Excellence Project - LeanEmpowerment
The project ran from November 2010 to March 2012. Key perfor-mance indicators are available from January 2010 to December 2011.It is safe to assume that there was less focus on lean in the year 2010
48
5.1 Warehouse Excellence Group - the Observation Sample
than in the year 2011. So, ideally, these two years can be comparedwith each other. This section describes the empowerment program,milestones, and the available data that was gathered during thisperiod.
Empowerment
The actions undertaken within the warehouses were based on anempowerment program. Figure 5.1 shows the four elements of theempowerment program. The empowerment program is based onthe literature in section 2.1 and the experience of Bosch ProductionSystem experts. The aim is to enable the warehouse leader to drivethe continuous improvement process as per the lean warehousingdefinition given in section 2.4. As described in chapter 4, the System-CIP and Point-CIP play a significant role in the achievement of thatgoal. The empowerment program consists of four elements that aredescribed below.Each of the three Bosch Logistics Workshops (BLW) was held overtwo days. The workshop sought to introduce knowledge about theSystem-CIP (BLW I), the Point-CIP (BLW II), and special problemsolving (BLW III) in a practical way. For example, the theory behindvalue stream mapping was taught in an hour-long classroom lecture.The participants then tried value stream mapping within instuctor-led groups in the warehouse. A separate session was necessary forproblem solving because it is so highly complex. The first workshoptook place in December 2010, the second in March 2011, and thelast in June 2011.The Bosch Logistics Learning Groups (BLLG) helped warehousemanagers solve upcoming problems together. Rotational one anda half day visits to different warehouses also supported knowledgetransfer between warehouses. The participants met six to seventimes during the project period.The Bosch Interdisciplinary Local Teams (BILT) supported knowl-edge transfer from the workshops to the warehouse operations of
49

5 Design of the Experiment
the participants. Lean experts coached warehouse managers to ad-just and implement the learned methodologies. The coaches alsoprovided detailed feedback to those in leadership roles.The final component was the exchange of good practices with thelean management working group in the warehouses of the GermanLogistics Association (BVL). In this working group, several compa-nies identified the lean success factors and tested this out in pilotwarehouses of their own. Furmans and Wlcek (2012) summarizedand published the results.
Milestones
The milestones provided a direction and challenged the warehouseswithin their lean activities. These milestones were to be reachedduring the project period. The first milestone required value streammapping, value stream design, and a project plan. The project planwas to close the gap between the two value streams. These repre-sented parts of the System-CIP cycle. The second milestone involvedestablishing regular communication and visualizations. The latterincluded the visualization of standards, process statuses on the shopfloor, and major key performance indicators. The second milestoneserved as preparation for the third, which required one closed Point-CIP cycle from the participating warehouses. In addition to regu-lar communication and target conditions, this included three otherelements: a quick reaction system, problem solving methods, andprocess confirmation. Figure 5.2 shows the milestones covered bythe empowerment components.
Measuring
Three different measurement techniques were used to produce aholistic picture of warehouse performance. These included the BLWA,result KPR tracking, and monitoring KPI tracking if available.In order to reach the milestones, the lean maturity of the warehouses
50

5.1 Warehouse Excellence Group - the Observation Sample
Bo
sc
h L
og
isti
cs
Wo
rks
ho
ps (
BL
W)
•S
yste
m-C
IP, P
oin
t-C
IP a
nd
the
ro
le o
f th
e le
ad
er
•M
ix o
f th
eo
ry a
nd
pra
ctice in a
tra
inin
g w
are
ho
use
•P
art
icip
ants
: M
ix o
f B
osch a
nd
Lo
gis
tic S
erv
ice
Pro
vid
er
Em
plo
ye
es
Bo
sc
h L
og
isti
cs
Le
arn
ing
Gro
up
(B
LL
G)
•G
uid
ed
le
arn
ing
gro
up
s w
ith the
pu
rpo
se
of e
na
blin
g e
ach o
the
r
•R
ota
tio
na
l vis
its o
f d
iffe
rent w
are
ho
use
s
•P
art
icip
ants
: M
ix o
f B
osch a
nd
Lo
gis
tic S
erv
ice
Pro
vid
er
em
plo
ye
es
Bo
sc
h In
terd
isc
iplin
ary
Lo
ca
l Te
am
s (
BIL
T)
•B
PS
Exp
ert
s c
oa
ch a
t th
e s
ide
of th
e w
are
ho
use
ma
na
ge
r
•S
up
po
rt d
uri
ng
im
ple
me
nta
tio
n
•K
no
w-h
ow
of B
PS
and
le
ad
ing
asp
ects
Good Practice Transfer
of the BVL-AK-LML*
*Bund
esvere
inig
ung L
ogis
tik-
Arb
eitskre
is-L
ean M
anagem
ent
in L
ägern
Figu
re5.1:
Wareh
ouse
Excelle
nceem
powermentstructure
51

5 Design of the Experiment
Bo
sch L
og
istic
s
Wo
rksh
op
(BL
W)
Bo
sch L
og
istic
s
Lea
rnin
g G
roup
(BL
LG
)
Bo
sch In
ter-
dis
cip
lina
ry L
oca
l
Te
am
s
(BIL
T)
Lea
n M
an
ag
em
ent
in W
are
ho
use
s
Wo
rkin
g G
roup
(BV
L-A
K-L
ML
)
20
10
2
01
2
20
11
Ja
n
Feb
M
ar
Ap
r M
ay
Ju
ne
Ju
ly
Se
pt
Oct
No
v
Se
pt
Oct
No
v
De
c
Au
g
Ma
r …
Mile
sto
ne
I
•V
SM
/VS
D
•P
roje
ct p
lan
Mile
sto
ne
II
•R
eg
ula
r Co
m.
•V
isu
aliz
atio
n
Mile
sto
ne
III
•P
oin
t CIP
Eva
lua
tion
Figure5.2:W
arehouseExcellence
projectmilestones
52

5.1 Warehouse Excellence Group - the Observation Sample
was recorded with the BLWA (see chapter 4) before warehouse ac-tivities began. The maturity in the 70 components (see figure 4.2and 4.3) were recorded by the assessors for each warehouse. Bymultiplying the number of components with the number of ware-houses, we find 1120 ordinal data at our disposal (compare Bortzand Weber, 2005, for a definition of ordinal data). Each record wasmade on the shop floor by two assessors. Feedback rounds were usedto ensure that the observations were aligned between the assessorsand the warehouse leaders. This ensured that subjective perceptionswere kept to a minimum. The assessors used a laboratory book asan organizational tool to record the most important environmentalpoints not covered in the structure sheet.Rational data (Bortz and Weber, 2005) were provided by the moni-toring KPI measurements. Result KPRs from January 2010 to De-cember 2011 were also analyzed. Delivery performance, quality per-formance, and productivity were also taken into consideration.Delivery performance at the result KPR level represents the overallprocess in most organizations. Delivery performance usually onlymeasures if the confirmed customer order was fulfilled correctly atthe end of the supply chain. To know the root cause, it is necessaryto know where the problem occurred within the supply chain. Forexample, one frequent reason for a delivery performance error is thatthe product was not assembled in time. A more detailed measure-ment, such as that between two internal processes, would indicatewhere it happened but this kind of measurement is rare. This indi-cates that customer claims frequently cannot be tracked back to thesupply chain participant that caused the problem.Another point regarding the measurement of delivery performanceis that very often no trend or fluctuation could be recognized inthe measured performance indicator within the project. The reasonfor this is that the workforce in the consumer goods warehouses ofthe Warehouse Excellence group is highly flexible. The workforceusually extends their working hours until the last order is fulfilled.A flat delivery performance was also common in the participating
53

5 Design of the Experiment
automotive warehouses. No recorded incident suggested that a cus-tomer delivery performance claim was caused by the warehouse. Itwill be difficult to conclude any impact of the lean approach on thisperformance indicator at the result KPR level because of that overallmeasurement of the delivery performance indicator and the usuallyflat line of the delivery performance. To measure the impact withinthe Warehouse Excellence project, a more detailed measurement isrequired than what is available now.Like with delivery performance, the quality performance indicatorat the result KPR level also measures the overall process. The mea-surement shows if the right product in the right quality and in theright quantity reached the customer of the end of the supply chain,regardless of where the mistake was made. There is also a timegap between the error caused on the shop floor and the reportedclaim from the customer. This time gap often blurs the KPR. Inthe automotive sector, the annual claim rates are at most a single-digit figure. This statistic of rare events also frequently leads to aflat quality performance line. To measure the impact within theWarehouse Excellence project, a more detailed measurement of thequality performance indicator is required than what is available now.Productivity is measured by comparing an output factor with aninput factor. In the warehouse, a common measurement is to divideorder lines by man-hours. This means that the measured perfor-mance indicator can represent the focused area exactly. Gaps intime do not exist between the effect caused on the shop floor andthe effect discovered with the KPI. Fluctuating order volumes andadjustments in the workforce also lead to volatile productivity linesthat support effect analysis. Measurements between two differentinternal processes using monitoring KPI are also possible and partlyavailable in warehouses. The lack of time gaps, volatile productivitylines, and the availability of monitoring KPIs are all sufficient formeasuring this performance indicator for this thesis.Another reason why no trend can be recognized by observing thequality performance and delivery performance indicators are the
54

5.2 Control Group
boundary conditions. For a warehouse operation, quality and de-livery performance is more a constrain and productivity is a target.This means that the priority is clear and to the account of produc-tivity performance that let a trend be recognized.In summary, detailed measurements of the delivery performance andquality performance figures will not be taken into consideration. Ofcourse it is important to know that the delivery performance andquality performance have not been influenced negatively by the leanapproach so far. We know that no major incident has taken placewithin the project period. A detailed measurement like the pro-ductivity performance measurement is not possible at this momentbecause of the above mentioned reasons. Therefor the focus will beon productivity measurements. Productivity figures from January2010 to December 2011 are available for each warehouse. MonitoringKPI from areas that focused on implementing lean are also availableand will be analyzed. The data for analysis usually ranges from aperiod before implementation to a certain period after it. The min-imum length of time considered before the lean implementation forcontrol measurements is usually, at a minimum, the same length oftime considered for measurements after implementation.
5.2 Control Group
A control group was needed to test hypothesis IV in section 1.2.The control group consisted of 56 randomly selected Bosch ware-houses located across 16 countries. These included 38 distributionwarehouses and 18 plant warehouses. Thirty-seven warehouses arein the automotive business, 6 in industrial technology, and 13 inconsumer goods and building technology. Twenty-seven of the ware-houses are operated by Bosch and 29 by logistics service providers.This included three of the five largest logistics service providers inthe world as measured by the turnover. All other detailed structuralinformation is provided in appendix B.1. The control group was not
55

5 Design of the Experiment
influenced by an empowerment program or by milestones that theyhad to achieve.Measurements were carried out that were similar to those under-taken for the Warehouse Excellence group. At the same time, lean-ness measurements in the control group were conducted using anonline survey. Before the online survey was released, it was testedon seven staff members from the Karlsruhe Institute of Technology(KIT), one lean expert, and two warehouse managers. The diversityof the test participants ensured feedback from different perspectives.The questionnaire was finalized after the feedback from the test wastaken into consideration.To ensure high response quality, the participating Bosch warehouseswere encouraged by Bosch’s logistic steering committee to completethe survey. The project team contacted each warehouse manager toexplain the purpose and structure of the survey. The warehouseswere given two weeks and the support of the project team to com-plete the survey. A plausibility check ensured that the survey an-swers were filled in precisely. For example, if a warehouse did nothave value stream mapping, they could not have a project plan thatincluded a value stream status and a value stream target. Suchissues were handled by the questionnaire. The final questionnaireconsisted of 19 components that covered the System-CIP and thePoint-CIP. A total of 1064 ordinal data were at our disposal.As a result of the discussion in subsection 5.1.1, the control groupalso focused on productivity KPI so that rational numbers couldbe acquired. From the 56 randomly chosen warehouses, only 18warehouses measured productivity at the result KPR level. This iswhy only 432 rational numbers were acquired.
5.3 Method for Testing the Hypotheses
The method for testing the hypotheses I-IV in section 1.2 is describedin this section. The verification structure is presented in figure 5.3.
56

5.3 Method for Testing the Hypotheses
Lean Maturity
Development
Productivity
Development
Review
Hypotheses
We
mig
ht kn
ow
now
if a
re
latio
nsh
ip e
xis
ts b
etw
een
le
an
ma
turity
deve
lopm
ent a
nd k
ey p
erf
orm
an
ce in
dic
ato
rs
Ch
ap
ter
Hy
po
the
sis
K
ey
Qu
es
tio
n
Wh
at
to D
o?
H
ow
to
Do
It?
6.2
Ba
se
fo
r
ab
scis
sa
of
H I, H
II,
H I
II,
H I
V
Do
we
do
le
an
?
1.
An
aly
se
Wa
Ex
(1
6)
Le
an
ma
turi
ty d
eve
lop
me
nt
2.
Wa
Ex
vs
. C
oG
r:
1.
Wa
Ex
vs
. C
oG
r (
56
)
2.
Wa
Ex
vs
. C
oG
r (
18)
3.
Wa
Ex
vs
. C
oG
r (3
8)
6.3
Ba
se
fo
r
ord
ina
te o
f
H I, H
II,
H I
II,
H I
V
Do
we
im
pro
ve
pe
rfo
rma
nce
ind
ica
tor?
1.
An
aly
sis
Wa
Ex
:
1.
An
aly
se
Wa
Ex
KP
R
de
ve
lop
me
nt
2.
An
aly
se
Wa
Ex
KP
I
de
ve
lop
me
nt
(pro
jects
)
2.
Co
mp
are
Wa
Ex
KP
R
de
ve
lop
me
nt
wit
h C
oG
r
(18)
KP
R d
eve
lop
me
nt
6.4
H
I, H
II,
H I
II,
H I
V
An
y r
ela
tio
ns
hip
be
twe
en
le
an
an
d p
erf
orm
an
ce
ind
ica
tor?
1.
KP
R C
orr
ela
tio
n
An
aly
sis
2.
Re
vie
w h
yp
oth
es
is
WaE
x =
Ware
house E
xcelle
nce G
roup (
16 w
are
houses)
Co
Gr
= C
ontr
ol G
roup w
ithout
Lean (
all
in a
ll 56,
there
from
18 t
hat
measure
d K
PI/K
PR
and
38 t
hat
did
not
measure
KP
I/K
PR
)
De
scr.
Sta
tis
tics
In
fere
nti
al S
tati
sti
cs
Avera
ge v
alu
e
Goodn
ess o
f fit te
st:
Sta
nda
rd d
evia
tion
Gra
ph
s
Tw
o-s
am
ple
Test
De
scr.
Sta
tis
tics
In
fere
nti
al S
tati
sti
cs
Avera
ge v
alu
e
Goodn
ess o
f fit te
st:
Sta
ndard
devia
tion
Gra
ph
s
Tw
o-s
am
ple
Test
Figu
re5.3:
Proo
fstruc
ture
ofthethesis
57

5 Design of the Experiment
The first analysis will show if the Warehouse Excellence group im-plemented lean approaches and improved them. To do this, theWarehouse Excellence group will be evaluated using the BLWA. Theaggregate average scores in each BLWA component will be shown forthe measurement before and after the project. A deviation will benoticed when the two results are compared and this makes it possi-ble to identify the impact of the project. If an improvement in thelean maturity is detected, the precondition for the Hypotheses I-IIIis established because we now know that a movement on the ab-scissa (see 1.2) can be shown. In order to strengthen the statementthat the Warehouse Excellence group improved their lean maturitylevel and to be able to measure the impact of the project, hypothesistests will be conducted to show that the first data set is significantlydifferent from the second data set.To establish the precondition for Hypothesis IV, the delta and devi-ation of the Warehouse Excellence group will be compared with theBLWA results of the control group. The comparison will be donewith three different group compositions and in the following order:
• The entire control group• The 18 warehouses that measure productivity and are the mostmature in terms of lean development
• The warehouses that do not measure productivity
An additional hypothesis test will be carried out to strengthen thestatement about a higher lean maturity development in the Ware-house Excellence group. The results of the hypothesis test of theWarehouse Excellence group will be compared with the test resultsof the control group.The productivity development will be analyzed in the next step.First, the focus will be on productivity development from January2010 to December 2011 at the result KPR level of the WarehouseExcellence group. Next, the productivity development from Jan-
58

5.3 Method for Testing the Hypotheses
uary 2010 to December 2011 will be compared at the result levelfor both groups. Since the lean activities began in the WarehouseExcellence group at the end of 2010, we should see a positive ten-dency in the group in 2011. This would support Hypothesis I. If thetendency of the Warehouse Excellence group is better than that ofthe control group, it would support Hypothesis IV. Additional sup-port for Hypothesis I will involve the analysis of the productivitymonitoring KPI of the Warehouse Excellence group in areas wherelean techniques were implemented. Additional analysis of the leanassessment results could provide evidence about lean improvementsin these areas. A comparison of the level of lean improvement withthat of an increase in productivity could support Hypotheses II andIII. A correlation analysis to validate Hypotheses II and III will alsobe done at the KPR level for the Warehouse Excellence group, thecontrol group, and both groups together.A final discussion on the qualitative factors and reflection on allhypotheses will complete the verification structure and finalize theresearch.
59

5 Design of the Experiment
60
6 Analyzing the Lean ImpactThe design of experiment and the testing structure described inchapter 5 will be used in this chapter to test the hypotheses. First,the statistical techniques that were used to analyze the data willbe described and the reason for their selection will be explained.Then, an analysis of lean improvement, productivity impact, andcorrelation will be conducted.
6.1 Statistical Background
The descriptive statistics will be supported by graphs, tables, andcharacteristic values to present the generated data. Average, stan-dard deviation, and linear regressions will be the characteristic val-ues (Bortz and Weber, 2005; Backhaus et al., 2003) used most oftenin this thesis.Unfortunately, descriptive statistics are limited by the generateddata. It may not be possible to offer a statement about the popu-lation or calculate significance levels. During elections, for example,most institutes ask for a small sample size, evaluate the data, test it,and use it to generate a statement about the population. Inferentialstatistics are needed for such tests. These inferential statistics aredivided into parametric and non-parametric tests. Parametric testsassume that the sample belongs to a population whose distributionis known. Statistical tests on samples evaluate their distribution,ascertaining, for example, if they are normally distributed. Thesetests are called goodness of fit tests. If a goodness of fit test can-not indicate a known distribution for the sample, the sample can be
61
6 Analyzing the Lean Impact
tested by a non-parametric test.
6.1.1 Choosing the Goodness of Fit Test
Lehmann and Romano (2005), Anderson and Darling (1954), Sá(2008), Cirrone et al. (2004), Duller (2008); and Janssen (2005) dis-cussed and analyzed several goodness of fit tests. The literaturereview identified the following tests as the most relevant ones:
• Kolmogorov-Smirnov test• Lilliefors test• Chi-Squared test• Anderson-Darling test• Cramer-von Mises test• Shapiro-Wilk test
Research by Janssen (2005) and Lehmann and Romano (2005) showedthat the Kolmogorov-Smirnov test is more effective than the Chi-Squared test in evaluating goodness of fit. The Anderson-Darling,Cramer-von Mises, and Lilliefors tests are based on the Kolmogorov-Smirnov test. Cirrone et al. (2004) and Lehmann and Romano(2005) said that the Anderson-Darling and Cramer-von Mises testsoutperform the Kolmogorov-Smirnov test because they are moresensitive indicators of the distribution. Sá (2008) compared theKolmogorov-Smirnov test, the Shapiro-Wilk test, and the Lillieforstest. He identified the Kolmogorov-Smirnov test as the weakest ofthe three and the Shapiro-Wilk test as the strongest across varioustested sample sizes. Razali and Wah (2011) compared the Shapiro-Wilk test, the Kolmogorov-Smirnov test, the Lilliefors test, and theAnderson-Darling test. They concluded that the Shapiro-Wilk testis the most powerful test for different distributions and sample sizes.Hence, this research uses the Shapiro-Wilk test as described in Sá
62
6.1 Statistical Background
(2008), Duller (2008), and Razali and Wah (2011).If the Shapiro-Wilk test shows that the sample structures are distri-bution free, non-parametric tests will be used to analyze the samples.
6.1.2 Choosing the Non-Parametric Test
Janssen (2005) describes four distinguishing characteristics that mustbe considered before choosing a non-parametric test. These are sam-ple size, scale level, sample quantity, and whether the samples aredependent from each other or not. Duller (2008), Janssen (2005), Sá(2008), Toutenburg et al. (2009), Genschel and Becker (2005), andGibbons (2003) describe several non-parametric tests.The most common tests for two independent samples with minimumordinal scales are as follows:
• Mann-Whitney U test• Median test• Moses test• Kolmogorov-Smirnov Z test• Wald-Wolfowitz test
Toutenburg et al. (2009) and Duller (2008) describe the Mann-Whitney U, Median, and Moses tests that test specific parametersand show where the difference occurs within samples. The Mann-Whitney U and Median tests are sensitive to the location of the dis-tribution among samples. Janssen (2005) describes the Median testas being a very general test and, hence, rather poor in its effective-ness. The Mann-Whitney test is considered to be very effective forlarge samples. The Moses test is sensitive to the shape of the distri-butions and is similar to the Wilcoxon Signed-Rank test, which willbe described later. It is especially suitable when extreme reactionsare expected (Duller, 2008). The advantage of the Kolmogorov-
63

6 Analyzing the Lean Impact
Smirnov Z test and the Wald-Wolfowitz test is their sensitivity tothe location and shape of the samples distribution. The so-calledOmnibus tests that are sensitive to both criteria cannot show wherethe difference occurs within the samples but indicate when signif-icant differences exist (Genschel and Becker, 2005; Gibbons, 2003;Janssen, 2005; Sá, 2008). Duller (2008) describes the Kolmogorov-Smirnov Z test as being more effective than the Wald-Wolfowitz test.In conclusion, we will use the Kolmogorov-Smirnow Z test for testswith two independent samples with minimum ordinal scales data forthis thesis.The most common tests for two dependent samples with minimumordinal scales are (Janssen, 2005; Sá, 2008; Duller, 2008; Genscheland Becker, 2005) as follows:
• Wilcoxon Signed-Rank test• Sign test
The Wilcoxon Signed-Rank test considers the magnitude of the dif-ference between sample parameters. The Sign test does not, whichmakes the Wilcoxon Signed-Rank test more effective (Sá, 2008).This more effective aspect is also the reason why this test will bechosen for this thesis for tests with two dependent samples withminimum ordinal scales data.All of the described statistical tests are conducted using the IBMSPSS Statistics Version 20 software. SPSS calculates significancelevel for each test. Clauß et al. (1994) and Bol (2003) offer thefollowing interpretation for the calculated significance levels:
• Significance level ≤ 0.001 = high significance level• Significance level > 0.001 and ≤ 0.010 = very significant level• Significance level > 0.010 and ≤ 0.050 = significance level• Significance level > 0.050 and ≤ 0.100 = low significance level
64

6.2 Analysis of Lean Maturity Development
• Not significant if above > 0.100
6.2 Analysis of Lean Maturity Development
The results of the BLWA are presented in this section. The devel-opment of the lean maturity of the Warehouse Excellence group andthe control group are shown by comparing the results of the firstand second assessment.
6.2.1 Lean Maturity Development of the WarehouseExcellence Group
Descriptive Analysis
Chapter 4 described the development of a maturity assessment formeasuring the leanness of a warehouse and section 5.1 described theproject, Warehouse Excellence, while focusing on the 16 warehousesin the observation group. The Bosch Logistics Warehouse Assess-ment evaluated the 16 warehouses from the end of 2010 to the endof 2011 / beginning of the year 2012.The accumulated results are highlighted in the figures 6.1, 6.2, 6.3,6.4 and the tables 6.1, 6.2.Table 6.3 provides figures for the assessment results over two dif-ferent years. There is a high level of improvement in the overallaverage points as well as in the points focusing on the main leancomponents System-CIP and Point-CIP, which were emphasized inthe Warehouse Excellence project. Additionally, the coefficient ofvariation shows that the spread of the function narrows.Table 6.3 shows that the total average accumulated score improvesby about 60 points, an increase of 84%. D.1 shows that each ware-house improves its entire system. Moreover, the variation coefficient
65

6 Analyzing the Lean Impact
Average of the B
osch Logistics Warehouse A
ssessment 2010
Average of the B
osch Logistics Warehouse A
ssessment 2011
CONCEPT
Analysis of the W
arehouse Excellence Group D
evelopment
EXECUTION
Target Condition
Quick Reaction System
Regular Comm
unication
Sustainable Problem Solving
Process Confirmation 0,0
1,0 2,0
3,0 4,0
1.2 Point-CIP
Business Requirements
Value Stream Planning
Identification of Improvem
ent …
Definition of Target Conditions
System-CIP Projects
Point-CIP Areas 0,0 1,0
2,0 3,0
4,0
1.1 System-CIP
Target Derivation
System-CIP Cycles
Improvem
ent Focus
Leadership Involvement
VSM-Q
uality
Target Achievement 0,0
1,0 2,0
3,0 4,0
KPI-effect
Quality of Problem
Solving 0,0 1,0
2,0 3,0
4,0
Figure6.1:B
LWA
results:Warehouse
Excellencegroup
2010vs.
Warehouse
Excellencegroup
2011(part
1)
66
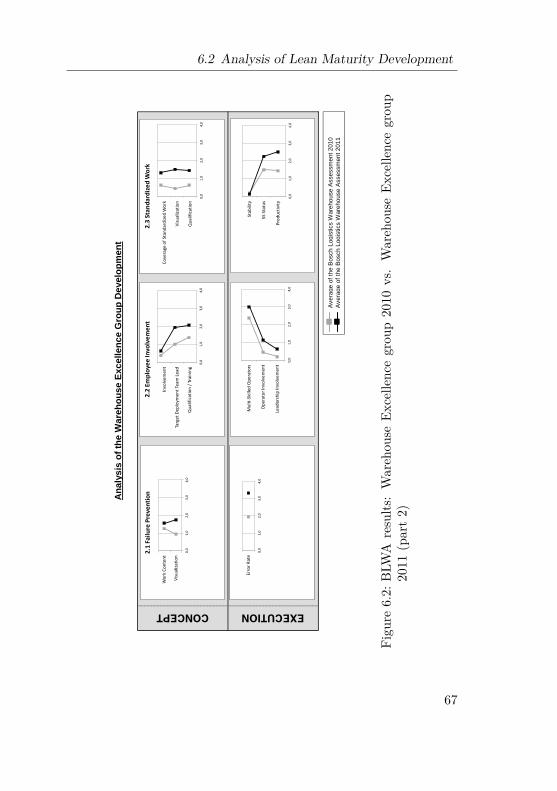
6.2 Analysis of Lean Maturity Development
Ave
rage
of t
he B
osch
Log
istic
s W
areh
ouse
Ass
essm
ent 2
010
Ave
rage
of t
he B
osch
Log
istic
s W
areh
ouse
Ass
essm
ent 2
011
CONCEPT EXECUTION
Ana
lysi
s of
the
War
ehou
se E
xcel
lenc
e G
roup
Dev
elop
men
t
Wor
k Co
nten
t
Visu
aliza
tion
0,0
1,0
2,0
3,0
4,0
2.1
Failu
re P
reve
ntio
n
Invo
lvem
ent
Targ
et D
eplo
ymen
t Tea
m L
ead
Qua
lific
atio
n / T
rain
ing
0,0
1,0
2,0
3,0
4,0
2.2
Empl
oyee
Invo
lvem
ent
Mul
ti-Sk
illed
Ope
rato
rs
Ope
rato
r Inv
olve
men
t
Lead
ersh
ip In
volv
emen
t
0,0
1,0
2,0
3,0
4,0
Cove
rage
of S
tand
ardi
zed
Wor
k
Visu
aliza
tion
Qua
lific
atio
n
0,0
1,0
2,0
3,0
4,0
2.3
Stan
dard
ized
Wor
k
Stab
ility
5S S
tatu
s
Prod
uctiv
ity 0,
0 1,
0 2,
0 3,
0 4,
0
Erro
r Rat
e
0,0
1,0
2,0
3,0
4,0
Figu
re6.2:
BLW
Aresults
:Wareh
ouse
Excelle
ncegrou
p2010
vs.Wareh
ouse
Excelle
ncegrou
p2011
(part2)
67

6 Analyzing the Lean Impact
Average of the B
osch Logistics Warehouse A
ssessment 2010
Average of the B
osch Logistics Warehouse A
ssessment 2011
CONCEPTEXECUTION
Analysis of the W
arehouse Excellence Group D
evelopment
Organization
Technical Equipment
Visualization 0,0 1,0
2,0 3,0
4,0
3.2 Outgoing G
oods
Time W
indow Adherence
Balancing of Complete Shipping
Processes
Lead Time of Shipping Process
Dispatch Error Rate
Handling Steps 0,0 1,0
2,0 3,0
4,0
Packaged Good
Packaging Material
Packaging Process
Visualization 0,0 1,0
2,0 3,0
4,0
3.3 Packaging
Lead Time of Packaging Process
Packaging error rate 0,0 1,0
2,0 3,0
4,0
Qualification 0,0
1,0 2,0
3,0 4,0
3.1 Overhead
Figure6.3:B
LWA
results:Warehouse
Excellencegroup
2010vs.
Warehouse
Excellencegroup
2011(part
3)
68

6.2 Analysis of Lean Maturity Development
Ave
rage
of t
he B
osch
Log
istic
s W
areh
ouse
Ass
essm
ent 2
010
Ave
rage
of t
he B
osch
Log
istic
s W
areh
ouse
Ass
essm
ent 2
011
CONCEPT EXECUTION
Ana
lysi
s of
the
War
ehou
se E
xcel
lenc
e G
roup
Dev
elop
men
t
Pick
ing
Proc
ess
Org
aniza
tiona
l Sys
tem
Info
rmat
ion
Syst
em
Visu
aliza
tion
0,0
1,0
2,0
3,0
4,0
3.4
Pick
ing
Lead
Tim
e of
Pic
king
Pro
cess
Pick
ing
Erro
r Rat
e
0,0
1,0
2,0
3,0
4,0
Stor
age
Tech
nic/
Layo
ut
Stor
age
Crite
ria
Inve
ntor
y M
anag
emen
t
Visu
aliza
tion
0,0
1,0
2,0
3,0
4,0
3.5
Stor
age
Lead
Tim
e of
Sto
rage
Pro
cess
Stor
age
Erro
r rat
e
0,0
1,0
2,0
3,0
4,0
Rece
ivin
g Pr
oces
s
Entr
y/Bo
okin
g
Insp
ectio
n
Visu
aliza
tion
0,0
1,0
2,0
3,0
4,0
3.6
Inco
min
g G
oods
Tim
e W
indo
w A
dher
ence
of
Rece
ivin
g
Bala
ncin
g of
Rec
eivi
ng P
roce
sses
Lead
Tim
e of
Rec
eivi
ng P
roce
ss
Rece
ivin
g Er
ror R
ate
Hand
ling
Step
s
0,0
1,0
2,0
3,0
4,0
Figu
re6.4:
BLW
Aresults
:Wareh
ouse
Excelle
ncegrou
p2010
vs.Wareh
ouse
Excelle
ncegrou
p2011
(part4)
69
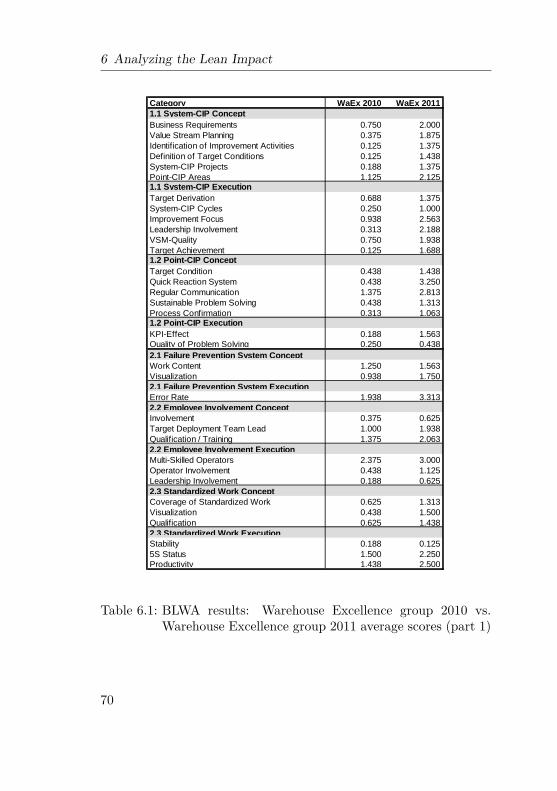
6 Analyzing the Lean Impact
Category WaEx 2010 WaEx 20111.1 System-CIP ConceptBusiness Requirements 0.750 2.000Value Stream Planning 0.375 1.875Identification of Improvement Activities 0.125 1.375Definition of Target Conditions 0.125 1.438System-CIP Projects 0.188 1.375Point-CIP Areas 1.125 2.1251.1 System-CIP ExecutionTarget Derivation 0.688 1.375System-CIP Cycles 0.250 1.000Improvement Focus 0.938 2.563Leadership Involvement 0.313 2.188VSM-Quality 0.750 1.938Target Achievement 0.125 1.6881.2 Point-CIP ConceptTarget Condition 0.438 1.438Quick Reaction System 0.438 3.250Regular Communication 1.375 2.813Sustainable Problem Solving 0.438 1.313Process Confirmation 0.313 1.0631.2 Point-CIP ExecutionKPI-Effect 0.188 1.563Quality of Problem Solving 0.250 0.4382.1 Failure Prevention System ConceptWork Content 1.250 1.563Visualization 0.938 1.7502.1 Failure Prevention System ExecutionError Rate 1.938 3.3132.2 Employee Involvement ConceptInvolvement 0.375 0.625Target Deployment Team Lead 1.000 1.938Qualification / Training 1.375 2.0632.2 Employee Involvement ExecutionMulti-Skilled Operators 2.375 3.000Operator Involvement 0.438 1.125Leadership Involvement 0.188 0.6252.3 Standardized Work ConceptCoverage of Standardized Work 0.625 1.313Visualization 0.438 1.500Qualification 0.625 1.4382.3 Standardized Work ExecutionStability 0.188 0.1255S Status 1.500 2.250Productivity 1.438 2.500
Table 6.1: BLWA results: Warehouse Excellence group 2010 vs.Warehouse Excellence group 2011 average scores (part 1)
70

6.2 Analysis of Lean Maturity Development
Category WaEx 2010 WaEx 20113.1 Overhead ConceptQualification 0.600 1.6883.2 Outgoing Goods ConceptOrganization 0.750 1.063Technical Equipment 2.500 2.500Visualization 0.438 0.8133.2 Outgoing Goods ExecutionTime Window Adherence 0.375 0.688Balancing of Complete Shipping Processes 0.063 0.188Lead Time of Shipping Process 0.063 0.313Dispatch Error Rate 2.031 2.656Handling Steps 0.125 0.0633.3 Packaging ConceptPackaged Good 1.719 1.885Packaging Material 1.625 2.073Packaging Process 0.938 1.208Visualization 1.063 1.5523.3 Packaging ExecutionLead Time of Packaging Process 0.313 0.438Packaging Error Rate 1.688 2.7503.4 Picking ConceptPicking Process 0.969 1.344Organizational System 1.188 1.250Information System 1.594 1.781Visualization 0.875 1.5313.4 Picking ExecutionLead Time of Picking Process 0.063 0.531Picking Error Rate 1.531 2.3443.5 Storage ConceptStorage Technic/Layout 1.906 1.906Storage Criteria 2.031 2.406Inventory Management 2.063 2.438Visualization 1.188 1.1883.5 Storage ExecutionLead Time of Storage Process 0.125 0.313Storage Error Rate 0.313 1.5633.6 Incoming Goods ConceptReceiving Process 0.563 1.281Entry/Booking 1.688 2.188Inspection 0.867 0.867Visualization 0.375 0.8133.6 Incoming Goods ExecutionTime Window Adherence of Receiving 0.625 0.875Balancing of Receiving Processes 0.063 0.625Lead Time of Receiving Process 0.375 0.781Receiving Error Rate 0.813 1.875Handling Steps 0.250 0.063
Table 6.2: BLWA results: Warehouse Excellence group 2010 vs.Warehouse Excellence group 2011 average scores (part 2)
71

6 Analyzing the Lean Impact
WaEx 2010 WaEx 2011 differenceAverage Points in all assessment categories 57.62 105.77 +83.56 %Coefficient of variance by all assessment categories 47.22 % 30.31 %Average Points in System- & Point-CIP categories 9.18 32.81 +257.14 %Coefficient of variance by Points in System- & Point-CIP categories 88.26 % 28.35 %
Table 6.3: BLWA results: total points
becomes smaller, which indicates a more aligned group. This meansthat the improvement of the average score is not just influenced bysingle warehouses that improved greatly while all other warehousesdid not improve. It is more a sign that the entire group reached aspecific positive development.Focusing solely on the results of the System-CIP and Point-CIP, theaverage accumulated score rises by 257%. This increase is largerthan the improvement to the total score. This also represents thefocus and goals of the project. Appendix D.1 shows that before theWarehouse Excellence project only a few warehouses had establisheda continuous improvement cycle from process design to target con-dition implementation and up to process stabilization. By reachingall of the milestones, all warehouses now have a continuous improve-ment cycle with different maturity levels. These are also representedin the scores shown in Appendix D.1.The System-CIP section consists of six components. The three com-ponents – identification of improvements, definition of target condi-tions, and System-CIP projects – are necessary for implementingspecific actions. These three components show a gap in 2010 as wellas in 2011 compared to other System-CIP components. The averagescore of the three components is 0.15 in 2010. For the others, this is0.75 in 2010. In the year 2011, the three components had an aver-age of 1.4, the others had 2.0. This gap narrows (viewed relatively)slightly but is still visible.This also reflects the project team’s experience during the Ware-house Excellence project. The actions that were defined by the
72

6.2 Analysis of Lean Maturity Development
warehouses were inaccurate. For example, the project plans didnot include any capacity planning for the persons involved. Anotherexample is that when a target condition was defined, the KPI neededto monitor that standard was not defined. Also, a systematic wayof identifying the most important areas for improvement did not ex-ist. Furthermore, the link between the goals and the projects wasnot shown with figures. Without these, a comprehensive strategyfor creating and reaching medium-term/long-term goals can neverbe established. This was also one of the major findings during theproject.In the execution part of the System-CIP, the component leadershipinvolvement had an average score of 0.313 in 2010 – one of the lowest.After focusing on the role of the leader in the CIP process, the scorein 2011 was 2.188 points – one of the strongest in the category. Thisindicates that the taken measures were effective.The Point-CIP results improved from an accumulated average scoreof 0.491 to 1.696 in 2011. This delta also shows that the takenmeasures were effective. In 2010, regular communication existed inpractice but most warehouses lacked a well-defined scope for dis-cussing KPIs and their deviations. Problem solving (0.438 pointsin 2010 and 1.313 points in 2011) and process confirmation (0.313points in 2010 and in 1.063 points in 2011) were the two subjectswith the lowest scores but still showed a clear improvement. Theproject team could confirm the assessment results with their expe-riences on the shop floors. None of the warehouses had ever hadproblem solving training with the shop floor team and root causeanalysis was part of the training. Process confirmation was alsolacking. The leaders often implement standards but did not followup on them to ensure adherence.
Inferential Analysis - Goodness of Fit Test
This section analyzes if the changes in the assessment results of theWarehouse Excellence group were significant or not. If we know if
73

6 Analyzing the Lean Impact
the results are significant, we can estimate with a higher level ofevidence if our results are random or based on the influence of thelean approach. In later sections, we will examine the following:
• The total assessment result for each warehouse of the Ware-house Excellence group
• The System-CIP and Point-CIP assessment results for eachwarehouse in the Warehouse Excellence group
• The System-CIP and Point-CIP assessment results for eachwarehouse in the control group
Before using a hypothesis test to describe the significant level of theresults, it is necessary to test how the evaluated data is distributed(see section 6.1.1). If we know that the data is normally distributedor not, we can decide if parametric or non-parametric hypothesistests can be used. To acquire a high level of evidence, the goodnessof fit test will be done on each data set that will be tested later.For the Shapiro-Wilk Test, we will assume the following hypotheses:
H0: The data set is normally distributed -> “We can useparametric two sample tests with a very high test power”
H1: The data set is not normally distributed -> “We have to usenon-parametric two sample tests with a good test power”
Table 6.4 shows the results of the Shapiro-Wilk test for the totalassessment result for each warehouse in the Warehouse Excellencegroup. Each line represents one warehouse. The abbreviation WaExin the row stands for Warehouse Excellence group. The numbers 10and 11 represent the data periods that are evaluated together. Thefirst set of data is from the end of 2010 (10) and the second set is
74

6.2 Analysis of Lean Maturity Development
Shapiro-Wilk
Stat- istic df
Signi- ficance
WaEx 10 & 11 W1 .699 138 .000 WaEx 10 & 11 W2 .854 138 .000 WaEx 10 & 11 W3 .789 138 .000 WaEx 10 & 11 W4 .807 138 .000 WaEx 10 & 11 W5 .758 138 .000 WaEx 10 & 11 W6 .891 138 .000 WaEx 10 & 11 W7 .769 138 .000 WaEx 10 & 11 W8 .785 138 .000 WaEx 10 & 11 W9 .855 138 .000 WaEx 10 & 11 W10 .804 138 .000 WaEx 10 & 11 W11 .879 138 .000 WaEx 10 & 11 W12 .728 138 .000 WaEx 10 & 11 W13 .773 138 .000 WaEx 10 & 11 W14 .782 138 .000 WaEx 10 & 11 W15 .854 138 .000 WaEx 10 & 11 W16 .771 138 .000
Table 6.4: Shapiro-Wilk test for the total assessment results of theWarehouse Excellence group
75

6 Analyzing the Lean Impact
taken at the end of 2011 (11). The calculated significance level isbelow 0.001%. This means that we can reject H0 with a high levelof significance and assume that H1 is valid. This means that nowarehouse in the Warehouse Excellence group has assessment resultsthat are normally distributed and this was expected. In conclusion,non-parametric tests should be used for the evaluation of the totalassessment results of the Warehouse Excellence group.The Hypotheses H0 and H1 can also be applied for the Shapiro-Wilktest in which the System-CIP and Point-CIP assessment results foreach warehouse of the Warehouse Excellence group are analyzed.Table 6.5 shows the result of testing the System-CIP and Point-CIPassessment results of the warehouses in the Warehouse Excellencegroup. The terminology in this table is the same that is used in theShapiro-Wilk test table except that the letters S and P are added,which stand for System-CIP and Point-CIP. All of the warehousestested below the significance level of 0.001% in this test as well. Thismeans that H0 can be rejected with a high level of significance andit can be assumed that H1 is valid. This means we can assume thatthe System-CIP and Point-CIP assessment results of the warehousesin the Warehouse Excellence group are not normally distributed.The System-CIP and Point-CIP assessment results for each ware-house in the control group were then tested to identify the distribu-tion of the data. The hypotheses H0 and H1 were also applied forthis test.Table 6.6 shows the results of the testing of the System-CIP andPoint-CIP assessment of the control group warehouses. Each linerepresents the results of one warehouse. CoGr indicates that thewarehouse is from the control group. The range C1 to C56 representsthe 56 warehouses in the control group. The 10 and 11 representsthe time frame when the data was collected. The warehouses C9,C11, and C13 to C26 did not reach any maturity level and did notmake any progress during the course of the project. They are notidentified separately because no distribution exists. Interpreting thedata leads to the fact that H0 can be rejected with a similar high
76
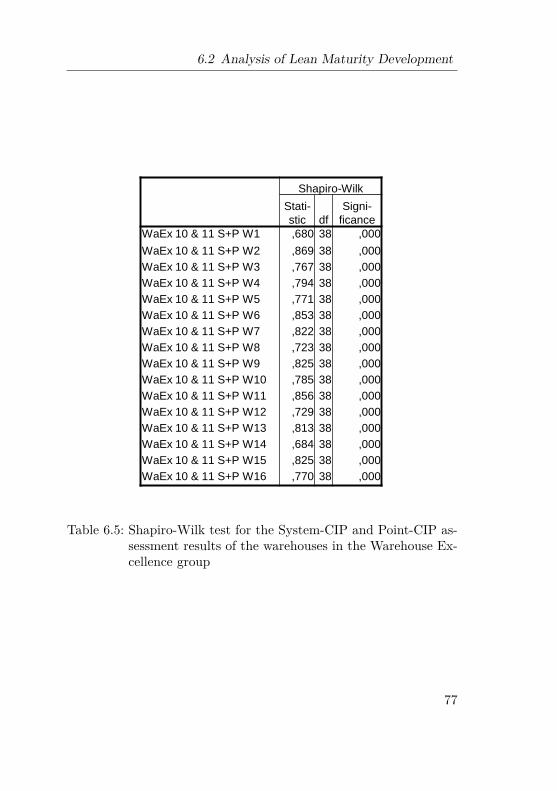
6.2 Analysis of Lean Maturity Development
Shapiro-Wilk
Stati-
stic df
Signi-
ficance
WaEx 10 & 11 S+P W1 ,680 38 ,000
WaEx 10 & 11 S+P W2 ,869 38 ,000
WaEx 10 & 11 S+P W3 ,767 38 ,000
WaEx 10 & 11 S+P W4 ,794 38 ,000
WaEx 10 & 11 S+P W5 ,771 38 ,000
WaEx 10 & 11 S+P W6 ,853 38 ,000
WaEx 10 & 11 S+P W7 ,822 38 ,000
WaEx 10 & 11 S+P W8 ,723 38 ,000
WaEx 10 & 11 S+P W9 ,825 38 ,000
WaEx 10 & 11 S+P W10 ,785 38 ,000
WaEx 10 & 11 S+P W11 ,856 38 ,000
WaEx 10 & 11 S+P W12 ,729 38 ,000
WaEx 10 & 11 S+P W13 ,813 38 ,000
WaEx 10 & 11 S+P W14 ,684 38 ,000
WaEx 10 & 11 S+P W15 ,825 38 ,000
WaEx 10 & 11 S+P W16 ,770 38 ,000
Table 6.5: Shapiro-Wilk test for the System-CIP and Point-CIP as-sessment results of the warehouses in the Warehouse Ex-cellence group
77

6 Analyzing the Lean Impact
Shapiro-Wilk
Shapiro-Wilk
Stati-
stic df
Signi-
ficance
Stati-
stic df
Signi-
ficance
CoGr 10 & 11 C1 ,810 38 ,000 CoGr 10 & 11 C37 ,737 38 ,000
CoGr 10 & 11 C2 ,436 38 ,000 CoGr 10 & 11 C38 ,803 38 ,000
CoGr 10 & 11 C3 ,622 38 ,000 CoGr 10 & 11 C39 ,763 38 ,000
CoGr 10 & 11 C4 ,861 38 ,000 CoGr 10 & 11 C40 ,701 38 ,000
CoGr 10 & 11 C5 ,819 38 ,000 CoGr 10 & 11 C41 ,750 38 ,000
CoGr 10 & 11 C6 ,742 38 ,000 CoGr 10 & 11 C42 ,731 38 ,000
CoGr 10 & 11 C7 ,667 38 ,000 CoGr 10 & 11 C43 ,752 38 ,000
CoGr 10 & 11 C8 ,522 38 ,000 CoGr 10 & 11 C44 ,751 38 ,000
CoGr 10 & 11 C10 ,516 38 ,000 CoGr 10 & 11 C45 ,701 38 ,000
CoGr 10 & 11 C12 ,468 38 ,000 CoGr 10 & 11 C46 ,509 38 ,000
CoGr 10 & 11 C27 ,680 38 ,000 CoGr 10 & 11 C47 ,663 38 ,000
CoGr 10 & 11 C28 ,574 38 ,000 CoGr 10 & 11 C48 ,787 38 ,000
CoGr 10 & 11 C29 ,515 38 ,000 CoGr 10 & 11 C49 ,720 38 ,000
CoGr 10 & 11 C30 ,684 38 ,000 CoGr 10 & 11 C50 ,152 38 ,000
CoGr 10 & 11 C31 ,404 38 ,000 CoGr 10 & 11 C51 ,836 38 ,000
CoGr 10 & 11 C32 ,500 38 ,000 CoGr 10 & 11 C52 ,152 38 ,000
CoGr 10 & 11 C33 ,780 38 ,000 CoGr 10 & 11 C53 ,498 38 ,000
CoGr 10 & 11 C34 ,665 38 ,000 CoGr 10 & 11 C54 ,325 38 ,000
CoGr 10 & 11 C35 ,471 38 ,000 CoGr 10 & 11 C55 ,826 38 ,000
CoGr 10 & 11 C36 ,748 38 ,000 CoGr 10 & 11 C56 ,599 38 ,000
Table 6.6: Shapirot-Wilk test for the assessment results of the con-trol group
78

6.2 Analysis of Lean Maturity Development
significance and the assumption can be made that the lean maturityresults are not normally distributed.The result of the Shapiro-Wilk test shows that the data sets ofWaEx, WaEx S+P, and CoGr respectively are not normally dis-tributed. This needed to be known before choosing the right test(parametric or non-parametric two sample test) to analyze if thetaken measures of the Warehouse Excellence project did have animpact on the maturity level of the participating warehouses.
Inferential Analysis - Wilcoxon Signed-Rank Test for theWarehouse Excellence Group
We know now with a high significance level that the distributionof the maturity development of the warehouses is not normally dis-tributed. This means non-parametric hypothesis tests will help usto determine if the development of the assessment results of eachwarehouse from 2010 to 2011 is random or not. To determine whichnon-parametric test has to be chosen, we also need to know if thedata set from 2010 and the data set from 2011 is dependent on orindependent from each other.Brosius (2011, p. 888) mentions that samples are dependent if thereis a before and after comparison which is this case here. For thisreason, the non-parametric two-sample dependency test that waschosen in chapter 6.1.2 will be used. The following hypotheses havebeen defined for the Wilcoxon Signed-Rank test:
H0: The samples n1 and n2 are from the same population -> “Thewarehouse did not improve their lean maturity”
H1: The samples n1 and n2 are not from the same population ->“The warehouse did improve their lean maturity”
79

6 Analyzing the Lean Impact
The sample n1 is the data set from the assessment results for theyear 2010. The sample n2 is from the assessment results for the year2011.Table 6.7 shows the ranking table of the Wilcoxon Signed-Rank testtotal assessment results for each warehouse in the Warehouse Excel-lence group. In this analysis, the results obtained from the begin-ning of the project were compared with the results obtained at theend of the project. A negative ranking means that the warehousehad a negative development in an assessment component. A posi-tive ranking means that development in a component was positive.Similarly, a tie means there has been no change in the specific com-ponent. Seventy components were considered in total. However, thewarehouses had an overall negative ranking in 1.4% of the cases. In57.3% of the cases, there were ties and there was a positive rankingin 41.3% of the cases. All warehouses had more positive rankingsthan negative ones. This means that the taken measures, duringthe Warehouse Excellence project, could be seen as a positive leanmaturity development.Table 6.8 shows the test statistics for the Wilcoxon Signed-Rank test.Each box represents the before and after comparison in a particularwarehouse. 15 of the 16 warehouses shows with high significanceand one warehouse with significance that H0 can be rejected. Thismeans that it can be assumed that there is a significant differencebetween the samples. In other words, the results from the year2010 are so different from the year 2011 that it cannot be random.This indicates an overall high significance that the taken measuresfrom the Warehouse Excellence project influenced the warehousesand could be seen by the assessments results.Analogous to the Wilcoxon Signed-Rank test, the analysis was con-ducted with the data set from the System-CIP and Point-CIP as-sessment results of the Warehouse Excellence group.Table 6.9 shows the ranking table of the Wilcoxon Signed-Rank testfor the assessment results of the System-CIP and Point-CIP resultsof the Warehouse Excellence group. The warehouses show negative
80

6.2 Analysis of Lean Maturity Development
N Mean Rank
Sum of Ranks N Mean
RankSum of Ranks
Negative Ranks
0a 0.00 0.00 Negative Ranks
4y 21.63 86.50
Positive Ranks
33b 17.00 561.00 Positive Ranks
36z 20.38 733.50
Ties 37c Ties 30aa
Total 70 Total 70Negative Ranks
1d 35.50 35.50 Negative Ranks
3ab 12.33 37.00
Positive Ranks
36e 18.54 667.50 Positive Ranks
24ac 14.21 341.00
Ties 33f Ties 43ad
Total 70 Total 70Negative Ranks
2g 14.75 29.50 Negative Ranks
3ae 11.83 35.50
Positive Ranks
19h 10.61 201.50 Positive Ranks
20af 12.03 240.50
Ties 49i Ties 46ag
Total 70 Total 69Negative Ranks
1j 11.00 11.00 Negative Ranks
1ah 6.50 6.50
Positive Ranks
41k 21.76 892.00 Positive Ranks
19ai 10.71 203.50
Ties 28l Ties 50aj
Total 70 Total 70Negative Ranks
0m 0.00 0.00 Negative Ranks
0ak 0.00 0.00
Positive Ranks
34n 17.50 595.00 Positive Ranks
31al 16.00 496.00
Ties 36o Ties 39am
Total 70 Total 70Negative Ranks
1p 21.50 21.50 Negative Ranks
0an 0.00 0.00
Positive Ranks
32q 16.86 539.50 Positive Ranks
19ao 10.00 190.00
Ties 37r Ties 51ap
Total 70 Total 70Negative Ranks
0s 0.00 0.00 Negative Ranks
0aq 0.00 0.00
Positive Ranks
27t 14.00 378.00 Positive Ranks
28ar 14.50 406.00
Ties 43u Ties 42as
Total 70 Total 70Negative Ranks
0v 0.00 0.00 Negative Ranks
0at 0.00 0.00
Positive Ranks
24w 12.50 300.00 Positive Ranks
38au 19.50 741.00
Ties 46x Ties 32av
Total 70 Total 70
WaEx W5 2011 - WaEx W5 2010
WaEx W6 2011 - WaEx W6 2010
WaEx W7 2011 - WaEx W7 2010
WaEx W8 2011 - WaEx W8 2010
WaEx W1 2011 - WaEx W1 2010
WaEx W2 2011 - WaEx W2 2010
WaEx W3 2011 - WaEx W3 2010
WaEx W4 2011 - WaEx W4 2010
a. WaEx W1 2011 < WaEx W1 2010b. WaEx W1 2011 > WaEx W1 2010c. WaEx W1 2011 = WaEx W1 2010
WaEx W13 2011 - WaEx W13 2010
WaEx W14 2011 - WaEx W14 2010
at. WaEx W16 2011 < WaEx W16 2010au. WaEx W16 2011 > WaEx W16 2010av. WaEx W16 2011 = WaEx W16 2010
WaEx W15 2011 - WaEx W15 2010
WaEx W16 2011 - WaEx W16 2010
WaEx W9 2011 - WaEx W9 2010
WaEx W10 2011 - WaEx W10 2010
WaEx W11 2011 - WaEx W11 2010
WaEx W12 2011 - WaEx W12 2010
between "d" and "as" similar
Table 6.7: Wilcoxon Rank table for the assessment results of thewarehouses in the Warehouse Excellence group
81

6 Analyzing the Lean Impact
WaEx W
1 2011 - W
aEx W1 2010
WaEx W
2 2011 - W
aEx W2 2010
WaEx W
3 2011 - W
aEx W3 2010
WaEx W
4 2011 - W
aEx W4 2010
Z-5,232
b-4,899
b-3,236
b-5,610
b
Asymp. Sig. (2-tailed)
.000.000
.001.000
WaEx W
5 2011 - W
aEx W5 2010
WaEx W
6 2011 - W
aEx W6 2010
WaEx W
7 2011 - W
aEx W7 2010
WaEx W
8 2011 - W
aEx W8 2010
Z-5,157
b-4,710
b-4,724
b-4,485
b
Asymp. Sig. (2-tailed)
.000.000
.000.000
WaEx W
9 2011 - W
aEx W9 2010
WaEx W
10 2011 - W
aEx W10 2010
WaEx W
11 2011 - W
aEx W11 2010
WaEx W
12 2011 - W
aEx W12 2010
Z-4,396
b-3,754
b-3,171
b-3,780
b
Asymp. Sig. (2-tailed)
.000.000
.002.000
WaEx W
13 2011 - W
aEx W13 2010
WaEx W
14 2011 - W
aEx W14 2010
WaEx W
15 2011 - W
aEx W15 2010
WaEx W
16 2011 - W
aEx W16 2010
Z-4,944
b-4,014
b-4,671
b-5,443
b
Asymp. Sig. (2-tailed)
.000.000
.000.000
Test Statistics
a
a. Wilcoxon Test
b. Based on negative ranks.
Table6.8:W
ilcoxonteststatisticsforthe
assessmentresultsofthe
warehousesin
theWarehouse
Excellencegroup
82

6.2 Analysis of Lean Maturity Development
NMean Rank
Sum of Ranks N
Mean Rank
Sum of Ranks
Negative Ranks 0a 0.00 0.00 Negative Ranks 0y 0.00 0.00
Positive Ranks 16b 8.50 136.00 Positive Ranks 15z 8.00 120.00Ties 3c Ties 4aa
Total 19 Total 19Negative Ranks 0d 0.00 0.00 Negative Ranks 0ab 0.00 0.00
Positive Ranks 15e 8.00 120.00 Positive Ranks 14ac 7.50 105.00Ties 4f Ties 5ad
Total 19 Total 19Negative Ranks 0g 0.00 0.00 Negative Ranks 3ae 6.33 19.00
Positive Ranks 9h 5.00 45.00 Positive Ranks 7af 5.14 36.00Ties 10i Ties 9ag
Total 19 Total 19Negative Ranks 0j 0.00 0.00 Negative Ranks 0ah 0.00 0.00
Positive Ranks 15k 8.00 120.00 Positive Ranks 14ai 7.50 105.00Ties 4l Ties 5aj
Total 19 Total 19Negative Ranks 0m 0.00 0.00 Negative Ranks 0ak 0.00 0.00
Positive Ranks 17n 9.00 153.00 Positive Ranks 15al 8.00 120.00Ties 2o Ties 4am
Total 19 Total 19Negative Ranks 0p 0.00 0.00 Negative Ranks 0an 0.00 0.00
Positive Ranks 12q 6.50 78.00 Positive Ranks 7ao 4.00 28.00Ties 7r Ties 12ap
Total 19 Total 19Negative Ranks 0s 0.00 0.00 Negative Ranks 0aq 0.00 0.00
Positive Ranks 12t 6.50 78.00 Positive Ranks 13ar 7.00 91.00Ties 7u Ties 6as
Total 19 Total 19Negative Ranks 0v 0.00 0.00 Negative Ranks 0at 0.00 0.00
Positive Ranks 14w 7.50 105.00 Positive Ranks 17au 9.00 153.00Ties 5x Ties 2av
Total 19 Total 19
c. WaEx W1 2011 = WaEx W1 2010 av. WaEx W16 2011 = WaEx W16 2010
WaEx W15 2011 S+P - WaEx W15 2010 S+P
WaEx W16 2011 S+P - WaEx W16 2010 S+P
au. WaEx W16 2011 > WaEx W16 2010at. WaEx W16 2011 < WaEx W16 2010a. WaEx W1 2011 < WaEx W1 2010
b. WaEx W1 2011 > WaEx W1 2010
WaEx W5 2011 S+P - WaEx W5 2010 S+P
WaEx W6 2011 S+P - WaEx W6 2010 S+P
WaEx W7 2011 S+P - WaEx W7 2010 S+P
WaEx W8 2011 S+P - WaEx W8 2010 S+P
WaEx W1 2011 S+P - WaEx W1 2010 S+P
WaEx W2 2011 S+P - WaEx W2 2010 S+P
WaEx W3 2011 S+P - WaEx W3 2010 S+P
WaEx W4 2011 S+P - WaEx W4 2010 S+P
WaEx W9 2011 S+P - WaEx W9 2010 S+P
WaEx W10 2011 S+P - WaEx W10 2010 S+P
WaEx W11 2011 S+P - WaEx W11 2010 S+P
WaEx W12 2011 S+P - WaEx W12 2010 S+P
WaEx W13 2011 S+P - WaEx W13 2010 S+P
WaEx W14 2011 S+P - WaEx W14 2010 S+P
between "d" and "as" similar
Table 6.9: Wilcoxon Rank table for the assessment results for theSystem-CIP and Point-CIP of the warehouses in theWarehouse Excellence group
83

6 Analyzing the Lean Impact
rankings in 1% of the cases, positive rankings in 69.7 % of the cases,and a tie in 29.3% of the cases. Similar to the earlier results, a pos-itive trend is shown for the taken measures that were implementedduring the Warehouse Excellence project. The higher positive trendcompared to the results of the test that was done before with thedata set of the total assessment underlines the focus of the project:the implementation of a systematic and analytical continuous im-provement cycle with the System-CIP and Point-CIP approach.Table 6.10 shows the test statistics of the Wilcoxon-Signed-Ranktest for the assessment results of the System-CIP and Point-CIPresults of the Warehouse Excellence group. In 11 warehouses, thereis with a high significance level that H0 can be rejected. In fourwarehouses, the results were very significant and in one warehousethe significance level of 0.374 is too low to reject H0. The reasonfor the less strong significance level, compared to the first Wilcoxon-Signed-Rank test statistics, is that the sample size is smaller. Singlenegative cases have a stronger effect on the results because the lowertotal amount of ties does not absorb the single negative impact. Inturn, the other results are very strong despite the small sample size.
Inferential Analysis - Wilcoxon Signed-Rank test for the ControlGroup
In order to evaluate the results of the Wilcoxon Signed-Rank testfor the Warehouse Excellence group, we also analyzed each ware-house in the control group. Tables 6.11 and 6.12 give the rankingtables of the Wilcoxon-Signed-Rank test for the assessment resultsof the System-CIP and Point-CIP components of the control group.The warehouses had negative rankings in 9.3% of the cases, positiverankings in 18.9% of the cases, and ties in 71.8% of the cases. Thisrepresents a moderately positive trend.Seventeen warehouses have ties in all components. This indicatesthat the issue was not totally addressed in the warehouses. Exclud-ing the warehouses with the 19 ties, the results are also moderately
84
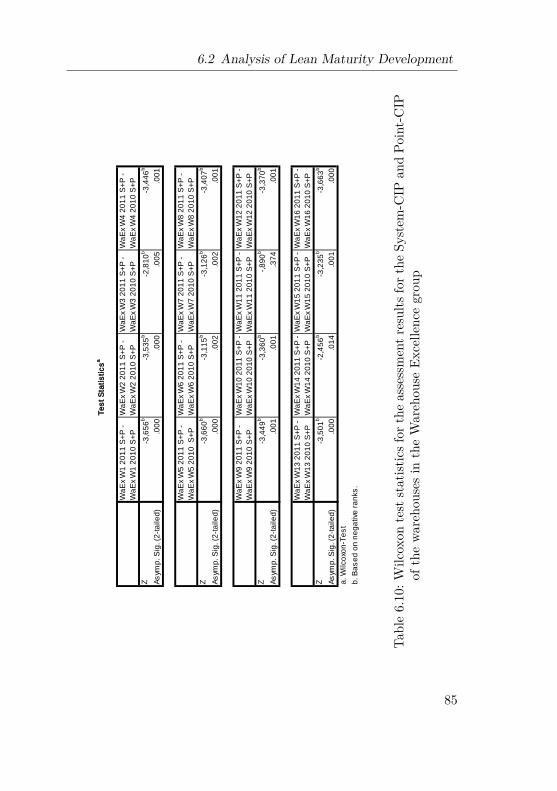
6.2 Analysis of Lean Maturity Development
Test
Sta
tistic
sa
WaE
x W
1 20
11 S
+P -
WaE
x W
1 20
10 S
+PW
aEx
W2
2011
S+P
- W
aEx
W2
2010
S+P
WaE
x W
3 20
11 S
+P -
WaE
x W
3 20
10 S
+PW
aEx
W4
2011
S+P
- W
aEx
W4
2010
S+P
Z-3
,656
b-3
,535
b-2
,810
b-3
,446
b
Asym
p. S
ig. (
2-ta
iled)
.000
.000
.005
.001
WaE
x W
5 20
11 S
+P -
WaE
x W
5 20
10 S
+PW
aEx
W6
2011
S+P
- W
aEx
W6
2010
S+P
WaE
x W
7 20
11 S
+P -
WaE
x W
7 20
10 S
+PW
aEx
W8
2011
S+P
- W
aEx
W8
2010
S+P
Z-3
,660
b-3
,115
b-3
,126
b-3
,407
b
Asym
p. S
ig. (
2-ta
iled)
.000
.002
.002
.001
WaE
x W
9 20
11 S
+P -
WaE
x W
9 20
10 S
+PW
aEx
W10
201
1 S
+P -
WaE
x W
10 2
010
S+P
WaE
x W
11 2
011
S+P
- W
aEx
W11
201
0 S
+PW
aEx
W12
201
1 S
+P -
WaE
x W
12 2
010
S+P
Z-3
,449
b-3
,360
b-,8
90b
-3,3
70b
Asym
p. S
ig. (
2-ta
iled)
.001
.001
.374
.001
WaE
x W
13 2
011
S+P
- W
aEx
W13
201
0 S
+PW
aEx
W14
201
1 S
+P -
WaE
x W
14 2
010
S+P
WaE
x W
15 2
011
S+P
- W
aEx
W15
201
0 S
+PW
aEx
W16
201
1 S
+P -
WaE
x W
16 2
010
S+P
Z-3
,501
b-2
,456
b-3
,235
b-3
,663
b
Asym
p. S
ig. (
2-ta
iled)
.000
.014
.001
.000
a. W
ilcox
on-T
est
b. B
ased
on
nega
tive
rank
s.
Table6.10:W
ilcoxon
test
statist
icsfor
theassessmentr
esults
fort
heSy
stem
-CIP
andPo
int-CIP
ofthewareh
ousesin
theWareh
ouse
Excelle
ncegrou
p
85

6 Analyzing the Lean Impact
N
Mean
Rank
Sum of
Ranks N
Mean
Rank
Sum of
Ranks N
Mean
Rank
Sum of
Ranks
Negative
Ranks5
aw 6,20 31,00 Negative
Ranks0
ca 0,00 0,00 Negative
Ranks0
de 0,00 0,00
Positive
Ranks7
ax 6,71 47,00 Positive
Ranks0
cb 0,00 0,00 Positive
Ranks0
df 0,00 0,00
Ties 7ay Ties 19
cc Ties 19dg
Total 19 Total 19 Total 19
Negative
Ranks4
az 2,50 10,00 Negative
Ranks1
cd 3,50 3,50 Negative
Ranks0
dh 0,00 0,00
Positive
Ranks0
ba 0,00 0,00 Positive
Ranks3
ce 2,17 6,50 Positive
Ranks0
di 0,00 0,00
Ties 15bb Ties 15
cf Ties 19dj
Total 19 Total 19 Total 19
Negative
Ranks2
bc 5,00 10,00 Negative
Ranks0
cg 0,00 0,00 Negative
Ranks0
dk 0,00 0,00
Positive
Ranks6
bd 4,33 26,00 Positive
Ranks0
ch 0,00 0,00 Positive
Ranks0
dl 0,00 0,00
Ties 11be Ties 19
ci Ties 19dm
Total 19 Total 19 Total 19
Negative
Ranks1
bf 4,50 4,50 Negative
Ranks0
cj 0,00 0,00 Negative
Ranks0
dn 0,00 0,00
Positive
Ranks15
bg 8,77 131,50 Positive
Ranks0
ck 0,00 0,00 Positive
Ranks0
do 0,00 0,00
Ties 3bh Ties 19
cl Ties 19dp
Total 19 Total 19 Total 19
Negative
Ranks3
bi 6,17 18,50 Negative
Ranks0
cm 0,00 0,00 Negative
Ranks0
dq 0,00 0,00
Positive
Ranks16
bj 10,72 171,50 Positive
Ranks0
cn 0,00 0,00 Positive
Ranks0
dr 0,00 0,00
Ties 0bk Ties 19
co Ties 19ds
Total 19 Total 19 Total 19
Negative
Ranks2
bl 4,75 9,50 Negative
Ranks0
cp 0,00 0,00 Negative
Ranks0
dt 0,00 0,00
Positive
Ranks6
bm 4,42 26,50 Positive
Ranks0
cq 0,00 0,00 Positive
Ranks0
du 0,00 0,00
Ties 11bn Ties 19
cr Ties 19dv
Total 19 Total 19 Total 19
Negative
Ranks0
bo 0,00 0,00 Negative
Ranks0
cs 0,00 0,00 Negative
Ranks8
dw 4,63 37,00
Positive
Ranks0
bp 0,00 0,00 Positive
Ranks0
ct 0,00 0,00 Positive
Ranks1
dx 8,00 8,00
Ties 19bq Ties 19
cu Ties 10dy
Total 19 Total 19 Total 19
Negative
Ranks1
br 3,50 3,50 Negative
Ranks0
cv 0,00 0,00 Negative
Ranks5
dz 3,80 19,00
Positive
Ranks4
bs 2,88 11,50 Positive
Ranks0
cw 0,00 0,00 Positive
Ranks1
ea 2,00 2,00
Ties 14bt Ties 19
cx Ties 13eb
Total 19 Total 19 Total 19
Negative
Ranks0
bu 0,00 0,00 Negative
Ranks0
cy 0,00 0,00 Negative
Ranks4
ec 3,38 13,50
Positive
Ranks0
bv 0,00 0,00 Positive
Ranks0
cz 0,00 0,00 Positive
Ranks1
ed 1,50 1,50
Ties 19bw Ties 19
da Ties 14ee
Total 19 Total 19 Total 19
Negative
Ranks0
bx 0,00 0,00 Negative
Ranks0
db 0,00 0,00 Negative
Ranks1
ef 1,00 1,00
Positive
Ranks9
by 5,00 45,00 Positive
Ranks0
dc 0,00 0,00 Positive
Ranks0
eg 0,00 0,00
Ties 10bz Ties 19
dd Ties 18eh
Total 19 Total 19 Total 19
aw. CoGr 2011 C1 < CoGr 2010 C1 ef. CoGr 2011 C30 < CoGr 2010 C30
ax. CoGr 2011 C1 > CoGr 2010 C1 eg. CoGr 2011 C30 > CoGr 2010 C30
CoGr 2011 C27 -
CoGr 2010 C27
CoGr 2011 C28 -
CoGr 2010 C28
CoGr 2011 C29 -
CoGr 2010 C29
CoGr 2011 C30 -
CoGr 2010 C30
eh. CoGr 2011 C30 = CoGr 2010 C30
CoGr 2011 C21 -
CoGr 2010 C21
CoGr 2011 C22 -
CoGr 2010 C22
CoGr 2011 C23 -
CoGr 2010 C23
CoGr 2011 C24 -
CoGr 2010 C24
CoGr 2011 C25 -
CoGr 2010 C25
CoGr 2011 C26 -
CoGr 2010 C26
ay. CoGr 2011 C1 = CoGr 2010 C1
CoGr 2011 C11 -
CoGr 2010 C11
CoGr 2011 C12 -
CoGr 2010 C12
CoGr 2011 C13 -
CoGr 2010 C13
CoGr 2011 C14 -
CoGr 2010 C14
CoGr 2011 C15 -
CoGr 2010 C15
CoGr 2011 C16 -
CoGr 2010 C16
CoGr 2011 C17 -
CoGr 2010 C17
CoGr 2011 C18 -
CoGr 2010 C18
CoGr 2011 C19 -
CoGr 2010 C19
CoGr 2011 C20 -
CoGr 2010 C20
CoGr 2011 C1 -
CoGr 2010 C1
CoGr 2011 C2 -
CoGr 2010 C2
CoGr 2011 C3 -
CoGr 2010 C3
CoGr 2011 C4 -
CoGr 2010 C4
CoGr 2011 C5 -
CoGr 2010 C5
CoGr 2011 C6 -
CoGr 2010 C6
CoGr 2011 C7 -
CoGr 2010 C7
CoGr 2011 C8 -
CoGr 2010 C8
CoGr 2011 C9 -
CoGr 2010 C9
CoGr 2011 C10 -
CoGr 2010 C10
between "aw" and "eh" similar
Table 6.11: Wilcoxon Rank table for the assessment results for theSystem-CIP and Point-CIP of the warehouses C1-C30 inthe control group
86
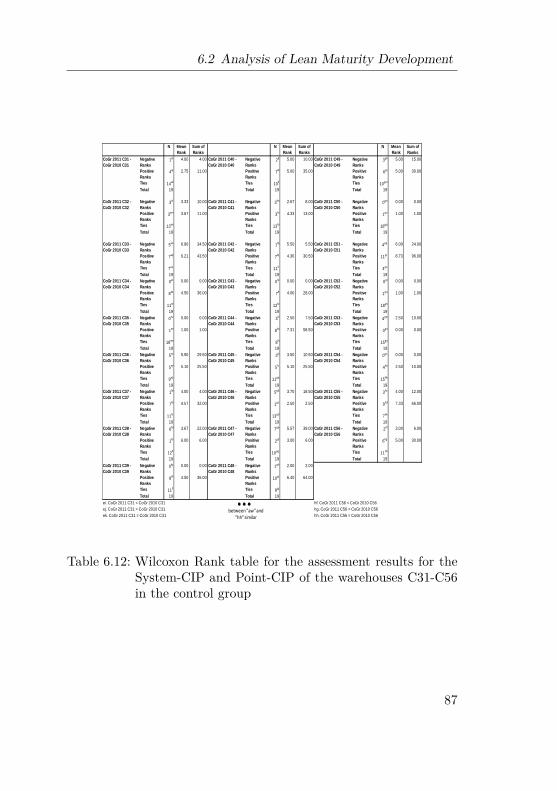
6.2 Analysis of Lean Maturity Development
N Mean Rank
Sum of Ranks
N Mean Rank
Sum of Ranks
N Mean Rank
Sum of Ranks
Negative Ranks
1ei 4.00 4.00 Negative Ranks
2fj 5.00 10.00 Negative Ranks
3gk 5.00 15.00
Positive Ranks
4ej 2.75 11.00 Positive Ranks
7fk 5.00 35.00 Positive Ranks
6gl 5.00 30.00
Ties 14ek Ties 10fl Ties 10gm
Total 19 Total 19 Total 19
Negative Ranks
3el 3.33 10.00 Negative Ranks
3fm 2.67 8.00 Negative Ranks
0gn 0.00 0.00
Positive Ranks
3em 3.67 11.00 Positive Ranks
3fn 4.33 13.00 Positive Ranks
1go 1.00 1.00
Ties 13en Ties 13fo Ties 18gp
Total 19 Total 19 Total 19
Negative Ranks
5eo 6.90 34.50 Negative Ranks
1fp 5.50 5.50 Negative Ranks
4gq 6.00 24.00
Positive Ranks
7ep 6.21 43.50 Positive Ranks
7fq 4.36 30.50 Positive Ranks
11gr 8.73 96.00
Ties 7eq Ties 11fr Ties 4gs
Total 19 Total 19 Total 19Negative Ranks
0er 0.00 0.00 Negative Ranks
0fs 0.00 0.00 Negative Ranks
0gt 0.00 0.00
Positive Ranks
8es 4.50 36.00 Positive Ranks
7ft 4.00 28.00 Positive Ranks
1gu 1.00 1.00
Ties 11et Ties 12fu Ties 18gv
Total 19 Total 19 Total 19Negative Ranks
0eu 0.00 0.00 Negative Ranks
3fv 2.50 7.50 Negative Ranks
4gw 2.50 10.00
Positive Ranks
1ev 1.00 1.00 Positive Ranks
8fw 7.31 58.50 Positive Ranks
0gx 0.00 0.00
Ties 18ew Ties 8fx Ties 15gy
Total 19 Total 19 Total 19Negative Ranks
5ex 5.90 29.50 Negative Ranks
3fy 3.50 10.50 Negative Ranks
0gz 0.00 0.00
Positive Ranks
5ey 5.10 25.50 Positive Ranks
5fz 5.10 25.50 Positive Ranks
4ha 2.50 10.00
Ties 9ez Ties 11ga Ties 15hb
Total 19 Total 19 Total 19Negative Ranks
1fa 4.00 4.00 Negative Ranks
5gb 3.70 18.50 Negative Ranks
3hc 4.00 12.00
Positive Ranks
7fb 4.57 32.00 Positive Ranks
1gc 2.50 2.50 Positive Ranks
9hd 7.33 66.00
Ties 11fc Ties 13gd Ties 7he
Total 19 Total 19 Total 19Negative Ranks
6fd 3.67 22.00 Negative Ranks
7ge 5.57 39.00 Negative Ranks
2hf 3.00 6.00
Positive Ranks
1fe 6.00 6.00 Positive Ranks
2gf 3.00 6.00 Positive Ranks
6hg 5.00 30.00
Ties 12ff Ties 10gg Ties 11hh
Total 19 Total 19 Total 19Negative Ranks
0fg 0.00 0.00 Negative Ranks
1gh 2.00 2.00
Positive Ranks
8fh 4.50 36.00 Positive Ranks
10gi 6.40 64.00
Ties 11fi Ties 8gj
Total 19 Total 19
ej. CoGr 2011 C31 > CoGr 2010 C31
CoGr 2011 C35 - CoGr 2010 C35
CoGr 2011 C36 - CoGr 2010 C36
CoGr 2011 C37 - CoGr 2010 C37
CoGr 2011 C31 - CoGr 2010 C31
CoGr 2011 C32 - CoGr 2010 C32
CoGr 2011 C46 - CoGr 2010 C46
ek. CoGr 2011 C31 = CoGr 2010 C31
ei. CoGr 2011 C31 < CoGr 2010 C31
CoGr 2011 C38 - CoGr 2010 C38
CoGr 2011 C39 - CoGr 2010 C39
CoGr 2011 C42 - CoGr 2010 C42
CoGr 2011 C43 - CoGr 2010 C43
CoGr 2011 C33 - CoGr 2010 C33
CoGr 2011 C34 - CoGr 2010 C34
CoGr 2011 C47 - CoGr 2010 C47
CoGr 2011 C44 - CoGr 2010 C44
CoGr 2011 C45 - CoGr 2010 C45
CoGr 2011 C40 - CoGr 2010 C40
CoGr 2011 C41 - CoGr 2010 C41
CoGr 2011 C51 - CoGr 2010 C51
CoGr 2011 C52 - CoGr 2010 C52
CoGr 2011 C48 - CoGr 2010 C48
CoGr 2011 C49 - CoGr 2010 C49
CoGr 2011 C50 - CoGr 2010 C50
hf. CoGr 2011 C56 < CoGr 2010 C56hg. CoGr 2011 C56 > CoGr 2010 C56hh. CoGr 2011 C56 = CoGr 2010 C56
CoGr 2011 C53 - CoGr 2010 C53
CoGr 2011 C54 - CoGr 2010 C54
CoGr 2011 C55 - CoGr 2010 C55
CoGr 2011 C56 - CoGr 2010 C56
between "aw" and "hh" similar
Table 6.12: Wilcoxon Rank table for the assessment results for theSystem-CIP and Point-CIP of the warehouses C31-C56in the control group
87
6 Analyzing the Lean Impact
positive: 13.4% of the cases have a negative ranking, 27.1% of thecases show a positive trend, and 59.55% of the rankings were ties.Tables 6.13 and 6.14 show the test statistics for the Wilcoxon-Signed-Rank test for the assessment results of the System-CIP and Point-CIP results of the control group. H0 can be rejected
• with a high significance level for one warehouse,• with a very significance level for five warehouses,• with significance for six warehouses and• with a low significance level for nine warehouses.
In other words, it can be assumed, that in 21 warehouses, withminimum low significance level, the warehouses did improve theirlean maturity. In the case of the other 35 warehouse, H0 cannot berejected and this indicates that these warehouses did not improvetheir lean maturity significant.Summarized for the control group this means that just 37.5% of thewarehouses did improve their lean maturity with a minimum lowsignificance level. Compared to the Warehouse Excellence group,in which 93.75% of the warehouses showed with minimum a verysignificance level an improvement, this means that the control groupimproved absolute and relative much less.
6.2.2 The Warehouse Excellence Group versus theControl Group
In earlier sections, we analyzed the development of the WarehouseExcellence group. We also compared the test statistics results ofthe Warehouse Excellence group with the control group. In thissection we will describe the direct comparison of the assessmentresults of the Warehouse Excellence group with the control group.This will be done first with the entire control group of 56 warehouses,
88

6.2 Analysis of Lean Maturity Development
Test Statisticsa
CoGr 2011 C1 - CoGr 2010 C1
CoGr 2011 C2 - CoGr 2010 C2
CoGr 2011 C3 - CoGr 2010 C3
CoGr 2011 C4 - CoGr 2010 C4
Z -,644b -1,841c -1,140b -3,337b
Asymp. Sig. (2-tailed) .519 .066 .254 .001
CoGr 2011 C5 - CoGr 2010 C5
CoGr 2011 C6 - CoGr 2010 C6
CoGr 2011 C7 - CoGr 2010 C7
CoGr 2011 C8 - CoGr 2010 C8
Z -3,111b -1,199b ,000d -1,131b
Asymp. Sig. (2-tailed) .002 .230 1.000 .258
CoGr 2011 C9 - CoGr 2010 C9
CoGr 2011 C10 - CoGr 2010 C10
CoGr 2011 C11 - CoGr 2010 C11
CoGr 2011 C12 - CoGr 2010 C12
Z ,000d -2,751b ,000d -,552b
Asymp. Sig. (2-tailed) 1.000 .006 1.000 .581
CoGr 2011 C13 - CoGr 2010 C13
CoGr 2011 C14 - CoGr 2010 C14
CoGr 2011 C15 - CoGr 2010 C15
CoGr 2011 C16 - CoGr 2010 C16
Z ,000d ,000d ,000d ,000d
Asymp. Sig. (2-tailed) 1.000 1.000 1.000 1.000
CoGr 2011 C17 - CoGr 2010 C17
CoGr 2011 C18 - CoGr 2010 C18
CoGr 2011 C19 - CoGr 2010 C19
CoGr 2011 C20 - CoGr 2010 C20
Z ,000d ,000d ,000d ,000d
Asymp. Sig. (2-tailed) 1.000 1.000 1.000 1.000
CoGr 2011 C21 - CoGr 2010 C21
CoGr 2011 C22 - CoGr 2010 C22
CoGr 2011 C23 - CoGr 2010 C23
CoGr 2011 C24 - CoGr 2010 C24
Z ,000d ,000d ,000d ,000d
Asymp. Sig. (2-tailed) 1.000 1.000 1.000 1.000
CoGr 2011 C25 - CoGr 2010 C25
CoGr 2011 C26 - CoGr 2010 C26
CoGr 2011 C27 - CoGr 2010 C27
CoGr 2011 C28 - CoGr 2010 C28
Z ,000d ,000d -1,780c -1,807c
Asymp. Sig. (2-tailed) 1.000 1.000 .075 .071a. Wilcoxon Testb. Based on negative ranks.b. Based on positive ranks.d. The sum of the negative ranks is equal the sum of the positive ranks
Table 6.13: Wilcoxon test statistics for the assessment results for theSystem-CIP and Point-CIP of the warehouses C1-C28 inthe control group
89

6 Analyzing the Lean Impact
Test Statisticsa
CoGr 2011 C29 - CoGr 2010 C29
CoGr 2011 C30 - CoGr 2010 C30
CoGr 2011 C31 - CoGr 2010 C31
CoGr 2011 C32 - CoGr 2010 C32
Z -1,633c -1,000c -,966b -,105b
Asymp. Sig. (2-tailed) .102 .317 .334 .916
CoGr 2011 C33 - CoGr 2010 C33
CoGr 2011 C34 - CoGr 2010 C34
CoGr 2011 C35 - CoGr 2010 C35
CoGr 2011 C36 - CoGr 2010 C36
Z -,365b -2,636b -1,000b -,207c
Asymp. Sig. (2-tailed) .715 .008 .317 .836
CoGr 2011 C37 - CoGr 2010 C37
CoGr 2011 C38 - CoGr 2010 C38
CoGr 2011 C39 - CoGr 2010 C39
CoGr 2011 C40 - CoGr 2010 C40
Z -2,111b -1,364c -2,588b -1,667b
Asymp. Sig. (2-tailed) .035 .172 .010 .096
CoGr 2011 C41 - CoGr 2010 C41
CoGr 2011 C42 - CoGr 2010 C42
CoGr 2011 C43 - CoGr 2010 C43
CoGr 2011 C44 - CoGr 2010 C44
Z -,539b -1,781b -2,401b -2,303b
Asymp. Sig. (2-tailed) .590 .075 .016 .021
CoGr 2011 C45 - CoGr 2010 C45
CoGr 2011 C46 - CoGr 2010 C46
CoGr 2011 C47 - CoGr 2010 C47
CoGr 2011 C48 - CoGr 2010 C48
Z -1,100b -1,725c -1,997c -2,791b
Asymp. Sig. (2-tailed) .271 .084 .046 .005
CoGr 2011 C49 - CoGr 2010 C49
CoGr 2011 C50 - CoGr 2010 C50
CoGr 2011 C51 - CoGr 2010 C51
CoGr 2011 C52 - CoGr 2010 C52
Z -,917b -1,000b -2,078b -1,000b
Asymp. Sig. (2-tailed) .359 .317 .038 .317
CoGr 2011 C53 - CoGr 2010 C53
CoGr 2011 C54 - CoGr 2010 C54
CoGr 2011 C55 - CoGr 2010 C55
CoGr 2011 C56 - CoGr 2010 C56
Z -1,890c -1,841b -2,144b -1,725b
Asymp. Sig. (2-tailed) .059 .066 .032 .084a. Wilcoxon Testb. Based on negative ranks.b. Based on positive ranks.d. The sum of the negative ranks is equal the sum of the positive ranks
Table 6.14: Wilcoxon test statistics for the assessment results for theSystem-CIP and Point-CIP of the warehouses C29-C56in the control group
90

6.2 Analysis of Lean Maturity Development
then with the 18 warehouses in the control group that have detailedperformance indicators, and finally with the 38 warehouses that donot yet implement performance indicators.
Warehouse Excellence Group versus Control Group (56)
Figure 6.5 reflects the accumulated System-CIP and Point-CIP as-sessment results of the Warehouse Excellence group in comparisonwith the control group before the start of the project. Both groupshad similar maturity levels. The biggest deviations are in the fol-lowing areas: Point-CIP with a 0.5 point difference, VSM-Qualitywith a 0.7 point difference, Sustainable Problem Solving with a 0.6point difference, and Quality of Problem Solving with a 1.0 pointdifference. However, the total average score of the control group is8.6 points and the average total score of the Warehouse Excellencegroup is 9.2 points. The difference of 0.6 points shows that bothgroups had similar maturity levels at the beginning of the projectbecause 0.6 points represents 6.5% of the total average score of theWarehouse Excellence group.However, compared to this development, the gap between the Ware-house Excellence group and the control group is distinctly higherin 2011. Figure 6.6 shows this gap, especially in the Quick Reac-tion System component which has a difference of 2.0 points and theImprovement Focus, Leadership Involvement, and Regular Commu-nication components which each have a 1.7 point difference. Thetotal score of the Warehouse Excellence group is 32.8 points. Thecontrol group has a total score of 12.8 points. This means thata development is recognizable but since it is 20 points lower thanthe Warehouse Excellence group it is clearly less developed in leantechniques.Table 6.15 summarizes the comparison of the results of the Ware-house Excellence group and the control group as discussed above.The coefficient of variation has also been listed. Both groups hadvery similar figures in 2010 but in the year 2011 the Warehouse Ex-
91
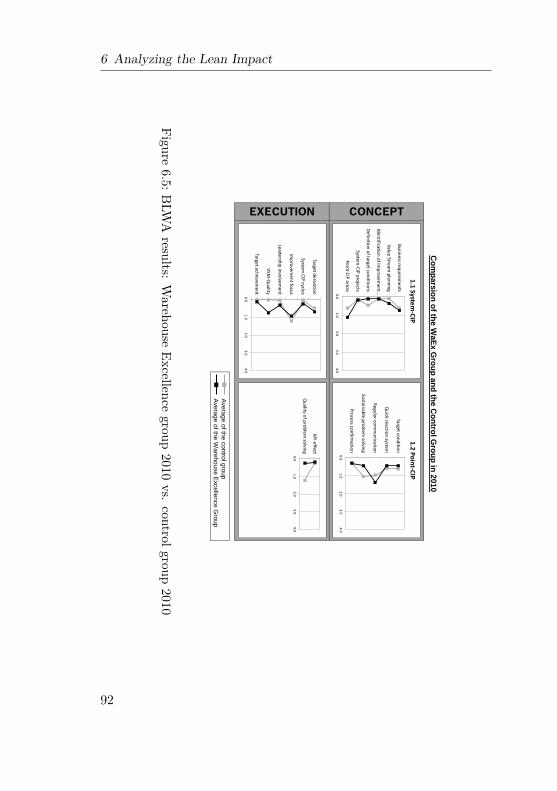
6 Analyzing the Lean Impact
Average of the control group
Average of the W
arehouse Excellence G
roup
Com
parsion of the WaEx G
roup and the Control G
roup in 2010
CONCEPTEXECUTION
Target condition
Quick reaction system
Regular comm
unication
Sustainable problem solving
Process confirmation 0.0
1.0 2.0
3.0 4.0
1.2 Point-CIP
Business requirements
Value Stream planning
Identification of improvem
ent …
Definition of target conditions
System-CIP projects
Point CIP areas 0.0 1.0
2.0 3.0
4.0
1.1 System-CIP
Target derivation
System CIP cycles
Improvem
ent focus
Leadership involvement
VSM-Q
uality
Target achievement 0.0
1.0 2.0
3.0 4.0
KPI-effect
Quality of problem
solving 0.0 1.0
2.0 3.0
4.0
Figure6.5:B
LWA
results:Warehouse
Excellencegroup
2010vs.
controlgroup2010
92

6.2 Analysis of Lean Maturity Development
Ave
rage
of t
he c
ontro
l gro
upA
vera
ge o
f the
War
ehou
se E
xcel
lenc
e G
roup
CONCEPT EXECUTION
Com
pars
ion
of th
e W
aEx
Gro
up a
nd th
e C
ontr
ol G
roup
in 2
011
Targ
et co
nditi
on
Qui
ck re
actio
n sy
stem
Regu
lar c
omm
unic
atio
n
Sust
aina
ble
prob
lem
solv
ing
Proc
ess c
onfir
mat
ion
0.0
1.0
2.0
3.0
4.0
1.2
Poin
t-CI
P
Busin
ess r
equi
rem
ents
Valu
e St
ream
pla
nnin
g
Iden
tific
atio
n of
impr
ovem
ent …
Defin
ition
of t
arge
t con
ditio
ns
Syst
em-C
IP p
roje
cts
Poin
t CIP
are
as 0.
0 1.
0 2.
0 3.
0 4.
0
1.1
Syst
em-C
IP
Targ
et d
eriv
atio
n
Syst
em C
IP c
ycle
s
Impr
ovem
ent f
ocus
Lead
ersh
ip in
volv
emen
t
VSM
-Qua
lity
Targ
et a
chie
vem
ent
0.0
1.0
2.0
3.0
4.0
KPI-e
ffect
Qua
lity
of p
robl
em so
lvin
g
0.0
1.0
2.0
3.0
4.0
Figu
re6.6:
BLW
Aresults
:Wareh
ouse
Excelle
ncegrou
p2011
vs.controlg
roup
2011
93

6 Analyzing the Lean Impact
WaEx
2010
CoGr (38)
2010
difference
2010
WaEx
2011
CoGr (38)
2011
difference
2011
Average Points in the
System- and Piont-CIP assessment topics9,18 7,82 1,36 32,81 10,32 22,49
Variance coefficient
in the System- and Point-CIP assessment topics88,26% 107,66% 28,35% 134,66%
WaEx
2010
CoGr (18)
2010
difference
2010
WaEx
2011
CoGr (18)
2011
difference
2011
Average Points in the System- and Piont CIP
assessment categories9,18 10,28 3,9 32,81 18,11 14,7
Variance coefficient
in the System- and Point-CIP assessment topics88,26% 61,06% 28,35% 71,04%
WaEx
2010
CoGr
2010
difference
2010
WaEx
2011
CoGr
2011
difference
2011
Average Points in the System- and Piont CIP
assessment categories9,18 8,61 0,57 32,81 12,82 19,99
Variance coefficient
in the System- and Point-CIP assessment topics88,26% 90,85% 28,35% 108,76%
Table 6.15: Assessment results achieved
cellence group had a distinct projection. The Warehouse Excellencegroup also improved more uniformly overall in contrast to the con-trol group. In this group, a few good warehouses pulled the averagetotal score up from 8.61 to 12.82. An indication for this is the coef-ficient of variation for the groups. The Warehouse Excellence grouphad a narrower spread in 2011 compared to the control group. Thespread of the control group in 2011 was higher than in 2010.
Warehouse Excellence Group versus Control Group (18)
Figure 6.7 shows the accumulated System-CIP and Point-CIP as-sessment results of the Warehouse Excellence group in comparisonwith control group (18). Control group (18) consists of 18 ware-houses from the entire control group. These warehouses have beenseparated because they are the only ones that measure productivitywithin the respective warehouse. This indicates that these ware-houses have a focuse on facts and figures and might also promotelean techniques. Thus, this comparison will isolate supposedly ma-ture warehouses from the entire control group.Both groups in this comparison also had similar profiles and matu-rity levels. However, the gap in the total score achieved betweenthe two groups is broader than in chapter 6.2.2. The total score ofthe Warehouse Excellence group is 9.2 points and the total score ofcontrol group (18) is 10.3 points. The biggest deviations from eachother are in the components Improvement Focus with a 1.2 pointdifference and Quality of Problem solving with 1.1 points difference.
94

6.2 Analysis of Lean Maturity Development
Aver
age
of th
e co
ntro
l gro
upAv
erag
e of
the
War
ehou
se E
xcel
lenc
e G
roup
Com
pars
ion
of th
e W
aEx
Gro
up a
nd th
e C
ontr
ol G
roup
(18)
in 2
010
CONCEPT EXECUTION
Targ
et co
nditi
on
Qui
ck re
actio
n sy
stem
Regu
lar c
omm
unic
atio
n
Sust
aina
ble
prob
lem
solv
ing
Proc
ess c
onfir
mat
ion
0.0
1.0
2.0
3.0
4.0
1.2
Poin
t-CI
P
Busin
ess r
equi
rem
ents
Valu
e St
ream
pla
nnin
g
Iden
tific
atio
n of
impr
ovem
ent …
Defin
ition
of t
arge
t con
ditio
ns
Syst
em-C
IP p
roje
cts
Poin
t CIP
are
as 0.
0 1.
0 2.
0 3.
0 4.
0
1.1
Syst
em-C
IP
Targ
et d
eriv
atio
n
Syst
em C
IP c
ycle
s
Impr
ovem
ent f
ocus
Lead
ersh
ip in
volv
emen
t
VSM
-Qua
lity
Targ
et a
chie
vem
ent
0.0
1.0
2.0
3.0
4.0
KPI-e
ffect
Qua
lity
of p
robl
em so
lvin
g
0.0
1.0
2.0
3.0
4.0
Figu
re6.7:
BLW
Aresults
:Wareh
ouse
Excelle
ncegrou
p2010
vs.controlg
roup
(18)
2010
95
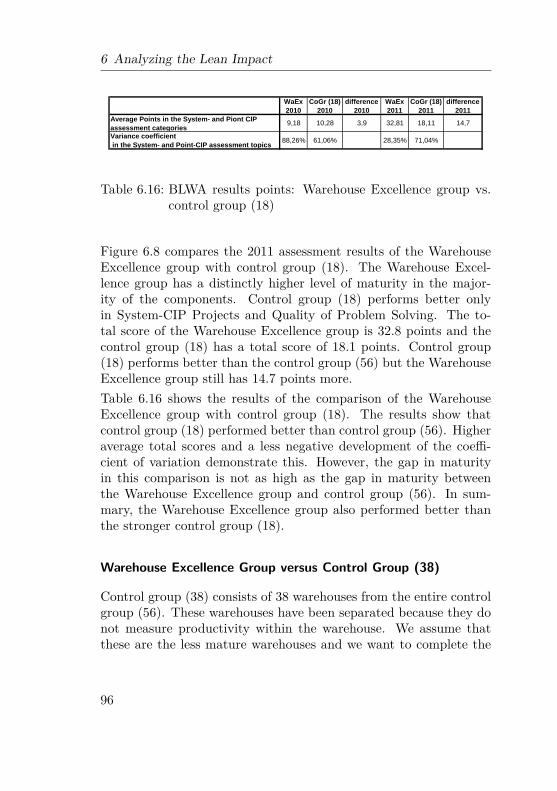
6 Analyzing the Lean Impact
WaEx
2010
CoGr (38)
2010
difference
2010
WaEx
2011
CoGr (38)
2011
difference
2011
Average Points in the
System- and Piont-CIP assessment topics9,18 7,82 1,36 32,81 10,32 22,49
Variance coefficient
in the System- and Point-CIP assessment topics88,26% 107,66% 28,35% 134,66%
WaEx
2010
CoGr (18)
2010
difference
2010
WaEx
2011
CoGr (18)
2011
difference
2011
Average Points in the System- and Piont CIP
assessment categories9,18 10,28 3,9 32,81 18,11 14,7
Variance coefficient
in the System- and Point-CIP assessment topics88,26% 61,06% 28,35% 71,04%
Table 6.16: BLWA results points: Warehouse Excellence group vs.control group (18)
Figure 6.8 compares the 2011 assessment results of the WarehouseExcellence group with control group (18). The Warehouse Excel-lence group has a distinctly higher level of maturity in the major-ity of the components. Control group (18) performs better onlyin System-CIP Projects and Quality of Problem Solving. The to-tal score of the Warehouse Excellence group is 32.8 points and thecontrol group (18) has a total score of 18.1 points. Control group(18) performs better than the control group (56) but the WarehouseExcellence group still has 14.7 points more.Table 6.16 shows the results of the comparison of the WarehouseExcellence group with control group (18). The results show thatcontrol group (18) performed better than control group (56). Higheraverage total scores and a less negative development of the coeffi-cient of variation demonstrate this. However, the gap in maturityin this comparison is not as high as the gap in maturity betweenthe Warehouse Excellence group and control group (56). In sum-mary, the Warehouse Excellence group also performed better thanthe stronger control group (18).
Warehouse Excellence Group versus Control Group (38)
Control group (38) consists of 38 warehouses from the entire controlgroup (56). These warehouses have been separated because they donot measure productivity within the warehouse. We assume thatthese are the less mature warehouses and we want to complete the
96

6.2 Analysis of Lean Maturity Development
Aver
age
of th
e co
ntro
l gro
up (1
8)Av
erag
e of
the
War
ehou
se E
xcel
lenc
e G
roup
Com
pars
ion
of th
e W
aEx
Gro
up a
nd th
e C
ontr
ol G
roup
(18)
in 2
011
CONCEPT EXECUTION
Targ
et co
nditi
on
Qui
ck re
actio
n sy
stem
Regu
lar c
omm
unic
atio
n
Sust
aina
ble
prob
lem
solv
ing
Proc
ess c
onfir
mat
ion
0.0
1.0
2.0
3.0
4.0
1.2
Poin
t-CI
P
Busin
ess r
equi
rem
ents
Valu
e St
ream
pla
nnin
g
Iden
tific
atio
n of
impr
ovem
ent …
Defin
ition
of t
arge
t con
ditio
ns
Syst
em-C
IP p
roje
cts
Poin
t CIP
are
as 0.
0 1.
0 2.
0 3.
0 4.
0
1.1
Syst
em-C
IP
Targ
et d
eriv
atio
n
Syst
em C
IP c
ycle
s
Impr
ovem
ent f
ocus
Lead
ersh
ip in
volv
emen
t
VSM
-Qua
lity
Targ
et a
chie
vem
ent
0.0
1.0
2.0
3.0
4.0
KPI-e
ffect
Qua
lity
of p
robl
em so
lvin
g
0.0
1.0
2.0
3.0
4.0
Figu
re6.8:
BLW
Aresults
:Wareh
ouse
Excelle
ncegrou
p2011
vs.controlg
roup
(18)
2011
97
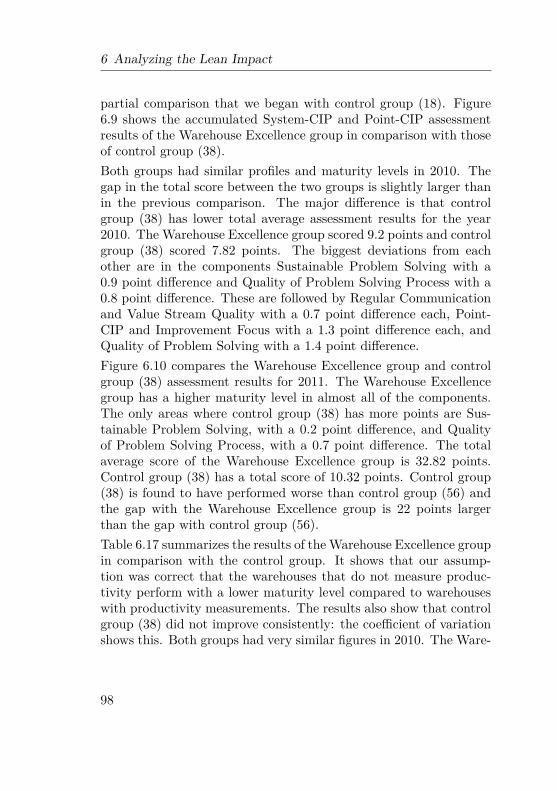
6 Analyzing the Lean Impact
partial comparison that we began with control group (18). Figure6.9 shows the accumulated System-CIP and Point-CIP assessmentresults of the Warehouse Excellence group in comparison with thoseof control group (38).Both groups had similar profiles and maturity levels in 2010. Thegap in the total score between the two groups is slightly larger thanin the previous comparison. The major difference is that controlgroup (38) has lower total average assessment results for the year2010. The Warehouse Excellence group scored 9.2 points and controlgroup (38) scored 7.82 points. The biggest deviations from eachother are in the components Sustainable Problem Solving with a0.9 point difference and Quality of Problem Solving Process with a0.8 point difference. These are followed by Regular Communicationand Value Stream Quality with a 0.7 point difference each, Point-CIP and Improvement Focus with a 1.3 point difference each, andQuality of Problem Solving with a 1.4 point difference.Figure 6.10 compares the Warehouse Excellence group and controlgroup (38) assessment results for 2011. The Warehouse Excellencegroup has a higher maturity level in almost all of the components.The only areas where control group (38) has more points are Sus-tainable Problem Solving, with a 0.2 point difference, and Qualityof Problem Solving Process, with a 0.7 point difference. The totalaverage score of the Warehouse Excellence group is 32.82 points.Control group (38) has a total score of 10.32 points. Control group(38) is found to have performed worse than control group (56) andthe gap with the Warehouse Excellence group is 22 points largerthan the gap with control group (56).Table 6.17 summarizes the results of the Warehouse Excellence groupin comparison with the control group. It shows that our assump-tion was correct that the warehouses that do not measure produc-tivity perform with a lower maturity level compared to warehouseswith productivity measurements. The results also show that controlgroup (38) did not improve consistently: the coefficient of variationshows this. Both groups had very similar figures in 2010. The Ware-
98
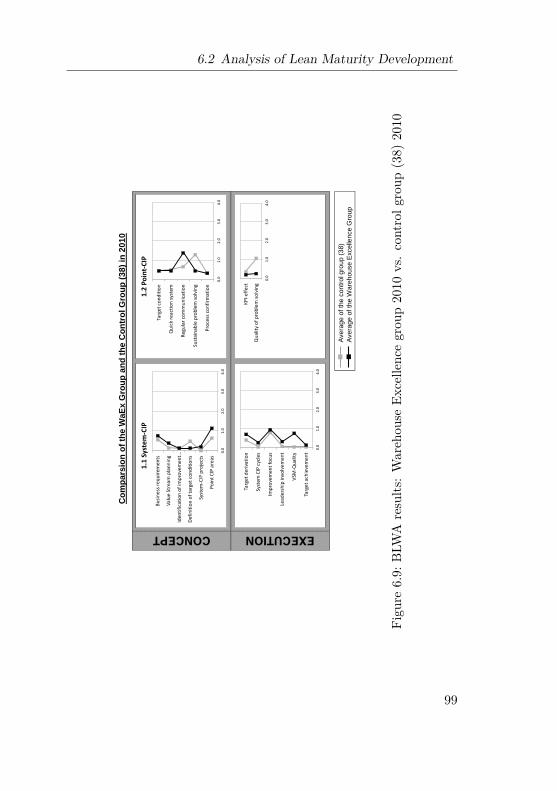
6.2 Analysis of Lean Maturity Development
Aver
age
of th
e co
ntro
l gro
up (3
8)Av
erag
e of
the
War
ehou
se E
xcel
lenc
e G
roup
Com
pars
ion
of th
e W
aEx
Gro
up a
nd th
e C
ontr
ol G
roup
(38)
in 2
010
CONCEPT EXECUTION
Targ
et co
nditi
on
Qui
ck re
actio
n sy
stem
Regu
lar c
omm
unic
atio
n
Sust
aina
ble
prob
lem
solv
ing
Proc
ess c
onfir
mat
ion
0.0
1.0
2.0
3.0
4.0
1.2
Poin
t-CI
P
Busin
ess r
equi
rem
ents
Valu
e St
ream
pla
nnin
g
Iden
tific
atio
n of
impr
ovem
ent …
Defin
ition
of t
arge
t con
ditio
ns
Syst
em-C
IP p
roje
cts
Poin
t CIP
are
as 0.
0 1.
0 2.
0 3.
0 4.
0
1.1
Syst
em-C
IP
Targ
et d
eriv
atio
n
Syst
em C
IP c
ycle
s
Impr
ovem
ent f
ocus
Lead
ersh
ip in
volv
emen
t
VSM
-Qua
lity
Targ
et a
chie
vem
ent
0.0
1.0
2.0
3.0
4.0
KPI-e
ffect
Qua
lity
of p
robl
em so
lvin
g
0.0
1.0
2.0
3.0
4.0
Figu
re6.9:
BLW
Aresults
:Wareh
ouse
Excelle
ncegrou
p2010
vs.controlg
roup
(38)
2010
99
6 Analyzing the Lean Impact
Average of the control group (38)Average of the W
arehouse Excellence Group
Com
parsion of the WaEx G
roup and the Control G
roup (38) in 2011
CONCEPTEXECUTION
Target condition
Quick reaction system
Regular comm
unication
Sustainable problem solving
Process confirmation 0.0
1.0 2.0
3.0 4.0
1.2 Point-CIP
Business requirements
Value Stream planning
Identification of improvem
ent …
Definition of target conditions
System-CIP projects
Point CIP areas 0.0 1.0
2.0 3.0
4.0
1.1 System-CIP
Target derivation
System CIP cycles
Improvem
ent focus
Leadership involvement
VSM-Q
uality
Target achievement 0.0
1.0 2.0
3.0 4.0
KPI-effect
Quality of problem
solving 0.0 1.0
2.0 3.0
4.0
Figure6.10:B
LWA
results:Warehouse
Excellencegroup
2011vs.
controlgroup(18)
2011
100

6.2 Analysis of Lean Maturity Development
WaEx 2010
CoGr (38) 2010
difference 2010
WaEx 2011
CoGr (38) 2011
difference 2011
Average Points in the System- and Piont-CIP assessment topics 9,18 7,82 1,36 32,81 10,32 22,49Variance coefficient in the System- and Point-CIP assessment topics 88,26% 107,66% 28,35% 134,66%
Table 6.17: BLWA results points: Warehouse Excellence group vs.control group (38)
house Excellence group had a narrower spread in 2011 compared tothe control group. The spread of the control group in 2010 was lowerthan in 2011.
6.2.3 Intermediate Result: Lean Improvement
Subsection 6.2.1 demonstrated a noticeable improvement in the leanmaturity level of the Warehouse Excellence group. That sectionalso showed that the coefficient of variation was lower in 2011 thanin 2010. This indicates that the warehouses focused on the leanimprovement approach. The better results in the coefficient of vari-ation could be explained with the set milestone goals. Before theproject, none of the participating warehouses were mature enough toreach the milestones without an empowerment program. After theempowerment program, all warehouses reached the milestones andfulfilled the set minimum requirements. Since the milestones wereset as goals and the warehouses achieved them, a slight tendencytowards an alignment of the maturity had taken place.The notable improvement in the lean maturity levels are clearlyshown by the Wilcoxon Signed-Rank test in 6.2.1. The WilcoxonSigned-Rank test determined that differences between the data setsof 2010 and 2011 exist for 93.75% of the warehouses with a high levelof significance. In the control group, the Wilcoxon Signed-Rank testshowed that a difference between the samples of the years 2010 and2011 exists for 21 Warehouses with minimum significance. In con-
101
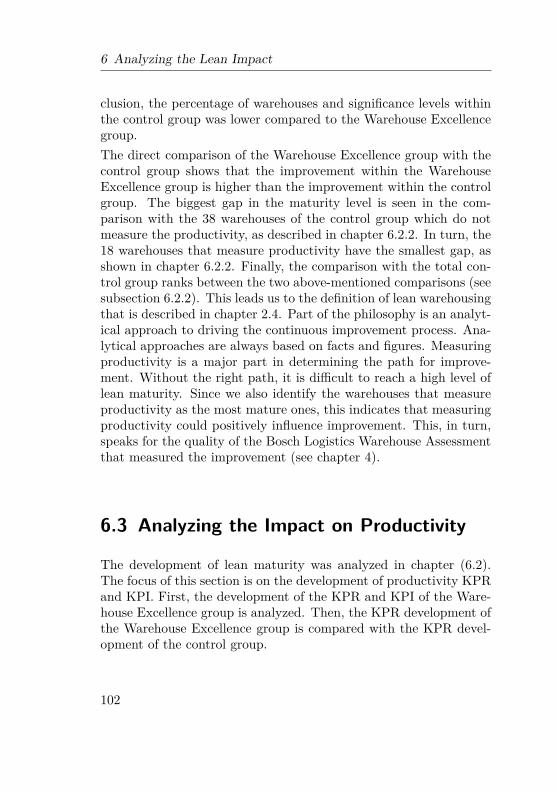
6 Analyzing the Lean Impact
clusion, the percentage of warehouses and significance levels withinthe control group was lower compared to the Warehouse Excellencegroup.The direct comparison of the Warehouse Excellence group with thecontrol group shows that the improvement within the WarehouseExcellence group is higher than the improvement within the controlgroup. The biggest gap in the maturity level is seen in the com-parison with the 38 warehouses of the control group which do notmeasure the productivity, as described in chapter 6.2.2. In turn, the18 warehouses that measure productivity have the smallest gap, asshown in chapter 6.2.2. Finally, the comparison with the total con-trol group ranks between the two above-mentioned comparisons (seesubsection 6.2.2). This leads us to the definition of lean warehousingthat is described in chapter 2.4. Part of the philosophy is an analyt-ical approach to driving the continuous improvement process. Ana-lytical approaches are always based on facts and figures. Measuringproductivity is a major part in determining the path for improve-ment. Without the right path, it is difficult to reach a high level oflean maturity. Since we also identify the warehouses that measureproductivity as the most mature ones, this indicates that measuringproductivity could positively influence improvement. This, in turn,speaks for the quality of the Bosch Logistics Warehouse Assessmentthat measured the improvement (see chapter 4).
6.3 Analyzing the Impact on Productivity
The development of lean maturity was analyzed in chapter (6.2).The focus of this section is on the development of productivity KPRand KPI. First, the development of the KPR and KPI of the Ware-house Excellence group is analyzed. Then, the KPR development ofthe Warehouse Excellence group is compared with the KPR devel-opment of the control group.
102

6.3 Analyzing the Impact on Productivity
6.3.1 Productivity Development of the WarehouseExcellence Group
Warehouse Excellence Result KPR Productivity Development
From the beginning of the year 2010, warehouses in the WarehouseExcellence group measured the monthly productivity of the entirewarehouse operation. Each warehouse reported the monthly aver-age. These monthly average figures were then normalized. Thismeans that the monthly average of January 2010 was set as theindex base 100. All further figures were related to that base andrepresent the development of the original figure. For example, awarehouse had the monthly average productivity of 20 order linesper man hour in January. This would set the index figure at 100. Ifthe figure had a positive development of 10% to 22 order lines perman hour in February, the index would rise to 110. The average ofthe index developments of the warehouses is shown in figure 6.11.In 2010, the slope of the trend line was 0.0116. In 2011, the sloperose to the value of 0.0282. The coefficient of the determination ofthe trend line also rose from 0.2516 to 0.4073. This shows a clearimprovement of the KPR in the year 2011. The graph also showstypical seasonal effects on the productivity in summer and winterof those years. These seasonal effects are also an indicator that thegraph is reliable.The Wilcoxon test was used to compare the reported index figures ofeach warehouse from 2010 with the figures for each warehouse from2011. The hypotheses are as follows:
H0:: The samples n1 and n2 are from the same population
H1:: The samples n1 and n2 are not from the same population
103
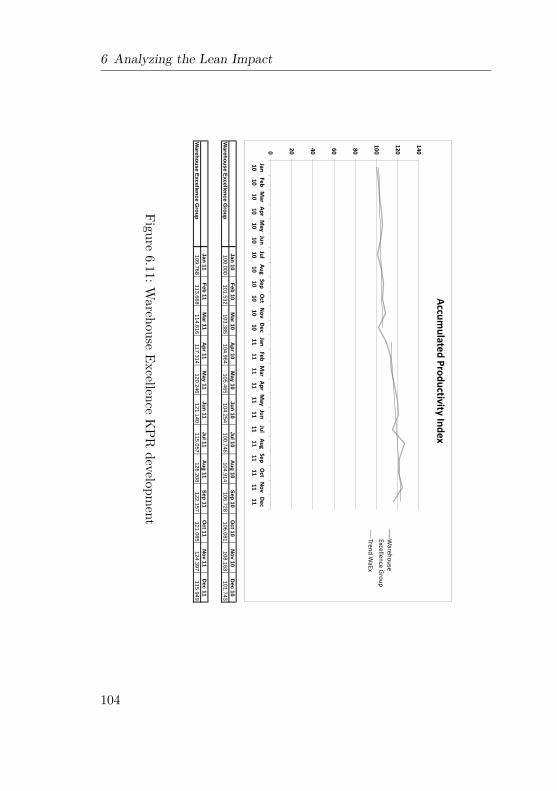
6 Analyzing the Lean Impact
Jan 10Feb 10
Mar 10
Apr 10
May 10
Jun 10Jul 10
Aug 10
Sep 10O
ct 10N
ov 10D
ec 10W
arehouse Excellence Group
100.000101.532
103.385104.964
105.465104.254
100.746104.914
106.728106.081
108.163101.743
Jan 11Feb 11
Mar 11
Apr 11
May 11
Jun 11Jul 11
Aug 11
Sep 11O
ct 11N
ov 11D
ec 11W
arehouse Excellence Group
109.768113.668
114.616117.314
120.246121.140
115.057126.208
122.157121.085
124.397115.949
0
20
40
60
80
100
120
140
Jan 10
Feb 10
Mar
10 Apr 10
May
10 Jun 10
Jul 10
Aug 10
Sep 10
Oct
10 N
ov 10
Dec
10 Jan 11
Feb 11
Mar
11 Apr 11
May
11 Jun 11
Jul 11
Aug 11
Sep 11
Oct
11 N
ov 11
Dec
11
Accumulated Productivity Index
Warehouse
Excellence Group Trend W
aEx
Figure6.11:W
arehouseExcellence
KPR
development
104

6.3 Analyzing the Impact on Productivity
WaEx 2011 -
WaEx 2010
Z -8,355b
Asymp. Sig. (2-tailed) ,000
N
Mean
Rank
Sum of
Ranks
Negative
Ranks41
a 56,00 2296,00
Positive
Ranks139
b 100,68 13994,00
Ties 0c
Total 180
Statistic for Testa
a. Wilcoxon-Test
b. Based on negative ranks.
WaEx 2011 -
WaEx 2010
a. WaEx 2011 < WaEx 2010
b. WaEx 2011 > WaEx 2010
c. WaEx 2011 = WaEx 2010
Table 6.18: Wilcoxon Rank table for the Warehouse Excellence KPRindex in the years 2010 and 2011
The sample n1 are the figures for the year 2010. Sample n2 indicatesthe sample for the figures in 2011.The ranking table for the test is shown in table 6.18. It shows thatthe positive rankings exceed the negative rankings. Finally, the teststatistics in 6.18 show with high enough significance that H0 can berejected.
Warehouse Excellence Monitoring KPI ProductivityDevelopment
During the Warehouse Excellence project, the participating ware-house managers defined projects in specific areas of their warehouses.The goal of these projects was to drive the lean approach, especiallythe closed loop between the System-CIP and Point-CIP methodolo-gies. Most of the warehouses defined more than one project. How-ever, a minimum of one project was required from the WarehouseExcellence project team. The projects were closely monitored andalso followed up on regularly by the project team.
105

6 Analyzing the Lean Impact
WaEx 2011 -
WaEx 2010
Z -8,355b
Asymp. Sig. (2-tailed) ,000
N
Mean
Rank
Sum of
Ranks
Negative
Ranks41
a 56,00 2296,00
Positive
Ranks139
b 100,68 13994,00
Ties 0c
Total 180
Statistic for Testa
a. Wilcoxon-Test
b. Based on negative ranks.
WaEx 2011 -
WaEx 2010
a. WaEx 2011 < WaEx 2010
b. WaEx 2011 > WaEx 2010
c. WaEx 2011 = WaEx 2010
Table 6.19: Wilcoxon test statistics for the Warehouse ExcellenceKPR index in the years 2010 and 2011
Figure 6.12 shows a detailed analysis of each project using one ex-ample. The KPI development is highlighted on the left side of thegraph. The definition of the KPI is displayed at the top of thefigure as is the project name of the warehouse. In this case, thename of the project is W16b. The time line for the project is alsoshown on this graph. In each example, there is a segment before thebeginning of the project. This serves as a basis for comparison. Spe-cific measures in the warehouse that deeply influence productivityare also highlighted. In this example, workforce management wasstarted in November 2011. The average productivity and deviationis listed below for the different segments. The assessment results ofthe Point-CIP for the years 2010 and 2011 are on the right side. Inaddition to this, the success factors that the warehouse focused onare also indicated (see section 2.1). Further examples are listed inappendix H.The 16 projects in the different warehouses had a massive positiveinfluence on the productivity. The improvement was by 26.02% onaverage. Table 6.20 provides the detailed results of the monitoringKPI development.
106
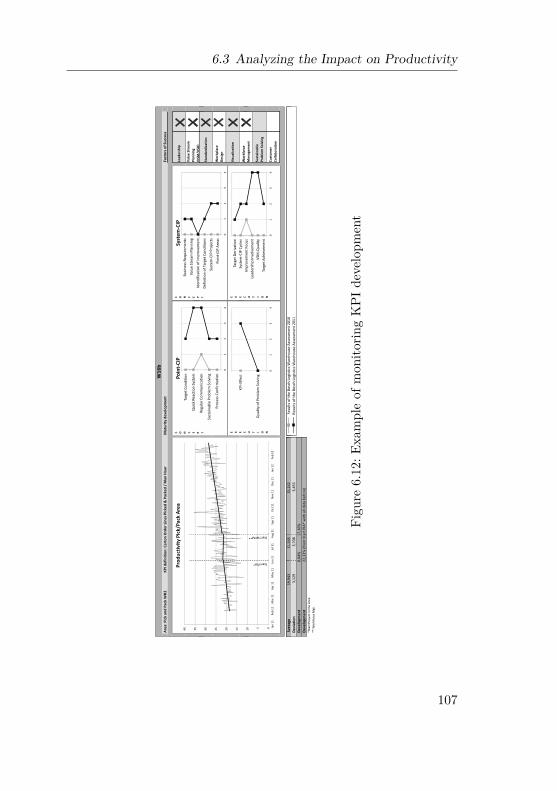
6.3 Analyzing the Impact on Productivity
Area
: Pic
k an
d Pa
ck W
H2
KPI d
efin
ition
: Car
ton
Ord
er L
ines
Pic
ked
& P
acke
d /
Man
Hou
rM
atur
ity d
evel
opm
ent
W16
b
Valu
e St
ream
Pl
anni
ng
(VSM
/VSD
)
Fact
ors
of S
ucce
ss
Lead
ersh
ip
3540
Prod
uctiv
ity P
ick/
Pack
Are
aTa
rget
Con
ditio
n
Qui
ck R
eact
ion
Syst
em
Regu
lar C
omm
unic
atio
n
C O N C E P T
Poin
t-CI
PBu
sines
s Req
uire
men
ts
Valu
e St
ream
Pla
nnin
g
Iden
tific
atio
n of
Impr
ovem
ent …
Dfi
itifT
tCdi
ti
C O N C E P T
Syst
em-C
IP
Visu
aliz
atio
n
Wor
kfor
ce
Stan
dard
izat
ion
Wor
kpla
ce
Des
ign
101520253035Q
uick
Rea
ctio
n Sy
stem
Regu
lar C
omm
unic
atio
n
Sust
aina
ble
Prob
lem
Sol
ving
Proc
ess C
onfir
mat
ion
01
23
4
E P T
KPI-E
ffect
E X E C U
Iden
tific
atio
n of
Impr
ovem
ent …
Defin
ition
of T
arge
t Con
ditio
ns
Syst
em-C
IP P
roje
cts
Poin
t-CI
P Ar
eas
01
23
4
E P T
Targ
et D
eriv
atio
nSy
stem
-CIP
Cyc
les
Impr
ovem
ent F
ocus
E X E C U
Aver
age
19,9
4321
,545
25,2
42Re
sults
ofth
eBo
sch
Logi
stic
sWar
ehou
seAs
sess
men
t201
0
Wor
kfor
ceM
anag
emen
t
Cust
omer
Co
llabo
ratio
n
Sust
aina
ble
Pr
oble
m S
olvi
ng
0510
Jan
11Fe
b 11
Mar
11
Apr 1
1M
ay 1
1Ju
n 11
Jul 1
1Au
g 11
Sep
11O
ct 1
1N
ov 1
1De
c 11
Jan
12Fe
b 12
KPI-E
ffect
Qua
lity
of P
robl
em S
olvi
ng
01
23
4
E C U T I O N
StartPIA*
StartWFM**
Syst
em-C
IP C
ycle
sIm
prov
emen
t Foc
usLe
ader
ship
Invo
lvem
ent
VSM
-Qua
lity
Targ
et A
chie
vem
ent
01
23
4
E C U T I O N
Aver
age
19,9
4321
,545
25,2
42Re
sults
of t
he B
osch
Log
istic
s War
ehou
se A
sses
smen
t 201
0D
evia
tion
3,12
93,
708
3,45
5Re
sults
of t
he B
osch
Log
istic
s War
ehou
se A
sses
smen
t 201
1D
evel
opm
ent
8,04
%17
,16%
Dev
elop
men
t22
,33%
(fro
m S
tart
PIA
* w
ith a
ll da
ta b
efor
e)*S
tart
Pro
ject
in th
e Ar
ea**
Wor
kfor
ce M
gt.
Figu
re6.12:E
xampleof
mon
itorin
gKPI
developm
ent
107

6 Analyzing the Lean Impact
RangeX < -25
-25 ≤ X < -15-15 ≤ X < -5
-5 ≤ X ≤ +5+5 < X ≤ +15
+15 < X ≤ +25 +25 < X
Amount
23
47
‐5,61%5,33%
15,88%25,39%
-8,02%10,52%
21,39%27,57%
10,60%22,33%
33,62%23,44%
37,33%47,97%73,64%74,94%
*avarage developement from
the defined segment before the project start w
ithin the area with
the avarage of after implem
entation
Result of each
warehouse*
Table6.20:M
onitoringKPI
development
overview
108

6.3 Analyzing the Impact on Productivity
6.3.2 Productivity Development of the WarehouseExcellence Group versus Control Group
The KPR and KPI development of the Warehouse Excellence groupwas shown, analyzed, and interpreted in subsection 6.3.1. This sec-tion analyzes the KPR development of the control group. This com-parison is shown in figure 6.13. Both of the groups had a similardevelopment in 2010 and the seasonal effects in summer and win-ter time can be seen. The situation changed in 2011: the controlgroup showed a negative trend. The average index value of 105.26 in2010 changed to 108.26 in 2011. The trend line slope changed from0.01463 to -0.02327. In contrast, the Warehouse Excellence groupimproved its trend from an average of 104.00 in 2010 to an averageof 118.47 in 2011. The slope of the trend line increased from 0.01164to 0.02822.The non-accumulated index figures of both groups were analyzedusing the Kolmogorov-Smirnov Z test to test if improvements aresignificant or might be coincidences. In the first test, the figures ofthe Warehouse Excellence group for the year 2010 were comparedwith the figures of the control group. In the second test, the figuresfor the year 2011 were compared. The hypotheses for the test are asfollows:
H0: The samples n1 and n2 are from the same population
H1: The samples n1 and n2 are not from the same population
The sample n1 indicates the data from 2010. Sample n2 is the datafrom 2011.Table 6.21 shows the test frequency. Further results are plotted intable 6.22. In 2010, the significance level is too low to reject H0.On the other hand, H0 could be rejected with high significance in
109

6 Analyzing the Lean Impact
Jan 10Feb 10
Mar 10
Apr 10M
ay 10Jun 10
Jul 10Aug 10
Sep 10O
ct 10N
ov 10D
ec 10W
arehouse Excellence Group
100.000101.532
103.385104.964
105.465104.254
100.746104.914
106.728106.081
108.163101.743
Control G
roup100.000
100.051103.784
105.211108.627
106.667109.244
101.932108.948
107.633110.285
100.712
Jan 11Feb 11
Mar 11
Apr 11M
ay 11Jun 11
Jul 11Aug 11
Sep 11O
ct 11N
ov 11D
ec 11W
arehouse Excellence Group
109.768113.668
114.616117.314
120.246121.140
115.057126.208
122.157121.085
124.397115.949
Control G
roup110.112
110.879110.935
112.570108.072
112.334108.371
103.474107.923
105.430106.657
102.408
0
20
40
60
80
100
120
140
Jan 10
Feb 10
Mar
10 Apr 10
May
10 Jun 10
Jul 10
Aug 10
Sep 10
Oct
10 N
ov 10
Dec
10 Jan 11
Feb 11
Mar
11 Apr 11
May
11 Jun 11
Jul 11
Aug 11
Sep 11
Oct
11 N
ov 11
Dec 11
Accumulated Productivity Index
Warehouse
Excellence Group
Control Group
Trend WaEx
Trend CoGr
Figure6.13:K
PRcom
parisonbetw
eenthe
Warehouse
Excellencegroup
andcontrolgroup
110

6.3 Analyzing the Impact on Productivity
2010 2011
most extrem
differenz
Absolut ,093 ,244
Positiv ,081 ,244
Negativ -,093 -,005
Kolmogorov-Smirnov-Z ,910 2,456
Asymp. Sig. (2-tailed) ,379 ,000
Name N
2010 CoGr 207
WaEx 180
Total 387
2011 CoGr 216
WaEx 192
Total 408
Table 6.21: Kolmogorov-Smirnov-Test frequency of KPR WaEx vs.CoGr
2010 2011
most extrem
differenz
Absolut ,093 ,244
Positiv ,081 ,244
Negativ -,093 -,005
Kolmogorov-Smirnov-Z ,910 2,456
Asymp. Sig. (2-tailed) ,379 ,000
Name N
2010 CoGr 207
WaEx 180
Total 387
2011 CoGr 216
WaEx 192
Total 408
Table 6.22: Kolmogorov-Smirnov-Test of KPR WaEx vs. CoGr
2011. This means that a large difference in significance can be seenbetween the data set of the Warehouse Excellence group in 2011compared to the data set of the control group in 2011.
6.3.3 Intermediate Result: Productivity Improvement
The first analyze of productivity improvement was in subsection6.3.1 with the Warehouse Excellence KPR. Figure 6.13 shows ahigher improvement in year 2011 compared to 2010 and the Kolmogorov-Smirnov-Z test shows, with a high significance, that the data setbetween 2010 and 2011 is not from the same population. This sup-ports the thesis that an effect could influence KPR development.The analysis in subsection 6.3.1 of the projects carried out duringthe Warehouse Excellence project tries to explain what the effectcould be. The summary shows that a high improvement in the mon-
111

6 Analyzing the Lean Impact
itoring KPIs has an effect on KPRs.These positive effects in the Warehouse Excellence group were com-pared with the control group development in subsection 6.3.2. Thegraph in figure 6.13 shows a higher productivity development forthe Warehouse Excellence group in 2011. The positive trend of thegraph is characterized by the Kolmogorov-Smirnov-Z test to show ifthe result was random or significant. The KPR index graphs from2010 could be from the same population but in 2011 the graphs showhigh significance so they are not from the same distribution.In conclusion, the data and development in 2010 are similar for bothgroups but are significantly different in 2011 which leads us to theassumption that something happened in the Warehouse Excellencegroup that did not happen in the control group and it resulted inan improvement of performance. We may suspect that this was theWarehouse Excellence project.
6.4 Review the Hypotheses
We defined the four hypotheses that we wanted to analyze in sec-tion 1.2 and they were also explained using a coordinate system infigures 1.1, 1.2, 1.3, and 1.4. The abscissa of the coordinate systemshows the lean maturity. The lean maturity improvement was ana-lyzed and an improvement in the Warehouse Excellence group wasshown in section 6.2. The ordinate shows the development of theperformance indicator. The performance indicator was analyzed insection 6.3. The Warehouse Excellence group showed an improve-ment in productivity in the result KPR and even a stronger one atthe KPI level. We now have the data and the intermediate resultswe need to make conclusions about the lean impact when discussingthe hypotheses and this is done in this section.Before we start, we will establish the basis for the discussion byshowing the relationship between the assessment results and the re-sult KPR of the Warehouse Excellence group in figure 6.14. The
112
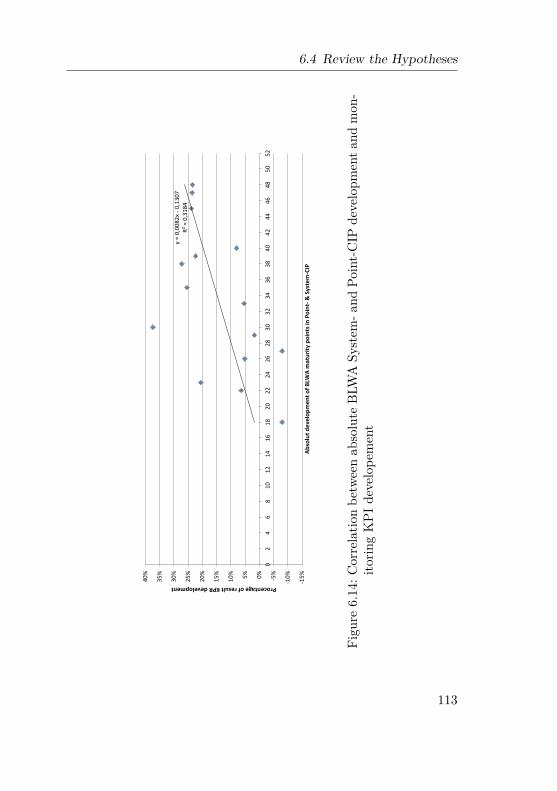
6.4 Review the Hypotheses
y =
0,00
82x
- 0,1
307
R² =
0,3
184
-15%
-10%
-5%
0%
5%
10%
15%
20%
25%
30%
35%
40%
0 2
4 6
8 10
12
14
16
18
20
22
24
26
28
30
32
34
36
38
40
42
44
46
48
50
52
Procentage of result KPR development
Abso
lut d
evel
opm
ent o
f BLW
A m
atur
ity p
oint
s in
Poin
t- &
Sys
tem
-CIP
Figu
re6.14:C
orrelatio
nbe
tweenab
solute
BLW
ASy
stem
-and
Point-CIP
developm
enta
ndmon
-ito
ringKPI
develope
ment
113
6 Analyzing the Lean Impact
abscissa is the absolute lean maturity development in the System-CIP and the Point-CIP. The ordinate is the percentage of the resultKPR development from the year 2010 to the year 2011. Each pointrepresents one warehouse and the line represents the trend line. Thetrend line hits the abscissa at the value of 15.94. This indicates thateven if some efforts are taken the expected positive lean effect onproductivity KPR might not be reached. A minimum higher in-vestment is necessary to gain from the benefits. The slope of thetrend line is 0.0082, which implies a positive trend. This shows thatif more lean efforts are taken, the productivity gain is also higher.The coefficient of determination is 0.3184, which indicates how wellthe relation can be described by a linear function.
6.4.1 Review of Hypothesis I
Hypothesis I states that lean techniques have a positive impact onperformance indicators. Figure 6.14 shows that most warehousesdid have an improvement with the exception of two. The interestingthing is that these two warehouses with the negative developmentin the result productivity KPR belong to the group of warehouseswith the lowest lean maturity development. We can conclude thatlean techniques have a positive impact on performance indicatorsbut resources have to be invested into in order to reach a certainlean maturity level before gaining from the benefits.
6.4.2 Review of Hypothesis II
Hypothesis II asserts that more lean has a more positive impact onperformance indicators. The slope of the trend line in 6.14 showsthat there is a positive relationship between the lean maturity leveland the productivity indicators. This means that if you invest moreto reach a higher lean maturity you will gain from an associatedhigher increase in productivity. The figure also shows that if youdevelop your lean maturity by 30 points, productivity development
114
6.4 Review the Hypotheses
will increase by a minimum of 5%. To summarize, more lean has amore positive impact on performance indicators.
6.4.3 Review of Hypothesis III
Hypothesis III states that there is a mathematical correlation be-tween the factors lean maturity and performance indicators and amathematical function can be used to describe this correlation. Arelationship between the two factors can be seen in figure 6.14 but afunction to describe this correlation could not be found. For exam-ple, the coefficient of determination is 0.3184 for a linear regressionwhich is far too low to describe that correlation. In conclusion, a re-lationship can be identified but a linear mathematical function couldnot be identified.
6.4.4 Review of Hypothesis IV
Hypothesis IV asserts that lean techniques have a higher positiveimpact on performance indicators than other approaches. The anal-ysis in section 6.2 showed us that the Warehouse Excellence groupimproved their lean maturity level significantly: much more thanthe control group. A large number of the warehouses in the controlgroup did not improve their lean maturity at all so we can assumethat the control group warehouses focused on other approaches.The analysis in subsection 6.3.2 also showed us that the develop-ment of the productivity result KPR was similar in both groupsin 2010. However, the productivity result KPR development of theWarehouse Excellence group was significantly better than the controlgroup in 2011. This means that something influenced the WarehouseExcellence group in the year 2011. We assume that this relates to theWarehouse Excellence group and that their approach was superiorto the other approaches in the control group.
115

6 Analyzing the Lean Impact
116
7 Summary & Conclusion
The roots of lean techniques date back 50 years to the productionsystems of the Japanese automotive production industry. Severalin-depth studies have verified the positive impact of lean techniquesin production environments. The research methodology of thesestudies was based on three elements:
• Measurement of the lean maturity• Measurement of performance indicators• Comparison of the samples with each other
A high level of evidence about the positive lean impact on perfor-mance indicators in the production environment can be proven bycomparing the results of these elements with each other. Lean tech-niques have also found their way into the warehouse environment.Since the warehouse environment is different from the productionenvironment, there is no guarantee that lean techniques have thesame impact. Several studies exist on lean maturity, performanceindicators or a comparison of different samples with each other butno single study could be found that combines all three elements witheach other with the goal of gaining a higher level of evidence aboutthe impact of lean techniques on performance indicators in the ware-house environment. In conclusion, the level of evidence about thepositive impact of lean approaches on performance indicators hasbeen higher in the production environment than in the warehouseenvironment until now.
117

7 Summary & Conclusion
We carried out a study in an attempt to close this gap in evidence.This study consisted of 16 warehouses in the observation group and56 warehouses in the control group. The observation group were em-powered by an intensive program with precisely defined milestones.By reaching these milestones, it was ensured that the warehouseswould implement a structured continuous improvement cycle, whichwe identified as a key element of the lean philosophy. Bosch coinedthe terms System-CIP and Point-CIP for their interpretation anddefinition of the method for a structured continuous improvementcycle process. By providing training, workshops, and coaches; weensured that all of the warehouses in the observation group reachedthe set milestones. The control group was not influenced by theempowerment program.Tools were needed to measure the progress of the lean maturityand performance indicators for each warehouse. By evaluating theexisting available tools, we were able to determine that the leanmaturity assessments that are customized for the warehouse envi-ronment do not meet our requirements. For this reason, a new leanmaturity assessment was developed, tested, and implemented. TheBosch Logistic Warehouse Assessment was developed based on anew generation of lean maturity assessments which were in use inthe production environment.The performance indicator development was measured by the KPR/-KPI Tree approach. The KPR/KPI Tree ensures that several mea-surements can be taken and linked together at the same or differentoperational level. For example, if a fully developed KRP/KPI Treewas implemented in a warehouse, it would be possible to estimate theinfluence that the increase in productivity of a picker has on totalwarehouse productivity. Since this level of development is almostnever found within warehouse operations, our study implementedand focused on the result productivity KPR of the total warehouseand the monitoring productivity KPI of specific areas within thewarehouse.After determining what has to be measured and how, we measured
118
and analyzed the generated data with descriptive and inferentialstatistics. The development of the average assessment score of theobservation group was relatively higher than the development of thecontrol group. The two sample non-parametric Wilcoxon hypothesistests for dependent data were used to test a significantly higher leanmaturity development in the observation group compared to thecontrol group.Before the study began, the development of the total productivity ofthe observation group in 2010 was very similar to the control group.During the study, the development of the observation group in 2011was higher than the control group. A significant difference betweenthe groups in 2011 was verified using the two sample non-parametricKolmogorov-Smirnov hypothesis tests for independent data.The monitoring productivity KPI of the projects, which is wherethe strongest impact of the lean activities within the warehousesoccurred, also showed a high positive development. A significantfunctional correlation between the productivity KPR and the leanmaturity development could not be verified. Instead, a positive rela-tionship between higher lean maturity and higher productivity gaincould be shown. The graph also showed that a certain lean maturitylevel has to be reached before benefits can be gained from lean.In conclusion, we have contributed to the evidence that lean tech-niques have a positive impact on performance indicators. We havealso shown that an observation group with a concentrated lean em-powerment program performs better than a control group withoutthat focus. A functional correlation between lean techniques andproductivity increase could not be shown. This could be becausenone of the warehouses had a highly developed KPR/KPI Tree. Itmight be possible to show a correlation with better coverage anda better linking of performance indicators within the observationgroup and control group.
119

7 Summary & Conclusion
120
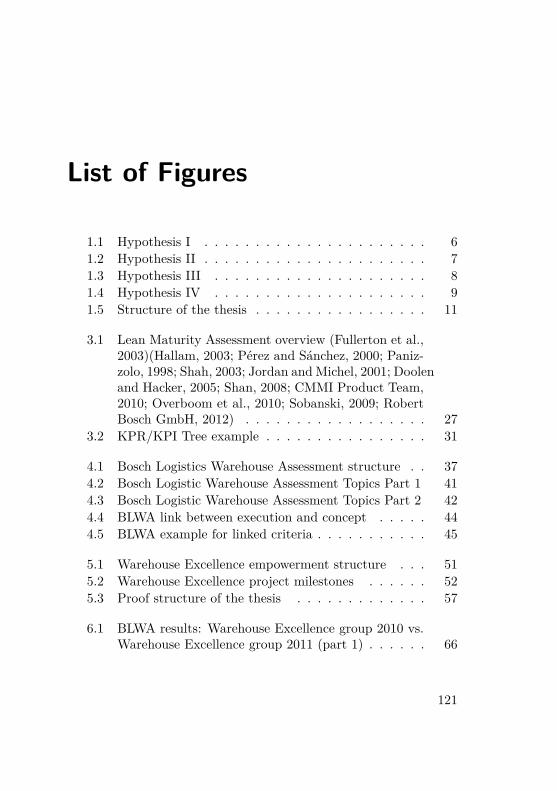
List of Figures
1.1 Hypothesis I . . . . . . . . . . . . . . . . . . . . . . 61.2 Hypothesis II . . . . . . . . . . . . . . . . . . . . . . 71.3 Hypothesis III . . . . . . . . . . . . . . . . . . . . . 81.4 Hypothesis IV . . . . . . . . . . . . . . . . . . . . . 91.5 Structure of the thesis . . . . . . . . . . . . . . . . . 11
3.1 Lean Maturity Assessment overview (Fullerton et al.,2003)(Hallam, 2003; Pérez and Sánchez, 2000; Paniz-zolo, 1998; Shah, 2003; Jordan and Michel, 2001; Doolenand Hacker, 2005; Shan, 2008; CMMI Product Team,2010; Overboom et al., 2010; Sobanski, 2009; RobertBosch GmbH, 2012) . . . . . . . . . . . . . . . . . . 27
3.2 KPR/KPI Tree example . . . . . . . . . . . . . . . . 31
4.1 Bosch Logistics Warehouse Assessment structure . . 374.2 Bosch Logistic Warehouse Assessment Topics Part 1 414.3 Bosch Logistic Warehouse Assessment Topics Part 2 424.4 BLWA link between execution and concept . . . . . 444.5 BLWA example for linked criteria . . . . . . . . . . . 45
5.1 Warehouse Excellence empowerment structure . . . 515.2 Warehouse Excellence project milestones . . . . . . 525.3 Proof structure of the thesis . . . . . . . . . . . . . 57
6.1 BLWA results: Warehouse Excellence group 2010 vs.Warehouse Excellence group 2011 (part 1) . . . . . . 66
121

List of Figures
6.2 BLWA results: Warehouse Excellence group 2010 vs.Warehouse Excellence group 2011 (part 2) . . . . . . 67
6.3 BLWA results: Warehouse Excellence group 2010 vs.Warehouse Excellence group 2011 (part 3) . . . . . . 68
6.4 BLWA results: Warehouse Excellence group 2010 vs.Warehouse Excellence group 2011 (part 4) . . . . . . 69
6.5 BLWA results: Warehouse Excellence group 2010 vs.control group 2010 . . . . . . . . . . . . . . . . . . . 92
6.6 BLWA results: Warehouse Excellence group 2011 vs.control group 2011 . . . . . . . . . . . . . . . . . . . 93
6.7 BLWA results: Warehouse Excellence group 2010 vs.control group (18) 2010 . . . . . . . . . . . . . . . . 95
6.8 BLWA results: Warehouse Excellence group 2011 vs.control group (18) 2011 . . . . . . . . . . . . . . . . 97
6.9 BLWA results: Warehouse Excellence group 2010 vs.control group (38) 2010 . . . . . . . . . . . . . . . . 99
6.10 BLWA results: Warehouse Excellence group 2011 vs.control group (18) 2011 . . . . . . . . . . . . . . . . 100
6.11 Warehouse Excellence KPR development . . . . . . 1046.12 Example of monitoring KPI development . . . . . . 1076.13 KPR comparison between the Warehouse Excellence
group and control group . . . . . . . . . . . . . . . 1106.14 Correlation between absolute BLWA System- and Point-
CIP development and monitoring KPI developement 113
C.1 1.1 System-CIP Concept (Furmans and Wlcek, 2012;Rother and Shook, 2008; Sobanski, 2009; Dehdari etal., 2011) . . . . . . . . . . . . . . . . . . . . . . . . 142
C.2 1.1 System-CIP Execution (Furmans andWlcek, 2012;Sobanski, 2009; Rother and Shook, 2008) . . . . . . 143
C.3 1.2 Point-CIP Concept (Dehdari et al., 2011; Soban-ski, 2009) . . . . . . . . . . . . . . . . . . . . . . . . 144
C.4 1.2 Point-CIP Execution (Sobanski, 2009; Dehdari etal., 2011) . . . . . . . . . . . . . . . . . . . . . . . . 145
122
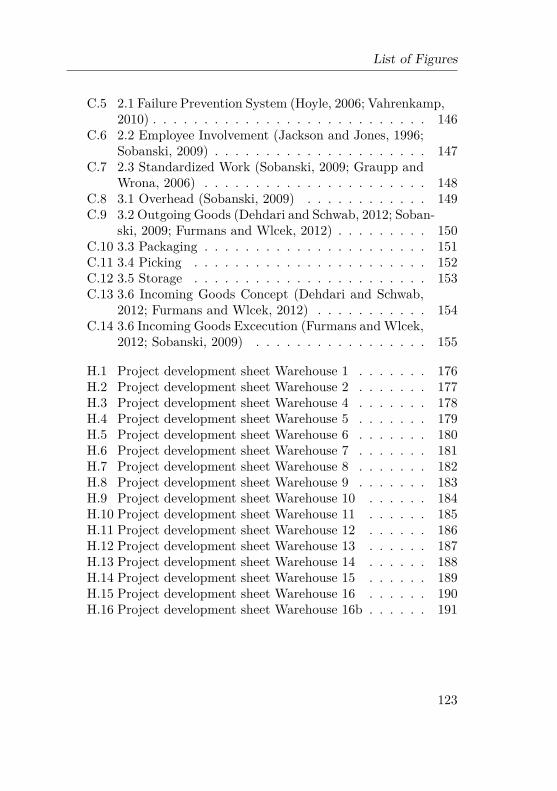
List of Figures
C.5 2.1 Failure Prevention System (Hoyle, 2006; Vahrenkamp,2010) . . . . . . . . . . . . . . . . . . . . . . . . . . . 146
C.6 2.2 Employee Involvement (Jackson and Jones, 1996;Sobanski, 2009) . . . . . . . . . . . . . . . . . . . . . 147
C.7 2.3 Standardized Work (Sobanski, 2009; Graupp andWrona, 2006) . . . . . . . . . . . . . . . . . . . . . . 148
C.8 3.1 Overhead (Sobanski, 2009) . . . . . . . . . . . . 149C.9 3.2 Outgoing Goods (Dehdari and Schwab, 2012; Soban-
ski, 2009; Furmans and Wlcek, 2012) . . . . . . . . . 150C.10 3.3 Packaging . . . . . . . . . . . . . . . . . . . . . . 151C.11 3.4 Picking . . . . . . . . . . . . . . . . . . . . . . . 152C.12 3.5 Storage . . . . . . . . . . . . . . . . . . . . . . . 153C.13 3.6 Incoming Goods Concept (Dehdari and Schwab,
2012; Furmans and Wlcek, 2012) . . . . . . . . . . . 154C.14 3.6 Incoming Goods Excecution (Furmans andWlcek,
2012; Sobanski, 2009) . . . . . . . . . . . . . . . . . 155
H.1 Project development sheet Warehouse 1 . . . . . . . 176H.2 Project development sheet Warehouse 2 . . . . . . . 177H.3 Project development sheet Warehouse 4 . . . . . . . 178H.4 Project development sheet Warehouse 5 . . . . . . . 179H.5 Project development sheet Warehouse 6 . . . . . . . 180H.6 Project development sheet Warehouse 7 . . . . . . . 181H.7 Project development sheet Warehouse 8 . . . . . . . 182H.8 Project development sheet Warehouse 9 . . . . . . . 183H.9 Project development sheet Warehouse 10 . . . . . . 184H.10 Project development sheet Warehouse 11 . . . . . . 185H.11 Project development sheet Warehouse 12 . . . . . . 186H.12 Project development sheet Warehouse 13 . . . . . . 187H.13 Project development sheet Warehouse 14 . . . . . . 188H.14 Project development sheet Warehouse 15 . . . . . . 189H.15 Project development sheet Warehouse 16 . . . . . . 190H.16 Project development sheet Warehouse 16b . . . . . . 191
123

List of Figures
124
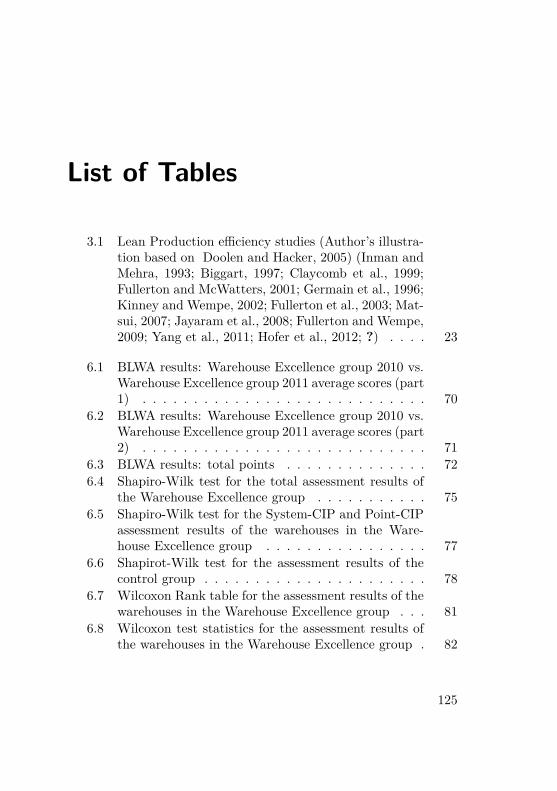
List of Tables
3.1 Lean Production efficiency studies (Author’s illustra-tion based on Doolen and Hacker, 2005) (Inman andMehra, 1993; Biggart, 1997; Claycomb et al., 1999;Fullerton and McWatters, 2001; Germain et al., 1996;Kinney and Wempe, 2002; Fullerton et al., 2003; Mat-sui, 2007; Jayaram et al., 2008; Fullerton and Wempe,2009; Yang et al., 2011; Hofer et al., 2012; ?) . . . . 23
6.1 BLWA results: Warehouse Excellence group 2010 vs.Warehouse Excellence group 2011 average scores (part1) . . . . . . . . . . . . . . . . . . . . . . . . . . . . 70
6.2 BLWA results: Warehouse Excellence group 2010 vs.Warehouse Excellence group 2011 average scores (part2) . . . . . . . . . . . . . . . . . . . . . . . . . . . . 71
6.3 BLWA results: total points . . . . . . . . . . . . . . 726.4 Shapiro-Wilk test for the total assessment results of
the Warehouse Excellence group . . . . . . . . . . . 756.5 Shapiro-Wilk test for the System-CIP and Point-CIP
assessment results of the warehouses in the Ware-house Excellence group . . . . . . . . . . . . . . . . 77
6.6 Shapirot-Wilk test for the assessment results of thecontrol group . . . . . . . . . . . . . . . . . . . . . . 78
6.7 Wilcoxon Rank table for the assessment results of thewarehouses in the Warehouse Excellence group . . . 81
6.8 Wilcoxon test statistics for the assessment results ofthe warehouses in the Warehouse Excellence group . 82
125

List of Tables
6.9 Wilcoxon Rank table for the assessment results forthe System-CIP and Point-CIP of the warehouses inthe Warehouse Excellence group . . . . . . . . . . . 83
6.10 Wilcoxon test statistics for the assessment results forthe System-CIP and Point-CIP of the warehouses inthe Warehouse Excellence group . . . . . . . . . . . 85
6.11 Wilcoxon Rank table for the assessment results for theSystem-CIP and Point-CIP of the warehouses C1-C30in the control group . . . . . . . . . . . . . . . . . . 86
6.12 Wilcoxon Rank table for the assessment results for theSystem-CIP and Point-CIP of the warehouses C31-C56 in the control group . . . . . . . . . . . . . . . . 87
6.13 Wilcoxon test statistics for the assessment results forthe System-CIP and Point-CIP of the warehouses C1-C28 in the control group . . . . . . . . . . . . . . . 89
6.14 Wilcoxon test statistics for the assessment results forthe System-CIP and Point-CIP of the warehouses C29-C56 in the control group . . . . . . . . . . . . . . . 90
6.15 Assessment results achieved . . . . . . . . . . . . . . 946.16 BLWA results points: Warehouse Excellence group
vs. control group (18) . . . . . . . . . . . . . . . . . 966.17 BLWA results points: Warehouse Excellence group
vs. control group (38) . . . . . . . . . . . . . . . . . 1016.18 Wilcoxon Rank table for the Warehouse Excellence
KPR index in the years 2010 and 2011 . . . . . . . . 1056.19 Wilcoxon test statistics for the Warehouse Excellence
KPR index in the years 2010 and 2011 . . . . . . . 1066.20 Monitoring KPI development overview . . . . . . . 1086.21 Kolmogorov-Smirnov-Test frequency of KPR WaEx
vs. CoGr . . . . . . . . . . . . . . . . . . . . . . . . 1116.22 Kolmogorov-Smirnov-Test of KPR WaEx vs. CoGr 111
A.1 Classification of warehouses in the Warehouse Excel-lence group . . . . . . . . . . . . . . . . . . . . . . . 138
126

List of Tables
B.1 Classification of warehouses in the control group . . 140
D.1 BLWA results per warehouse: Warehouse Excellencegroup 2010 . . . . . . . . . . . . . . . . . . . . . . . 158
D.2 BLWA results per warehouse: Warehouse Excellencegroup 2011 . . . . . . . . . . . . . . . . . . . . . . . 159
E.1 Warehouse Excellence Group KPR development 2010 162E.2 Warehouse Excellence KPR development 2011 . . . . 163
F.1 Assessment results per warehouse: control group 2010C1-C28 . . . . . . . . . . . . . . . . . . . . . . . . . 166
F.2 Assessment results per warehouse: control group 2010C29-C56 . . . . . . . . . . . . . . . . . . . . . . . . 167
F.3 Assessment results per warehouse: control group 2011C1-C28 . . . . . . . . . . . . . . . . . . . . . . . . . 168
F.4 Assessment results per warehouse: control group 2011C1-C28 . . . . . . . . . . . . . . . . . . . . . . . . . 169
G.1 Control group KPR development 2010 . . . . . . . . 172G.2 Control group KPR development 2011 . . . . . . . . 173
127

List of Tables
128

Bibliography
Anderson, T. W. and D. A. Darling (1954). A Test of Goodness ofFit. Journal of the American Statistical Association 49 (268), p.765–769.
Arnold, D., H. Isermann, A. Kuhn, H. Tempelmeier and K. Furmans(2008). Logistik-Handbuch. Berlin and Heidelberg: Springer BerlinHeidelberg.
Augustin, H. (2009). Lean warehousing: Mit Six Sigma und LeanManagement Lagerprozesse erfolgreich gestalten ; eine Trend-studie. München: Huss.
Backhaus, K., B. Erichson, W. Plinke and R. Weiber (2003).Multivariate Analysemethoden: Eine anwendungsorientierte Ein-führung (10 ed.). Berlin: Springer.
Bartholdi, J. J. and S. T. Hackman (2011). Warehouse & Distribu-tion Science.
Bell, S. and M. A. Orzen (2011). Lean IT: enabling and sustainingyour lean transformation. New York: Productivity Press.
Bidgoli, H. (eds.) (2004). Managing the Flow of Materials Acrossthe Supply Chain // The Internet encyclopedia. Hoboken and NJand USA: John Wiley & Sons, Inc and John Wiley & Sons.
Biggart, T. (1997). The Effects of Just-in-Time Inventory SystemAdoption on Firm Performance. Ph.D. thesis.
Bol, G. (2003). Induktive Statistik: Lehr- und Arbeitsbuch (3 ed.).München and Wien: Oldenbourg.
Bortz, J. and R. Weber (2005). Statistik für Human- und Sozial-wissenschaftler: Mit 242 Tabellen (6 ed.). Springer-Lehrbuch.
129

Bibliography
Heidelberg: Springer Medizin.Bösenberg, D. and H. Metzen (1993). Lean Management: Vorsprungdurch schlanke Konzepte (2 ed.). Landsberg/Lech: Verl. ModerneIndustrie.
Brosius, F. (2011). SPSS 19 (1 ed.). Heidelberg and München andLandsberg and Frechen and Hamburg: mitp-Verl.
Bruin, T. d., R. Freeze, U. Kaulkarni and M. Rosemann (eds.)(2005). Understanding the Main Phases of Developing a MaturityAssessment Model. Australasian Conference on Information Sys-tems. Sydney: Campbell, B. and Underwood, J. and Bunker, D.
Cirrone, G., S. Donadio, S. Guatelli, A. Mantero, B. Mascialino,S. Parlati, M. Pia, A. Pfeiffer, A. Ribon and P. Viarengo (2004). Agoodness-of-fit statistical toolkit. IEEE Transactions on NuclearScience 51 (5), p. 2056–2063.
Clauß, G., F.-R. Finze and L. Partzsch (1994). Statistik für Sozi-ologen, Pädagogen, Psychologen und Mediziner. Thun [u.a.]:Deutsch.
Claycomb, C., C. Dröge and R. Germain (1999). The Effect of Just-in-Time with Customers on Organizational Design and Perfor-mance. The International Journal of Logistics Management 10 (1),p. 37–58.
Claycomb, C., R. Germain and C. Dröge (1999). Total systemJIT outcomes: inventory, organization and financial effects. In-ternational Journal of Physical Distribution & Logistics Manage-ment 29 (10), p. 612–630.
CMMI Product Team (2010). CMMIr for Services, Version 1.3:CMMI-SVC, V1.3.
Cusumano, M. A. (1994). The Limits of Lean. Sloan ManagementReview Summer, p. 27–32.
Dehdari, P. and M. Schwab (2012). Produktionsumfeld vs. Lagerum-feld. In: K. Furmans and H. Wlcek (eds.), Arbeitskreisbericht,Volume 1, p. 16–20. DVV Media Group.
130
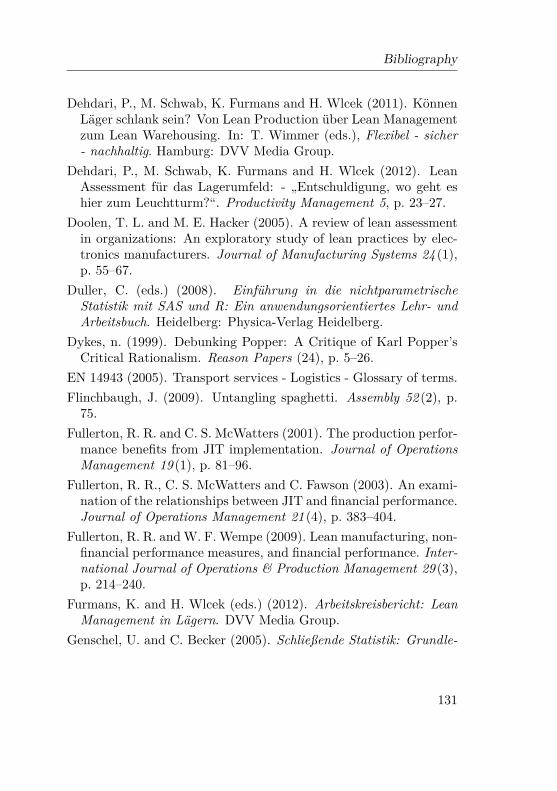
Bibliography
Dehdari, P., M. Schwab, K. Furmans and H. Wlcek (2011). KönnenLäger schlank sein? Von Lean Production über Lean Managementzum Lean Warehousing. In: T. Wimmer (eds.), Flexibel - sicher- nachhaltig. Hamburg: DVV Media Group.
Dehdari, P., M. Schwab, K. Furmans and H. Wlcek (2012). LeanAssessment für das Lagerumfeld: - „Entschuldigung, wo geht eshier zum Leuchtturm?“. Productivity Management 5, p. 23–27.
Doolen, T. L. and M. E. Hacker (2005). A review of lean assessmentin organizations: An exploratory study of lean practices by elec-tronics manufacturers. Journal of Manufacturing Systems 24 (1),p. 55–67.
Duller, C. (eds.) (2008). Einführung in die nichtparametrischeStatistik mit SAS und R: Ein anwendungsorientiertes Lehr- undArbeitsbuch. Heidelberg: Physica-Verlag Heidelberg.
Dykes, n. (1999). Debunking Popper: A Critique of Karl Popper’sCritical Rationalism. Reason Papers (24), p. 5–26.
EN 14943 (2005). Transport services - Logistics - Glossary of terms.Flinchbaugh, J. (2009). Untangling spaghetti. Assembly 52 (2), p.75.
Fullerton, R. R. and C. S. McWatters (2001). The production perfor-mance benefits from JIT implementation. Journal of OperationsManagement 19 (1), p. 81–96.
Fullerton, R. R., C. S. McWatters and C. Fawson (2003). An exami-nation of the relationships between JIT and financial performance.Journal of Operations Management 21 (4), p. 383–404.
Fullerton, R. R. andW. F. Wempe (2009). Lean manufacturing, non-financial performance measures, and financial performance. Inter-national Journal of Operations & Production Management 29 (3),p. 214–240.
Furmans, K. and H. Wlcek (eds.) (2012). Arbeitskreisbericht: LeanManagement in Lägern. DVV Media Group.
Genschel, U. and C. Becker (2005). Schließende Statistik: Grundle-
131

Bibliography
gende Methoden. Berlin/Heidelberg: Springer-Verlag.Germain, R., C. Droge and N. Spears (1996). The implicationsof just-in-time for logistics organization management and perfor-mance. Journal of Business Logistics 17 (2), p. 19–34.
Gibbons, J. D. (2003). Nonparametric statistical inference. NewYork: Marcel Dekker.
Graupp, P. and R. J. Wrona (2006). The TWI workbook: Essentialskills of supervisors. New York: Productivity Press.
Gudehus, T. and H. Kotzab (2012). Comprehensive logistics (2 ed.).Heidelberg and and New York: Springer-Verlag Berlin Heidelberg.
Hallam, C. R. A. (2003). Lean enterprise self-assessment as a leadingindicator for accelerating transformation in the aerospace indus-try. Ph.D. thesis, Massachusetts Institute of Technology (MIT),Massachusetts.
Hofer, C., C. Eroglu and A. Rossiter Hofer (2012). The effect oflean production on financial performance: The mediating roleof inventory leanness. International Journal of Production Eco-nomics 138 (2), p. 242–253.
Holweg, M. (2007). The genealogy of lean production. Journal ofOperations Management 25 (2), p. 420–437.
Hoyle, D. (2006). ISO 9000 quality systems handbook (5 ed.). OxfordU.K. and and Burlington MA: Butterworth-Heinemann.
Huber, C. (2011). Throughput Analysis of Manual Order PickingSystems with Congestion Consideration. Ph.D. thesis, Karlsruhe.
Inman, R. A. and S. Mehra (1993). Financial Justification of JIT Im-plementation. International Journal of Operations & ProductionManagement 13 (4), p. 32–39.
Jackson, T. L. and K. R. Jones (1996). Implementing a lean man-agement system. Portland Or: Productivity Press.
Janssen, J. (2005). Statistische Datenanalyse mit SPSS für Win-dows: Eine anwendungsorientierte Einführung in das Basissystemund das Modul Exakte Tests; mit 163 Tabellen (5 ed.). Berlin and
132

Bibliography
Heidelberg: Springer.Jayaram, J., S. Vickery and C. Droge (2008). Relationship building,lean strategy and firm performance: an exploratory study in theautomotive supplier industry. International Journal of ProductionResearch 46 (20), p. 5633–5649.
Jordan, J. A. and F. J. Michel (2001). The lean company: Makingthe right choices. Dearborn and MI: Society of ManufacturingEngineers.
Kinney, M. R. and W. F. Wempe (2002). Further Evidence on theExtent and Origins of JIT’s Profitability Effects. The AccountingReview 77 (1), p. 203–225.
Lass, R. (1984). Phonology: An introduction to basic concepts. Cam-bridge and and New York: Cambridge University Press.
Lebra, T. S. and W. P. Lebra (1986). Japanese culture and behavior:Selected readings (Rev. ed. ed.). Honolulu: University of HawaiiPress.
Lehmann, E. L. and J. P. Romano (2005). Testing statistical hy-potheses (3 ed.). Springer texts in statistics. New York: Springer.
Liker, J. K. (2004). The Toyota way: 14 management principlesfrom the world’s greatest manufacturer. New York: McGraw-Hill.
Mahfouz, A. (2011). An Integrated Framework to Assess ’Leanness’Performance in Distribution Centres. Ph.D. thesis, Dublin Insti-tute of Technology, Dublin.
Matsui, Y. (2007). An empirical analysis of just-in-time productionin Japanese manufacturing companies. International Journal ofProduction Economics 108 (1-2), p. 153–164.
Oeltjenbruns, H. (2000). Organisation der Produktion nach demVorbild Toyotas: Analyse Vorteile und detaillierte Vorausset-zungen sowie die Vorgehensweise zur erfolgreichen Einführungam Beispiel eines globalen Automobilkonzerns: Zugl.: Clausthal,Techn. Univ., Diss., 2000. Innovationen der Fabrikplanung und-organisation. Aachen: Shaker.
133
Bibliography
Ohno, T. (1988). Toyota production system: Beyond large-scale pro-duction. Cambridge and Massachusetts: Productivity Press.
Olhager, J. (2012). The Role of Decoupling Points in Value ChainManagement. In: H. Jodlbauer, J. Olhager, and R. J. Schonberger(eds.), The Role of Decoupling Points in Value Chain Manage-ment, p. 37–47. Heidelberg: Physica-Verlag HD.
Overboom, M. A., de Haan J. A. C. and Naus A. J. A. M. (eds.)(2010). Measuring the degree of leanness in logistics serviceproviders: Development of a measurement tool, Porto.
Panizzolo, R. (1998). Applying the lessons learned from 27 lean man-ufacturers. International Journal of Production Economics 55 (3),p. 223–240.
Pérez, M. P. and A. M. Sánchez (2000). Lean production and sup-plier relations: a survey of practices in the Aragonese automotiveindustry. Technovation 20 (12), p. 665–676.
Pfeiffer, W. and E. Weiß (1994). Lean Management. Grundlagen derFührung und Organisation lernender Unternehmen. 2., überarb.und erw. Aufl. Berlin: Schmidt.
Razali, N. M. and Y. B. Wah (2011). Power comparisions of Shapiro-Wilk, Kolmogorov-Smirnov, Lilliefors and Anderson-Darling tests.Journal of Statistical Modeling and Analytics 2 (1), p. 21–33.
Reuter, C. (2009). Logistikrelevante Lösungen auf der Basis vonLean-Management bei kleinen Losgrössen und hoher Varianten-vielfalt. Ph.D. thesis, Universität Stuttgart, Heimsheim.
Robert Bosch GmbH (2012). Bosch Production System AssessmentV. 3.1.
Rother, M. and S. Kinkel (2009). Die Kata des Weltmarktführers:Toyotas Erfolgsmethoden (1 ed.). Frankfurt: Campus Verl.
Rother, M. and J. Shook (2008). Learning to see: Value-streammapping to create value and eliminate muda (1.3 ed.). A lean toolkit method and workbook. Cambridge and Massachusetts: LeanEnterprise Inst.
134

Bibliography
Sá, J. P. M. d. (eds.) (2008). Applied Statistics Using SPSS, STATIS-TICA, MATLAB and R. Berlin and Heidelberg: Springer-Verlag.
Scheer, A.-W. (eds.) (2005). Corporate Performance Management:ARIS in der Praxis; mit 5 Tab. Berlin and Heidelberg: Springer.
Shah, R. (2003). Lean manufacturing: context, practice bundles,and performance. Journal of Operations Management 21 (2), p.129–149.
Shan, R. S. (2008). The role of assessment in a lean transforma-tion. Ph.D. thesis, Massachusetts Institute of Technology (MIT),Massachusetts.
Sobanski, E. B. (2009). Assessing Lean Warehousing: Developmentand validation of a lean assessment tool. Ph.D. thesis, OklahomaState University, Oklahoma.
Spee, D. and J. Beuth (2012). Lagerprozesse effizient gestalten: LeanWarehousing in der Praxis erfolgreich anwenden. München: Huss-Verl.
ten Hompel, M., T. Schmidt and L. Nagel (2007). Materialflusssys-teme: Förder- und Lagertechnik (3., vollst. neu bearb. Aufl ed.).Berlin: Springer.
Toutenburg, H., C. Heumann, M. Schomaker and M. Wißmann(eds.) (2009). Arbeitsbuch zur deskriptiven und induktiven Statis-tik (2 ed.). Springer-Lehrbuch. Berlin and Heidelberg: SpringerBerlin Heidelberg.
Vahrenkamp, R. (2010). Von Taylor zu Toyota: Rationalisierungs-debatten im 20. Jahrhundert (1 ed.). Lohmar and Köln: Eul.
VDI 3629 (2005). Basic organisational functions in warehousing.Wisser, J. (2009). Der Prozess Lagern und Kommissionieren imRahmen des Distribution Center Reference Model (DCRM). Wis-senschaftliche Berichte des Institutes für Fördertechnik und Lo-gistiksysteme der Universität Karlsruhe (TH). Karlsruhe: Uni-versitätsverlag.
Womack, J. P. (2007). The machine that changed the world: The
135

Bibliography
story of lean production - Toyotas secret weapon in the global carwars that is revolutionizing world industry (1 ed.). London: FreePress.
Womack, J. P. and D. T. Jones (2004). Lean thinking: Ballast ab-werfen, Unternehmensgewinne steigern ([Erw. und aktualisierteNeuausg.] ed.). Management. Frankfurt am Main: Campus-Verl.
Yang, M. G., P. Hong and S. B. Modi (2011). Impact of lean man-ufacturing and environmental management on business perfor-mance: An empirical study of manufacturing firms. InternationalJournal of Production Economics 129 (2), p. 251–261.
Zidel, T. (2006). A lean guide to transforming healthcare: How toimplement lean principles in hospitals, medical offices, clinics, andother healthcare organizations. Milwaukee and Wis: ASQ QualityPress.
136

A Appendix - WarehouseExcellence Group DataSheet
137

A Appendix - Warehouse Excellence Group Data Sheet
# Pallets# B
ins# Trucks
# Pallets# Trucks
# PalletsW
1E
ME
AU
BK
LSP
DY
es60
22.00017.000
15350
20250
W2
EM
EA
UB
KB
oschP
No
1602.520
21.6007
11040
350W
3E
ME
AU
BI
Bosch
DN
o 70
2.50046.000
1050
12150
W4
EM
EA
UB
GLS
PD
Yes
7540.000
16.00070
1.00040
800W
5E
ME
AU
BI
LSP
PY
es80
40.00030.000
401.000
401.000
W6
EM
EA
UB
KB
oschP
No
3304.500
10.50070
40050
300W
7E
ME
AU
BG
LSP
DY
es75
15.00020.000
40N
/A40
N/A
W8
EM
EA
UB
KLS
PP
Yes
3512.000
2.50025
40040
600W
9E
ME
AU
BK
Bosch
PN
o220
9.50015.000
40800
30600
W10
EM
EA
UB
K/U
BG
LSP
DN
o120
12.90030.000
4210
10220
W11
EM
EA
UB
KLS
PP
Yes
1001.000
10.000N
/A200
N/A
350W
12E
ME
AU
BK
LSP
PY
es45
15.000N
/A35
N/A
70N
/AW
13E
ME
AU
BG
LSP
PY
es150
25.00013.800
75700
45700
W14
EM
EA
UB
KB
oschP
No
363.300
6.00020
45015
350W
15E
ME
AU
BK
LSP
PN
o16
2.5006.000
3150
6180
W16
EM
EA
UB
K/U
BG
Bosch
DN
o125
14.00060.000
4-6400
4-6N
/A
*W
H = W
arehouse**
EM
EA
= Europe/M
iddle-East/A
frica***
D = D
istributionP
= Production
Service Provider
WH
*C
ode R
egion**B
usi-ness U
nit
Storage Capacity
Inbound Vol./Day
WH
Type***# Staff
Clients
beside B
osch
Outbound Vol./D
ay
TableA.1:C
lassificationofw
arehousesin
theWarehouse
Excellencegroup
138
B Appendix - Control GroupData Sheet
139

B Appendix - Control Group Data Sheet
# PalletsC1 Asia-Pacific UBK LSP Production 6.000C2 Asia-Pacific UBK LSP Production 9.000C3 Asia-Pacific UBI LSP Distribution 4.891C4 Asia-Pacific UBK LSP Distribution 2.922C5 Asia-Pacific UBK LSP Distribution 12.640C6 Asia-Pacific UBI LSP Distribution 12.000C7 Asia-Pacific UBG Bosch Distribution 4.500C8 Asia-Pacific UBK LSP Production 5.000C9 Asia-Pacific UBK Bosch Distribution 1.353
C10 Asia-Pacific UBK Bosch Distribution 5.672C11 Asia-Pacific UBK Bosch Distribution 911C12 Asia-Pacific UBI Bosch Production 3.709C13 Asia-Pacific UBK Bosch Distribution 430C14 Asia-Pacific UBK Bosch Distribution 950C15 Asia-Pacific UBK Bosch Distribution 595C16 Asia-Pacific UBK Bosch Distribution 207C17 Asia-Pacific UBK Bosch Distribution 383C18 Asia-Pacific UBK Bosch Distribution 947C19 Asia-Pacific UBK Bosch Distribution 1.166C20 Asia-Pacific UBK Bosch Distribution 1.984C21 Asia-Pacific UBK Bosch Distribution 1.118C22 Asia-Pacific UBK Bosch Distribution 896C23 Asia-Pacific UBK Bosch Distribution 633C24 Asia-Pacific UBK Bosch Distribution 721C25 Asia-Pacific UBK Bosch Distribution 4.058C26 Asia-Pacific UBK Bosch Distribution 1.732C27 Europe/Middle East/Africa UBK LSP Distribution 5.255C28 Europe/Middle East/Africa UBG LSP Distribution 3.900C29 Europe/Middle East/Africa UBG LSP Distribution 4.800C30 Europe/Middle East/Africa UBK LSP Production 3.000C31 Europe/Middle East/Africa UBK LSP Distribution 800C32 Europe/Middle East/Africa UBK LSP Distribution 6.652C33 Europe/Middle East/Africa UBK LSP Distribution 1.018C34 Europe/Middle East/Africa UBG LSP Distribution 12.800C35 Europe/Middle East/Africa UBK LSP Distribution N/AC36 Europe/Middle East/Africa UBK LSP Production 5.800C37 Europe/Middle East/Africa UBG LSP Distribution 14.100C38 Europe/Middle East/Africa UBI Bosch Production 10.433C39 Europe/Middle East/Africa UBG LSP Production 11.400C40 Europe/Middle East/Africa UBK Bosch Production 7.600C41 Europe/Middle East/Africa UBI LSP Distribution 9.300C42 Europe/Middle East/Africa UBG LSP Production 12.000C43 Europe/Middle East/Africa UBG LSP Production 18.000C44 Europe/Middle East/Africa UBK LSP Distribution 9.230C45 Europe/Middle East/Africa UBK LSP Distribution 3.000C46 Europe/Middle East/Africa UBG Bosch Production 7.550C47 Europe/Middle East/Africa UBG Bosch Distribution 5.250C48 Europe/Middle East/Africa UBG LSP Distribution 16.000C49 Europe/Middle East/Africa UBK LSP Distribution 1.180C50 Europe/Middle East/Africa UBK LSP Production 850C51 Latin America UBK Bosch Production 3.120C52 Latin America UBK LSP Distribution 600C53 North America UBI Bosch Distribution 3.344C54 North America UBK Bosch Production 10.000C55 North America UBK LSP Production 8.500C56 North America UBG Bosch Production 3.389
Storage Capacity
Warehouse Type
WarehouseCode
Service Provider
Business Unit
Region
Table B.1: Classification of warehouses in the control group
140

C Appendix - AssessmentQuestionaire
The development of the Bosch Logistic Warehouse Assessment (BLWA)is described in chapter4. We remember that the BLWA is based onthe Bosch Production System Assessment V. 3.1. Some parts ofthe Bosch Production System Assessment V. 3.1. were used as is,some parts derived, and some parts developed new for the BLWA.However, the Bosch Production System Assessment V. 3.1 is theintellectual property of Bosch and classified as strictly confidential.This means that parts that are used as is or derived cannot be pub-lished and only the parts that are totally new could be published.Nevertheless, we looked for literature sources that explain the mainpurpose of the parts that cannot be published. These parts wererated from bad to very good.
141

C Appendix - Assessment QuestionaireC
on
fide
ntia
lN
am
e o
f Wa
reh
ou
se
Wa
reh
ou
se
An
aly
sis
1.0
No
.0
12
34
De
sc
riptio
nS
tan
da
rds
Sta
nd
ard
sS
tan
da
rds
Sta
nd
ard
s
Bu
sin
ess re
qu
irem
en
ts
To
esta
blis
h a
vis
ion
sh
ou
ld b
e a
n in
teg
ral p
art o
f the
lea
n
pra
ctis
e in
a w
are
ho
use
. (So
ba
nski 2
00
9, p
.21
0) T
o re
ach
this
vis
ion
, KP
I-Tre
es c
an
be
use
d to
de
rive
go
als
from
the
bu
sin
ess
(cu
sto
me
r/ma
rke
t) for th
e w
are
ho
use
. (Fu
rma
ns, 2
01
2, p
. 79
)
ba
do
kg
oo
dve
ry g
oo
d0
Va
lue
stre
am
pla
nn
ing
So
ba
nski (2
00
9, p
.21
0) e
xp
lain
s th
e im
po
rtan
ce
of v
alu
e s
trea
m
ma
pp
ing
. A h
igh
er m
atu
rity c
an
be
rea
ch
ed
by h
avin
g v
alu
e
stre
am
ma
pp
ing
an
d v
alu
e s
trea
m d
esig
n fo
r all p
roce
sse
s w
ithin
the
wa
reh
ou
se
s. T
he
va
lue
stre
am
ma
ps s
ho
uld
inclu
de
the
info
rma
tion
an
d m
ate
rial flo
ws a
nd
ke
y p
erfo
rma
nce
ind
ica
tors
.
(Ro
the
r, 20
08
, pa
rt II). A y
ea
rly u
pd
ate
of th
e m
ap
s a
re n
ece
ssa
ry
(Ro
the
r, 20
08
, pa
rt V).
In a
wa
reh
ou
se
with
hig
he
r ma
turity
, the
role
of th
e v
alu
e s
trea
m
ma
na
ge
r sh
ou
ld b
e im
ple
me
nte
d a
nd
the
va
lue
stre
am
de
sig
n
sh
ou
ld le
ad
to a
pu
ll syste
m. (R
oth
er, 2
00
8, p
art I &
III)
ba
do
kg
oo
dve
ry g
oo
d0
Ide
ntific
atio
n o
f imp
rove
me
nt a
ctiv
ities
Ro
the
r (20
08
, pa
rt V) m
en
tion
s th
at th
e im
pro
ve
me
nt a
ctiv
ities
sh
ou
ld le
ad
from
va
lue
stre
am
ma
pp
ing
to v
alu
e s
trea
m d
esig
n.
Th
ese
activ
ities n
ee
d to
ha
ve
me
asu
rab
le g
oa
ls. A
lso
, a
de
riva
tion
from
the
bu
sin
ess re
qu
irem
en
t co
uld
he
lp id
en
tify
su
cce
ssfu
l imp
rove
me
nt a
ctiv
ities. (F
urm
an
s, 2
01
2, p
.80
)
ba
do
kg
oo
dve
ry g
oo
d0
De
finitio
n o
f targ
et c
on
ditio
ns fo
r Po
int-C
IP
De
hd
ari e
t al. (2
01
1) m
en
tion
tha
t a ta
rge
t co
nd
ition
with
a h
igh
ma
turity
co
nsis
t of a
sta
nd
ard
, a k
ey p
erfo
rma
nce
ind
ica
tor, a
nd
sta
bility
crite
ria.
ba
do
kg
oo
dve
ry g
oo
d0
Syste
m-C
IP p
roje
cts
Ro
the
r (20
08
, pa
rt V) d
escrib
es th
e fo
llow
ing
req
uire
me
nts
for
pro
jects
. Firs
t, it ha
s to
be
exa
ctly
de
scrib
ed
wh
at y
ou
pla
n to
do
,
wh
en
, an
d h
ow
(ste
p-b
y-s
tep
). Th
en
, me
asu
rab
le g
oa
ls a
re
ne
ed
ed
. Fin
ally
, cle
ar c
he
ckp
oin
ts w
ith re
al d
ea
dlin
es a
nd
na
me
d
revie
we
rs a
re re
qu
ired
. He
als
o h
igh
ligh
t als
o th
e im
po
rtan
ce
of
the
va
lue
stre
am
ma
na
ge
r with
in th
is c
on
text.
ba
do
kg
oo
dve
ry g
oo
d0
Po
int-C
IP a
rea
s:
- On
e P
oin
t-CIP
for w
ho
le
wa
reh
ou
se
Po
int C
IP a
rea
s:
- Po
int C
IP d
on
e fo
r
min
imu
m tw
o w
are
ho
use
se
ctio
ns
Po
int C
IP a
rea
s:
- Po
int C
IP d
on
e
se
pa
rate
ly fo
r eve
ry
wa
reh
ou
se
se
ctio
n (IG
,
Sto
rag
e, …
)
Po
int C
IP a
rea
s:
- Po
int C
IP d
on
e
se
pa
rate
ly fo
r eve
ry
wa
reh
ou
se
se
ctio
n, c
irca
10
op
era
tors
pe
r tea
m
0.0
0
System CIP
1.1
Co
mm
en
tsT
op
ics
Wa
reh
ou
se
An
aly
sis
1.0
CONCEPT
Po
ints
Ave
rag
e
Le
ve
l
IST
-AU
FN
AH
ME
Them
en
feld
er u
nd
Gew
ichtu
ng
1 K
ontin
uie
rliche V
erb
esseru
ng
3 L
agerp
rozesse
2 Ü
berg
reife
nde T
hem
en
We
rtstr
om
an
aly
se
Mo
de
rato
r1, M
od
era
tor2
1M
M/D
D/Y
YY
Y
FigureC.1:1.1
System-C
IPConcept(Furm
ansandW
lcek,2012;Rotherand
Shook,2008;Soban-ski,2009;D
ehdarietal.,2011)
142
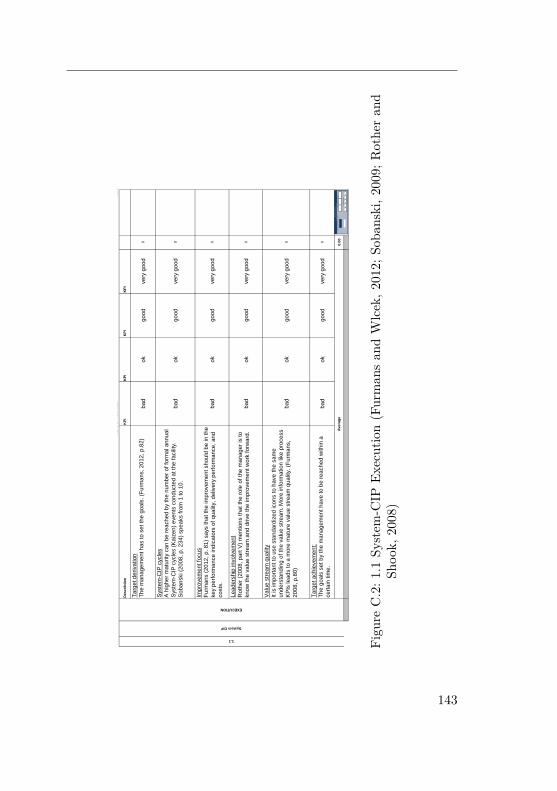
Co
nfid
en
tia
lN
am
e o
f W
are
ho
use
Wa
reh
ou
se
An
aly
sis
1.0
De
sc
rib
tio
nK
PI
KP
IK
PI
KP
I
Ta
rge
t d
eriva
tio
n
Th
e m
an
ag
em
en
t h
as to
se
t th
e g
oa
ls. (F
urm
an
s, 2
01
2, p
.82
)b
ad
ok
go
od
ve
ry g
oo
d0
Syste
m-C
IP c
ycle
s
A h
igh
er
ma
turity
ca
n b
e r
ea
ch
ed
by th
e n
um
be
r o
f fo
rma
l a
nn
ua
l
Syste
m-C
IP c
ycle
s (
Ka
ize
n)
eve
nts
co
nd
ucte
d a
t th
e f
acili
ty.
So
ba
nski (2
00
8, p
. 2
34
) sp
ea
ks f
rom
1 to
10
. b
ad
ok
go
od
ve
ry g
oo
d0
Imp
rove
me
nt fo
cu
s
Fu
rma
ns (
20
12
, p
. 8
1)
sa
ys th
at th
e im
pro
ve
me
nt sh
ou
ld b
e in
th
e
ke
y p
erf
orm
an
ce
in
dic
ato
rs o
f q
ua
lity, d
eliv
ery
pe
rfo
rma
nce
, a
nd
co
sts
.
ba
do
kg
oo
dve
ry g
oo
d0
Le
ad
ers
hip
in
vo
lve
me
nt
Ro
the
r (2
00
8, p
art
V)
me
ntio
ns th
at th
e r
ole
of
the
ma
na
ge
r is
to
kn
ow
th
e v
alu
e s
tre
am
an
d d
rive
th
e im
pro
ve
me
nt w
ork
fo
rwa
rd.
ba
do
kg
oo
dve
ry g
oo
d0
Va
lue
str
ea
m q
ua
lity
It is im
po
rta
nt to
use
sta
nd
ard
ize
d ico
ns to
ha
ve
th
e s
am
e
un
de
rsta
nd
ing
of
the
va
lue
str
ea
m. M
ore
in
form
atio
n lik
e p
roce
ss
KP
Is le
ad
s to
a m
ore
ma
ture
va
lue
str
ea
m q
ua
lity. (F
urm
an
s,
20
08
, p
.80
)
ba
do
kg
oo
dve
ry g
oo
d0
Ta
rge
t a
ch
ieve
me
nt:
Th
e g
oa
ls s
et b
y th
e m
an
ag
em
en
t h
ave
to
be
re
ach
ed
with
in a
ce
rta
in tim
e.
ba
do
kg
oo
dve
ry g
oo
d0
0.0
0
1.1
System CIP
EXECUTION
Ave
rag
e
IST
-AU
FN
AH
ME
Them
en
feld
er
und
Gew
ichtu
ng
1 K
ontinu
ierlic
he V
erb
esseru
ng
3 L
agerp
rozesse
2 Ü
berg
reifende T
hem
en
We
rtstr
om
an
aly
se
Mo
de
rato
r1,
Mo
de
rato
r21
MM
/DD
/YY
YY
Figu
reC.2:1
.1Sy
stem
-CIP
Execution(Furman
san
dW
lcek,2
012;
Soba
nski,2
009;
Rothe
ran
dSh
ook,
2008)
143
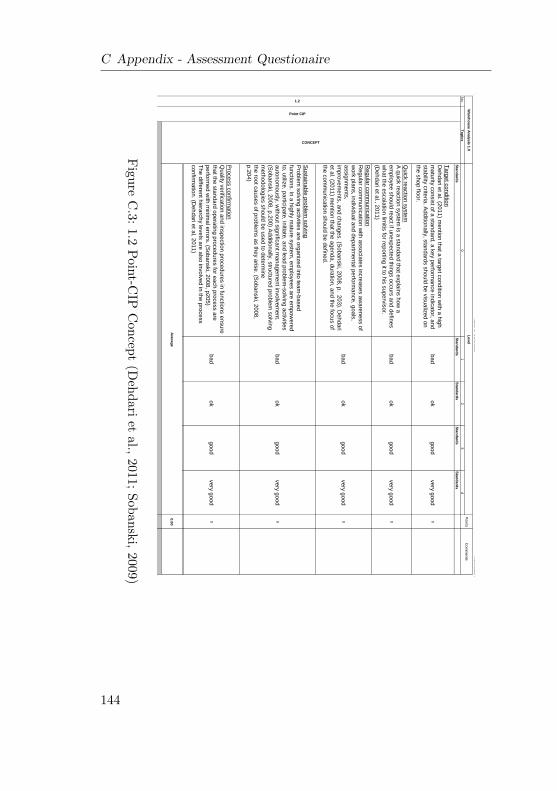
C Appendix - Assessment QuestionaireC
on
fide
ntia
lN
am
e o
f Wa
reh
ou
se
Wa
reh
ou
se
An
aly
sis
1.0
No
.0
12
34
Sta
nd
ard
sS
tan
da
rds
Sta
nd
ard
sS
tan
da
rds
Sta
nd
ard
s
Ta
rge
t co
nd
ition
De
hd
ari e
t al. (2
01
1) m
en
tion
tha
t a ta
rge
t co
nd
ition
with
a h
igh
ma
turity
co
nsis
t of a
sta
nd
ard
, a k
ey p
erfo
rma
nce
ind
ica
tor, a
nd
sta
bility
crite
ria. A
dd
ition
ally
, sta
nd
ard
s s
ho
uld
be
vis
ua
lize
d o
n
the
sh
op
floo
r.
ba
do
kg
oo
dve
ry g
oo
d0
Qu
ick re
actio
n s
yste
m
A q
uic
k re
actio
n s
yste
m is
a s
tan
da
rd th
at e
xp
lain
s h
ow
a
em
plo
ye
e s
ho
uld
rea
ct if u
ne
xp
ecte
d th
ing
s o
ccu
rs a
nd
de
fine
s
wh
at th
e e
sca
latio
n lim
itis fo
r rep
ortin
g it to
his
su
pe
rvis
or.
(De
hd
ari e
t al., 2
01
1)
ba
do
kg
oo
dve
ry g
oo
d0
Re
gu
lar c
om
mu
nic
atio
n
Re
gu
lar c
om
mu
nic
atio
n w
ith a
sso
cia
tes in
cre
ase
s a
wa
ren
ess o
f
wo
rk p
lan
s, in
div
idu
al a
nd
de
pa
rtme
nta
l pe
rform
an
ce
, go
als
,
assig
nm
en
ts,
imp
rove
me
nts
, an
d c
ha
ng
es. (S
ob
an
ski, 2
00
8, p
. 20
3). D
eh
da
ri
et a
l. (20
11
) me
ntio
n th
at th
e a
ge
nd
a, d
ura
tion
, an
d th
e fo
cu
s o
f
the
co
mm
un
ica
tion
sh
ou
ld b
e d
efin
ed
.
ba
do
kg
oo
dve
ry g
oo
d0
Su
sta
ina
ble
pro
ble
m s
olv
ing
Pro
ble
m s
olv
ing
activ
ities a
re o
rga
niz
ed
into
tea
m-b
ase
d
fun
ctio
ns. In
a h
igh
ly m
atu
re s
yste
m, e
mp
loye
es a
re e
mp
ow
ere
d
to, u
tilize
, pa
rticip
ate
, initia
te, a
nd
lea
d p
rob
lem
-so
lvin
g a
ctiv
ities
au
ton
om
ou
sly
, with
ou
t sig
nific
an
t ma
na
ge
me
nt in
vo
lve
me
nt.
(So
ba
nski, 2
00
8, p
.20
0) A
dd
ition
ally
, stru
ctu
red
pro
ble
m s
olv
ing
me
tho
do
log
ies s
ho
uld
be
use
d to
de
term
ine
the
roo
t ca
use
s o
f pro
ble
ms a
s th
ey a
rise
. (So
ba
nski, 2
00
8,
p.2
04
)
ba
do
kg
oo
dve
ry g
oo
d0
Pro
ce
ss c
on
firma
tion
Qu
ality
ve
rifica
tion
an
d in
sp
ectio
n p
roce
du
res in
fun
ctio
ns e
nsu
re
tha
t the
sta
nd
ard
op
era
ting
pro
ce
du
res fo
r ea
ch
pro
ce
ss a
re
pe
rform
ed
with
min
ima
l erro
rs. (S
ob
an
ski, 2
00
8, p
20
5)
Th
e d
iffere
nt h
iera
rch
y le
ve
ls a
re a
lso
invo
lve
d in
the
pro
ce
ss
co
nfirm
atio
n. (D
eh
da
ri et a
l, 20
11
)
ba
do
kg
oo
dve
ry g
oo
d0
0.0
0
Po
ints
Co
mm
en
ts
1.2
Point CIP
To
pic
s
Wa
reh
ou
se
An
aly
sis
1.0
Ave
rag
e
Le
ve
l
CONCEPT
IST
-AU
FN
AH
ME
Them
en
feld
er u
nd
Ge
wic
htu
ng
1 K
ontin
uie
rliche V
erb
esseru
ng
3 L
agerp
rozesse
2 Ü
berg
reife
nde T
hem
en
We
rtstro
mana
lyse
Mo
de
rato
r1, M
od
era
tor2
1M
M/D
D/Y
YY
Y
FigureC.3:1.2
Point-CIP
Concept
(Dehdariet
al.,2011;Sobanski,2009)
144

Co
nfid
en
tia
lN
am
e o
f W
are
ho
use
Wa
reh
ou
se
An
aly
sis
1.0
KP
IK
PI
KP
IK
PI
KP
I
KP
I-e
ffe
ct
So
ba
nski (2
00
8, p
.22
2)
de
fin
es th
at a
mo
re m
atu
re s
yste
m n
ee
ds
less tim
e to
ach
ieve
ta
rge
ts.
ba
do
kg
oo
dve
ry g
oo
d0
Qu
alit
y o
f p
rob
lem
so
lvin
g
Th
e r
oo
t ca
use
an
aly
sis
ha
s to
be
do
ne
with
th
e r
igh
t to
ols
. T
he
co
un
term
ea
su
res s
ho
uld
ha
ve
a tro
ub
lesh
oo
tin
g e
ffe
ct. M
ore
ove
r
the
pro
ble
ms s
ho
uld
be
so
lve
d p
erm
an
en
tly a
nd
ch
ecke
d w
ith
a
follo
w u
p. (D
eh
da
ri e
t a
l, 2
01
1)
ba
do
kg
oo
dve
ry g
oo
d0
0.0
0
1.2
Point CIP
EXECUTION
Ave
rag
eIS
T-A
UF
NA
HM
E
Them
en
feld
er
und
Ge
wic
htu
ng
1 K
ontinu
ierlic
he V
erb
esseru
ng
3 L
agerp
rozesse
2 Ü
berg
reifende T
hem
en
We
rtstr
om
ana
lyse
Mo
de
rato
r1,
Mo
de
rato
r21
MM
/DD
/YY
YY
Figu
reC.4:1
.2Po
int-CIP
Execution(Sob
anski,2009;D
ehda
riet
al.,2011)
145
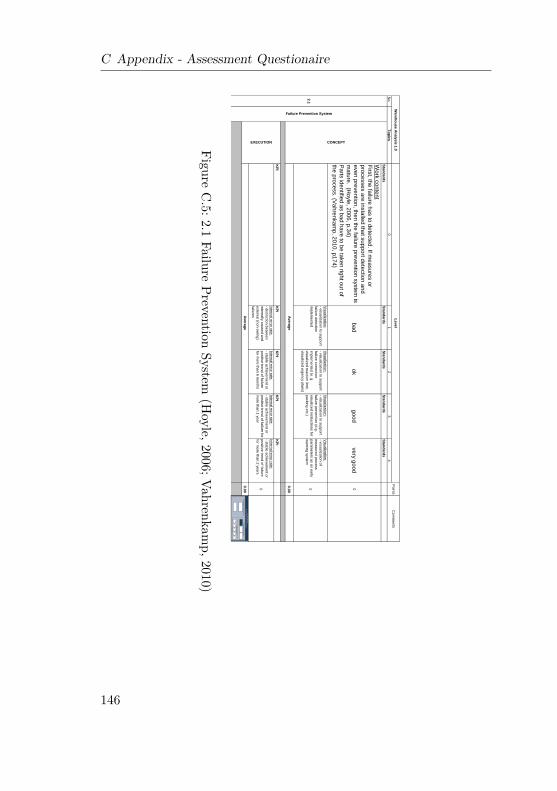
C Appendix - Assessment Questionaire Co
nfid
en
tial
Na
me
of W
are
ho
use
Wa
reh
ou
se
An
aly
sis
1.0
No
.0
12
34
Sta
nd
ard
sS
tan
da
rds
Sta
nd
ard
sS
tan
da
rds
Sta
nd
ard
s
Wo
rk c
on
ten
t
Firs
t, the
failu
re h
as to
de
tecte
d. If m
ea
su
res o
r
pro
ce
sse
s a
re in
sta
lled
tha
t su
pp
ort d
ete
ctio
n a
nd
eve
n p
reve
ntio
n, th
en
the
failu
re p
reve
ntio
n s
yste
m is
ma
ture
. (Ho
yle
, 20
06
, p.3
4)
Pa
rts id
en
tified
as b
ad
ha
ve
to b
e ta
ke
n rig
ht o
ut o
f
the
pro
ce
ss. (V
ah
ren
ka
mp
, 20
10
, p1
74
)
ba
do
kg
oo
dve
ry g
oo
d0
Vis
ua
liza
tion
:
- vis
ua
liza
tion
to s
up
po
rt
failu
re d
ete
ctio
n
imp
lem
en
ted
Vis
ua
liza
tion
:
- vis
ua
liza
tion
to s
up
po
rt
failu
re c
orre
ctio
n
imp
lem
en
ted
(e. g
.
vis
ua
lize
d re
actio
n lim
it,
vis
ua
lize
d u
rge
ncy p
lan
s)
Vis
ua
liza
tion
:
- vis
ua
liza
tion
to s
up
po
rt
failu
re p
reve
ntio
n (e
.g.
vis
ua
lize
d in
stru
ctio
ns fo
r
pa
ckin
g e
tc.)
Vis
ua
liza
tion
:
- vis
ua
liza
tion
of
me
asu
red
pro
ce
ss
pa
ram
ete
rs a
s a
n e
arly
wa
rnin
g s
yste
m0
0.0
0
KP
IK
PI
KP
IK
PI
KP
I
Inte
rna
l erro
r rate
:
- dis
tinctio
n b
etw
ee
n
inte
rna
lly c
au
se
d a
nd
exte
rna
l (no
n-o
win
g)
failu
res
Inte
rna
l erro
r rate
:
- sta
ble
ach
ieve
me
nt o
r
po
sitiv
e tre
nd
of fa
ilure
for m
ore
tha
n 6
mo
nth
s
Inte
rna
l erro
r rate
:
- sta
ble
ach
ieve
me
nt o
r
po
sitiv
e tre
nd
of fa
ilure
for
mo
re th
an
1 y
ea
r
Inte
rna
l erro
r rate
:
- sta
ble
ach
ieve
me
nt o
r
po
sitiv
e tre
nd
of fa
ilure
for m
ore
tha
n 2
ye
ars
0
0.0
0
2.1
EXECUTION CONCEPT
Ave
rag
e
Ave
rag
e
Failure Prevention System
Co
mm
en
tsW
are
ho
use
An
aly
sis
1.0
Po
ints
Le
ve
l
To
pic
s
IST
-AU
FN
AH
ME
Them
en
feld
er u
nd
Ge
wic
htu
ng
1 K
ontin
uie
rliche V
erb
esseru
ng
3 L
agerp
rozesse
2 Ü
berg
reife
nde T
hem
en
We
rtstro
mana
lyse
Mo
de
rato
r1, M
od
era
tor2
1M
M/D
D/Y
YY
Y
FigureC.5:2.1
FailurePrevention
System(H
oyle,2006;Vahrenkamp,2010)
146

Co
nfid
en
tia
lN
am
e o
f W
are
ho
use
Wa
reh
ou
se
An
aly
sis
1.0
No
.0
12
34
Sta
nd
ard
sS
tan
da
rds
Sta
nd
ard
sS
tan
da
rds
Sta
nd
ard
s
Invo
lve
me
nt:
Wo
rke
r in
vo
lve
me
nt is
im
po
rta
nt fo
r su
sta
inin
g
imp
rove
me
nts
an
d e
mp
ow
erin
g th
e
wo
rkfo
rce
. T
hu
s, th
e p
erc
en
tag
e o
f th
e a
ctivitie
s th
at
are
in
itia
ted
by th
e w
ork
ers
is tra
cke
d. (S
ob
an
ski,
20
08
, p
.16
8)
ba
do
kg
oo
dve
ry g
oo
d0
Ta
rge
t d
ep
loym
en
t
Wa
reh
ou
se
s ta
rge
ts h
ave
to
be
de
rive
d f
or
ea
ch
tea
m. T
he
te
am
le
ad
er
se
t th
e ta
rge
ts f
or
his
sp
ecific
tea
m d
eriviv
ed
fro
m h
is p
ers
on
al ta
rge
ts. (J
ackso
n,
19
96
, p
.10
9)
ba
do
kg
oo
dve
ry g
oo
d0
Qu
alif
ica
tio
n /
Tra
inin
g:
- b
ott
len
eck t
rea
tme
nt
by
fle
xib
le w
ork
forc
e
Qu
alif
ica
tio
n /
Tra
inin
g:
- re
gu
lar
tra
inin
g (
off
-th
e-
job
) fo
r te
am
le
ad
er
pro
vid
ed
to
fa
cili
tate
eff
ective
te
am
ing
,
co
mm
un
ica
tio
n s
kill
s,
co
ntin
uo
us im
pro
ve
me
nt
me
tho
ds (
e.
g.
Me
tho
ds
Sh
op
)
Qu
alif
ica
tio
n /
Tra
inin
g:
- re
gu
lar
tra
inin
g (
off
-th
e-
job
) fo
r e
mp
loye
es
pro
vid
ed
to
fa
cili
tate
eff
ective
te
am
ing
,
co
mm
un
ica
tio
n s
kill
s,
co
ntin
uo
us im
pro
ve
me
nt
me
tho
ds (
e.
g.
Me
tho
ds
Sh
op
)
Qu
alif
ica
tio
n /
Tra
inin
g:
- a
s le
ve
l 3
0
0.0
0
KP
IK
PI
KP
IK
PI
KP
I
Mu
lti-skill
ed
op
era
tors
:
Op
era
tors
are
no
t tr
ain
ed
fo
r d
iffe
ren
t fu
nctio
ns
Mu
lti-skill
ed
op
era
tors
:
25
-49
% o
f th
e o
pe
rato
rs
are
tra
ine
d f
or
mo
re t
ha
n
on
e f
un
ctio
n
Mu
lti-skill
ed
op
era
tors
:
50
-74
% o
f th
e o
pe
rato
rs
are
tra
ine
d f
or
mo
re t
ha
n
on
e f
un
ctio
n
Mu
lti-skill
ed
op
era
tors
:
75
-90
% o
f th
e o
pe
rato
rs
are
tra
ine
d f
or
mo
re t
ha
n
on
e f
un
ctio
n
Mu
lti-skill
ed
op
era
tors
:
Mo
re t
ha
n 9
0 %
of
the
op
era
tors
are
tra
ine
d f
or
mo
re t
ha
n o
ne
fu
nctio
n0
Op
era
tor
invo
lve
me
nt
Em
plo
ye
es p
ractice
, e
xh
ibit th
e in
itia
tive
, a
nd
ad
he
re
to th
e le
an
in
itia
tive
, o
rig
ina
tin
g p
rob
lem
-so
lvin
g a
nd
reso
lutio
n a
ctivitie
s in
div
idu
ally
an
d a
uto
no
mo
usly
.
(So
ba
nski, 2
00
8, p
. 2
01
)
ba
do
kg
oo
dve
ry g
oo
d0 0
Le
ad
ers
hip
in
vo
lve
me
nt
Ma
na
ge
r o
r S
up
erv
iso
rs s
pe
nd
sig
nific
an
t tim
e o
n
the
sh
op
flo
or
de
ve
lop
ing
te
am
le
ad
ers
an
d
em
plo
ye
es a
nd
dire
ctin
g a
nd
fa
cili
tatin
g d
aily
activitie
s. (S
ob
an
ski, 2
00
8, p
. 2
01
)
ba
do
kg
oo
dve
ry g
oo
d0
0.0
0
Po
ints
Co
mm
en
tsW
are
ho
use
An
aly
sis
1.0
EXECUTION
Ave
rag
e
Le
ve
l
CONCEPT
Ave
rag
e
Employee Involvement
2.2
To
pic
s
IST
-AU
FN
AH
ME
Them
en
feld
er
und
Ge
wic
htu
ng
1 K
ontinu
ierlic
he V
erb
esseru
ng
3 L
agerp
rozesse
2 Ü
berg
reifende T
hem
en
We
rtstr
om
ana
lyse
Mo
de
rato
r1,
Mo
de
rato
r21
MM
/DD
/YY
YY
Figu
reC.6:2
.2Em
ployee
Involvem
ent(Jackson
andJo
nes,
1996;S
oban
ski,2009)
147
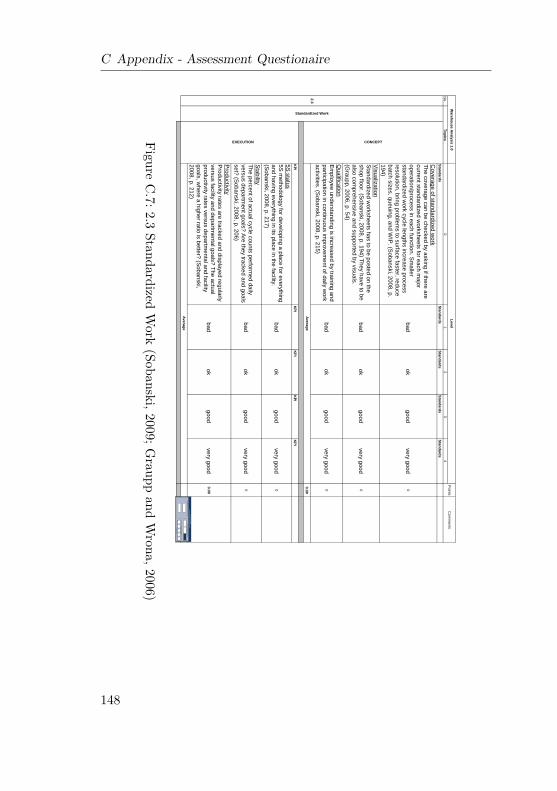
C Appendix - Assessment Questionaire Co
nfid
en
tial
Na
me
of W
are
ho
use
Wa
reh
ou
se
An
aly
sis
1.0
No
.0
12
34
Sta
nd
ard
sS
tan
da
rds
Sta
nd
ard
sS
tan
da
rds
Sta
nd
ard
s
Co
ve
rag
e o
f sta
nd
ard
ize
d w
ork
Th
e c
ove
rag
e c
an
be
ch
ecke
d b
y a
skin
g if th
ere
are
cu
rren
t sta
nd
ard
ize
d w
ork
sh
ee
ts fo
r ea
ch
ma
jor
op
era
tion
/pro
ce
ss in
ea
ch
fun
ctio
n. S
ma
ller
sta
nd
ard
ize
d w
ork
cycle
len
gth
s in
cre
ase
pro
ce
ss
reso
lutio
n, b
ring
pro
ble
ms to
su
rface
faste
r, red
uce
ba
tch
siz
es, q
ue
uin
g, a
nd
WIP
. (So
ba
nski, 2
00
8, p
.
19
4)
ba
do
kg
oo
dve
ry g
oo
d0
Vis
ua
liza
tion
Sta
nd
ard
ize
d w
ork
sh
ee
ts h
as to
be
po
ste
d o
n th
e
sh
op
floo
r. (So
ba
nski, 2
00
8, p
. 19
4) T
he
y h
ave
to b
e
als
o c
om
pre
he
nsiv
e a
nd
su
pp
orte
d b
y v
isu
als
.
(Gra
up
p, 2
00
6, p
. 54
)
ba
do
kg
oo
dve
ry g
oo
d0
Qu
alific
atio
n
Em
plo
ye
e u
nd
ers
tan
din
g is
incre
ase
d b
y tra
inin
g a
nd
pa
rticip
atio
n in
co
ntin
uo
us im
pro
ve
me
nt o
f da
ily w
ork
activ
ities. (S
ob
an
ski, 2
00
8, p
. 21
5)
ba
do
kg
oo
dve
ry g
oo
d0
0.0
0
KP
IK
PI
KP
IK
PI
KP
I
5S
sta
tus
5S
me
tho
do
log
y fo
r de
ve
lop
ing
a p
lace
for e
ve
ryth
ing
an
d h
avin
g e
ve
ryth
ing
in its
pla
ce
in th
e fa
cility
.
(So
ba
nski, 2
00
8, p
. 21
7)
ba
do
kg
oo
dve
ry g
oo
d0
Sta
bility
Th
e p
erc
en
t of a
ctu
al c
ycle
co
un
ts p
erfo
rme
d d
aily
ve
rsu
s d
ep
artm
en
t go
als
? A
re th
ey tra
cke
d a
nd
go
als
se
t? (S
ob
an
ski, 2
00
8, p
. 20
6)
ba
do
kg
oo
dve
ry g
oo
d0
Pro
du
ctiv
ity
Pro
du
ctiv
ity ra
tes a
re tra
cke
d a
nd
dis
pla
ye
d re
gu
larly
ve
rsu
s fa
cility
an
d d
ep
artm
en
tal g
oa
ls?
Th
e a
ctu
al
pro
du
ctiv
ity ra
tes v
ers
us d
ep
artm
en
tal a
nd
facility
go
als
, wh
ere
a h
igh
er ra
tio is
be
tter?
(So
ba
nski,
20
08
, p. 2
12
)
ba
do
kg
oo
dve
ry g
oo
d0
.00
2.3
EXECUTION CONCEPT
Ave
rag
e
Ave
rag
e
Standardized Work
Co
mm
en
tsW
are
ho
use
An
aly
sis
1.0
Po
ints
Le
ve
l
To
pic
s
IST
-AU
FN
AH
ME
Them
en
feld
er u
nd
Ge
wic
htu
ng
1 K
ontin
uie
rliche V
erb
esseru
ng
3 L
agerp
rozesse
2 Ü
berg
reife
nde T
hem
en
We
rtstro
mana
lyse
Mo
de
rato
r1, M
od
era
tor2
1M
M/D
D/Y
YY
Y
FigureC.7:2.3
StandardizedWork
(Sobanski,2009;Graupp
andWrona,2006)
148
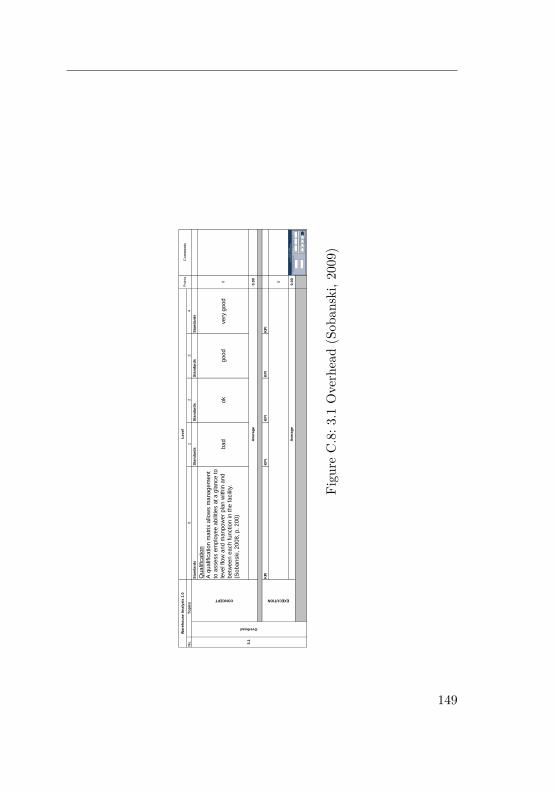
Co
nfid
en
tia
lN
am
e o
f W
are
ho
use
Wa
reh
ou
se
An
aly
sis
1.0
No
.0
12
34
Sta
nd
ard
sS
tan
da
rds
Sta
nd
ard
sS
tan
da
rds
Sta
nd
ard
s
Qu
alif
ica
tio
n
A q
ua
lific
atio
n m
atr
ix a
llow
s m
an
ag
em
en
t
to a
sse
ss e
mp
loye
e a
bili
tie
s a
t a
gla
nce
to
leve
l flo
w a
nd
ma
np
ow
er
pla
n w
ith
in a
nd
be
twe
en
ea
ch
fu
nctio
n in
th
e f
acili
ty.
(So
ba
nski, 2
00
8, p
. 2
00
)
ba
do
kg
oo
dve
ry g
oo
d0
0.0
0
KP
IK
PI
KP
IK
PI
KP
I
0
0.0
0
Ave
rag
e
EXECUTION
Ave
rag
e
Wa
reh
ou
se
An
aly
sis
1.0
Le
ve
lP
oin
tsC
om
me
nts
To
pic
s
3.1
Overhead
CONCEPT
IST
-AU
FN
AH
ME
Them
en
feld
er
und
Ge
wic
htu
ng
1 K
ontinu
ierlic
he V
erb
esseru
ng
3 L
agerp
rozesse
2 Ü
berg
reifende T
hem
en
We
rtstr
om
ana
lyse
Mo
de
rato
r1,
Mo
de
rato
r21
MM
/DD
/YY
YY
Figu
reC.8:3
.1Overhead(Sob
anski,2009)
149

C Appendix - Assessment Questionaire Co
nfid
en
tial
Na
me
of W
are
ho
use
Wa
reh
ou
se
An
aly
sis
1.0
No
.0
12
34
Sta
nd
ard
sS
tan
da
rds
Sta
nd
ard
sS
tan
da
rds
Sta
nd
ard
s
Org
an
iza
tion
Tim
e w
ind
ow
s c
an
he
lp le
ve
l the
wo
rklo
ad
for
de
fine
d s
hip
pin
g tim
es. If th
ese
time
win
do
ws a
re
als
o a
va
ilab
le fo
r the
do
wn
stre
am
pro
ce
sse
s, th
e
ma
turity
is h
igh
er. (D
eh
da
ri et a
l, 20
12
)
ba
do
kg
oo
dve
ry g
oo
d0
Te
ch
nic
al E
qu
ipm
en
t:
- OG
op
era
tor h
as to
ha
nd
le th
e e
ntire
pro
ce
ss
ma
nu
ally
Te
ch
nic
al E
qu
ipm
en
t:
- OG
op
era
tor its
su
pp
orte
d b
y s
em
i-
au
tom
atic
eq
uip
me
nt (e
.
g. s
ca
nn
er)
Te
ch
nic
al E
qu
ipm
en
t:
- as le
ve
l 3
Te
ch
nic
al E
qu
ipm
en
t:
- OG
op
era
tor is
su
pp
orte
d b
y a
uto
ma
tic
eq
uip
me
nt (e
. g. R
FID
ga
te)
0
Vis
ua
liza
tion
Vis
ua
l co
ntro
ls c
an
he
lp g
ua
ran
tee
the
time
win
do
ws. V
isu
al c
on
trol m
ech
an
ism
s e
nh
an
ce
pro
ce
ss in
teg
rity a
nd
red
uce
wa
ste
by e
limin
atin
g
se
arc
hin
g a
nd
sta
biliz
ing
pro
ce
sse
s. (S
ob
an
ski,
20
08
, p.2
15
) (Fu
rma
ns, 2
01
2, p
.49
)
ba
do
kg
oo
dve
ry g
oo
d00
0.0
0
KP
IK
PI
KP
IK
PI
KP
I
Tim
e w
ind
ow
ad
he
ren
ce
Tra
ckin
g th
e tim
e w
ind
ow
ad
he
ren
ce
info
rma
tion
illustra
tes th
e p
erfo
rma
nce
ve
rsu
s th
e e
xp
ecta
tion
s.
(So
ba
nski, 2
00
8, p
. 21
2)
ba
do
kg
oo
dve
ry g
oo
d0
Ba
lan
cin
g o
f co
mp
lete
sh
ipp
ing
pro
ce
sse
s
To
ba
lan
ce
the
wo
rklo
ad
, it is im
po
rtan
t to k
no
w th
e
wo
rklo
ad
an
d a
va
ilab
le m
an
ho
urs
. An
imp
rove
me
nt
of th
e b
ala
nce
is d
esire
d. (F
urm
an
s, 2
01
2, p
. 82
) b
ad
ok
go
od
ve
ry g
oo
d0
Le
ad
time
of th
e s
hip
pin
g p
rep
ara
tion
pro
ce
ss
Th
e le
ad
time
of th
e s
hip
pin
g a
nd
sh
ipp
ing
pre
pa
ratio
n s
ho
uld
be
me
asu
red
. If it is s
tab
le
red
uce
d fo
r a c
erta
in tim
e th
an
this
is a
go
od
ind
ica
tion
. (Fu
rma
ns, 2
01
2, p
. 79
)
ba
do
kg
oo
dve
ry g
oo
d0
Dis
pa
tch
erro
r rate
:
- failu
res c
au
se
d in
the
dis
pa
tch
are
a a
re
me
asu
red
Dis
pa
tch
erro
r rate
:
- sta
ble
ach
ieve
me
nt o
r
po
sitiv
e tre
nd
of fa
ilure
for
mo
re th
an
6 m
on
ths
Dis
pa
tch
erro
r rate
:
- sta
ble
ach
ieve
me
nt o
r
po
sitiv
e tre
nd
of fa
ilure
for
mo
re th
an
1 y
ea
r
Dis
pa
tch
erro
r rate
:
- sta
ble
ach
ieve
me
nt o
r
po
sitiv
e tre
nd
of fa
ilure
for m
ore
tha
n 2
ye
ars
0
Ha
nd
ling
ste
ps
- ha
nd
ling
ste
ps a
re
co
un
ted
Ha
nd
ling
ste
ps:
- red
uctio
n in
ha
nd
ling
ste
ps in
the
last 6
mo
nth
s
by o
ptim
izin
g m
ea
su
res
(if ne
ce
ssa
ry m
inim
um
is
rea
ch
ed
, sta
ble
ach
ieve
me
nt c
ou
nts
as
red
uctio
n)
Ha
nd
ling
ste
ps:
- red
uctio
n in
ha
nd
ling
ste
ps in
the
last 3
mo
nth
s
by o
ptim
izin
g m
ea
su
res
(if ne
ce
ssa
ry m
inim
um
is
rea
ch
ed
, sta
ble
ach
ieve
me
nt c
ou
nts
as
red
uctio
n)
Ha
nd
ling
ste
ps:
- red
uctio
n in
ha
nd
ling
ste
ps in
the
last m
on
th
by o
ptim
izin
g m
ea
su
res
(if ne
ce
ssa
ry m
inim
um
is
rea
ch
ed
, sta
ble
ach
ieve
me
nt c
ou
nts
as
red
uctio
n)
0
0.0
0
Outgoing Goods
Co
mm
en
tsL
eve
lP
oin
ts
To
pic
s
Ave
rag
e
CONCEPT
Ave
rag
e
EXECUTION
Wa
reh
ou
se
An
aly
sis
1.0
3.2
IS
T-A
UF
NA
HM
E
Them
en
feld
er u
nd
G
ew
ichtu
ng
1 K
ontin
uie
rlic
he V
erbesseru
ng
3 La
gerp
ro
zesse
2 Ü
bergreifende T
hem
en
We
rtstrom
ana
lyse
Mo
de
rato
r1, M
od
era
tor2
1M
M/D
D/Y
YY
Y
FigureC.9:3.2
Outgoing
Goods
(Dehdariand
Schwab,2012;Sobanski,2009;Furm
ansand
Wl-
cek,2012)
150

Co
nfid
en
tia
lN
am
e o
f W
are
ho
use
Wa
reh
ou
se
An
aly
sis
1.0
No
.0
12
34
Sta
nd
ard
sS
tan
da
rds
Sta
nd
ard
sS
tan
da
rds
Sta
nd
ard
s
Pa
cka
ge
d g
oo
d:
- p
acka
ge
d g
oo
ds a
re a
va
ilab
le in
sh
ort
wa
lkin
g d
ista
nce
(<
5 m
ete
rs)
Pa
cka
ge
d g
oo
d:
- p
acka
ge
d g
oo
ds a
re a
va
ilab
le f
or
the
pa
cka
gin
g o
pe
rato
r in
op
era
tin
g d
ista
nce
(with
ou
t w
alk
ing
)
Pa
cka
ge
d g
oo
d:
- p
acka
ge
d g
oo
ds a
re d
eliv
ere
d in
th
e r
igh
t
se
qu
en
ce
(re
ga
rdin
g d
isp
atc
h s
eq
ue
nce
)
Pa
cka
ge
d g
oo
d:
- a
s le
ve
l 3
0
Pa
cka
gin
g m
ate
ria
l:
- o
pe
rato
r h
as p
acka
gin
g m
ate
ria
l in
wa
lkin
g d
ista
nce
- m
ate
ria
l m
ust
be
re
sto
cke
d b
y p
acka
gin
g
op
era
tor
him
se
lf (
inte
rru
ptio
n o
f w
ork
)
Pa
cka
gin
g m
ate
ria
l:
- O
pe
rato
r h
as p
acka
gin
g m
ate
ria
l in
wa
lkin
g d
ista
nce
- M
ate
ria
l is
re
sto
cke
d r
eg
ula
rly
Pa
cka
gin
g m
ate
ria
l:
- o
pe
rato
r h
as p
acka
gin
g m
ate
ria
l in
op
era
tin
g d
ista
nce
(w
ith
ou
t w
alk
ing
)
- m
ate
ria
l is
re
sto
cke
d r
eg
ula
rly
- o
pe
rato
r h
as p
ossib
ility
fo
r e
me
rge
ncy
ca
ll in
ca
se
ma
teria
l ru
ns o
ut
Pa
cka
gin
g m
ate
ria
l:
- a
s le
ve
l 3
- sta
gin
g o
f m
ate
ria
l is
gu
ara
nte
ed
by a
we
ll-w
ork
ing
, c
on
su
mp
tio
n-d
rive
n s
yste
m
(e.
g.
milk
run
)
0
Pa
cka
gin
g p
roce
ss:
- e
rgo
no
mic
re
qu
ire
me
nts
are
fu
lfill
ed
reg
ard
ing
pa
cka
gin
g w
ork
pla
ce
Pa
cka
gin
g p
roce
ss:
- p
roce
ss-o
rie
nte
d w
ork
pla
ce
de
sig
n/la
yo
ut:
ce
ntr
al a
nd
su
ffic
ien
t d
isp
osa
l o
f a
ll
de
vic
es /
to
ols
/ m
ach
ine
s /
IT
-su
pp
ort
Pa
cka
gin
g p
roce
ss:
- a
s le
ve
l 2
- fle
xib
le w
ork
pla
ce
de
sig
n -
-> w
ork
sp
lace
ca
n b
e u
se
d f
or
diffe
ren
t fu
nctio
ns
- sta
nd
ard
s f
or
pa
cka
gin
g p
roce
ss a
re
de
fin
ed
an
d c
om
mu
nic
ate
d
Pa
cka
gin
g p
roce
ss:
- o
pe
rato
rs p
roce
ssin
g a
pa
cka
gin
g u
nit
are
wo
rkin
g >
90
% o
f th
eir w
ork
tim
e
acco
rdin
g t
o s
tan
da
rdiz
ed
wo
rk0
Vis
ua
liza
tio
n:
- cle
ar
vis
ua
liza
tio
n o
f w
hic
h p
rod
ucts
mu
st
be
pa
cke
d t
og
eth
er
- sta
nd
ard
ize
d a
nd
vis
ua
lize
d p
lace
wh
ere
to p
ut
the
de
live
ry n
ote
Vis
ua
liza
tio
n:
- a
s le
ve
l 1
- cle
ar
vis
ua
liza
tio
n o
f w
hic
h c
on
sig
ne
d
ord
ers
sh
ou
ld b
e w
ork
ed
on
ne
xt
(FIF
O,
rush
ord
ers
)
Vis
ua
liza
tio
n:
- a
s le
ve
l 2
- e
asily
vis
ible
co
mp
lete
ne
ss c
he
ck (
e.
g.
by w
eig
ht)
Vis
ua
liza
tio
n:
- a
s le
ve
l 3
- vis
ua
liza
tio
n,
if p
acka
gin
g o
pe
rato
rs a
re
still
on
tim
e o
r if c
on
sig
nm
nt
op
era
tors
are
wo
rkin
g f
aste
r --
> f
lexib
le e
mp
loye
e
ch
an
ge
- b
ase
d o
n v
olu
me
ca
lcu
latio
n o
f o
rde
r
vis
ua
liza
tio
n o
f a
de
qu
ate
pa
cka
gin
g
0 00
.00
KP
IK
PI
KP
IK
PI
KP
I
Le
ad
tim
e o
f th
e p
acka
gin
g p
roce
ss:
- le
ad
tim
e o
f th
e p
acka
gin
g p
roce
ss is
me
asu
red
Le
ad
tim
e o
f th
e p
acka
gin
g p
roce
ss:
- p
ositiv
e t
ren
d o
r a
t sta
ble
ta
rge
t le
ve
l o
f
ave
rag
e le
ad
tim
e o
f a
ll p
ackin
g u
nits
sin
ce
min
. 6
mo
nth
s
Le
ad
tim
e o
f th
e p
acka
gin
g p
roce
ss:
- p
ositiv
e t
ren
d o
f a
ve
rag
e le
ad
tim
e s
ince
the
la
st
12
mo
nth
s o
r sta
ble
Le
ad
tim
e o
f th
e p
acka
gin
g p
roce
ss:
- p
ositiv
e t
ren
d o
f a
ve
rag
e le
ad
tim
e s
ince
the
la
st
24
mo
nth
s o
r o
n o
uts
tan
din
g le
ve
l0
Pa
cka
gin
g e
rro
r ra
te:
- fa
ilure
s c
au
se
d in
th
e p
acka
gin
g a
rea
are
me
asu
red
Pa
cka
gin
g e
rro
r ra
te:
- sta
ble
ach
ieve
me
nt
or
po
sitiv
e t
ren
d o
f
failu
re f
or
mo
re t
ha
n 6
mo
nth
s
Pa
cka
gin
g e
rro
r ra
te:
- sta
ble
ach
ieve
me
nt
or
po
sitiv
e t
ren
d o
f
failu
re f
or
mo
re t
ha
n 1
ye
ar
Pa
cka
gin
g e
rro
r ra
te:
- sta
ble
ach
ieve
me
nt
or
po
sitiv
e t
ren
d o
f
failu
re f
or
mo
re t
ha
n 2
ye
ars
0
0.0
0
Wa
reh
ou
se
An
aly
sis
1.0
Co
mm
en
tsL
eve
lP
oin
ts
To
pic
s
EXECUTION
3.3
Ave
rag
e
CONCEPT
Ave
rag
e
Packaging
IST
-AU
FN
AH
ME
Them
en
feld
er
und
Ge
wic
htu
ng
1 K
ontinu
ierlic
he V
erb
esseru
ng
3 L
agerp
rozesse
2 Ü
berg
reifende T
hem
en
We
rtstr
om
ana
lyse
Mo
de
rato
r1,
Mo
de
rato
r21
MM
/DD
/YY
YY
Figu
reC.10:
3.3Pa
ckaging
151

C Appendix - Assessment Questionaire
Co
nfid
en
tial
Na
me
of W
are
ho
use
Wa
reh
ou
se
An
aly
sis
1.0
No
.0
12
34
Sta
nd
ard
sS
tan
da
rds
Sta
nd
ard
sS
tan
da
rds
Sta
nd
ard
s
Pic
kin
g p
roce
ss:
- all n
ece
ssa
ry M
AE
are
ava
ilab
le
su
fficie
ntly
- co
nsig
me
nt o
pe
rato
rs a
re s
up
po
rted
by
ma
nu
al m
ea
su
res (e
.g. p
icklis
t)
- pic
kin
g w
ork
pla
ce
s fu
lfill erg
on
om
ic
req
uire
me
nts
Pic
kin
g p
roce
ss:
- as le
ve
l 1
- pic
kin
g o
pe
rato
rs a
re s
up
po
rted
by
syste
ma
tic a
nd
au
tom
atic
me
asu
res (e
.g.
pic
k-b
y-s
ca
n)
- op
era
tor s
elf c
on
trol
- pic
kin
g w
ork
pla
ce
s a
re p
roce
ss o
rien
ted
Pic
kin
g p
roce
ss:
- as le
ve
l 2
- pic
kin
g o
pe
rato
rs a
re s
up
po
rted
by
syste
ma
tic a
nd
au
tom
atic
me
asu
res th
at
allo
w tw
o fre
e h
an
ds (e
.g. p
ick b
y
vo
ice
/ligh
t)
Pic
kin
g p
roce
ss:
- as le
ve
l 3
- op
era
tors
pro
ce
ssin
g a
pa
ckin
g u
nit a
re
wo
rkin
g >
90
% o
f the
ir wo
rk tim
e a
cco
rdin
g
to s
tan
da
rdiz
ed
wo
rk0
Org
an
iza
tion
al s
yste
m:
- de
fine
d p
roce
ss fo
r trea
tme
nt o
f fix d
ate
an
d ru
sh
ord
er e
xis
ts
Org
an
iza
tion
al s
yste
m:
- pic
kin
g te
ch
niq
ue
de
pe
nd
s o
n o
rde
r
freq
ue
ncy, o
rde
r vo
lum
e/s
ize
, sta
bility
of
go
od
s, p
acka
gin
g m
ate
rial
- syste
m c
alc
ula
tes o
ptim
al m
eth
od
- job
co
ntro
l follo
ws a
cle
arly
de
fine
d
stra
teg
y
Org
an
iza
tion
al s
yste
m:
- as le
ve
l 2
- pic
kin
g s
eq
ue
nce
is o
ptim
ize
d b
y s
yste
m
- ord
er d
isp
atc
h d
ep
en
ds o
n a
va
ilab
le
pic
kin
g p
erfo
rma
nce
, cu
rren
t wo
rkin
g
pro
gre
ss a
nd
cu
rren
t syste
m s
tatu
s
Org
an
iza
tion
al s
yste
m:
- as le
ve
l 3
- pic
kin
g ra
cks a
re fle
xib
le
- syste
ma
tic a
nd
exte
nsiv
e p
lan
nin
g
ap
pro
ach
to le
ve
l ca
pa
city
sh
ort te
rm in
ca
se
of flu
ctu
atio
n in
de
ma
nd
0
Info
rma
tion
syste
m:
- ma
nu
al o
rde
r en
try
Info
rma
tion
syste
m:
- failu
re p
reve
ntio
n b
y a
uto
ma
tic
reg
istra
tion
of p
ickin
g p
ositio
ns (e
.g. b
y
sca
nn
ing
)
Info
rma
tion
syste
m:
- au
tom
atic
al o
rde
r en
try
- vo
uch
erle
ss tra
nsfe
r of p
ickin
g o
rde
r
Info
rma
tion
syste
m:
- as le
ve
l 30
Vis
ua
liza
tion
:
- vis
ua
liza
tion
to s
up
po
rt ma
teria
l flow
syste
m (tra
nsp
ort, ta
kin
g, h
an
d-o
ve
r), e. g
.
pic
kin
g a
rea
s, …
Vis
ua
liza
tion
:
- vis
ua
liza
tion
to s
up
po
rt org
an
iza
tion
al
syste
m (o
rde
r se
qu
en
ce
, pic
kin
g a
mo
un
t,
inte
rna
l de
live
ry p
erfo
rma
nce
, ...)
Vis
ua
liza
tion
:
- as le
ve
l 2
Vis
ua
liza
tion
:
- as le
ve
l 300
0.0
0
KP
IK
PI
KP
IK
PI
KP
I
Le
ad
time
of th
e p
ickin
g p
roce
ss:
- lea
d tim
e o
f the
pic
kin
g p
roce
ss is
me
asu
red
Le
ad
time
of th
e p
ickin
g p
roce
ss:
- po
sitiv
e tre
nd
or a
t sta
ble
targ
et le
ve
l of
ave
rag
e le
ad
time
of a
ll pa
cka
gin
g u
nits
sin
ce
min
. 6 m
on
ths
Le
ad
time
of th
e p
ickin
g p
roce
ss:
- po
sitiv
e tre
nd
of a
ve
rag
e le
ad
time
sin
ce
the
last 1
2 m
on
ths o
r sta
ble
Le
ad
time
of th
e p
ickin
g p
roce
ss:
- po
sitiv
e tre
nd
of a
ve
rag
e le
ad
time
sin
ce
the
last 2
4 m
on
ths o
r on
ou
tsta
nd
ing
leve
l0
Pic
kin
g e
rror ra
te:
- failu
res c
au
se
d in
the
pic
kin
g a
rea
are
me
asu
red
Pic
kin
g e
rror ra
te:
- sta
ble
ach
ieve
me
nt o
r po
sitiv
e tre
nd
of
failu
re fo
r mo
re th
an
6 m
on
ths
Pic
kin
g e
rror ra
te:
- sta
ble
ach
ieve
me
nt o
r po
sitiv
e tre
nd
of
failu
re fo
r mo
re th
an
1 y
ea
r
Pic
kin
g e
rror ra
te:
- sta
ble
ach
ieve
me
nt o
r po
sitiv
e tre
nd
of
failu
re fo
r mo
re th
an
2 y
ea
rs
0
0.0
0
3.4
To
pic
s
Wa
reh
ou
se
An
aly
sis
1.0
EXECUTION CONCEPT
Co
mm
en
tsP
oin
ts
Picking
Ave
rag
e
Ave
rag
e
Le
ve
l
IST
-AU
FN
AH
ME
Them
en
feld
er u
nd
Ge
wic
htu
ng
1 K
ontin
uie
rliche V
erb
esseru
ng
3 L
agerp
rozesse
2 Ü
berg
reife
nde T
hem
en
We
rtstro
mana
lyse
Mo
de
rato
r1, M
od
era
tor2
1M
M/D
D/Y
YY
Y
FigureC.11:3.4
Picking
152

Co
nfid
en
tia
lN
am
e o
f W
are
ho
use
Wa
reh
ou
se
An
aly
sis
1.0
No
.0
12
34
Sta
nd
ard
sS
tan
da
rds
Sta
nd
ard
sS
tan
da
rds
Sta
nd
ard
s
Sto
rag
e t
ech
nic
/la
yo
ut:
- sa
fety
-re
late
d a
nd
ju
dic
ial g
uid
elin
es a
re
co
nsid
ere
d
Sto
rag
e t
ech
nic
/la
yo
ut:
- a
s le
ve
l 0
- sto
rag
e t
ech
niq
ue
de
pe
nd
s o
n g
oo
ds
(siz
e,
we
igh
t, p
acka
gin
g,
sta
bili
ty,
am
ou
nt,
…)
Sto
rag
e t
ech
nic
/la
yo
ut:
- a
s le
ve
l 1
- sto
rag
e t
ech
niq
ue
de
pe
nd
s o
n e
co
no
mic
facto
rs (
op
tim
al la
nd
an
d r
oo
m u
se
)
Sto
rag
e t
ech
nic
/la
yo
ut:
- a
s le
ve
l 2
- sto
rag
e t
ech
nic
is u
pd
ate
d m
in.
2x/y
ea
r
- a
uto
ma
tiza
tio
n le
ve
l fits
to
aim
ed
pro
fita
bili
ty a
nd
fle
xib
ility
(ca
n b
e
arg
um
en
ted
by w
are
ho
use
ma
na
ge
r)
Sto
rag
e t
ech
nic
/la
yo
ut:
- a
s le
ve
l 2
- sto
rag
e t
ech
nic
is u
pd
ate
d m
in.
6x/y
ea
r
- a
s le
ve
l 3
0
Sto
rag
e c
rite
ria
:
- fo
r sto
rag
e s
afe
ty-r
ela
ted
an
d ju
dic
ial
gu
ide
line
s a
re c
on
sid
ere
d (
esp
ecia
lly in
ca
se
of
ha
za
rdo
us m
ate
ria
ls)
Sto
rag
e c
rite
ria
:
- a
s le
ve
l 0
- te
ch
nic
al re
qu
ire
me
nts
are
co
nsid
ere
d
(op
tim
al vo
lum
e u
se
, e
qu
al lo
ad
, …
)
Sto
rag
e c
rite
ria
:
- a
s le
ve
l 1
- e
co
no
mic
fa
cts
are
co
nsid
ere
d (
inve
nto
ry
turn
ove
r, a
va
ilab
ility
, o
ptim
al d
ista
nce
s .
..)
Sto
rag
e c
rite
ria
:
- te
ch
nic
al a
nd
eco
no
mic
fa
cts
are
up
da
ted
min
. 2
x/y
ea
r
Sto
rag
e c
rite
ria
:
- te
ch
nic
al a
nd
eco
no
mic
fa
cts
are
up
tad
et
min
. 6
x/y
ea
r0
Inve
nto
ry m
an
ag
em
en
t:
- cle
ar
an
d s
yste
ma
tic a
dm
inis
tra
tio
n o
f a
ll
inve
nto
rie
s in
th
e w
are
ho
use
syste
m
Inve
nto
ry m
an
ag
em
en
t:
- a
s le
ve
l 1
- lit
tle
/no
tim
e w
ind
ow
be
twe
en
mo
vin
g
go
od
s a
nd
bo
okin
g p
roce
ss
Inve
nto
ry m
an
ag
em
en
t:
- a
s le
ve
l 2
- p
erm
an
en
t in
ve
nto
ry t
akin
g b
y h
igh
ly
de
ve
lop
ed
ED
V s
yste
ms
Inve
nto
ry m
an
ag
em
en
t:
- a
s s
tora
ge
pro
ce
ss d
oe
sn
't a
llow
an
y
inve
nto
ry d
evia
tio
ns
0
Vis
ua
liza
tio
n:
- b
in lo
ca
tio
ns a
re c
lea
rly v
isu
aliz
ed
(e
.g.
nu
mb
er,
sca
n c
od
e)
Vis
ua
liza
tio
n:
- a
s le
ve
l 1
- m
in/m
ax in
ve
nto
rie
s a
re v
isu
aliz
ed
(if
exis
tin
g)
Vis
ua
liza
tio
n:
- a
s le
ve
l 2
- in
ve
nto
rie
s a
nd
pe
rfo
rma
nce
of
the
wa
reh
ou
se
are
vis
ible
fo
r e
ve
ryo
ne
(e
. g
.
scre
en
with
cu
rre
nt
KP
Is)
Vis
ua
liza
tio
n:
- a
s le
ve
l 3
0 0 0
Fro
m-b
in t
ran
sfe
r:
Fro
m-b
in t
ran
sfe
r:
- T
ran
sfe
r to
co
nsig
nm
en
t a
rea
is
co
nsu
mp
tio
n d
rive
n (
Pu
ll)
Fro
m-b
in t
ran
sfe
r:
- a
s le
ve
l 2
Fro
m-b
in t
ran
sfe
r:
- a
s le
ve
l 3
0
0.0
0
KP
IK
PI
KP
IK
PI
KP
I
Le
ad
tim
e o
f th
e s
tora
ge
pro
ce
ss:
- le
ad
tim
e o
f th
e s
tora
ge
pro
ce
ss is
me
asu
red
Le
ad
tim
e o
f th
e s
tora
ge
pro
ce
ss:
- p
ositiv
e t
ren
d o
r a
t sta
ble
ta
rge
t le
ve
l o
f
ave
rag
e le
ad
tim
e o
f a
ll p
acka
gin
g u
nits
sin
ce
min
. 6
mo
nth
s
Le
ad
tim
e o
f th
e s
tora
ge
pro
ce
ss:
- p
ositiv
e t
ren
d o
f a
ve
rag
e le
ad
tim
e s
ince
the
la
st
12
mo
nth
s o
r sta
ble
Le
ad
tim
e o
f th
e s
tora
ge
pro
ce
ss:
- p
ositiv
e t
ren
d o
f a
ve
rag
e le
ad
tim
e s
ince
the
la
st
24
mo
nth
s o
r o
n o
uts
tan
din
g le
ve
l0
Sto
rag
e e
rro
r ra
te:
- fa
ilure
s c
au
se
d in
th
e a
rea
of
sto
rag
e a
re
me
asu
red
Sto
rag
e e
rro
r ra
te:
- sta
ble
ach
ieve
me
nt
or
po
sitiv
e t
ren
d o
f
failu
re f
or
mo
re t
ha
n 6
mo
nth
s
Sto
rag
e e
rro
r ra
te:
- sta
ble
ach
ieve
me
nt
or
po
sitiv
e t
ren
d o
f
failu
re f
or
mo
re t
ha
n 1
ye
ar
Sto
rag
e e
rro
r ra
te:
- sta
ble
ach
ieve
me
nt
or
po
sitiv
e t
ren
d o
f
failu
re f
or
mo
re t
ha
n 2
ye
ars
0
0.0
0
Ave
rag
e
Ave
rag
e
Co
mm
en
tsL
eve
lP
oin
ts
In c
ase
sto
rag
e is s
ep
era
ted
fro
m c
on
sig
nm
en
t a
rea
Storage
3.5
To
pic
s
Wa
reh
ou
se
An
aly
sis
1.0
EXECUTIONCONCEPT
IST
-AU
FN
AH
ME
Them
en
feld
er
und
Ge
wic
htu
ng
1 K
ontinu
ierlic
he V
erb
esseru
ng
3 L
agerp
rozesse
2 Ü
berg
reifende T
hem
en
We
rtstr
om
ana
lyse
Mo
de
rato
r1,
Mo
de
rato
r21
MM
/DD
/YY
YY
Figu
reC.12:
3.5Storage
153

C Appendix - Assessment Questionaire Co
nfid
en
tial
Na
me
of W
are
ho
use
Wa
reh
ou
se
An
aly
sis
1.0
No
.0
12
34
Sta
nd
ard
sS
tan
da
rds
Sta
nd
ard
sS
tan
da
rds
Sta
nd
ard
s
Org
an
iza
tion
Tim
e w
ind
ow
s c
an
he
lp le
ve
l the
wo
rklo
ad
for
de
fine
d re
ce
ivin
g tim
es. If th
ese
time
win
do
ws a
re
als
o a
va
ilab
le fo
r the
up
stre
am
pro
ce
sse
s, th
e
ma
turity
is h
igh
er. (D
eh
da
ri et a
l, 20
12
)
ba
do
kg
oo
dve
ry g
oo
d0
En
try / b
oo
kin
g:
- two
-leve
l En
try:
the
po
stin
g o
f the
go
od
s
to th
e in
ve
nto
ry a
nd
the
en
try o
f the
inco
min
g
go
od
s a
re d
on
e
se
pe
rate
ly
En
try / b
oo
kin
g:
- as le
ve
l 1
- en
try in
the
syste
m is
do
ne
no
t mo
re th
an
on
e
da
y a
fter g
oo
ds a
re
rece
ive
d
En
try / b
oo
kin
g:
- sin
gle
-leve
l En
try:
the
po
stin
g o
f the
go
od
s
to th
e in
ve
nto
ry is
do
ne
tog
eth
er w
ith th
e e
ntry
of
the
inco
min
g g
oo
ds (a
t
lea
st in
terim
bo
okin
g o
f
Avis
-Info
rma
tion
to
sto
rag
e s
yste
m =
Ein
bu
ch
un
g u
nte
r
Vo
rbe
ha
lt)
- en
try in
the
syste
m is
En
try / b
oo
kin
g:
- as le
ve
l 3
- en
try in
the
syste
m is
do
ne
ne
arly
at th
e s
am
e
time
as g
oo
ds a
re
rece
ive
d (n
ot m
ore
tha
n 2
ho
urs
late
r)
0
Insp
ectio
n:
- insp
ectio
n in
ten
sity
de
pe
nd
s o
n fa
ilure
rate
of
su
pp
lier o
r co
mp
ara
ble
crite
ria
Insp
ectio
n:
- su
pp
lier d
eliv
er a
lrea
dy
filled
ou
t an
d s
ign
ed
co
ntro
l do
cu
me
nts
with
the
ir go
od
s
Insp
ectio
n:
- free
ticke
t (Fre
ipa
ss) fo
r
au
dite
d s
up
plie
rs (e
. g.
skip
-qu
ota
afte
r a d
efin
ed
sch
em
e)
Insp
ectio
n:
- as le
ve
l 3
0
Vis
ua
liza
tion
Vis
ua
l co
ntro
ls c
an
he
lp g
ua
ran
tee
the
time
win
do
ws. V
isu
al c
on
trol m
ech
an
ism
s e
nh
an
ce
pro
ce
ss in
teg
rity a
nd
red
uce
wa
ste
by e
limin
atin
g
se
arc
hin
g a
nd
sta
biliz
ing
pro
ce
sse
s. (S
ob
an
ski,
20
08
, p.2
15
) (Fu
rma
ns, 2
01
2, p
.49
)
ba
do
kg
oo
dve
ry g
oo
d00
0.0
0
CONCEPT
Ave
rag
e
Incoming Goods
3.6
Co
mm
en
ts
To
pic
s
Wa
reh
ou
se
An
aly
sis
1.0
Le
ve
lP
oin
ts
IST
-AU
FN
AH
ME
Them
en
feld
er u
nd
Ge
wic
htu
ng
1 K
ontin
uie
rliche V
erb
esseru
ng
3 L
agerp
rozesse
2 Ü
berg
reife
nde T
hem
en
We
rtstro
mana
lyse
Mo
de
rato
r1, M
od
era
tor2
1M
M/D
D/Y
YY
Y
FigureC.13:3.6
Incoming
Goods
Concept
(Dehdari
andSchw
ab,2012;
Furmans
andW
lcek,2012)
154

Co
nfid
en
tia
lN
am
e o
f W
are
ho
use
Wa
reh
ou
se
An
aly
sis
1.0
KP
IK
PI
KP
IK
PI
KP
I
Tim
e w
ind
ow
ad
he
ren
ce
Tra
ckin
g th
e tim
e w
ind
ow
ad
he
ren
ce
in
form
atio
n
illu
str
ate
s th
e p
erf
orm
an
ce
ve
rsu
s th
e e
xp
ecta
tio
ns.
(So
ba
nski, 2
00
8, p
. 2
12
)
ba
do
kg
oo
dve
ry g
oo
d0
Ba
lan
cin
g o
f co
mp
lete
in
co
min
g p
roce
sse
s
To
ba
lan
ce
th
e w
ork
loa
d, it is im
po
rta
nt to
kn
ow
th
e
wo
rklo
ad
an
d a
va
ilab
le m
an
ho
urs
. A
n im
pro
ve
me
nt
of
the
ba
lan
ce
is d
esire
d. (F
urm
an
s, 2
01
2, p
. 8
2)
ba
do
kg
oo
dve
ry g
oo
d0
3.6
Le
ad
tim
e o
f th
e in
co
min
g p
roce
ss
Th
e le
ad
tim
e o
f th
e in
co
min
g a
nd
in
co
min
g h
an
dlin
g
sh
ou
ld b
e m
ea
su
red
. If
it is
sta
bile
re
du
ce
d f
or
a
ce
rta
in tim
e th
an
th
is is a
go
od
in
dic
atio
n. (F
urm
an
s,
20
12
, p
. 7
9)
ba
do
kg
oo
dve
ry g
oo
d0
Re
ce
ivin
g e
rro
r ra
te:
- fa
ilure
s c
au
se
d in
th
e
are
a o
f in
co
min
g g
oo
ds
are
me
asu
red
Re
ce
ivin
g e
rro
r ra
te:
- sta
ble
ach
ieve
me
nt
or
po
sitiv
e t
ren
d o
f fa
ilure
for
mo
re t
ha
n 6
mo
nth
s
Re
ce
ivin
g e
rro
r ra
te:
- sta
ble
ach
ieve
me
nt
or
po
sitiv
e t
ren
d o
f fa
ilure
for
mo
re t
ha
n 1
ye
ar
Re
ce
ivin
g e
rro
r ra
te:
- sta
ble
ach
ieve
me
nt
or
po
sitiv
e t
ren
d o
f fa
ilure
for
mo
re t
ha
n 2
ye
ars
0
Ha
nd
ling
ste
ps
- h
an
dlin
g s
tep
s a
re
co
un
ted
Ha
nd
ling
ste
ps:
- re
du
ctio
n o
f h
an
dlin
g
ste
ps in
th
e la
st
6
mo
nth
s b
y o
ptim
izin
g
me
asu
res
(if
ne
ce
ssa
ry m
inim
um
is
rea
ch
ed
, sta
ble
ach
ieve
me
nt
co
un
ts a
s
red
uctio
n)
Ha
nd
ling
ste
ps:
- re
du
ctio
n o
f h
an
dlin
g
ste
ps in
th
e la
st
3 m
on
ths
by o
ptim
izin
g m
ea
su
res
(if
ne
ce
ssa
ry m
inim
um
is
rea
ch
ed
, sta
ble
ach
ieve
me
nt
co
un
ts a
s
red
uctio
n)
Ha
nd
ling
ste
ps:
- re
du
ctio
n o
f h
an
dlin
g
ste
ps in
th
e la
st
mo
nth
by
op
tim
izin
g m
ea
su
res
(if
ne
ce
ssa
ry m
inim
um
is
rea
ch
ed
, sta
ble
ach
ieve
me
nt
co
un
ts a
s
red
uctio
n)
0
0.0
0
EXECUTION
Ave
rag
e
Incoming Goods
IST
-AU
FN
AH
ME
Them
en
feld
er
und
Ge
wic
htu
ng
1 K
ontinu
ierlic
he V
erb
esseru
ng
3 L
agerp
rozesse
2 Ü
berg
reifende T
hem
en
We
rtstr
om
ana
lyse
Mo
de
rato
r1,
Mo
de
rato
r21
MM
/DD
/YY
YY
Figu
reC.14:
3.6IncomingGoo
dsEx
cecu
tion(Furman
san
dW
lcek,2
012;
Soba
nski,2
009)
155

C Appendix - Assessment Questionaire
156

D Appendix - WarehouseExcellence GroupAssessment Results
157

D Appendix - Warehouse Excellence Group Assessment Results
2010C
riteriaM
inM
axA
verageW
1W
2W
3W
4W
5W
6W
7W
8W
9W
10W
11W
12W
13W
14W
15W
161.1 System
-CIP C
onceptB
usiness Requirem
ents0
40.750
02
00
04
00
20
20
20
00
Value S
tream P
lanning0
10.375
01
10
01
10
00
11
00
00
Identification of Improvem
ent Activities
01
0.1250
10
00
10
00
00
00
00
0D
efinition of Target Conditions
02
0.1250
20
00
00
00
00
00
00
0S
ystem-C
IP P
rojects0
10.188
01
00
01
00
01
00
00
00
Point-C
IP A
reas0
41.125
04
12
01
10
11
10
11
40
1.1 System-C
IP ExecutionTarget D
erivation0
10.688
01
11
01
11
11
10
10
10
System
-CIP
Cycles
01
0.2500
10
00
10
01
01
00
00
0Im
provement Focus
02
0.9380
02
11
11
11
12
01
20
1Leadership Involvem
ent0
20.313
01
00
02
00
00
20
00
00
VS
M-Q
uality0
40.750
01
40
04
10
00
11
00
00
Target Achievem
ent0
20.125
00
00
00
00
00
00
20
00
1.2 Point-CIP C
onceptTarget C
ondition0
20.438
02
10
01
10
01
10
00
00
Quick R
eaction System
04
0.4380
00
00
20
01
04
00
00
0R
egular Com
munication
03
1.3751
21
11
21
02
12
01
33
1S
ustainable Problem
Solving
02
0.4380
00
00
20
00
02
01
02
0P
rocess Confirm
ation0
20.313
00
00
01
00
10
00
01
20
1.2 Point-CIP Execution
KP
I-Effect
03
0.1880
00
00
00
00
03
00
00
0Q
uality of Problem
Solving
02
0.2500
00
00
20
00
02
00
00
0Sum
of Reached M
aturity Level1
1911
52
277
210
625
29
712
2Sum
of Average
9.188Standard D
eviation8.109
Coefficient of Variation
88.266
TableD.1:B
LWA
resultsper
warehouse:
Warehouse
Excellencegroup
2010
158

2011
Crit
eria
Min
Max
Aver
age
W1
W2
W3
W4
W5
W6
W7
W8
W9
W10
W11
W12
W13
W14
W15
W16
1.1
Syst
em-C
IP C
once
ptB
usin
ess
Req
uire
men
ts1
42.
000
14
21
24
11
41
11
42
21
Val
ue S
tream
Pla
nnin
g0
41.
875
12
22
34
11
32
31
10
31
Iden
tific
atio
n of
Impr
ovem
ent A
ctiv
ities
04
1.37
52
21
14
20
04
01
00
14
0D
efin
ition
of T
arge
t Con
ditio
ns0
31.
438
13
12
12
22
12
11
10
21
Sys
tem
-CIP
Pro
ject
s0
21.
375
12
10
12
21
12
21
20
22
Poi
nt-C
IP A
reas
14
2.12
52
42
22
32
12
21
12
24
21.
1 Sy
stem
-CIP
Exe
cutio
nTa
rget
Der
ivat
ion
14
1.37
51
41
11
11
14
11
11
11
1S
yste
m-C
IP C
ycle
s0
21.
000
12
11
11
11
11
10
10
12
Impr
ovem
ent F
ocus
14
2.56
32
22
43
41
12
42
24
24
2Le
ader
ship
Invo
lvem
ent
04
2.18
81
20
04
42
24
24
02
04
4V
SM
-Qua
lity
14
1.93
81
14
11
41
14
11
11
14
4Ta
rget
Ach
ieve
men
t0
31.
688
11
03
21
21
32
13
30
22
1.2
Poin
t-CIP
Con
cept
Targ
et C
ondi
tion
12
1.43
81
21
11
12
21
21
12
12
2Q
uick
Rea
ctio
n S
yste
m0
43.
250
42
14
44
14
40
44
44
44
Reg
ular
Com
mun
icat
ion
14
2.81
34
21
43
23
23
42
32
33
4S
usta
inab
le P
robl
em S
olvi
ng0
31.
313
02
03
33
10
00
22
10
22
Pro
cess
Con
firm
atio
n0
21.
063
11
21
02
01
11
11
01
22
1.2
Poin
t-CIP
Exe
cutio
nK
PI-E
ffect
03
1.56
30
10
22
13
13
21
31
02
3Q
ualit
y of
Pro
blem
Sol
ving
02
0.43
80
10
20
20
00
00
11
00
0Su
m o
f Rea
ched
Mat
urity
Lev
el25
4022
3538
4726
2345
2930
2733
1848
39Su
m o
f Ave
rage
32.8
13St
anda
rd D
evia
tion
9.30
4C
oeffi
cien
t of V
aria
tion
28.3
55
TableD.2:B
LWA
results
perwareh
ouse:Wareh
ouse
Excelle
ncegrou
p2011
159

D Appendix - Warehouse Excellence Group Assessment Results
160
E Appendix - WarehouseExcellence Group KPR
161
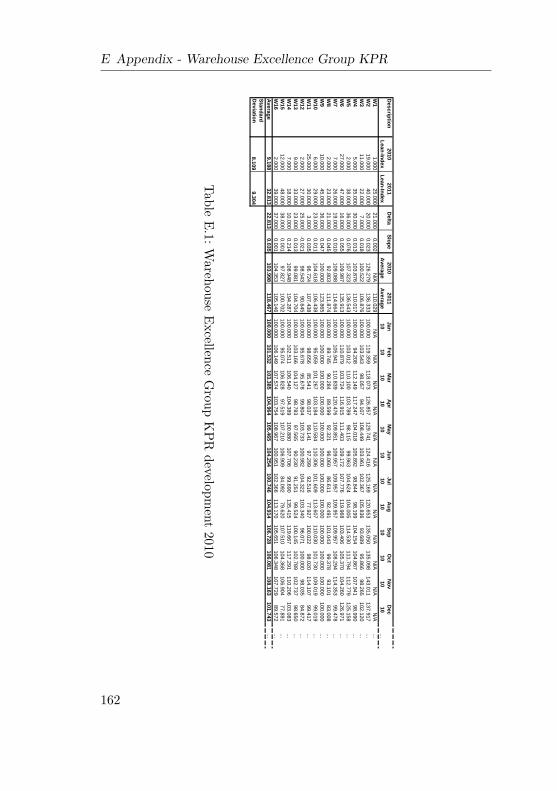
E Appendix - Warehouse Excellence Group KPR
Description
2010Lean-Index
2011 Lean-Index
Delta
Slope2010
Average2011
AverageJan10
Feb10
Mar
10Apr10
May
10Jun10
Jul10
Aug10
Sep10
Oct
10N
ov10
Dec
10…
W1
1.00025.000
21.0000.002
N/A
110.029N
/AN
/AN
/AN
/AN
/AN
/AN
/AN
/AN
/AN
/AN
/AN
/A…
W2
19.00040.000
20.0000.023
126.279136.333
100.000119.359
118.073126.857
129.741124.416
125.169120.653
135.050135.098
143.011137.917
…W
311.000
22.0007.000
0.018100.522
106.876100.000
103.54398.057
94.107108.449
103.961102.367
105.83693.689
95.86698.265
102.120…
W4
5.00035.000
30.0000.013
103.876110.017
100.00094.208
112.149117.247
104.018105.892
98.84498.199
104.154104.867
107.94198.990
…W
52.000
38.00036.000
0.076107.323
136.543100.000
103.012110.100
103.78998.115
99.963104.624
104.005114.530
111.794112.779
125.158…
W6
27.00047.000
16.0000.055
109.987135.913
100.000110.879
103.724116.915
111.403109.172
107.776119.968
103.406105.370
104.260126.971
…W
77.000
26.00019.000
0.010109.088
114.664100.000
105.941110.839
120.476109.851
109.957109.957
109.957109.957
108.294114.353
99.478…
W8
2.00023.000
21.0000.045
92.803111.874
100.00089.745
90.28489.599
92.32196.060
86.61192.491
101.04399.378
93.10183.008
…W
910.000
45.00036.000
0.047100.000
123.865100.000
100.000100.000
100.000100.000
100.000100.000
100.000100.000
100.000100.000
100.000…
W10
6.00029.000
23.0000.011
104.618106.438
100.00095.059
101.267103.184
110.584110.306
101.609113.607
110.030101.730
109.01999.019
…W
1125.000
30.0003.000
0.03596.724
107.438100.000
98.65685.541
98.03799.141
97.29992.516
77.927100.022
98.020114.107
99.417…
W12
2.00027.000
25.000-0.021
98.54390.645
100.00095.678
95.67899.804
103.733100.982
104.322103.340
96.071100.000
98.03584.872
…W
139.000
33.00023.000
0.01399.081
104.704100.000
103.166104.127
98.78397.565
90.23091.251
99.524100.145
102.789102.737
98.650…
W14
7.00018.000
10.0000.214
108.948194.287
100.000102.511
106.540104.389
100.880107.706
99.690135.415
119.667117.291
110.206103.083
…W
1512.000
48.00038.000
0.00197.827
100.702100.000
95.074106.828
97.519107.210
106.90984.092
79.620107.510
104.368106.904
77.891…
W16
2.00039.000
37.0000.001
104.353105.146
100.000106.149
107.574103.754
108.967100.951
102.366113.170
105.651106.348
107.72989.572
…Average
9.18832.813
22.8130.035
103.998118.467
100.000101.532
103.385104.964
105.465104.254
100.746104.914
106.728106.081
108.163101.743
…StandardD
eviation8.109
9.304
TableE.1:W
arehouseExcellence
Group
KPR
development
2010
162
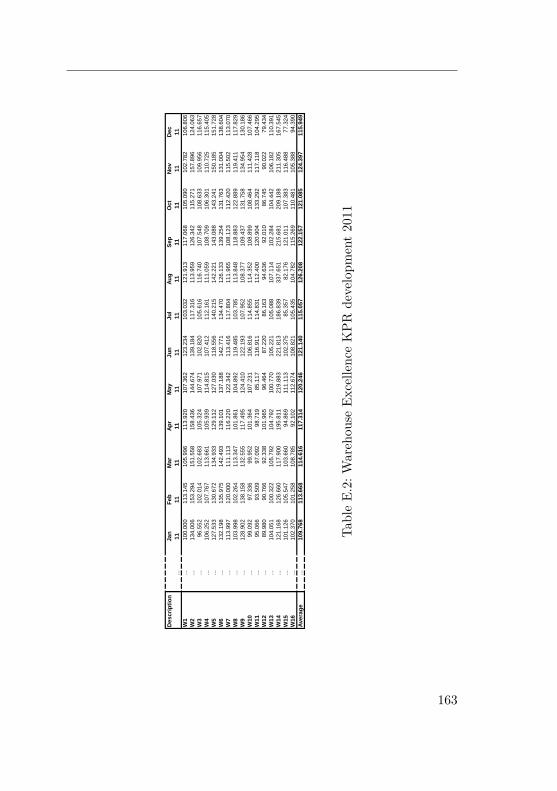
Des
crip
tion
…Ja
n11
Feb
11M
ar 11Ap
r11
May 11
Jun
11Ju
l11
Aug
11Se
p11
Oct 11
Nov 11
Dec 11
W1
…10
0.00
011
3.14
510
5.99
611
3.92
010
7.36
212
3.23
410
3.03
212
1.91
311
7.06
810
5.09
010
2.78
210
6.80
6W
2…
134.
006
153.
294
151.
558
158.
436
144.
674
139.
184
117.
316
113.
959
126.
342
115.
271
157.
896
124.
063
W3
…96
.552
102.
014
102.
683
105.
324
107.
971
102.
820
105.
616
116.
740
107.
548
108.
633
109.
956
116.
657
W4
…10
6.25
210
7.76
711
3.66
110
5.93
911
4.81
510
7.41
211
2.16
111
1.05
910
8.70
910
6.30
111
0.72
511
5.40
5W
5…
127.
533
130.
672
134.
933
129.
112
127.
030
118.
556
140.
215
142.
221
143.
088
143.
241
150.
185
151.
728
W6
…13
2.19
813
5.97
514
2.49
313
9.10
113
7.18
814
2.77
113
4.47
012
6.13
313
9.25
413
1.76
313
1.00
413
8.60
4W
7…
113.
997
120.
000
111.
113
116.
220
122.
342
113.
416
117.
804
111.
965
108.
123
112.
420
115.
502
113.
070
W8
…10
3.99
810
2.26
411
3.34
710
1.86
110
4.89
211
9.48
510
3.78
511
3.84
811
8.88
312
2.88
911
9.41
111
7.82
9W
9…
128.
902
138.
158
132.
555
117.
495
124.
410
122.
193
107.
952
108.
377
109.
437
131.
758
134.
954
130.
186
W10
…99
.092
97.3
3699
.952
101.
364
107.
231
106.
816
114.
855
114.
352
108.
899
108.
464
111.
428
107.
466
W11
…95
.066
93.5
0997
.092
98.7
1985
.117
116.
911
114.
831
112.
400
120.
904
133.
292
117.
118
104.
295
W12
…89
.980
90.7
6692
.338
101.
965
96.4
6487
.220
86.1
6394
.636
92.0
1086
.745
90.0
2279
.434
W13
…10
4.05
110
0.32
210
5.79
210
4.79
210
0.77
010
5.22
110
5.08
810
7.11
410
2.28
410
4.44
210
6.18
211
0.39
1W
14…
121.
168
126.
660
117.
900
195.
811
219.
883
221.
813
186.
839
337.
651
215.
681
209.
188
211.
305
167.
545
W15
…10
1.12
610
5.54
710
3.66
094
.869
111.
113
102.
375
85.3
5782
.176
121.
011
107.
383
116.
488
77.3
24W
16…
102.
370
101.
258
108.
785
92.1
0211
2.67
410
8.82
110
5.43
510
4.78
211
5.26
911
0.48
110
5.38
894
.390
Aver
age
…10
9.76
811
3.66
811
4.61
611
7.31
412
0.24
612
1.14
011
5.05
712
6.20
812
2.15
712
1.08
512
4.39
711
5.94
9
TableE.2:
Wareh
ouse
Excelle
nceKPR
developm
ent2011
163

E Appendix - Warehouse Excellence Group KPR
164

F Appendix - Control GroupAssessment Results
165

F Appendix - Control Group Assessment Results
2010C
riteriaM
inM
axA
verageC
1C
2C
3C
4C
5C
6C
7C
8C
9C
10C
11C
12C
13C
14C
15C
16C
17C
18C
19C
20C
21C
22C
23C
24C
25C
26C
27C
28…
1.1 System-C
IP Concept
Business Requirem
ents0
20.286
00
01
10
12
00
00
00
00
00
00
00
00
00
21
…Value Stream
Planning0
10.036
10
00
00
00
00
00
00
00
00
00
00
00
00
00
Identification of Improvem
ent Activities0
00.000
00
00
00
00
00
00
00
00
00
00
00
00
00
00
…D
efinition of Target Conditions
02
0.2500
00
20
21
00
00
00
00
00
00
00
00
00
01
1…
System-C
IP Projects0
00.000
00
00
00
00
00
00
00
00
00
00
00
00
00
00
…Point-C
IP Areas0
30.429
31
01
12
30
00
00
00
00
00
00
00
00
00
10
…1.1 System
-CIP Execution
Target Derivation
04
0.4640
01
11
40
40
00
00
00
00
00
00
00
00
01
1…
System-C
IP Cycles
00
0.0000
00
00
00
00
00
00
00
00
00
00
00
00
00
0…
Improvem
ent Focus0
40.714
20
34
41
01
00
00
00
00
00
00
00
00
00
23
…Leadership Involvem
ent0
00.000
00
00
00
00
00
00
00
00
00
00
00
00
00
00
…VSM
-Quality
00
0.0000
00
00
00
00
00
00
00
00
00
00
00
00
00
0…
Target Achievement
00
0.0000
00
00
00
00
00
00
00
00
00
00
00
00
00
0…
1.2 Point-CIP C
onceptTarget C
ondition0
20.357
20
02
20
10
00
00
00
00
00
00
00
00
00
21
…Q
uick Reaction System
02
0.2502
00
22
01
00
00
00
00
00
00
00
00
00
00
0…
Regular C
omm
unication0
40.750
33
01
24
00
00
04
00
00
00
00
00
00
00
13
…Sustainable Problem
Solving0
40.750
33
00
00
40
00
04
00
00
00
00
00
00
00
43
…Process C
onfirmation
02
0.1792
10
00
01
00
00
00
00
00
00
00
00
00
01
0…
1.2 Point-CIP Execution
KPI-Effect0
20.250
00
22
20
10
00
00
00
00
00
00
00
00
00
00
…Q
uality of Problem Solving
04
0.7502
21
33
31
00
00
00
00
00
00
00
00
00
02
4…
Sum of R
eached Maturity Level
2010
719
1816
147
00
08
00
00
00
00
00
00
00
1717
...Sum
of Average C
1-C56
5.464Standard D
eviation of Sum C
1-C56
7.488C
oefficient of Variation C1-C
56137.028
TableF.1:A
ssessment
resultsper
warehouse:
controlgroup2010
C1-C
28
166

2010
Crit
eria
…C
29C
30C
31C
32C
33C
34C
35C
36C
37C
38C
39C
40C
41C
42C
43C
44C
45C
46C
47C
48C
49C
50C
51C
52C
53C
54C
55C
561.
1 Sy
stem
-CIP
Con
cept
Busi
ness
Req
uire
men
ts…
02
20
10
02
21
20
02
22
10
22
00
00
20
20
Valu
e St
ream
Pla
nnin
g…
00
00
20
00
01
10
00
00
00
10
00
00
00
10
Iden
tific
atio
n of
Impr
ovem
ent A
ctiv
ities
…0
00
00
00
00
00
00
00
00
04
00
00
00
00
0D
efin
ition
of T
arge
t Con
ditio
ns…
20
02
00
04
00
00
10
02
11
04
00
10
00
00
Syst
em-C
IP P
roje
cts
…0
00
00
00
00
40
00
00
00
00
00
00
00
00
0Po
int-C
IP A
reas
…0
00
01
00
30
20
21
00
01
11
31
03
00
02
11.
1 Sy
stem
-CIP
Exe
cutio
nTa
rget
Der
ivat
ion
…0
10
00
00
10
00
01
00
10
00
41
01
00
00
0Sy
stem
-CIP
Cyc
les
…0
00
01
00
00
10
00
00
00
00
00
00
00
00
0Im
prov
emen
t Foc
us…
02
04
44
02
42
41
04
42
23
12
20
00
00
01
Lead
ersh
ip In
volv
emen
t…
00
00
00
00
00
00
00
00
00
10
00
00
00
10
VSM
-Qua
lity
…0
00
00
00
00
00
00
00
00
00
00
00
00
01
0Ta
rget
Ach
ieve
men
t…
00
00
10
00
01
00
00
00
00
00
00
00
00
00
1.2
Poin
t-CIP
Con
cept
Targ
et C
ondi
tion
…1
20
10
11
21
21
22
11
11
10
02
00
02
00
0Q
uick
Rea
ctio
n Sy
stem
…0
00
00
20
22
02
02
22
00
02
40
04
00
00
0R
egul
ar C
omm
unic
atio
n…
24
00
30
20
43
11
11
11
00
00
40
10
00
21
Sust
aina
ble
Prob
lem
Sol
ving
…4
30
01
00
20
00
14
00
03
00
40
04
03
04
3Pr
oces
s C
onfir
mat
ion
…1
00
02
00
00
20
02
00
10
22
00
00
00
00
01.
2 Po
int-C
IP E
xecu
tion
KPI-E
ffect
…0
00
04
00
00
20
00
00
01
11
11
00
00
00
0Q
ualit
y of
Pro
blem
Sol
ving
…4
40
10
14
11
21
03
11
12
01
41
02
03
04
1Su
m o
f Rea
ched
Mat
urity
Lev
el…
1418
28
208
719
1423
127
1711
1111
129
1628
120
160
100
177
TableF.2:
Assessm
entresults
perwareh
ouse:controlg
roup
2010
C29-C
56
167

F Appendix - Control Group Assessment Results
2011C
riteriaM
inM
axA
verageC
1C
2C
3C
4C
5C
6C
7C
8C
9C
10C
11C
12C
13C
14C
15C
16C
17C
18C
19C
20C
21C
22C
23C
24C
25C
26C
27C
28…
1.1 System-C
IP Concept
Business Requirem
ents0
30.821
10
21
32
12
00
00
00
00
00
00
00
00
00
11
…Value Stream
Planning0
40.482
10
03
40
00
00
00
00
00
00
00
00
00
00
00
Identification of Improvem
ent Activities0
40.339
10
04
40
00
00
00
00
00
00
00
00
00
00
00
…D
efinition of Target Conditions
04
0.7322
01
44
11
00
10
00
00
00
00
00
00
00
00
0…
System-C
IP Projects0
40.696
00
03
40
00
00
00
00
00
00
00
00
00
00
00
…Point-C
IP Areas0
30.786
30
02
32
30
03
00
00
00
00
00
00
00
00
00
…1.1 System
-CIP Execution
Target Derivation
04
0.3390
00
44
00
00
10
00
00
00
00
00
00
00
01
0…
System-C
IP Cycles
04
0.2860
00
11
00
00
00
00
00
00
00
00
00
00
00
0…
Improvem
ent Focus0
40.893
30
03
11
01
01
00
00
00
00
00
00
00
00
40
…Leadership Involvem
ent0
40.446
00
01
40
00
00
00
00
00
00
00
00
00
00
00
…VSM
-Quality
04
0.3042
00
04
00
00
00
00
00
00
00
00
00
00
00
0…
Target Achievement
02
0.0710
00
11
00
00
00
00
00
00
00
00
00
00
00
0…
1.2 Point-CIP C
onceptTarget C
ondition0
40.839
10
23
41
10
02
00
00
00
00
00
00
00
00
01
…Q
uick Reaction System
04
0.9460
02
44
41
40
40
20
00
00
00
00
00
00
00
0…
Regular C
omm
unication0
41.143
13
04
14
04
01
04
00
00
00
00
00
00
00
00
…Sustainable Problem
Solving0
41.411
20
04
43
44
00
01
00
00
00
00
00
00
00
24
…Process C
onfirmation
02
0.4461
01
11
11
00
10
10
00
00
00
00
00
00
00
0…
1.2 Point-CIP Execution
KPI-effect0
40.661
30
22
12
10
00
00
00
00
00
00
00
00
00
00
…Q
uality of problem solving
04
1.1793
03
44
31
10
10
30
00
00
00
00
00
00
01
0…
Sum of R
eached Maturity Level
243
1349
5624
1416
015
011
00
00
00
00
00
00
00
96
...Sum
of Average C
1-C56
12.821Standard D
eviation of Sum C
1-C56
13.945C
oefficient of Variation C1-C
56108.767
TableF.3:A
ssessment
resultsper
warehouse:
controlgroup2011
C1-C
28
168

2011
Crit
eria
…C
29C
30C
31C
32C
33C
34C
35C
36C
37C
38C
39C
40C
41C
42C
43C
44C
45C
46C
47C
48C
49C
50C
51C
52C
53C
54C
55C
561.
1 Sy
stem
-CIP
Con
cept
Busi
ness
Req
uire
men
ts…
11
00
12
21
21
21
22
21
11
03
10
31
00
01
Valu
e St
ream
Pla
nnin
g…
00
00
21
00
10
11
01
12
00
24
10
10
00
10
Iden
tific
atio
n of
Impr
ovem
ent A
ctiv
ities
…0
00
01
00
00
00
00
00
40
00
21
02
00
00
0D
efin
ition
of T
arge
t Con
ditio
ns…
00
00
01
00
10
21
12
24
11
04
20
00
00
41
Syst
em-C
IP P
roje
cts
…0
00
00
40
04
04
00
44
40
00
30
03
00
02
0Po
int-C
IP A
reas
…0
00
02
00
30
21
13
22
00
01
31
03
00
21
11.
1 Sy
stem
-CIP
Exe
cutio
nTa
rget
Der
ivat
ion
…0
10
01
00
00
00
01
00
11
00
40
00
00
00
0Sy
stem
-CIP
Cyc
les
…0
00
00
10
01
01
00
11
10
00
10
03
00
04
0Im
prov
emen
t Foc
us…
02
11
14
00
42
41
04
41
40
01
10
00
00
10
Lead
ersh
ip In
volv
emen
t…
00
00
40
00
10
40
00
04
00
14
00
10
00
10
VSM
-Qua
lity
…0
00
00
10
01
01
00
11
00
00
40
01
00
01
0Ta
rget
Ach
ieve
men
t…
00
00
00
00
00
00
00
00
00
00
00
00
00
20
1.2
Poin
t-CIP
Con
cept
Targ
et C
ondi
tion
…1
21
01
11
21
21
11
11
12
00
42
02
01
10
2Q
uick
Rea
ctio
n Sy
stem
…0
02
00
20
02
02
00
02
42
00
40
02
00
02
4R
egul
ar C
omm
unic
atio
n…
04
00
01
24
31
22
41
11
00
14
10
30
04
30
Sust
aina
ble
Prob
lem
Sol
ving
…4
30
03
00
40
30
24
00
44
00
44
02
02
13
4Pr
oces
s C
onfir
mat
ion
…0
00
21
00
10
20
12
00
10
00
21
02
00
02
01.
2 Po
int-C
IP E
xecu
tion
KPI-E
ffect
…0
00
44
10
11
21
10
22
00
00
11
02
00
03
0Q
ualit
y of
Pro
blem
Sol
ving
…0
42
21
14
21
01
01
11
01
00
41
42
02
04
3Su
m o
f Rea
ched
Mat
urity
Lev
el…
617
69
2220
918
2315
2712
1922
2433
162
556
174
321
58
3416
TableF.4:
Assessm
entresults
perwareh
ouse:controlg
roup
2011
C1-C28
169

F Appendix - Control Group Assessment Results
170

G Appendix - Control GroupKPR
171
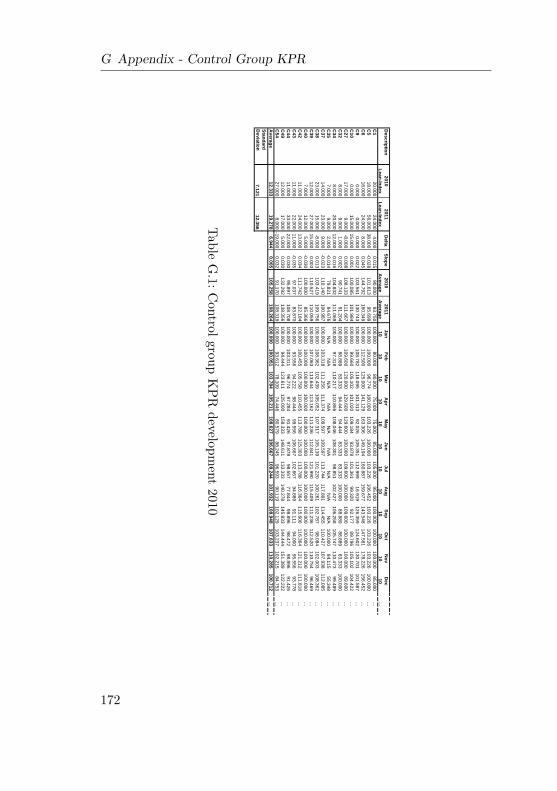
G Appendix - Control Group KPR
Description
2010Lean-Index
2011 Lean-Index
Delta
Slope2010
Average
2011A
verageJan10
Feb10
Mar
10A
pr10
May
10Jun10
Jul10
Aug
10Sep10
Oct
10N
ov10
Dec
10…
C1
20.00024.000
4.0000.015
90.00093.750
100.00080.000
80.00075.000
75.00085.000
105.00095.000
100.000100.000
100.00085.000
…C
518.000
56.00038.000
-0.028101.613
95.699100.000
100.00096.774
100.000103.226
100.000103.226
106.452103.226
103.226103.226
100.000…
C6
16.00024.000
8.0000.045
144.792160.349
100.000112.500
125.000141.129
163.306149.194
160.887159.677
143.548147.581
178.226156.452
…C
90.000
0.0000.000
0.022103.561
130.743100.000
108.782118.095
101.31392.026
109.351112.999
16.919126.359
124.602130.701
101.587…
C10
0.00015.000
15.0000.001
100.085101.984
100.00099.660
105.102101.020
109.18493.878
101.36199.320
92.17789.796
105.102104.422
…C
2717.000
9.000-8.000
0.008108.133
111.667100.000
109.600120.000
129.600129.600
100.000109.600
100.000109.600
100.000100.000
89.600…
C32
8.0009.000
1.0000.002
90.74191.204
100.00088.889
83.33394.444
94.44483.333
83.333100.000
88.88988.889
83.333100.000
…C
348.000
20.00012.000
0.016104.832
111.069100.000
97.318110.217
110.856108.046
108.30198.851
102.427106.258
105.747110.473
99.489…
C35
7.0009.000
2.000-0.014
79.82184.676
N/A
N/A
N/A
N/A
N/A
N/A
N/A
N/A
N/A
100.00084.115
55.348…
C37
14.00023.000
9.000-0.023
110.140100.987
100.000103.318
111.256111.374
109.597109.597
113.744117.891
114.455110.427
107.938112.085
…C
3823.000
15.000-8.000
0.013103.419
109.756100.000
108.362102.439
105.052107.317
105.139101.220
100.261102.787
98.084102.003
108.362…
C39
12.00027.000
15.0000.003
110.527110.059
100.000107.063
113.644113.162
111.236112.841
121.990115.409
111.236112.520
110.75496.469
…C
407.000
12.0005.000
-0.030100.000
85.366100.000
100.000100.000
100.000100.000
100.000100.000
100.000100.000
100.000100.000
100.000…
C42
11.00024.000
13.0000.034
111.742122.184
100.000100.455
105.758110.455
113.788115.303
113.788116.364
115.606116.364
121.212111.818
…C
4311.000
22.00011.000
-0.03597.037
83.870100.000
93.55694.222
98.44499.556
106.667102.667
94.88991.111
94.00095.556
93.778…
C44
11.00033.000
22.0000.030
95.897108.708
100.000103.311
96.77497.284
91.42697.878
98.55777.844
98.89698.472
98.89691.426
…C
4912.000
17.0005.000
0.030132.292
138.356100.000
94.444123.611
125.000158.333
148.611133.333
140.278145.833
144.444151.389
122.222…
C54
27.0008.000
-19.0000.032
91.170108.319
100.00093.612
78.10974.446
80.57988.245
96.59390.119
102.129103.237
102.21584.753
…A
verage12.333
19.2786.944
0.005105.258
108.264100.000
100.051103.784
105.211108.627
106.667109.244
101.932108.948
107.633110.285
100.712…
Standard D
eviation7.121
12.356TableG.1:C
ontrolgroupKPR
development
2010
172
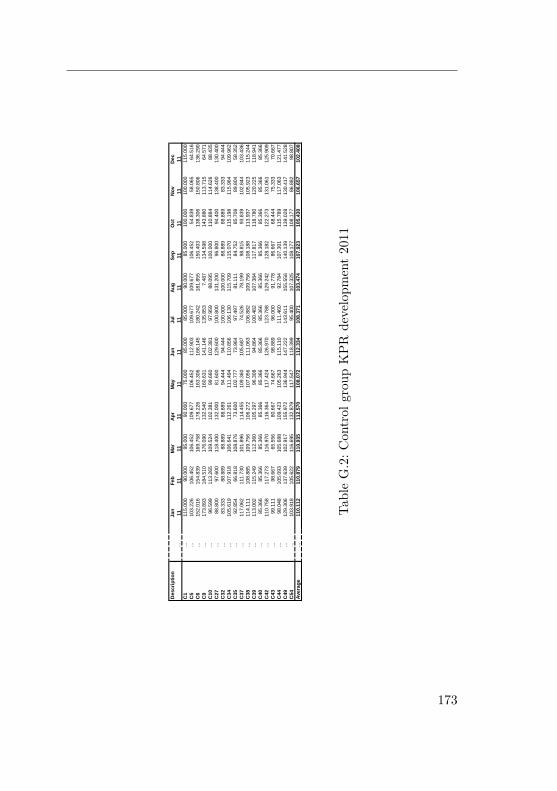
Des
crip
tion
…Ja
n11
Feb
11M
ar 11Ap
r11
May 11
Jun
11Ju
l11
Aug
11Se
p11
Oct 11
Nov 11
Dec 11
C1
…11
5.00
090
.000
95.0
0090
.000
75.0
0085
.000
85.0
0090
.000
85.0
0010
0.00
010
0.00
011
5.00
0C
5…
103.
226
106.
452
106.
452
109.
677
106.
452
112.
903
109.
677
109.
677
106.
452
54.8
3958
.065
64.5
16C
6…
152.
016
154.
839
169.
758
178.
226
163.
306
168.
145
180.
242
181.
855
150.
403
138.
306
150.
806
136.
290
C9
…17
3.89
318
4.51
017
6.09
013
2.54
016
0.63
114
1.14
613
5.85
37.
487
134.
598
143.
880
113.
715
64.5
71C
10…
96.5
9911
3.26
510
9.52
410
2.38
199
.660
102.
381
97.9
5988
.095
100.
000
110.
884
114.
626
88.4
35C
27…
88.8
0097
.600
118.
400
132.
000
81.6
0012
9.60
010
0.80
013
1.20
096
.800
94.4
0013
8.40
013
0.40
0C
32…
83.3
3388
.889
88.8
8988
.889
94.4
4494
.444
100.
000
100.
000
88.8
8988
.889
83.3
3394
.444
C34
…10
5.61
910
7.91
810
6.64
111
2.26
111
1.49
411
0.85
610
6.13
011
5.70
911
5.07
011
5.19
811
5.96
410
9.96
2C
35…
92.8
5466
.818
108.
876
73.6
0010
2.77
773
.964
97.4
9781
.111
84.7
5285
.708
89.8
0458
.352
C37
…11
7.06
211
1.73
010
1.89
611
4.45
510
9.36
010
5.68
774
.526
78.1
9998
.815
93.8
3910
2.84
410
3.43
6C
38…
114.
111
108.
885
109.
756
106.
272
107.
056
111.
063
106.
882
109.
756
108.
188
113.
937
105.
923
115.
244
C39
…11
3.00
211
5.24
911
2.36
010
5.29
796
.308
94.8
6410
0.48
210
7.38
411
7.81
711
8.78
012
0.22
511
8.94
1C
40…
85.3
6685
.366
85.3
6685
.366
85.3
6685
.366
85.3
6685
.366
85.3
6685
.366
85.3
6685
.366
C42
…11
0.75
811
7.27
311
6.97
011
6.36
411
7.42
412
6.97
012
3.78
812
9.24
212
8.18
212
2.27
313
1.06
112
5.90
9C
43…
99.1
1198
.667
65.5
5680
.667
74.6
6798
.889
96.0
0091
.778
86.6
6768
.444
75.3
3370
.667
C44
…98
.048
105.
093
105.
688
109.
423
105.
263
115.
110
111.
460
92.7
8410
7.30
111
5.78
911
7.06
312
1.47
7C
49…
129.
306
137.
639
102.
917
155.
972
136.
944
147.
222
143.
611
155.
556
140.
139
139.
028
130.
417
141.
528
C54
…10
3.91
810
5.62
211
6.69
513
2.87
911
7.54
711
8.39
995
.400
107.
325
108.
177
108.
177
86.8
8298
.807
Aver
age
…11
0.11
211
0.87
911
0.93
511
2.57
010
8.07
211
2.33
410
8.37
110
3.47
410
7.92
310
5.43
010
6.65
710
2.40
8
TableG.2:C
ontrol
grou
pKPR
developm
ent2011
173

G Appendix - Control Group KPR
174
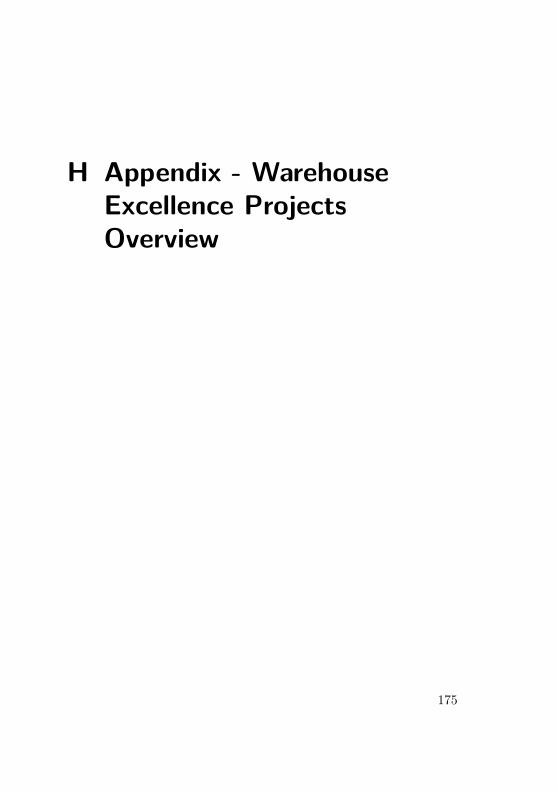
H Appendix - WarehouseExcellence ProjectsOverview
175
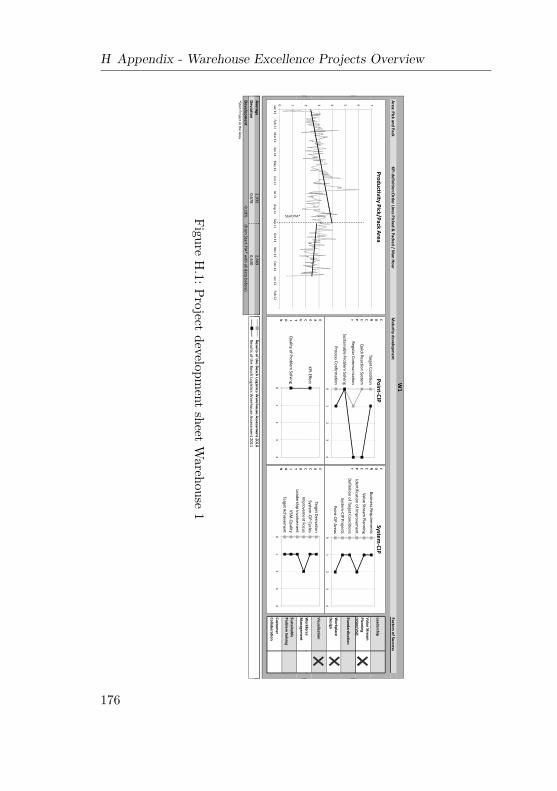
H Appendix - Warehouse Excellence Projects Overview
Area: Pick and PackKPI definition:O
rder Lines Picked & Packed / M
an Hour
Maturity developm
ent
Leadership
W1
Value Stream
Planning (VSM
/VSD)
Factors of Success
6 7
Productivity Pick/Pack AreaTarget Condition
Quick Reaction System
Regular Comm
unication
CONCEPT
Point-CIPBusiness Requirem
ents
Value Stream Planning
Identification of Improvem
ent …
Dfi
itifT
tCditi
CONCEPT
System-CIP
Visualization
Workforce
Standardization
Workplace
Design
2 3 4 5 6Q
uick Reaction System
Regular Comm
unication
Sustainable Problem Solving
Process Confirmation
01
23
4
EPT
KPI-Effect
EXECU
Identification of Improvem
ent …
Definition of Target Conditions
System-CIP Projects
Point-CIP Areas
01
23
4
EPT
Target DerivationSystem
-CIP CyclesIm
provement Focus
EXECU
Average2,939
2,669Resultsofthe
BoschLogisticsW
arehouseAssessm
ent2010
Customer
Collaboration
Sustainable Problem
Solving
Workforce
Managem
ent
0 1 2Jan 11Feb 11
Mar 11
Apr 11M
ay 11Jun 11
Jul 11Aug 11
Sep 11O
ct 11N
ov 11Dec 11
Jan 12Feb 12
KPI-Effect
Quality of Problem
Solving
01
23
4
ECUTION
Start PIA*
System-CIP Cycles
Improvem
ent FocusLeadership Involvem
entVSM
-Quality
Target Achievement
01
23
4
ECUTION
Average2,939
2,669Results of the Bosch Logistics W
arehouse Assessment 2010
Deviation
0,6780,630
Results of the Bosch Logistics Warehouse Assessm
ent 2011D
evelopment
-9,18% (from
Start PIA* with all data before)
*Start Project in the Area
FigureH.1:Project
development
sheetWarehouse
1
176
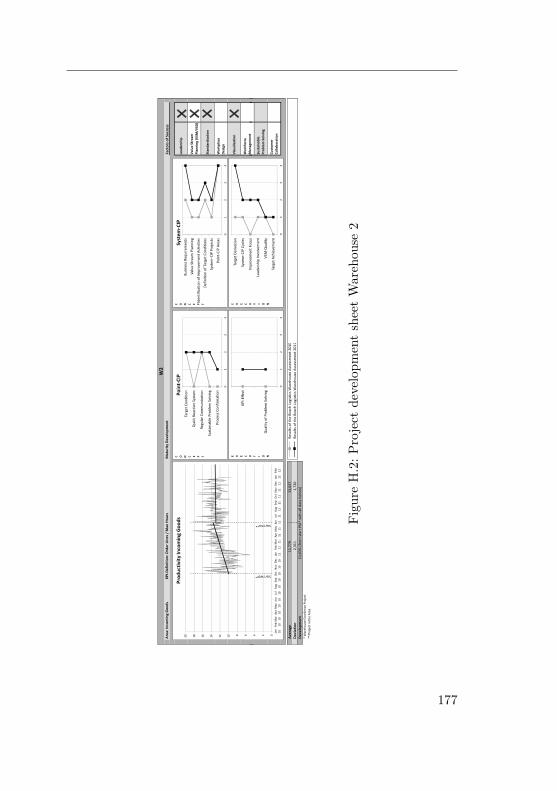
Area
: Inc
omin
g G
oods
KPI-D
efin
ition
: Ord
er L
ines
/ M
an H
ours
Mat
urity
Dev
elop
men
tW
2
Wor
kpla
ce
Des
ign
Visu
aliz
atio
n
Lead
ersh
ip
Valu
e St
ream
Pl
anni
ng (V
SM/V
SD)
Stan
dard
izat
ion
Fact
ors o
f Suc
cess
Wor
kfor
ce
Man
agem
ent
468101214161820
Prod
uctiv
ity In
com
ing
Goo
dsTa
rget
Con
ditio
n
Qui
ck R
eact
ion
Syst
em
Regu
lar C
omm
unic
atio
n
Sust
aina
ble
Prob
lem
Sol
ving
Proc
ess C
onfir
mat
ion
01
23
4
C O N C E P T
Poin
t-CI
P
KPI-E
ffect
E X E C U T
Busin
ess
Requ
irem
ents
Valu
e St
ream
Pla
nnin
g
Iden
tific
atio
n of
Impr
ovem
ent A
ctiv
ities
Defin
ition
of T
arge
t Con
ditio
ns
Syst
em-C
IP P
roje
cts
Poin
t-CI
P Ar
eas
01
23
4
C O N C E P T
Syst
em-C
IP
Targ
et D
eriv
atio
n
Syst
em-C
IP C
ycle
s
Impr
ovem
ent F
ocus
E X E C U T
Aver
age
11,7
7913
,027
Resu
lts o
f the
Bos
ch L
ogist
ics W
areh
ouse
Ass
essm
ent 2
010
Dev
iatio
n2,
311
1,72
0Re
sults
of t
he B
osch
Log
istic
s War
ehou
se A
sses
smen
t 201
1D
evel
opm
ent
10,6
0% (f
rom
star
t PIA
* w
ith a
ll da
ta b
efor
e)*
War
ehou
se E
xcel
lenc
e Pr
ojec
t**
Pro
ject
in th
e Ar
ea
Sust
aina
ble
Pr
oble
m S
olvi
ng
Cust
omer
Co
llabo
ratio
n0246
Jan
10Fe
b 10
Mar
10
Apr
10M
ay
10Ju
n 10
Jul
10Au
g 10
Sep
10O
ct
10N
ov
10De
c 10
Jan
11Fe
b 11
Mar
11
Apr
11M
ay
11Ju
n 11
Jul
11Au
g 11
Sep
11O
ct
11N
ov
11De
c 11
Jan
12Fe
b 12
Qua
lity
of P
robl
em S
olvi
ng
01
23
4
C U T I O N
Start WEP*
StartPiA**
Impr
ovem
ent F
ocus
Lead
ersh
ip In
volv
emen
t
VSM
-Qua
lity
Targ
et A
chie
vem
ent
01
23
4
C U T I O N
Figu
reH.2:P
roject
developm
entsheetWareh
ouse
2
177

H Appendix - Warehouse Excellence Projects Overview
Area: Outgoing G
oodsKPI-D
efinition: Order Lines / M
an Hours
Maturity D
evelopment
W4
Leadership
Value Stream
Planning (VSM/VSD
)
Factors of Success
2
2,5
Productivity Outgoing G
oodsTarget Condition
Quick Reaction System
Regular Comm
unication
CONCEPT
Point-CIPBusiness Requirem
ents
Value Stream Planning
Identification of Improvem
ent …
Dfi
itifT
tCditi
CONCEPT
System-CIP
Workplace
Design
Visualization
Standardization
Workforce
1
1,5 2
Quick Reaction System
Regular Comm
unication
Sustainable Problem Solving
Process Confirmation
01
23
4
EPT
KPI-Effect
EXECU
Identification of Improvem
ent …
Definition of Target Conditions
System-CIP Projects
Point-CIP Areas
01
23
4
EPT
Target Derivation
System-CIP Cycles
Improvem
entFocus
EXECU
Average0,934
1,0241,228
Results of the Bosch Logistics Warehouse Assessm
ent 2010i
il
fh
hh
Sustainable Problem
Solving
Customer Collaboration
Managem
ent
0
0,5Jun 11Jul 11
Aug 11Sep 11
Oct 11
Nov 11
Dec 11Jan 12
Feb 12
KPI-Effect
Quality of Problem
Solving
01
23
4
ECUTION
Start PIA*
Start R**
System-CIP Cycles
Improvem
ent Focus
Leadership Involvement
VSM-Q
uality
Target Achievement
01
23
4
ECUTION
Deviation
0,2710,149
0,339Results of the Bosch Logistics W
arehouse Assessment 2011
Developm
ent9,63%
19,97%D
evelopment
25,39%(from
start PIA* with all data before)
* Project in the Area**Refocused
FigureH.3:Project
development
sheetWarehouse
4
178

Area
: Inc
omin
g G
oods
KPI-D
efin
ition
: Ord
er L
ines
(PID
) / M
an H
ours
Mat
urity
Dev
elop
men
tFa
ctor
s of S
ucce
ssW
5
Lead
ersh
ip
Valu
e St
ream
Pl
anni
ng
(VSM
/VSD
)2025
Prod
uctiv
ity In
com
ing
Goo
dsTa
rget
Con
ditio
n
Qui
ck R
eact
ion
Syst
em
Regu
lar C
omm
unic
atio
n
C O N C E P T
Poin
t-CI
PBu
sines
s Req
uire
men
ts
Valu
e St
ream
Pla
nnin
g
Iden
tific
atio
n of
Impr
ovem
ent …
Defin
ition
of T
arge
t Con
ditio
ns
C O N C E P T
Syst
em-C
IP
Stan
dard
izat
ion
Wor
kpla
ce
Des
ign
Visu
aliz
atio
n
Wor
kfor
ce
101520Re
gula
r Com
mun
icat
ion
Sust
aina
ble
Prob
lem
Sol
ving
Proc
ess C
onfir
mat
ion
01
23
4
P T
KPI-E
ffect
E X E C U
Iden
tific
atio
n of
Impr
ovem
ent …
Defin
ition
of T
arge
t Con
ditio
ns
Syst
em-C
IP P
roje
cts
Poin
t-CI
P Ar
eas
01
23
4
P T
Targ
et D
eriv
atio
n
Syst
em-C
IP C
ycle
s
Impr
ovem
ent F
ocus
E X E C U
Aver
age
5,69
77,
287
9,34
8Re
sults
ofth
eBo
sch
Logi
stic
sWar
ehou
seAs
sess
men
t201
0
Sust
aina
ble
Pr
oble
m S
olvi
ng
Cust
omer
Co
llabo
ratio
n
Wor
kfor
ceM
anag
emen
t
05
Jan
10Fe
b 10
Mar
10
Apr
10M
ay
10Ju
n 10
Jul
10Au
g 10
Sep
10O
ct
10N
ov
10De
c 10
Jan
11Fe
b 11
Mar
11
Apr
11M
ay
11Ju
n 11
Jul
11Au
g 11
Sep
11O
ct
11N
ov
11De
c 11
Jan
12Fe
b 12
KPI-E
ffect
Qua
lity
of P
robl
em S
olvi
ng
01
23
4
C U T I O N
Start WEP*
StartPiA**
Syst
em-C
IP C
ycle
s
Impr
ovem
ent F
ocus
Lead
ersh
ip In
volv
emen
t
VSM
-Qua
lity
Targ
et A
chie
vem
ent
01
23
4
C U T I O N
Aver
age
5,69
77,
287
9,34
8Re
sults
of t
he B
osch
Log
istic
s War
ehou
se A
sses
smen
t 201
0D
evia
tion
0,62
01,
697
1,49
9Re
sults
of t
he B
osch
Log
istic
s War
ehou
se A
sses
smen
t 201
1D
evel
opm
ent
27,9
0%D
evel
opm
ent
47,9
7% (
from
star
t PIA
* w
ith a
ll da
ta b
efor
e)*
War
ehou
se E
xcel
lenc
e Pr
ojec
t**
Pro
ject
in th
e Ar
ea
28,2
8%
Figu
reH.4:P
roject
developm
entsheetWareh
ouse
5
179

H Appendix - Warehouse Excellence Projects Overview
Area: Outgoing G
oodsKPI-D
efinition: Order Lines / M
an Hours
Maturity D
evelopment
W6
Factors of Success
Leadership
Value Stream
Planning (VSM/VSD
)5 6
Productivity Outgoing G
oodsTarget Condition
Quick Reaction System
Regular Comm
unication
CONCEPT
Point-CIPBusiness Requirem
ents
Value Stream Planning
Identification of Improvem
ent …
Dfi
itifT
tCditi
CONCEPT
System-CIP
Workforce
Standardization
Workplace
Design
Visualization
2 3 4 5Q
uick Reaction System
Regular Comm
unication
Sustainable Problem Solving
Process Confirmation
01
23
4
PT
KPI-Effect
EXECU
Identification of Improvem
ent …
Definition of Target Conditions
System-CIP Projects
Point-CIP Areas
01
23
4
PT
Target Derivation
System-CIP Cycles
Improvem
entFocus
EXECU
Average1,799
3,016Results of the Bosch Logistics W
arehouse Assessment 2010
3,155
Workforce
Managem
ent
Sustainable Problem
Solving
Customer Collaboration
0 1 2Jun 11Jul 11
Aug 11Sep 11
Oct 11
Nov 11
Dec 11Jan 12
Feb 12
KPI-Effect
Quality of Problem
Solving
01
23
4
ECUTION
Start PIA*
System-CIP Cycles
Improvem
ent Focus
Leadership Involvement
VSM-Q
uality
Target Achievement
01
23
4
ECUTION
Average1,799
3,016Results of the Bosch Logistics W
arehouse Assessment 2010
Deviation
0,3520,483
Results of the Bosch Logistics Warehouse Assessm
ent 2011D
evelopment
75,43%-4,41%
Developm
ent73,64%
(from start PIA* w
ith all data before)* Project Start inthe Area
0,7323,155
FigureH.5:Project
development
sheetWarehouse
6
180
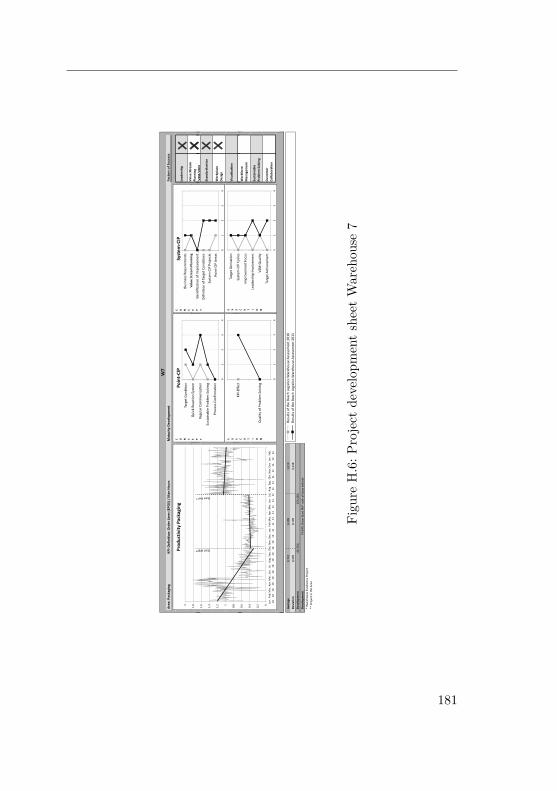
Area
: Pac
kagi
ngKP
I-Def
initi
on: O
rder
Lin
es (E
POS)
/ M
an H
ours
Mat
urity
Dev
elop
men
t
Valu
e St
ream
Pl
anni
ng
(VSM
/VSD
)
W7
Fact
ors o
f Suc
cess
Lead
ersh
ip
1,82
Prod
uctiv
ity P
acka
ging
Targ
et C
ondi
tion
Qui
ck R
eact
ion
Syst
em
Regu
larC
omm
unic
atio
n
C O N C E P T
Poin
t-CI
P
EP*
A**
Busi
ness
Req
uire
men
ts
Valu
e St
ream
Pla
nnin
g
Iden
tific
atio
n of
Impr
ovem
ent …
C O N C E P T
Syst
em-C
IP
(VSM
/VSD
)
Stan
dard
izat
ion
Wor
kpla
ce
Des
ign
Visu
aliz
atio
n
06
0,81
1,2
1,4
1,6
1,8
Qui
ck R
eact
ion
Syst
em
Regu
lar C
omm
unic
atio
n
Sust
aina
ble
Prob
lem
Sol
ving
Proc
ess C
onfir
mat
ion
01
23
4
E P T
KPI-E
ffect
E X E CStart WEP*
StartPiA**
Valu
e St
ream
Pla
nnin
g
Iden
tific
atio
n of
Impr
ovem
ent …
Defin
ition
of T
arge
t Con
ditio
ns
Syst
em-C
IP P
roje
cts
Poin
t-CI
P Ar
eas
01
23
4
E P T
Targ
et D
eriv
atio
n
Syst
em-C
IP C
ycle
s
E X E C
Sust
aina
ble
Prob
lem
Sol
ving
Cust
omer
Co
llabo
ratio
n
Wor
kfor
ce
Man
agem
ent
0
0,2
0,4
0,6
0,8
Jan.
10
Feb.
10
Mrz
. 10
Apr.
10M
ai.
10Ju
n.
10Ju
l. 10
Aug.
10
Sep.
10
Okt
. 10
Nov
. 10
Dez.
10
Jan.
11
Feb.
11
Mrz
. 11
Apr.
11M
ai.
11Ju
n.
11Ju
l. 11
Aug.
11
Sep.
11
Okt
. 11
Nov
. 11
Dez.
11
Jan.
12
Feb.
12
KPI-E
ffect
Qua
lity
of P
robl
em S
olvi
ng
01
23
4
X E C U T I O N
Syst
em-C
IP C
ycle
s
Impr
ovem
ent F
ocus
Lead
ersh
ip In
volv
emen
t
VSM
-Qua
lity
Targ
et A
chie
vem
ent
01
23
4
X E C U T I O N
Aver
age
0,74
20,
398
1,01
0Re
sults
of t
he B
osch
Log
istic
s War
ehou
se A
sses
smen
t 201
0D
evia
tion
0,40
60,
109
0,24
8Re
sults
of t
he B
osch
Log
istic
s War
ehou
se A
sses
smen
t 201
1D
evel
opm
ent
-46,
33%
Dev
elop
men
t74
,94%
(fro
m S
tart
PIA
* w
ith a
ll da
ta b
efor
e)*
War
ehou
se E
xcel
lenc
e Pr
ojec
t**
Pro
ject
in th
e Ar
ea
153,
48%
01
23
40
12
34
Figu
reH.6:P
roject
developm
entsheetWareh
ouse
7
181

H Appendix - Warehouse Excellence Projects Overview
Area: Incoming G
oodsKPI-D
efinition: Order Lines / M
an Hours
Maturity D
evelopment
Leadership
Value Stream
Planning (VSM/VSD
)
W8
Factors of Success
50 60
Productivity Incoming G
oodsTarget Condition
Quick Reaction System
Regular Comm
unication
CONCEPT
Point-CIPBusiness Requirem
ents
Value Stream Planning
Identification of Improvem
ent …
Definition of Target Conditions
CONCEPT
System-CIP
Standardization
Workplace
Design
Visualization
Workforce
20 30 40 50Regular Com
munication
Sustainable Problem Solving
Process Confirmation
01
23
4
PT
KPI-Effect
EXECU
Identification of Improvem
ent …
Definition of Target Conditions
System-CIP Projects
Point-CIP Areas
01
23
4
PT
Target Derivation
System-CIP Cycles
ItF
EXECU
Average29,549
31,696Resultsofthe
BoschLogisticsW
arehouseAssessm
ent201034,770
Sustainable Problem
Solving
Customer Collaboration
Workforce
Managem
ent
0 10 20Jul 11Aug 11
Sep 11O
ct 11N
ov 11Dec 11
Jan 12Feb 12
KPI-Effect
Quality of Problem
Solving
01
23
4
CUTION
Start PiA*
System-CIP Cycles
Improvem
ent Focus
Leadership Involvement
VSM-Q
uality
Target Achievement
01
23
4
CUTION
Average29,549
31,696Results of the Bosch Logistics W
arehouse Assessment 2010
Deviation
3,3894,471
Results of the Bosch Logistics Warehouse Assessm
ent 2011D
evelopment
7,27%9,70%
Developm
ent10,51%
(from Start PIA* w
ith all data before)* Start Project in the Area
34,7702,960
FigureH.7:Project
development
sheetWarehouse
8
182
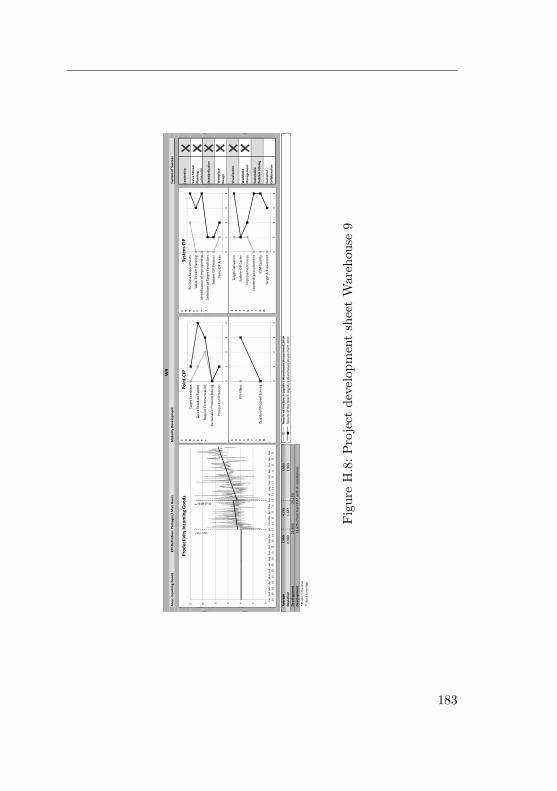
Area
: Inc
omin
g G
oods
KPI-D
efin
ition
: Pac
kage
s / M
an H
ours
Mat
urity
Dev
elop
men
tFa
ctor
s of S
ucce
ssW
9
Lead
ersh
ip
Valu
e St
ream
Pl
anni
ng
(VSM
/VSD
)1012
Prod
uctiv
ity In
com
ing
Goo
dsTa
rget
Con
ditio
n
Qui
ck R
eact
ion
Syst
em
Regu
lar C
omm
unic
atio
n
C O N C E P T
Poin
t-CI
P
rt WFM**
Start PIA*
Busin
ess R
equi
rem
ents
Valu
e St
ream
Pla
nnin
g
Iden
tific
atio
n of
Impr
ovem
ent …
Dfi
itifT
tCdi
ti
C O N C E P T
Syst
em-C
IP
Stan
dard
izat
ion
Wor
kpla
ce
Des
ign
Visu
aliz
atio
n
Wor
kfor
ce46810
Qui
ck R
eact
ion
Syst
em
Regu
lar C
omm
unic
atio
n
Sust
aina
ble
Prob
lem
Sol
ving
Proc
ess C
onfir
mat
ion
01
23
4
E P T
KPI-E
ffect
E X E C
Start WFM
Start PIA
Iden
tific
atio
n of
Impr
ovem
ent …
Defin
ition
of T
arge
t Con
ditio
ns
Syst
em-C
IP P
roje
cts
Poin
t-CI
P Ar
eas
01
23
4
E P T
Targ
et D
eriv
atio
n
Syst
em-C
IP C
ycle
s
Impr
ovem
entF
ocus
E X E C
Aver
age
4,79
55,
952
Resu
ltsof
the
Bosc
hLo
gist
icsW
areh
ouse
Asse
ssm
ent2
010
3,90
0
Wor
kfor
ceM
anag
emen
t
Sust
aina
ble
Pr
oble
m S
olvi
ng
Cust
omer
Co
llabo
ratio
n
024
Jan
10Fe
b 10
Mar
10
Apr
10M
ay
10Ju
n 10
Jul
10Au
g 10
Sep
10O
ct
10N
ov
10De
c 10
Jan
11Fe
b 11
Mar
11
Apr
11M
ay
11Ju
n 11
Jul
11Au
g 11
Sep
11O
ct
11N
ov
11De
c 11
Jan
12Fe
b 12
KPI-E
ffect
Qua
lity
of P
robl
em S
olvi
ng
01
23
4
E C U T I O N
Syst
em-C
IP C
ycle
s
Impr
ovem
ent F
ocus
Lead
ersh
ip In
volv
emen
t
VSM
-Qua
lity
Targ
et A
chie
vem
ent
01
23
4
E C U T I O N
Aver
age
4,79
55,
952
Resu
lts o
f the
Bos
ch L
ogist
ics W
areh
ouse
Ass
essm
ent 2
010
Dev
iatio
n0,
000
1,64
71,
969
Resu
lts o
f the
Bos
ch L
ogist
ics W
areh
ouse
Ass
essm
ent 2
011
Dev
elop
men
t22
,96%
Dev
elop
men
t33
,62%
(fro
m S
tart
PIA
* w
ith a
ll da
ta b
efor
e)*
Proj
ect i
n th
e Ar
ea**
Wor
k Fo
rce
Mgt
.
24,1
2%
3,90
0
Figu
reH.8:P
roject
developm
entsheetWareh
ouse
9
183

H Appendix - Warehouse Excellence Projects Overview
Area: Incoming G
oodsKPI-D
efinition: Order Lines / M
an Hours
Maturity D
evelopment
Factors of Success
Leadership
W10
Value StreamPlanning (VSM
/VSD)
80 90
100
Productivity Incoming G
oodsTarget Condition
Quick Reaction System
RegularComm
unication
CONCEPT
Point-CIPBusiness Requirem
ents
Value Stream Planning
Identification of Improvem
ent …
CONCEPT
System-CIP
(VSM/VSD
)
Standardization
Workplace
Design
Visualization
30 40 50 60 70 80 90Q
uick Reaction System
Regular Comm
unication
Sustainable Problem Solving
Process Confirmation
01
23
4
EPT
KPI-Effect
EXEC
g
Identification of Improvem
ent …
Definition of Target Conditions
System-CIP Projects
Point-CIP Areas
01
23
4
EPT
Target Derivation
System-CIP Cycles
EXEC
Customer
Collaboration
Workforce
Managem
ent
Sustainable Problem
Solving
0 10 20 30 40
Jan 10
Feb 10
Mar
10Apr 10
May
10Jun 10
Jul 10
Aug 10
Sep 10
Oct
10N
ov 10
Dec 10
Jan 11
Feb 11
Mar
11Apr 11
May
11Jun 11
Jul 11
Aug 11
Sep 11
Oct
11N
ov 11
Dec 11
Jan 12
Feb 12
KPI-Effect
Quality of Problem
Solving
01
23
4
ECUTION
Start PIA*
System-CIP Cycles
Improvem
ent Focus
Leadership Involvement
VSM-Q
uality
Target Achievement
01
23
4
ECUTION
Average49,444
57,295Results of the Bosch Logistics W
arehouse Assessment 2010
Devitation
7,3326,933
Results of the Bosch Logistics Warehouse Assessm
ent 2011D
evelopment
15,88% (from
Start PIA* with all data before)
* Warehouse Excellence Project
** Project in the Area
Jan 10
Feb 10
Mar
10Apr 10
May
10Jun 10
Jul 10
Aug 10
Sep 10
Oct
10N
ov 10
Dec 10
Jan 11
Feb 11
Mar
11Apr 11
May
11Jun 11
Jul 11
Aug 11
Sep 11
Oct
11N
ov 11
Dec 11
Jan 12
Feb 12
01
23
40
12
34
FigureH.9:Project
development
sheetWarehouse
10
184

Area
: Inc
omin
g G
oods
KPI-D
efin
ition
: Ord
er L
ines
/ M
an H
ours
Mat
urity
Dev
elop
men
t
W11
Fact
ors o
f Suc
cess
Lead
ersh
ip
Valu
e St
ream
Pl
anni
ng
(VSM
/VSD
)67
Prod
uctiv
ity In
com
ing
Goo
dsTa
rget
Con
ditio
n
Qui
ck R
eact
ion
Syst
em
Regu
lar C
omm
unic
atio
n
C O N C E P T
Poin
t-CI
PBu
sines
s Req
uire
men
ts
Valu
e St
ream
Pla
nnin
g
Iden
tific
atio
n of
Impr
ovem
ent …
Dfi
itifT
tCdi
ti
C O N C E P T
Syst
em-C
IP
Wor
kfor
ce
Wor
kpla
ce
Des
ign
Visu
aliz
atio
n
Stan
dard
izat
ion
23456Q
uick
Rea
ctio
n Sy
stem
Regu
lar C
omm
unic
atio
n
Sust
aina
ble
Prob
lem
Sol
ving
Proc
ess C
onfir
mat
ion
01
23
4
E P T
KPI-E
ffect
E X E C U
Iden
tific
atio
n of
Impr
ovem
ent …
Defin
ition
of T
arge
t Con
ditio
ns
Syst
em-C
IP P
roje
cts
Poin
t-CI
P Ar
eas
01
23
4
E P T
Targ
et D
eriv
atio
n
Syst
em-C
IP C
ycle
s
Impr
ovem
entF
ocus
E X E C U
Sust
aina
ble
Pr
oble
m S
olvi
ng
Cust
omer
Co
llabo
ratio
n
Wor
kfor
ceM
anag
emen
t
012
Jan
10Fe
b 10
Mar
10
Apr
10M
ay
10Ju
n 10
Jul
10Au
g 10
Sep
10O
ct
10N
ov
10De
c 10
Jan
11Fe
b 11
Mar
11
Apr
11M
ay
11Ju
n 11
Jul
11Au
g 11
Sep
11O
ct
11N
ov
11De
c 11
Jan
12Fe
b 12
KPI-E
ffect
Qua
lity
of P
robl
em S
olvi
ng
01
23
4
E C U T I O N
StartPiA*
Syst
em-C
IP C
ycle
s
Impr
ovem
ent F
ocus
Lead
ersh
ip In
volv
emen
t
VSM
-Qua
lity
Targ
et A
chie
vem
ent
01
23
4
E C U T I O N
Aver
age
3,95
75,
434
Resu
lts o
f the
Bos
ch L
ogist
ics W
areh
ouse
Ass
essm
ent 2
010
Dev
iatio
n0,
311
0,30
4Re
sults
of t
he B
osch
Log
istic
s War
ehou
se A
sses
smen
t 201
1D
evel
opm
ent
37,4
4% (
from
Sta
rt P
IA*
with
all
data
bef
ore)
*Pro
ject
in th
e Ar
ea
Figu
reH.10:
Projectde
velopm
entsheetWareh
ouse
11
185
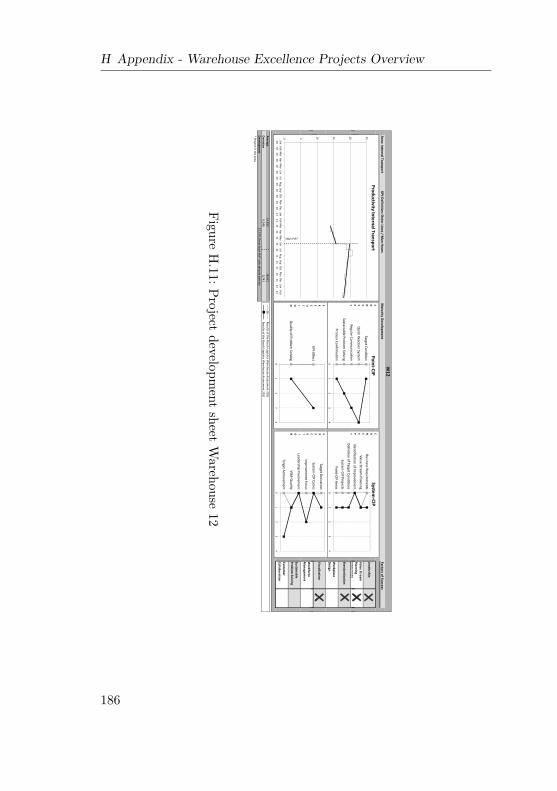
H Appendix - Warehouse Excellence Projects Overview
Area: Internal TransportKPI-D
efinition: Order Lines / M
an Hours
Maturity D
evelopment
Factors of Success
Leadership
Value StreamPlanning (VSM
/VSD)
W12
20 25
Productivity Internal TransportTarget Condition
Quick Reaction System
RegularComm
unication
CONCEPT
Point-CIPBusiness Requirem
ents
Value Stream Planning
Identification of Improvem
ent …
CONCEPT
System-CIP
(VSM/VSD
)
Standardization
Workplace
Design
Visualization10 15 20
Quick Reaction System
Regular Comm
unication
Sustainable Problem Solving
Process Confirmation
01
23
4
EPT
KPI-Effect
EXEC
g
Identification of Improvem
ent …
Definition of Target Conditions
System-CIP Projects
Point-CIP Areas
01
23
4
EPT
Target Derivation
System-CIP Cycles
EXEC
Customer
Collaboration
Workforce
Managem
ent
Sustainable Problem
Solving
0 5 10
Jan 10
Feb 10
Mar
10Apr 10
May
10Jun 10
Jul 10
Aug 10
Sep 10
Oct
10N
ov 10
Dec 10
Jan 11
Feb 11
Mar
11Apr 11
May
11Jun 11
Jul 11
Aug 11
Sep 11
Oct
11N
ov 11
Dec 11
Jan 12
Feb 12
KPI-Effect
Quality of Problem
Solving
01
23
4
ECUTION
Start PiA*
System-CIP Cycles
Improvem
ent Focus
Leadership Involvement
VSM-Q
uality
Target Achievement
01
23
4
ECUTION
Average14,832
18,921Results of the Bosch Logistics W
arehouse Assessment 2010
Deviation
0,5460,741
Results of the Bosch Logistics Warehouse Assessm
ent 2011D
evelopment
27,57% (from
Start PIA* with all data before)
* Project in the Area
01
23
40
12
34
FigureH.11:Project
development
sheetWarehouse
12
186
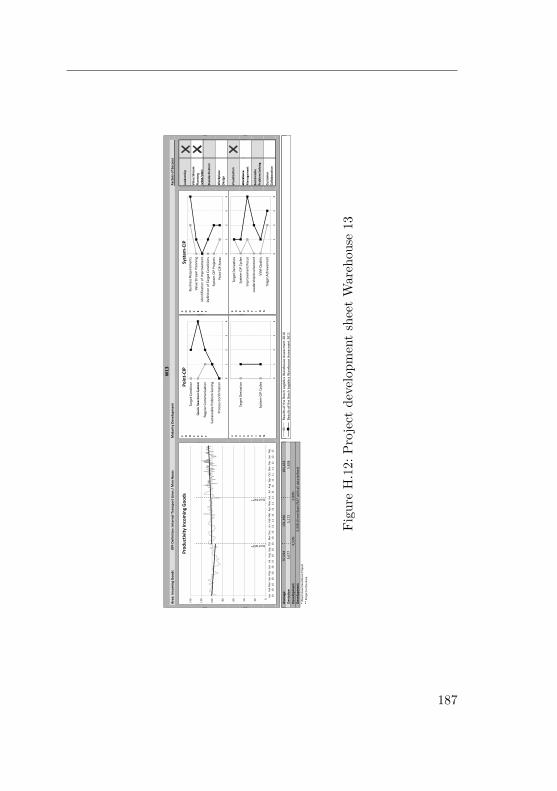
Area
: Inc
omin
g G
oods
KPI-D
efin
ition
: Int
erna
l Tra
nspo
rt L
ines
/ M
an H
ours
Mat
urity
Dev
elop
men
tW
13
Lead
ersh
ip
Valu
e St
ream
Pl
anni
ng
(VSM
/VSD
)
Fact
ors o
f Suc
cess
120
140
Prod
uctiv
ity In
com
ing
Goo
dsTa
rget
Con
ditio
n
Qui
ck R
eact
ion
Syst
em
Regu
lar C
omm
unic
atio
n
C O N C E P T
Poin
t-CI
PBu
sines
s Req
uire
men
ts
Valu
e St
ream
Pla
nnin
g
Iden
tific
atio
n of
Impr
ovem
ent …
Dfi
itifT
tCdi
ti
C O N C E P T
Syst
em-C
IP
Wor
kpla
ce
Des
ign
Visu
aliz
atio
n
Stan
dard
izat
ion
Wor
kfor
ce40608010
0
120
Qui
ck R
eact
ion
Syst
em
Regu
lar C
omm
unic
atio
n
Sust
aina
ble
Prob
lem
Sol
ving
Proc
ess C
onfir
mat
ion
01
23
4
E P T
Targ
et D
eriv
atio
n
E X E C U
Iden
tific
atio
n of
Impr
ovem
ent …
Defin
ition
of T
arge
t Con
ditio
ns
Syst
em-C
IP P
roje
cts
Poin
t-CI
P Ar
eas
01
23
4
E P T
Targ
et D
eriv
atio
n
Syst
em-C
IP C
ycle
s
Impr
ovem
entF
ocus
E X E C U
Aver
age
9709
410
149
610
443
3Re
sults
ofth
eBo
sch
Logi
stic
sWar
ehou
seAs
sess
men
t201
0
Sust
aina
ble
Pr
oble
m S
olvi
ng
Cust
omer
Co
llabo
ratio
n
Wor
kfor
ceM
anag
emen
t
02040
Jan
10Fe
b 10
Mar
10
Apr
10M
ay
10Ju
n 10
Jul
10Au
g 10
Sep
10O
ct
10N
ov
10De
c 10
Jan
11Fe
b 11
Mar
11
Apr
11M
ay
11Ju
n 11
Jul
11Au
g 11
Sep
11O
ct
11N
ov
11De
c 11
Jan
12Fe
b 12
Targ
et D
eriv
atio
n
Syst
em-C
IP C
ycle
s
01
23
4
E C U T I O N
Start WEP*
Start PiA**
Syst
em-C
IP C
ycle
s
Impr
ovem
ent F
ocus
Lead
ersh
ip In
volv
emen
t
VSM
-Qua
lity
Targ
et A
chie
vem
ent
01
23
4
E C U T I O N
Aver
age
97,0
9410
1,49
610
4,43
3Re
sults
of t
he B
osch
Log
istic
s War
ehou
se A
sses
smen
t 201
0D
evia
tion
5,67
75,
172
5,83
8Re
sults
of t
he B
osch
Log
istic
s War
ehou
se A
sses
smen
t 201
1D
evel
opm
ent
4,53
%D
evel
opm
ent
5,33
% (f
rom
Sta
rt P
IA*
with
all
data
bef
ore)
* W
areh
ouse
Exc
elle
nce
Proj
ect
** P
roje
ct in
the
Area
2,89
%
Figu
reH.12:
Projectde
velopm
entsheetWareh
ouse
13
187
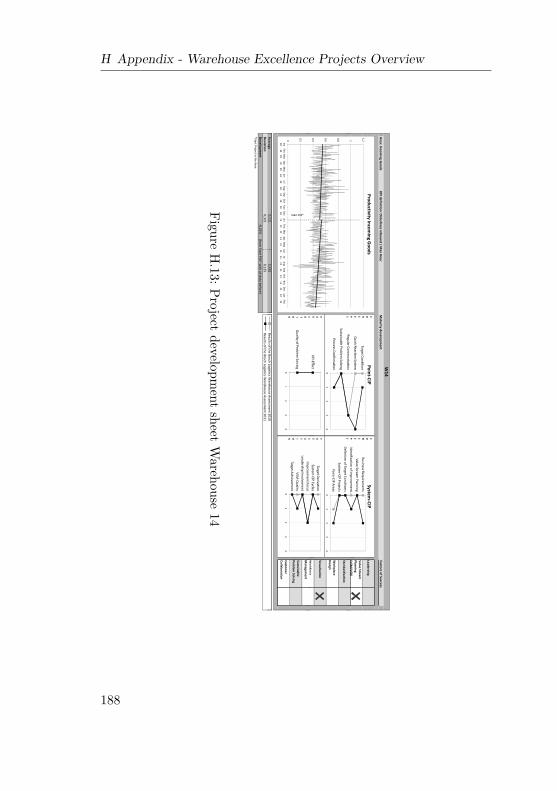
H Appendix - Warehouse Excellence Projects Overview
Area: Incoming G
oodsKPI definition: O
rderlines Inbound / Man H
ourM
aturity development
Leadership
W14
Value Stream
Planning (VSM
/VSD)
Factors of Success
1
1,2
Productivity Incoming G
oodsTarget Condition
Quick Reaction System
Regular Comm
unication
CONCEPT
Point-CIPBusiness Requirem
ents
Value Stream Planning
Identification of Improvem
ent …
Dfi
itifT
tCditi
CONCEPT
System-CIP
Visualization
Workforce
Standardization
Workplace
Design
0,4
0,6
0,8 1
Quick Reaction System
Regular Comm
unication
Sustainable Problem Solving
Process Confirmation
01
23
4
EPT
KPI-Effect
EXECU
Identification of Improvem
ent …
Definition of Target Conditions
System-CIP Projects
Point-CIP Areas
01
23
4
EPT
Target DerivationSystem
-CIP CyclesIm
provement Focus
EXECU
Average0,531
0,488Resultsofthe
BoschLogisticsW
arehouseAssessm
ent2010
Customer
Collaboration
Sustainable Problem
Solving
Workforce
Managem
ent
0
0,2
0,4
Jan 10
Feb 10
Mar
10Apr 10
May
10Jun 10
Jul 10
Aug 10
Sep 10
Oct
10N
ov 10
Dec 10
Jan 11
Feb 11
Mar
11Apr 11
May
11Jun 11
Jul 11
Aug 11
Sep 11
Oct
11N
ov 11
Dec 11
Jan 12
Feb 12
KPI-Effect
Quality of Problem
Solving
01
23
4
ECUTION
Start PIA*
System-CIP Cycles
Improvem
ent FocusLeadership Involvem
entVSM
-Quality
Target Achievement
01
23
4
ECUTION
Average0,531
0,488Results of the Bosch Logistics W
arehouse Assessment 2010
Deviation
0,1210,125
Results of the Bosch Logistics Warehouse Assessm
ent 2011D
evelopment
-8,02% (from
Start PIA* with all data before)
*Start Project in the Area
FigureH.13:Project
development
sheetWarehouse
14
188
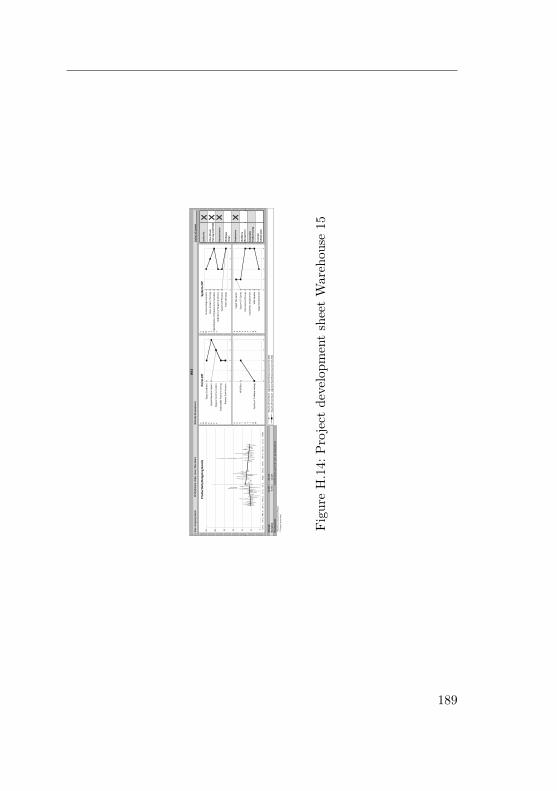
Area
: Out
goin
g G
oods
KPI-D
efin
ition
: Ord
er L
ines
/ M
an H
ours
Mat
urity
Dev
elop
men
tW
15
Wor
kpla
ce
Des
ign
Visu
aliz
atio
n
Lead
ersh
ip
Valu
e St
ream
Pl
anni
ng (V
SM/V
SD)
Stan
dard
izat
ion
Fact
ors o
f Suc
cess
Wor
kfor
ce
Man
agem
ent
406080100
120
Prod
uctiv
ityO
utgo
ing
Goo
dsTa
rget
Con
ditio
n
Qui
ck R
eact
ion
Syst
em
Regu
lar C
omm
unic
atio
n
Sust
aina
ble
Prob
lem
Sol
ving
Proc
ess C
onfir
mat
ion
01
23
4
C O N C E P T
Poin
t-CI
P
KPI-E
ffect
E X E C U T
StartPiA**
Busin
ess
Requ
irem
ents
Valu
e St
ream
Pla
nnin
g
Iden
tific
atio
n of
Impr
ovem
ent A
ctiv
ities
Defin
ition
of T
arge
t Con
ditio
ns
Syst
em-C
IP P
roje
cts
Poin
t-CI
P Ar
eas
01
23
4
C O N C E P T
Syst
em-C
IP
Targ
et D
eriv
atio
n
Syst
em-C
IP C
ycle
s
Impr
ovem
ent F
ocus
E X E C U T
Aver
age
22,8
5328
,210
Resu
lts o
f the
Bos
ch L
ogist
ics W
areh
ouse
Ass
essm
ent 2
010
Dev
iatio
n9,
776
11,3
27Re
sults
of t
he B
osch
Log
istic
s War
ehou
se A
sses
smen
t 201
1D
evel
opm
ent
23,4
4% (f
rom
star
t PIA
* w
ith a
ll da
ta b
efor
e)*
War
ehou
se E
xcel
lenc
e Pr
ojec
t**
Pro
ject
in th
e Ar
ea
Sust
aina
ble
Pr
oble
m S
olvi
ng
Cust
omer
Co
llabo
ratio
n02040
Jan
11Fe
b 11
Mar
11
Apr 1
1M
ay 1
1Ju
n 11
Jul 1
1Au
g 11
Sep
11O
ct 1
1N
ov 1
1De
c 11
Jan
12Fe
b 12
Qua
lity
of P
robl
em S
olvi
ng
01
23
4
C U T I O N
Impr
ovem
ent F
ocus
Lead
ersh
ip In
volv
emen
t
VSM
-Qua
lity
Targ
et A
chie
vem
ent
01
23
4
C U T I O N
Figu
reH.14:
Projectde
velopm
entsheetWareh
ouse
15
189

H Appendix - Warehouse Excellence Projects Overview
Area: Pick and Pack WH
2KPI definition: Carton O
rder Lines Picked & Packed / M
an Hour
Maturity developm
entW
16
Value Stream
Planning (VSM
/VSD)
Factors of Success
Leadership
3
3,5
Productivity Pick/Pack AreaTarget Condition
Quick Reaction System
Regular Comm
unication
CONCEPT
Point-CIPBusiness Requirem
ents
Value Stream Planning
Identification of Improvem
ent …
Dfi
itifT
tCditi
CONCEPT
System-CIP
Visualization
Workforce
Standardization
Workplace
Design
1
1,5 2
2,5 3Q
uick Reaction System
Regular Comm
unication
Sustainable Problem Solving
Process Confirmation
01
23
4
EPT
KPI-Effect
EXECU
PIA*
Identification of Improvem
ent …
Definition of Target Conditions
System-CIP Projects
Point-CIP Areas
01
23
4
EPT
Target DerivationSystem
-CIP CyclesIm
provement Focus
EXECU
Average1,844
2,239Resultsofthe
BoschLogisticsW
arehouseAssessm
ent2010
Customer
Collaboration
Sustainable Problem
Solving
Workforce
Managem
ent
0
0,5 1Jan 11Feb 11
Mar 11
Apr 11M
ay 11Jun 11
Jul 11Aug 11
Sep 11O
ct 11N
ov 11Dec 11
Jan 12Feb 12
KPI-Effect
Quality of Problem
Solving
01
23
4
ECUTION
Start PIA*System
-CIP CyclesIm
provement Focus
Leadership Involvement
VSM-Q
ualityTarget Achievem
ent
01
23
4
ECUTION
Average1,844
2,239Results of the Bosch Logistics W
arehouse Assessment 2010
Deviation
0,2680,252
Results of the Bosch Logistics Warehouse Assessm
ent 2011D
evelopment
21,39% (from
Start PIA* with all data before)
*Start Project in the Area
FigureH.15:Project
development
sheetWarehouse
16
190

Area
: Pic
k an
d Pa
ck W
H2
KPI d
efin
ition
: Car
ton
Ord
er L
ines
Pic
ked
& P
acke
d /
Man
Hou
rM
atur
ity d
evel
opm
ent
W16
b
Valu
e St
ream
Pl
anni
ng
(VSM
/VSD
)
Fact
ors o
f Suc
cess
Lead
ersh
ip
3540
Prod
uctiv
ity P
ick/
Pack
Are
aTa
rget
Con
ditio
n
Qui
ck R
eact
ion
Syst
em
Regu
lar C
omm
unic
atio
n
C O N C E P T
Poin
t-CI
PBu
sines
s Req
uire
men
ts
Valu
e St
ream
Pla
nnin
g
Iden
tific
atio
n of
Impr
ovem
ent …
Dfi
itifT
tCdi
ti
C O N C E P T
Syst
em-C
IP
Visu
aliz
atio
n
Wor
kfor
ce
Stan
dard
izat
ion
Wor
kpla
ce
Des
ign
101520253035Q
uick
Rea
ctio
n Sy
stem
Regu
lar C
omm
unic
atio
n
Sust
aina
ble
Prob
lem
Sol
ving
Proc
ess C
onfir
mat
ion
01
23
4
E P T
KPI-E
ffect
E X E C U
Iden
tific
atio
n of
Impr
ovem
ent …
Defin
ition
of T
arge
t Con
ditio
ns
Syst
em-C
IP P
roje
cts
Poin
t-CI
P Ar
eas
01
23
4
E P T
Targ
et D
eriv
atio
nSy
stem
-CIP
Cyc
les
Impr
ovem
ent F
ocus
E X E C U
Aver
age
19,9
4321
,545
25,2
42Re
sults
ofth
eBo
sch
Logi
stic
sWar
ehou
seAs
sess
men
t201
0
Wor
kfor
ceM
anag
emen
t
Cust
omer
Co
llabo
ratio
n
Sust
aina
ble
Pr
oble
m S
olvi
ng
0510
Jan
11Fe
b 11
Mar
11
Apr 1
1M
ay 1
1Ju
n 11
Jul 1
1Au
g 11
Sep
11O
ct 1
1N
ov 1
1De
c 11
Jan
12Fe
b 12
KPI-E
ffect
Qua
lity
of P
robl
em S
olvi
ng
01
23
4
E C U T I O N
StartPIA*
StartWFM**
Syst
em-C
IP C
ycle
sIm
prov
emen
t Foc
usLe
ader
ship
Invo
lvem
ent
VSM
-Qua
lity
Targ
et A
chie
vem
ent
01
23
4
E C U T I O N
Aver
age
19,9
4321
,545
25,2
42Re
sults
of t
he B
osch
Log
istic
s War
ehou
se A
sses
smen
t 201
0D
evia
tion
3,12
93,
708
3,45
5Re
sults
of t
he B
osch
Log
istic
s War
ehou
se A
sses
smen
t 201
1D
evel
opm
ent
8,04
%17
,16%
Dev
elop
men
t22
,33%
(fro
m S
tart
PIA
* w
ith a
ll da
ta b
efor
e)*S
tart
Pro
ject
in th
e Ar
ea**
Wor
kfor
ce M
gt.
Figu
reH.16:
Projectde
velopm
entsheetWareh
ouse
16b
191