


Map xxxx
▪
▪ University of OxfordEnergy Colloquium
Tidal lagoons as a cornerstone of the UK energy sectorOctober 2016

1850 : Locations of active UK tidal mills

2016 Images of these permanent assets
Felin Wen, Anglesey
Carew Castle, Pembrokeshire, 1542-1937
Three Mills, London, 1776-1817
Woodbridge, Ipswich, 1170-2016

24
Our island nation
! The best tidal range resource in Europe and 2nd best worldwide
! A 1,400 year history of tapping it! Shallow waters, suitable bathymetry,
population and grid proximity! Variance in tide times offering the
potential for 24-hour generation, a total potential for up to 40GW

Why do we have such a large tidal range?
‘Shoaling’
‘Funnelling’

Security and predictability

Vive la France!Opening of La Rance by General de Gaulle 26 November 1966

14
! World’s first tidal power station, opened November 1966
! Fruit of three decades of research into tidal power in salt water in the Breton-Normand Gulf
! 97% availability during nearly 50 years of operation
La Rance tidal power station

1914
La Rance Tidal Barrage, France49 years of field data
! Built and operated by EDF! 240MW installed capacity! 540,000 MWh/year! Operating smoothly! 97% availability in 49 years! 93% efficiency on the ebb! 75% efficiency on the flood! Year 47 – first overhaul of turbines, 5 turbines received
replacement parts! Year 48 – control system to be replaced! Year 50 - €200m refurbishment for another 50 years of
output
Tidal range is a proven technology
Year 47
Year 1

The UK energy gap
Source: Bircham Dyson Bell
The UK has a requirement to provide security of supply in the face of:
• Increasing demand through the electrification of heat and transport
• A requirement to decarbonise the electricity system by 2050
• Power station closures out to 2025 representing 30% of existing generation capacity
• Continuing focus on value for money and lowest cost solutions

24
Wall length: 9.5km Area: 11.5km2
Installed capacity: 320MWDaily generating time: 14 hoursAnnual output (net): 530GWhAnnual CO2 savings: 236,000 t
Design life: 120yrs Height of wall: 5-20mWall above low water: 12.0m Wall above high water: 3.5m Tidal range Neaps: 4.1mTidal range Springs: 8.5m
Swansea Bay Tidal Lagoon: a blueprint

We generate on the ebb & flood of each tide, sluicing & pumping at the end of eachtide to maximize head difference ready for the next tide
Flexible and predictable generation

Cardiff
Lancashire
Colwyn
Portfolio A: Cardiff, Colwyn, Lancashire

Portfolio A: Cardiff, Colwyn, Lancashire
Cardiff
Colwyn
Lancashire

Portfolio A: Flexible generation

CCGT behaviour change

24
Tidal Lagoon Swansea Bay


Technical drawings:Bund wall cross sections

Temporary bund wall (cofferdam)
LAGOON SIDE
SEA SIDE

La Rance – cofferdam construction

Shiwa – cofferdam construction

Shiwa – cofferdam construction

Shiwa – cofferdam construction
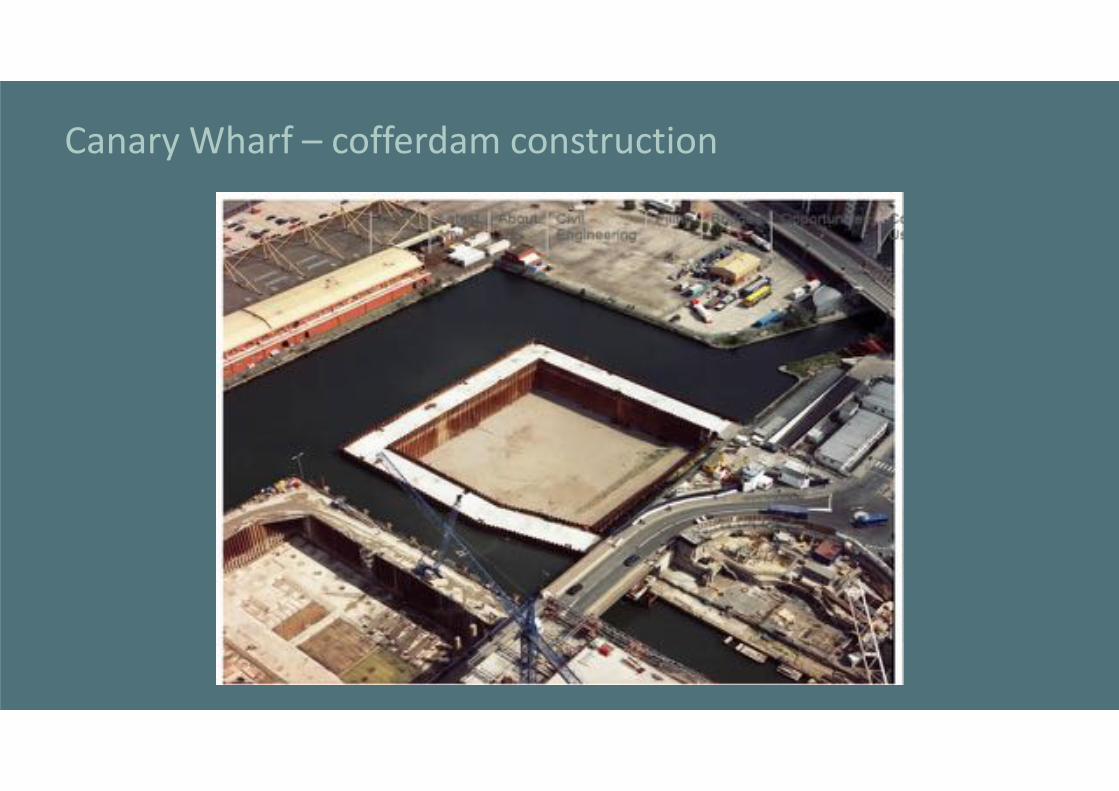
Canary Wharf – cofferdam construction

Technical drawings:Turbine and sluice gate structures

Technical drawings:Turbine house cross section

Technical drawings:Sluice gate cross section

Construction sequence – Year 1

Construction sequence – Year 2 & 3

Construction sequence – Year 4

Turbine house

Draft Tube40 tonnes
Turbine Housing90 tonnes
Bulb Nose20 tonnes
Hatch Cover30 tonnes
Shaft40 tonnes
Runner
Runner blade18 tonne
Runner hub45 tonnes
Distributor90 tonnes
Discharge ring
Generator
Turbine components

CACW heat exchangers
Stator end plate
Stator frame
Stator copper
Stator laminationsRotor
laminations
Rotorbars
Terminal box
Rotor spider
Rotor end rings
Rotor pressure plates
Stator compression
plates
Converter
Generator components

TLSB turbine tender
! 2 stage competitive process
! 18 month duration including 9 months of homologous model testing
! 3 global leaders in hydro turbine design and manufacture: GE-Andritz, Voith, Alstom
! 3 different variable speed solutions
! Winner-GE Andritz-triple regulated varspeed bulb

24
Tidal Lagoon Swansea Bay

IEC60193 homologous model testing – guaranteed performance

Our Preferred Contractor (AndritzHydro) has supplied 455 similar design bulb turbines around the world with an installed capacity of over 10GW
Low head hydro bulb turbine – 7.2m runner

Distributor and runner installation

Bulb nose installation

Runner inspection

Andritz Hydro turbine performance data

Tidal Lagoon Swansea Bay:UK supply chain locations

Swansea Bay Tidal Lagoon - direct construction demand

Swansea Bay Tidal Lagoon - direct construction employment

UK contentOffshore Wind Programme Board/BVG Associates methodologyTidal lagoons have 84% UK content throughout their lifetime
• Tidal lagoons have significantly higher UK content across development, capital and operational expenditure• This translates into improved GVA, skills and expertise, taxation and regeneration in deprived areas

Balance of paymentsTidal lagoons divert more spending into the UK across all stages84p of every £1 spent stays in the UK
• Under a CfD, payments from UK consumers to tidal lagoons are recycled back into the UK economy, contributing to GDP and keeping value in the country
• The most recent offshore wind farm to secure a CfD sends most of its subsidy overseas – 57p of every £1

South Wales industrial potential:
Pembroke Docks: Heavy fabrication
Port Talbot Docks: Pre-cast/caisson yard
Newport: Manufacturing logistics centre/Turbine Manufacturing Plant/Generator Manufacturing Plant
Swansea Docks: Turbine Manufacturing Plant
Milford Haven: Caisson yard

Tidal Lagoon Cardiff
Indicative design:Average tide: 9.21mArea: 70km2
Length: 22km Turbines: 90-110Installed cap: 3,240MWOutput: 6TWh p/a
Comfortably enough low carbon electricity to power every home in Wales **Average annual electricity consumption per Welsh household = 3,928 kWh. 1.319m Welsh households
Figures are based on a single indicative design iteration and are not necessary representative of any scheme that may be developed


SWANSEAMATERIAL QUANTITY
CARDIFFMATERIAL QUANTITY
Scaling up from TLSB in a single step

52
CARDIFF
SWANSEA20m
27m
98m
130m
Cardiff cofferdam modification

53
Turbine blocks are based on a scaled-up version of the Swansea Bay design to accommodate a larger 8m turbine and increased tides
Cardiff Swansea Bay
Cardiff powerhouse design modification

SWANSEAVOLUME OF LAGOON
70,000,000 M
CARDIFFVOLUME OF LAGOON
810,000,000 M
Scaling up from TLSB in a single step
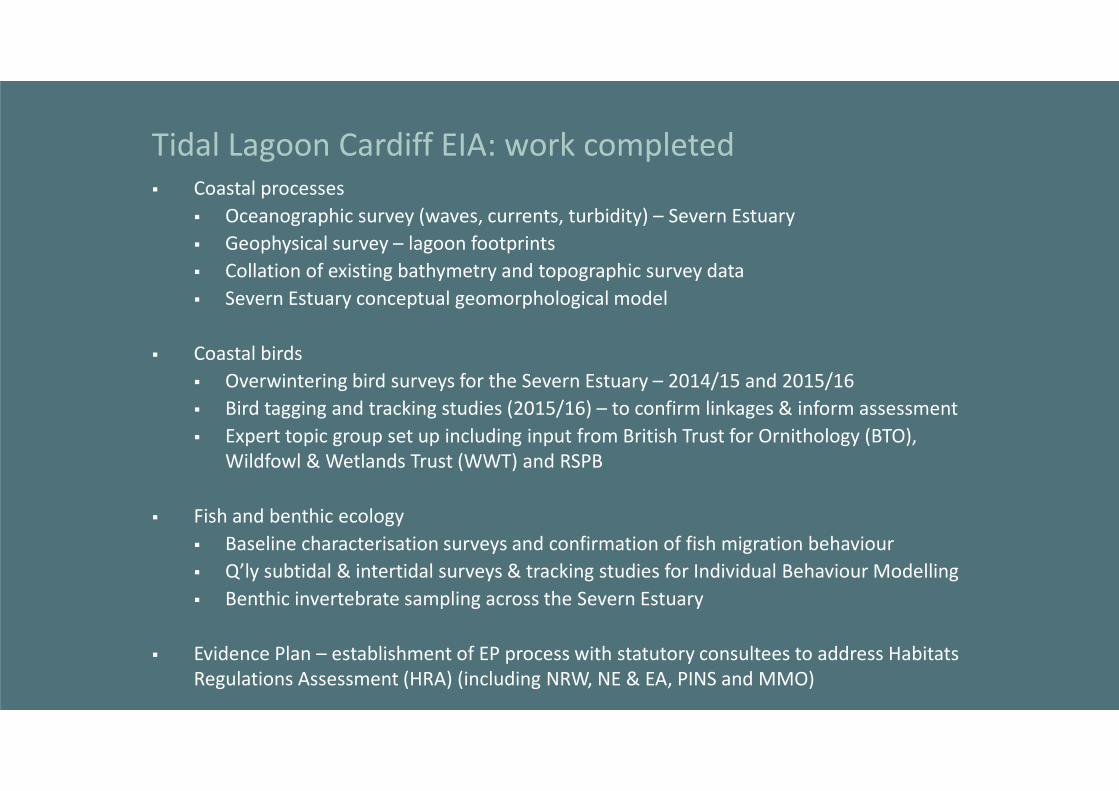
! Coastal processes! Oceanographic survey (waves, currents, turbidity) – Severn Estuary! Geophysical survey – lagoon footprints! Collation of existing bathymetry and topographic survey data! Severn Estuary conceptual geomorphological model
! Coastal birds! Overwintering bird surveys for the Severn Estuary – 2014/15 and 2015/16! Bird tagging and tracking studies (2015/16) – to confirm linkages & inform assessment! Expert topic group set up including input from British Trust for Ornithology (BTO),
Wildfowl & Wetlands Trust (WWT) and RSPB
! Fish and benthic ecology! Baseline characterisation surveys and confirmation of fish migration behaviour! Q’ly subtidal & intertidal surveys & tracking studies for Individual Behaviour Modelling! Benthic invertebrate sampling across the Severn Estuary
! Evidence Plan – establishment of EP process with statutory consultees to address Habitats Regulations Assessment (HRA) (including NRW, NE & EA, PINS and MMO)
Tidal Lagoon Cardiff EIA: work completed

! Steering Group set up – comprised of TLP, NRW, Natural England and Environment Agency. PINS and MMO have a watching brief
! Six Expert Topic Groups (ETGs) set up and meetings held (TLP specialist consultants identified below)! Coastal processes (ABPmer + Intertek re water quality &
JBA on flooding)! Coastal birds (BTO, WWT)! Marine mammals (Natural Power)! Intertidal and subtidal benthic ecology (APEM and Ocean
Ecology)! Fish (APEM and THA)! HRA/WFD/MCZ/Compensation
Evidence Plan process: established

Environmental Enhancement Programme – EEP
! Compensation for lost intertidal areas! Cardiff: potential compensation up to 2,200 ha! Reduced lay-out option for lagoon to reduce this compensation area! Importance for pumping to reduce intertidal loss within the lagoon
footprint! Better operation of the lagoon to reduce intertidal losses

58
Wallasea Island (Alfleets Marsh) Managed Realignment
Stanford Wharf Nature Reserve (London Gateway compensation) Fish migration highway and Fish pass (Rhine west)

A precedent: Wallasea Island
A partnership project between the Environment Agency, the RSPB and CrossRail
Objectives:
! Coastal squeeze compensation! Creation of a major new visitor attraction: quiet enjoyment of nature and open space that will reconnect
people with their coastal heritage, display rich biodiversity and provide a safe haven for birds
! The largest conservation and habitat engineering project of its type in Europe (688ha)! Habitat creation:
! 320ha of mudflats! 160ha of saltmarsh! 96ha shallow saline lagoons! 64ha of brackish grazing marsh! 129ha of pasture
! Completion expected 2025! £100-150m overall project cost (£130-195k/ha)! £5.8m land purchase estimate (£3k/ha)
59

A precedent: Medmerry
An Environment Agency flood defence project that has created a 500ha RSPB reserve.
Project objectives:1. Sustainable flood risk management2. Creation of intertidal habitat to help offset losses elsewhere
in the Solent3. Community involvement in the scheme
development (the Medmerry Stakeholder Advisory Group was established in 2009)
Achievements:• Constructed in 2 years (£35M project cost)• 13 industry awards in 2014 alone, including The Prime
Minister’s Better Public Building Award (previous winners include the Tate Modern)
• Species success: in 2015, avocet, dunlin, wigeon, knot and grey plover have all be seen using the reserve, along with redshank, oystercatcher, lapwing and little ternAnd now sharks!
60

Coastal processes – geophysical & oceanographic surveys complete
Terrain model from aerial LiDAR & bathymetry surveys
Seabed relief and magnetometer surveys
Rockhead depth

Oceanographic surveys – Severn Estuary
Surveys to inform coastal processes modelling
! Waves! Currents! Turbidity

Bathymetry & topographic data collated from multiple sources
Data collated from: TLP Survey work; Ports; UKHO; NRW; EA

! Fundamental initial step for the TLP team and ETG is to agree the use of a model with appropriate boundaries to ensure robust assessment of both project and cumulative effects.
! Coastal processes model will also form the basis of the water quality and flooding assessments and support other assessments.
! Coastal processes model proposed was that used for the DECC (2010) STP SEA.
! Key project specific surveys undertaken and ongoing to assist in this process and refinement of the model grid.
Coastal processes model overview

Model boundaries


67
Coastal processes – TLC flow speed changes
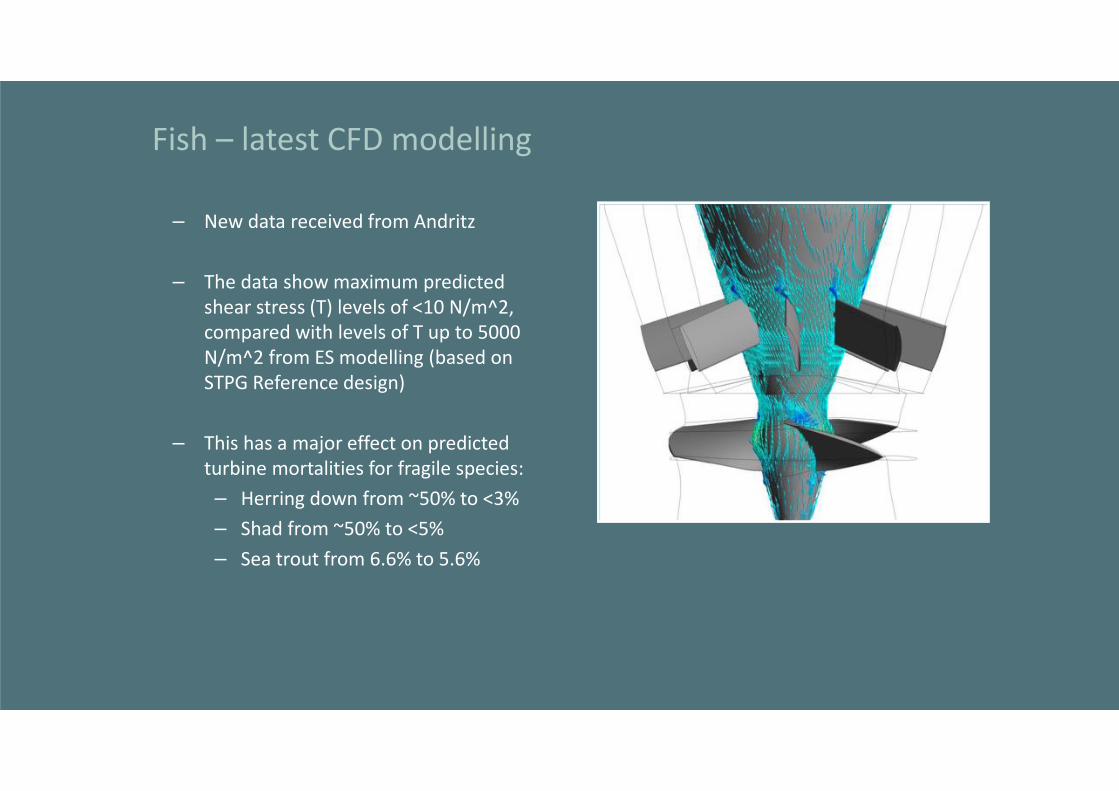
Fish – latest CFD modelling
– New data received from Andritz
– The data show maximum predicted shear stress (Τ) levels of <10 N/m^2, compared with levels of Τ up to 5000 N/m^2 from ES modelling (based on STPG Reference design)
– This has a major effect on predicted turbine mortalities for fragile species:– Herring down from ~50% to <3%– Shad from ~50% to <5%– Sea trout from 6.6% to 5.6%

Fish – subtidal surveys

! Annual volume of deposition: 4 to 10 million tons! Needs to be removed by maintenance dredging

Tides in the estuary are reduced due to the presence of the lagoon

Coastal birds – work completed
72
• Overwintering Bird Surveys – Cardiff/Newport footprints & full survey of Severn Estuary SPA (2014/16)
• Bird GPS tagging & tracking studies – to confirm how birds currently use the estuary & associated freshwater habitats (2015/16)
• Benthic Invertebrate Surveys – sampling to inform Individual Based Modelling (IBM) for birds – 200 locations throughout the estuary

Fish – work completed
73
• Quarterly subtidal & intertidal surveys – baseline characterisation surveys since 2015 – Welsh & English waters
• Migratory fish tagging & tracking studies – work in Swansea to inform future modelling & impact assessment work

Swansea Bay:Strike Price behaviour under the HM Treasury structure
[SERIES NAME]
[SERIES NAME]
[SERIES NAME]
[SERIES NAME]
[SERIES NAME]
[SERIES NAME]
0
20
40
60
80
100
120
140
160
2017
2020
2023
2026
2029
2032
2035
2038
2041
2044
2047
2050
2053
2056
2059
2062
2065
2068
2071
2074
2077
2080
2083
2086
2089
2092
2095
2098
2101
2104
2107
2110
2113
£201
2/M
Wh
2012 real Strike Price
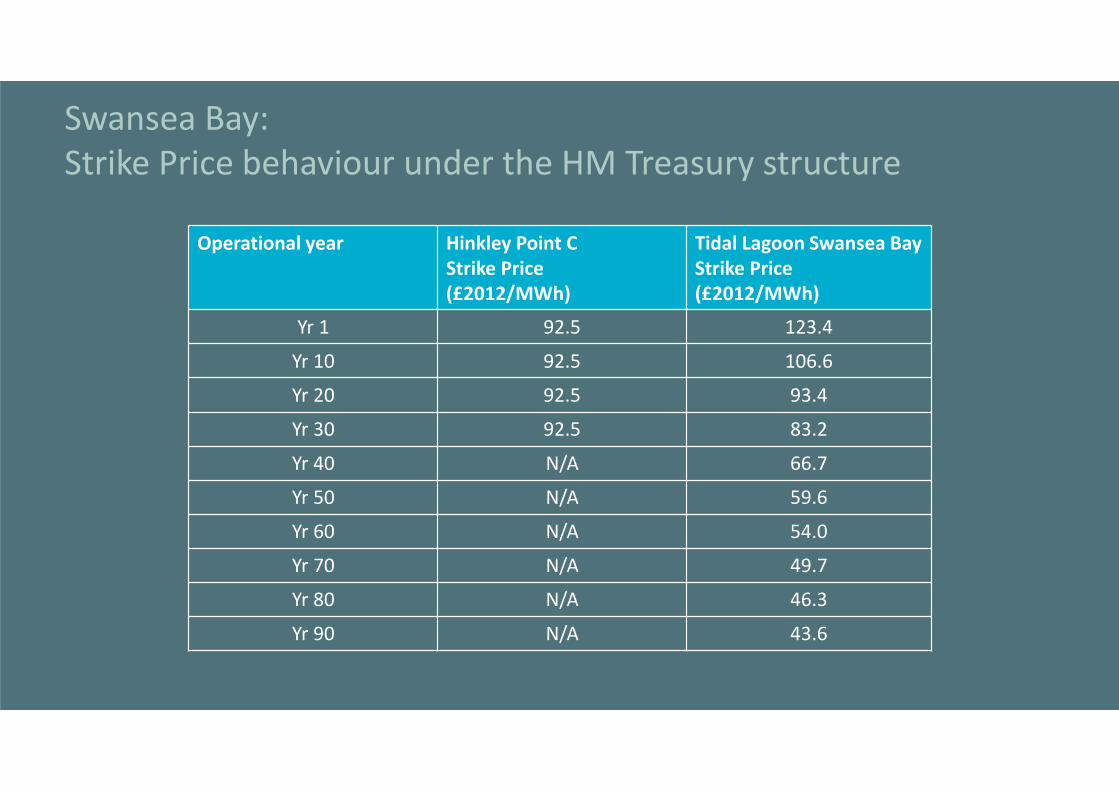
Swansea Bay:Strike Price behaviour under the HM Treasury structure
Operational year Hinkley Point CStrike Price(£2012/MWh)
Tidal Lagoon Swansea BayStrike Price(£2012/MWh)
Yr 1 92.5 123.4
Yr 10 92.5 106.6
Yr 20 92.5 93.4
Yr 30 92.5 83.2
Yr 40 N/A 66.7
Yr 50 N/A 59.6
Yr 60 N/A 54.0
Yr 70 N/A 49.7
Yr 80 N/A 46.3
Yr 90 N/A 43.6

Debt amortization – 35 year structureRelative to technology lifetime, short term CfD structures force inefficient debt amortisation
- x
0.50x
1.00x
1.50x
2.00x
2.50x
3.00x
0
200
400
600
800
1,000
1,200
1,400
1,600
1,800
2,000
2015 2019 2023 2027 2031 2035 2039 2043 2047 2051 2055 2059 2063 2067 2071 2075 2079 2083 2087 2091 2095 2099 2103 2107
£m
Refinancing - nominal debt Bond Index Linked Debt - Real Bank Debt
Mezz Private Placement EIB Refinancing - index linked debt
Index-Linked Debt - Nominal Avg DSCR

Debt amortization – 90 year structureStructuring debt amortisation to complement the longevity of the technology dramatically improves efficiency, reducing overall subsidy requirements by 50%
- x
0.50x
1.00x
1.50x
2.00x
2.50x
-200
0
200
400
600
800
1,000
1,200
1,400
2015 2020 2025 2030 2035 2040 2045 2050 2055 2060 2065 2070 2075 2080 2085 2090 2095 2100 2105
£m
Refinancing - nominal debt Bank Debt Index-Linked Debt - Nominal
Avg DSCR Backward Looking ADSCR - Total Debt


HM Treasury structure:Optimisation mechanisms
Mechanism Rationale
Partial indexation of Strike Price High capex, low opex project – efficient financing, reduces overall subsidy
CfD term Allows long term debt – efficient financing
Capex protections None. Equity take construction risk
Cost of debt mechanism Minimised refinancing risk during operations
Refinancing risk £50m refinance gain assumed in the base case – at Equity risk
HMG grant Reduces overall subsidy requirement
HMG sharing mechanisms Reduces overall subsidy requirement
Cardiff payment Reduces overall subsidy requirement

Annual take of LCFPartially indexed strike prices mean the tidal lagoon take of the LCF decreases year on year
LCF assumed to remain at 2020/21 level of £7.6bn annually, in 2012 terms
If LCF is larger in reality, percentages will be lower
At a level of £10bn, all tidal lagoon figures would be under 2%
Power station Year 1 Year 5 Year 10 Year 35
Tidal Lagoon Swansea Bay 0.41% 0.36% 0.32% 0.14%
Tidal Lagoon Cardiff 2.06% 1.83% 1.33% -0.10%
Swansea & Cardiff 2.47% 2.19% 1.65% 0.04%
Hinkley Point C 9.67% 10.22% 9.87% 11.70%

Impact on consumer billsTidal lagoons have a low overall impact on bills – less so year on year
Project Technology Capacity Annual cost per household Impact on unit rateMW £2016/yr p2016/kWh
Tidal Lagoon Swansea Bay (30 yr average) Tidal lagoon 320 0.31 0.008
Tidal Lagoon Cardiff (30 yr average) Tidal lagoon 2,700 1.20 0.030
Hinkley Point C (CfD average) New nuclear 3,200 12.06 0.305
Burbo Bank Ex. (CfD average) Offshore wind 258 1.16 0.029
East Anglia 1 (CfD average) Offshore wind 714 2.18 0.055
Drax Unit 1 (CfD average) Biomass conversion 600 2.63 0.066
New CCGT (lifetime average) CCGT 880 2.18 0.055
Project Technology Capacity Annual cost per household Impact on unit rate
MW £2016/yr p2016/kWh
Tidal Lagoon Swansea Bay (60 yr average) Tidal lagoon 320 0.18 0.005
Tidal Lagoon Cardiff (60 yr average) Tidal lagoon 2,700 0.31 0.008
Hinkley Point C (60 yr average) New nuclear 3,200 7.03 0.178
Burbo Bank Ex. (60 yr average) Offshore wind 258 0.44 0.011
East Anglia 1 (60 yr average) Offshore wind 714 0.96 0.024
New CCGT (60 yr average) CCGT 880 2.23 0.057
CfD term or 30 year average
60 year average*
*Assumes new power stations are built to replace retired ones if required, at a reduced cost for offshore wind (£85/MWh, 2012prices), CCGT case is based on an LCOE of £80/MWh, 2012 prices
• Partial indexation means the consumer impact of tidal lagoons diminishes over time, competitive over the short term, they can provide improving value for money over the long term

60 year regret – wind and nuclear scenariosTidal lagoons represent ‘no-regrets options’ even under aggressive cost reductions for wind and new nuclear together
60 year regret - net subsidy position per equivalent MW (£'000)
Aurora assumptions
40% 66.0 (607) (502) (377) (188)
30% 77.0 (972) (867) (741) (553)
20% 88.0 (1,336) (1,231) (1,106) (917)
10% 99.0 (1,701) (1,596) (1,470) (1,282)
0% 110.0 (2,065) (1,961) (1,835) (1,647)
95.0 92.5 89.5 85.0
New nuclear price (£2012/MWh)
Decline in offshore wind CfD
price 2025 (£2012/MWh)
Wind starting point uses Aurora Energy Research assumptionsCosts of a wind and nuclear MW are scaled to represent the same volume of MWh delivered over a 60 year periodWind price evolution from starting 2025 price is based on middle scenario of 30% cost reduction per 15 year cycle and convergence on £60/MWh

System impacts of tidal lagoons: Aurora Energy Research study• 25GW of tidal lagoons would require
£0.7bn of system spending• This provides over 10% of the UK’s
energy requirement• CO2 emissions would be reduced by
36% in 2036 – a 130MT saving on the system between 2020-2040
• 25GW of tidal lagoons provide £270m of savings in the balancing mechanism compared to wind
• Tidal lagoons have lower intermittency costs than wind and solar
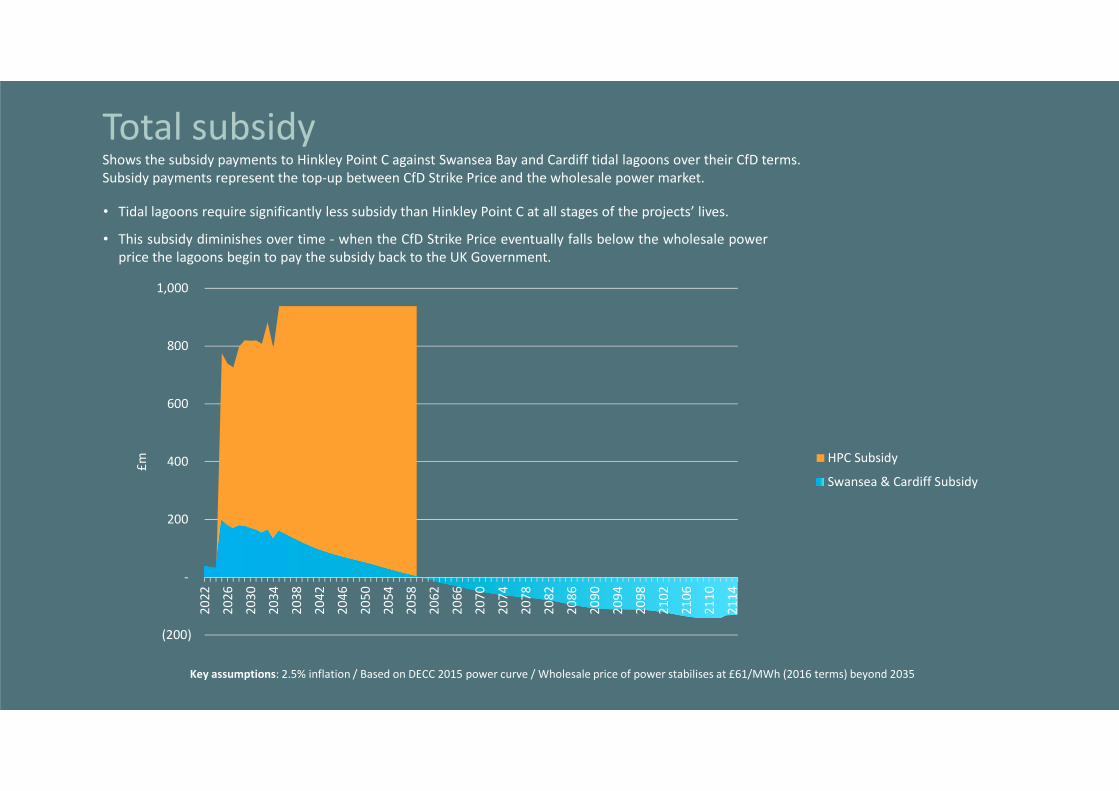
Total subsidyShows the subsidy payments to Hinkley Point C against Swansea Bay and Cardiff tidal lagoons over their CfD terms.Subsidy payments represent the top-up between CfD Strike Price and the wholesale power market.
• Tidal lagoons require significantly less subsidy than Hinkley Point C at all stages of the projects’ lives.
• This subsidy diminishes over time - when the CfD Strike Price eventually falls below the wholesale powerprice the lagoons begin to pay the subsidy back to the UK Government.
Key assumptions: 2.5% inflation / Based on DECC 2015 power curve / Wholesale price of power stabilises at £61/MWh (2016 terms) beyond 2035
(200)
-
200
400
600
800
1,000
2022
2026
2030
2034
2038
2042
2046
2050
2054
2058
2062
2066
2070
2074
2078
2082
2086
2090
2094
2098
2102
2106
2110
2114
£m
HPC Subsidy
Swansea & Cardiff Subsidy

0
1
2
3
4
5
6
7
8
9
10
Output Subsidy
Ratio Hinkley Point C
Swansea & Cardiff tidal lagoons (blended)
Hinkley Point C vs. Swansea Bay and Cardiff tidal lagoonsHead-to-head relative comparison over their respective CfD terms:
Key assumptions: 2.5% inflation / Based on DECC 2015 power curve / Wholesale price of power stabilises at £61/MWh (2016 terms) beyond 2035
Chart illustrates the ratio of electricitygenerated and subsidy received over CfDterm between Swansea Bay and Cardifftidal lagoons (combined capacity of3,560MW with a 90 year CfD) and HinkleyPoint C nuclear power station (capacity of3,200MW with a 35 year CfD).

86
1914
Global potential – France, India, China & Canada:Large scope for exports from UK supply chain
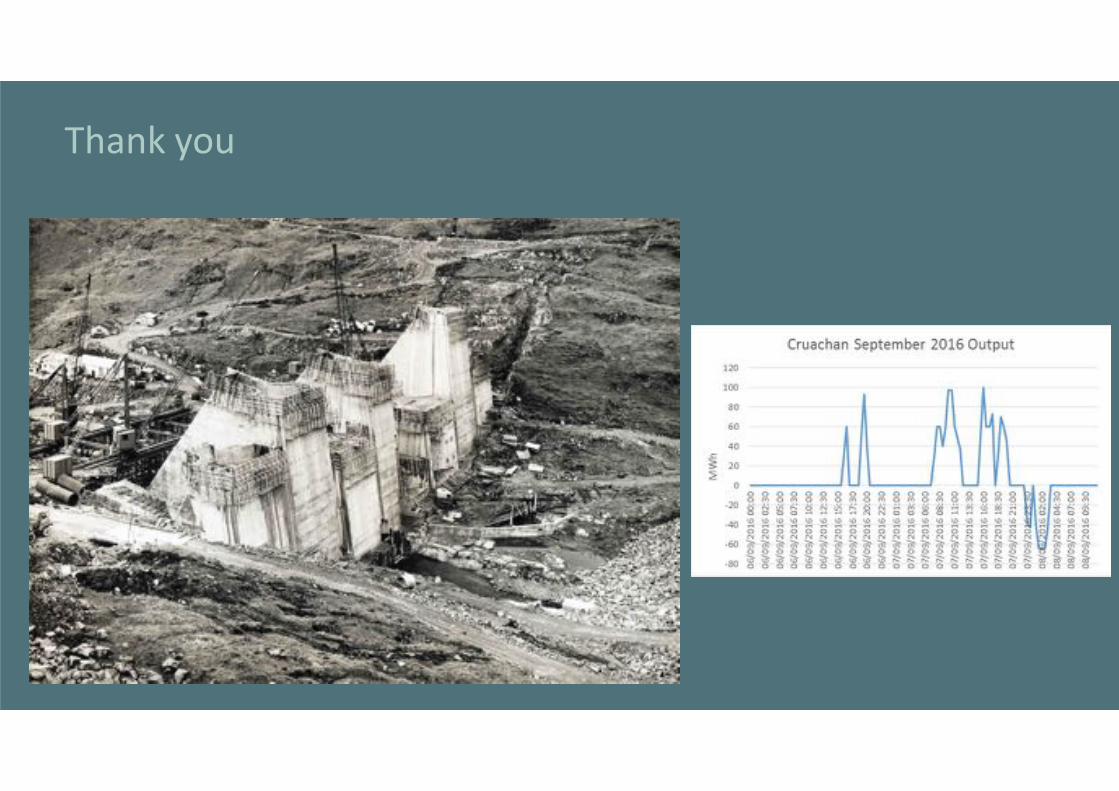
Thank you


![Esitys tarjouskilpailuun perustuvasta ... · Uusiutuvan energian pienyksikkö: vuosituotanto max 10 000 MWh [min. vuosituotanto 800 MWh] Tarjous Preemio €/MWh Vuosituotanto MWh](https://static.cupdf.com/doc/110x72/5f68f0e09636bc7f4a5fd91e/esitys-tarjouskilpailuun-perustuvasta-uusiutuvan-energian-pienyksikk-vuosituotanto.jpg)


