Tectonophysics, 185 (1991) 277-294
Elsevier Science Publishers B.V., Amsterdam
277
Maximum likelihood estimation of earthquake hazard parameters in the Aegean area from mixed data
Gerassimos A. Papadopoulos a*b~l and Andrzej Kijko ’
a Department of Civil Engineering. Hellenic Air Force Academy, Dekelia, Attika, Greece
b Department of Natural Disasters, Ministry of Environment, Physical Planning and Public Works,
2 Panormou Str., 11523 Athens, Greece
’ Institute of Geophysics, Polish Academy of Sciences, fiiecia Janusza 64, 01-452 Warsaw, Poland
(Received February 25,199O; revised version accepted May 29,199O)
ABSTRACT
Papadopoulos, G.A. and Kijko, A., 1991. Maximum likelihood estimation of earthquake hazard parameters in the Aegean area from mixed data. Tectonophysics, 185: 277-294.
The maximum likelihood estimation of earthquake hazard parameters has been made in the Aegean and adjacent regions
on the basis of a procedure which utilizes mixed data containing incomplete files of large historical events, and complete files
of most recent earthquakes. The entire earthquake catalog used covers the period from 479 B.C. to 1985 A.D. The maximum
regional magnitude, M,,,,, the activity rate of the seismic events, the mean return period, R, of earthquakes with a certain
lower magnitude M> m, as well as the parameter b of the magnitude-frequency relationship have been determined for
eighteen different seismotectonic segments, the fore-arc and back-arc regions, and the area examined as an entity. The
determination has also been carried out for sub-crustal shocks in the south Aegean. Assuming that the earthquake hazard is an
increasing function of M,,,, and a decreasing function of R, we suggested a relative hazard scale to classify segments by
hazard level based on their M_ and R. It is shown that in general the hazard is higher in the back-arc segments than in the
fore-arc ones. High differences of the b parameter and the hazard level from segment to segment reflect the high seismotectonic complexity and crustal heterogeneity.
Introduction
The term “natural hazard” refers to a poten- tially damaging or destructive natural event such
as an earthquake, volcanic eruption, tsunami etc.
Here the term “seismic hazard” is used to describe
earthquake size measured by surface-wave magni-
tude, M.
Seismic hazard studies in the Aegean region
have been published by several authors cited in
the relevant works of B&h (1983a, b) and Malcro-
poulos and Burton (1985). The seismic activity in
this region is extremely high and much has oc-
curred within the historical period. One would,
’ Address for correspondence: 98 Mavromichali Str., 11472 In this paper we use this approach to estimate
Athens, Greece. seismic hazard parameters in several seismo-
therefore, expect a considerable amount of seismo-
logical information to be available. However, the
incompleteness of the data, even for earthquakes
of large magnitude, make the existing historical
catalogs unsuitable for use in seismic hazard
evaluation based on most methods proposed. Nev-
ertheless, Kijko and Sellevoll (1987; 1989) have
developed an approach utilizing the information
on strong events contained in the macroseismic
part of catalog as well as that contained in the
complete catalog. Hereafter we use “subcatalog”
to refer to any part of the catalog which contains
complete data above a certain magnitude
threshold. The part of catalog covered by the
subcatalogs is called the “complete part” while the
remaining is the “extreme part” of the catalog.
oo40-1951/91/$03.50 0 1991 - Elsevier Science Publishers B.V.
278
tectonic segments of the Aegean and adjacent regions. Such a study is of importance for two main reasons:
(1) We evaluate hazard parameters utilizing as much as possible seismological ~fo~ation not only from the instrumental period, i.e., the time during which measurements were made but also the many hundreds of years previous to this of the historic era. In other words, we use historical seismological information not used so far in Aegean hazard determination.
(2) Tbe application of that approach in a region with high seismotectonic complexity and high seismicity is a good methodological test offering a suitable basis for seismotectonic discussions.
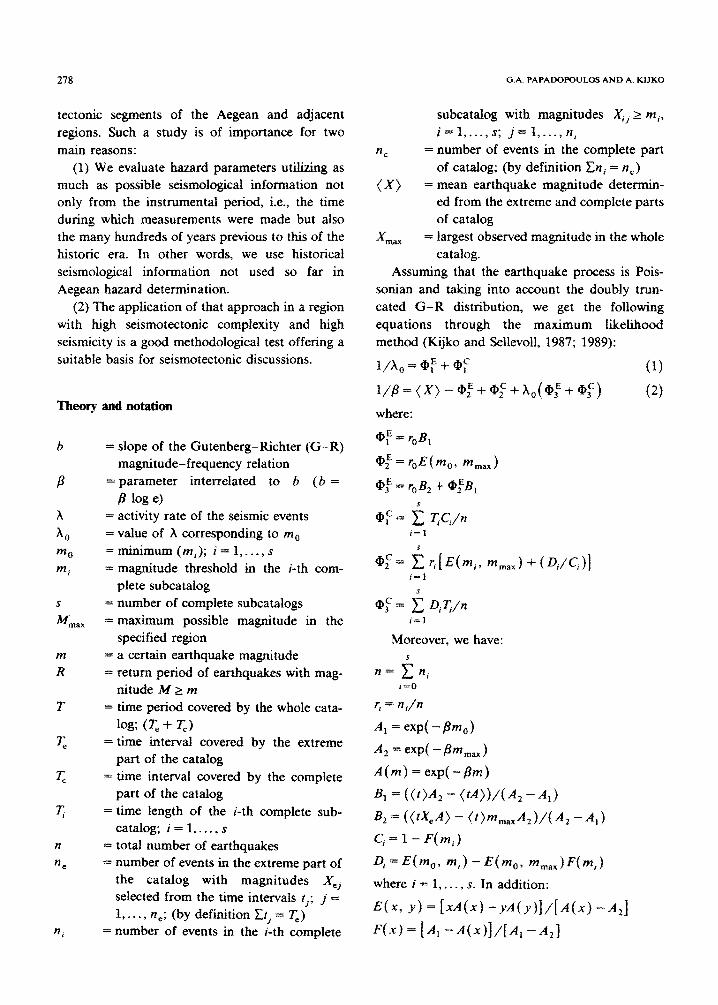
Theory and notation
b = slope of the Gutenberg-Richter (G-R) magnitude-frequency relation
P = parameter interrelated to b (b =
8 log el x = activity rate of the seismic events
x0 = value of X corresponding to mO
m0 =~~rnurn(rn~); i=l,...,s
“I = magnitude threshold in the i-th com- plete subcatalog
.s = number of complete subcatalogs M *ax = maximum possible magnitude in the
specified region m = a certain earthquake magnitude R = return period of earthquakes with mag-
nitude M 2 m T = time period covered by the whole cata-
log; (T, + T,)
T, = time interval covered by the extreme part of the catalog
T, = time interval covered by the complete part of the catalog
77 = time length of the i-th complete sub- catalog; i = 1,. . . , s
n = total number of earthquakes
a, = number of events in the extreme part of the catalog with magnitudes Xej selected from the time intervals r,; J’ = 1 , - *. , ne; (by definition El, = T,)
ni = number of events in the i-th complete
nc
(X>
X max
G.A. PAPADOFOULOS AND A. KIJKO
subcatalog with magnitudes Xi, 2 mj, i=f ‘.‘., s; j = 1,. . . , n,
= number of events in the complete part of catalog; (by definition Ez, = n,)
= mean earthquake magnitude determin- ed from the extreme and complete parts of catalog
= largest observed magnitude in the whole catalog.
Assuming that the earthquake process is Pois-
sonian and taking into account the doubly trun- cated G-R dist~bution, we get the fo~o~g equations through the maximum likelihood method (Kijko and Sellevoll, 1987; 1989):
l/X, = cpl” + ta; (1)
l/~=(x)-Q1~+~,f+xO(cp~+Qh,c) (2)
where:
*): = roB,
i=l
i=l
Moreover, we have: s
n= Cn, I=0
r, = ni/n
A, = exp( - Bmo)
A2 = exp( - Pmmax )
A(m) =exp(-Pm)
4 = f WAz - (tA))/( A, - A,)
4 = (O&A) - Wm,,A,V(A, -A,)
ci=l-F(mj)
4 = E(mov mi) - Etm,, m~~~)~(mi)
where i = 1,. . . , s. In addition:
E(x, Y) = [xA(x) -y~f~k’[A~~) -A,]
F(x) = [A, - A(x)],&% -A,]
ESTIMATION OF GsRTHQUAKE HAZARD PARAMETERS IN THE AEGEAN
and:
where the summation is from i = I,. . . ) n,.
The indices E and C are introduced in order to distinguish different sources of functions @. If they are derived from the extreme part of catalog, they are marked as E. Otherwise they follow from the complete parts (subcatalogs) and are marked
as C. Introducing the condition that the largest ob-
served magnitude, X,,,,,, is equal to the largest expected magnitude in the span of the whole
catalog, T, we get:
X max = EXPECTED{ x,,, 1 Ii’>
where (Kijko, 1988):
EXPECTEDC xmax \ T)
Jw-z2) - E;W,) = mmax -
B exp( - TZ,l
- m, exp( - h,T)
(3)
In eqn. (3) Z, =AA,, 2, =hA2, x = &,/(A, -
A,) and E,(.) denotes an exponential integral function. By introducing the condition (3) into relations (1) and f2), we obtain a set of equations determining the maximum likelihood solution, which can be solved by iteration.
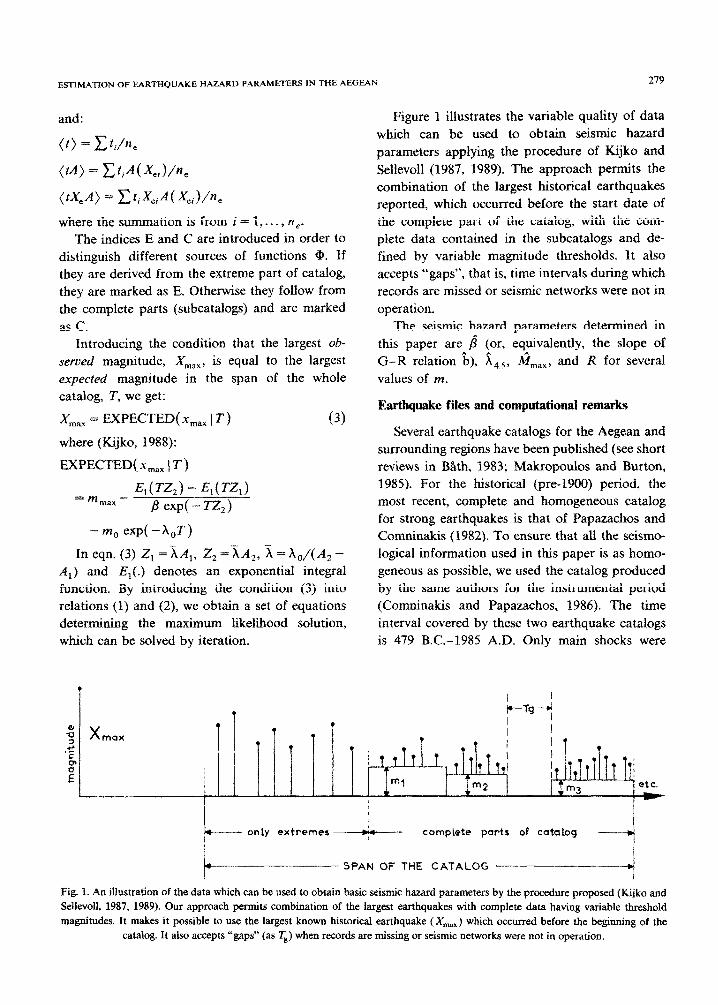
Figure 1 illustrates the variable quality of data
which can be used to obtain seismic hazard
parameters applying the procedure of Kijko and
279
Sellevoll (1987, 1989). The approach permits the combination of the largest historical earthquakes reported, which occurred before the start date of the complete part of the catalog, with the com- plete data contained in the subcatalogs and de- fined by variable magnitude thresholds. It also accepts “gaps”, that is, time intervals during which records are missed or seismic networks were not in
operation. The seismic hazard parameters dete~ned in
this paper are b (or, equivalently, the slope of G-R relation b), i4,5, J&,,,,, and R for several values of m.
Earthquake files and computational remarks
Several earthquake catalogs for the Aegean and surrounding regions have been published (see short reviews in B&h, 1983; Makropoulos and Burton, 1985). For the historical (pre-19~) period, the most recent, complete and homogeneous catalog for strong earthqu~es is that of Pap~chos and Comninakis (1982). To ensure that all the seismo- logical information used in this paper is as homo- geneous as possible, we used the catalog produced by the same authors for the instrumental period (Comninakis and Papazachos, 1986). The time interval covered by these two earthquake catalogs is 479 B.C.-1985 A.D. Only main shocks were
I+---- only extremes + compiete parts ot catalog I
I-- SPAN OF THE CATALOG ~
-___..
Fig. 1. An illustration of the data which can be used to obtain basic seismic hazard parameters by the procedure proposed (Kijko and Sellevoll, 1987, 1989). Our approach permits combination of the largest earthquakes with complete data having variable threshold magnitudes. It makes it possible to use the largest known historical earthquake (X_) which occurred before the beginning of the
catalog. It also accepts “gaps” (as Ts) when records are missing or seismic networks were not in operation.
280 G.A. PAPADOPOULOS AND A. KIJKO
considered. ~on~quently, the results of the seismic
hazard determination concern background seismic
activity from main shocks,
The plot of earthquake magnitude versus frequency or other statistical tests which have been used by various authors, indicate that the completeness of our earthqu~e data is different for different time intervals. Before 1800 A.D. it
seems impossible to define a ma~itude level above which the data can be considered as complete.
Thus, the pre-1800 period constitutes the extreme
part of our whole catalog (covering the time inter- val from 479 B.C. to 1799 A.D.). For c~nve~en~e we changed 479 B.C. to 500 B.C., so that T = 2486 y. The remai~ng material, from the interval 1800-1985 is the complete part of the catalog.
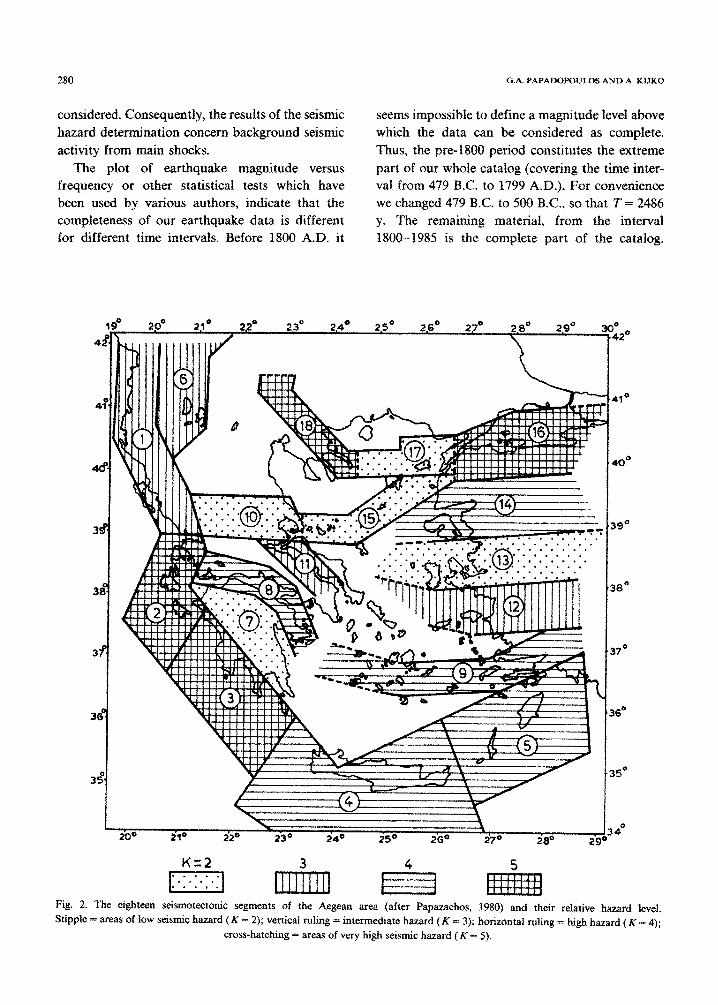
Fig. 2. The eighteen seismotectonic segments of the Aegean area (after Papazachos, 1980) and their relative hazard level. Stipple = areas of low seismic hazard (K = 2); vertical ruling = intermediate hazard (K = 3); horizontal ruling = high hazard (K = 4);
cross-hatching = areas of very high seismic hazard ( K = 5).
ESTIMATION OF EARTHQUAKE HAZARD PARAMETERS IN THE AEGEAN 281
TABLE 1
Earthquake subcatalogs defined for the period 1800-1985 on
the basis of the magnitude threshold, mi. Also @en is the time
interval 7; for which the data are complete
Subcataiog
i=l (C) 1800-1910 6.5
=l (I) 1800-1910 6.9
= 2 (C, I) 1911-1949 5.2
= 3 (C, I) 1950-1963 4.8
= 4 (C, I) 1964-1985 4.5
C = crustal shocks; I = intermediate depth shocks.
This has been divided into subcatalogs (s = 4),
with different magnitude thresholds as indicated
in Table 1. It is obvious that T, = 186 y.
It was assumed that for all cases, the maximum
observed magnitude X,,,,, was determined with
standard error, ox, equal to l/4. The approximate
standard deviation of km,, is (Kijko and Selle-
~011, 1987, 1989):
IJ msx = rux
where r is a “transmission coefficient” which
transmits the uncertainties in X,,, into the uncer-
tainties of #._,.
The Aegean region is highly complicated from
seismotectonic point of view (e.g. Papadopoulos et
al., 1986) and for this reason we evaluated seismic
hazard parameters for several seismotectonic seg-
ments. Based on several criteria such as fault
plane solutions, seismicity rates, etc., Papazachos
(1980), divided the whole region into nineteen
distinct seismotectonic segments. The nineteenth
segment, however, located in northern Greece,
seems to be only a part of the shallow seismic
activity occurring even more to the north in the
area of Bulgaria. Therefore, this segment has not
been considered here. Figure 2 shows the eighteen
segments for which hazard parameters have been
estimated.
The first five segments (l-5) constitute the
outer or fore-arc seismic zone while the remaining
segments (6-18) form the inner or back-arc seismic
zone. Seismic hazard parameters are also esti-
mated for these two zones and the area as a whole
(l-18), as well as for intermediate depth earth-
quakes (IDE) (h 2 70 km) occurring in the South
Aegean as a result of the active subduction of the
Mediterranean lithosphere.
One problem we faced in applying the method
summarized earlier is the small number of events
in the extreme part of the catalog. In the cases
where there were only a few events in a long time
span (the extreme part of the catalog), and many
events in a complete subcatalog, that is, in a short
time span, the inversion procedure is very sensitive
and strongly disturbed, resulting in meaningless
parameter estimation. Consequently, if, for a
specified segment, the extreme part of catalog
contained no more than four events (n, c 5) we
omitted them from the computations. The method
of kI-&Z. evaluation was performed using the largest
earthquake, X,,, , that ever occurred in the entire
TABLE 2
Description of the input data used for seismic hazard evahra-
tion in the Aegean and surrounding regions
Segment T, “e T, “c X max
1 2300 10 186 144 6.9
2 2300 22 186 116 7.3
3 0 0 186 85 7.5
4 2300 7 186 191 7.1
5 0 0 186 116 7.2
6 0 0 76 40 6.9
7 0 0 76 30 7.0
8 2300 8 186 65 7.3
9 2300 8 76 54 7.5
10 2300 6 76 33 7.0
11 0 0 186 16 7.1
12 0 0 186 28 7.1
13 2300 9 186 51 7.1
14 0 0 186 41 7.2
15 0 0 76 36 7.1
16 2300 25 186 30 7.8
17 23M1 6 186 21 7.0
18 0 0 186 25 7.8
l- 5 2300 43 186 652 7.5
6-18 2300 72 186 470 7.8
l-18 2300 11.5 186 1122 7.8
IDEE 2300 4 186 164 8.3
IDEC 0 0 186 164 8.3
T,. T,, T, n,, n,, and X,,,,, are explained in the text. T = 2486
y for ail segments. X,, is expressed in surface-wave magni-
tude, M. IDEE = intermediate depth earthquakes from both
the extreme and complete parts of the cataiog; IDEC = IDE
from only the complete part of the catalog. The segments are
shown in Fig. 2.
282 G.A. PAPADOPOULOS AND A. KIJKQ
TABLE 3
Information contributed by the complete parts of the catalog in the determination of the hazard parameters
Segment i=l i=2 i=3
6 IW .x PI a l%l x WI p^ I%1
I 5.8 6.5 12.0 20.8 0.9 2 11.2 6.5 6.0 18.8 2.8
3 24.9 5.9 30.3 8.3 14.5 4 7.1 1.0 17.9 15.2 6.8
5 17.1 2.6 33.2 13.8 10.3 6 45.8 22.5 10.9
7 _ 47.9 23.3 19.8 8 8.3 9.6 5.2 17.8 0.7
9 _ 9.8 16.2 3.6 10 9.3 10.4 3.5
11 26.9 6.3 36.6 31.3 7.6 12 36.3 14.2 22.6 17.9 9.9
13 6.7 10.0 8.7 6.7 2.7
14 33.4 9.8 25.8 12.2 9.6 15 _ _ 45.0 19.4 17.3 16 6.8 5.5 2.8 5.5 0.3
17 11.2 14.8 3.2 3.7 2.5 18 43.8 12.0 20.1 28.0 5.5 l- 5 6.5 7.0 12.0 15.6 4.5 6-18 7.4 6.1 5.1 14.7 1.1 1-18 7.1 5.1 6.8 15.6 1.5
IDEE 3.7 5.3 6.6 22.9 1.3
IDEC 31.7 5.5 26.8 23.8 8.3
The number of each subcatalog, i, refers to Table 1. IDEE and IDEC as in Table 2.
i=4
fi l%l B 1st A PI
6.5 15.2 59.7
16.7 12.0 42.0
21.2 30.2 64.7
16.2 16.3 64.5
13.8 39.4 69.8
10.0 43.3 67.5
23.3 32.3 53.4
11.0 11.3 50.7
14.6 8.1 56.8
12.9 7.9 62.0
12.5 28.9 49.9
17.9 31.2 50.0
8.4 9.7 60.2
14.6 31.3 63.4
19.4 37.7 61.1
7.3 10.8 36.4
14.8 16.8 44.4
12.0 30.0 48.0
13.9 10.3 57.9 12.7 11.3 53.2
12.6 12.3 57.4
14.1 10.3 54.1
14.6 33.2 56.1
interval, T. If &,,,, takes the value of X,,,, we
finally obtain k,,,,, = X,,, + 0.1.
Seismic hazard parameters for the segments 1,
2, 4, 8, 9, 10, 13, 16, 17, l-5, 6-18, and 1-18 were
calculated utilizing both the complete and extreme
parts of the catalog. Only complete data (four
complete subcatalogs) were used to estimate
hazard parameters for the segments 3, 5, 6, 7, 11,
12, 14, 15, and 18.
The number of reported intermediate depth
earthquakes which occurred before 1800 is ne = 4
< 5. In this case we made two alternative calcula-
tions; one using only the complete part of the
catalog and another using both extreme and com-
plete data. The results obtained by both calcula-
tions are given in order to point out the dis-
crepancy between them.
Table 2 summarizes the input data used for the
seismic hazard estimation in the Aegean seismo-
tectonic segments, while Table 3 shows the per-
centage of information contributed from the four
complete subcatalogs in the determination of the
hazard parameters.
Results
The values obtained of the parameter 6 are
shown in Table 4. The slope b’ of the G-R
relation determined by other authors by the least-
squares method is also given for comparison. Ta-
ble 5 provides the estimated values of seismic
hazard parameters &,,,,, fi,.,, and R for several
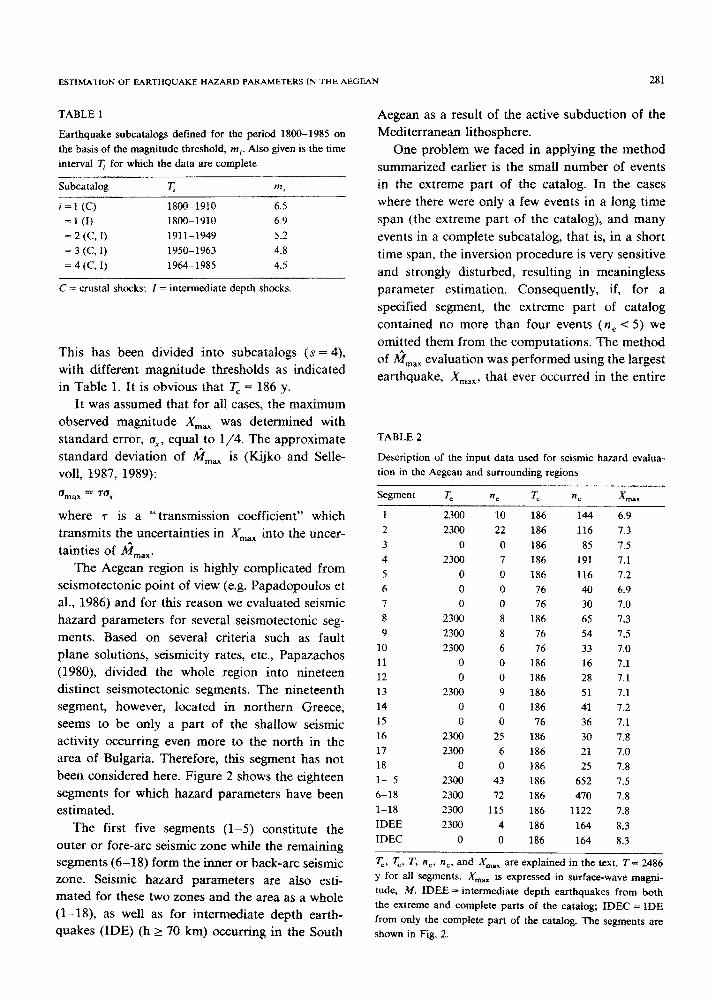
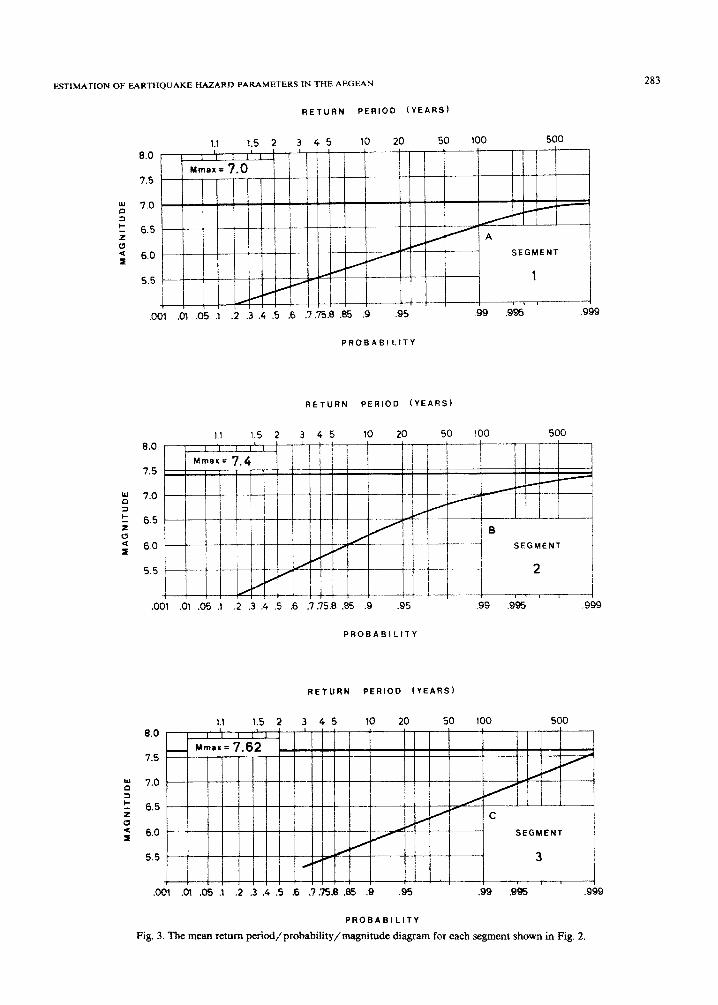
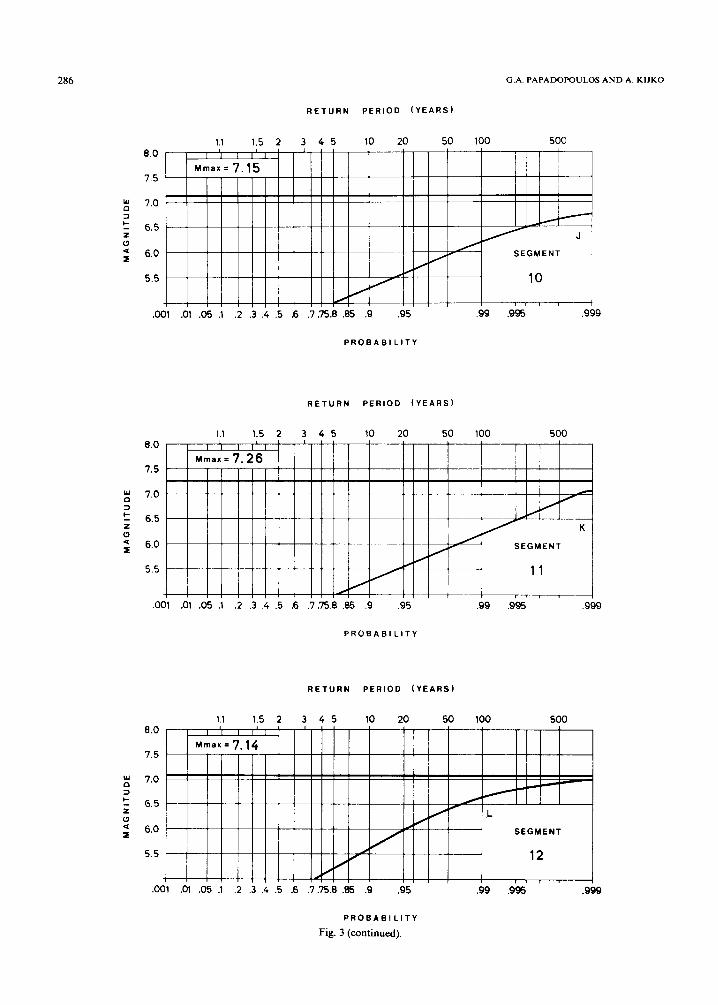
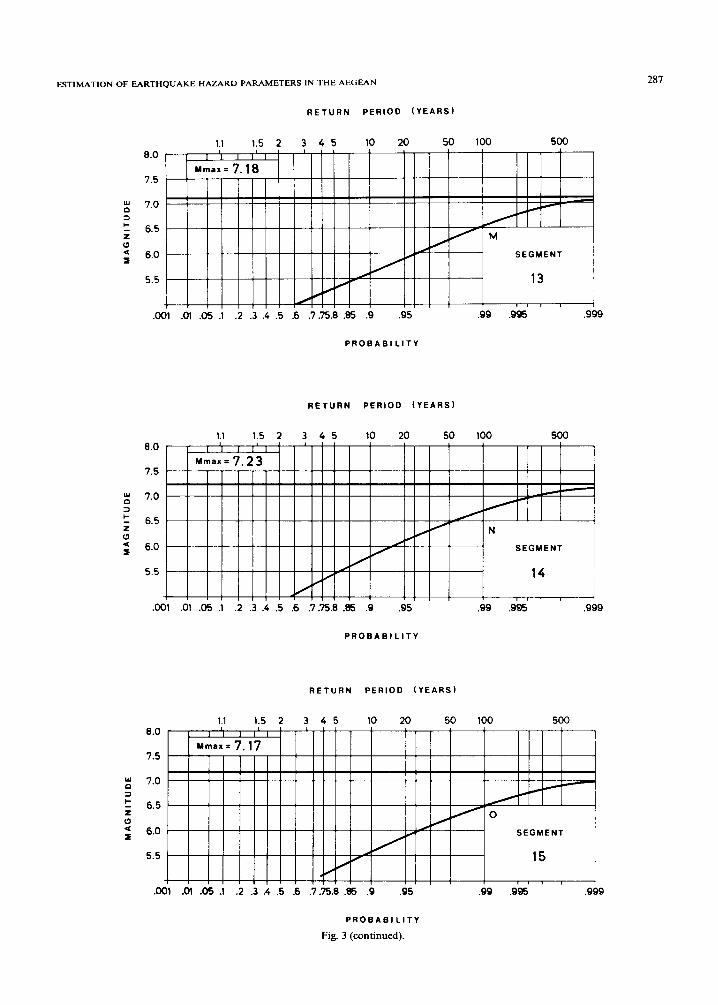
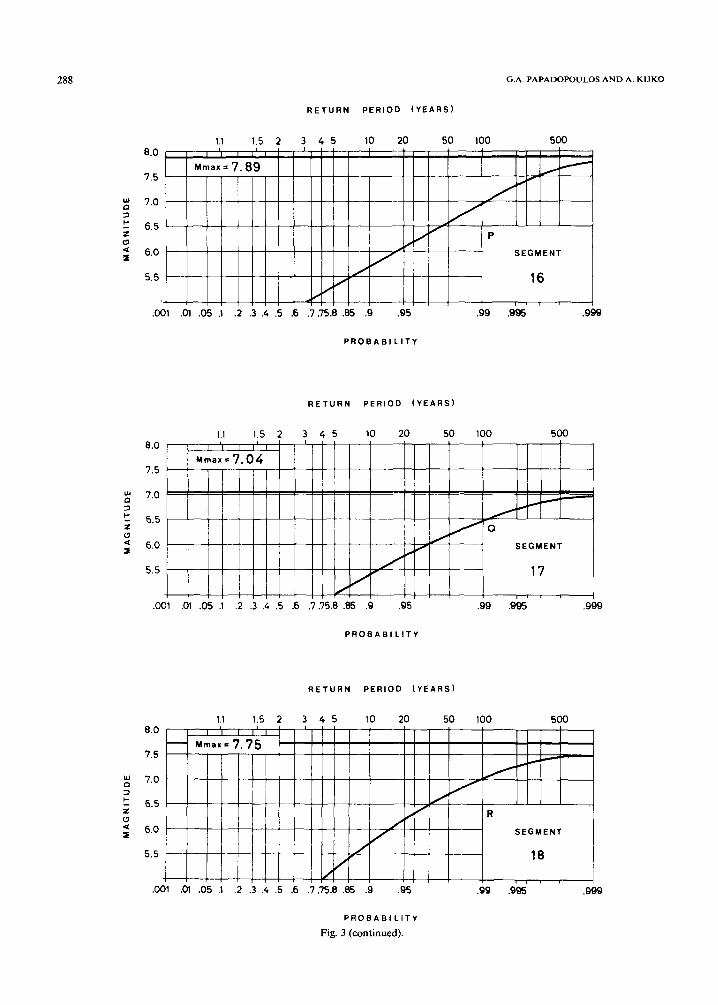
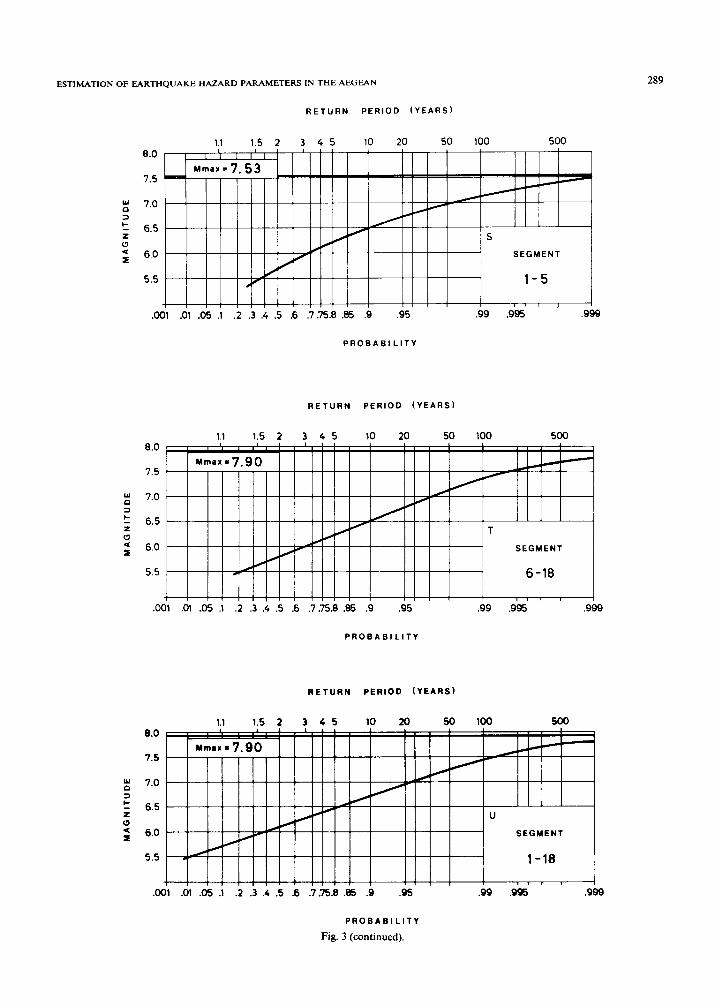
levels of FK Figure 3 illustrates the mean return
periods and probability that a certain magnitude
will not be exceeded in any year for the segments
examined.
From Table 5 it follows that the maximum
possible earthquake magnitude, e,,,,,, varies sig-
nificantly from segment to segment. On a regional
ESTIMATION OF EARTHQUAKE HAZARD PARAMETERS IN THE AEGEAN 283
RETURN PERIOD (YEARS)
7.5
!iY 7.0
3 I- ; 6.5
0 e I 6.0 SEGMENT
5.5
.O 9
PROBABI LlTY
RETURN PERIOD (YEARS)
-
!_ SEGMENT
2
- $1) r IIk I -__ i .OOl .Ol .05 S .2 .3 .4 .S .6 .7 .?5.0 .85 .9 .95 .99 ,995 .999
PROBABILITY
RETURN PERIOD (YEARS)
1.5 2 3 4 5 10 20 50 100 500
7.5
ii 7.0
3
k 6.5 N z c1 0’
C ; 6.0 I/
,“I
SEGMENT
5.5 3
.OOl .Ol .06 .1 .2 .3 .4 .5 .6 .7 35.9 .85 .9 .95 .QQ .QQ5 ,999
PROBABILITY
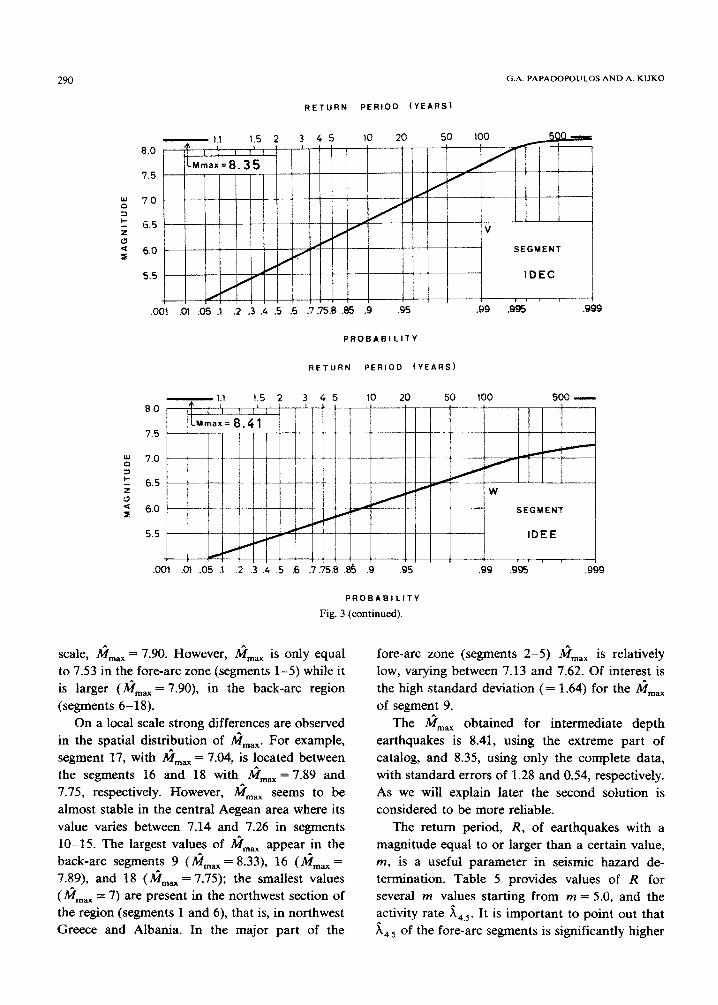
Fig. 3. The mean return pe~~/probab~ty/ma~tude diagram for each segment shown in Fig. 2.

284 G.A. PAPADOPOULOS AND A. KIJKO
RETURN PERIOD (YEARS)
1.1 1.5 2 3 45 10 20 50 100 500
.OOl .OI .05 .l .2 .3 .4 .5 6 7.75.8 .85 .9 .95 .99 ,995 ,999
PROBABILITY
RETURN PERIOD (YEARS)
1.1 1.5 2 3 45 10 20 50 100 500 8.0
7.5
7.0
6.5
6.0 ,I
YE
SEGMENT
5.5 ,' II 4' 5
-l I .OOl .Ol .05 .l .2 .3 .4 .5 .6 .7.75.6 .B5 .9 .95 .99 ,995 .999
PROBABILITY
RETURN PERIOD (YEARS)
1.1 1.5 2 3 45 10 20 50 100 500
7.5
p" 7.0 3 5 6.5
z : 6.0 SEGMENT
5.5
.oOl .Ol .05 .l .2 .3 .4 .5 .6 .7.?5.8 .85 .9 .95 .99 .9% ,999
PROBABI LITV
Fig. 3 (continued).

ESTIMATION OF ELARTHQUAKE HAZARD PARAMETERS IN THE AEGEAN 285
RETURN PERIOD (YEARS)
6.5
6.0 ,’
I SEGMENT
5.5 40 I’
7
-r 1 .CQl .Ol 05 1 .2 .3 .4 .5 .6 .7 75.0 .Q5 .Q .95 .QQ 9% .QQQ
0.0
7.5
7.0
6.5
6.0
5.5
PROBABILITY
RETURN PERIOD (YEARS)
SEGMENT
+ .OOl .Ol 05 .l .2 .3 .4 .5 .6 .7.75.8 85 .Q .95 .QQ .s
PROBABILITY
RETURN PERIOD (YEARS)
0.0
7.5
7.0
6.5
6.0 SEGMENT
5.5
.OOl .Ol .05 .l .2 .3 .4 .5 .6 .7 75.8 .85 .Q .95 .QQ ,995 ,999
PROBABILITY
Fig. 3 (continued).
286 G.A. PAPADOPOULOS AND A. KIJKO
RETURN PERIOD (YEARS)
7.5
: 7.0 1 I- I In
; 6.5
0 4 z! 6.0 SEGMENT
5.5 I/
/’
1 10
1' I
-I I 001 .Ol 05 .l .2 3 .4 .5 .6 .7.75.9 .85 .9 .95 .99 ,995 ,999
PROBABILITY
RETURN PERIOD (YEARS)
1.1 1.5 2 3 4 5 10 20 50 100 500 8.0
7.5
ii 7.0 3 I- z 6.5
u ii 6.0 SEGMENT
5.5
,001 .Ol .05 .l .2 3 .4 .5 .6 .7.75.0 .95 .9 .95 .99 ,996 .999
PROBABILITY
RETURN PERIOD (VEARS)
8.0
7.5
7.0
6.5
6.0
5.5
1.1 1.5 2 3 45 10 20 50 100 500
I I II IIIII III1
/ 0’ L
/ SEGMENT
.oOl .Ol .05 .l .2 .3 .4 .5 .6 .7.75.9 .85 .9 .95 .99 .QQ5 .999
PROBABILITY
Fig. 3 (continued).
ESTIh4ATION OF EARTHQUAKE HAZARD PARAMETERS IN THE AEGEAN 287
RETURN PERIOD (YEARS)
z 0 4
B
6.5
6.0 SEGMENT
5.5
PROBABILITY
RETURN PERIOD (YEARS)
1.1 1.5 2 3 45 10 20 50 100 500 9.0
7.5
7.0
6.5
6.0
5.5
0.0
7.5
7.0
6.5
6.0
5.5
PROBABILITY
RETURN PERIOD (YEARS)
1.1 1.5 2 3 45 10 20 50 100 500
SEGMENT
.CQl .Ol .05 .l .2 .3 .4 .5 .6 .7.75.0 .95 .9 .95 .99 .995 .999
PROBABILITY
Fig. 3 (continued).
288 G.A. PAPADOPOULOS AND A. KIJKO
0.0
7.5
7.0
6.5
6.0
RETURN PERIOD (YEARS)
SEGMENT
.OOl .Ol .05 .I .2 .3 .4 .5 .6 .7.75.8 .85 .Q .95 .QQ .QQ5 ,999
PROBABILITY
RETURN PERIOD (YEARS)
6.0 SEGMENT
5.5
,001 .Ol .05 .I .2 .3 .4 .5 .6 .7 ,758 .85 .Q .95 .QQ .QQ5 .9
PROBABILITY
RETURN PERIOD (YEARS)
1.1 1.5 2 3 45 10 20 50 100 500 __ u,cl
7.5
7.0
6.5
6.0
5.5
SEGMENT
.OOl .Ol .05 .l .2 .3 .4 .5 .6 .7 .75.8 .05 .Q .95 .QQ .Q% .QbQ
PROBABILITY
Fig. 3 (continued).
ESTIMATION OF EARTHQUAKE HAZARD PARAMETERS IN THE AEGEAN
RETURN PERIOD (YEARS)
0.0
7.5
7.0
6.5
/' I' S
6.0
0’
SEGMENT
5.5 / d' l-5
-I 1 I .OOl .Ol .05 .l .2 .3 .4 .5 .6 .7.75.0 .65 .9 .95 .99 .995
PROBABILITY
RETURN PERIOD (YEARS)
1.1 I.5 2 3 45 10 20 50 100 500 8.0
7.5
7.0
6.5
6.0 SEGMENT
5.5
.OQl .Ol .05 .l .2 .3 .4 .5 .6 .7.75.0 .65 .9 .95 .99 ,995 .S
PROBABILITY
RETURN PERIOD (YEARS)
1.1 1.5 2 345 10 20 50 100 500 . .
0.0
7.5
7.0
6.5
6.0
5.5
I4 /-
U AN
I- SEGMENT
I’ -I 1-18
1 I I
289
DO1 .Ol .05 1 .2 .3 .i .5 .6 .7.75.0 .es .9 .95 .99 995 .999
PROBABILITY
Fig. 3 (continued).
290 G.A. PAPADOPOULOS A
RETURN PERIOD (YEARS)
.ND A. KIJKO
8.0
6.0 SEGMENT
5.5
! !KiiI!ii!!! .OOt .Ol .05 S .2 .3 .4 5 .6 .7.75.8 .85 .9 ‘95 .QQ .QQ5 .99Q
PROBABILITY
RETURN PERI~~I (YEARS)
- 1.1 1.5 2 3 4 5 10 20 50 100 SOO--
8.0
7.5
7.0
6.5
6.0 SEGMENT
5.5
PROBABILITY
Fig. 3 (continued).
scale, tim, = 7.90. However, &,,,, is only equal to 7.53 in the fore-arc zone (segments l-5) while it is larger (&, = 7.90), in the back-arc region (segments 6-18).
On a local scale strong differences are observed in the spatial distribution of gm,. For example, segment f7, with &,,= = 7.04, is located between the segments 16 and 18 with &,._ = 7.89 and 7.75, respectively. However, cimax seems to be almost stable in the central Aegean area where its value varies between 7.14 and 7.26 in segments 10-15. The largest values of @,,, appear in the back-arc segments 9 (Gmm = 8.33), 16 (kmaX = 7.891, and 18 (h?,,,, = 7.75); the smallest values
(&?,X = 7) are present in the northwest section of the region (segments 1 and 6), that is, in northwest Greece and Albania. In the major part of the
fore-arc zone (segments 2-5) E;j,,, is relatively low, varying between 7.13 and 7.62. Of interest is the high standard deviation (= 1.64) for the &,,, of segment 9.
The j’&, obtained for intermediate depth earthquakes is 8.41, using the extreme part of catalog, and 8.35, using only the complete data, with standard errors of 1.28 and 0.54, respectively. As we will explain later the second solution is considered to be more reliable.
The return period, R, of earthquakes with a magnitude equal to or larger than a certain value, m, is a useful parameter in seismic hazard de- termination. Table 5 provides values of R for several m values starting from m = 5.0, and the activity rate X4.5. It is important to point out that x4,5 of the fore-arc segments is significantly higher

ESTIMATION OF EARTHQUAKE HAZARD PARAMETERS IN THE AEGEAN 291
TABLE 4
Values of parameter b and their standard deviations &,, ob-
tained in our study
Segment b eb b’
1 1.25 0.06 1.01
2 0.86 0.06 0.86
3 1.04 0.09 0.84
4 1.14 0.05 1.14
5 1.22 0.09 1.02
6 0.89 0.13 0.84
7 1 .Ol 0.16 1.08
8 1.03 0.07 1.14
9 1.22 0.07 0.70
10 1.13 0.09 0.59
11 0.98 0.22 0.87
12 0.79 0.15 0.64
13 1.07 0.07 0.87
14 0.78 0.10 0.59
15 0.98 0.14 0.61
16 0.73 0.17 0.46
17 0.72 0.07 0.78
18 0.61 0.13 0.51
l- 5 1.15 0.02 1.06
6-18 1.07 0.03 0.95
1-18 1.14 0.02 1.06
IDEE 1.14 0.05 0.68
IDEC 0.78 0.05 0.68
b’ is the same parameter determined by the least-squares
method by Papazachos (1980) for the segments l,.. .,18;
Papadopoulos (1982) for 1-5, 6-18 and l-18, and Papado-
poulos (1989) for IDEE and IDEC. IDEE and IDEC as in
Table 2.
than that of the back-arc segments. This is also
indicated by the A,, values for the segments l-5
and 6-18. For m 2 6.0, however, the return peri-
ods in segment l-5 are higher than the periods in
segment 6-18, implying that strong events (M 2
6.0) occur more frequently in the inner seismic
zone than in the outer zone. Papadopoulos (1982)
observed this difference in magnitude-frequency
relationships, determined using the least-squares
method, in 1911-1978 data. Considering the val-
ues of R,,,, R,.,, and R,, one may argue that
segment 2 in the Ionian Islands is the most active
in the region. Very active also are segments 16 and
18 in the Marmara Sea and Serbomacedonian
geological zone, respectively. To group all the 18
segments in classes based on their level of seismic
hazard we took into account equally their &?,,,aX
and R,,. We suggest that the seismic hazard is a
function of the form 8( M,,, R,,,) increasing with
M max and decreasing with R,,. For M,,,,, < 7.2,
7.2 I M,,,,, < 7.6, and M,,, 2 7.6, we define
e(M,,,,,) equal to 2, 4, and 6, respectively. We
define fl( R,,,) equal to 2, 4, and 6 for R,, 2 30,
30 > R,,, 2 17.5, and R,, -c 17.5, respectively. The
arithmetic mean K = +[a( M,,,,,) + 0( R6,0)] sig-
nifies the adopted relative seismic hazard of a
specific segment. K takes the values 2, 3, 4, and 5
leading to the definition of four classes of relative
seismic hazard: low (K = 2) intermediate (K = 3),
high (K = 4) and very high (K = 5).
Figure 2 shows how the segments are classified
in the relative seismic hazard scale. This classifica-
tion does not change drastically if we change
either the intervals of M,,, and R,,, ranked by 2,
4 or 6, or the value of m by using, for example,
R,,5 instead of R,,,.
Although the values of fi,, obtained for the
two alternative calculations concerning inter-
mediate depth shocks are almost identical, the
return periods, R, for magnitude levels of m 2 5.0
deviate significantly. Where the extreme part of
the catalog has been considered (IDEE in Table
5), R is much higher than the value obtained for
the same m value using only the complete part
(IDEC in Table 5). Thus, the R,., of IDEE ex-
ceeds the R,., of IDEC by a factor of 7. We
believe that the IDEE results are totally non-
realistic because of the small number of events
(n, = 4) in the extreme part of catalog. Values of
R (m I 7) for IDEC are compatible with return
periods determined by Papadopoulos (1989) using
the least-squares method on 1800-1985 data. For
m > 7, however, there is some deviation.
The parameter b of the G-R relation is one of
the most important parameters in seismology.
Apart from its importance in seismicity and earth-
quake prediction studies, b is an indicator of the
mechanical properties in the seismogenic material,
such as stress concentration, crack density and
degree of heterogeneity. Table 4 shows that on a
regional scale the 6 value is relatively high (about
1.1 for the region as an entity, as well as for
fore-arc and back-arc regions) expressing the high
fracturing, locally concentrated stresses, and high
degree of heterogeneity. The 6 value exhibits
292 G.A. PAPAWF’OULOS AND A. KIJKO
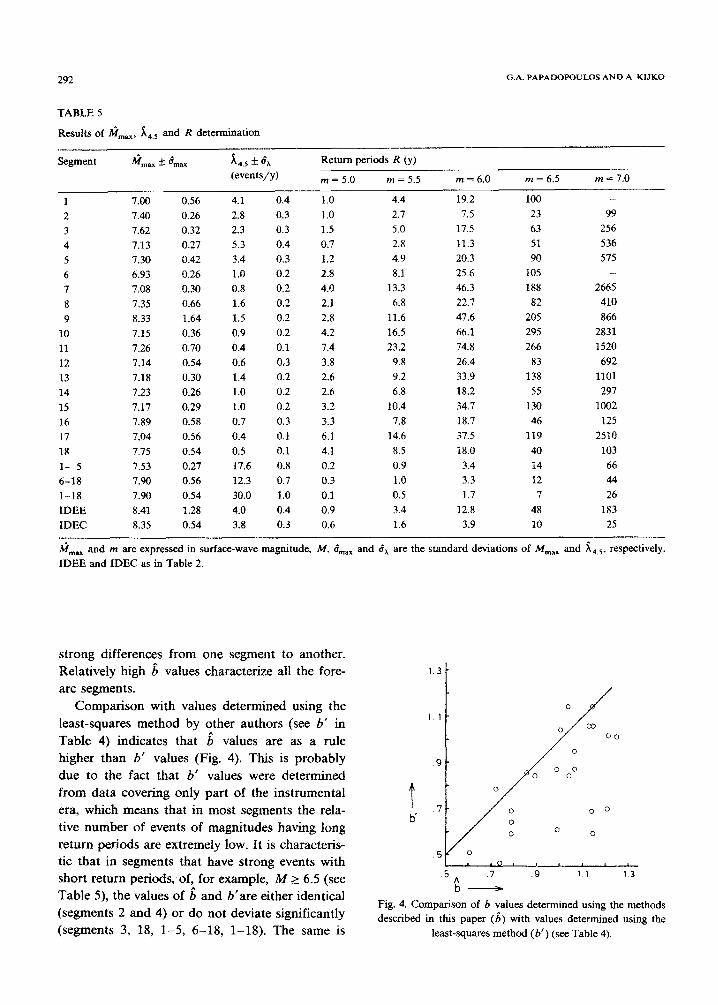
TABLE 5
Results of k,,,=, A.,, and R determination
Segment ‘k, * c, fi,* * 6, (events/y)
Return periods R (y)
m = 5.0 M = 5.5 M = 6.0 m = 6.5 m = 7.0
1 7.00 0.56 4.1 0.4 1.0 4.4 19.2 100
2 7.40 0.26 2.8 0.3 1.0 2.7 7.5 23
3 7.62 0.32 2.3 0.3 1.5 5.0 17.5 63
4 7.13 0.27 5.3 0.4 0.7 2.8 11.3 51
5 7.30 0.42 3.4 0.3 1.2 4.9 20.3 90
6 6.93 0.26 1.0 0.2 2.8 8.1 25.6 105
J 7.08 0.30 0.8 0.2 4.0 13.3 46.3 188
8 7.35 0.66 1.6 0.2 2.1 6.8 22.7 82
9 8.33 1.64 1.5 0.2 2.8 11.6 47.6 205
10 7.15 0.36 0.9 0.2 4.2 16.5 66.1 295
11 7.26 0.70 0.4 0.1 7.4 23.2 74.8 266
12 7.14 0.54 0.6 0.3 3.8 9.8 26.4 83
13 7.18 0.30 1.4 0.2 2.6 9.2 33.9 138
14 7.23 0.26 1.0 0.2 2.6 6.8 18.2 55
15 7.17 0.29 1.0 0.2 3.2 10.4 34.7 130
16 7.89 0.58 0.7 0.3 3.3 7.8 18.7 46
17 7.04 0.56 0.4 0.1 6.1 14.6 37.5 119
18 7.75 0.54 0.5 0.1 4.1 8.5 18.0 40
l- 5 7.53 0.27 17.6 0.8 0.2 0.9 3.4 14
6-18 7.90 0.56 12.3 0.7 0.3 1.0 3.3 12
l-18 7.90 0.54 30.0 1.0 0.1 0.5 1.7 J
IDEE 8.41 1.28 4.0 0.4 0.9 3.4 12.8 48
IDEC 8.35 0.54 3.8 0.3 0.6 1.6 3.9 10
99
256
536
575
2665
410
866
2831
1520
692
1101
297
1002
125
2510
103
66
44
26
183
25
%m% and M are expressed in surface-wave magnitude, M. G,,,, and 8, are the standard deviations of M,, and A,,, respectively.
IDEE and IDEC as in Table 2.
strong differences from one segment to another. Relatively high 5 values characterize all the fore- arc segments.
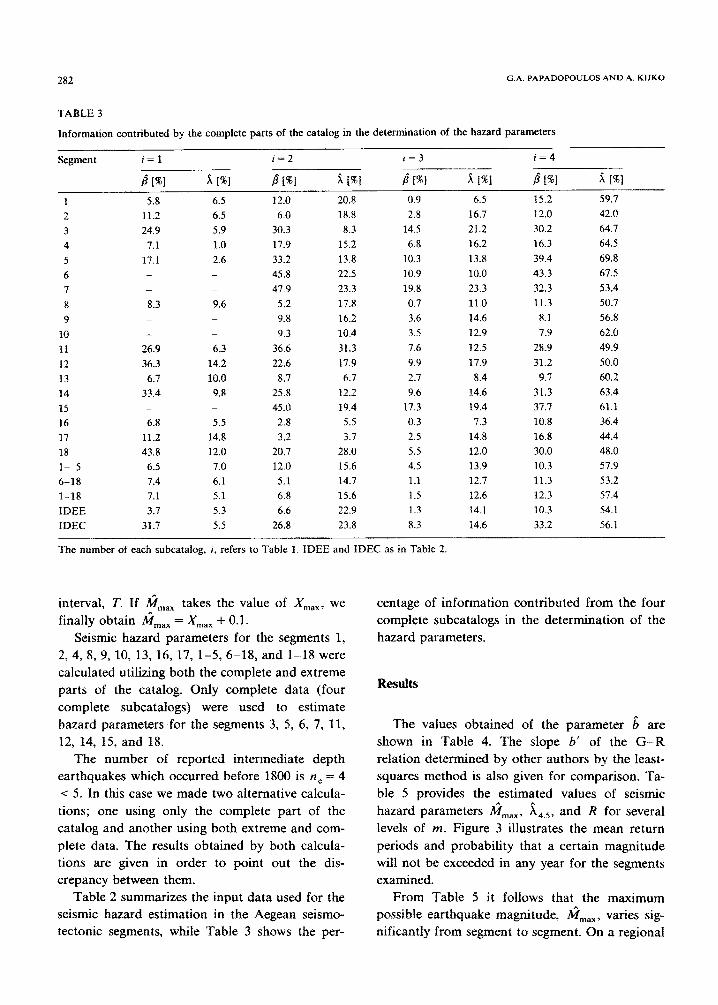
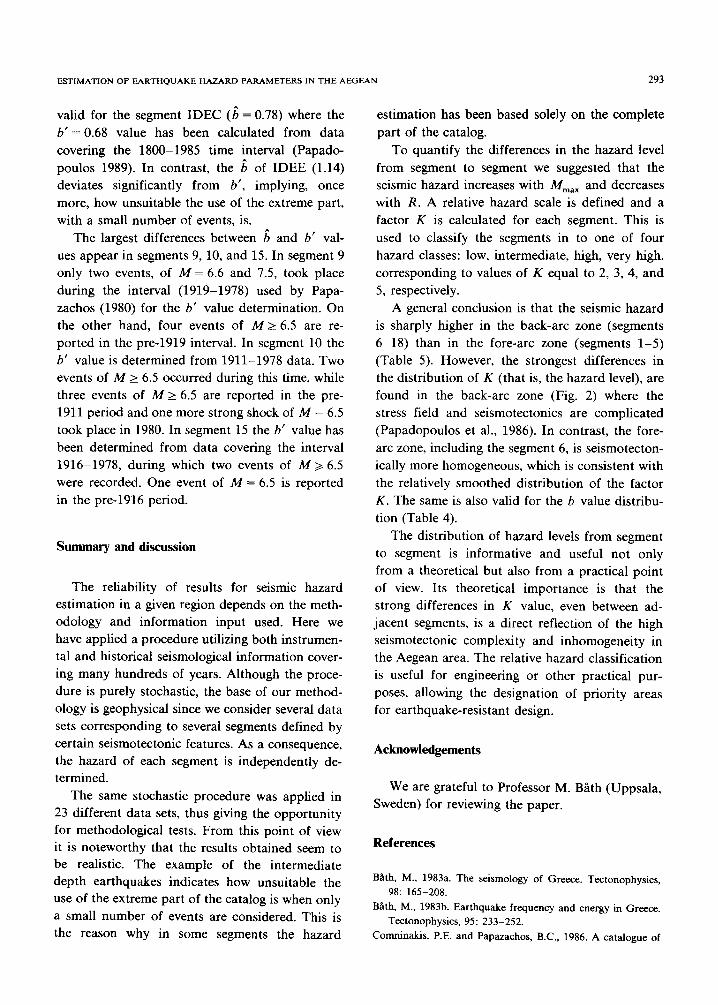
Comparison with values determined using the least-squares method by other authors (see b’ in Table 4) indicates that 6 values are as a rule higher than b’ values (Fig. 4). This is probably due to the fact that b’ values were determined from data covering only part of the instrumental era, which means that in most segments the rela- tive number of events of magnitudes having long return periods are extremely low. It is characteris- tic that in segments that have strong events with
short return periods;of, for example, A4 2 6.5 (see Table 5), the values of 5 and b’are either identical (segments 2 and 4) or do not deviate significantly (segments 3, 18, l-5, 6-18, 1-18). The same is
Fig. 4. Comparison of b values determined using the methods
described in this paper (6) with values determined using the
least-squares method (b’) (see Table 4).
ESTIMATION OF EARTHQUAKE HAZARD PARAMETERS IN THE AEGEAN 293
valid for the segment IDEC (B = 0.78) where the
b’ = 0.68 value has been calculated from data
covering the 18OC-1985 time interval (Papado-
poulos 1989). In contrast, the 6 of IDEE (1.14)
deviates significantly from b’, implying, once
more, how unsuitable the use of the extreme part,
with a small number of events, is.
The largest differences between 6 and b’ val-
ues appear in segments 9,10, and 15. In segment 9
only two events, of M = 6.6 and 7.5, took place
during the interval (1919-1978) used by Papa-
zachos (1980) for the b’ value determination. On
the other hand, four events of M 2 6.5 are re-
ported in the pre-1919 interval. In segment 10 the
b’ value is determined from 1911-1978 data. Two
events of M 2 6.5 occurred during this time, while
three events of M 2 6.5 are reported in the pre-
1911 period and one more strong shock of M = 6.5
took place in 1980. In segment 15 the b’ value has
been determined from data covering the interval
1916-1978, during which two events of Ma 6.5
were recorded. One event of M = 6.5 is reported
in the pre-1916 period.
Summary and discussion
The reliability of results for seismic hazard
estimation in a given region depends on the meth-
odology and information input used. Here we
have applied a procedure utilizing both instrumen-
tal and historical seismological information cover-
ing many hundreds of years. Although the proce-
dure is purely stochastic, the base of our method-
ology is geophysical since we consider several data
sets corresponding to several segments defined by
certain seismotectonic features. As a consequence,
the hazard of each segment is independently de-
termined.
The same stochastic procedure was applied in
23 different data sets, thus giving the opportunity
for methodological tests. From this point of view
it is noteworthy that the results obtained seem to
be realistic. The example of the intermediate
depth earthquakes indicates how unsuitable the
use of the extreme part of the catalog is when only
a small number of events are considered. This is
the reason why in some segments the hazard
estimation has been based solely on the complete
part of the catalog.
To quantify the differences in the hazard level
from segment to segment we suggested that the
seismic hazard increases with M,,, and decreases
with R. A relative hazard scale is defined and a
factor K is calculated for each segment. This is
used to classify the segments in to one of four
hazard classes: low, intermediate, high, very high,
corresponding to values of K equal to 2, 3, 4, and
5, respectively.
A general conclusion is that the seismic hazard
is sharply higher in the back-arc zone (segments
6-18) than in the fore-arc zone (segments 1-5)
(Table 5). However, the strongest differences in
the distribution of K (that is, the hazard level), are
found in the back-arc zone (Fig. 2) where the
stress field and seismotectonics are complicated
(Papadopoulos et al., 1986). In contrast, the fore-
arc zone, including the segment 6, is seismotecton-
ically more homogeneous, which is consistent with
the relatively smoothed distribution of the factor
K. The same is also valid for the b value distribu-
tion (Table 4).
The distribution of hazard levels from segment
to segment is informative and useful not only
from a theoretical but also from a practical point
of view. Its theoretical importance is that the
strong differences in K value, even between ad-
jacent segments, is a direct reflection of the high
seismotectonic complexity and inhomogeneity in
the Aegean area. The relative hazard classification
is useful for engineering or other practical pur-
poses, allowing the designation of priority areas
for earthquake-resistant design.
Acknowledgements
We are grateful to Professor M.
Sweden) for reviewing the paper.
References
Bath (Uppsala,
B%th, M., 1983a. The seismology of Greece. Tectonophysics, 98: 165-208.
B&h, M., 1983b. Earthquake frequency and energy in Greece.
Tectonophysics, 95: 233-252.
Comninakis, P.E. and Papazachos, B.C., 1986. A catalogue of

294 G.A. PAPADOPOULOS AND A. KIJKO
earthquakes in Greece and the surrounding area for the
period 1901-1985. Univ. Thessaloniki Geophys. Lab. Publ.
1, 167 pp.
Kijko, A., 1988. Maximum likelihood estimation of Guten-
berg-Richter b parameter for uncertain magnitude values.
Pure Appl. Geophys., 127: 573-579.
Kijko, A. and Sellevoll, M.A., 1987. Estimation of earthquake
hazard parameters from incomplete data files. Seismo. Ser.,
11, Seismological Obs., Univ. Bergen, Norway, 23 pp.
Kijko, A. and SelIevoll, M.A., 1989. Estimation of earthquake
hazard parameters from incomplete data files. Part I. Utili-
zation of extreme and complete catalogs with different
threshold magnitudes. Bull. Seismol. Sot. Am., 79: 645-654.
Makropoulos, K.C. and Burton, P.W., 1985. Seismic hazard in
Greece. I. Magnitude recurrence. Tectonophysics, 117:
205-257.
Papadopoulos, G.A., 1982. Contribution to the study of the
active deep tectonics of the Aegean and surrounding areas.
D. Sci. Thesis, Univ. Thessaloniki, 176 pp. (in Greek with
English abstr.).
Papadopoulos, G.A., 1989. Forecasting large intermediate de-
pth earthquakes in the South Aegean. Phys. Earth Planet.
Inter., 57: 192-198.
Papadopoulos, G.A., Kondopoulou, D.P., Leventakis, G.-A.
and Pavlides, S.B., 1986. Seismotectonic of the Aegean
region. Tectonophysics, 124: 67-84.
Papazachos, B.C., 1980. Seismicity rates and long-term earth-
quake prediction in the Aegean area. Quatemiones Geod.,
3: 171-190.
Papazachos, B.C. and Comninakis, P.E., 1982. A catalogue of
historical earthquakes in Greece and surrounding area, 479
B.C.-1900 A.D. Univ. of Thessaloniki, Geophys. Lab. Publ.
5, 24 PP.