MASTER DRILLING GROUP
International Raise Drilling Experts
November 2012
Private & Confidential

Page 2
DISCLAIMER
IMPORTANT NOTICE
This document has been compiled from information provided by the Directors of Master Drilling Group Limited (“Master Drilling”, “Master Drilling Group” or the “Company”) and
from publicly available sources, and involves elements of subjective judgment and analysis, which may or may not be correct, and have not been independently verified.
Accordingly, Master Drilling and its Advisors accept no responsibility for the correctness or otherwise of the content set out herein and no representation or warranty, express or
implied, is being made or given as to the accuracy or completeness of the information set out herein. The information contained in this document is subject to completion,
revision, verification and amendment without prior notice and without liability to compensate or reimburse any party.
No representation or warranty, express or implied is, or will be, given by Master Drilling or its Directors, Partners, Employees or Advisors or any other person as to the
accuracy, completeness or fairness of this document and, so far as permitted by law and except in the case of fraud by the party concerned, no responsibility or liability
whatsoever is accepted for the accuracy or sufficiency thereof or for any errors, omissions or misstatements negligent or otherwise relating thereto.
Master Drilling shall only be bound by those particular representations and warranties set forth in definitive written transaction documents, when and if such transaction
documents are executed and subject to such restrictions and limitations as may be contained therein.
This document may include certain statements, estimates, targets, forecasts and projections provided by Master Drilling. Such statements, estimates, targets, forecasts and
projections reflect significant assumptions and subjective judgments and analysis by Master Drilling’s management concerning anticipated future events which may or may not
prove to be correct and there can be no assurance that any estimates, targets, forecasts or projections are attainable or wil l be realised. Nothing contained in this document is,
or shall be relied upon as, a promise or representation, whether as to the past or the future. Accordingly, (subject as aforesaid) neither Master Drilling nor its Directors,
Partners, Employees or Advisors nor any other person, shall be liable for any direct, indirect or consequential loss or damage suffered by any person as a result of relying on
any statement in or omission from this document and any such liability is expressly disclaimed. In particular, but without l imitation, no representation or warranty is given as to
the achievement or reasonableness of, and no reliance should be placed on, any estimates, targets, forecasts or projections contained in this document (or otherwise provided
by or on behalf of Master Drilling with respect to the subject matter of this document). In all cases, interested parties should conduct their own investigation and analysis of
Master Drilling and the information contained in this document before making any decisions.
This presentation and the documents provided with this presentation are confidential and may not be disclosed to any third party without the prior written consent of Master
Drilling.

Page 3
MASTER DRILLING GROUP
1. MASTER DRILLING GROUP OVERVIEW................................................................................................................... 4
2. INVESTMENT HIGHLIGHTS........................................................................................................................................ 11
3. CORPORATE STRATEGY............................................................................................................................................ 14
4. MAJOR CLIENTS AND COMMODITIES..................................................................................................................... 19
5. OPERATIONS............................................................................................................................................................... 23
6. HISTORICAL FINANCIALS.......................................................................................................................................... 28
7. OUTLOOK ON DRILLING SERVICES MARKET......................................................................................................... 32

Page 4
Master Drilling Group Overview

Page 5
1. MASTER DRILLING GROUP OVERVIEW
Company Overview
Master Drilling Background and Organogram:
Master Drilling was founded by Mr. Daniel Coenraad Pretorius
in 1986 and commenced raise-boring operations in South Africa
during the same year with two raisebore machines
Today, Master Drilling is one of the global leaders in the
raiseboring market, also providing other specialised drilling
services for mineral exploration and mining companies
Master Drilling currently operates 154 drilling rigs of various
sizes globally, in countries including South Africa, Zambia,
DRC, Burkina Faso, Mexico, Peru, Brazil and Chile
Master Drilling has 94 machines (84 raise borers, 5 drilling
related rigs and 5 blast hole / sampling rigs) active across its
operations in Africa and South America. This is one of the
largest fleets of raisebore machines globally
Master Drilling expanded into exploration drilling during 2005 by
acquiring a controlling stake in Drillcorp Africa (Pty) Ltd
(“Drillcorp”)
Drillcorp has a total of 60 exploration drilling rigs in operation
across numerous countries in sub-Saharan Africa, including
Burkina Faso, Zambia and DRC. These rigs include both
surface and underground diamond drill and reverse circulation
rigs
Master Drilling’s head office is located in Fochville, South
Africa. An engineering facility, which manufactures most of the
consumables and parts for the world fleet, is housed within the
same complex
Master Drilling International
Limited (“MDI”)
Master Drilling Group Limited 100%
MDI Exco
Limited
Kala SA
(Chile)
Master Drilling
do Brasil Ltda
(Brazil)
Master Drilling
Peru SAC
(Peru)
Master Drilling
Mexico SA
(Mexico)
Master Drilling
Zambia Limited
(Zambia)
Master Drilling
Australia (Pty)
Limited
(Australia)
Drillcorp
Burkina Faso
SA
(Burkina Faso)
Drillcorp Cote
d’Ivoire SA
(Cote d’Ivoire)
Master Drilling
South Africa
(Pty) Limited
(“MDSA”)
Drilling
Technical
Services (Pty)
Limited
Drillcorp Africa
(Pty) Limited
15%
85% 74%1 74%2 74%1
100%
100%
100%
100%
100%
100%
80%3
80%3 International Operations
SA Operations
1 – Remaining 26% held by Mosima Drilling (Pty) Limited
2 – Remaining 26% held by Epha Drilling (Pty) Limited
3 – Remaining 20% held by Moussa Kone
Page 6
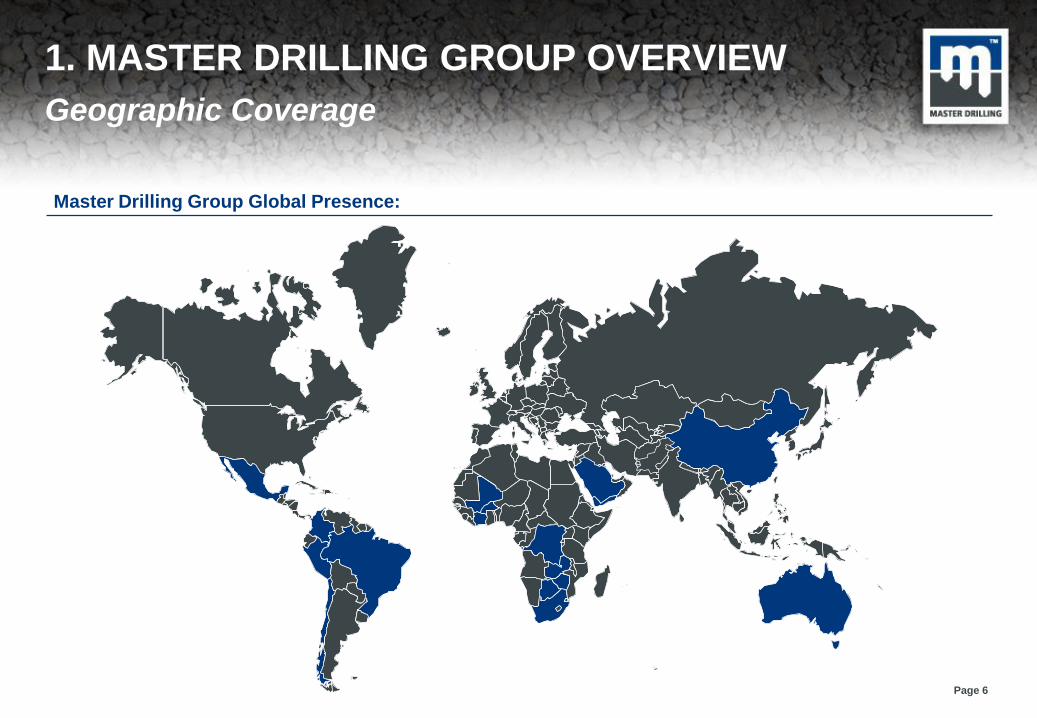
1. MASTER DRILLING GROUP OVERVIEW
Geographic Coverage
Master Drilling Group Global Presence:

Page 7
1. MASTER DRILLING GROUP OVERVIEW
Operational Milestones
Regional associates are established in Brazil and Zambia
First self designed, low profile blindhole / raiseborer (BHB200) was added to the fleet
Key Operational Milestones Since 2000:
2000
2001
2002
2003
2008
2004
2005
2006
2007
2009
2010
2011
Acquired the largest raisedrill ever built (HG380)
First stope long hole drilling contract commenced at Beatrix mine
First hole for the HG380 commenced at Anglo Platinum’s Amandelbult mine (501m x 4.5m diameter)
Acquired total fleet of boxhole machines from RUC
HG380 machine completed a 4.5m diameter and 500m in length hole at Amandelbult Platinum mine
Introduced a stope long hole drilling project at Mponeng mine
Designed and built a remote operated shot-crete application machine
Obtained coveted ISO9001:2000 accreditation
World’s fastest completion with HG380 machine at Tara Mines, Ireland (692m x 4.5m in 90 days)
Drilled Europe’s deepest 4m hole with HG380 machine at Tara Mines, Ireland (839m)
New cutter design implemented and stope drill mono rail system purposely built for Goldfield’s Kloof 3
Addition of new machines to the fleet
Design of the auto spanner
Shaft Support division. Training division introduced with virtual learning
Design of the gripper machine
Largest hole drilled to date with HG380 (7.3m diameter)
Designed first ever low profile Blind Hole borer (LP 150)
2012 Longest and most accurate raisebore hole ever drilled

Page 8
1. MASTER DRILLING GROUP OVERVIEW
Operational Photos
HG380 Raiseborer underground on site in Peru HG380 Raiseborer on surface at site in South Africa Blasthole drilling on site in Peru
Core drilling at site in Yemen Underground reamer head Underground holing of piloting process

Page 9
1. MASTER DRILLING GROUP OVERVIEW
Raisebore Drilling Overview
Raisebore Drilling – The Safer, Faster and More Accurate Method of Drilling:
Raisebore drilling is a method used to drill ore passes and
ventilation shafts required for production in an underground
mine, without the use of explosives
The raisebore drilling machine is set up on the upper level of
the two levels to be connected. A small pilot hole (c. 300mm in
diameter) is drilled to the level required. The pilot hole is then
reamed to a larger diameter (up to 6m in diameter) by attaching
a reamer head to the drillrods at the lower shaft and pulling it
back towards the drilling unit in a circular motion
The reamer head has a series of tungsten carbide cutters which
cut the rock during the circular motion. The drill cuttings from
the reamer head fall to the floor of the lower level and are
removed by a standard LHD loader
The boring principle is attractive because it offers the following
advantages over conventional drilling and blasting methods:
–Safer working conditions
–Speed of completion
–A hole which has a more stable structural shape
–A hole which has smooth sidewalls which has low
frictional loss in ventilation airways, and reduces the
likelihood of blockages in the ore-passes
HG380 Raisebore Machine
Reamer Head

Page 10
Fred G. Dixon GM, Drillcorp Africa
Mr. Fred G. Dixon is the
General Manager of
Drillcorp Africa Limited, a
position he has held for 6
years
Prior to joining Master
Drilling, Mr. Dixon was
employed in various
management roles over a
20 year career with Mittal
Steel in South Africa.
Specific roles include Plant
Manager, Project Manager
and Senior Draughtsman
In his work at Mittal Steel,
Mr. Dixon was responsible
for management of the
company’s heavy earth
moving equipment and
locomotives
Mr. Dixon holds an MBA
from Potchefstroom
University and a degree in
civil engineering from Vaal
Triangle Technicon
1. MASTER DRILLING GROUP OVERVIEW
Key Management Team
Daniël C. Pretorius Chief Executive Officer, MDG
Mr. Daniel (Danie) C.
Pretorius is the Founder
and Chief Executive
Officer of Master Drilling
Group Limited
Mr. Pretorius originally
founded Master Drilling in
1986 and has been
actively involved in
building the company for
over 25 years.
Mr. Pretorius is widely
considered a pioneer in
the field of raisebore
drilling, having helped
design the company’s
drilling fleet to meet the
needs of its clients
Prior to founding Master
Drilling, Mr. Pretorius was
an Engineer with Kuruman
Consolidated Asbestos,
Elandsrand Gold Mine,
Western Deep Levels Gold
Mine and RUC Mining
(now a division of Murray
& Roberts)
André J. Van Deventer Chief Financial Officer, MDG
Mr. André van Deventer is
the Chief Financial Officer
of Master Drilling Group
Limited, a position he has
held for the past 10 years
Joined Master Drilling as a
Financial Manager in 2001
and was appointed to
Board of Directors in 2002
Prior to joining Master
Drilling, Mr. Van Deventer
was a Financial Manager
at Beefmaster (Pty) Ltd, an
integrated beef business in
Kimberley, South Africa.
Before this, he was an
Accountant at Gericke,
Rademeyer & Newton
Walker in Klerksdorp,
South Africa
Mr. Van Deventer is a
member of the South
African Institute of
Chartered Accountants
Barend J. Jordaan Technical Director, MDG
Mr. Barend (Koos) J.
Jordaan is the Technical
Director of Master Drilling
Group Limited, a position
he has held for the past 11
years
Prior to joining Master
Drilling, Mr. Jordaan was a
Design and Project
Engineer for Joy Mining
Machinery in South Africa.
Before this, he was a
Technician for Orsmond
Aviation and a Design
Engineer for FEV
Motorentechnik
Mr. Jordaan holds a
degrees in Mechanical
Engineering from Pretoria
Technicon (now Tshwane
University of Technology)
and International
Technology Management
from University of
Gronigen, Netherland
MBA from Bond University,
Australia
Gareth R. Sheppard Director of Operations (Int.), MDG
Mr. Gareth R. Sheppard is
the Director for
International Operations of
Master Drilling Group
Limited, a position he has
held for the past 10 years
Mr. Sheppard joined
Master Drilling in 2001 as
Director of Master Drilling
Peru S.A.C. and Master
Drilling International Ltd
Joined the Board of
Directors of Master Drilling
Mexico SA de CV in 2005
and Master Drilling
Australia (Pty) Ltd in 2011
Mr. Sheppard holds a
degree in Mining
Engineering from Wits
University and an MBA
from Wits Business School
in South Africa
Member of Instituto de
Ingenieros de Minas del
Peru

Page 11
Investment Highlights

Page 12
2. INVESTMENT HIGHLIGHTS
Key Highlights
GLOBAL RAISEBORE DRILLING
SPECIALIST WITH
SUBSTANTIAL GROWTH
UPSIDE
STRONG PIPELINE OF ORDERS
FROM TOP-TIER MINING
CLIENTS
PREFERRED EMERGING
MARKET EXPOSURE WITH
BENEFIT OF COUNTRY AND
COMMODITY DIVERSIFICATION
SUPPORTIVE MARKET
CONDITIONS UNDERPINNED BY
ROBUST COMMODITY PRICES
WORLD CLASS MANAGEMENT
EXPERTISE
1
2 5
4 3

Page 13
2. INVESTMENT HIGHLIGHTS
Global Raiseboring Drilling Specialist Growth
GLOBAL LEADER
IN RAISE BORE
DRILLING
SERVICES
Niche drilling segment used extensively in on-mine development
(ventilation shafts and ore passes) by exiting producers
Raise bore drilling is highly differentiated to exploration drilling; it is
insulated from mining capital cycle (customers are major miners in
production not explorers), benefits from rising safety standards (increased
ventilation shafts) and increasing mining capital intensity (customers
seeking to extend existing operations rather than build new mines)
EXISTING CASH
FLOW
GENERATIVE
BUSINESS
Solid cash flow generative business, operating since 1986 with significant
growth history
FULLY
INTEGRATED
BUSINESS MODEL
Integrated business model including design, manufacture, service and
operation of rigs (including manufacture of bespoke rigs for customer
demands)
GOOD VISIBILITY
ON FUTURE
EARNINGS
Strong pipeline of orders from top-tier mining houses
WORLDWIDE
OPERATIONS 154 total rigs across 7 countries
WORLD CLASS
MANAGEMENT
EXPERTISE
Built business from start-up to global leader
OPERATIONAL
DIVERSIFICATION
Diversified exposure to mix of commodities and multiple emerging
markets
Historical Revenue:
Historical EBITDA:
0
10
20
30
40
50
60
70
80
90
100
2009FY 2010FY 2011FY 2012H1
US
$m
0
5
10
15
20
25
2009FY 2010FY 2011FY 2012H1
US
$m

Page 14
Corporate Strategy

Page 15
3. CORPORATE STRATEGY
Vision & Mission
Our vision is to be the global preferred supplier of efficient and reliable, high quality
drilling services and technology in the mining and civil engineering sectors
OUR VISION:
Our mission is to remain at the forefront of technological advancement through ongoing
research and development and continuous interaction with our customers, contributing to
improved customer business performance, now and in the future. Our key business
principles are quality, safety and integrity
OUR MISSION:

Page 16
3. CORPORATE STRATEGY
Organisational Culture
1. The quality of Master Drilling’s service is achieved through excellent planning, which takes into consideration every step of drilling
operations, in order to mitigate any possibility of a mistake in advance
2. Preventing pollution and wastage
3. Satisfaction of clients is paramount
4. Providing a safe working environment
5. Master Drilling carefully chooses its suppliers and subcontractors by taking into consideration their quality consciousness
6. Trained and qualified staff shall be employed in all functions of the Company. The knowledge and the responsibility for quality of all
employees is fostered by means of continuous skills development
7. Identify measurable, functional objectives during management review meetings
8. In providing its drilling service to mines and the civil construction industries, the Company strives to be as environmentally friendly as
possible. This includes the efforts of its employees to use equipment with care, making use of the Company’s resources and energy in a
manner that is as economical as possible in order to minimise waste
9. The consequences of Master Drilling’s work and the effectiveness of the SHEQ Management System are controlled regularly by means of
internal audits and annual management reviews by management where objectives are assessed and reported
“DOING THINGS RIGHT THE FIRST TIME” – WHAT IT MEANS TO MASTER DRILLING:
Master Drilling’s organisational culture focuses on “Doing Things Right the First Time”
Master Drilling is committed to cultivating a culture of quality through on-going employee training & development,
responsible & direct communication with clients and continuous improvement in service quality

Page 17
Peter J. Ledger Non Executive Chairman
3. CORPORATE STRATEGY
Corporate Governance & Strategic Planning
The Board of Directors of Master Drilling is responsible
for providing strategic direction and effective oversight
of corporate governance for the Company on a global
basis
The Board meets for scheduled meetings at least once
per quarter and otherwise as needed
Key responsibilities of the Board of Directors include:
Establish and review the Company’s Vision,
Objectives, Values and Strategic Plan
Establish and monitor firm-wide policies and
procedures which provide a framework for
effective and responsible management of the
Company
Oversight of appropriate programmes and
services offered in order to meet the needs of
clients and remain ahead of the competition
On an annual basis, establish specific business
objectives and identify key performance areas
for all major functions of the Company
Appoint senior management and efficiently
delegate responsibility for execution of key
objectives
Daniël C. Pretorius Chief Executive Officer
André J. Van Deventer Chief Financial Officer
Gareth R. Sheppard Executive Director
Barend J. Jordaan Executive Director
Shane Ferguson Non Executive Director
Roger Davey Non Executive Director
Jacques de Wet Non Executive Director
Corporate Governance & Strategic Planning:
Akhter A. Deshmukh Non Executive Director

Page 18
3. CORPORATE STRATEGY
SWOT Analysis
S Established client base among blue chip mining companies
Pioneer and market leader in technically specialised raisebore
drilling – creates competitive advantage vs. competitors
Primary focus on production-stage drilling – less influenced by
commodity price swings and/or capital market uncertainty
Contracts signed up to 1-2 years in advance of service delivery,
enabling high degree of future earnings visibility
Large fleet of specialised drill rigs, including one of the world’s
largest raisebore machines (HG380)
STRENGTHS:
OPPORTUNITIES:
O Expand geographical footprint to new target markets (Colombia,
DRC, Mali, Australia)
New technology development (Gripper – horizontal drilling)
Diversification into new market segments, including hydro
schemes (well drilling) and civil engineering
Improved brand recognition, both within mining industry and
amongst institutional capital market participants
Strategic and opportunistic acquisitions in new markets
W High quality, specialised raisebore services charged at premium
price point relative to competitors
High average fleet age
Lack of enterprise-wide IT platform (currently being addressed)
Low BBBEE score of local South African business – reduces
competitiveness when tendering for South African government
contracts
WEAKNESSES:
THREATS:
T Shortage of skilled labour inhibits rate of expansion (mineral
drilling more technically advanced skill than oil/gas, requiring
approx. 3 – 4 years to train supervisory/lead driller)
Exchange rate fluctuations for international operations
Closure of client mines caused by commodity price weakness,
capital shortage or other factors
Cash flow constraints inhibit ability to deliver on contracts
Deterioration in government relations in key markets
Sustained long-term capital market weakness

Page 19
Major Clients and Commodities

Page 20
2012 H1
4. MAJOR CLIENTS & COMMODITIES
Commodity Focus
Overview of MD Group Commodity Focus: MD Group Revenues by Commodity (2011 / 2012H1):
Master Drilling enjoys a degree of diversification through its
relative balance between precious and base metals exposure:
Gold & Silver: increasingly driven by investment demand
as safe haven and hedge against US dollar inflation
PGMs: remain subject to developed market demand,
particularly EU automobile consumption
Base Metals: remain vital to urbanisation and
industrialisation of BRICs and other emerging markets
In light of recent commodity price volatility, the Company’s
management has identified commodity diversification as a high
priority short-term focus area
In particular, Master Drilling is targeting revenue growth and
diversification in the coal, iron ore and ferroalloys (chrome,
manganese) sectors in South Africa
Iron ore and ferroalloys exposure will provide cyclical
diversification, as steel is an early-cycle industry vs. precious
metals and PGMs (typically late-cycle)
Additionally, the Company seeks to expand service offering in
the civil engineering sector, particularly for underground
development at large hydro-electric projects
PRECIOUS & BASE METALS ANCHOR PORTFOLIO, BUT AIM TO EXPAND IN COAL, FERROALLOYS & CIVIL ENGINEERING
26%
17%
20%
11%
8%
7% 2%
2% 1% 6% Gold
Copper
PGM
Silver/Lead/ Zinc & Copper
Gold/Silver
Coal
Silver
Zinc/Lead
Chrome
Other
2011
26%
15%
24%
12%
5%
12%
1% 2% 1% 2%
Gold
Copper
PGM
Silver/Lead/ Zinc & Copper
Gold/Silver
Coal
Silver
Zinc/Lead
Chrome
Other

Page 21
20%
0%
10%
25% 9%
5%
-19%
8% 4% 12%
3%
8%
28%
6%
8%
-19%
8%
8%
-6
-4
-2
0
2
4
6
8
10
12
14
16
H1 2012 2011 2010 2009
US
$m
MD Zambia
MD Peru
MD Brazil
MD Mexico
Kala
MDI
Drillcorp Africa
Drilling Technical Services
MDSA
4. MAJOR CLIENTS & COMMODITIES
Geographical Focus
Overview of MD Group Geographical Focus: MD Profit for the Year by Geography (2009 – 2012H1):
Master Drilling is capable of offering specialised drilling services
virtually anywhere in the world and is not limited to specific
countries or regions. Contracts can be effectively mobilised as a
self-contained business unit on a temporary basis
Principal focus on the drilling services markets in Africa and
Latin America, including continuing operations in South Africa,
Peru, Chile, Brazil, Mexico and Zambia
In addition to continuing operations, Master Drilling carries our
projects in various other countries, including Burkina Faso,
Zimbabwe, Botswana and Saudi Arabia
Master Drilling recently registered a subsidiary in China, where
it engages in manufacturing and trading. The Chinese drilling
market is a target for future revenue expansion
Established brand name and market leader in raisebore drilling
amongst major South African mining companies
Rapid revenue growth in Latin American markets, where Master
Drilling is often the monopoly supplier of raisebore technology
Other expansion opportunities exist in Colombia, DRC, Mali,
Australia and other high opportunity markets
ESTABLISHED BRAND IN SOUTH AFRICA, WITH RAPID REVENUE GROWTH IN LATIN AMERICA & OTHER AFRICA
2011 2012 H1
1Positive values excludes loss from MD Brazil
1 1 1

Page 22
4. MAJOR CLIENTS & COMMODITIES
Selected Existing Client Base
AFRICA: LATIN AMERICA:
CLIENT BASE PRIMARILY COMPRISED OF BLUE-CHIP MAJOR & MID-TIER MINING COMPANIES

Page 23
Operations

Page 24
5. OPERATIONS
Service Offering
Master Drilling’s Specialised Service Offering:
Master Drilling provides both primary and secondary services to
its clients, depending on the terms of each individual contract
Primary services offered by Master Drilling include:
− Raisebore drilling
− Box hole & slot riser boring/drilling
− Drain hole drilling
− Drop raising
− Shaft support
− Surface blast hole drilling
Primary services offered by Drillcorp Africa include:
− Core drilling
− Percussion drilling
− Reverse circulation drilling
Secondary services are offered in contracts where the scope
of services exceeds the core, primary services on offer. These
are either offered directly by Master Drilling or alternatively sub-
contracted to third party providers
− Earthworks, piling & foundation construction
− Directional drilling & wedging
− Core logging & cutting
Equipment supply services are offered to the MD Group
companies by Drilling Technical Services and MD China
RAISEBORE
DRILLING
Used to drill smooth ore passes and
ventilation shafts in underground mines,
without the use of explosives
Further applications in civil engineering,
particularly underground hydro schemes
Significant advantages including no
blasting (ie. no fracturing), safety, speed,
accuracy and depth capability
Requires stable ground conditions
SLOT & DROP
RAISING
Raise excavation which is completely pre-
drilled over full length and blasted from
bottom at appropriate lengths
Advantages of safety and low cost
BLAST HOLE
DRILLING
Used to drill consistent blast patterns in
time-effective manner for open pit mines
Typically used in large surface operations
with high production rates (coal & bulks)
EXPLORATION
DRILLING
Core drilling, percussion drilling and
reverse circulation drilling used in
discovery of new mineral deposits and
determination of grade & continuity

Page 25
5. OPERATIONS
Key Performance Metrics
Key Operational Performance Metrics:
Master Drilling’s management team uses a variety of Key Performance Indicators (KPIs) to monitor the Company’s performance against
targeted objectives:
− Rig Availability (%)
− Rig Utilisation (%)
− Achieved Drilling Hours (hours drilled per day)
− Achieved Penetration Rates (metres driller per hour)
− Revenue Contribution per Rig (US$ per machine)
Achieved and targeted performance metrics are reviewed by senior management on a quarterly basis
Key Performance Indicators Summary:
2009 2010 2011 2012a
Total Capital Project and Production Stage Rigs 68 73 78 87
Utilisation Percentage 65% 80% 80% 74%
ARPOR (US$) 54,386 66,235 78,502 73,401
Total Exploration Stage Rigs 40 43 54 60
Utilisation Percentage 39% 23% 58% 67%
ARPOR (US$) 16,859 16,531 29,989 22,724
Source: Master Drilling Group Limited a As at 30 June

Page 26
Maintain sufficient working capital and balance sheet
strength to weather economic downturns
RISK MANAGEMENT & MITIGANTS:
Focus on diversification across key commodity groups,
including early, mid and late-cycle commodities
Geographical diversification and active relationship
management with local government authorities
Cultivate future senior managers from within through
continual investment in employee training and development
Core raiseboring business is a specialised, niche market in
which Master Drilling is a leading recognised provider
Aim to match currency of revenues, costs and liabilities;
utilise FX hedging instruments where possible
Management expertise and prudence in accepting contracts;
DTS subsidiary ensures availability of custom supplies
5. OPERATIONS
Risks & Mitigants
MACROECONOMIC RISK:
Global economic downturn & capital market weakness
SELECTED KEY RISKS TO MASTER DRILLING:
COMMODITY MARKET RISK:
Exposure to fluctuations in commodity prices
GEOPOLITICAL RISK:
Heightened risk in high opportunity emerging markets
PERSONNEL RISK:
Loss of key managers & inability to recruit/retain skilled personnel
COMPETITION RISK:
Competition from alternative suppliers of drilling services
FOREIGN EXCHANGE RISK:
Exposure to fluctuations in foreign exchange rates
OPERATIONAL RISK:
Management failure to successfully execute on contracts

Page 27
0
20
40
60
80
100
120
140
160
180
2009 2010 2011 Aug 2012
Nu
mb
er
of
Dri
ll R
igs
XXL Raisebore
X Large Raisebore
Large Raisebore
Medium Raisebore
Small Raisebore
Other Specialised Rigs
Blast Hole
Drain / Slot Hole
Blind Hole
Exploration Rigs
33
46
63
27
11
12
10
9
9
9
21
10
0
10
20
30
40
50
60
70
80
90
100
2009 2010 2011 2012H1
Rev
en
ues (
US
$ m
illio
n)
Exploration Stage
Capital Project Stage
Production Stage
5. OPERATIONS
Group Operational Drill Rigs
Group Revenues by Drilling Type, 2009 – 2012H1: Group Total Drill Rigs by Machine Type, 2009 – 2012:
Total:
110
Total:
120
Total:
138
Total:
154
Computational reconciliation of totals may not be possible due to independent rounding
Source: Master Drilling Group Limited
Total:
$53m
Total:
$67m
Total:
$95m
Total:
$46m

Page 28
Historical Financials
Page 29
6. HISTORICAL FINANCIALS
Statement of Financial Position
Statement of Financial Position
US$ 2012H1 2011H1 2011FY 2010FY 2009FY
Assets
Non-Current Assets
Property, Plant and Equipment 54,933,005 44,702,603 50,048,933 42,485,993 33,178,816
Goodwill 169,059 169,059 169,059 0 0
Other Investments 6,892,371 5,499,556 6,836,790 4,162,322 2,702,473
Deferred Tax 1,581,229 352,796 554,694 270,035 0
Total Non-Current Assets 63,575,664 50,724,014 57,609,476 46,918,350 35,881,289
Current Assets
Inventories 12,434,799 11,243,044 10,546,672 4,430,411 3,314,600
Loans to Employees 426,895 84,749 91,284 88,490 69,882
Current Tax Receivable 36,500 717,243 248,428 117,797 38,199
Trade and Other Receivables 19,653,798 18,690,159 21,994,988 16,699,472 11,928,189
Cash and Cash Equivalents 3,009,014 3,260,044 1,499,980 1,999,756 3,815,905
Total Current Assets 35,561,006 33,995,239 34,381,352 23,335,926 19,166,775
Total Assets 99,136,670 84,719,253 91,990,828 70,254,276 55,048,064
Equity and Liabilities
Equity
Share Capital 120 120 120 120 120
Reserves 3,654,022 2,362,056 1,159,534 3,574,368 3,324,570
Retained Income 53,211,454 43,877,056 48,481,356 38,226,923 29,929,626
Equity Attributable to Equity Holders of Parent 56,865,596 46,239,232 49,641,010 41,801,411 33,254,316
Non-Controlling Interest 447,296 334,421 372,113 163,198 127,344
Total Equity 57,312,892 46,573,653 50,013,123 41,964,609 33,381,660
Liabilities
Non-Current Liabilities
Other Financial Liabilities 5,418,611 1,279,330 2,761,507 1,695,783 3,381,506
Finance Lease Obligation 3,350,908 5,433,413 5,476,836 5,521,650 2,563,351
Deferred Tax 3,262,693 3,917,753 4,557,918 3,277,588 3,162,526
Total Non-Current Liabilities 12,032,212 10,630,496 12,796,261 10,495,021 9,107,383
Current Liabilities
Minority Shareholder Loan 475,143 575,443 727,870 1,735,810 922,565
Other Financial Liabilities 1,676,997 570,709 1,676,997 570,709 825,104
Current Tax Payable 5,525,050 2,927,508 2,598,979 744,150 1,709,176
Finance Lease Obligations 3,737,449 3,944,550 3,737,449 3,944,550 2,262,069
Trade and Other Payables 15,228,150 16,933,798 17,344,370 9,263,507 6,105,079
Bank Overdraft 3,148,777 2,563,096 3,095,779 1,535,919 735,028
Total Current Liabilities 29,791,566 27,515,104 29,181,444 17,794,645 12,559,021
Total Equity and Liabilities 99,136,670 84,719,253 91,990,828 70,254,276 55,048,064
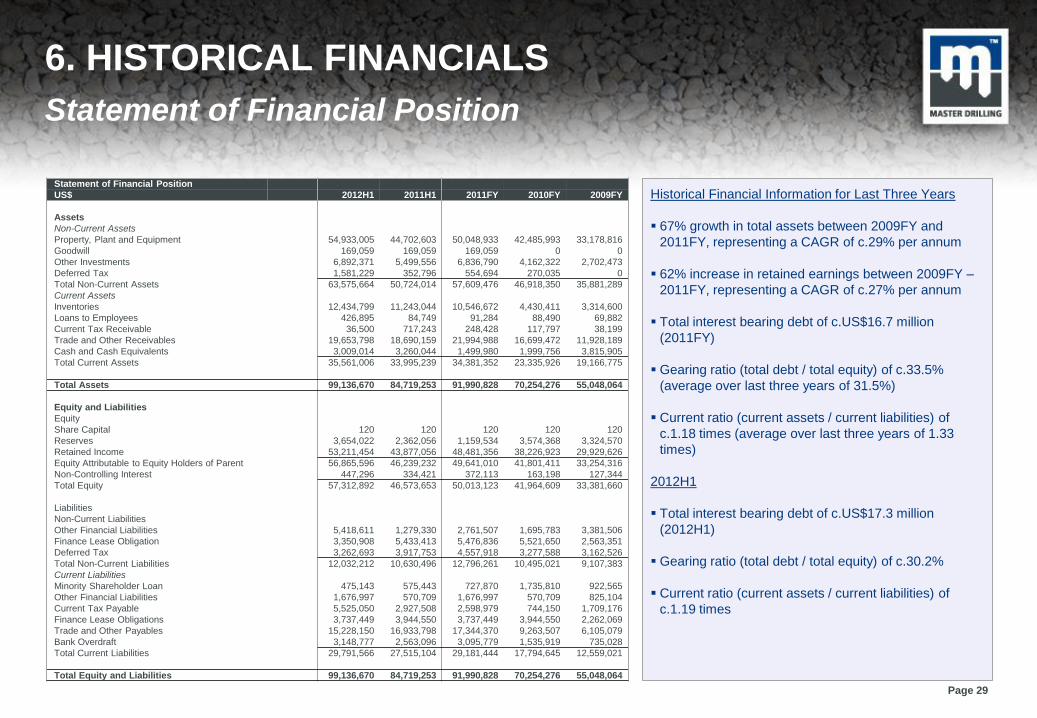
Historical Financial Information for Last Three Years
67% growth in total assets between 2009FY and
2011FY, representing a CAGR of c.29% per annum
62% increase in retained earnings between 2009FY –
2011FY, representing a CAGR of c.27% per annum
Total interest bearing debt of c.US$16.7 million
(2011FY)
Gearing ratio (total debt / total equity) of c.33.5%
(average over last three years of 31.5%)
Current ratio (current assets / current liabilities) of
c.1.18 times (average over last three years of 1.33
times)
2012H1
Total interest bearing debt of c.US$17.3 million
(2012H1)
Gearing ratio (total debt / total equity) of c.30.2%
Current ratio (current assets / current liabilities) of
c.1.19 times

Page 30
Statement of Comprehensive Income
US$ 2012H1 2011H1 2011FY 2010FY 2009FY
Continuing Operations
Revenue 45,713,505 46,197,088 94,631,187 66,694,491 52,982,060
Cost of Sales (30,930,366) (28,019,592) (66,164,018) (46,013,406) (35,211,863)
Gross Profit 14,783,139 18,177,496 28,467,169 20,681,085 17,770,197
Other Income 1,138,576 1,001,011 1,263,783 2,688,485 567,939
Operating Expenses (9,138,283) (10,252,488) (12,382,027) (11,108,114) (8,896,831)
Operating Profit 6,783,432 8,926,019 17,348,925 12,261,456 9,441,305
Investment Revenue 170,809 149,548 223,795 90,767 65,813
Finance Costs (1,131,762) (894,211) (1,997,265) (1,291,916) (887,213)
Profit Before Taxation 5,822,479 8,181,356 15,575,455 11,060,307 8,619,905
Taxation (1,017,198) (2,360,000) (3,900,547) (2,074,509) (2,700,975)
Profit From Continuing Operations 4,805,281 5,821,356 11,674,908 8,985,798 5,918,930
Discontinued Operations
Loss from Discontinued Operations (630,249)
Profit For The Year 4,805,281 5,821,356 11,044,659 8,985,798 5,918,930
Other Comprehensive Income
Exchange Differences on Translating Foreign
Operations 2,471,216 (1,301,133) (2,122,348) 83,721 1,897,048
Gains and Losses on Property Revaluation 23,272 (46,014) (292,486) 166,077 298,607
Other Comprehensive (Loss) Income for the
Year 2,494,488 (1,347,147) (2,414,834) 249,798 2,195,655
Total Comprehensive Income 7,299,769 4,609,043 8,629,825 9,235,596 8,114,585
Net Profit Attributable To:
Owners Of The Parent:
Profit for the Year from Continuing Operations 4,730,098 5,650,133 11,465,993 8,949,944 5,855,181
Loss for the Year from Discontinuing Operations (630,249)
Profit for the Year Attributable to Owners of the
Parent 4,730,098 5,650,133 10,835,744 8,949,944 5,855,181
Non-Controlling Interest:
Profit for the Year from Continuing Operations 75,183 171,223 208,915 35,854 63,749
Total Comprehensive Income Attributable To:
Owners of the Parent 7,224,586 4,437,820 8,420,910 9,199,742 8,050,836
Non-Controlling Interest 75,183 171,223 208,915 35,854 63,749
Total Comprehensive Income 7,299,769 4,609,043 8,629,825 9,235,596 8,114,585
6. HISTORICAL FINANCIALS
Statement of Comprehensive Income
Historical Financial Information for Last Three Years
Top-line revenue growth of 79% between 2009FY and
2011FY, representing a CAGR of c.34% per annum
Gross margin of 30% in 2011FY (average over last
three years of c.32%)
Operating margin of 18% in 2011FY (average over last
three years of 18%)
Net profit margin of 12% in 2011FY (average over last
three years of 12%)
Adjusted EBITDA US$11.5m, US$13.7m & US$19.2m
(2009FY, 2010FY & 2011FY)
Net profit from continuing operations increased 97%
between 2009FY and 2011FY, representing a CAGR of
c.40% per annum
Loss from discontinued operations represents the
Company’s decision to discontinue its exploration
operations in Brazil. The assets from this operation
have been transferred to other operating entities in the
Group
2012H1
Adjusted EBITDA US$11.2m & US$8.2m (2011H1 &
2012H1)

Page 31
Statement of Cash Flows
US$ 2012H1 2011H1 2011FY 2010FY 2009FY
Cash Flows from Operating Activities
Cash Generated from Operations 6,484,069 10,390,757 14,752,818 8,755,460 6,345,569
Interest Income 170,809 149,548 223,795 479,303 514,187
Finance Costs (1,131,762) (894,211) (1,997,265) (1,220,383) (719,871)
Tax Paid 2,120,801 (135,923) (896,289) (3,004,071) (1,505,253)
Net Cash from Operating Activities 7,643,917 9,510,171 12,083,059 5,010,309 4,634,632
Cash Flows from Investing Activities
Purchase of Property, Plant and Equipment (7,670,022) (6,083,529) (9,476,837) (10,737,468) (11,650,315)
Sale of Property, Plant and Equipment 1,473,490 1,242,503 843,991 2,207,621 2,570,003
Increase in Goodwill (169,059)
Sale of Financial Assets (1,026,535) 82,761 (284,659) (270,035) 0
Net Cash from Investing Activities (7,223,067) (4,927,324) (8,917,505) (8,799,882) (9,080,312)
Cash Flows from Financing Activites
Proceeds / (Repayment) of Financial Liabilities 2,657,104 (416,453) 2,172,012 (1,632,039) 4,206,610
Movement in Loans to Employees (335,611) 3,741 (2,794) (18,608) (69,882)
Proceeds from Shareholders Loan 1,427,917
Repayment of Shareholders Loan (55,581) (1,337,234) (2,674,471) (1,459,849)
Repayment of / (Proceeds on) Minority Shareholder Loan (252,727) (1,160,367) (1,007,940) 813,245 922,565
Acquisition of Additional Shares in Subsidiary (1,302,377)
Finance Lease Payments (1,988,683) (1,186,062) (1,932,560) 4,569,247 1,738,027
Dividends Paid (581,311) (652,647) (375,818)
Net Cash from Financing Activities 24,502 (4,096,375) (4,321,501) 498,025 6,926,854
Total Cash Movement for the Year 445,352 320,950 (2,163,887) (2,478,303) 3,403,739
Cash at the Beginning of the Year (595,799) 463,837 463,837 3,080,877 (352,244)
Effect of Exchange Rate Movement on Cash Balances 10,684 (87,839) 104,251 (138,737) 0
Total Cash at End of the Year (139,763) 696,948 (1,595,799) 463,837 3,080,877
6. HISTORICAL FINANCIALS
Statement of Cash Flows
Historical Financial Information for Last Three Years
Cash generated from operations increased by 132%
between 2009FY and 2011FY, representing a CAGR of
c.52% per annum
Increase in net cash from operating activities of 161%
between 2009FY and 2011FY, representing a CAGR of
c.61% per annum
Historically, the majority of Master Drilling’s operating
cash flow has been reinvested into the business to
pursue expansion opportunities
In 2011FY, purchases of PP&E represented c.78% of
net cash generated from operating activities (average
over last three years of c.181%)
Page 32
Outlook on Drilling Services Market

Page 33
7. OUTLOOK ON DRILLING SERVICES MARKET
Overview of Drilling Services Industry
Market correlated to commodity prices & capital markets:
Exploration and development drilling are highly correlated to
commodity prices, mining company equity financings, mining
acquisitions and mine site activity
Drilling services demand for production-stage clients is considerably
less volatile than exploration/development clients due to lower
dependence on commodity prices and equity market financing
Exploration budgets of both senior and early-stage exploration
companies are key leading indicators of global demand for drilling
services
In 2008, high commodity prices drove exploration activity to record
highs with global exploration spending approaching US$14 billion
During the global economic slowdown of 2009, mineral exploration
expenditures fell by over 40%, but have since recovered
Funding for junior miners dried up during financial crisis, resulting in
delay or cancellation of many pre-production mining projects globally
Current outlook for gold and base metal exploration is positive, as
emerging markets continue to drive global demand for commodities
Mineral reserves of both precious and base metals have been
increasingly depleted during the past decade
Reduction in both mine lives and mined grade likely to lead to an
extended recovery in exploration and development activity
EXPLORATION
DRILLING
SERVICES
MINE
DEVELOPMENT
DRILLING
SERVICES
PRODUCTION
DRILLING
SERVICES
Focussed on discovery of new
mineral deposits and to determine
whether reserves are sufficient to
justify project development
High volatility due to dependence
on junior miners, commodity
cycles and availability of financing
Initial establishment of mine
infrastructure, including tunnels,
ventilation shafts, dewatering
systems and ore passes
Continued core drilling for accurate
definition of geological conditions
Tends to be high margin
Multiple purposes, including
establishment or expansion or
ventilation shafts and ore passes
Typically undertaken for majors
and established mining
companies, resulting in greater
contract frequency and reliability

Page 34
-25%
0%
25%
50%
75%
100%
125%
150%
175%
200%
225%
250%
Jan 0
9
Ap
r 0
9
Ju
l 0
9
Oct 0
9
Ja
n 1
0
Apr
10
Ju
l 1
0
Oct 1
0
Ja
n 1
1
Apr
11
Ju
l 1
1
Oct 1
1
Ja
n 1
2
Ap
r 1
2
Ju
l 1
2
Pri
ce P
erf
orm
an
ce
(2
00
9 =
0%
) Gold Spot (US$/oz)
Copper Spot (US$/lb)
-100%
0%
100%
200%
300%
400%
500%
600%
700%
800%
900%
1000%
1100%
Ja
n 0
9
Ap
r 0
9
Ju
l 0
9
Oct 0
9
Jan 1
0
Ap
r 1
0
Ju
l 1
0
Oct 1
0
Ja
n 1
1
Ap
r 1
1
Ju
l 1
1
Oct 1
1
Ja
n 1
2
Ap
r 1
2
Ju
l 1
2
Boart Longyear Ltd
Major Drilling Group Int.
Ausdrill Ltd
Foraco International
Energold Drilling Corp
MSCI M&M Index
7. OUTLOOK ON DRILLING SERVICES MARKET
Performance of Key Commodities & Drilling Equities
Rising gold & copper prices benefit drillers: Drilling equities outperformed mining index since ‘09:
Source: Bloomberg Finance L.P. Source: Bloomberg Finance L.P.
-6%
57%
179%
250% 304%
580%
101%
175%

Page 35
9
22
33
19
54
34
38
0
10
20
30
40
50
60
2005
2006
2007
2008
2009
2010
2011
Eq
uit
y C
ap
ital R
ais
ed
* (
US
$b
n)
*Includes IPO, follow-on equity
and convertible bonds across
ASX, TSX, TSX-V, London,
London AIM and JSE markets
7. OUTLOOK ON DRILLING SERVICES MARKET
Mining Capital Raising & Exploration Spending
Large increase in mining capital raised since ‘05: Robust recovery in exploration spend post–GFC:
Source: Thomson Financial Source: Metals Economics Group, 2012
2.7
4.4
6.0
8.8
12.2
15.1
8.5
12.4
16.3
19.0
20.4
19.3
17.1
18.0
20.8
0
5
10
15
20
25
2003
2004
2005
2006
2007
2008
2009
2010
2011
2012e
2013e
2014e
2015e
2016e
2017e
No
n-F
err
ou
s E
xp
lora
tio
n S
pen
din
g (
US
$b
)
Page 36
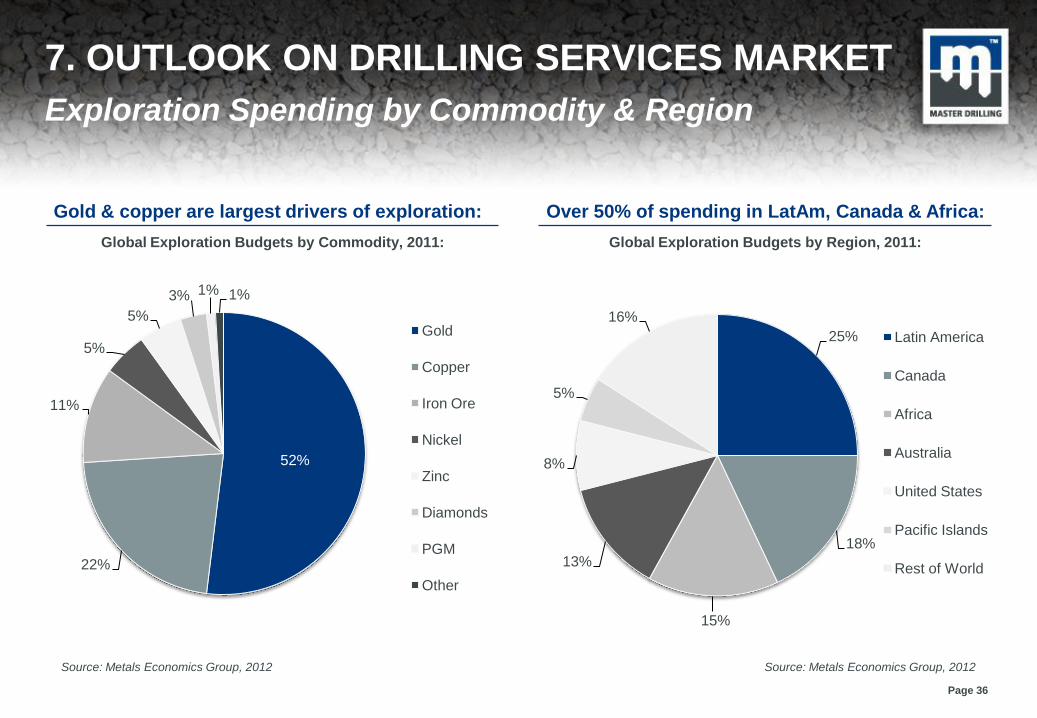
52%
22%
11%
5%
5%
3% 1% 1%
Gold
Copper
Iron Ore
Nickel
Zinc
Diamonds
PGM
Other
7. OUTLOOK ON DRILLING SERVICES MARKET
Exploration Spending by Commodity & Region
Gold & copper are largest drivers of exploration: Over 50% of spending in LatAm, Canada & Africa:
Source: Metals Economics Group, 2012 Source: Metals Economics Group, 2012
Global Exploration Budgets by Commodity, 2011: Global Exploration Budgets by Region, 2011:
25%
18%
15%
13%
8%
5%
16%
Latin America
Canada
Africa
Australia
United States
Pacific Islands
Rest of World
Page 37
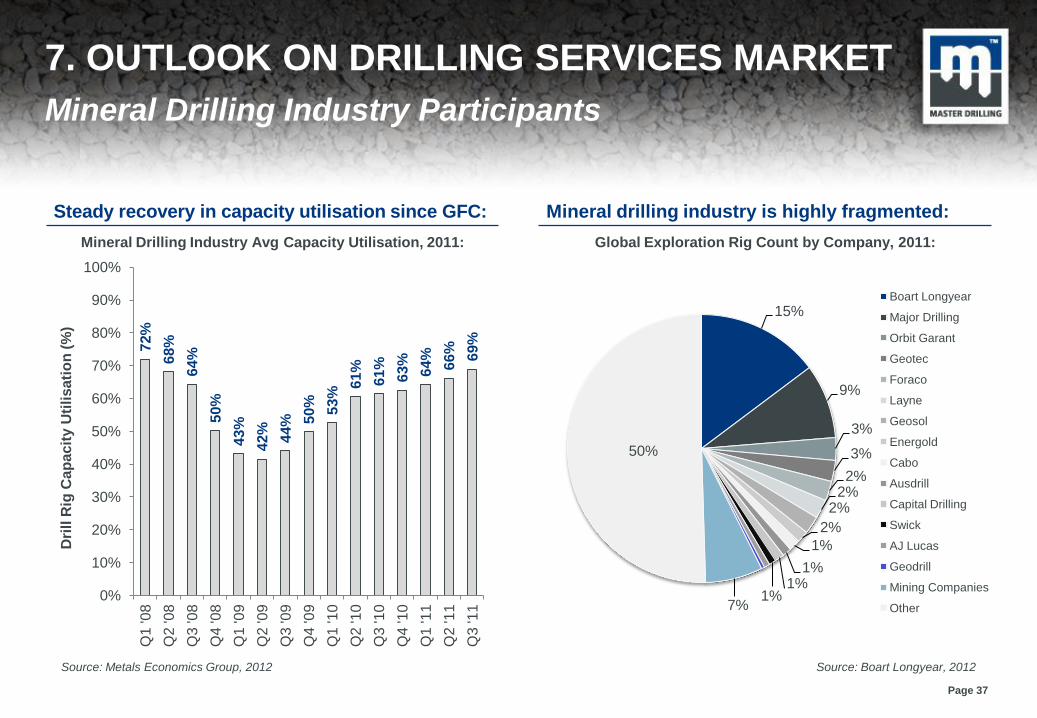
72%
68%
64%
50%
43%
42%
44%
50%
53%
61%
61%
63
%
64%
66%
69%
0%
10%
20%
30%
40%
50%
60%
70%
80%
90%
100%
Q1 '0
8
Q2
'08
Q3
'08
Q4
'08
Q1
'09
Q2
'09
Q3
'09
Q4
'09
Q1
'10
Q2 '1
0
Q3
'10
Q4
'10
Q1
'11
Q2
'11
Q3
'11
Dri
ll R
ig C
ap
acit
y U
tili
sati
on
(%
) 7. OUTLOOK ON DRILLING SERVICES MARKET
Mineral Drilling Industry Participants
Steady recovery in capacity utilisation since GFC: Mineral drilling industry is highly fragmented:
Source: Metals Economics Group, 2012 Source: Boart Longyear, 2012
Mineral Drilling Industry Avg Capacity Utilisation, 2011: Global Exploration Rig Count by Company, 2011:
15%
9%
3%
3%
2% 2%
2%
2%
1%
1% 1%
1% 7%
50%
Boart Longyear
Major Drilling
Orbit Garant
Geotec
Foraco
Layne
Geosol
Energold
Cabo
Ausdrill
Capital Drilling
Swick
AJ Lucas
Geodrill
Mining Companies
Other