Marshalls plc
Delivering
long-term
sustainable
growth
2018 Half Year ResultsReview and Outlook

Agenda
Delivering long-term sustainable growth
• Highlights
• Financial Performance
• The Market
• Delivering Long-Term Sustainable Growth
• Public Sector and Commercial
• Domestic
• Emerging UK Businesses
• CPM
• Strategy Update
• Summary
• Questions
Find us on Facebook
MarshallsGroup
Follow us on Twitter
@MarshallsGroup
Follow us on LinkedIn
Marshalls
Follow us on YouTube
MarshallsTV
Find out more online
www.marshalls.co.uk
2 Marshalls plc 2018 Half Year Results Review and Outlook
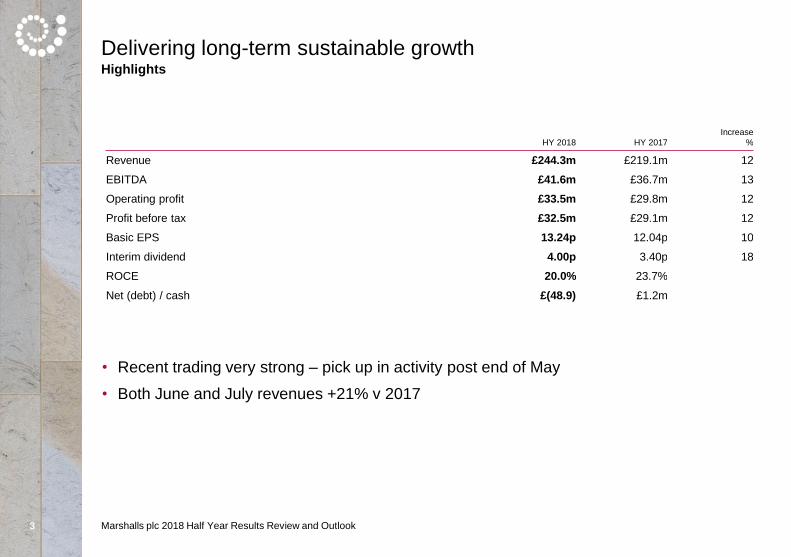
Delivering long-term sustainable growthHighlights
HY 2018 HY 2017
Increase
%
Revenue £244.3m £219.1m 12
EBITDA £41.6m £36.7m 13
Operating profit £33.5m £29.8m 12
Profit before tax £32.5m £29.1m 12
Basic EPS 13.24p 12.04p 10
Interim dividend 4.00p 3.40p 18
ROCE 20.0% 23.7%
Net (debt) / cash £(48.9) £1.2m
3
• Recent trading very strong – pick up in activity post end of May
• Both June and July revenues +21% v 2017
Marshalls plc 2018 Half Year Results Review and Outlook

Delivering long-term sustainable growthHighlights
Marshalls plc 2018 Half Year Results Review and Outlook4
200
250
300
350
400
450
500£m
Revenue
0
5
10
15
20
25
30
pe
nce
Basic EPS
0
20
40
60
80
100
£m
EBITDA
0
5
10
15
pe
nce
Dividend per share (excluding supplementary)

Financial
Performance
Half Year
2018 Results

Delivering long-term sustainable growthRevenue growth
6 Marshalls plc 2018 Half Year Results Review and Outlook
£m

Delivering long-term sustainable growthRevenue analysis
64%
31%
5%
Public Sector &Commercial
UK Domestic
International
81%
14%
5%
Landscape Products
Emerging UK Businesses
International
Revenue analysis: end market Revenue analysis: business area
↑1%
flat
↑19%
↑15%
↓1%
↑1%
7 Marshalls plc 2018 Half Year Results Review and Outlook

Delivering long-term sustainable growthMargin reconciliation
Revenue
£m
Operating profit
£m
Impact on margin
%
HY 2017 219.1 29.8 13.6
Landscape Products 25.3 4.8 0.6
Emerging UK Businesses (0.2) (1.1) (0.5)
International 0.1 - -
HY 2018 244.3 33.5 13.7
8 Marshalls plc 2018 Half Year Results Review and Outlook

Delivering long-term sustainable growthCash flow from operating activities
HY 2018
£m
HY 2017
£m
Cash inflow arising from:
Operating profit 33.5 29.8
Depreciation and amortisation 8.1 6.9
EBITDA 41.6 36.7
Net financial expenses paid (0.7) (0.5)
Taxation paid (6.1) (5.7)
Net gain on sale of property, plant and equipment (1.0) (0.9)
Receivables / payables (11.9) (9.6)
Inventory (7.0) (1.5)
Acquisition / restructuring costs (1.5) -
Equity settled share-based payments and other items 0.6 0.7
Net cash flow from operating activities 14.0 19.2
9 Marshalls plc 2018 Half Year Results Review and Outlook
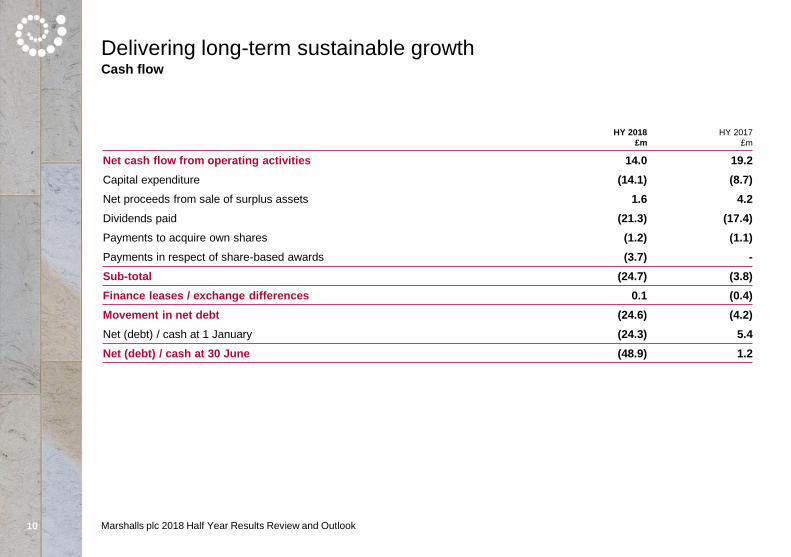
Delivering long-term sustainable growthCash flow
HY 2018
£m
HY 2017
£m
Net cash flow from operating activities 14.0 19.2
Capital expenditure (14.1) (8.7)
Net proceeds from sale of surplus assets 1.6 4.2
Dividends paid (21.3) (17.4)
Payments to acquire own shares (1.2) (1.1)
Payments in respect of share-based awards (3.7) -
Sub-total (24.7) (3.8)
Finance leases / exchange differences 0.1 (0.4)
Movement in net debt (24.6) (4.2)
Net (debt) / cash at 1 January (24.3) 5.4
Net (debt) / cash at 30 June (48.9) 1.2
10 Marshalls plc 2018 Half Year Results Review and Outlook
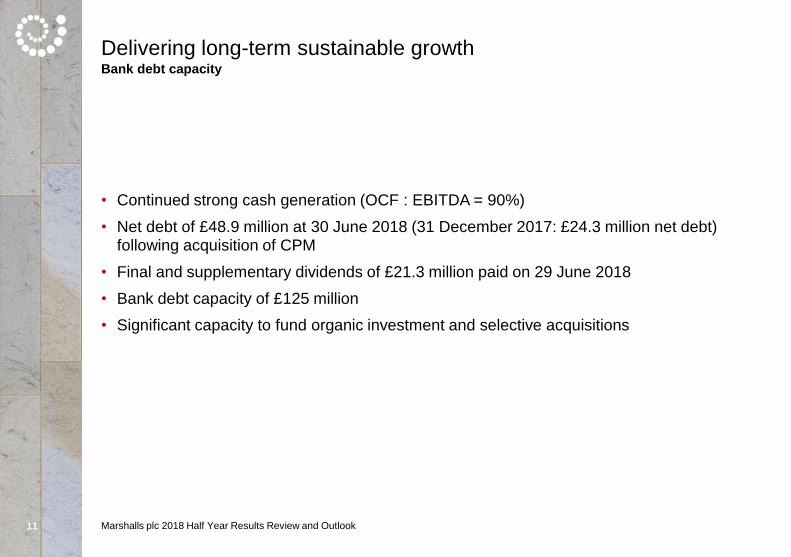
Delivering long-term sustainable growthBank debt capacity
• Continued strong cash generation (OCF : EBITDA = 90%)
• Net debt of £48.9 million at 30 June 2018 (31 December 2017: £24.3 million net debt) following acquisition of CPM
• Final and supplementary dividends of £21.3 million paid on 29 June 2018
• Bank debt capacity of £125 million
• Significant capacity to fund organic investment and selective acquisitions
11 Marshalls plc 2018 Half Year Results Review and Outlook
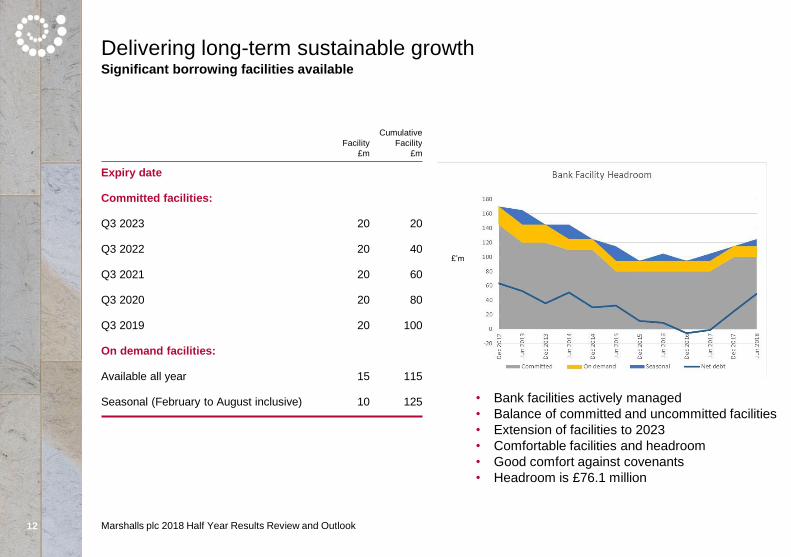
Delivering long-term sustainable growthSignificant borrowing facilities available
Facility
£m
Cumulative
Facility
£m
Expiry date
Committed facilities:
Q3 2023 20 20
Q3 2022 20 40
Q3 2021 20 60
Q3 2020 20 80
Q3 2019 20 100
On demand facilities:
Available all year 15 115
Seasonal (February to August inclusive) 10 125 • Bank facilities actively managed
• Balance of committed and uncommitted facilities
• Extension of facilities to 2023
• Comfortable facilities and headroom
• Good comfort against covenants
• Headroom is £76.1 million
12
£’m
Marshalls plc 2018 Half Year Results Review and Outlook

Delivering long-term sustainable growthCapital allocation policy
1Organic growth
2R&D
NPD
3Ordinary dividends
4Selective acquisitions
5Supplementarydividends
Capital investment in
growth projects.
Plan £28m in 2018
Increase research
and development and
new product
development
Maintain dividend
cover of 2 times
earnings over the
business cycle
Target selective
bolt-on acquisition
opportunities in
Water Management,
Street Furniture and
Minerals
Supplementary
dividends when
appropriate.
Discretionary and
non-recurring
13 Marshalls plc 2018 Half Year Results Review and Outlook

Delivering long-term sustainable growthStrong track record of capital discipline
HY
2018
HY
2017
HY
2016
HY
2015
HY
2014
Debtor days 33 34 34 36 42
Creditor days 53 52 51 51 53
Inventory turn (times per annum) 3.2 3.3 3.2 3.0 2.9
Liquidity ratio
(current assets: current liabilities)
1.6 1.6 1.5 1.6 1.5
ROCE 20.0% 23.7% 19.9% 15.2% 10.1%
Gearing 20.0% N/A 4.3% 17.9% 28.8%
Net cash / (debt) £(48.9)m £1.2m £(8.8)m £(32.9)m £(50.9)m
Net assets £244.6m £222.6m £204.9m £184.0m £177.0m
14 Marshalls plc 2018 Half Year Results Review and Outlook

-50
-40
-30
-20
-10
0
10
20
Delivering long-term sustainable growthPensions
Balance Sheet
• Company contributions to Defined Benefit Scheme reduced to zero under agreed Recovery Plan
• Surplus of £11.5 million at 30 June 2018 (31 December 2017: surplus of £4.1 million)
Income Statement
• Scheme closed since 2006 to future accrual
• Net service cost: £0.3 million debit (2017: £0.2 million debit)
• Looking to “transfer out” long term
Accounting valuation
Actuarial valuation: Formal£m
15 Marshalls plc 2018 Half Year Results Review and Outlook

Delivering long-term sustainable growthDividends
• Progressive ordinary dividend policy
• 2018 interim dividend 4.0p (up 18%)
• Target of 2x cover
• Supplementary dividend: discretionary and non-recurring
• CAGR growth of 18% over 5 years
16 Marshalls plc 2018 Half Year Results Review and Outlook
2.00 2.25 2.90 3.40 4.00
4.004.75
5.806.80
2.00
3.00
4.00
0.00
2.00
4.00
6.00
8.00
10.00
12.00
14.00
16.00
2014 2015 2016 2017 2018
Interim Final Supplementary

The Market
Half Year
2018 Results
New photo to be provided

1.5%
8.8%
4.4%4.1%
7.1%
-0.6%
2.3%1.9%
-2.0%
0.0%
2.0%
4.0%
6.0%
8.0%
10.0%
2013 2014 2015 2016 2017 2018 2019 2020
All Work Central Forecast % Growth on Last Year
Delivering long-term sustainable growth
Marshalls plc 2018 Half Year Results Review and Outlook
CPA construction output forecasts – Summer 2018
18
Note: Historic numbers are the latest ONS adjusted figures

Delivering long-term sustainable growth
Marshalls plc 2018 Half Year Results Review and Outlook
CPA 2018 to 2020 cumulative sector forecasts
6.1%8.2% 7.9%
24.5%
-4.7%
6.4%
-9.8%
4.4%
-5.0%
4.0%
1.7%
-5.0%
5.1%
2.0% 2.2% 1.9%3.6%
-15.0%
-10.0%
-5.0%
0.0%
5.0%
10.0%
15.0%
20.0%
25.0%
30.0%
Ne
w H
ou
sin
g P
ub
lic
Ne
w H
ou
sin
g P
riva
te
All
Ne
w H
ou
sin
g
Ne
w In
fras
tru
ctu
re
Ne
w P
ub
lic O
the
r
Ne
w P
riva
te In
du
stri
al
Ne
w P
riva
te C
om
mer
cial
All
Ne
w W
ork
Pu
blic
Ho
usi
ng
RM
&I
Pri
vate
Ho
usi
ng
RM
&I
All
Ho
usi
ng
RM
&I
Pu
blic
Oth
er R
M&
I
Pri
vate
Oth
er R
M&
I
Infr
astr
uct
ure
R&
M
All
No
n H
ou
sin
g R
M&
I
All
RM
&I
All
Wo
rk
2020 2019 201819
Key sectors for Marshalls

New Build Housing
• 22% of Construction Market by Value
• 2018 to 2020 Cumulative Growth of 7.9%
Infrastructure
• 15% of Construction Market by Value
• 2018 to 2020 Cumulative Growth of 28.5%
Private Housing RMI
• 13% of Construction Market by Value
• 2018 to 2020 Cumulative Growth of 4%
20 Marshalls plc 2018 Half Year Results Review and Outlook
Delivering long-term sustainable growthFocus on the sectors with greatest growth and scaleMarshalls are focused on these sectors

Public Sector &
Commercial
Half Year
2018 Results

7.9%
3.4%
-12.0%
-10.0%
-8.0%
-6.0%
-4.0%
-2.0%
0.0%
2.0%
4.0%
6.0%
8.0%
10.0%
12.0%
-30.0%
-20.0%
-10.0%
0.0%
10.0%
20.0%
30.0%
MA
T H
ard
Lan
dsc
apin
g V
alu
e La
gged
12
Mo
nth
s
Har
d L
and
scap
ing
Val
ue
Lagg
ed 1
2 M
on
ths
All Scapes Next 12 Months Hard Landscaping Value % Change
Hard Landscaping Value Lagged 12 Months MAT Hard Landscaping Value Lagged 12 Months
Delivering long-term sustainable growth
Marshalls plc 2018 Half Year Results Review and Outlook
ABI lead indicatorPositive one year out
22

-
50,000
100,000
150,000
200,000
250,000
2010 2011 2012 2013 2014 2015 2016 2017 2018 2019 2020
New Housing Starts & CPA Forecast
Private Public Private Forecast Public Forecast
0.5%
-8.7%
20.6%
13.3%
5.4%3.6%
5.1%
2.0% 1.7%0.8%
-15.0%
-10.0%
-5.0%
0.0%
5.0%
10.0%
15.0%
20.0%
25.0%
2011 2012 2013 2014 2015 2016 2017 2018 2019 2020
Growth in New Housing Starts & CPA Forecast
Total Growth Total Growth Forecast
Delivering long-term sustainable growth
Marshalls plc 2018 Half Year Results Review and Outlook
Private and public housing statistics and CPA forecasts
0.5%
-8.7%
20.6%
13.3%
5.4%3.6%
5.1%
2.0% 1.7%0.8%
-15.0%
-10.0%
-5.0%
0.0%
5.0%
10.0%
15.0%
20.0%
25.0%
2011 2012 2013 2014 2015 2016 2017 2018 2019 2020
Growth in New Housing Starts & CPA Forecast
Total Growth Total Growth Forecast
23

Delivering long-term sustainable growth
Marshalls plc 2018 Half Year Results Review and Outlook
Housing contract awards by region June 2017-18
24

• ‘Key’ package launched: premium
complimentary block, paving, kerb
and edging product specifically for
the housebuilder
• Urbex Rivien paving launched:
economy paving designed for the
housebuilder
• Consistent Growth in Specifications
H1 2016 H1 2017 H1 2018
Delivering long-term sustainable growth
Marshalls plc 2018 Half Year Results Review and Outlook
Marshalls Landscape Products - new products for housingIncreasing sales
25
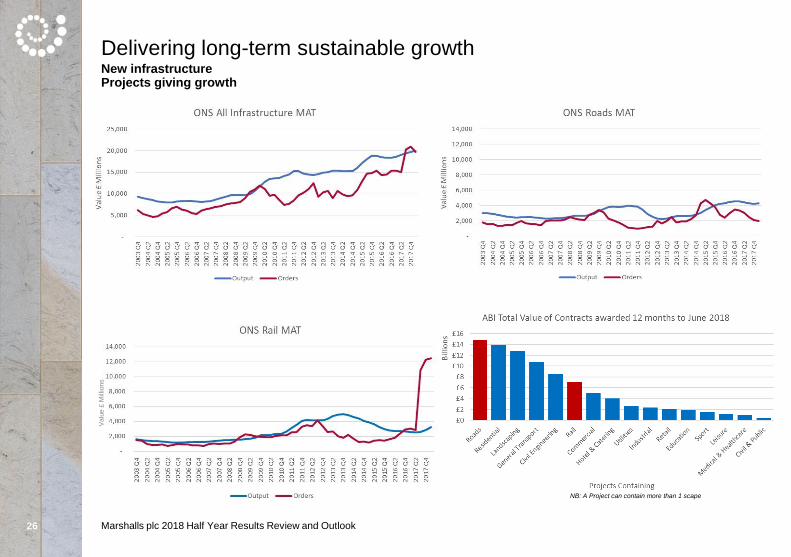
NB: A Project can contain more than 1 scape
Delivering long-term sustainable growth
Marshalls plc 2018 Half Year Results Review and Outlook
New infrastructureProjects giving growth
26
Valu
e £
Millions
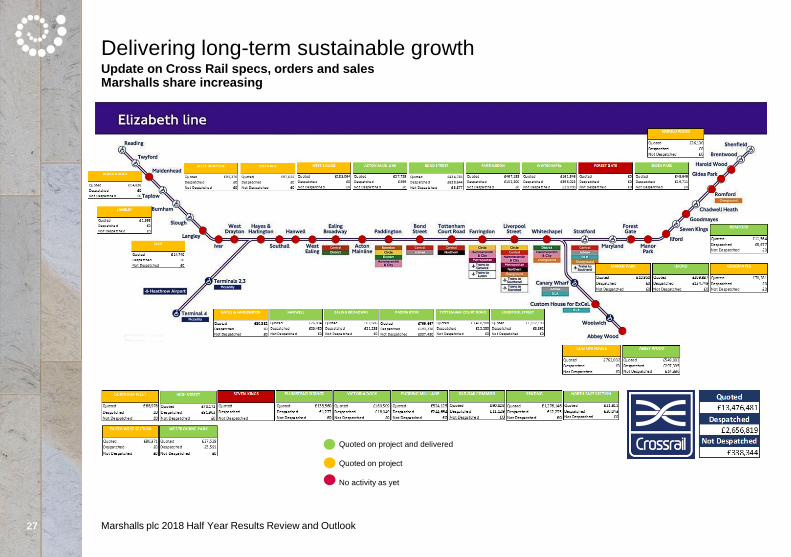
Quoted on project and delivered
Quoted on project
No activity as yet
Delivering long-term sustainable growth
Marshalls plc 2018 Half Year Results Review and Outlook
Update on Cross Rail specs, orders and salesMarshalls share increasing
27

Domestic
Half Year
2018 Results

0.0%
2.0%
4.0%
6.0%
8.0%
10.0%
12.0%
-
5,000
10,000
15,000
20,000
25,000
30,000
2013 2014 2015 2016 2017 2018 2019 2020
Gro
wth
% v
LY
Val
ue
£ M
illio
ns
CPA Private Housing RM&I Forecast
Value Growth % v LY
Delivering long-term sustainable growth
Marshalls plc 2018 Half Year Results Review and Outlook
Positive for 2019 and 2020 support growth
29
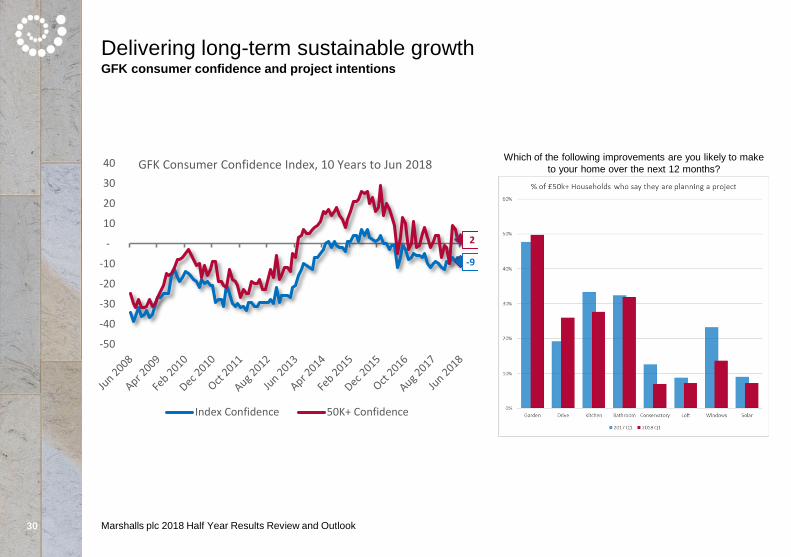
-9
2
-50
-40
-30
-20
-10
-
10
20
30
40 GFK Consumer Confidence Index, 10 Years to Jun 2018
Index Confidence 50K+ Confidence
Which of the following improvements are you likely to make
to your home over the next 12 months?
Delivering long-term sustainable growth
Marshalls plc 2018 Half Year Results Review and Outlook
GFK consumer confidence and project intentions
30

£0.00
£1.00
£2.00
£3.00
£4.00
£5.00
£6.00
£7.00
Mo
vin
g A
nn
ual
To
tal V
alu
e £b
n
Moving Annual Total Value & Annual Value per Individual (£) of Flexible Payments from Pensions
0
50,000
100,000
150,000
200,000
250,000
Number of Individuals
Delivering long-term sustainable growth
Marshalls plc 2018 Half Year Results Review and Outlook
Pensions releaseContinuing to grow
31

£0
£500
£1,000
£1,500
£2,000
£2,500
Tota
l Eq
uit
y R
elea
se V
alu
e (£
mill
ion
s)
Equity Release over 55's (Lifetime Mortgage Values)
2015 2016 2017*
*2017 Proportions based on half year results Sources: Equity Release Council & Key Retirement
Delivering long-term sustainable growth
Marshalls plc 2018 Half Year Results Review and Outlook
Equity release – over 55’sFunding Domestic growth
32
Delivering long-term sustainable growth
Marshalls plc 2018 Half Year Results Review and Outlook
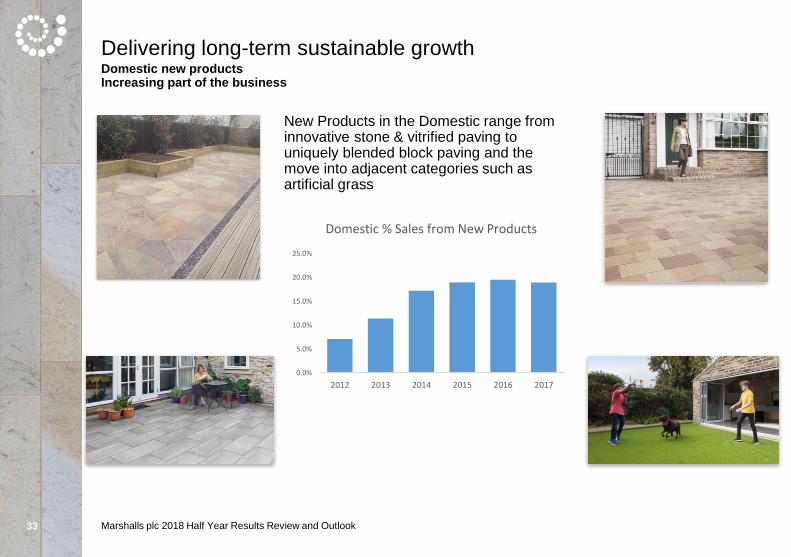
Domestic new productsIncreasing part of the business
New Products in the Domestic range from innovative stone & vitrified paving to uniquely blended block paving and the move into adjacent categories such as artificial grass
33
0.0%
5.0%
10.0%
15.0%
20.0%
25.0%
2012 2013 2014 2015 2016 2017
Domestic % Sales from New Products

Delivering long-term sustainable growth
Marshalls plc 2018 Half Year Results Review and Outlook
The Marshalls RegisterContinues to grow
The Marshalls Register continues to go from strength to strength.
Recent census with all members saw a satisfaction rating
of 8.5 out of 10.
The primary reason for joining the Register is the brand association with the support they receive from Marshalls coming second.
The 10 year awards were the biggest and best yet with the standards getting forever higher.
34

Emerging UK
Businesses
Half Year
2018 Results

Delivering long-term sustainable growth
Marshalls plc 2018 Half Year Results Review and Outlook
Landscape ProtectionMarket growing quickly
• Specifications up 291% vs LY 2017 H1
36

2010 2011 2012 2013 2014 2015 2016 2017
Sales Growth
Current
New /
Proposed
Current Mortar Sites and
Expansion Opportunities• UK market leader in supply of RTU mortar and screeds
• 14 UK plants with expansion opportunities in the South
East
• New Product Development :
New mortars to compliment our Recon Walling
Flowing liquid screeds and quick drying semi dry
screeds
Delivering long-term sustainable growth
Marshalls plc 2018 Half Year Results Review and Outlook
Premier Mortars and ScreedsExpanding nationally
37

Delivering long-term sustainable growth
Marshalls plc 2018 Half Year Results Review and Outlook
Recon WallingGrowing in New Build
38
4 Distinct Colours
4 Finishes
2012 2013 2014 2015 2016 2017
Sales Growth

Delivering long-term sustainable growth
Marshalls plc 2018 Half Year Results Review and Outlook
CPM brand alignment
39

Delivering long-term sustainable growth
40
CPM integrationOn target
• Acquired in October 2017 for £41.4 million including £3 million of assumed CPM debt
• Integration plan well advanced – now fully part of Landscape Products
• Strong trading since acquisition with half year performance in line with our expectations
• Strong order book – first smart motorway order received
• Numerous cross-selling opportunities
• Strong pipeline of new products
• Significant capital expenditure with new £5 million facility at Mells in Somerset increasing capacity and efficiency
Marshalls plc 2018 Half Year Results Review and Outlook

Delivering long-term sustainable growth
Marshalls plc 2018 Half Year Results Review and Outlook
CPM major project wins
• M20 Smart Motorway Programme Junctions 3-5
• M23 Smart Motorway Programme Junctions 8-10
• M6 Smart Motorway Programme Junctions 2-4
41
Delivering long-term sustainable growth
Marshalls plc 2018 Half Year Results Review and Outlook
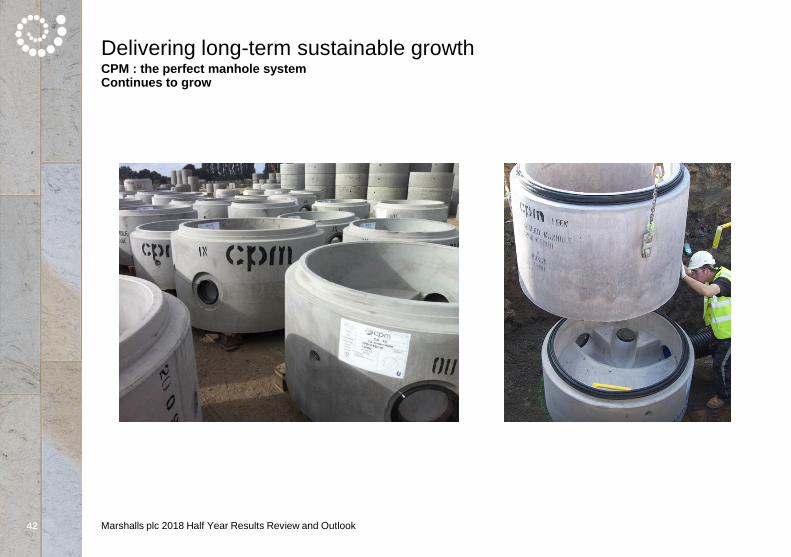
CPM : the perfect manhole systemContinues to grow
42

Delivering long-term sustainable growth
Marshalls plc 2018 Half Year Results Review and Outlook
CPM new factory due to be completed November 2018
Increased efficiency … Increased capacity
43

Strategy Update
Half Year
2018 Results

Delivering long-term sustainable growthDigital journey gaining paceProgression of user minutes spent on Marshalls online
45 Marshalls plc 2018 Half Year Results Review and Outlook
Mins

Delivering long-term sustainable growthDigitising the specification journey
46 Marshalls plc 2018 Half Year Results Review and Outlook
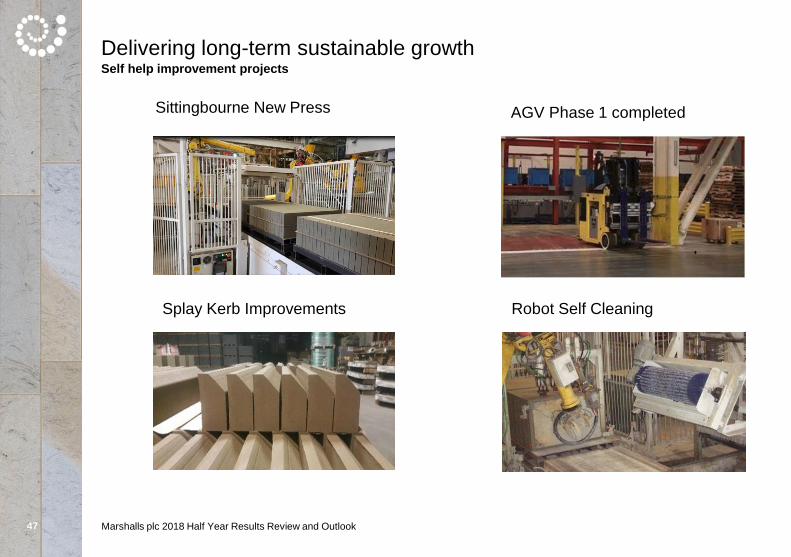
Delivering long-term sustainable growthSelf help improvement projects
47 Marshalls plc 2018 Half Year Results Review and Outlook
Sittingbourne New Press
Splay Kerb Improvements
AGV Phase 1 completed
Robot Self Cleaning
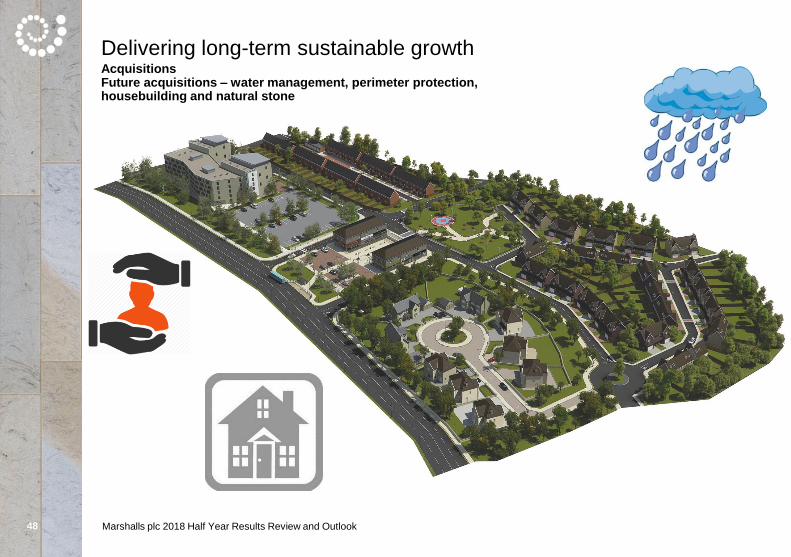
Delivering long-term sustainable growthAcquisitionsFuture acquisitions – water management, perimeter protection, housebuilding and natural stone
48 Marshalls plc 2018 Half Year Results Review and Outlook
Strategy update
Delivering long-term sustainable growth
49
• Adverse weather impact in first 4 months – reduced sales of £9 million
• Strong recovery recently with half year PBT + 12%
• Recent trading very strong – both June and July revenues +21% v 2017
• CPM continuing to trade strongly and integration well advanced
• Organic capital investment continues
• Restructuring of certain of the Emerging UK Businesses
• Continued focus on innovation and new product development
• Digital strategy progressing rapidly – driving real benefits across the business
• Acquisition targets continue to be identified – selective and investment criteria in place
• Maintained a 2 times dividend cover policy, supported by supplementary dividends.
The 2020 Strategy will drive long-term growth and shareholder returns
Marshalls plc 2018 Half Year Results Review and Outlook

Delivering long-term sustainable growth2020 Strategy update
• Strong PBT growth +12%
• 2018 H1 EBITDA £41.6 million +13%
• Self help programme - savings of £5 million p.a. increasingly certain
• NPD continuing strongly
• Interim dividend – +18%
• Digital strategy in full implementation. Commercial website now ‘live’, Domestic to follow shortly
• First acquisition bedding in; strong pipeline of future acquisition targets
• Continuing development of the Marshalls brand
• 2020 Strategy increasingly confident to deliver its goals
Our 2020 Strategy will drive long-term growth and shareholder returns
Marshalls plc 2018 Half Year Results Review and Outlook50

Delivering long-term sustainable growthSummary
• Strong financial performance; despite adverse weather impact in first 4 months
• New Build Housing, Road, Rail and Water Management remain attractive markets
• Increasing market share through service/product
• Strong start at CPM and integration on track
• Well placed to deliver continued growth and operational profit improvements
• Both June and July revenues +21% v 2017
• Board remains confident of achieving its expectations for 2018
51 Marshalls plc 2018 Half Year Results Review and Outlook

Q&A
Half Year
2018 Results

Appendices
Half Year
2018 Results

Delivering long-term sustainable growthProfit for the financial period
HY 2018
£m
HY 2017
£m
Increase
%
EBITDA 41.6 36.7 13
Depreciation / amortisation (8.1) (6.9)
Operating profit 33.5 29.8 12
Financial income and expense (net) (1.0) (0.7)
Profit before tax 32.5 29.1 12
54 Marshalls plc 2018 Half Year Results Review and Outlook

Delivering long-term sustainable growthConstruction Products Association
£m / % change
2016
Actual
2017
Actual
2018
Estimate
2019
Forecast
2020
Forecast
Housing
34,578 37,966 39,754 40,606 40,953
10.4% 9.8% 4.7% 2.1% 0.9%
Other New Work
61,243 63,584 61,185 63,161 65,092
2.5% 3.8% -3.8% 3.2% 3.1
Repair, Maintenance and Improvement
Private Housing 19,908 22,088 22,088 22,530 22,980
7.2% 11.0% - 2.0% 2.0%
Total 52,871 55,636 55,278 56,012 56,721
1.6% 5.2% -0.6% 1.3% 1.3%
Total All Work 148,692 157,186 156,217 159,779 162,766
3.9% 5.7% -0.6% 2.3% 1.9%
55 Marshalls plc 2018 Half Year Results Review and Outlook
Note: Figures taken from the latest CPA Summer Forecast

Additional information and ratios
HY 2018 HY 2017
Interest:
Charge £1.0m £0.7m
Cover 34.0 times 42.4 times
EPS 13.24p 12.04p
Interim dividend 4.00p 3.40p
Weighted average number of shares 197.6m 197.4m
Net asset value £244.6m £222.6m
Delivering long-term sustainable growth
56 Marshalls plc 2018 Half Year Results Review and Outlook
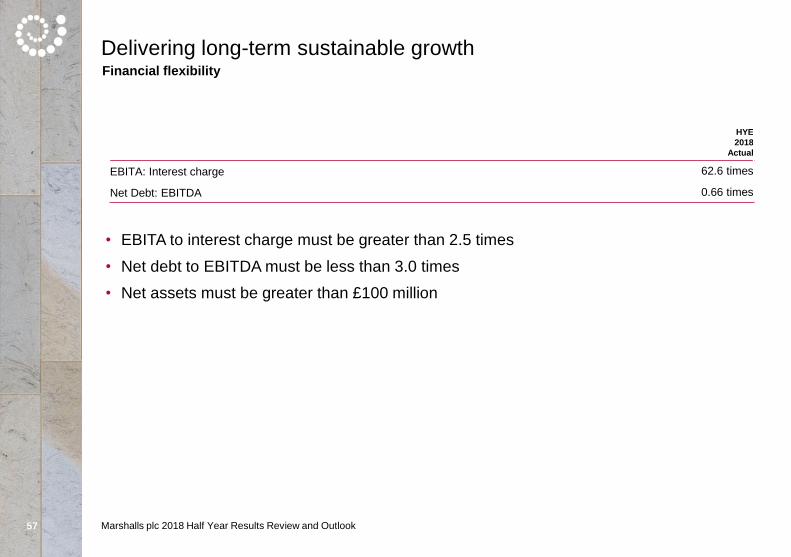
Delivering long-term sustainable growthFinancial flexibility
• EBITA to interest charge must be greater than 2.5 times
• Net debt to EBITDA must be less than 3.0 times
• Net assets must be greater than £100 million
HYE
2018
Actual
EBITA: Interest charge 62.6 times
Net Debt: EBITDA 0.66 times
57 Marshalls plc 2018 Half Year Results Review and Outlook

Delivering long-term sustainable growthNet assets
£m
2017 YE Net Assets 237.6
Impact of movements in the period:
Profit for the financial period 26.2
Dividends (21.3)
Actuarial movement on pensions (after tax) 6.4
Hedging reserve 0.2
Share-based payments (after tax) (3.2)
Purchase of own shares (1.2)
Foreign currency translation differences / other (0.1)
Non-controlling interest -
7.0
HYE 2018 Net Assets 244.6
58 Marshalls plc 2018 Half Year Results Review and Outlook

Delivering long-term sustainable growth
• For the purposes of the following disclaimer, references to this “presentation” shall be deemed to include references to the
presenters’ speeches, the question and answer session and any other related verbal or written communications.
• This presentation, which is personal to the recipient and has been issued by Marshalls plc (“Marshalls”), comprises slides for a
presentation in relation to Marshalls preliminary results, and is solely for use at such presentation.
• This presentation and these slides are confidential and may not be reproduced, redistributed or passed on directly or indirectly to
any other person or published in whole or in part for any purpose.
• This presentation and associated discussion includes forward-looking statements. Information contained in this presentation
relating to Marshalls has been compiled from public sources. All statements other than statements of historical fact included in this
announcement, including without limitation those regarding the plans, objectives and expected performance of Marshalls, are
forward-looking statements. Marshalls has based these forward-looking statements on its current expectations and projections
about future events, including numerous assumptions regarding its present and future business strategies, operations, and the
environment in which it will operate in the future.
• Forward-looking statements generally can be identified by the use of forward-looking terminology such as 'ambition', 'may', 'will',
'could', 'would', 'expect', 'intend', 'estimate', 'anticipate', 'believe', 'plan', 'seek' or 'continue', or negative forms or variations of
similar terminology. Such forward-looking statements involve known and unknown risks, uncertainties, assumptions and other
factors related to Marshalls.
• By their nature, forward-looking statements involve risks, uncertainties and assumptions and many relate to factors which are
beyond the control of Marshalls, such as future market and economic conditions, external factors affecting operations and the
behaviour of other market participants. Actual results may differ materially from those expressed in forward-looking statements.
Given these risks, uncertainties, and assumptions, you are cautioned not to put undue reliance on any forward-looking statements.
In addition, the inclusion of such forward-looking statements should under no circumstances be regarded as a representation by
Marshalls that Marshalls will achieve any results set out in such statements or that the underlying assumptions used will in fact be
the case.
• Other than as required by applicable law or the applicable rules of any exchange on which securities of Marshalls may be listed,
Marshalls has no intention or obligation to update or revise any forward-looking statements included in this presentation.
• This presentation is for information only and does not constitute or form part of any offer or invitation to sell, or any solicitation of
any offer to purchase, any shares in Marshalls or any other securities, nor shall it or any part of it nor the fact of its distribution
form the basis of, or be relied upon in connection with, any contract or investment decision related thereto. No investment advice
is being given in this presentation.
Disclaimer
59 Marshalls plc 2018 Half Year Results Review and Outlook