MARKET-DRIVING INNOVATION:
UNDERSTANDING THE CRITICAL SUCCESS FACTORS
AT THE FRONT END OF THE DEVELOPMENT PROCESS
Thesis submitted in fulfilment of the requirements for the Degree of
DOCTOR OF PHILOSOPHY
Onnida Thongpravati
B.Bus (eCommerce), M.Bus & InfTech
School of Economics, Finance and Marketing
College of Business
RMIT University
June 2014

i
DECLARATION
I certify that, except where due acknowledge has been made, this thesis is the original work
of the author alone. The thesis has not been submitted previously, in whole or in part, to
qualify for any other academic award. The content of thesis is the result of work that has
been carried out since the official commencement date of the approved research program,
and any editorial work, paid or unpaid, carried out by a third party is acknowledged.
Onnida Thongpravati
June 2014

ii
ACKNOWLEDGEMENTS
This journey to the PhD has been a long-engaging and worthwhile life experience. My gratitude isextended to many people who have come into my life. Some have left and some remain, but theyhave all provided me with the possibility to complete this thesis and have become a part of myjourney.
At the top of the list I would like to gratefully acknowledge the guidance, support andencouragement of my main supervisor, Associate Professor Mike Reid, who has always had trust inme (even more than I myself do sometimes!) – a very understanding, knowledgeable and ever sopatient person. His positive attitude, inspirational words and brilliant suggestions keep me motivatedand influence my way of thinking and learning, growing up around this research.
Prior to the start of the PhD journey I would like to express my appreciation and thanks to AssociateProfessor Liliana Bove, Professor Michael Davern and Associate Professor Damien Power for beingmy referees and allowing me to get a scholarship for my PhD entrance. Not to forget AssociateProfessor Martin Davies who taught me how to write a good research proposal and to readbackwards, in reverse. Here is also included Associate Professor Alex Maritz for seeing my potentialas a researcher and kick-starting my career in the world of academia.
At the “front end” of the PhD journey, my deep gratitude goes to Professor Michael Beverland, myprevious supervisor. His tremendous thoughts on breakthrough innovation started me thinking andchanging the way I view the world since he took me on board with this research. I would also like toexpress my special thanks to Professor Erik Jan Hultink for shedding light on my thesis. Hiscontinued support, wisdom and advice on my research was invaluable. Another person I would liketo thank is my second supervisor, Dr Angela Dobele, who recently came on board and keeps meenthusiastic about my project. Her cheerful support and warm attitude has meant a lot for me to pushthrough to the end of the journey.
Importantly, I would like to acknowledge and thank my family and my dear Thai friends both inAustralia and in Thailand. Although there are too many to single out, I would especially like tothank Nardwadee Watanakij, my best-friend-sister-buddy, who has always been there to support mein times of hardship. I would also like to thank Maris Janepanich and Chuchart Sritangos for theirgreat support and friendship. And one that cannot be missed is Wijittra Poonchokpanich for hermother-like kind support. I give the biggest thanks to my mother, Vanida, for her unconditional loveand understanding and her belief that I could achieve anything, and also for feeding me and keepingme alive when things were all over the place. Equally, I would like to thank my father, Maitri, whogave me the incentive to strive towards my vision, and my brother Sorot, or DJ Ketchupboyz, whoshowed me the other side of the world when I was stressed out.
Lastly, I would like to thank myself for continuing to believe in the vision that one must have apurpose in life and make a contribution to the world. This thesis would not have been possiblewithout the support of all those people whom I have mentioned (and those whom I have notmentioned) but the ability to follow the intuition enabled me to pass through episodes of sciatica,steroid treatments, cortisone injections and a ride in an ambulance to an emergency department andthen being hospitalised. With regard to this, I would like to thank Dr Dennis Shifter, Dr AndrewMitchell and Dr Khompakorn Limpasutirachata for their treatment that allowed me to get back onmy feet and be able to finish my thesis. Yet all these words cannot express how grateful I am to havethe strength and the opportunity to become a Doctor of Philosophy.

iii
PUBLICATION
Thongpravati, O. Reid, M. & Dobele, A. (2013). “Market-Driving Innovation:
Understanding the Critical Success Factors at the Front End of the Development Process”,
Annual Australian and New Zealand Marketing Academy Conference, Auckland, New
Zealand, December.

iv
TABLE OF CONTENTS
DECLARATION ...................................................................................................................... IACKNOWLEDGEMENTS ....................................................................................................IIPUBLICATION..................................................................................................................... IIITABLE OF CONTENTS ...................................................................................................... IVLIST OF TABLES...................................................................................................................XLIST OF FIGURES............................................................................................................ XIIILIST OF ABBREVIATIONS.............................................................................................XIVABSTRACT .......................................................................................................................XVIICHAPTER 1: INTRODUCTION ...........................................................................................1
1.1 Background and Significance ......................................................................................1
1.1.1 The Resource-Based View of the Firm and Product Innovation ...............................1
1.1.2 The Importance of Market-Driving Innovation .........................................................2
1.1.3 The Front End of Market-Driving Innovation ...........................................................4
1.1.4 The Emergence of Market Visioning Competence and Market Vision .....................5
1.1.5 The Emergence of Absorptive Capacity as Antecedent to Market VisioningCompetence.........................................................................................................................6
1.2 Research Objectives and Questions .............................................................................9
1.3 Research Methodology ..............................................................................................11
1.3.1 Research Context: Thailand .....................................................................................11
1.3.2 Research Design.......................................................................................................14
1.3.3 Unit of Analysis .......................................................................................................15
1.4 Research Contributions..............................................................................................16
1.5 Outline of Thesis Chapters ........................................................................................17
1.6 Chapter Summary ......................................................................................................22
CHAPTER 2: LITERATURE REVIEW AND CONCEPTUAL MODEL ......................232.1 Introduction................................................................................................................23
2.2 The Resource-Based Perspective and Dynamic Capabilities ....................................23
2.2.1 The Resource-Based View of the Firm and Product Innovation .............................26
2.3 Introduction to Product Innovation............................................................................30
2.3.1 New Product Development and Product Innovativeness .........................................30
2.3.2 Defining Types of Product Innovation.....................................................................34
2.3.2.1 Classifying Market-Driving Innovation (Radical and Really New innovation) 39
2.4 The Nature of Market-Driving Innovation ................................................................40
2.4.1 Measuring the Final Outcomes of Market-Driving Innovation ...............................40

v
2.4.2 The Critical Success Factors of Market-Driving Innovation ...................................44
2.4.2.1 Section Conclusion.............................................................................................61
2.5 The Nature of the Front End of Market-Driving Innovation .....................................62
2.5.1 Defining the Front End of Innovation ......................................................................62
2.5.2 The Front End Challenges of Market-Driving Innovation.......................................64
2.5.3 Measuring the Front End Outcomes of Market-Driving Innovation .......................66
2.5.4 The Front End Success Factors of Market-Driving Innovation ...............................69
2.5.5 Section Conclusion...................................................................................................86
2.6 The Emergence of Critical Front End Success Factors .............................................88
2.6.1 Market Vision and Market Visioning Competence .................................................88
2.6.1.1 Defining Market Vision .....................................................................................89
2.6.1.2 Defining Market Visioning Competence ...........................................................93
2.6.2 Absorptive Capacity.................................................................................................96
2.6.2.1 Defining Absorptive Capacity............................................................................96
2.6.2.2 Absorptive Capacity and Product Innovation ....................................................99
2.6.2.3 Absorptive Capacity and the Front End of Market-Driving Innovation ..........102
2.6.3 Section Conclusion.................................................................................................105
2.7 Conceptual Model and Hypotheses Development ...................................................106
2.7.1 Absorptive Capacity as an Antecedent to Market Visioning Competence ............107
2.7.2 Market Visioning Competence and Market Vision ...............................................112
2.7.3 Performance Consequences of Market Vision .......................................................113
2.7.3.1 Before-Launch Stage Performance ..................................................................113
2.7.3.2 Post-Launch Stage Performance ......................................................................115
2.7.4 Market-Driving Innovation Performance...............................................................117
2.7.5 Proposed Moderation Effects .................................................................................120
2.7.5.1 External Environment ......................................................................................120
2.7.5.2 NPD Process Rigidity ......................................................................................123
2.7.5.3 Firm Size (number of employees)....................................................................125
2.7.6 Conceptual Model and Summary of Research Hypotheses ...................................127
2.8 Chapter Summary ....................................................................................................131
CHAPTER 3: RESEARCH METHODOLOGY...............................................................1323.1 Introduction..............................................................................................................132
3.2 Research Paradigm ..................................................................................................132
3.3 Research Design ......................................................................................................134
3.4 Quantitative Research ..............................................................................................138
3.4.1 Development of Web-based Survey Tool ..............................................................138

vi
3.4.2 Sampling and Data Collection ...............................................................................144
3.4.2.1 Unit of Analysis ...............................................................................................144
3.4.2.2 Sample Selection..............................................................................................145
3.4.2.3 Sample Size......................................................................................................147
3.4.2.4 Key Informants.................................................................................................147
3.4.2.5 Survey Design and Process ..............................................................................148
3.4.2.6 Survey Response ..............................................................................................150
3.4.3 Survey Questionnaire Development ......................................................................152
3.4.3.1 Measurement Scale ..........................................................................................152
3.4.3.2 Survey Instructions...........................................................................................154
3.4.3.3 Survey Structure and Layout............................................................................155
3.4.3.4 Survey Pre-Testing and Translation.................................................................157
3.4.3.5 Considerations for Common Method Bias.......................................................159
3.5 Data Preparation and Analysis Procedure................................................................161
3.5.1 Preliminary Data Examination...............................................................................161
3.5.2 Data Analysis Procedure ........................................................................................162
3.5.3 Sample Characteristics ...........................................................................................163
3.6 Ethical Considerations and Confidentiality .............................................................165
3.7 Chapter Summary ....................................................................................................166
CHAPTER 4: CONSTRUCT MEASUREMENT ............................................................1674.1 Introduction to Measurement Scale Development...................................................167
4.1.1 Operationalisation of Constructs............................................................................168
4.1.1.1 Multiple-item Scales ........................................................................................169
4.1.1.2 Content Validity ...............................................................................................169
4.1.2 Reliability and Validity of Constructs....................................................................170
4.1.2.1 Construct Reliability ........................................................................................171
4.1.2.2 Convergent Validity .........................................................................................172
4.1.2.3 Discriminant Validity.......................................................................................172
4.1.2.4 Measurement Models .......................................................................................173
4.1.2.5 Goodness-of-Fit Measures ...............................................................................176
4.2 Operationalisation, Reliability and Validity of Main Independent Measures .........178
4.2.1 Absorptive Capacity (ACAP) ................................................................................178
4.2.1.1 Operationalisation of ACAP ............................................................................178
4.2.1.2 Reliability and Validity of ACAP ....................................................................182
4.2.2 Market Visioning Competence (MVC)..................................................................185
4.2.2.1 Operationalisation of MVC..............................................................................185

vii
4.2.2.2 Reliability and Validity of MVC......................................................................189
4.2.3 Market Vision (MV) ..............................................................................................195
4.2.3.1 Operationalisation of MV ................................................................................195
4.2.3.2 Reliability and Validity of MV ........................................................................198
4.2.4 Summary of Reliability and Validity for Main Independent Measures .................204
4.3 Operationalisation, Reliability and Validity of Dependent Measures .....................205
4.3.1 Before-Launch Stage Performance (BLSP) ...........................................................205
4.3.1.1 Operationalisation of BLSP .............................................................................205
4.3.1.2 Reliability and Validity of BLSP .....................................................................208
4.3.2 Post-Launch Stage Performance (PLSP) ...............................................................210
4.3.2.1 Operationalisation of PLSP..............................................................................210
4.3.2.2 Reliability and Validity of PLSP......................................................................213
4.3.3 Financial Performance (FP) ...................................................................................215
4.3.3.1 Operationalisation of FP ..................................................................................215
4.3.3.2 Reliability and Validity of FP ..........................................................................216
4.3.4 Summary of Reliability and Validity for Dependent Measures .............................216
4.3.4.1 Operationalisation of Market-Driving Innovation Performance (MDIP) ........216
4.3.4.2 Reliability and Validity of MDIP.....................................................................217
4.4 Operationalisation, Reliability and Validity of Moderation Measures ....................221
4.4.1 External Environment (EE)....................................................................................221
4.4.1.1 Operationalisation of EE ..................................................................................221
4.4.1.2 Reliability of EE...............................................................................................223
4.4.2 NPD Process Rigidity (NPDR) ..............................................................................224
4.4.2.1 Operationalisation of NPDR ............................................................................224
4.4.2.2 Reliability of NPDR.........................................................................................225
4.4.3 Firm Size ................................................................................................................226
4.4.3.1 Operationalisation of Firm Size .......................................................................226
4.4.4 Summary of Reliability for Moderation Measures (EE/NPDR) ............................226
4.5 Summary of Properties of Measurement .................................................................227
4.5.1 Nomological Validity.............................................................................................227
4.5.2 Inter-Construct Correlation ....................................................................................229
4.6 Demographics ..........................................................................................................231
4.7 Chapter Summary ....................................................................................................232
CHAPTER 5: RESULTS AND DISCUSSION..................................................................2335.1 Introduction..............................................................................................................233
5.2 Data Analysis ...........................................................................................................235

viii
5.2.1 Multiple Regression ...............................................................................................235
5.2.1.1 Assumptions of Multiple Regression ...............................................................236
5.2.2 Partial Least Squares Structural Equation Modelling (PLS-SEM) ........................240
5.3 Absorptive Capacity and Market Visioning Competence .......................................244
5.4 Market Visioning Competence and Market Vision .................................................252
5.5 Performance Consequences of Market Vision.........................................................257
5.5.1 Before-Launch Stage Performance ........................................................................257
5.5.2 Post-Launch Stage Performance ............................................................................263
5.6 Market-Driving Innovation Performance ................................................................269
5.6.1 Before-Launch Stage and Post-Launch Stage Performance ..................................269
5.6.2 Before-Launch Stage Performance and Financial Performance ............................273
5.6.3 Post-Launch Stage Performance and Financial Performance ................................276
5.7 Proposed Moderation Effects...................................................................................279
5.7.1 External Environment (EE)....................................................................................280
5.7.2 NPD Process Rigidity (NPDR) ..............................................................................286
5.7.3 Firm Size (Number of Employees) ........................................................................290
5.8 Section Conclusion ..................................................................................................294
5.9 Partial Least Square Structural Equation Modelling: Integrated Model..................295
5.9.1 Preliminary Model Testing ....................................................................................296
5.9.2 Structural Model Estimates ....................................................................................303
5.9.2.1 Hypothesis Testing...........................................................................................304
5.9.2.2 Testing Mediated Effects (Fully Mediated Model)..........................................307
5.9.2.3 Testing Moderating Effects..............................................................................311
5.10 Overview of Chapter 5 Findings.................................................................................314
CHAPTER 6: CONCLUSIONS AND IMPLICATIONS .................................................3176.1 Introduction..............................................................................................................317
6.2 Absorptive Capacity, Market Visioning Competence and Market Vision ..............318
6.2.1 Potential Absorptive Capacity and Market Vision.................................................318
6.2.2 Realised Absorptive Capacity, Market Visioning Competence and Market Vision.........................................................................................................................................320
6.2.3 Section Conclusion.................................................................................................322
6.3 Market Visioning Competence and Market Vision ......................................................323
6.4 Performance Consequence of Market Vision ..........................................................325
6.4.1 Market Vision and Before-Launch Stage Performance .........................................325
6.4.2 Market Vision and Post-Launch Stage Performance .............................................328
6.5 Market-Driving Innovation Performance ................................................................330

ix
6.6 The Mediating Role of Market Vision.....................................................................332
6.7 Moderation Effects ..................................................................................................334
6.7.1 External Environment ............................................................................................334
6.7.2 NPD Process Rigidity ............................................................................................336
6.7.3 Firm Size (Number of Employees) ........................................................................339
6.8 The Implications of the Study..................................................................................342
6.8.1 Theoretical Implications.........................................................................................342
6.8.2 Managerial Implications.........................................................................................348
6.8.2.1 Implications for Business.................................................................................348
6.8.2.2 Implications for Public Policy Makers.............................................................351
6.8.3 Limitations and Future Research ...........................................................................352
6.9 Conclusion and Personal Reflection ........................................................................356
REFERENCES .....................................................................................................................357APPENDICES.......................................................................................................................395
Appendix 1: Project Information Statement .......................................................................395
Appendix 2: New Product Development Survey................................................................403

x
LIST OF TABLES
Table 2.1: Common Measurement Scales of Product Innovation Performance....................41
Table 2.2: Summary of Critical Success Factors of Market-Driven Innovation and Market-
Driving Innovation.................................................................................................................45
Table 2.3: NPD Processes and Models..................................................................................52
Table 2.4: Summary of Critical Success Factors at the Front End of Innovation .................70
Table 2.5: Summary of Key Studies on Absorptive Capacity and Innovation....................100
Table 3.1: Common Cause of Method Bias and Adopted Remedies……………..……….160
Table 4.1: Criterion of Model Fit………………………………………………………….177
Table 4.2: Measure for ACAP Construct (adapted measure) ..............................................180
Table 4.3: Reliability for ACAP measure............................................................................182
Table 4.4: Internal consistency, square roots of average variance extracted and correlation
matrix and model fit of – ACAP..........................................................................................182
Table 4.5: Goodness-of-fit analysis – ACAP ......................................................................183
Table 4.6: Measure for MVC Construct (adapted measure)................................................188
Table 4.7: Reliability for MVC measure .............................................................................189
Table 4.8: Internal consistency, square roots of average variance extracted and correlation
matrix and model fit – MVC ...............................................................................................189
Table 4.9: Goodness-of-fit analysis – MVC........................................................................190
Table 4.10: Reliability for Final MVC measure ..................................................................193
Table 4.11: Internal consistency, square roots of average variance extracted and correlation
matrix and model fit – Final MVC ......................................................................................193
Table 4.12: Goodness of fit analysis – Final MVC .............................................................194
Table 4.13: Measure for MV Construct (adapted measure) ................................................197
Table 4.14: Reliability for MV measure..............................................................................198
Table 4.15: Internal consistency, square roots of average variance extracted and correlation
matrix and model fit – MV ..................................................................................................198
Table 4.16: Goodness-of-fit analysis – MV ........................................................................199
Table 4.17: Reliability for Final MV measure.....................................................................202
Table 4.18: Internal consistency, square roots of average variance extracted and correlation
matrix and model fit – Final MV.........................................................................................202

xi
Table 4.19: Goodness of fit analysis – Final MV................................................................203
Table 4.20: Overall Reliability for Main Independent Measures (Final) ............................204
Table 4.21: Measure for BLSP (adapted measure)..............................................................207
Table 4.22: Reliability for BLSP measure...........................................................................208
Table 4.23: Internal consistency, square roots of average variance extracted and correlation
matrix and model fit – BLSP ...............................................................................................208
Table 4.24: Goodness of fit analysis – BLSP ......................................................................209
Table 4.25: Measure for PLSP (adapted measure) ..............................................................212
Table 4.26: Reliability for PLSP measure ...........................................................................213
Table 4.27: Internal consistency, square roots of average variance extracted and correlation
matrix and model fit – PLSP ...............................................................................................213
Table 4.28: Goodness-of-fit analysis – PLSP......................................................................214
Table 4.29: Measure for FP (adapted measure)...................................................................215
Table 4.30: Reliability for FP measure................................................................................216
Table 4.31: Reliability for MDIP measure ..........................................................................217
Table 4.32: Internal consistency, square roots of average variance extracted and correlation
matrix and model fit – MDIP...............................................................................................218
Table 4.33: Goodness of fit analysis – MDIP......................................................................219
Table 4.34: Measure for EE (adapted measure) ..................................................................223
Table 4.35: Reliability for EE measure ...............................................................................224
Table 4.36: Measure for NPDR (adapted measure).............................................................225
Table 4.37: Reliability for NPDR measure..........................................................................225
Table 4.38: Reliability for Moderation Measures................................................................226
Table 4.39: Descriptive scales and correlations coefficients, and reliability estimates.......228
Table 4.40: Inter-construct correlation ................................................................................230
Table 5.1: Regression Models: Absorptive Capacity and Market Visioning Competence .245
Table 5.2: Regression Models: Market Visioning Competence and Market Vision ...........253
Table 5.3: Regression Models: Market Vision and Before-Launch Stage Performance.....258
Table 5.4: Regression Models: Market Vision and Post-Launch Stage Performance.........264
Table 5.5: Regression Models: Before-Launch Stage Performance and Post-Launch Stage
Performance.........................................................................................................................270
Table 5.6: Regression Models: Before-Launch Stage Performance and Financial
Performance.........................................................................................................................274
xii
Table 5.7: Regression Models: Post-Launch Stage Performance and Financial Performance
.............................................................................................................................................277
Table 5.8: Moderation Effects of External Environment between MV and Before-Launch
Stage Performance ...............................................................................................................281
Table 5.9: Moderation Effects of External Environment between MV and Post-Launch
Stage Performance ...............................................................................................................284
Table 5.10: Moderation Effects of NPD Process Rigidity ..................................................287
Table 5.11: Moderation Effects of Firm Size (Number of Employees) ..............................291
Table 5.12: Final items for MVC Construct (adapted measure) .........................................296
Table 5.13: Internal Consistency, Square Roots of Average Variance Extracted, and
Correlation Matrix ...............................................................................................................298
Table 5.14: Comparison between PACAP/RACAP of ACAP and MV constructs ............300
Table 5.15: Summary of Main Hypotheses Results (Fully-Mediated Model) ....................310
Table 5.16: Summary of Additional Analysis Results (Fully-Mediated Model) ................311
Table 5.17: Summary of Moderating Effects Results (Fully-Mediated Model) .................313

xiii
LIST OF FIGURES
Figure 1.1: The Initial Conceptual Framework .....................................................................10
Figure 1.2: Outline of Chapter 2 – Literature Review and Conceptual Model .....................18
Figure 1.3: Outline of Chapter 3 – Research Methodology...................................................19
Figure 1.4: Outline of Chapter 4 – Construct Measurement .................................................20
Figure 1.5: Outline of Chapter 5 – Results and Discussion...................................................21
Figure 2.1: Operationalisation of Product Innovativeness………..………………………...31
Figure 2.2: Defining Types of Product Innovation................................................................36
Figure 2.3: The Changing Focus of Market Orientation .......................................................50
Figure 2.4: The Entire Innovation Process ............................................................................54
Figure 2.5: Key relationships between MVC and MV ..........................................................88
Figure 2.6: Intrinsic and Extrinsic Dimensions of Market Vision.........................................90
Figure 2.7: Organisational and Individual Dimensions of Market Visioning Competence ..93
Figure 2.8: Absorptive capacity, its potential and realised subsets and dimensions .............97
Figure 2.9: Conceptual Model .............................................................................................128
Figure 3.1: Overview of the Research Activities……………………………………….…136
Figure 4.1: Measurement Model – ACAP………………………………………………...184
Figure 4.2: Measurement Model – Original MVC (adapted measure)................................191
Figure 4.3: Measurement Model – Final MVC ...................................................................192
Figure 4.4: Measurement Model – Original MV (adapted measure) ..................................200
Figure 4.5: Measurement Model – Final MV......................................................................201
Figure 4.6: Measurement Model – BLSP ............................................................................209
Figure 4.7: Measurement Model – PLSP ............................................................................214
Figure 4.8: Measurement Model – MDIP............................................................................220
Figure 5.1: Example of Normal Probability of Residual Scatterplot……………..…….....239
Figure 5.2: Structural Model (hypothesis testing) ...............................................................305
Figure 5.3: Structural Model Without Market Vision (MV) ...............................................308
Figure 5.4: Fully-Mediated Model (reconfigured model) ...................................................309

xiv
LIST OF ABBREVIATIONS
Theoretical Abbreviations Terms
ACAP Absorptive Capacity
AQ Acquisition (of knowledge)
AS Assimilation (of knowledge)
BI Breakthrough Integrity
BLSP Before-Launch Stage Performance
CI Competitive Intensity
CL Clarity (of market vision)
EE External Environment
ESC Early Success with Customers
EX Exploitation (of knowledge)
FEI Front End of Innovation
FFE Fuzzy Front End
FO Form (of market vision)
FP Financial Performance
ID Idea Driving
IDNW Idea Networking
MDIP Market-Driving Innovation Performance
MG Magnetism (of market vision)
ML Market Learning Tools
MO Proactive Market Orientation
MT Market Turbulence
MV Market Vision
MVC Market Visioning Competence
NCD New Concept Development Model
NOE Number of Employees
NPD New Product Development
NPDR New Product Development Process Rigidity
NW Networking
PACAP Potential Absorptive Capacity
PLSP Post-Launch Stage Performance
PML Proactive Market Learning

xv
Theoretical Abbreviations Terms
RACAP Realised Absorptive Capacity
RBT Resource-Based Theory
RBV Resource-Based View
SC Scope (of market vision)
SP Specificity (of market vision)
SPMG Specific Magnetism (of market vision)
STM Speed-to-Market
TR Transformation (of knowledge)
TT Technological Turbulence
VOC Voice of Customer
WO Windows of Opportunity
Statistics Abbreviations Terms
AMOS Analysis of Moment Structures
AVE Average Variance Extracted
CB-SEM Covariance-Based Techniques
CFA Confirmatory Factor Analysis
CFI Comparative Fit Index
CR Composite Reliability
GoF Goodness-of-Fit
LISREL Linear Structural Relations
MLE Maximum Likelihood Estimation
MODPROBE Moderator analysis in the form of a SPSS macro
NFI Normed Fit Index
OLS Ordinary Least Squares
PLS-SEM Partial Least Square Structural Equation Modelling
RMSEA Root Mean Square Error of Approximation
SPSS Statistical Package for Social Sciences
VIF Variance Inflation Factor

xvi
Organisation Abbreviations Terms
GEM Global Entrepreneurship Monitor
ITU International Telecommunication Union
MSI Marketing Science Institute
NIA National Innovation Agency
OECD Organisation for Economic Co-operation and
Development
PDMA Product Development and Management Association
PDMAA Product Development Management Association of
Australia
WIPO World Intellectual Property Organization
Other Abbreviations Terms
GDP Gross Domestic Product
ICT Information and Communications Technology
R&D Research and Development
SBU Strategic Business Unit
SME Small and Medium-sized Enterprise
URL Uniform Resource Locator
xvii
ABSTRACT
Although marketing scholars have investigated the significance of both radical and really
new innovations to business success, the factors underpinning such “market-driving”
innovations remain elusive, especially at the front end of the new-product development
(NPD) process. Most research on the NPD process, particularly the dominant “stage-gate”
theory of innovation, has focused on reinforcing the status quo by solving customers’
existing problems or stated preferences in current markets, often resulting in “me too” or
incremental innovations. Ensuring that future potential market-driving innovations are able
to emerge from the front end of the NPD process into the development and
commercialisation stages without losing their innovativeness or breakthrough integrity is
thus fraught with difficulty and is a key challenge for firms.
Drawing upon the resource-based view (RBV) and the dynamic capability theory of the
firm, the present research responds to this research gap by examining the notion of Market
Vision (MV) and its antecedent, Market Visioning Competence (MVC) (Reid & de
Brentani, 2010), to improve the front end or “early performance” of market-driving
innovations. This research focuses on market-driving innovations, which incorporate both
radical and really new innovations—specifically, radical breakthroughs, technological
breakthroughs and market breakthroughs new products. MV, in this research, relates to
having a clear and specific early-stage mental model or image of a product-market that
enables NPD teams to grasp what it is they are developing and for whom. MVC is the
ability of individuals or NPD teams in organisations to link new ideas or advanced
technologies to future market opportunities. Accordingly, the research extends the
understanding of factors driving front end success and proposes Absorptive Capacity
(ACAP), with its subsets, Potential Absorptive Capacity (PACAP) and Realised Absorptive
Capacity (RACAP), as an emerging organisational dynamic learning capability that
influences MVC and its resultant MV, and in turn, specific NPD performance outcomes. A
model is developed that integrates ACAP, MVC and MV with market-driving innovation
performance, which comprises before-launch stage performance, post-launch stage
performance and financial performance. In addition, the research investigates the external
structural factors associated with the firm’s turbulent and competitive environment as well
as internal factors, including the degree of NPD process rigidity and firm size (number of
xviii
employees), as moderators that influence the impact of MV on before-launch stage
performance and post-launch stage performance.
The data were derived from a web-based survey of 179 managers of top innovative firms in
Thailand. The focus of the research was at the NPD program level of a strategic business
unit or at the company level where there was no separate business unit. The sample was
primarily drawn from the 2011–2012 database of the National Innovation Agency, operating
under the umbrella of the Ministry of Science and Technology, Thailand (National
Innovation Agency, 2011, 2012). Furthermore, the measurement instruments adopted were
the existing scales in product innovation and management literature, slightly modified
where appropriate. Several new items were developed to fit the specific context of the front
end of market-driving innovation – most significantly, a breakthrough integrity measure.
The constructs were assessed by using Cronbach’s alpha, confirmatory factor analysis and
correlation analysis to determine their reliability and their convergent, discriminant and
nomological validity. The assessment of the constructs in relation to the hypothesised
relationships was tested using linear regression, while the overall set of relationships was
modelled using SmartPLS (Ringle, Wende & Will, 2005).
A major contribution of this research is the finding that ACAP as a dynamic capability
significantly and distinctly influences both MVC and MV at the front end of market-driving
innovation. On one hand, a firm’s ability to acquire and assimilate knowledge, or PACAP,
can lead to a discovery of new sources of knowledge for market-driving ideas, hence
directly influencing MV but not MVC. On the other hand, a firm’s ability to transform and
exploit knowledge, or RACAP, fosters the entrepreneurial mindset and actions of
individuals or NPD team members, and can directly influence opportunity recognition in
MVC, as well as generating the new initiatives and knowledge that are essential to develop
a shared mental model of radically new or really new product for future markets (the MV
itself). Moreover, the findings indicate that MVC significantly and positively influences MV
and that both of these constructs significantly and positively influence certain aspects of
before-launch stage performance and post-launch stage performance – specifically, the
ability to maintain breakthrough integrity, to achieve early success with customers and
speed-to-market, and to open windows of opportunity. The results also suggest that the best
way to account for such performance outcomes is by considering MV as a mediating
variable. Additionally, large firm size significantly and positively influences the translation
xix
of MV into post-launch stage performance outcomes. With respect to before-launch stage
performance and post-launch stage performance, a significant positive relationship is
observed. In turn, the performance outcomes at both those stages significantly and
positively influence the financial performance of market-driving innovations.
Overall, these findings are important in suggesting that the capability to visualise future
potential product-markets (MVC/MV) and in combination with broader organisational level
dynamic learning capabilities (ACAP and its subsets PACAP/RACAP) can lead firms to
achieve better performance of market-driving innovations, from the front end of the
development process and through to commercialisation. In line with the theoretical
argument in the RBV and dynamic capability literature, the outcome of these capabilities
contributes to achieving competitive advantage and superior performance through new
product development. More importantly, this is the first empirical study to model the role of
ACAP as a precursor to MVC/MV and specific performance outcomes (i.e., before-launch
stage performance and post-launch stage performance). Further the research also helps
extend the work of Reid and de Brentani (2010) on MVC and MV, whilst exploring this
notion in a different research context (i.e., using sample from a developing country). The
theoretical and managerial implications for the advancement of market-driving innovations
apply not only to Thailand, but also more broadly to other countries and locations.
1
CHAPTER 1: INTRODUCTION
You can’t just ask customers what they want and then try to give that to them.By the time you get it built, they’ll want something new.
Steve Jobs, 1989, Co-founder, former Chairman and CEO of Apple Inc.
1.1 Background and Significance
1.1.1 The Resource-Based View of the Firm and Product Innovation
In today’s rapidly changing and highly competitive environment, firms require resources
and capabilities to drive success and performance in order to sustain competitive advantage.
Accordingly, recent studies have used the resource-based view (RBV) to investigate the role
of a firm’s resources in addressing the dynamic business environment (de Brentani,
Kleinschmidt & Salomo, 2010; Paladino, 2007). The RBV of the firm, as proposed in the
dynamic capabilities literature, provides an overall theoretical perspective (Eisenhardt &
Martin, 2000). The RBV focuses on a firm’s internal resources that are valuable, rare,
inimitable and nonsubstitutable (Barney, 1991). Importantly, these resources need to be
modified, integrated and reconfigured to adapt to the changing environment. This is the
dynamic nature of the capability of a firm to alter its internal resources in advantageous
ways to improve firm performance (Teece, Pisano & Shuen, 1997). Internal resources,
particularly the intangible resources (skills and knowledge) and an entrepreneurial
orientation (proactiveness and innovativeness), are essential for creating sustainable
advantage (Bakar & Ahmad, 2010).
The Marketing Science Institute (MSI) has considered the topic of Connecting Innovation
with Growth as a top-tier research priority for almost a decade (MSI, 2006, 2008, 2014).
Innovation is viewed as “the prime engine of growth” in economies. New product
development (NPD) and product innovation are viewed as one of the most important, value-
creating activities required for a firm to succeed, or even survive, in the competitive and
dynamic business environment. Eisenhardt and Martin (2000) argued that the link between
RBV and product innovation can strengthen RBV and its empirical grounding. Cast in RBV,
2
product innovation has been regarded as an engine of corporate renewal and is a dynamic
capability of the firm (Danneels, 2002; Knight & Cavusgil, 2004; McNally & Schmidt,
2011; Zahra, Sapienza & Davidson, 2006). The abilities of a firm to exploit its existing
resources and skills and to change the routines for product development can enhance new
product performance and firm performance, and are therefore important for scholarly
examination (Cooper & de Brentani, 1991; Cooper & Kleinschmidt, 1993; De Clercq,
Thongpapanl & Dimov, 2011; Kleinschmidt & Cooper, 1991; Song & Parry, 1997a, 1997b;
Zirger & Maidique, 1990).
1.1.2 The Importance of Market-Driving Innovation
Breakthrough product innovations are argued to be a source of sustainable competitive
advantage that can importantly contribute to a firm’s growth and profitability in the current
dynamic business environment (e.g. Chandy & Tellis, 1998; Cho & Pucik, 2005; Hauser,
Tellis & Griffin, 2006; Sorescu, Chandy & Prabhu, 2003). This type of product innovation
has been designated as a significant research topic by the MSI (Story, Hart & O'Malley,
2009). Breakthrough innovations can revolutionise an industry and fundamentally redefine
the market structure, preferences and even behaviour of all players in the market (customers,
competitors and other stakeholders) (Jaworski, Kohli & Sahay, 2000). Respectively,
breakthrough innovations are also sometimes referred to as “market-driving innovations”
because they drive the market in nature (Zortea-Johnston, Darroch & Matear, 2012). Firms
that focus on developing market-driving innovations are considered to be “market-driving”
as opposed to being “market-driven” (Kumar, Scheer & Kotler, 2000; Schindehutte, Morris
& Kocak, 2008). Market-driving firms change the rules of the competitive game, enabling
them to transcend “the zero-sum game that characterises many industry battlegrounds”
(Bessant, Birkinshaw & Delbridge, 2004, p.33).
For the purpose of this study, “market-driving [product] innovation” is defined as a
breakthrough product innovation which explores new ideas or technologies that
significantly transform existing markets or create new ones and therefore require market-
driving competencies (Jaworski et al., 2000; Leifer et al., 2000; Mohr, Sengupta & Slater,
3
2005). “Market-driving competencies” mean “getting outside the immediate voice of the
customer” to proactively reshape customers’ product preferences (Jaworski et al., 2000,
p.45). The definition of market-driving innovation is in contrast to “incremental” (“market-
driven”) innovation, which is defined in the study as an improvement of an existing product,
which exploits existing ideas/technologies in the existing market, and therefore requires
market-driven competencies (Garcia & Calantone, 2002; Jaworski et al., 2000; Leifer et al.,
2000). Market-driven competencies are about listening to the voice of the customer and
being reactive to articulated product preferences in existing (predictable) markets (Jaworski
et al., 2000; Varadarajan, 2009).
By definition, market-driving innovations are composed of both “radical” innovations and
“really new” innovations—specifically, radical breakthroughs new products, and
technological breakthroughs and market breakthroughs new products (Chandy & Tellis,
1998, 2000; Garcia & Calantone, 2002; Zortea-Johnston et al., 2012). This research is
focused on these three types of ‘tangible’ breakthrough new products rather than
‘intangible’ services or process innovations. An example of a radical breakthrough is the
first consumer microwave oven (an entirely new product category). Examples of really new
innovations are the Apple iPhone3 and iPod (a market breakthrough using existing
technologies within a new platform) and the Canon LaserJet printer (a technological
breakthrough using new technology to extend the existing product line from the InkJet
printer).
Despite the importance of market-driving innovations for attaining superior performance,
firms continue to face challenges in developing the capabilities required for market-driving
innovations (O'Connor, Ravichandran & Robeson, 2008). Wind and Mahajan (1997, p.3)
stated that “the challenge is how to increase an organization’s ability to develop
breakthrough products”. The literature on the management of innovation highlights the
critical success factors for managing the development of market-driving innovations.
Several recent studies have identified that managing market-driving innovations needs
capabilities in various dimensions: a clearly identified organisational structure and market-
driving culture, a flexible NPD process, an appropriate strategic focus (NPD strategy),
research and launch tactics, including appropriate innovation metrics and performance
measurements (Barczak & Kahn, 2012; Cooper, 2011; Cooper & Edgett, 2008; Cooper &

4
Kleinschmidt, 2010; Kahn, Barczak, Nicholas, Ledwith & Perks, 2012; O'Connor, 2008;
Rangan & Bartus, 1995; Sethi & Iqbal, 2008). The factor of particular importance related to
NPD best practice is the strategy for “the defining and planning of a vision and focus for
research and development (R&D), technology management, and product development
efforts” at all organisational levels (Barczak & Kahn, 2012, p.294). This strategic focus
reflects the front end of the NPD effort and is viewed as distinct from the other capability
dimensions (Kahn et al., 2012).
1.1.3 The Front End of Market-Driving Innovation
This thesis focuses on understanding the critical success factors at the front end of market-
driving innovations. Practitioners, expert consultants and researchers identify the front end
of innovation (FEI) as the root of NPD success. FEI is a significant area for further research
on product development management (e.g. Backman, Borjesson & Setterberg, 2007;
Khurana & Rosenthal, 1998; Kim & Wilemon, 2002b; Koen et al., 2001; Verworn, Herstatt
& Nagahira, 2008). The front end is especially important for market-driving innovations
(Leifer, O'Connor & Rice, 2001; McDermott & O'Connor, 2002; Reid & de Brentani, 2004;
Schindehutte et al., 2008). The highest level of ambiguity and uncertainty is at the front end
of market-driving innovations due to the least understanding of this phase and the fewest
strategies available for effective management (de Brentani & Reid, 2012). There is,
however, no consensus on the constructs that drive the front end success of market-driving
innovations (McDermott, 1999). This area of research remains a perplexing topic to
theorists because of the “fuzziness” of the idea generation and evaluation stages of the NPD
process (Broring, Cloutier & Leker, 2006; Verworn et al., 2008). The MSI has thus
highlighted its continued interest in this area and the need for novel or new approaches to
new product development, particularly regarding generating radical or really new (market-
driving) product ideas (MSI, 2008).
5
Generating market-driving ideas and getting them across the stages from opportunity
discovery (FEI) and into product development (through “the Valley of Death”), whilst
retaining their innovativeness remain challenging for many firms (Markham, Ward, Aiman-
Smith & Kingon, 2010). The dominant “stage-gate” theory of innovation may be too rigid
for market-driving innovations, especially at the front end of the development process
(Hammedi, van Riel & Sasovova, 2011; O'Connor, 1998; Seidel, 2007; Sethi & Iqbal,
2008). Although different versions exist and it acknowledges the need for iteration, the
stage-gate process primarily relies on the traditional market orientation or market-driven
NPD and reinforces the status quo by solving customers’ existing problems or stated
preferences in current markets, often resulting in “me too” or incremental innovations
(Beverland, Ewing & Matanda, 2006; Jaworski et al., 2000; Wind & Mahajan, 1997).
Further, the generally linear stage-gate process involves gates which act as quality control or
go/kill decision check points before a new product idea can progress to the next stage
(Cooper, 2008). With a lack of clear market vision to anchor product development, the more
innovative market-driving ideas that could potentially create new markets are often dumped
or squelched by managers and therefore fail to emerge into the development stage and then
into commercialisation (Backman et al., 2007; Hill & Rothaermel, 2003; Kumar et al.,
2000).
1.1.4 The Emergence of Market Visioning Competence and Market Vision
Drawing on the RBV of the firm as proposed in the dynamic capabilities literature, recent
research suggests that market visioning competence (MVC) and its resultant market vision
(MV) (Reid & de Brentani, 2010) are instrumental in ensuring that market-driving
innovations are able to emerge into the development process whilst retaining their
breakthrough integrity. This research further examines this notion and defines MVC as “the
ability of individuals or NPD teams in organisations to link new ideas or advanced
technologies to future market opportunities”. This results in MV, “a clear and specific early-
stage mental model or image of a product-market that enables NPD teams to grasp what it is
they are developing and for whom”. MVC and MV are expected to have a strong impact on
program level performance, especially during the early activities or the front end of the NPD
6
effort of market-driving innovations. As MV acts as an indicator for early strategic direction
influencing early performance or before-launch stage performance (BLSP), this study also
proposes the condition under which MV has the potential to impact on post-launch stage
performance (PLSP), and ultimately financial performance (FP).
Further, both external and internal environments of the firm are considered to have
moderating influences on the relationship between effectiveness of the emergent MV and
BLSP/PLSP outcomes. Recent research has specifically highlighted the importance of
factoring in a firm’s competitive environment and the firm’s internal resources as
moderators on the way in which “MV unfolds and on its capacity for impacting
performance” (Reid & de Brentani, 2012, p.125). Accordingly, this study determines that
the relevant moderating factors are the firm’s external environment and the internal factors
of the degree of rigidity inherent in the NPD process and the firm size (number of
employees). The effect of firm size, for instance, is the subject of much dispute in the
innovation literature, particularly on market-driving innovations; thus, investigating this
factor may provide further insights (Chandy & Tellis, 2000).
1.1.5 The Emergence of Absorptive Capacity as Antecedent to MarketVisioning Competence
Recent literature on product innovation has also highlighted absorptive capacity (ACAP) as
one of the most significant constructs to emerge in strategic organisational research
(Bertrand & Mol, 2013; Flatten, Engelen, Zahra & Brettel, 2011; Lane, Koka & Pathak,
2006; Zhou & Wu, 2010). ACAP, as firm-specific learning, resource and capability, is part
of “a wider literature on the contribution of knowledge processes to organizational
performance, located within the RBV of the firm, and its sub-set of dynamic capabilities”
(Harvey, Skelcher, Spencer, Jas & Walshe, 2010, p.83). Accordingly, ACAP can be defined
as “the organizational routines and process by which firms acquire, assimilate, transform
and exploit knowledge to produce a dynamic organizational capability” (Zahra & George,
2002, p.186). Empirical studies have pointed out that firms with high levels of ACAP
perform well in developing product innovations to achieve superior business performance
7
and competitive advantage in changing environmental conditions (e.g. Chen, Lin & Chang,
2009; Cohen & Levinthal, 1990; Daghfous, 2004; Kostopoulos, Papalexandris, Papachroni
& Loannou, 2011; Tsai, 2001; Vinding, 2006).
More specifically, ACAP is strongly related to market-driving innovations (Hill &
Rothaermel, 2003; Kostopoulos et al., 2011; Zahra et al., 2006). As market-driving
innovations involve novel combinations of new or existing ideas/technologies and know-
how, such innovations are argued to be best supported by ACAP through exploratory
learning and a broad range of loosely related knowledge domains (Kogut & Zander, 1992;
Van den Bosch, Volberda & de Boer, 1999). At the broader organisational level, ACAP has
a high likelihood of fostering the entrepreneurial mindset and actions of individuals or NPD
team members at the NPD program level, and can directly influence opportunity recognition
in linking new ideas or advanced technologies to future markets (MVC) at the front end of
market-driving innovations.
The organisational influence at the front end of market-driving innovations in relation to
information processing and knowledge management is not well understood or managed
(Reid & de Brentani, 2004). In the case of market-driving innovations, individuals or NPD
team members often have a limited ability to perceive, understand and make decisions with
respect to novel and new information (O'Connor & Rice, 2001). As such, opportunities must
be given to the individuals or NPD team members to encourage exploratory learning,
specifically through acquiring, transferring and sharing information or using tacit
knowledge (intuition) to deal with the uncertainty and the requirement for creativity at the
front end of market-driving innovations (Bertels, Kleinschmidt & Koen, 2011). The sharing
of information at the organisational level helps to make an individual’s tacit knowledge
more explicit, thus building collective intuition (Eisenhardt, 1999). Bertels et al. (2011,
p.759) stated “it is in our tacit knowledge that our intuition, insight, and ‘gut feel’ originate
– all of which are crucial to innovation in general and the front end of innovation in
particular”.
8
Goffin and Koners (2011, p.300) further highlighted that:
Tacit knowledge is a popular management concept but one that is poorly
understood, as empirical evidence to demonstrate the validity of the theoretical
concepts is sadly lacking. This provides a unique opportunity for NPD scholars
– they have the ideal arena in which a deeper understanding of tacit knowledge
can be generated.
This thesis proposes that absorptive capacity (organisational dynamic learning capabilities)
is an antecedent to market visioning competence and its resultant market vision, particularly
at the front end of the NPD process, and influences a firm’s ability to develop and
commercialise market-driving innovations. Through absorptive capacity, organisational
routines and processes may help to manage and support the individual pattern recognition
(MVC) and resultant decision initiatives (MV) associated with the front end of market-
driving innovations (de Brentani & Reid, 2012). Individuals undertaking NPD and market-
driving innovation related tasks may go by no means without support from top management
at the broader organisational level, where strategic, structural and resource planning occurs
(Khurana & Rosenthal, 1997). Reid and de Brentani (2004, p.175) supported this view by
stating that “it is important therefore to see whether there are any structures or processes that
can be put in place to help organizations better manage, where possible, the early stages of
the fuzzy front end of discontinuous innovation”.
9
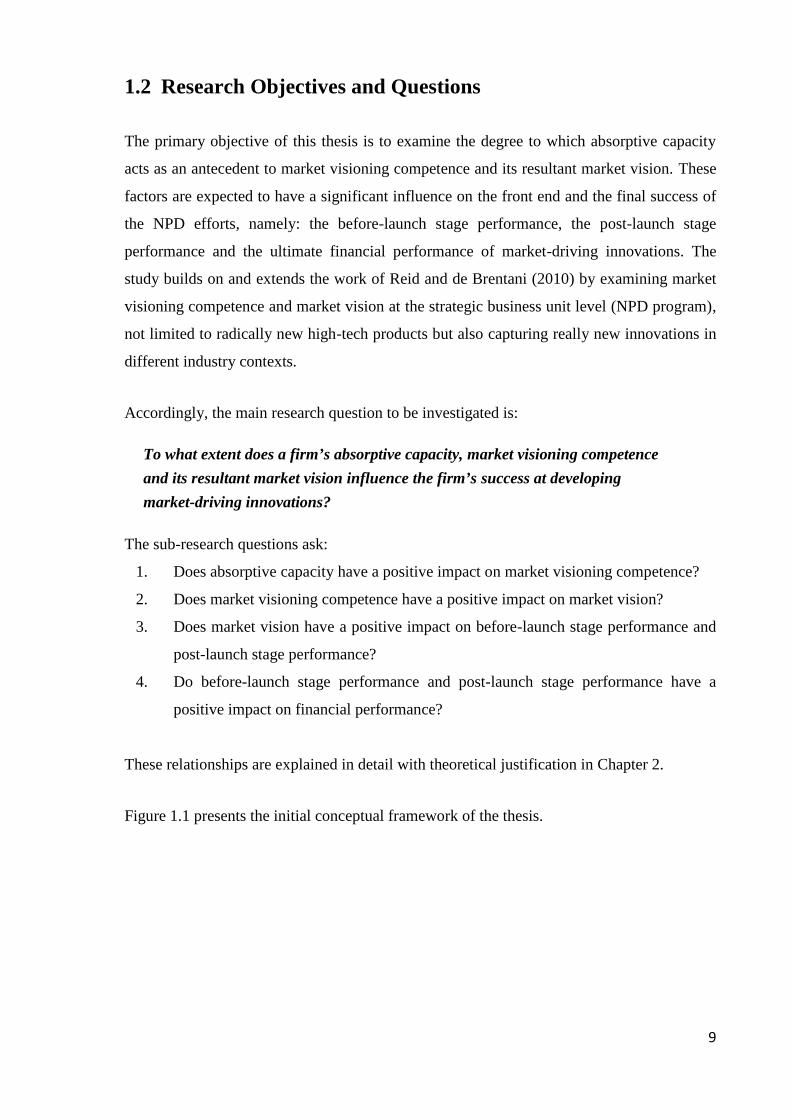
1.2 Research Objectives and Questions
The primary objective of this thesis is to examine the degree to which absorptive capacity
acts as an antecedent to market visioning competence and its resultant market vision. These
factors are expected to have a significant influence on the front end and the final success of
the NPD efforts, namely: the before-launch stage performance, the post-launch stage
performance and the ultimate financial performance of market-driving innovations. The
study builds on and extends the work of Reid and de Brentani (2010) by examining market
visioning competence and market vision at the strategic business unit level (NPD program),
not limited to radically new high-tech products but also capturing really new innovations in
different industry contexts.
Accordingly, the main research question to be investigated is:
To what extent does a firm’s absorptive capacity, market visioning competenceand its resultant market vision influence the firm’s success at developing
market-driving innovations?
The sub-research questions ask:
1. Does absorptive capacity have a positive impact on market visioning competence?
2. Does market visioning competence have a positive impact on market vision?
3. Does market vision have a positive impact on before-launch stage performance and
post-launch stage performance?
4. Do before-launch stage performance and post-launch stage performance have a
positive impact on financial performance?
These relationships are explained in detail with theoretical justification in Chapter 2.
Figure 1.1 presents the initial conceptual framework of the thesis.
10
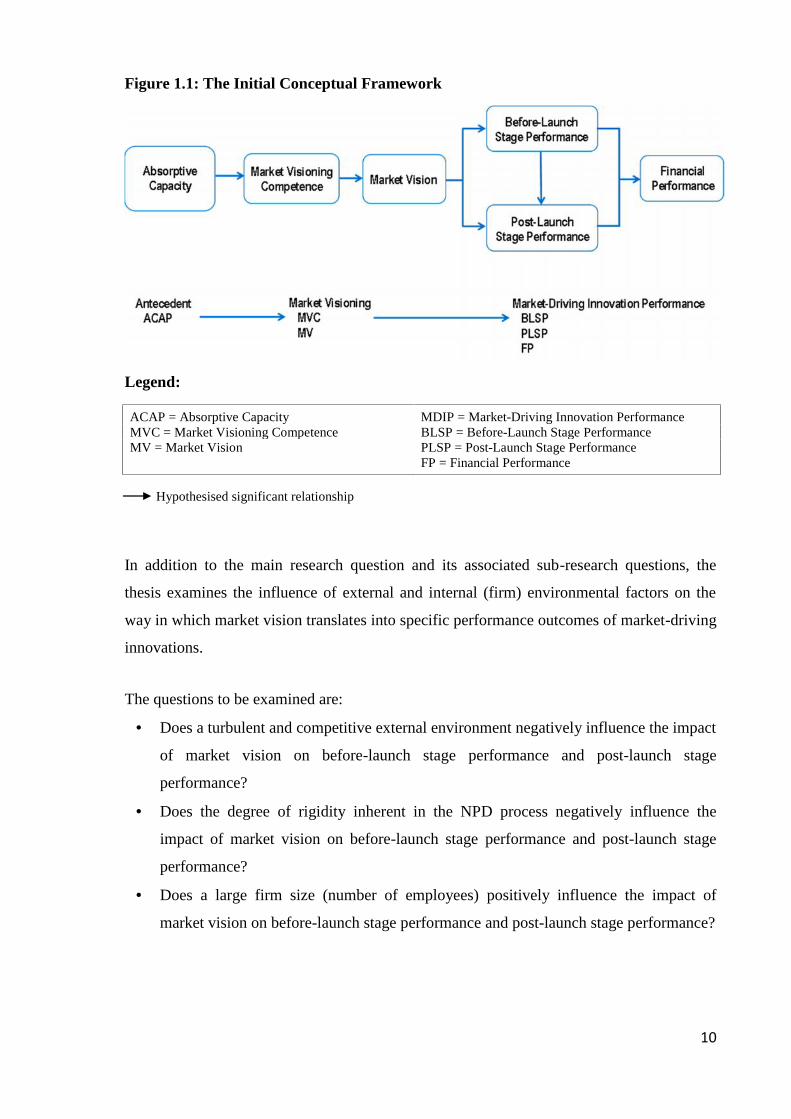
Figure 1.1: The Initial Conceptual Framework
Legend:
ACAP = Absorptive Capacity MDIP = Market-Driving Innovation PerformanceMVC = Market Visioning Competence BLSP = Before-Launch Stage PerformanceMV = Market Vision PLSP = Post-Launch Stage Performance
FP = Financial Performance
Hypothesised significant relationship
In addition to the main research question and its associated sub-research questions, the
thesis examines the influence of external and internal (firm) environmental factors on the
way in which market vision translates into specific performance outcomes of market-driving
innovations.
The questions to be examined are:
Does a turbulent and competitive external environment negatively influence the impact
of market vision on before-launch stage performance and post-launch stage
performance?
Does the degree of rigidity inherent in the NPD process negatively influence the
impact of market vision on before-launch stage performance and post-launch stage
performance?
Does a large firm size (number of employees) positively influence the impact of
market vision on before-launch stage performance and post-launch stage performance?

11
1.3 Research Methodology
1.3.1 Research Context: Thailand
Studies on NPD and product innovation, particularly those published in the Harvard
Business Review (HBR) and the Journal of Product Innovation Management (JPIM) have
used data from developed countries such as the USA, the UK and Europe (Lieberman &
Montgomery, 1998; Zhou, 2006). Most of the pertinent research on market-driving
innovation has utilised large mature firms in Silicon Valley (e.g., Apple, Hewlett-Packard)
or those on the Fortune 500 list (e.g., Walmart, General Motors). An emphasis has also been
placed on radically new, technology-intensive research settings, as in the study by Reid and
de Brentani (2010). The high-tech industries are commonly used as the context in studies on
NPD success factors (Suwannaporn & Speece, 2003). This leaves the generalisability of the
findings to developing countries and to small-to-medium-sized firms developing radically
new or really new products and to low-tech industries an open question.
This study adopts Thailand as the research context. Thailand is of particular interest for five
reasons. First, the context of Thailand offers the research perspective of NPD and
innovation in a developing country. Developing countries often play a role of technological
catching-up. This implies that the development of the technological capabilities related to
NPD in developing countries are often influenced by the technologies generated in
developed countries (Chen, Guo & Zhu, 2012). Thailand is among the developing countries
that are characterised as being in the middle ground in terms of technological capability
(Klochikhin & Shapira, 2012). To a certain extent, NPD-related activities in Thailand
require the import of sophisticated technology and high value-added components from
developed countries (Intarakumnerd, Chairatana & Tangchitpiboon, 2002; Suwannaporn &
Speece, 2003). Further, the development of Thailand involves unprecedented transitions of
social, legal and economic institutions. This includes the recent transition of its economic
structure from an agriculture-based economy to a newly industrialised economy
(Intarakumnerd et al., 2002). The economic restructuring in Thailand and the country’s
unique cultural characteristics may pose different challenges for NPD and innovation that
cannot be fully explained by theories and practices embedded in the developed countries
12
(Cho, Kim & Rhee, 1998; Hoskisson, Eden, Lau & Wright, 2000; Li & Atuahene-Gima,
2001; Zhou, Yim & Tse, 2005).
Second, Thailand offers a diversified manufacturing sector ranging from agriculture to
technology-based industries. Thailand is among the world’s top exporters in global food and
agriculture markets for products such as rice, cassava and rubber (Intarakumnerd et al.,
2002). According to the United Nations Conference on Trade and Development (UNCTAD)
World Investment Report 2012, Thailand is the 12th largest food exporting nation in the
world. The country ranks 17th for manufacturing output and 11th for agriculture output,
according to the World Economic Forum (WEF) Global Competitiveness Report 2012–2013
(Thailand Board of Investment, 2013). In addition, Thailand is a world-class production and
R&D hub for multinational corporations, especially those involved in the electrical
appliance, electronics and automotive industries such as Electrolux, Seagate and Toyota
(Brimble, 2006; Thailand Board of Investment, 2012, 2013; Youngsuksathaporn, 2005). In
the automotive industry, for instance, Thailand has been regarded as the “Detroit of the
East” for being the 15th largest automotive producer in the world in the year 2011, based on
The Economist’s ‘Pocket World in Figures 2013’ (Thailand Board of Investment, 2012,
2013). Thus, Thailand offers a mixture of new products of different types, providing a good
context for studying the underlying success factors related to NPD and innovation practices.
Third, Thailand is the second largest economy in South-east Asia and is recognised as “one
of the great development success stories” by The World Bank (2011). The diversified
manufacturing sector in Thailand has contributed to the country’s economic performance
and growth of gross domestic product (GDP), with approximately 78% accounted for by
exports of goods and services. GDP performance in Thailand has been impressive, with an
average of 5%–6% year-on-year, including an increase to 6.4% in the year 2012 (Thailand
Board of Investment, 2013).
Fourth, there is an increasing number of small and medium-sized enterprises (SMEs) in
Thailand involved in NPD and innovation. The data collected by the Global
Entrepreneurship Monitor (GEM) showed a more than three-fold increase in Thai SMEs to
2.8 million from 1997 to 2008. The growth of the SME business sector has driven economic
growth by stimulating businesses to undertake innovation and competition to improve their
13
productivity and performance (OECD, 2011). According to the Organisation for Economic
Co-operation and Development (OECD), “the challenge is that Thai SMEs face a very
turbulent and dynamic business environment in the Asian region. Innovation is one way to
survive and continually adapt in such an environment” (OECD, 2011, p.35). As a result,
Thailand had the highest level of early-stage entrepreneurial activities (29%) among 42
countries in 2007, as measured by GEM, compared to rates of 4.4% in China, 9.6% in the
USA and 16.4% in Japan. The level of early-stage entrepreneurial activities in Thailand
indicates the high number of small businesses in the economy, many of which are less than
three and a half years old (OECD, 2011). Additionally, a national survey by GEM Thailand
(2011) showed an increase in new product early-stage entrepreneurial activities from 42% in
2007 to 58% in 2011, suggesting a positive trend to the development of new products and/or
services (Global Entrepreneurship Monitor, 2011).
Lastly, innovations in Thailand have been fostered by the Thai royal family and increasingly
promoted by Thai government organisations, including the cabinet, ministries and
specialised agencies. The Thai royal family is known for its active encouragement of
inventors. The current King of Thailand, Bhumibol Adulyadej, also known as “the king of
invention”, is the world’s first monarch to be granted a patent. That was in 1993 for the
Chai-Pattana slow speed surface aerator (Pakaworawuth, 2007). The King has been a true
inventor, holding more than 20 patents and 19 trademarks, and has been a role model for
Thai communities to develop concrete and practical benefits from innovations, such as
artificial rainmaking and the use of palm oil as a fuel (Government Public Relations
Department, 2009). His Majesty won the Best Inventor Award in 2001 and recently received
a Global Leader Award “in recognition of his extraordinary commitment to promoting
intellectual property and his important contribution to society as a prolific inventor” from
the World Intellectual Property Organization (WIPO) in 2009 (WIPO, 2009, para. 1). In a
similar vein, Princess Maha Chakri Sirindhorn received a WIPO Gold Medal for the Best
Woman Inventor Award in 2008 for her research on digital high resolution imagery to aid
map accuracy in the study of land use (WIPO, 2008).
An important aim of the Thai government is to motivate Thai businesses and local
communities to be more enthusiastic in recognising the significance of new product
development and innovation (National Innovation Agency, 2010a; Youngsuksathaporn,

14
2005). Recent government activities related to innovation include Inventors’ Day and
National Innovation Day. To commemorate the King’s first patent allocation, Inventors’
Day is set by the Thai Cabinet. Thailand is the only country in South-east Asia and one of
only seven countries in the world that recognises such a day. The National Innovation Day
is set by the National Innovation Agency (NIA) to honour the King as ‘the Father of Thai
Innovation’ (National Innovation Agency, 2010b). Several product innovation showcases,
exhibitions, research funds and awards have also been organised by the NIA such as the Top
Ten Innovative Businesses, National Innovation Awards and Rice Innovation Awards. In
addition, Japan’s successful One-Village-One-Product scheme was adopted by the Thai
government to encourage each village community to develop their own innovative products
utilising indigenous skills, craftsmanship and available local resources and raw materials
(Youngsuksathaporn, 2005). With all these activities related to innovation, there has been a
strong innovative momentum, demonstrated by an increasing number of Thai patent
applications from 631 to 4196 and granted patents from 101 to 768 during the period of
1995 to 2009, according to the data collected by Thai authorities (OECD, 2011).
1.3.2 Research Design
The research design of the study consists of two sequential phases as follows.
Phase One is an exploratory review of the literature in the fields of marketing, management
and product innovation in order to gain information about the nature of the research problem
and to formulate the specific research objectives and questions for the study (Burns & Bush,
2009; Malhotra, Hall, Shaw & Oppenheim, 2004).
Phase Two is quantitative descriptive research through the use of a web-based cross-
sectional survey. This approach was adopted as it appeared to be the most appropriate
technique for responding to the “what proportion” nature of the stated research question: To
what extent does a firm’s absorptive capacity, its market visioning competence and market
vision influence the firm’s success at developing market-driving innovation? (Emory &
Cooper, 1991). The descriptive research design supports the investigation of meaningful
15
relationships, the testing of validity and discovering whether true differences exist (Hair,
Lukas, Miller, Bush & Ortinau, 2012a). The use of a web-based survey also provides
efficiency in data collection and database management, particularly in terms of obtaining the
required information from the target respondents within the time span of the research
(Zikmund & Babin, 2007).
1.3.3 Unit of Analysis
This study uses the term “firm” to capture an overall type of respondents and entities. The
unit of analysis is the company level or the strategic business unit (SBU) level where
research, development and commercialisation of market-driving innovations are undertaken.
The study focuses on product innovation at program level NPD rather than project level
NPD. The key informants were identified as managers with responsibility for the
development and commercialisation of market-driving innovations (as defined in this
study). Examples of the key informants were senior management, including a vice president
of marketing and product managers. The target respondents were seen as the most suitable
persons to participate in the survey due not only to their understanding of organisational
routines in general and NPD processes in particular, but also to their knowledge about the
activities associated with the front end and final launch of market-driving innovations. In
line with the unit of analysis, the informants were asked to refer to their SBU or, when the
company had no dedicated SBU, to their company.
16
1.4 Research Contributions
By providing answers to the research questions, the study develops a theoretically derived
model and empirically tests the model that integrates absorptive capacity and market
visioning competence and its resultant market vision to better explain NPD performance-
related to market-driving innovation. The premise of this study is grounded in the resource-
based view of the firm, as proposed in the dynamic capabilities literature.
The study makes a number of contributions of value to academics, practitioners and public
policy makers:
Theoretical Implications
(1) Advancing knowledge about the front end of innovation in relation to market vision
and associated competencies and, through absorptive capacity, specifically adding to
theory development.
(2) Bridging the gap in the traditional market orientation to NPD through the resource-
based view and dynamic capability theory and the notion of “market-driving”.
(3) Improving the understanding of NPD performance-related market-driving
innovation relative to before-launch stage, post-launch stage and financial
performance outcomes, specifically adding to theory development through the newly
formed breakthrough integrity measure.
(4) Broadening the scope of the pertinent research on market-driving innovations by
using and testing data from a developing country, which includes both large sized
and small-to-medium sized firms developing market-driving innovations.
(5) Addressing the debate on the influence of firm size on the development of market-
driving innovation.
Business Implications
This study highlights the importance of firms engaging in the development of market-
driving innovations as a competitive necessity for survival by achieving sustainable
competitive advantage. The study unfolds the concepts of absorptive capacity, market
17
visioning competence and its resultant market vision as a firm’s dynamic and exploratory
learning capabilities, specifically in relation to market-driving innovations, in order to
increase the chance of success of radically new and really new products. These insights are
crucial for managers, entrepreneurs and NPD team members related to how they can best
redesign, facilitate and manage the capture and dissemination of information related to the
development of market-driving innovations, especially in terms of maintaining
breakthrough integrity from the front end through to launch.
Implications for Public Policy Makers
This study proposes modes of facilitating and improving the development of market-driving
innovation for policy makers, particularly those at the National Innovation Agency (NIA)
Thailand, the primary source of the sample. The policies can be formulated in terms of
stimulating a firm’s dynamic learning capability (absorptive capacity) and knowledge
exchange across industry networks and information resources. This can advance the
traditional array of policy interventions by supporting future knowledge inflows and
innovation activities that may ultimately lead to the increased development of market-
driving innovations at the national level.
1.5 Outline of Thesis Chapters
This thesis comprises six chapters. The structure of each chapter is as follows.
Chapter 1: Introduction
This chapter provides an introduction and overview of the research background to the thesis.
Chapter 2: Literature Review and Conceptual Model
Chapter 2 presents an extensive review of the relevant literature associated with the research
area of the study, see Figure 1.2.

18
Source: developed from this research
The discussion commences with a review of the resource-based perspective and dynamic
capabilities and in relation to the resource-based view of the firm and product innovation.
This is followed by the introduction to product innovation, which includes a review of new
product development and product innovativeness, the definitions of product innovation
types and in particular a classification of market-driving innovation for this research. The
nature of market-driving innovation is also reviewed in terms of the final outcome measures
and the critical success factors/dimensions for NPD best practice, which are particularly
related to the important front end of innovation. The nature of the front end of market-
driving innovation is then explored and explicated in a review of the general front end of
innovation (defining) and in relation to market-driving innovation, reviewing the front end
challenges, the front end outcome measures and the front end success factors within which
the concepts of market visioning competence, market vision and absorptive capacity have
2.2 The Resource-Based Perspective and Dynamic Capabilities
2.5 The Nature of the Front End of Market-Driving Innovation
2.4. The Nature of Market-Driving Innovation
2.6 The Emergence of Critical Front End Success Factors
2.8 Chapter Summary
2.3 Introduction to Product Innovation
2.7 Conceptual Model and Hypotheses Development
2.1 Introduction
Figure 1.2: Outline of Chapter 2 – Literature Review and Conceptual Model

19
emerged from recent literature. These concepts are further reviewed and defined for the
purpose of this study.
In setting up the theoretical framework, the relationships between market visioning
competence and its resultant market vision, and potential antecedent absorptive capacity and
performance consequences are drawn and analysed. In addition, potential moderating
conditions are considered in terms of their effects on the relationships between market
vision and performance consequences. The chapter concludes with a conceptual model
identifying a number of variables and their relationships derived from the literature review
and translated into a series of relevant hypotheses for empirical testing.
Chapter 3: Research Methodology
Chapter 3 provides a detailed plan of the research methodology employed to examine the
proposed hypotheses, see Figure 1.3.
Source: developed from this research
3.1 Introduction
3.4 Quantitative Research
3.3 Research Design
3.5 Data Preparation and Analysis Procedure
3.7 Chapter Summary
3.2 Research Paradigm
3.6 Ethical Considerations and Confidentiality
Figure 1.3: Outline of Chapter 3 – Research Methodology
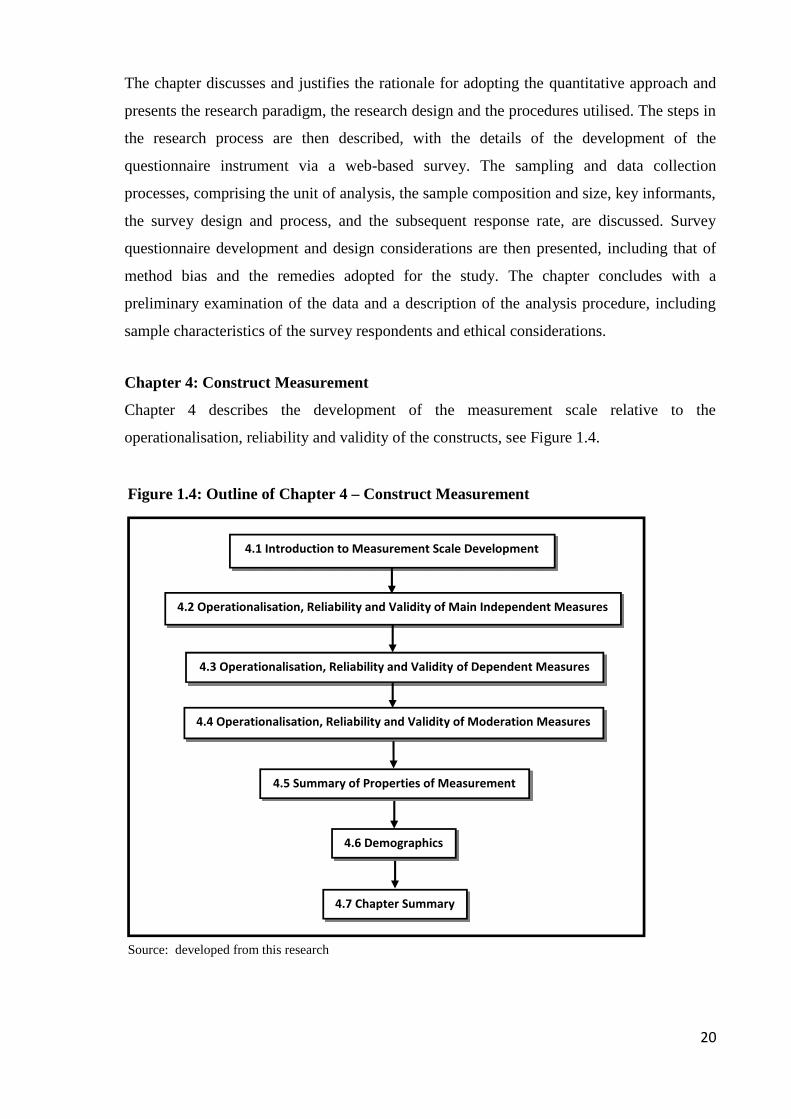
20
The chapter discusses and justifies the rationale for adopting the quantitative approach and
presents the research paradigm, the research design and the procedures utilised. The steps in
the research process are then described, with the details of the development of the
questionnaire instrument via a web-based survey. The sampling and data collection
processes, comprising the unit of analysis, the sample composition and size, key informants,
the survey design and process, and the subsequent response rate, are discussed. Survey
questionnaire development and design considerations are then presented, including that of
method bias and the remedies adopted for the study. The chapter concludes with a
preliminary examination of the data and a description of the analysis procedure, including
sample characteristics of the survey respondents and ethical considerations.
Chapter 4: Construct Measurement
Chapter 4 describes the development of the measurement scale relative to the
operationalisation, reliability and validity of the constructs, see Figure 1.4.
Source: developed from this research
4.1 Introduction to Measurement Scale Development
4.4 Operationalisation, Reliability and Validity of Moderation Measures
4.3 Operationalisation, Reliability and Validity of Dependent Measures
4.5 Summary of Properties of Measurement
4.7 Chapter Summary
4.2 Operationalisation, Reliability and Validity of Main Independent Measures
4.6 Demographics
Figure 1.4: Outline of Chapter 4 – Construct Measurement
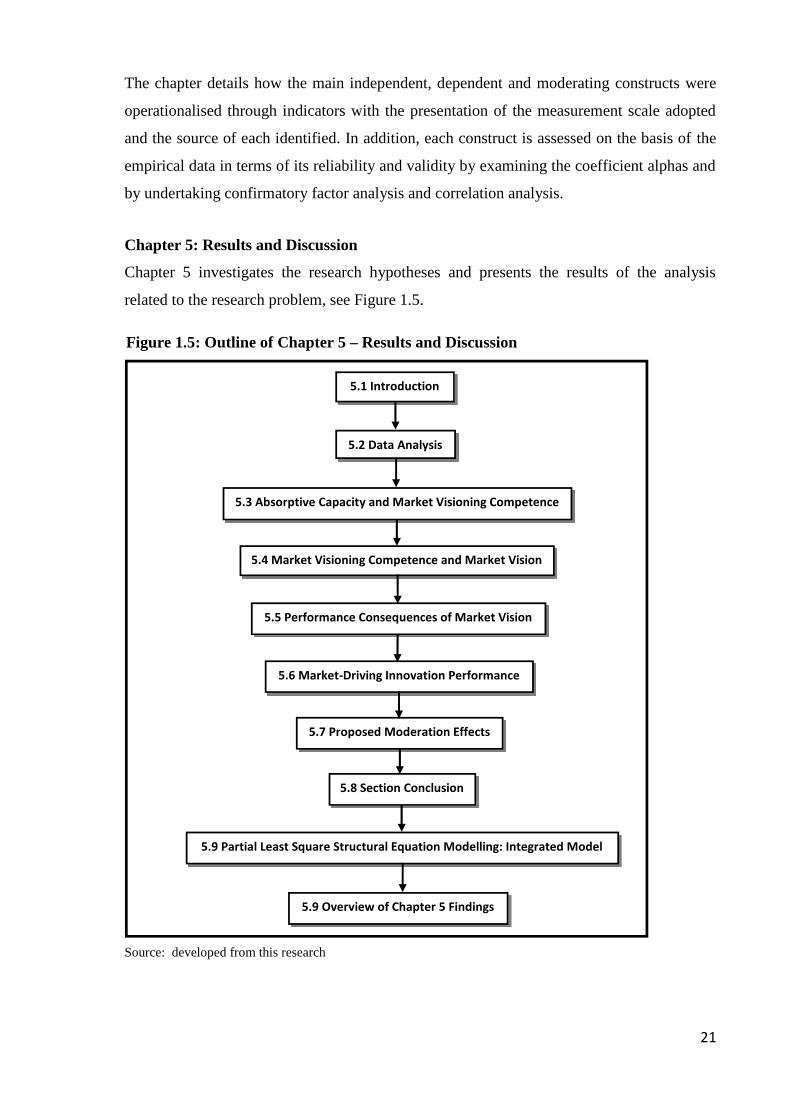
21
The chapter details how the main independent, dependent and moderating constructs were
operationalised through indicators with the presentation of the measurement scale adopted
and the source of each identified. In addition, each construct is assessed on the basis of the
empirical data in terms of its reliability and validity by examining the coefficient alphas and
by undertaking confirmatory factor analysis and correlation analysis.
Chapter 5: Results and Discussion
Chapter 5 investigates the research hypotheses and presents the results of the analysis
related to the research problem, see Figure 1.5.
Source: developed from this research
5.1 Introduction
5.4 Market Visioning Competence and Market Vision
5.3 Absorptive Capacity and Market Visioning Competence
5.5 Performance Consequences of Market Vision
5.7 Proposed Moderation Effects
5.2 Data Analysis
5.6 Market-Driving Innovation Performance
5.8 Section Conclusion
5.9 Partial Least Square Structural Equation Modelling: Integrated Model
Figure 1.5: Outline of Chapter 5 – Results and Discussion
5.9 Overview of Chapter 5 Findings
22
Simple bivariate and multiple regression analyses are utilised to examine the direct
relationships between absorptive capacity, market visioning competence and its resultant
market vision, and the impacts on market-driving innovation performance including the
associated moderation effects. Then the chapter presents an integrated model using Partial
Least Square Structural Equation Modelling (PLS-SEM) to further examine the
relationships simultaneously and assess the fit between the empirical data and the
conceptual model derived from the literature review.
Chapter 6: Conclusions and Implications
This final chapter presents the key findings and main conclusions of the study associated
with each of the hypotheses and the additional analysis results. The theoretical and
managerial implications are identified along with implications for public policy makers. The
chapter concludes with an acknowledgement of the limitations of the study and
recommendations for future research arising from this study.
1.6 Chapter Summary
This chapter has provided an overview of the thesis, outlining the background and
significance of the research, and presenting the research objectives and questions. An
outline of the research methodology including the research context, research design and unit
of analysis was also presented. This was followed by a list of the research contributions and
an outline of the thesis chapters.
The following chapter provides an extensive review of the relevant literature, the foundation
upon which the conceptual framework was developed.
23
CHAPTER 2: LITERATURE REVIEW AND CONCEPTUALMODEL
2.1 Introduction
Chapter 1 provided an overview of the thesis, explaining the background and significance of
the research, and presenting the subsequent research objectives and research questions. This
was followed by the research methodology, the research contributions and an outline of the
thesis chapters.
This chapter reviews the product innovation and management literature on market-driving
innovation, particularly at the front end of the innovation process. The perspective is
grounded in the resource-based view (RBV) of the firm as proposed in the dynamic
capabilities literature. The types of product innovation are first defined and classified,
including that of a market-driving innovation. The common success factors associated with
a market-driving innovation and its final outcome measures are identified and reviewed
from the relevant studies. The front end of innovation is then examined as an important area
of focus for market-driving innovation, particularly in relation to its critical success factors
and outcome measures. This is followed by a presentation of the conceptual model and the
research hypotheses, proposing the relationships between the constructs that emerged from
the literature review to form the foundation and frame the area of study.
2.2 The Resource-Based Perspective and Dynamic Capabilities
Over the past decade, resource-based theory (RBT) (Penrose, 1959) has been an important
although somewhat controversial perspective used in strategic management literature to
explain a firm’s success. RBT postulates that a firm’s resources are the primary
determinants of sustainable competitive advantage and superior performance (Conner, 1991;
Penrose, 1959). Competitive advantage can be measured by economic rents, that is, the
return on resources invested or, more broadly, profits (Grant, 1991). According to Porter
24
(1980, 1985), competitive advantage relates to superior differentiation and/or low-cost
position. This derives from a firm’s combination of unique resources that are valuable, rare,
nonsubstitutable and imperfectly imitable (Barney, 1991; Collis & Montgomery, 1995;
Smith, Vasudevan & Tanniru, 1996).
Resources are firm-specific assets or inputs into the production process (Grant, 1991). These
resources are owned, controlled or accessed by a firm, and give the firm the capacity to
“exploit opportunities or neutralize threats” as well as to improve the efficiency and
effectiveness of its performance (Barney, 1991, p.106). Typically, resources are categorised
as tangible, such as capital and equipment, and intangible, such as the skills, talent and tacit
knowledge of individual employees. The key resources are the intangible skills and
knowledge that are developed over time and are difficult to transfer across firms. A firm
equipped with such resources is superior to its competitors (Teece et al., 1997).
The fundamental source of competitive advantage is a firm’s capability to adapt, integrate,
build and reconfigure “internal and external organisational skills, resources and functional
competences” to address the changing environment (Teece et al., 1997, p.515). The term
“capability” refers to the combination and accumulation of resources for producing any kind
of work or activity and is, in essence, “a routine, or a number of interacting routines”
(Grant, 1991, p.122). “Organisational capabilities” are the embedded processes, routines and
current practices of learning, organising and getting specific activities done in a firm
(Eisenhardt & Martin, 2000; Teece et al., 1997). A unique combination of both strategic and
complementary key resources, particularly those with the potential to generate rents, may
allow a firm to develop inputs to organisational capability, critical competences and
embedded routines (Tallman, 2005). The resources in themselves, however, appear to be
less valuable without the organisational capabilities to manage them. Porter (1991, 1996)
stated that the processes and activities for creating advantage are more important to focus on
and analyse than the firm’s resources.
This broader capabilities view of RBT reflects the resource-based view (RBV) of the firm as
proposed in the dynamic capabilities literature (Barney, 1986; Montgomery, 1995; Rumelt,
1984; Wernerfelt, 1984). The RBV of the firm has emerged as one of the most fruitful
trends within the RBT (Acedo, Barroso & Galan, 2006). This is because the traditional RBT

25
does not provide an adequate explanation of how and why firms achieve superior long-term
performance in rapidly changing and unpredictable situations. Accordingly, the importance
of the RBV perspective in explaining the sources of a firm’s performance is recognised by
many authors (e.g. Amit & Schoemaker, 1993; Barney, 1991; Mahoney & Pandian, 1992;
Peteraf, 1993; Peteraf & Barney, 2003). A central premise of RBV is that a certain set of
resources and capabilities enables firms to survive in highly challenging settings. Numerous
RBV researchers have focused on “look within the enterprise and down to the factor market
conditions that the enterprise must contend with, to search for some possible causes of
sustainable competitive advantages”, holding constant all other factors outside the firm
(Peteraf & Barney, 2003, p.312). This inward-looking perspective has proved to be useful
for analysing various strategic issues and diversification (Foss & Knudsen, 2003). In
addition, recent research on RBV has emphasised intangible assets, which include dynamic
capabilities (Teece et al., 1997).
Dynamic capability theory extends RBV to incorporate the process dimension of gaining
and sustaining advantage over time (Teece, 2007; Teece et al., 1997). According to Winter
(2000), dynamic capabilities can be strategically defined as effecting organisational change
by changing the path of evolution and development to match the requirements of the
changing environment. The term “dynamic” refers to:
the capacity to renew competences so as to achieve congruence with the
changing business environment; certain innovative responses are required
when time-to-market and timing are critical, the rate of technological change is
rapid, and the nature of future competition and markets difficult to determine.
(Teece et al., 1997, p.515)
In this view, “dynamic capabilities” refers to “a learned and stable pattern of collective
activity through which the organization systematically generates and modifies its operating
routines in pursuit of improved effectiveness” (Zollo & Winter, 2002, p.340). The dynamic
capabilities of firms are heterogeneous in respect to resources, capabilities and endowments
that are difficult to modify (Amit & Schoemaker, 1993; Barney, 1991; Mahoney & Pandian,
1992; Penrose, 1959; Wernerfelt, 1984). For this reason, the RBV of a firm and its dynamic
capabilities reflect the firm’s ability to develop new capabilities through constant
reconfiguration, recombination and the accumulation of different types of resources (i.e.,

26
skill acquisition, learning and other intangible assets). The firm can therefore develop new
applications and attain new and innovative forms of competitive advantage to meet
changing market demands (Eisenhardt & Martin, 2000; O’Regan & Ghobadian, 2004; Teece
et al., 1997).
2.2.1 The Resource-Based View of the Firm and Product Innovation
The Marketing Science Institute (MSI) has highlighted the continuing development of new
approaches to the topic of new product development (NPD) and innovation for nearly a
decade (MSI, 2008, 2014). NPD and product innovation are among the core capabilities for
a firm’s success and sustainable growth (Beverland et al., 2006; Brown & Eisenhardt, 1995;
Cousins, Lawson, Petersen & Handfield, 2011; Jaruzelski & Dehoff, 2009; McNally,
Akdeniz & Calantone, 2011; McNally & Schmidt, 2011). Developing product innovation is
important for firms to survive in the modern world. Accenture Research (2009) found that
89% of the firms surveyed view innovation as a top priority to achieve future growth. A
Boston Consulting Group Senior Executive Innovation Survey (2010) found that 71% of
firms view product innovation among their top three strategic priorities and that 70%
consider new-to-the-world products to be important or very important to a firm’s future
(Andrew, Manget, Michael, Taylor & Zablit, 2010). Statistical evidence has shown product
innovation to account for up to 33% of a firm’s sales (Cooper & Kleinschmidt, 2010).
Despite the importance of product innovation to a firm’s success, many new products are
not commercially successful. The American Productivity & Quality Center (2003) reported
that only about one in ten product concepts emerge into launch and only 51% of those are
launched within the original schedule. The Product Development Management
Association’s Best Practices Study found that only 59% of new products commercialised by
firms are generally successful, and only 54% are regarded as profitable (Barczak, Griffin &
Kahn, 2009). In a similar vein, Cooper and Kleinschmidt (2010) asserted that commercial
success for new products is found in only one of four development projects and up to $80
billion of annual losses are incurred for having to abandon one-third of NPD projects. This
raises the questions of why some firms are more efficient and effective than others in
27
undertaking NPD and what the organisational resources and capabilities are that account for
a firm’s success.
A number of recent studies have used RBV to investigate the role of resources as the
fundamental source of competitive advantage through NPD and innovation (e.g. de Brentani
et al., 2010; Knight & Cavusgil, 2004; Zou & Cavusgil, 2002). In relation to product
development and management, the RBV of the firm provides a perspective that explains
how the resources of the functional and integrative capabilities of the firm influence its
process efficiency and product effectiveness (Verona, 1999). As resources are the inputs
into the production process (Grant, 1991), the firms that realise a uniqueness and superiority
of resources and capabilities can engage in NPD and innovations that “produce more
economically and/or better satisfy customer wants by creating greater value or net benefits”
(Peteraf & Barney, 2003, p.311). This can lead a firm to achieve a competitive advantage
over its competitors by means of attaining aggressive pricing and high sales volume (cost
leadership) and/or differentiated products that facilitate premium pricing, positive brand
image and customer loyalty (Porter, 1980, 1985). Cast in RBV, NPD capabilities are
therefore the principal functions of a firm that enable it to create superior, unique and novel
product offerings (Atuahene-Gima & Ko, 2001; Autio, Sapienza & Almeida, 2000).
In highly competitive and dynamic marketplace, firms require different approaches, a
paradigm beyond RBV (Eisenhardt & Martin, 2000; O'Connor, 2008; Teece et al., 1997).
Previous research on RBV has often viewed resources as a stable concept that can be
identified at a point in time and will endure over time (Dunford, Snell & Wright, 2003). The
RBV perspective thus applies to known markets where the industry/market structure,
boundaries and value chain are relatively stable and clear. As previously stated, it has been
argued that dynamic capabilities have become increasingly important as a source of
sustainable competitive advantage (Eisenhardt & Martin, 2000). Effective dynamic
capabilities focus on intangible resources, particularly the creation of new, situation-specific
knowledge (tacit knowledge) and “learning before doing” (Pisano, 1994) where this
resource base is modified over the course of its changing environment (Eisenhardt &
Martin, 2000; Smith et al., 1996; Teece et al., 1997).

28
The perspective forwarded in the RBV of the firm proposed in the dynamic capabilities
literature has become one of the dominant and most robust contemporary approaches for
analysing sustainable competitive advantage in recent studies, particularly for breakthrough
innovation (O'Connor, 2008; Reid & de Brentani, 2010). The approach is suitable for
investigating breakthrough innovation since its market is unknown and therefore it involves
a high level of ambiguity and uncertainty in the development process. Indeed, breakthrough
innovation appears to constitute the dynamic capability. Successful breakthrough innovation
requires superior resources in regard to value, rarity and the inimitability of embedded skills
and tacit knowledge (Barney, 1991).
Breakthrough innovation has been argued to be an important source of sustainable
competitive advantage. The benefits of breakthrough innovation can be huge and enduring
for both new and established firms (e.g. Chandy & Tellis, 1998; Hamel & Prahalad, 1994a;
Hauser et al., 2006; Schumpeter, 1934; Wind & Mahajan, 1997). Breakthrough innovation
sets the stage for future product development and creates a new platform that drives the
market (Chandy & Tellis, 2000; McDermott & O'Connor, 2002). It is evident that firms can
gain greater depth and breadth in their product portfolio through breakthrough innovations
than from a single product line. These firms are also more successful than highly diversified
firms (Sorescu et al., 2003). Schindehutte et al. (2008, p.7) claimed that firms that engage in
market-driving behaviour by focusing on breakthrough [market-driving] innovation can
“create entirely new markets, produce discontinuous leaps in customer value, design unique
business systems, develop new channels, raise service to unprecedented levels, and
fundamentally change the rules of the competitive game”.
Despite the significance of breakthrough innovation as a crucial source for corporate growth
and survival, achieving its successful development remains an elusive goal for many firms
(O'Connor et al., 2008). As Spanjol, Tam, Qualls, and Bohlmann (2011) stated, “the NPD
portfolio in most companies is dominated by incremental innovations, as evidenced in
statistics showing that up to 90% of new product introductions are incremental” (p.627). In
other words, only 10% of new product introductions are real breakthroughs (Griffin, 1997b;
Reid & de Brentani, 2004). Those real breakthroughs, however, generate 24% of profits
(Martin, 1995). Sorescu et al. (2003) found that a minority of firms develop a large majority
of the breakthrough innovations. A strong financial performance is found in firms which
29
develop breakthrough innovations, especially those with high pre-product levels of
marketing and technology support. Thus, strong evidence has been found that successful
breakthrough innovation pays off more than proportionally (Cooper, 1990a; Kleinschmidt &
Cooper, 1991). Indeed, breakthrough innovation continues to “consistently generate more
positive performance outcomes than incremental innovations” (Rubera & Kirca, 2012,
p.143).
Accordingly, the assumption of this research is based on the perspective of the RBV of the
firm and dynamic capabilities. The perspective focuses on firm-specific organisational
resources, capabilities and functional competences that could help to explain how firms
achieve success in developing market-driving innovations. The resource-based dynamic
capabilities highlight the importance of exploratory learning processes and knowledge
creation for firms operating in dynamic markets. Firms assemble and share new information
in order to create discontinuities in the environment, as provided by market-driving
innovation, and to build further capabilities and resources. The result is a competitive
advantage that can lead to a firm’s superior performance, particularly in a highly
challenging setting (Teece et al., 1997).
In addition, it is also important to differentiate the terms “capability”, “competence” and
“capacity” when analysing a firm’s ability to innovate. Generally, “capability” refers a
collaborative process that can be deployed or improved and through which an individual’s
know-how – that is, competence – can be exploited. “Competence” is about getting the right
people with certain skills (sufficient knowledge, strength and abilities) to successfully
perform and process critical work functions, through capability, in a defined work setting
(Vincent, 2008). The relevant questions for firms to ask themselves in relation to
“capability” are: “How can we get done what we need to get done?” and “How easy is it to
access, deploy or apply the competencies we need?” (Vincent, 2008, para. 4-5), and
importantly “What can the firm do more effectively than its rivals?” (Grant, 1991, p.115).
The questions related to “competence” are: “Who knows how?” and “How well do they
know?” (Vincent, 2008, para. 4-5). The questions “Do we have enough?” and “How much
is needed?” refer to the “capacity” to hold, receive or accommodate amount/volume
(Vincent, 2008, para. 6).
30
2.3 Introduction to Product Innovation
2.3.1 New Product Development and Product Innovativeness
In general, the new product development (NPD) process or product innovation process is
about bringing new products to market. A new feasible product idea can be called an
invention. An invention that has progressed through the stages of production, marketing and
diffusion into the marketplace, and has been adopted by customers can be called a product
innovation (Garcia & Calantone, 2002). According to Garcia and Calantone (2002, p.112),
“the innovation process comprises the technological development of an invention combined
with the market introduction of that invention to end-users through adoption and diffusion”.
The NPD process is iterative, which involves the first introduction of a product innovation
followed by subsequent reintroduction of an improved version. The degree of newness of a
product innovation is often measured by its innovativeness. Product innovativeness has been
measured according to both the product’s newness to the marketplace (macro level) and the
product’s newness to the firm (micro level) (Garcia & Calantone, 2002; Harmancioglu,
Dröge & Calantone, 2009; Song & Montoya-Weiss, 1998). More specifically, Johnson and
Jones (1957) suggested that the term “newness” can be measured in technological and
market dimensions. On one hand, the technological dimension verifies a paradigm shift in
the science and technology of a new product. On the other hand, the market dimension
verifies the extent to which the new product generates a paradigm shift in the market
structure in an industry (Chandy & Tellis, 1998; Garcia & Calantone, 2002). The
technological and market dimensions have become widely recognised in studies of new
product success factors and related NPD strategies, development processes and performance
(Harmancioglu et al., 2009).
Accordingly, the degree of newness of a product at both macro and micro levels can be
measured by its discontinuity in technological and/or marketing dimensions (Garcia &
Calantone, 2002). The discontinuity of a new product at the macro level causes “a paradigm
shift in the science and technology and/or market structure in an industry” (Garcia &
Calantone, 2002, p.113). The discontinuity of a new product at the micro level influences
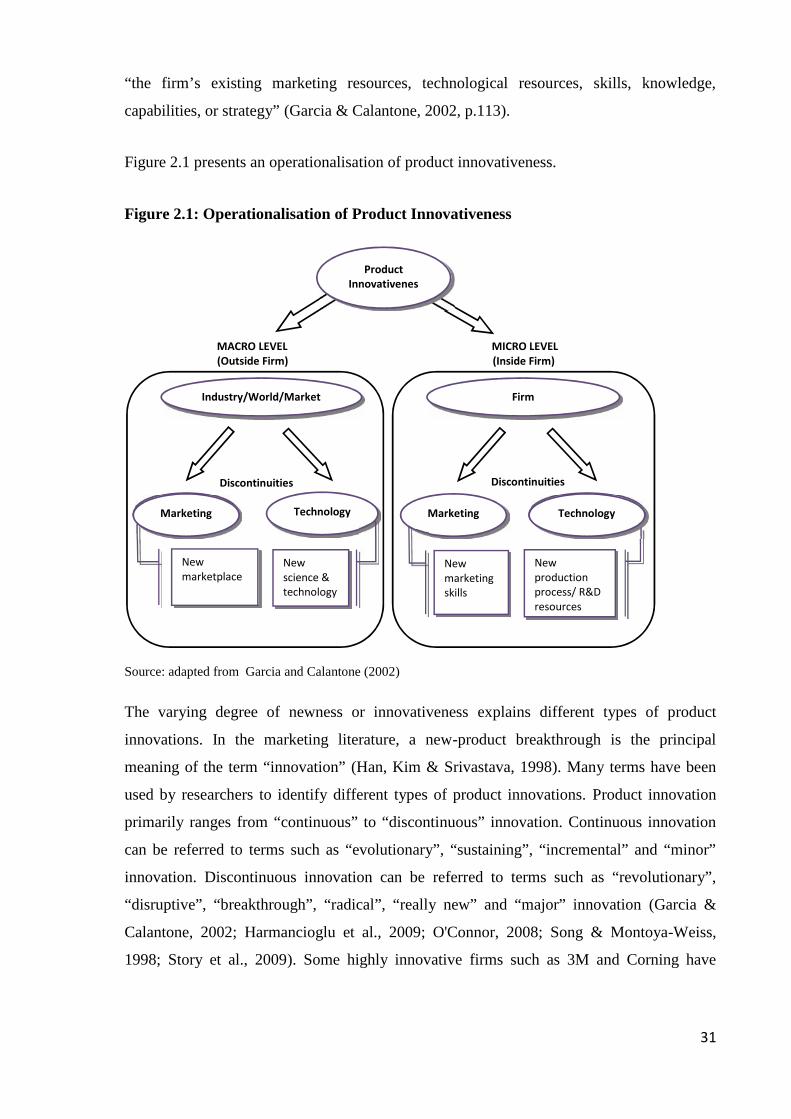
31
“the firm’s existing marketing resources, technological resources, skills, knowledge,
capabilities, or strategy” (Garcia & Calantone, 2002, p.113).
Figure 2.1 presents an operationalisation of product innovativeness.
Figure 2.1: Operationalisation of Product Innovativeness
MACRO LEVEL MICRO LEVEL(Outside Firm) (Inside Firm)
Source: adapted from Garcia and Calantone (2002)
The varying degree of newness or innovativeness explains different types of product
innovations. In the marketing literature, a new-product breakthrough is the principal
meaning of the term “innovation” (Han, Kim & Srivastava, 1998). Many terms have been
used by researchers to identify different types of product innovations. Product innovation
primarily ranges from “continuous” to “discontinuous” innovation. Continuous innovation
can be referred to terms such as “evolutionary”, “sustaining”, “incremental” and “minor”
innovation. Discontinuous innovation can be referred to terms such as “revolutionary”,
“disruptive”, “breakthrough”, “radical”, “really new” and “major” innovation (Garcia &
Calantone, 2002; Harmancioglu et al., 2009; O'Connor, 2008; Song & Montoya-Weiss,
1998; Story et al., 2009). Some highly innovative firms such as 3M and Corning have
Discontinuities Discontinuities
Industry/World/Market Firm
Marketing MarketingTechnology Technology
Newmarketplace
Newmarketingskills
Newscience &technology
Newproductionprocess/ R&Dresources
ProductInnovativenes
s
Marketing Technology
DiscontinuitiesDiscontinuities
32
categorised the degree of product innovativeness as “horizon 1, 2, 3” and “today, tomorrow
and beyond” (O'Connor, 2010, p.2). These different expressions create a lack of clear
distinction between the terms and difficulties in their interpretations (Danneels &
Kleinschmidt, 2001; de Brentani, 2001). Researchers and firms are thus far from a
consensus regarding the definition of “innovation”, particularly for breakthrough types
(McDermott & O'Connor, 2002).
According to March (1991), radical innovation can be differentiated from incremental
innovation by its exploration competencies. Leifer et al. (2000) described exploration as
involving “something fundamentally new, including new products, processes, or
combinations of the two” (p.5). In contrast, incremental innovation is based on exploitation
competencies, and has to do with refining and improving the cost or features of existing
products. This terminology has been used by the majority of the researchers to make the
distinction between radical and incremental innovation (Leifer et al., 2000).
Following Atuahene-Gima (2005), “radical innovation” refers to new products that “involve
fundamental changes in technology for the firm, typically address the needs of emerging
customers, new to the firm and/or industry, and offer substantial new benefits to customers”
(p.65). In contrast to radical innovation, “incremental innovation” refers to “product
improvements and line extensions that are usually aimed at satisfying the needs of existing
customers. They involve small changes in technology and little deviation from the current
product-market experience of the firm” (Atuahene-Gima, 2005, p.65).
Product innovation is also related to being market focused or market leading. Jaworski et al.
(2000) suggested that firms can be market driving (driving markets) or market driven. Being
market driving means that firms challenge the status quo to discover latent or unarticulated
needs of customers to develop breakthrough innovations in a new (unpredictable) market
(Deszca, Munro & Noori, 1999; Kumar et al., 2000; O'Connor, 1998; Varadarajan, 2009).
The market structure and the behaviour of market players are manipulated, which increases
the competitiveness of the industry. The market structure can be changed in three ways: “(1)
eliminating players in a market (deconstruction approach), (2) building a new or modified
set of players in a market (construction approach) and (3) changing the functions performed
by players (functional modification approach)” (Jaworski et al., 2000, p.45). Further,
33
changing the mindset of customers, competitors and other stakeholders may directly
influence market behaviour. As opposed to being market driving, market driven means that
a firm reactively responds to customer’s preferences and follows other players’ behaviour to
develop incremental innovations within a given market structure (Jaworski et al., 2000;
Kumar et al., 2000).
According to Zortea-Johnston et al. (2012), “those innovations that create new customers,
lead existing customers, meet latent needs, and reshape product/market spaces” are referred
to as “driving markets innovations” (p.146). Zortea-Johnston et al. (2012) advocate that
driving markets innovations drive the market and are considered to be radical or
breakthrough in nature (i.e. new to the world innovations or those innovations that either
change consumer behaviour or market structures). These types of innovations enable firms
to “renew their competitive position and delay eventual firm decline” (Zortea-Johnston et
al., 2012, p.146). Other researchers have also described driving markets innovation as
“market-driving innovation” (e.g. Kumar et al., 2000; Schindehutte et al., 2008).
Schindehutte et al. (2008, p.17) state “market-driving firms must search for their next
market-driving innovation, or lose its competitive advantage to a new incumbent” (p.17). In
contrast to market-driving innovation, “market-driven innovation” is considered to be
incremental in nature. This type of product innovation is developed within the confine of the
existing market structure and does not, or at most very little, alter consumers’ usage pattern
or behaviour (Zortea-Johnston et al., 2012).
Past empirical research has leaned towards an internal firm perspective rather than an
external customer perspective to measure innovativeness (Harmancioglu et al., 2009; Song
& Montoya-Weiss, 1998). The firm perspective is consistent with the RBV of the firm or
inward-looking view grounded in this study. Innovation has been extensively identified in
both the technological and the market dimensions and the perspectives on changes made in
an organisation (Damanpour, 1991; Garcia & Calantone, 2002). Innovative products that are
new to both dimensions necessitate more learning/unlearning and organisational changes. In
this regard, radical innovations require a greater variety of resources, new skills,
learning/unlearning, flexibility and capabilities quite apart from existing technology and
practices (McDermott & O'Connor, 2002). Radical innovations therefore involve more
uncertainty and a higher proportion of experimentation than incremental innovations that
34
involve only extensions, refinements or adaptations of established product designs (Kessler
& Chakrabarti, 1999; Ottum & Moore, 1997; Sethi, 2000; Sivadas & Dwyer, 2000). Mohr et
al. (2005, p.18-19) considered that “breakthrough (radical) innovations are so different that
they cannot be compared to any existing practices or perceptions. They employ new
technologies and create new markets. Breakthroughs are conceptual shifts that make
history”.
2.3.2 Defining Types of Product Innovation
The terminology and theoretical work of other researchers has provided value in terms of
distinguishing the types of innovations. However, a practical definition is required based on
the resource-based view of the firm to gain insights into market-driving innovation. A clear
definition and set of criteria are important to provide structure to the body of the research
and the intended meaning of the innovation construct and its domains, including the
operationalisation implications (Varadarajan, 1996).
Accordingly, this research merges views from previous studies and defines “market-driving
[product] innovation” as “breakthrough product innovation, which explores new ideas or
technologies that transform existing markets or create new ones, and therefore require
market-driving competencies” (Jaworski et al., 2000; Leifer et al., 2000; March, 1991; Mohr
et al., 2005). Market-driving competencies are about getting “outside the immediate voice of
the customer” and proactively reshaping customers’ product preferences (Jaworski et al.,
2000, p.45).
As the majority of definitions of product newness describe the two common dimensions of
(1) technology and (2) markets, this research has correspondingly adopted criteria on these
dimensions to measure the newness of product innovation. For the purpose of this study, the
merged definition of “market-drivinginnovation” refers to a product identifiable by one or
both of the following criteria:
35
(1) builds on a very new idea or very new technology that has never been used in the
industry or market before, and/or;
(2) is one of the first of its kind introduced into the market and/or has an impact or causes
significant changes in the industry or product category (either offers 5 to 10 times
improved benefits or 30% cost reduction compared with the previous generation)
(Leifer et al., 2000; O'Connor, 1998; O'Connor & Rice, 2001; Song & Montoya-
Weiss, 1998).
These criteria identify what makes a product new to a firm. The first criterion verifies the
extent to which the idea or technology embedded in a new product is different from existing
ideas or technologies. Firms must have technological competence or very new ideas to
develop advanced technology or products that are able to drive the market. The second
criterion verifies the extent to which the new product is new to the market and/or impacts on
the current markets or industries or creates new ones. Firms must have market competence
to offer products better than existing products by discovering additional or unarticulated
needs of customers (Chandy & Tellis, 1998; Damanpour, 1991; Danneels & Kleinschmidt,
2001; Veryzer, 1998a).
Correspondingly, the two levels (low and high) for each criterion conceptually lead to four
types of product innovations (see Figure 2.2): (1) radical [breakthrough] innovation, (2)
technological breakthrough, (3) market breakthrough and (4) incremental innovation. This
study adopts one of the most prevalent typologies in innovation research (Harmancioglu et
al., 2009), primarily based on the work by Chandy and Tellis (1998), Garcia and Calantone
(2002), Song and Montoya-Weiss (1998) and Zortea-Johnston et al. (2012).
Figure 2.2 presents the types of product innovation defined in the thesis.
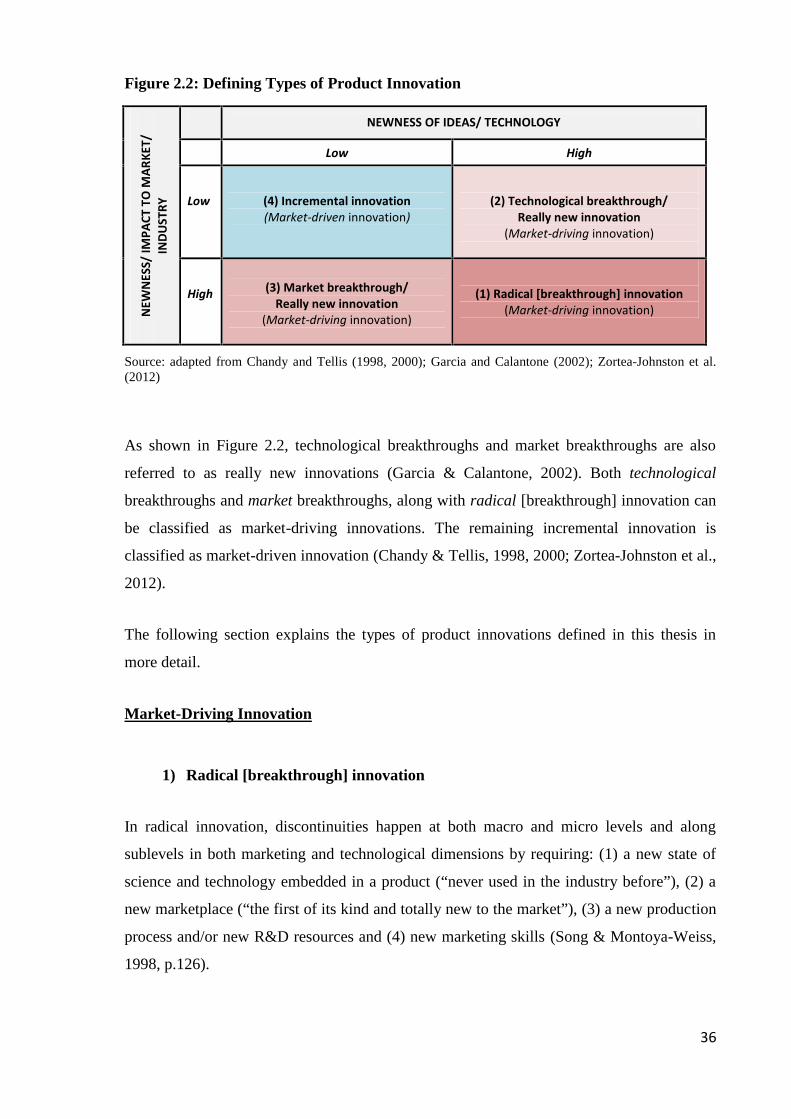
36
Figure 2.2: Defining Types of Product Innovation
NEW
NES
S/ IM
PACT
TO
MAR
KET/
INDU
STRY
NEWNESS OF IDEAS/ TECHNOLOGY
Low High
Low (4) Incremental innovation(Market-driven innovation)
(2) Technological breakthrough/Really new innovation
(Market-driving innovation)
High (3) Market breakthrough/Really new innovation
(Market-driving innovation)
(1) Radical [breakthrough] innovation(Market-driving innovation)
Source: adapted from Chandy and Tellis (1998, 2000); Garcia and Calantone (2002); Zortea-Johnston et al.(2012)
As shown in Figure 2.2, technological breakthroughs and market breakthroughs are also
referred to as really new innovations (Garcia & Calantone, 2002). Both technological
breakthroughs and market breakthroughs, along with radical [breakthrough] innovation can
be classified as market-driving innovations. The remaining incremental innovation is
classified as market-driven innovation (Chandy & Tellis, 1998, 2000; Zortea-Johnston et al.,
2012).
The following section explains the types of product innovations defined in this thesis in
more detail.
Market-Driving Innovation
1) Radical [breakthrough] innovation
In radical innovation, discontinuities happen at both macro and micro levels and along
sublevels in both marketing and technological dimensions by requiring: (1) a new state of
science and technology embedded in a product (“never used in the industry before”), (2) a
new marketplace (“the first of its kind and totally new to the market”), (3) a new production
process and/or new R&D resources and (4) new marketing skills (Song & Montoya-Weiss,
1998, p.126).
37
A radical [breakthrough] innovation meets all the described criteria, requiring changes in
both existing technology and market infrastructure (Garcia & Calantone, 2002). In other
words, “radical innovations” in this study are breakthrough new products that create
significant discontinuities and are new for both the firm and the marketplace – a new line of
business or new product line. Radical innovation provides an entirely new level of
functionality to customers and substantially transforms the way the current
markets/industries operate or forms new ones (Leifer et al., 2000). An example of a radical
innovation is the first consumer microwave oven; the many subsequent improvements were
not radical innovations.
2) Technological breakthrough and 3) Market breakthrough as “Really New
Innovation”
For really new innovation, discontinuity happens at the macro level, either in the
technological dimension through a new state of science and technology embedded in a
product (“never used in the industry before”) or in the marketing dimension through a new
marketplace (“the first of its kind and totally new to the market”); whereas at the micro level
discontinuities can happen in any combination by requiring new a production process/R&D
resources and/or new marketing skills (Song & Montoya-Weiss, 1998, p.126).
A really new innovation can be either a technological breakthrough or a market
breakthrough but will not incorporate both. In this study, “technological breakthroughs”
refer to products that build on a new or novel idea/technology that has never been used in
the industry before. The product may not be new to the market but the technology
application is. An example of a technological breakthrough is the Canon LaserJet printer,
which used new technology to extent the existing product line of the InkJet Printer (Garcia
& Calantone, 2002). “Market breakthroughs” refer to products that build on an existing idea
or technology and create a new market, being the first of their kind and totally new to the
market, and/or causing significant changes in the industry or product category (Song &
Swink, 2009). An example of a market breakthrough is the iPod, which used existing
technology (MP3) within a new platform to create a new market.
38
Market-Driven Innovation
4) Incremental innovation
For incremental innovation, discontinuity happens only at the micro level, from a
technological dimension which requires new production process/R&D resources and/or
from a marketing dimension which requires new marketing skills (Garcia & Calantone,
2002; Song & Montoya-Weiss, 1998). In other words, an incremental product is new either
to the firm or to the customer. This type of product innovation can also be referred to as
“market-driven innovation” (Jaworski et al., 2000; Zortea-Johnston et al., 2012) because it
is an adaptation of an existing product which only provides “new features, benefits, or
improvements to the existing technology in the existing market” (Garcia & Calantone, 2002,
p.113).
This study refers to “incremental” (“market-driven”) innovation as “an improvement of an
existing product, which exploits existing ideas/technologies in the existing market, and
therefore requires market-driven competencies” (Garcia & Calantone, 2002; Jaworski et al.,
2000; Leifer et al., 2000). Market-driven competencies are about listening to the voice of the
customer and being reactive to articulated product preferences in existing (predictable)
markets (Jaworski et al., 2000; Varadarajan, 2009). An example of an incremental
innovation is the Apple iPhone4, where incremental improvements to the iPhone3
introduced new benefits based on the existing platform.
39
2.3.2.1 Classifying Market-Driving Innovation (Radical and Really Newinnovation)
By defining the types of product innovation, radical innovations and really new innovations
are discontinuous and can be distinguished from the others. Most discontinuous innovations
are often classified as really new innovations—specifically, technological breakthroughs or
market breakthroughs. This is because new product development seldom results in both new
marketing and technical infrastructures at the macro level, as occurs in radical innovation. A
really new innovation is not as innovative as a radical innovation and is less able to
influence the market and/or reshape the nature of competition in the industry. According to
Garcia and Calantone (2002), really new innovations are considered as moderately
innovative products, as defined by Kleinschmidt and Cooper (1991, p.243) as “consisting of
lines to the firm, but where the products were not as innovative (that is not new to the
market) and new items in existing product lines for the firm”. There may also be fewer risks
and uncertainties associated with the development of a really new innovation than with the
development of a radical innovation (Garcia & Calantone, 2002; Kleinschmidt & Cooper,
1991).
For generalisation and simplification of term, “market-driving” (“breakthrough”) innovation
in this study is composed of both radical and really new innovations (that is, radical
breakthroughs, technological breakthroughs and market breakthroughs new products)
(Chandy & Tellis, 1998, 2000; Garcia & Calantone, 2002; Zortea-Johnston et al., 2012).
The focus of this research is specifically on these three types of ‘tangible’ breakthrough new
products rather than ‘intangible’ services or process innovations. The remaining incremental
innovation classified as market-driven innovation is thus not central to the thesis. The
classification of market-driving innovation is consistent with that of O'Connor (2008), who
treated and labelled radical and really new innovations collectively as “major innovation”.
Although radical innovation and really new innovation involve different degrees of product
newness, the strategic challenges of these two types of innovation are of like kind. A firm
engaged in developing radical or really new innovation is required to shift outside its realms
of knowledge and experience (O'Connor, 1998). This means that the firm cannot rely
completely on its current technology and customers, as in the NPD scenario of incremental
innovation (O'Connor, 2008).
40
2.4 The Nature of Market-Driving Innovation
2.4.1 Measuring the Final Outcomes of Market-Driving Innovation
In general, NPD or product innovation performance has been viewed in multidimensional
terms, comprising both financial and non-financial (strategic) measures (Samiee & Roth,
1992). It reflects the final outcome measures of product success, as a result of a firm’s new
product development and innovation efforts (Cooper, 1984; Cooper & Kleinschmidt, 1987b;
Hise, O'Neal, Parasuraman & McNeal, 1990). Firms can evaluate their financial returns
through subjective outcome perceptions (Cavusgil & Zou, 1994; Griffin & Page, 1996) or
by strategic proxies that are more easily determined in the shorter term (Crawford & di
Benedetto, 2003). This view is consistent with the RBV of the firm and the dynamic
capabilities literature. According to RBV studies, performance involves a firm’s ability to
achieve a competitive advantage and ultimately leads to superior financial returns. In the
longer term, financial measures reflect the firm’s achievement of quantifiable performance
objectives (Doyle, 1994; Heidt, 2008). The most frequently used financial measures are
profitability, return on investment and sales growth (Page, 1993). In the short term,
performance is gauged at the post-launch stage in terms of improved efficiency, market
share/position or breaking into new arenas (Griffin & Page, 1996; Kapelko, 2006; Smith et
al., 1996).
Table 2.1 presents the common measurement scales of product innovation performance that
have been developed and/or used in product innovation literature.
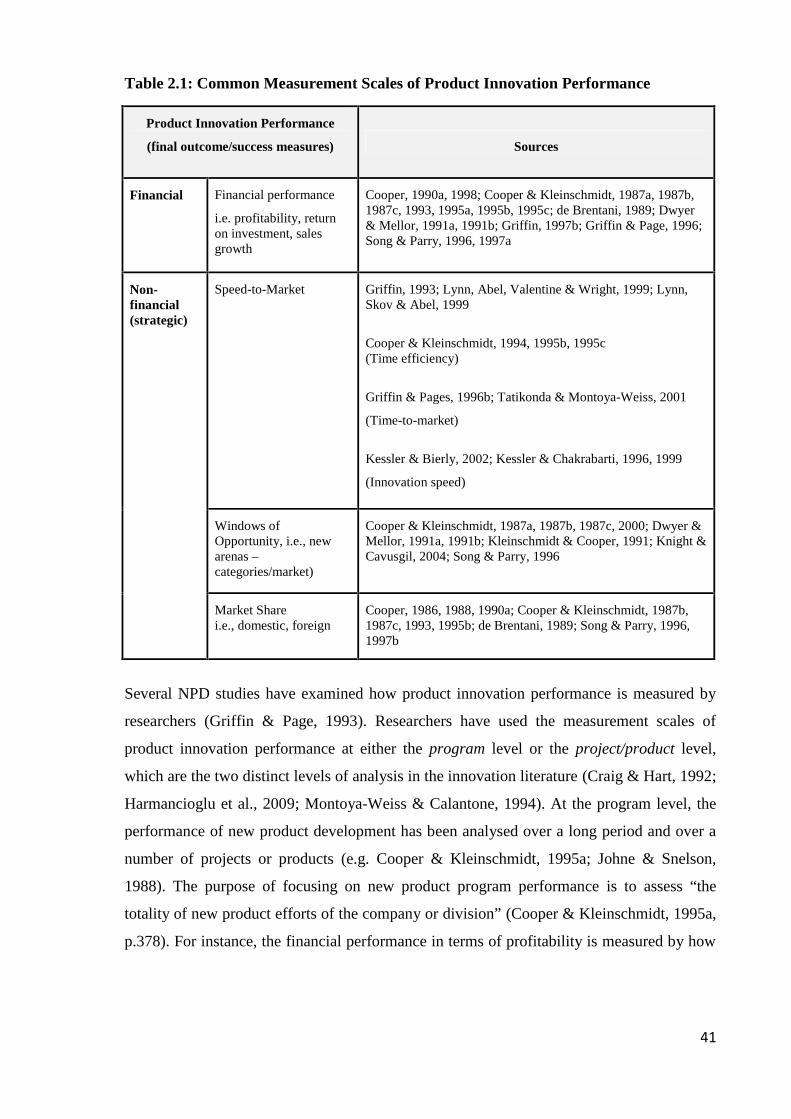
41
Table 2.1: Common Measurement Scales of Product Innovation Performance
Product Innovation Performance
(final outcome/success measures) Sources
Financial Financial performance
i.e. profitability, returnon investment, salesgrowth
Cooper, 1990a, 1998; Cooper & Kleinschmidt, 1987a, 1987b,1987c, 1993, 1995a, 1995b, 1995c; de Brentani, 1989; Dwyer& Mellor, 1991a, 1991b; Griffin, 1997b; Griffin & Page, 1996;Song & Parry, 1996, 1997a
Non-financial(strategic)
Speed-to-Market Griffin, 1993; Lynn, Abel, Valentine & Wright, 1999; Lynn,Skov & Abel, 1999
Cooper & Kleinschmidt, 1994, 1995b, 1995c(Time efficiency)
Griffin & Pages, 1996b; Tatikonda & Montoya-Weiss, 2001
(Time-to-market)
Kessler & Bierly, 2002; Kessler & Chakrabarti, 1996, 1999
(Innovation speed)
Windows ofOpportunity, i.e., newarenas –categories/market)
Cooper & Kleinschmidt, 1987a, 1987b, 1987c, 2000; Dwyer &Mellor, 1991a, 1991b; Kleinschmidt & Cooper, 1991; Knight &Cavusgil, 2004; Song & Parry, 1996
Market Sharei.e., domestic, foreign
Cooper, 1986, 1988, 1990a; Cooper & Kleinschmidt, 1987b,1987c, 1993, 1995b; de Brentani, 1989; Song & Parry, 1996,1997b
Several NPD studies have examined how product innovation performance is measured by
researchers (Griffin & Page, 1993). Researchers have used the measurement scales of
product innovation performance at either the program level or the project/product level,
which are the two distinct levels of analysis in the innovation literature (Craig & Hart, 1992;
Harmancioglu et al., 2009; Montoya-Weiss & Calantone, 1994). At the program level, the
performance of new product development has been analysed over a long period and over a
number of projects or products (e.g. Cooper & Kleinschmidt, 1995a; Johne & Snelson,
1988). The purpose of focusing on new product program performance is to assess “the
totality of new product efforts of the company or division” (Cooper & Kleinschmidt, 1995a,
p.378). For instance, the financial performance in terms of profitability is measured by how
42
profitable the company’s or division’s/business unit’s total new product efforts are (previous
three years) relative to the amount spent on them (Cooper, 1998). At the project level,
researchers have analysed the outcome and success of the development of a specific new
product (e.g. Cooper, 1984; Cooper & Kleinschmidt, 1987b; Dwyer & Mellor, 1991a;
Maidique & Zirger, 1984; Myers & Marquis, 1969; Rubenstein, Chakrabarti, O’Keefe,
Souder & Young, 1976; Zirger & Maidique, 1990). Profitability, for instance, is measured
by the extent to which the new product’s profit meets its profit objective.
The significance of market-driving innovation to superior performance has been shown in
numerous empirical studies (Cho & Pucik, 2005; Christensen, 1997; Lawless & Anderson,
1996; Sorescu et al., 2003; Zahra, 1996). However, only a limited number of studies have
dealt specifically with the performance measures of market-driving innovation (O'Connor et
al., 2008). Competitive advantage has been considered the most strategically useful measure
for performance-based success, particularly for new-to-the-world product (Bertels et al.,
2011; Griffin & Page, 1996). Consistent with the defined criteria of market-driving
innovation, the term “new-to-the-world” refers to products that offer customers new
solutions to problems that have never been solved before and thus create an entirely new
market (Griffin & Page, 1996).
Cast in RBV, competitive advantage is the ultimate key for firm performance, and can be
used to strategically and financially measure the success of market-driving innovation. The
commonly used financial measures of market-driving innovation are revenue and profit
growth due to new products (Chan, Musso & Shankar, 2008). The development of most
market-driving innovations can take many years (usually ten years or more) and millions of
investment dollars. Thus, superior financial returns for market-driving innovation can only
be expected in the long term (Chandy & Tellis, 2000; Morone, 1993; Sorescu et al., 2003).
This is less likely to please top management than short-term gains. The strategic or interim
measures of success (that is, at the post-launch stage) are becoming increasingly prevalent
for market-driving innovation (Bakar & Ahmad, 2010; McDermott & O'Connor, 2002).
The notion of “windows of opportunity” as a strategic measure signifies a relevant
performance objective in the context of market-driving innovation. The measure is a
common way of viewing new product success by capturing an exploitation of unique market
43
and/or product opportunities (Cooper & Kleinschmidt, 1987c). Given the high competition
and dynamism of today’s market, firms that are able to gain a foothold in new markets or
new product categories through market-driving innovation are likely to achieve competitive
advantage and succeed in the longer term (Cooper & Kleinschmidt, 2000; Knight &
Cavusgil, 2004). In line with the RBV of the firm, opening up windows of opportunity can
lead firms to attain market and/or technological leadership, which is a precursor to
competitive advantage and superior financial performance (Hunt, 1997; Peteraf & Barney,
2003). O'Connor et al. (2008) study on radical innovation success supported these
contentions by capturing the elements of windows of opportunity and financial performance
as “output” – that is, the degree to which “the investment in radical innovation has brought
commercial success, both financially and through market expansion” (p.74).
“Speed-to-market” is another strategic measure that captures the context of market-driving
innovation (Prajogo & Sohal, 2003). Different terms have been used as success measures
related to speed such as “innovation speed”, “time-to-market” and “time efficiency”. In
general, “speed-to-market” refers to the development cycle time from idea generation to
formal product launch or use by a lead user. This measure relates to accelerating activities,
including the tasks involved throughout the NPD process (Griffin, 1993). In line with the
RBV, the premise of speed-to-market is that it enables firms to achieve a competitive
advantage by being the first in the market (first-mover advantage) (Kessler & Chakrabarti,
1999). If a firm can develop a new product faster than its competitors or if development
takes less time than what is considered normal and customary in the industry, there is a
greater chance for the firm to establish an advanced strategic position and reap pioneering
advantage through market-driving innovation (i.e., being the first of its kind introduced to
the market).
44
2.4.2 The Critical Success Factors of Market-Driving Innovation
In recognising the significance of market-driving innovation to firm growth and survival,
researchers have begun to focus on success factors to explain the effects of various internal
and external factors on market-driving innovation performance (e.g. Herrmann, Tomczak &
Befurt, 2006; O'Connor, 2008; O'Connor et al., 2008). The understanding of the success
factors associated with the development of market-driving innovation is, nevertheless,
considerably limited as the studies associated with the success factors of NPD have
predominantly focused on incremental innovation, which provides little value when it
comes to managing the success of market-driving innovation (McDermott & O'Connor,
2002; Story et al., 2009). Several studies have clearly highlighted that managing market-
driving innovation requires approaches, processes, structure, people and competencies that
are different from those of the conventional incremental or market-driven innovation (e.g.
Bessant, Von Stamm, Moeslein & Neyer, 2010; Lindgren & O'Connor, 2011; O'Connor,
1998; O'Connor & Ayers, 2005; Story et al., 2009).
Accordingly, this section reviews a number of studies associated with the success of NPD
and categorises several important characteristics into seven critical success
factors/dimensions for both market-driven and market-driving innovations (see Table 2.2).
Table 2.2 presents the critical success factors of market-driven innovation and market-
driving innovation

45
Table 2.2: Summary of Critical Success Factors of Market-Driven Innovation andMarket-Driving Innovation
Factors/DimensionsMarket-Driven Innovation
(incremental)Market-Driving Innovation
(breakthrough)
1 Organisationalstructure
Single structure(only one NPD program for allproducts)
Cross-functional team betweendepartments
Clearly identified structure(strategic business units, looselycoupled to mainstreamorganisation)
Multifunctional skilled employeeswith entrepreneurial characteristics
2 Organisationalculture/behaviour(market orientation)
Market driven(reactive market orientation)
Top management involvement
Market driving(proactive market orientation)*
Top management involvement(visionary leaders), externallinkages with potential customersand constituents
3 NPD process Stage-gate process, strong marketorientation and rigorous go/killdecision points
Next generation stage-gate process(“full”, “xpress” and “lite”)
4. Front End of InnovationStrategic focus(NPD strategy)
Reactive NPD strategy:Market sensing: what does themarket want?- Focus on existing consumer needs- Address existing demand
Proactive NPD strategy*:Forward sensing: how can themarketplace evolve?- Focus on latent consumer needs- Build and create demand
5. Research Market research:- Customer insight (market pull)
Research and development (R&D):- Executive foresight*(technology push)
6 Commercialisation(launch tactics)
Mass market:Intensive distribution strategy:- Low expenditure- Product-market fit- Current channels
Niche market:Exclusive distribution strategy:- High expenditure- Customer education and service- New channels
7 Metrics andperformancemeasurement
Traditional measures for productdevelopment performance
Activity- and performance-basedmeasures
*Emerging success factors of market-driving innovation
Source: Barczak & Kahn, 2012; Cooper, 1988, 1994, 1996, 1998, 2011; Cooper & Edgett, 2008; Cooper &Kleinschmidt, 2010; Kahn et al., 2012; Kumar et al., 2000; O’Connor, 2008; Rangan & Bartus, 1995;Sethi & Iqbal, 2008
The following sections explain the seven multidimensional success factors in more detail.
46
1) Organisational structure
“Organisational structure” refers to the structure that underlies the establishment of a firm’s
product development and intra-company integration at the individual and team levels
(Barczak & Kahn, 2012; Kahn et al., 2012).
Predominantly, firms that focus on developing incremental innovations often have a single
structure or only one NPD program for all products (MacCormack, Crandall, Henderson &
Toft, 2012). In terms of organising and structuring NPD, the notion of multi-disciplinary,
cross-functional integration has been identified as a driver of NPD success (Salomo,
Keinschmidt & de Brentani, 2010). A cross-functional product development team may
consist of individuals with function-specific knowledge such as R&D, engineering,
purchasing, manufacturing, operations, sales and marketing. These individuals are closely
integrated to cooperate and exchange ideas and values about NPD activities in their
functional areas through both formal and informal communication (Cooper & Kleinschmidt,
2010; Gatignon & Xuereb, 1997). Market information can be collected and synthesised
from team members for making decisions related to NPD (Berchicci & Tucci, 2010).
Importantly, team members must be accountable from the start of the project through to the
end. Such cross-functional teams can undertake concurrent NPD and push new products
through to commercialisation (Cooper & Kleinschmidt, 2010).
Going beyond cross-functionality, an identified team of individuals or an institutionalised
group, department or other entity of the firm is structured for the development of market-
driving innovations. Market-driving innovations require an institutionalised group of highly
multifunctional individuals who are broadly skilled, knowledgeable and have
entrepreneurial characteristics to enable to work well in circumstances of high risk and
market/technical uncertainty (Lynn, Morone & Paulson, 1996; O'Connor, 1998; O'Connor
& McDermott, 2004; Simon, McKeough, Ayers, Rinehart & Alexia, 2003). According to
Olson, Walker, Ruekerf, and Bonnerd (2001), a high level of cooperation across different
functions, particularly between individuals in marketing and operations, can negatively
influence the early performance of highly innovative projects. The approach appears to kill
highly innovative product ideas and prevent them from emerging into development and
commercialisation. Entrepreneurial individuals have a mindset and vision that drive the

47
development of market-driving innovations while non-entrepreneurial individuals might not
be able foresee future potential opportunities and find it stressful to adapt to changing
circumstances (O'Connor, 2008).
In contrast to the organic environment of incremental innovation, the principal mechanisms
for managing these multifunctional and entrepreneurial individuals are flexibility, consensus
building and fluidity (Jelinek & Schoonhoven, 1993). Accordingly, having a clearly
identified organisational structure can ensure clear roles, responsibilities and reporting
relationships for both discipline and creativity (O'Connor, 2008). O'Connor (2008, p. 319)
stated that “an identified organisation with accumulated common experiences can
compensate for the memory loss that is likely when routines are simple and there is little
structure for managers to grasp”. Market-driving innovation needs to eventually be
embedded in an SBU where the business models, processes, resources, networks and
operating systems are loosely coupled to the mainstream operating model. An SBU allows
market-driving competencies to develop without being stamped out by concrete rules (Hill
& Rothaermel, 2003; Leonard-Barton, 1992; Rice, Leifer & O'Connor, 2002).
2) Organisational culture/behaviour (market orientation)
“Organisational culture” refers to the management value system of the firm and the top
management involvement that drive product development thinking and external
linkages/collaboration with partners, suppliers, customers and constituents (Barczak &
Kahn, 2012; Kahn et al., 2012). In the strategic marketing literature, the aspect of
organisational norms, values and culture is referred to as “market orientation”. Market
orientation inherently specifies organisational learning and decision-making behaviour,
activities, resources and capabilities (Slater & Narver, 1995). According to Jaworski and
Kohli (1993, p.53), market orientation is “the organization-wide generation of market
intelligence, dissemination of the intelligence across departments, and organization-wide
responsiveness to it”.

48
Top management support is an important factor that has a direct positive impact on the
climate and innovative culture of a firm and its new product performance (Cooper, 2001;
Cooper & Kleinschmidt, 1996; de Brentani & Kleinschmidt, 2004; Kleinschmidt, de
Brentani & Salomo, 2007). Top management support can lead a firm to innovate more
highly in market-driving innovations (Cooper, 2011). Managers must have the values and
beliefs to be visionary leaders to empower project teams and individuals to generate product
newness by encouraging an atmosphere of entrepreneurship and risk taking (de Brentani &
Kleinschmidt, 2004; Kleinschmidt et al., 2007). The role of top management is to act as
executive champions, mentors or facilitators to articulate a new product strategy, to foster
the commitment to the required product development resources and to discipline the process
for developing new products (Hill & Rothaermel, 2003).
“Market Driven” versus “Market Driving”
Several studies have explored the paradigm of market orientation (e.g. Deshpandé, Farley &
Webster, 1993; Jaworski & Kohli, 1993; Kohli & Jaworski, 1990; Narver & Slater, 1990).
Day (1993, 1994) developed a theoretical basis for the relationship between market
orientation and firm performance. It has also been found that firms engaging in an
appropriate market orientation by means of having the right culture of innovation can
achieve successful product innovation, sustainable competitive advantage and superior
financial performance (Baker & Sinkula, 1999; Kleinschmidt et al., 2007).
According to Jaworski et al. (2000, p.45), there are two approaches to being market
oriented: “market driven” versus “driving markets. The notion of driving markets has been
described as “market driving” by other researchers (e.g. Carrillat, Jaramillo & Locander,
2004; Kumar et al., 2000). At the organisational level, the view of the market-driven
approach and the market-driving approach is consistent with the perspective of “reactive”
and “proactive” market orientation, respectively (Narver, Slater & MacLachlan, 2000). On
one hand, firms engaging in market-driven behaviour learn and respond to changes in
stakeholder perceptions, preferences and behaviour (competitors, channel members,
partners, suppliers, influencers and distributors) within a given market structure. On the
other hand, market-driving firms unlearn received wisdom and proactively “shape”
customers and the market to create discontinuity or a fundamental industry shift (Jaworski et
49
al., 2000; Kumar et al., 2000). Hills and Sarin (2003, p.14) supported that “market driving
could be regarded as a firm’s ability to lead fundamental changes in the evolution of
industry conditions by influencing the value creation process at the product, market, or
industry levels”.
In today’s dynamic and highly competitive environment, firms are required to engage in
market-driving behaviour rather than market-driven behaviour to be successful. The
importance of market-driving orientation has been identified in the research on NPD success
(e.g. Carrillat et al., 2004; Hurley & Hult, 1998; Kumar, 1997; Schindehutte et al., 2008).
The success of market-driving firms is based on the design of the innovative activities that
would result in a dramatic leap of benefits that exceeds customers’ expectations and
advances existing product experiences, thus requiring major changes in consumer behaviour
(Kumar et al., 2000). Schindehutte et al. (2008, p.5) stated that “market-driving is a dynamic
advantage-creating capability and a disruptive advantage-destroying performance outcome,
and it reflects a strong entrepreneurial orientation”.
Market-driving firms have a greater capacity to innovate highly than market-driven firms
(Beverland et al., 2006). The capacity to innovate is related to what Cohen and Levinthal
(1990) called “absorptive capacity”. The innovativeness of a firm’s culture is an aspect that,
when acting in concert with various other organisational resources and capabilities, can
increase the innovative capacity of the firm (Hurley & Hult, 1998). This also involves the
firm’s formal and informal interactions with potentials customers and external constituents
(Dougherty, 1995; Eisenhardt & Martin, 2000). The linkage between the focal firm and
external sources is the key to NPD and breakthrough innovation as part of a knowledge
creating process (O'Connor, 2008; Reid & de Brentani, 2004). The external knowledge
brought into the firm combined with existing information leads to richer information stocks
that allow individuals and NPD teams to discover future market opportunities (Shane,
2000). The ability to assess and exploit external knowledge is a principal function of the
level of existing related knowledge (Cohen & Levinthal, 1990). Corning, one of the world’s
top innovative firms, for instance, has identified product opportunities through its
exploratory marketing function. The aim is to connect to completely new customers and to
exploit the rich technical competencies in the central research group (O'Connor, 2008).

50
From “Market-Driven” to “Market-Driving” Orientation
The concept of market-driven is predominantly considered in the marketing literature in
regard to its influence on firm performance (Kohli & Jaworski, 1990; Slater & Narver,
1998). Although several firms (e.g., Apple, Corning, 3M) have driven the market by
revolutionising their industry to gain a more sustainable competitive advantage, the market-
driving approach has been largely neglected by researchers (Carrillat et al., 2004; Kumar et
al., 2000). It is only recently that researchers have begun to focus on the essential behaviour
of firms to strategically become market-driving (Schindehutte et al., 2008). Market-driving
firms develop new solutions to problems that have not been solved previously; this enables
them to shape the market structure (Jaworski et al., 2000). Thus, there is a need to move the
focus of research away from market-driven orientation to market-driving orientation (Hills
& Sarin, 2003; Kumar et al., 2000).
Figure 2.3 illustrates the changing focus of market orientation.
Figure 2.3: The Changing Focus of Market Orientation
Source: adapted from Jaworski et al. (2000, p.46); Wind and Mahajan (1997, p.3)
Market-Driving
Market-Driven
BreakthroughInnovation
(Major changes in consumerbehaviour)
(Minimum changes in consumerbehaviour)
Given(Current Solutions)
Shape(New Solutions)
Market Behaviour
MarketStructure
Given(Current Problems)
Shape(New Problems)
IncrementalInnovation
51
The changing focus of market orientation from market-driven to market-driving is shedding
light on the development process of breakthrough innovation that has remained elusive to
date. While market-driven firms are excellent at developing incremental innovations,
market-driving firms are excellent at developing breakthrough innovations (Hills & Sarin,
2003; Leifer et al., 2001; Stolper, Blut & Holzmueller, 2009).
3) NPD process
A further known factor to new product development (NPD) success is the NPD process.
“NPD process” generally refers to the stages and gates of product development from
product concept through to launch (Barczak & Kahn, 2012; Kahn et al., 2012). Although
many processes have been proposed for managing NPD, there appears to be a fundamental
sequence of activities over the path of the development. In the early stage of the
development process, market opportunity and customer needs are evaluated to frame a
product concept. After refining the product concept, firms examine its technical feasibility
and move through the design, development and commercialisation phases (Crawford, 1994;
Hughes & Chafin, 1996; Ulrich & Eppinger, 1995; Urban & Hauser, 1993; Veryzer, 1998b).
In the marketing literature since the 1970s, many processes for NPD practices have been
documented. Historical processes such as the phased program planning (PPP) approach used
by NASA have been modified by firms for their use. Firms have used approaches such as
phased development process, structured development process and particularly stage-gate or
phased review process to provide templates for the stages of their NPD processes (Veryzer,
1998b). These processes delineate a formalised, rational step-by-step disciplined system
with a defined scope, the extent of activities for each stage, the required personnel and the
expected outcomes. This approach aims to provide high quality and to control some of the
technical and marketing uncertainty and risks associated in NPD (Zhang & Doll, 2001).
NPD personnel, team leaders and senior managers are required to be involved in the NPD
process and product innovation. Additional requirements are:
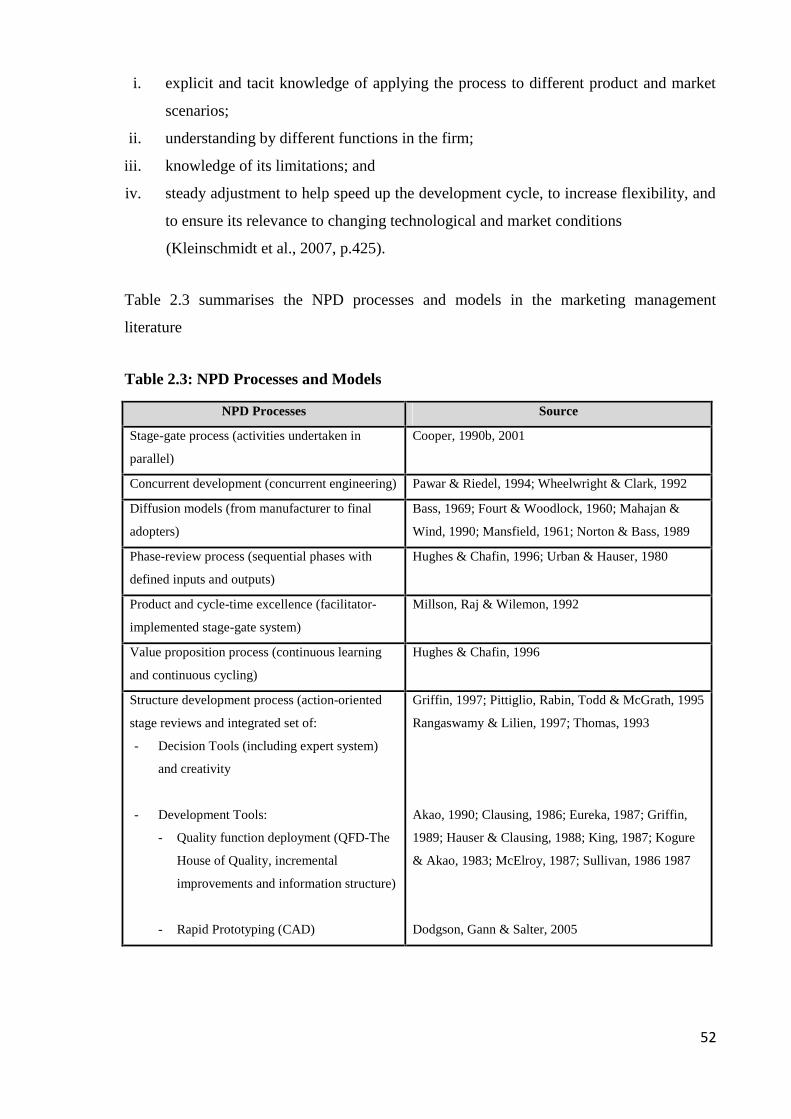
52
i. explicit and tacit knowledge of applying the process to different product and market
scenarios;
ii. understanding by different functions in the firm;
iii. knowledge of its limitations; and
iv. steady adjustment to help speed up the development cycle, to increase flexibility, and
to ensure its relevance to changing technological and market conditions
(Kleinschmidt et al., 2007, p.425).
Table 2.3 summarises the NPD processes and models in the marketing management
literature
Table 2.3: NPD Processes and Models
NPD Processes Source
Stage-gate process (activities undertaken in
parallel)
Cooper, 1990b, 2001
Concurrent development (concurrent engineering) Pawar & Riedel, 1994; Wheelwright & Clark, 1992
Diffusion models (from manufacturer to final
adopters)
Bass, 1969; Fourt & Woodlock, 1960; Mahajan &
Wind, 1990; Mansfield, 1961; Norton & Bass, 1989
Phase-review process (sequential phases with
defined inputs and outputs)
Hughes & Chafin, 1996; Urban & Hauser, 1980
Product and cycle-time excellence (facilitator-
implemented stage-gate system)
Millson, Raj & Wilemon, 1992
Value proposition process (continuous learning
and continuous cycling)
Hughes & Chafin, 1996
Structure development process (action-oriented
stage reviews and integrated set of:
- Decision Tools (including expert system)
and creativity
- Development Tools:
- Quality function deployment (QFD-The
House of Quality, incremental
improvements and information structure)
- Rapid Prototyping (CAD)
Griffin, 1997; Pittiglio, Rabin, Todd & McGrath, 1995
Rangaswamy & Lilien, 1997; Thomas, 1993
Akao, 1990; Clausing, 1986; Eureka, 1987; Griffin,
1989; Hauser & Clausing, 1988; King, 1987; Kogure
& Akao, 1983; McElroy, 1987; Sullivan, 1986 1987
Dodgson, Gann & Salter, 2005

53
The Dominant Stage-Gate Theory
The stage-gate innovation process, introduced by Cooper (1990b), appears to be the main
NPD idea-to-launch model. The model is often used as the foundation of a multistage,
multi-disciplinary new product process and has been modified by firms in order to
overcome the deficiencies that plague their NPD projects and programs (Cooper, 1993,
2001). A survey of 60 automotive firms including Ford, GM and Toyota, approved by the
Product Development and Management Association (PDMA), found that 48.6% of firms
utilised the traditional stage-gate process and 30% utilised a modified stage-gate process,
while the rest did not have any formal process (Ettlie & Elsenbach, 2007). These figures
suggest that approximately 80% of well-managed firms have some form of stage-gate
process in place. The American Productivity & Quality Center (2003) benchmarking
supported the finding that it is mostly the top-performing companies that have implemented
a stage-gate process.
The dominant stage-gate innovation process is “a conceptual and operational map for
moving new product projects from idea to launch and beyond – a blueprint for managing the
new product development (NPD) process to improve effectiveness and efficiency” (Cooper,
2008, p.214). The process goes through different stages of known deliverables and gates as
checkpoints or go/kill decision points before passing through the next stage (Cooper &
Kleinschmidt, 2010). The entire innovation process can be separated into three general
areas: the front end (the fuzzy front end), new product development and commercialisation
(Koen, 2005; Koen et al., 2002).
The entire innovation process is shown in Figure 2.4.

54
Figure 2.4: The Entire Innovation Process
Source: adapted from Cooper (2008); Khurana and Rosenthal (1998); Koen et al. (2002)
55
The dominant stage-gate theory of innovation with its highly structured gating, evaluation,
monitoring and control processes may be incomplete and inappropriate for breakthrough
innovation (O'Connor, 1998; Seidel, 2007; Wind & Mahajan, 1997). The gates that act as
quality control or go/kill decision checkpoints may inhibit learning and the generation of
novel ideas, reduce flexibility and delay the development and commercialisation of
breakthrough innovation (Kelley, 2009; Sethi & Iqbal, 2008). The development of
breakthrough innovation can be very fuzzy, risky and uncertain. According to the traditional
stage-gate process, the first order of market assessment is to determine the potential of the
market, its size and the likelihood of market acceptance (O'Connor, 1998). However,
O'Connor (1998, p.153) stated that:
It is not clear, however, that this series of questions is appropriate for a market
that requires “creation” or may not have emerged, whose applications are
unknown, and for which issues of technical feasibility come into question
every time a new application is considered.
The traditional stage-gate process is deemed to support exploitative/incremental innovation
rather than exploratory/breakthrough innovation (Benner & Tushman, 2003; Brown &
Eisenhardt, 1997; Jaworski et al., 2000; Sethi & Iqbal, 2008; Veryzer, 1998a; Wind &
Mahajan, 1997). This is because incremental innovations are “sustaining innovations” or
product improvements that provide additional benefits to existing products (Christensen,
1997). The market environment, operational strategies and circumstances for the
development of incremental innovations are steady and can be clearly defined, allowing the
assessments of market size and market potential (McCarthy, Tsinopoulos, Allen & Rose-
Anderssen, 2006; Phillips, Noke, Bessant & Lamming, 2006). The traditional approach to
NPD can stabilise routines and increase efficiency in the short term because it may help
firms to develop incremental innovation quickly (Benner & Tushman, 2003). This type of
incremental product, nevertheless, does not offer a long-term competitive advantage (Brown
& Eisenhardt, 1997). To mitigate this problem, the addition of a discovery stage to the
stage-gate process was an attempt to optimise the traditional stage-gate process for the
generation of breakthrough ideas. All proposed development projects needed to enter the
discovery stage at the front end of the process prior to entering the initial screening or Gate
1 of the stage-gate process. While the discovery stage allowed new product ideas and new
opportunities to be uncovered and captured, the initial screening stage acted as a
clearinghouse for decisions about bringing new product ideas through development and into
market (Cooper, Edgett & Kleinschmidt, 2002b).
56
The next generation version of the stage-gate process, “NexGen systems”, was introduced to
handle different types of new product ideas and associated risk levels. Once a new product
idea passes through the idea-screening stage, three versions of the stage-gate process are
available: “stage-gate full”, “stage-gate xpress” and “stage-gate lite” (Cooper, 2008, p.223).
The decision to elect one version over another depends on the level of risk associated with
the new product idea (project). The stage-gate full has a five-stage, five-gate process for
projects involving a high level of risk and complex platform developments. The stage-gate
xpress is suitable for projects involving moderate risk such as extensions and modifications.
The stage-gate lite is a streamlined approach, efficient and lean, which is often used for very
small projects or for bringing innovative products to market rapidly. The stage-gate lite
approach reflects the three competencies of a radical product development innovation
capability identified by O'Connor and Ayers (2005) and O'Connor and DeMartino (2006).
These competencies are: (1) the discovery stage of developing novel ideas and recognising
breakthrough possibilities, (2) the incubation stage of exploring potential market/partnership
opportunities and complementary technologies and turning opportunity into a business
proposition and (3) the acceleration stage of refining a breakthrough innovation project with
commercial potential for it be self-sustaining (Cooper, 2008).
Cooper (2008) argued that the NexGen systems are scalable, flexible and adaptable versions
of stage-gate with a spiral development process and simultaneous execution. Loops or
spirals are built in from the front end stages through to development and into the testing
stage. These spirals allow the back-and-forth play of activities and overlapping of stages for
product iterations and improvements (Cooper, Edgett & Kleinschmidt, 2002a; Kotler &
Keller, 2009). The aim of the process is to facilitate an open innovation model that
incorporates the pooling of knowledge assets, complementary capabilities and risk sharing
for innovative purposes (Chesbrough & Appleyard, 2007). This may allow a firm to develop
an evolving but distinct development process for breakthrough innovation (Kelley, 2009).
The different versions of the stage-process are utilised and often modified by well-managed
firms practising and optimising design-process management. However, it must be noted that
“there was no direct evidence that firms historically more likely to report new product
launches that were new to the world or industry were also more likely to use a modified
Stage-Gate NPD process” (Ettlie & Elsenbach, 2007, p.32). Although highly innovative
firms are likely to be more creative with the stage-gate process, the process is not viewed as
57
way to further introduce radically new or really new products per se. NPD strategy is a key
element of this pattern (Ettlie & Elsenbach, 2007) and is discussed in the next section.
4) Strategic focus (NPD strategy)
“Strategic focus” (NPD strategy) is a key NPD success factor, which refers to the vision and
focus that define the direction for research and development (R&D), and the management of
technology and product development efforts at all organisational levels including a strategic
business unit (SBU) and a product line and/or individual projects (Barczak & Kahn, 2012).
At the front end of the development process, the organisation should clearly define NPD as
a long-term strategy, and have visible goals that align with the organisational mission and
strategic plan (Kahn et al., 2012). Having a new product strategy is strongly related to
positive business performance (American Productivity & Quality Center, 2003).
The approaches underlying market-driven and market-driving orientation can be employed
to formulate NPD strategies (Beverland et al., 2006). As previously noted, research on NPD
management has extensively captured market-driven activities, particularly market-sensing
stance (Kumar et al., 2000; Mishra, Kim & Lee, 1996; Parry & Song, 1994). Accordingly,
being market driven involves a market-sensing, reactive NPD strategy and a focus on
existing consumer needs to address existing demand (Christensen, 1997; Narver, Slater &
MacLachlan, 2004). A market-driven reactive strategy reflects “adaptive organisational
learning capabilities in terms of market intelligence generation” (Tuominen, Rajala &
Moller, 2004, p.214). Firms adopting a reactive strategy often have strong operational ties
with their dependent suppliers and key customers. They are, however, known to achieve
only evolutionary, incremental innovation and short-term business success (Carrillat et al.,
2004; Hills & Sarin, 2003; Schindehutte et al., 2008). Carrillat et al. (2004, p.2) asserted that
“if every actor in the market follows a market-driven strategy and every firm adapts to
competitors’ strategic moves and stays aligned with consumers requirements, then no actor
will be able to offer a value proposition superior to the competition”.
To counter the criticism of market-driven orientation and its conceptualisation as being too
reactive to the market, research on NPD has identified market-driving orientation that
involves a forward-sensing, proactive strategy as the key to success (Jaworski et al., 2000;
58
Kumar et al., 2000). A market-driving proactive strategy is a future-looking frame of
reference and a long-term perspective that guides a firm’s innovation efforts (Kelley, 2009).
The strategic focus is on unarticulated or latent consumer needs in the untapped market
space to create demand for a new level of functionality (Baker & Sinkula, 2002; Carrillat et
al., 2004). Latent needs are real needs that customers do not recognise or were not
previously aware of. This strategic focus requires generative organisational learning
capabilities involving collaborative learning with lead users in term of anticipatory market
intelligence.
Firms adopting proactive NPD strategy leverage to compete innovatively outside their
comfort zone (Hamel & Prahalad, 2005; Tuominen et al., 2004). They engage in
entrepreneurial behaviour such as risk management, proactiveness, innovativeness and
opportunity focus (Jaworski et al., 2000; Kumar et al., 2000; Narver et al., 2004). The
entrepreneurial behaviour can redirect the strategic plan involving market forces and new
ideas/technologies that are not evident to competitors (Tellis, Prabhu & Chandy, 2009). In
so doing, an emphasis is placed on a firm’s capability to develop radical or really new
innovations that are able to influence or even pioneer new markets (Andriopoulos & Lewis,
2009; Atuahene-Gima, Slater & Olson, 2005). This also induces other industry members to
introduce new products with improved standard features (Mohr, 2001; Moriarty & Kosnik,
1989; Narver et al., 2000). Baker and Sinkula (1999) stated that “such breakthroughs, or
radical innovations, require the ability to suspend restrictive marketplace beliefs and to
explore openly the potential of new technologies to satisfy existing needs in unique ways”
(p.297).
5) Research
While strategic focus (NPD strategy) provides a general framework to direct a firm’s
innovation efforts, “research” refers to methods and techniques that can be used to sense,
study and understand customers’ needs and problems, competitors, technologies and other
macro-environmental forces in the market. The research, particularly at the front end of the
development process, portrays the use of the knowledge and information that underlie a
firm’s innovative capacity (absorptive capacity) (Barczak & Kahn, 2012; Kahn et al., 2012).
59
Predominantly, the scope of NPD strategy involves two research perspectives of “customer
insight” (market pull) and “executive foresight” (technology push) (Wind & Mahajan, 1997,
p.6). The perspective of customer insight is shaped by the traditional market research tools,
primarily customer feedback. This implies that customers are pulled into the NPD process
as the key source of knowledge and ideas/concepts for new products. The perspective of
customers, however, is often shaped by short term and current experience, which only result
in incremental innovations. In contrast, executive foresight is important for the development
of breakthrough innovation. The perspective of executive foresight means that the NPD
team and individuals involved in research and development (R&D), particularly for new
technologies, can develop highly innovative products based on their foresight (often without
direct customer input) and push them out to the market (Kumar et al., 2000; Wind &
Mahajan, 1997).
6) Commercialisation (launch tactics)
Having a proficient launch strategy is cited in product development and marketing literature,
both theoretically and empirically, as one of the important factors for new product
development. “Commercialisation” (“launch tactics”) refers to new product launch and
post-launch activities including tactical launch decisions involving marketing mix
adjustments (that is, how to launch) to stimulate adoption and diffusion of the new product
into the consumer market (Barczak & Kahn, 2012; Hultink, Griffin, Hart & Robben, 1997).
Tactical launch decisions involving marketing mix (product and branding, pricing,
distribution, promotion) are made during product launch and are influenced by strategic
launch decisions made regarding product innovativeness and market targeting early in the
NPD process (Hultink et al., 1997).
Accordingly, launch tactics should reflect the degree of product innovativeness, whether the
product is market-driven or market-driving. For market-driven innovation, firms are
essentially driven by the market in their overall approach to new product development and
thus often use mass market focus and intensive distribution due to numerous competitive
offerings in the market but with low overall distribution expenses. It must, however, be
noted that the launch tactics are different and more difficult when customers have limited
experience and familiarity with a new product concept that is highly innovative or market
60
driving, as opposed to an incremental extension of an existing product (Hultink et al., 1997;
Olson, Walker & Ruekert, 1995).
More innovative firms that launch market-driving innovations using an exclusive
distribution strategy are the most successful. Firms making tactical launch decisions
associated with this strategy focus on niche market and combine technological possibilities
with a market need to produce more innovative products in a market where there are few
incumbent competitors (Hultink et al., 1997). Market acceptance and the diffusion rates of
market-driving innovations are, in fact, hard to predict (McDermott & O'Connor, 2002).
Thus, the more innovative, market-driving innovations are launched exclusively with high
distribution expenditure through the firm’s new channels to ensure appropriate customer
education about the product attributes and service (di Benedetto, DeSarbo & Song, 2008;
Slater & Olson, 2001).
7) Metrics and performance-based measurement
The last dimension of new product success factor is the metrics and performance
measurement, which is the measures, tracking of progress and reporting of product
development performance at both project and program levels (Kahn et al., 2012).
Different NPD processes, operating systems and expectations are needed for incremental
innovation and breakthrough innovation. Having clear milestones, review mechanisms and
traditional financial measures may be sufficient to track the progress and success of the
development of incremental innovation (Hamel & Prahalad, 2005). However, different
performance metrics must be established for breakthrough innovation (Rice, O'Connor,
Leifer, McDermott & Standish-Kuon, 2000; Stringer, 2000). Measuring the commercial
success of a breakthrough innovation may require both activity-based and performance-
based measures. An example of the appropriate metrics for breakthrough innovation might
include the evaluation of the program activities in terms of how effectively the market is
informed of the initiative through direct linkages with external constituents such as potential
customers and partners. For performance indicators, strategic measures are more likely to be
used than financial measures to assess whether the breakthrough innovation moves the firm
into a new strategic domain or creates new market connections, technological advantage and
capabilities or new partnerships (Manion & Cherion, 2009; Olson & Slater, 2002).
61
2.4.2.1 Section Conclusion
This section has reviewed the characteristics associated with the success of both market-
driven innovation and market-driving innovation and classified seven critical success factors
based on the multidimensional nature of NPD best practice. These factors/dimensions are:
(1) organisational structure, (2) organisational culture/behaviour (market orientation), (3)
NPD process, (4) strategic focus (NPD strategy), (5) research, (6) commercialisation
(launch tactics) and (7) metrics and performance measurement (Barczak & Kahn, 2012;
O'Connor, 2008). In fact, the innovation practices and capabilities for market-driven
innovation often do not work well for market-driving innovation (Leifer et al., 2000; Rice et
al., 2002). The section has also highlighted the different structure, process, skills/mindsets
and capabilities entailed in the development of market-driven innovation and market-driving
innovation within the seven multidimensional success factors.
Notwithstanding the multidimensional success factors, recent research has identified
“strategy” as the most important dimension related to NPD best practice, followed by
research (Barczak & Kahn, 2012; Kahn et al., 2012). Strategy (a strategic focus, in this
study) and research are related to the front end of innovation in terms of identifying and
planning (vision) for new product strategies to guide the firm’s innovation efforts and the
research perspective of using the traditional market research tools (customer insight) or
research and development (executive foresight) (Kahn et al., 2012; Wind & Mahajan, 1997).
With respect to the front end of market-driving innovation, the strategic focus and research
reflect a firm’s continuing endeavours of engaging in market-driving behaviour and a
forward-sensing, proactive strategy to discover latent consumer needs and/or new
technologies and to link them to future market opportunities. Market-driving firms develop
highly innovative products based on their foresight by acquiring new technical/market
knowledge and information that underlie their innovative capacity (absorptive capacity).
This clearly highlights the importance of NPD efforts at the front end of the innovation
process, particularly for market-driving innovation.
62
2.5 The Nature of the Front End of Market-Driving Innovation
2.5.1 Defining the Front End of Innovation
In the innovation management literature, several terms have been used to describe the front
end or the early stages of the innovation process (early development phase). “Front end of
innovation” (FEI) (Koen et al., 2001), “fuzzy front end” (FFE) (Smith & Reinertsen, 1991),
“pre-phase 0” (Khurana & Rosenthal, 1997, 1998), “pre-development” (Cooper &
Kleinschmidt, 1994a), “up-front homework” (Cooper, 1994), “pre-project activities”
(Verganti, 1997) and “up-front activities” (Crawford, 1980) also denote the same concept.
This study uses the term “front end of innovation” (FEI) to describe the front end or the
early stages of the innovation process instead of using what is commonly referred to as the
“fuzzy front end” (FFE), which, from the perspective of Koen et al. (2001), implies that the
front end is a mysterious, unknowable and uncontrollable part of the innovation process that
is impossible to manage. FEI involving early activities and decisions can in fact be managed
and defined by “those activities that come before the formal and well-structured New
Product and Process Development (NPPD) or Stage Gate™ process” (Koen et al., 2001,
p.49). The front end activities commonly involve opportunity identification and exploration,
information collection and concept development (Crawford & di Benedetto, 2000; Koen et
al., 2001). According to Khurana and Rosenthal (1998), FEI includes “product strategy
formulation and communication, opportunity identification and assessment, idea generation,
product definition, project planning, and executive reviews”, which occur through pre-phase
zero/product and portfolio strategy and into phase zero and phase one (p.59). FEI primarily
involves a two-step decision-making process as the evaluation (go/no-go) points: “(1) the
awareness step and resulting information collection for idea generation and (2) the
information evaluation step regarding the opportunity, resulting in a decision about the
selection or rejection [of that idea]” (Broring et al., 2006, p.490).
A number of studies have highlighted the importance of managing the front end of the
innovation process as a key to new product success and a firm’s competitive advantage (e.g.
Backman et al., 2007; Bertels et al., 2011; Cooper, 1988, 1997, 1998; Khurana & Rosenthal,
1998; Kim & Wilemon, 2002b; Verworn et al., 2008). The front end activities and decisions
have the strategic importance of influencing the business unit’s options and costs for
designing, developing and ultimately commercialising a product at the later phases of the

63
innovation process (Bertels et al., 2011). Thus, the greatest opportunities for time saving (at
the least expense) and for improving the overall innovation process are at the front end of
innovation (Backman et al., 2007). The efforts and time spent at FEI have been found to
result in a reduction of development time and a sharper and more stable early product
definition, thereby reducing uncertainty and ambiguity in the NPD project (Cooper, 2001;
Cooper & Kleinschmidt, 1995b; Urban & Hauser, 1993). The cost of generating several
potential ideas is also relatively lower than the cost of actual development for any one idea
(Smith & Reinertsen, 1991; Urban & Hauser, 1993). “Managers and researchers claim the
benefits resulting from improvements in the front [end] are likely to far exceed those that
result from improvements aimed directly at the design engineering process” (Koen et al.,
2001, p.2).
Recent research has found that successful businesses spend twice as much time and money
as unsuccessful ones on the front end or pre-development activities prior to moving to the
development stage (Cooper & Kleinschmidt, 2010). Cooper and Kleinschmidt (1994b, p.26)
stated that “the greatest differences between winners and losers were found in the quality of
execution of pre-development activities”. A high quality of execution of predevelopment
activities results in a success rate of 75% and a high rate of profitability (7.2 out of 10). In
contrast, when predevelopment activities are lacking or poorly undertaken, the success rate
is only 31.3% and profitability is only 3.7 out of 10 (Cooper, 2001).
Despite the importance of the predevelopment activities to business success, FEI continues
to be “one of the weakest areas of the innovation process” (Koen et al., 2002, p.29). There is
only limited research on how best to manage the idea generation and evaluation phases of
NPD (Koen et al., 2001; Martinsuo & Poskela, 2011). The later phases of NPD activities
are, however, relatively well researched as evident by the dominant stage-gate process
(Brown & Eisenhardt, 1995; Cooper, 2001; March, 1991). This leaves FEI as the least well-
structured part of the NPD both theoretically and practically, especially in the case of
market-driving innovation (de Brentani & Reid, 2012).

64
2.5.2 The Front End Challenges of Market-Driving Innovation
Drawing upon a review of the literature on the FEI, “the front end” of market-driving
innovation in this study refers to the following sequence of activities: the recognition of a
breakthrough possibility (new idea or advanced technology), information collection, an
assessment of future market opportunity, the translation of the breakthrough possibility into
a clear and specific early-stage concept, and finally either its approval for formal, structured
new product development or its termination (Kim & Wilemon, 2002a; Koen et al., 2002;
Koen et al., 2001; Murphy & Kumar, 1997).
The greatest weakness and uncertainty is found at the front end of the development process,
especially for market-driving innovations (Reid & de Brentani, 2004). The high level of
uncertainty associated with highly innovative ideas and visioning for future market
application creates the “upstream creative challenge” for developing market-driving
innovations (Koen et al., 2002; Kumar et al., 2000; Reid & de Brentani, 2010). In the early
stages of developing market-driving innovation, it is difficult to assess customers’ future
needs with no obvious market sight (Thomke & von Hippel, 2002). Nevertheless, firms
would still like to find out who their target customers are, what exactly customers need,
which new technology will succeed, and what skills and capabilities are required for the
new product being developed (Khurana & Rosenthal, 1998). With a lack of clear market
vision, firms can spend a lot of time and activities trying to generate market-driving
ideas/concepts and anchor product development (Phillips et al., 2006).
Difficulties in maintaining breakthrough integrity
The real challenge for firms is the ability to move market-driving innovations through the
NPD process, especially through the stages between opportunity discovery and product
development, or the “Valley of Death” , whilst retaining their breakthrough integrity
(Cooper, 2011; Markham et al., 2010). Market-driving innovations are revolutionary, risky
and disruptive (O'Connor & Veryzer, 2001). Christensen and Overdorf (2000, p.73)
described the disruptive nature of market-driving innovations as that they “promise lower
profit margins per unit sold, are not attractive to the company’s best customers, and
inconsistent with the established company’s values”. A market-driving idea/concept is
inherently outside the existing strategic domain and may even damage the current “cash
cow” mainstream business and target market. Further, turning a market-driving idea into an
65
innovation can take up to ten years or more to develop and cost millions of investment
dollars. The longevity of projects also implies a turnover of NPD team members and a
senior management that may put pressure to modify the market-driving idea and dumb
down its innovativeness given the risk of the project. These factors, coupled with other
exogenous events, mean that market-driving ideas are often regarded as too difficult and too
costly because of the need to stretch into unfamiliar business processes, new areas of
organisational and technical competency, and unpredictable markets (McDermott &
O'Connor, 2002; O'Connor & Veryzer, 2001).
Established firms and their accumulated decision-making experiences usually favour
investment in new product development projects that align with the organisational direction,
technology, resources and sunk costs invested in R&D, particularly those projects with a
certainty of payoff (Levinthal & March, 1993; March, 1991; Teece et al., 1997). Business
investments are prioritised aggressively in high-margin products that potentially have a
market size large enough to attract them (Christensen, 1997). Hence, there is a tendency for
firms to channel funds repeatedly into the status quo that supports incremental innovations
over market-driving innovations to avoid the risk of damaging the existing industry and
market. Kumar et al. (2000, p.136) asserted that “the greater the threat of cannibalization,
the more intense is the resistance to market driving ideas”.
As a consequence, the more innovative market-driving ideas that might create new markets
are often squelched and soundly rejected at the outset, or otherwise face a number of stops
and starts, deaths and revivals before moving through to launch (Hill & Rothaermel, 2003;
McDermott & O'Connor, 2002). On average, the success of market-driving innovation is
estimated as one in 300 at the idea submission stage (or the patent disclosure stage) and one
in 125 at the small project stage (or after a patent is granted); and only one in nine projects
(11%) is commercially successful (Stevens & Burley, 2003). For every successful market-
driving innovation, there are thus possibly hundreds of highly innovative, breakthrough
ideas that fail to emerge into the development process and through to commercialisation.
66
2.5.3 Measuring the Front End Outcomes of Market-Driving Innovation
Although the importance of the front end of innovation has been recognised, the relationship
between the front end activities and the front end performance has attracted little empirical
investigation. The front end or early performance, as a measure, captures the front end
outcome of new product success (that is, at the before-launch stage). The front end
performance is predicted by a set of front end activities – R&D and concept development;
the existence of a front end process and relevant NPD team members; and the development
plan (time, costs, and resources, including technologies and regulatory requirements) – for
bringing a new product to market (Kim & Wilemon, 2002b; Koen et al., 2001). The
PDMA’s comparative practice surveys have shown that a substantial number of front end
activities has taken place in NPD practices but are not assessed in relation to new product
performance (Barczak et al., 2009). Most NPD success measures use standard financial-
based measures such as ROI, profitability, revenue and the break-even time (Griffin & Page,
1993, 1996). These traditional financial measures have a high time-lag in regard to front end
activities. Any positive effect on financial performance may appear only after several years
of a new product concept being launched, particularly for market-driving innovation
(O'Connor et al., 2008). Measuring financial results at the front end stage thus appears to be
irrelevant or less important in the short term (O'Connor, 1998; Reid & de Brentani, 2010).
The primary determinants of the front end outcome (deliverables) include “a well-defined
product concept” developed from a new product idea that can be validated and evolved into
a commercial product (Cooper & Kleinschmidt, 2010; Kim & Wilemon, 2010). According
to Seidel (2007, p.524), a “product concept” refers to “the desired outcome of the
development process, the form, need and technology for the new product”. A well-defined
product concept provides a preliminary identification of the needs of customers, potential
market opportunities and associated risk, and a management vision for the product,
including its quality, performance and features (Khurana & Rosenthal, 1997). Research on
the execution of the front end suggests that new products which have an explicit, sharp,
stable and early defined product concept are three times more successful and profitable than
poorly defined products (Cooper, 1999; Cooper & Kleinschmidt, 2010).
Noting the importance of having an early, well-defined product concept, an extensive
literature review has indicated that none of the existing measures captures how successful
the front end is in delivering highly innovative concepts into development and
67
commercialisation phases. The first half of the front end battle is about generating great
product ideas. Most studies on market-driving innovation typically capture the number of
product ideas or concepts in the pipeline as the outcome measure of this front end activity
(Chan et al., 2008). Product innovativeness or the level of innovativeness can be an
important measure for capturing the scope of market-driving ideas but this measure is most
frequently used to capture the degree of newness of an innovation (the final outcome in both
market and technological aspects) (Danneels & Kleinschmidt, 2001; Garcia & Calantone,
2002; Griffin, 1997b; Prajogo & Sohal, 2003). The study by Verworn (2009) captured the
degree of newness of an initial product concept by focusing on the resource aspect. While
the study identified two items of the degree of newness factor, it measured resources only in
terms of unusually high capital needs and the new skills required to execute the project.
In addition, the other half of the front end battle, previously described as the Valley of
Death, is “the gap between conception or invention versus moving that concept or invention
through to a commercialized product – the gap where so many projects die” (Cooper, 2011,
p.6). Having many great product ideas does not mean that these ideas are able to emerge
into the formal development process. Rather, the ideas are further evaluated, defined,
refined and developed before ultimately being commercialised. The impact of highly
innovative ideas will not be evident either in front end performance or financial
performance. In addition to financial objectives being inappropriate measurements at the
front end stage, the number of product introductions can only be used to generally indicate
more ideas moving from the front end into the formal NPD. Similarly, evaluating new
product successes as they are introduced into the market can be used as a general indicator
to seeing the front end as successes when the product ideas move through development into
commercialisation (Barczak et al., 2009; Griffin, 1997a; Markham & Griffin, 1998; Page,
1993). It appears that the existing measures do not adequately capture evidence of highly
innovative ideas flowing from the front end into the more formal development and through
to launch.
Although an idea’s entry or acceptance of breakthrough innovation into the formal NPD
process is an important element for measuring the front end performance (before-launch
stage performance), this element seems to have gained little, if any, consideration in the
literature. This type of measurement requires a delicate balance for breakthrough innovation
in terms of trying to validate a concept for a market that has had no previous experience
68
with such a product, as well as obtaining internal support for turning it into a NPD project
(O'Connor & Veryzer, 2001). The before-launch stage performance of a breakthrough
innovation is highly dependent on a firm’s ability to maintain the high level of
innovativeness of the original product concept from the initial idea through to final product
launch. This ability is related to what is called “product integrity”, which is “a clear vision
of the product’s intended image, performance” (Brown & Eisenhardt, 1995, p.363). The
Concise Oxford English Dictionary describes the term “integrity” as “the condition of
having no part of element taken away or wanting” or “the condition of not being marred or
violated”. Churchman’s theory refers to the notion of “integrity” in product design as “the
conditions of its wholeness, soundness and virtue” (Swanson, 1994, p.55). To adequately
capture the concept of integrity in the context of breakthrough innovation, this study
therefore proposes “breakthrough integrity” (BI) as a front end outcome measure. It refers
to the extent to which a clear and highly innovative concept of a potential new product is
maintained after it enters the development and commercialisation phases (Clark &
Fujimoto, 1990, 1991; Reid & de Brentani, 2010; Seidel, 2007).
Furthermore, customer-related measure is an important measure for capturing the front end
outcome of market-driving innovation. Typically, the success of a market-driving
innovation in the marketplace is assessed in terms of customer acceptance and satisfaction
with the new product (Chan et al., 2008). According to Griffin and Page (1996), the
customer-related measure is regarded as the most appropriate for new-to-the-world
products. This is because when a firm commercialises something radically new or really
new (never before available), customer acceptance and satisfaction can influence sales and
product adoption by others. In the same vein, recent research by Reid and de Brentani
(2010) captured a customer-based measure to deal with the front end or “early performance”
of a radical innovation. The study referred to the measure as “early success with the
customers” (ESC), that is, satisfaction with and acceptance of a new product concept by
early customers (Reid & de Brentani, 2010, p.507). This ESC measure was adopted based
on the concept of “lead user” (von Hippel, 1978) and the findings by Griffin and Page
(1996) in a project level success measurement study.

69
2.5.4 The Front End Success Factors of Market-Driving Innovation
In recognising the importance of managing the front end of innovation (FEI), this section
reviews the common success factors which have been found to significantly affect the front
end of the development process. Past research on the FEI has focused primarily on the
success factors of market-driven innovations, as opposed to market-driving innovations. In
fact, a focus on the front end of market-driving innovation is the critical root of success for
innovative firms and yet fewest strategies are available for its effective management (de
Brentani & Reid, 2012; Reid & de Brentani, 2004). The main focus of this study is therefore
to understand the critical success factors at the front end of market-driving innovation.
Based on the seven multidimensional NPD success factors previously identified in Table
2.2, Table 2.4 then identifies the five NPD success factors/dimensions and associated
characteristics that are relevant to the front end of innovation of both market-driven
innovation and market-driving innovation.
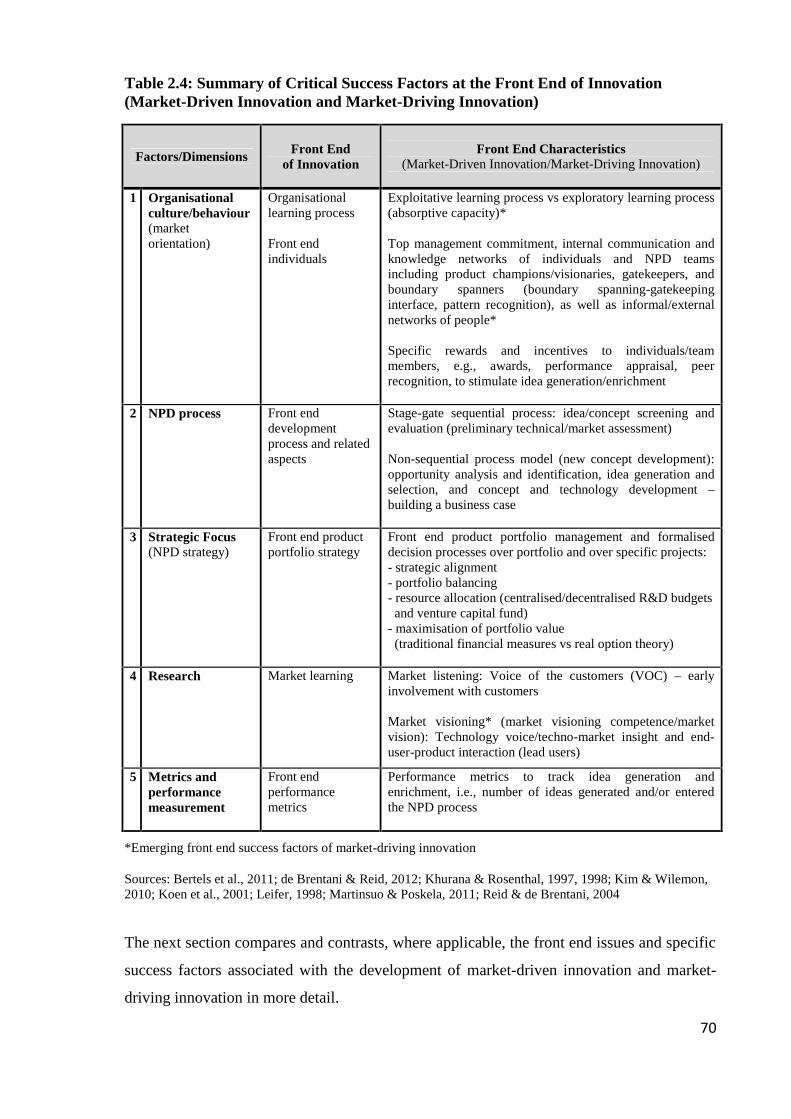
70
Table 2.4: Summary of Critical Success Factors at the Front End of Innovation(Market-Driven Innovation and Market-Driving Innovation)
Factors/DimensionsFront End
of InnovationFront End Characteristics
(Market-Driven Innovation/Market-Driving Innovation)
1 Organisationalculture/behaviour(marketorientation)
Organisationallearning process
Front endindividuals
Exploitative learning process vs exploratory learning process(absorptive capacity)*
Top management commitment, internal communication andknowledge networks of individuals and NPD teamsincluding product champions/visionaries, gatekeepers, andboundary spanners (boundary spanning-gatekeepinginterface, pattern recognition), as well as informal/externalnetworks of people*
Specific rewards and incentives to individuals/teammembers, e.g., awards, performance appraisal, peerrecognition, to stimulate idea generation/enrichment
2 NPD process Front enddevelopmentprocess and relatedaspects
Stage-gate sequential process: idea/concept screening andevaluation (preliminary technical/market assessment)
Non-sequential process model (new concept development):opportunity analysis and identification, idea generation andselection, and concept and technology development –building a business case
3 Strategic Focus(NPD strategy)
Front end productportfolio strategy
Front end product portfolio management and formaliseddecision processes over portfolio and over specific projects:- strategic alignment- portfolio balancing- resource allocation (centralised/decentralised R&D budgets
and venture capital fund)- maximisation of portfolio value
(traditional financial measures vs real option theory)
4 Research Market learning Market listening: Voice of the customers (VOC) – earlyinvolvement with customers
Market visioning* (market visioning competence/marketvision): Technology voice/techno-market insight and end-user-product interaction (lead users)
5 Metrics andperformancemeasurement
Front endperformancemetrics
Performance metrics to track idea generation andenrichment, i.e., number of ideas generated and/or enteredthe NPD process
*Emerging front end success factors of market-driving innovation
Sources: Bertels et al., 2011; de Brentani & Reid, 2012; Khurana & Rosenthal, 1997, 1998; Kim & Wilemon,2010; Koen et al., 2001; Leifer, 1998; Martinsuo & Poskela, 2011; Reid & de Brentani, 2004
The next section compares and contrasts, where applicable, the front end issues and specific
success factors associated with the development of market-driven innovation and market-
driving innovation in more detail.
71
(1) Organisational culture/behaviour
The first front end success factor is related to the organisational culture/behaviour,
specifically, the organisational learning process and the roles of key individuals at the front
end of innovation.
Organisational learning process
An important aspect of an innovative firm’s organisational culture/behaviour is the strength
and style of its learning orientation. A learning orientation influences “the propensity of the
firm to create and use knowledge” (Sinkula, Baker & Noordewier, 1997, p.309). Two
critical learning styles that influence the front end development of innovations are
exploitative market learning and exploratory market learning (Kim & Atuahene-Gima,
2010; March, 1991). On one hand, exploitative market learning focuses on refining and
extending information already acquired and it is more likely to be associated with
incremental innovation (Atuahene-Gima, 2005; Danneels, 2002). On the other hand,
exploratory market learning requires “a firm to engage in the pursuit of very new and radical
market information, going beyond the current product market knowledge domain” (Kim &
Atuahene-Gima, 2010, p.522). This type of market learning is more likely to be associated
with breakthrough innovation (Atuahene-Gima, 2005; Danneels, 2002).
Exploratory market learning is related to the concept of “absorptive capacity” (Cohen &
Levinthal, 1990) in that “outside sources of knowledge are often critical to the innovation
process, whatever the organization level at which the innovating unit is defined” (p.128).
According to Zahra and George (2002), absorptive capacity is “a set of organizational
routines and process by which firms acquire, assimilate, transform and exploit knowledge to
produce a dynamic organizational capability” (p.186). Researchers have acknowledged the
importance of instituting organisational processes as drivers to initiate and enhance vision
creation and market intelligence at the front end of breakthrough innovation (Deszca et al.,
1999; O'Connor & Veryzer, 2001; Reid & de Brentani, 2004). Accordingly, information
processing is at the core of the organisational process of innovation. A firm’s capability to
process and manage the information flow by acquiring and assimilating external information
and combining it with existing, in-house knowledge as well as sharing the information at the
organisational level (that is, absorptive capacity) creates a high chance of leading to new
72
product ideas and their transformation into new products, particularly for breakthrough
innovations (de Brentani & Reid, 2012; O'Connor & Rice, 2001).
The external environment is the main source of new ideas for breakthrough innovations
(Cousins et al., 2011). Wind and Mahajan (1997, p.7) described external linkages as the
“forefront of the changing dynamics of competition and cooperation, especially in the R&D
arena”. New information acquired from the external environment regarding markets, and
competitors, thus, has an impact on the very early decisions made by individuals in the firm
in visioning the general adoption pattern and how a new idea could be adopted or used by
their firm. Despite great ideas that may come from in-house, there is still likely to be some
degree of input from external sources (Reid & de Brentani, 2004). This is especially true
when breakthrough innovations (that open up a new market) tend to be initiated from
outside the current industry (Utterback, 1994).
In addition, the process of sharing the newly acquired and assimilated information at the
organisational level (product, program and firm) may enable individuals and NPD teams to
build collective intuition as well as formulating and sustaining the vision for the
development of market-driving innovation (Eisenhardt, 1999; O'Connor & Veryzer, 2001).
The sharing of information also kick-starts organisational level awareness of market-driving
innovations (de Brentani & Reid, 2012). The establishment of “knowledge networks” is
imperative to support information sharing and the visioning process to avoid missing
potentially great product ideas and opportunities. A knowledge network may consist of
multifunctional-skilled employees and cross-functional teams particularly between R&D
and marketing, including other informal/external networks of people who exchange ideas,
information and other resources at the front end of market-driving innovation (Brem &
Voigt, 2009; Kim & Wilemon, 2002b; O'Connor, 2008). An empirical study by Olson et al.
(2001) supported that high levels of cooperation between marketing and R&D functions
during the early stages of the development process of highly innovative projects can lead to
positive project performance. Further, a firm’s capability to connect to informal networks
may stimulate recognition of the value of a new product and exploit it to commercial ends
(Cohen & Levinthal, 1990). de Brentani and Reid (2012, p.73) stated that “it is the informal
processes of networking and information sharing that have been shown to be of particular
importance during the FFE of the NPD process for discontinuous innovations”.
73
Front end individuals
In the product innovation management literature, particular individuals have roles in
supporting and forwarding innovations within networks and firms, especially at the front
end of market-driving innovation. These front end individuals are people such as senior
management (visionary leaders), boundary spanners, product champions and gatekeepers.
At the management level, senior management has an essential role in setting up the
organisational culture and instituting the required routines and processes that foster the
exploration of entirely new product ideas and/or technologies (O'Connor & Veryzer, 2001).
Although the experiments may lead to unexpected results or failures, individuals and NPD
teams are encouraged to “learn by doing” and to treat failures as valuable discoveries for
their future development in order to achieve bigger and better outcomes. A survey by
PricewaterhouseCoopers (2013) supported that an environment where failure and risk are
reasonably tolerated is very important for the development of breakthrough innovations
(71%) as well as having senior executives taking part in innovative projects (74%). In fact,
senior managers have the role of “visionary leaders” in terms of supporting radically new or
really new product ideas through to the development process and into a potential market
(Tellis, 2006). Without senior management support and commitment during strategic,
structural and resource planning at the front end of innovation, the process of developing
breakthrough innovations may come to a near standstill (Burgelman & Sayles, 1986;
Khurana & Rosenthal, 1997). The findings by the American Productivity & Quality Center
(2003) support this contention that senior management in the top-performing companies are
committed to necessary product development and resources.
In addition, senior management should offer rewards and recognitions to individuals and
NPD teams to stimulate idea generation at the front end of the development process.
According to the PricewaterhouseCoopers survey (2013), 73% of senior executives believe
that recognising and rewarding innovation initiatives is critical because “the best
breakthrough innovators want to be recognised as somebody who makes a difference – to
their profession, to the company, and sometimes to the world” (p.28). In the same vein,
Baer, Oldham, and Cummings (2003) found that a monetary reward or special bonus
(extrinsic motivation) does not have a significant influence on creativity, especially on those
highly innovative ideas that are compulsory for breakthrough innovation. The authors also
argued that intrinsic factors, such as personal recognition or an opportunity to lead in high-
74
profile innovation initiatives, can stimulate individuals to generate ideas for radical
innovation (Baer et al., 2003).
At the individual level, “boundary spanners” operate at the boundary interface of a
permeable organisation and perform organisationally relevant tasks by connecting the
organisation with information and elements outside it. The importance of acquiring external
information during the early stages of developing a market-driving innovation has already
been mentioned. Boundary spanners have strong external networks to facilitate the flow of
innovation-related information between the environment and the firm (de Brentani & Reid,
2012; Reid & de Brentani, 2004, 2010). “Gatekeepers” assess the value of the externally
acquired information and decide whether to share it with others in the organisation. They
perform at the gatekeeping interface by indirectly championing ideas at the front end of
innovation (de Brentani & Reid, 2012). Specifically, there are both technological and
marketing gatekeepers. Technological gatekeepers are highly important in connecting an
organisation with external sources of technology. Marketing gatekeepers have a similar role
in sensing, gathering and routing both market and technical information.
Moreover, NPD studies have drawn the concept of “champions” (“visionaries”) from
marketing and management sciences to study their roles in both incremental innovations
(Cooper & Kleinschmidt, 1986, 1987a; Gupta & Wilemon, 1990; Kim & Wilemon, 2002a;
Markham, 1998; Zirger & Maidique, 1990) and particularly market-driving innovations (de
Brentani, 2001; de Brentani & Reid, 2012; Leifer et al., 2000; O'Connor & Veryzer, 2001;
Veryzer, 1998a). The role of product champions is closely related to that of gatekeepers.
Product champions are individuals who informally emerge in an organisation to make
significant contributions to innovations. The key role of product champions is to actively
and enthusiastically promote the progress of a project through its critical stages, particularly
early in the development process, and sell or justify the “vision” internally to the point
where senior management and other critical members of the firm support the idea. They are
often entrepreneurs by nature and lead the charge of accessing resources and are willing to
do what it takes to make an innovation happen (de Brentani & Reid, 2012; Reid & de
Brentani, 2004; Veryzer, 1998a).
The importance of key individuals involved in the front end of innovation is related to the
concept of “pattern recognition” in the knowledge development and management literature
(Roos, 1996; Veryzer, 1998a). Pattern recognition (distinction tree) is an individual process
75
of thinking which involves two types of distinction making: “refinement” and “rethinking”
(Roos, 1996). First, refinement is an incremental process of knowledge development. It is a
thinking process of making finer distinctions in a branch of knowledge that already exists
(knowledge depth increase), and thus often results in incremental improvements. Second,
rethinking is a recursive process of gaining new insight into new tradition by breaking
traditional views and current practices. It is a thinking process of identifying and examining
previous assumptions made by oneself or others to seek out possible new branches of
knowledge (knowledge width increase), and thus often results in conceptual breakthroughs
or breakthrough advancement (Roos, 1996).
The main role of pattern recognition at the individual level is in directing an information
search during the idea generation stage of the development process. An information search
in the incremental scenario can be carried out through “refinement” (Roos, 1996), given the
existing market and technical information (Fisher, Maltz & Jaworski, 1997; Gatignon &
Xuereb, 1997). In contrast, “rethinking” for breakthrough innovation is more difficult, given
the unknown market and/or advance technical information (Roos, 1996). Individual
competence (knowledge, strength and know-how) are thus critical for successfully
performing and processing critical work functions in a breakthrough setting.
(2) NPD process
Front end development process and related aspects
The new product development process was identified as a critical success factor for both
market-driving and market-driven innovations. The development of the two types of
innovations requires different approaches to the NPD process. This means that specific front
end development processes and related aspects of market-driven and market-driving
innovations differ in terms of how new product ideas are generated and evaluated. The
traditional stage-gate, sequential process of idea generation/evaluation that might work well
for incremental innovation may not be suitable for breakthrough innovation, which requires
a more flexible process, especially during the early stages of innovation (O'Connor &
Veryzer, 2001). This leads to the second front end success factor, which focuses on the front
end development process.
76
Koen et al. (2002) highlighted the “New Concept Development” or “NCD” model as a non-
sequential process that comprises five elements: opportunity identification, opportunity
analysis, idea generation, idea selection, and concept and technology development. Their
study suggested that these five elements represent the flow, circulation and iteration of
ideas, as opposed to processes. The new concept development model allows back-and-forth
looping among all the five elements, which can be used in any order or combination and
more than once. This is quite different from “the sequential NPD or Stage-Gate process, in
which looping back and redirect or redo activities are associated with significant delays,
added costs, and poorly managed projects” (Koen et al., 2002, p.9). The loop-backs in the
new concept development model at the front end ensure that “redo” or “redirect” activities
often result in clearly defined market/technical requirements and a more effective new
product development plan. This typically leads to a reduction of overall costs and cycle time
for product development and commercialisation. In contrast, in the stage-gate model, any
rework downstream can exponentially increase the cycle time and costs of product
development (Koen et al., 2002; Koen et al., 2001).
The five elements of the new concept development model work differently for market-
driven and market-driving innovations. For market-driven innovation, new concept
development begins when a firm recognises the need to develop new products to respond to
existing market trends (opportunity identification), and then further analyses the trends and
competitive threats in more detail (opportunity analysis) to generate and select new product
ideas (idea generation and selection) that can be translated into a concept definition (concept
and technology development). In contrast, new concept development of market-driving
innovation begins when a firm recognises a breakthrough possibility for capturing
something radical or really new to the market, an application for which there is no readily
identifiable customer need (opportunity identification). Further analysis is done by finding
potential business opportunities for the new application (opportunity analysis). Several
product ideas associated with the new application are identified and, once selected, the new
product idea leads to a new concept and technology development. Importantly, it must be
noted that opportunity identification is mostly practised at highly innovative firms (those
that produce a large number of really new innovations) (Koen et al., 2001).
The last element of the new concept development model, concept and technology
development, involves building a business case based on analysis of customer needs, market

77
competitiveness and potential, technology unknowns, investment requirements and overall
project risk (Koen et al., 2002). A solid business case should be developed for incremental
innovation to encourage the translation of product ideas into new products using the firm’s
existing capabilities (Koen et al., 2002). The level of formality of a business case can vary
depending on the type of innovation and its nature of opportunity (e.g., new market,
technology and/or product arena), the level of resources, the organisational culture and the
requirements for moving the new product idea into the development process (Koen et al.,
2001). The business case for a large-scope, risky, breakthrough type of project is less formal
than that for an incremental project since getting the right data and constructing a solid, fact-
based business case can often be much more difficult. However, a compelling business case
should be built because many firms have a lot of great new product ideas with promising
value for the firm’s growth but do not feel the urge to invest in such ideas. A compelling
business case can convince senior management to make an investment and move forward by
developing new organisational and/or technological capabilities for translating highly
innovative ideas into radical or really new innovations (Cooper, 2011).
(3) Strategic Focus (NPD strategy)
Front end product portfolio strategy
The third front end success factor, the front end product portfolio strategy, is in line with the
strategic focus approach (NPD strategy). Front end product portfolio management and
formalised decision processes involve the “evaluation, selection, prioritisation and control”
of the firm’s product innovation portfolio at both program level (portfolio) and project level
(specific projects). The strategy supports the main front end objective by facilitating “the
selection of best new product concepts for the development and launch for successful
products” (Oliveira & Rozenfeld, 2010, p.1339).
A formal portfolio management system and plan is a method commonly applied by top-
performing firms to keep their product innovation portfolio current and competitive (Cooper
& Kleinschmidt, 2010). The results of the PDMA Best Practices Study (2003) indicated that
55% of firms have a well-defined, structured process for portfolio management. However,
formally planned activities are conducted for only one third of the projects to fill identified
78
gaps in the firm’s product portfolio (Barczak et al., 2009). A review of the product
innovation and management literature suggests that a firm needs to attain four primary goals
when managing a product innovation portfolio and related activities at the front end of the
development process (Barczak & Kahn, 2012; Cooper, Edgett & Kleinschmidt, 2002c).
These four goals are described below.
i. Strategic alignment: strategic alignment between projects in a portfolio and the
general NPD strategy
Most of the firms examined by Cooper and Kleinschmidt (2010) were suffering from having
too many NPD projects, resulting in the lack of resources, time and money to commit to
further innovations. This state of affairs seemed to be due to a lack of focus, inadequate
project evaluation and poor project prioritisation (Cooper & Kleinschmidt, 2010). Studies
have shown that the combination of too many projects and inadequate resource commitment
creates high new product failure rates (Cooper, 2001; Cooper & Kleinschmidt, 1996) and
poorer NPD performance for the business overall (de Brentani & Kleinschmidt, 2004).
Firms should therefore seek strategic alignment in their product portfolio and ensure that
innovative development and the resources allocated to it reflect the firm’s strategic NPD
priorities (Cooper, Edgett & Kleinschmidt, 2001).
ii. Portfolio balancing: a balance between incremental and breakthrough projects within
a portfolio
The results from a PDMA best practice study by Barczak et al. (2009) indicated that firms
have focused less on expanding into new competitive spaces by developing new product
lines and new-to-the-world projects in their portfolios, but more on exploiting the firm’s
existing knowledge, markets and customers by maintaining their current product lines or
engaging in product improvement projects. As a result, incremental innovations have
constituted the majority of new product projects (approximately 90%) (Cooper, 2001;
Cooper, Edgett & Kleinschmidt, 2003).
Accordingly, a critical issue in portfolio management is to foster well planned and properly
resourced NPD projects with the right mix and balance in the product portfolio. Cooper and
Kleinschmidt (2010) found that while firms typically have too many low-value, non-
innovative NPD projects, top-performing firms foster a higher proportion of innovative
79
NPD projects by specifically articulating a product innovation strategy for breakthrough
innovations. This suggests that firms may need to focus more on risky, long-term,
breakthrough projects and less on short-term, incremental projects in order to perform better
in today’s highly competitive business environment.
iii. Resource allocation: management of resources (especially R&D budget) for
preferred projects
Effective portfolio management helps to ensure that necessary resources (funds, time and
people) are dedicated to preferred projects (i.e., incremental versus breakthrough projects)
and/or across strategic arenas (Cooper, 2011; Cooper & Kleinschmidt, 2010). The
management of portfolio funding for incremental projects typically leans towards traditional
corporate R&D spending through a centralised system (Stringer, 2000). In contrast, several
large firms have managed to decentralise their R&D and build “fat” and “flexibility” into
their budgets over the portfolio for breakthrough projects. Breakthrough projects should be
funded separately from a large firm’s traditional R&D budget. The purpose is to avoid the
“trap of incremental thinking”, which tends to inhibit all aspects of breakthrough
innovations (Stringer, 2000, p.74). Avoiding that trap allows for the identification, testing
and screening of promising breakthrough ideas through to development and into
commercialisation.
An external strategy to manage funding for breakthrough projects is the ability to attract and
retain high-quality venture capital. Relying only on ever-larger internal R&D budgets
cannot possibly support all of the potential breakthrough ideas from the front end through to
the development and into the marketplace (Rice et al., 2000). The venture capital model
considers a set of breakthrough projects as a portfolio of corporate entrepreneurship. A pool
of money is put aside to open up new investments related to the firm’s growth strategy early
in the process and this enables ventures to obtain more money for breakthrough projects
faster (Rice et al., 2000). Governance of a portfolio entirely composed of high-risk,
breakthrough projects also requires an appropriate resource diversification strategy to
acquire new competencies and/or new technology and new business platforms (O'Connor,
2008).
80
iv. Maximisation of portfolio value: maximise the value of projects in the portfolio
during idea generation and selection
Idea generation and selection in the product portfolio often appear to be poorly managed at
the front end of innovation. Barczak et al. (2009) study on trends and drivers of success in
NPD practices indicated that less than half of the ideas for radical or really new projects are
initiated through formally planned activities to fill identified gaps in the product portfolio.
In contrast, most of the ideas for incremental projects are generated from a wide variety of
people through formally planned activities. Further, formal records of ideas have been found
for only 60%–65% of the ideas generated, while less than half of those ideas are accessible
by people other than the idea originator. Then, only approximately 60% of the ideas emerge
into the NPD process using a formal selection process, while most of the remaining ideas
cannot be moved forwarded and have no budget allocation. Thus, new product ideas often
fade away as potential opportunities (Barczak et al., 2009).
During the idea selection stage, decisions made by firms within the formal product portfolio
rely on formalised decision processes. Making the right investment decisions by selecting
the most promising product ideas can lead firms to achieve the greatest business value and is
significant to the firm’s future health and success. However, to evaluate which new product
ideas to pursue over the specific projects within the portfolio (project level go/kill decisions)
and over the several projects as a portfolio (program level) can be difficult because of the
limited information available during the early stages of the development process (Koen et
al., 2002). Firms therefore utilise a variety of evaluation tools and techniques, particularly
traditional financial measurements such as discounted cash flow analysis and payback
periods (Barczak et al., 2009).
Traditional financial measurements are subject to short-term biases, which inhibit a
significant flow of breakthrough ideas into commercialisation (Cooper, 2011; Stringer,
2000). The more novel an idea is, the more uncertain the development process and time to
commercialisation are, thus increasing overall project risk. The financial measure does not
evaluate the dependency of project value on risk beyond what is captured by the discount
rate, net present value or internal rate of return. The return of investment in a breakthrough
innovation occurs only after there are purchases by customers over time (Koen et al., 2002;
Rice et al., 2000; Stringer, 2000).
81
For breakthrough innovations, formalised decision processes must be modified to allow
“crazy” new ideas that do not offer immediate payoff a fair chance to succeed (Stringer,
2000). Breakthrough ideas can be evaluated by future cash flow/benefits or risk assessment
using real-options theory. Assessing risk using options theory supports investment in
projects associated with high uncertainty. The approach focuses on keeping investment
options open by relying on how new information changes the option value of the
opportunity (of the project invested). The aim of this approach is to learn more as the project
progresses in order to reduce uncertainty and is in line with the exploratory process
previously described. A unique governance board involving market/technology experts in
the investment may also be required to overlook the portfolio of breakthrough innovations
and related project level issues (O'Connor, 2008).
(4) Research
Market learning
The fourth front end success factor is related to research and specifically the view of market
learning at the front end of the development process. Rangan and Bartus (1995) described
two views of market learning, which are consistent with the two research perspectives of
customer insight and executive foresight previously described . Whereas market-driven
innovations call for “market listening” (voice of customer), market-driving innovations call
for “market visioning” (technology voice) (O'Connor, 1998).
The View of “Market Listening”
Incorporating market listening through the voice of the customer (VOC) at the front end of
the development process has been regarded by the majority of researchers as “a critical
success factor for NPD” (Kleef, van Trijp & Luning, 2005, p.181). According to the PDMA,
VOC can be defined as “a complete set of customer wants and need; expressed in the
customers’ own language; affinitized, that is, organized into a hierarchy; and prioritized,
that is, rated for relative importance and performance or satisfaction” (Katz, 2001, p.1).
VOC can be obtained through traditional methods of market research such as customer
interviews or focus groups (Bell, Holbrook & Solomon, 1991; Davis, 1989; Hassenzahl,
2001). Following traditional market research, customers are a significant source of new
product ideas (Callahan & Lasry, 2004; Fang, 2008; Griffin & Hauser, 1993; Urban &
82
Hauser, 1993). Thus, early involvement with customers can lead to successful product
innovation (Kahn, Castellion & Griffin, 2005; Verworn, 2009; von Hippel, 1986).
In a view opposed to the long-standing marketing theory on the value of customer input,
several studies have pointed out the limitations of listening to customers on NPD and
product innovation (e.g. Leonard-Barton, 1995; Ulwick, 2002). Ulwick (2002) described
how firms often wrongly interpret customers’ expressed needs for innovation. The study
asserted that “customers want to buy groceries on-line; companies then deliver these
tangibles, and customers, very often and much to everyone’s chagrin, just don’t buy”
(Ulwick, 2002, p.5-6). This relates to “the limitations of listening” to customers (Leonard-
Barton, 1995). For this reason, management may conclude that customers do not know
exactly what they want (Ulwick, 2002).
Christensen (1997) had a similar view on “innovator’s dilemma” or “the current-customer
trap”. Leading firms fail to sustain their positions and lose business to entrant firms because
they are too “well managed”, meaning that they listen closely to their customers and
develop new products that correspond to customers’ needs and market trends. Christensen
claimed that “we cannot expect our customers to lead us toward innovations that they do not
now need” (1997, p.258). In other words, customers may not be able to see even current
needs, much less the innovations that may serve their needs in the future. By the time
customers are aware that they want an innovation, it is too late for the firm to develop that
innovation to compete in the market (Luecke & Katz, 2003). Christensen (1997) concluded
that “staying close to your customers appears not always to be robust advice” (p. 54).
The growing number of discussions on market listening raises the question of the value of
customer input (VOC) in the development of breakthrough innovation (e.g. Christensen &
Bower, 1996; Day, 1998; Leonard-Barton & Doyle, 1996). Direct customer input may
hamper breakthrough innovation, particularly during the front end of the NPD effort.
Customers have difficulty visualising and articulating their future needs because their
mindsets are based on what they have experienced or their current use context (Deszca et
al., 1999; Mullins & Sutherland, 1998; Reid & de Brentani, 2010). This is a “functional
fixedness” (Baron, 1998), a cognitive limitation that may hinder truly creative thinking and
can influence the tacit knowledge of customers (Maqsood, Finegan & Walker, 2004). Tacit
knowledge by its nature is individualised and difficult to transfer (Narvekar & Jain, 2006).
This type of knowledge underlies intuition or “gut-feeling” and hinders well-informed
83
decisions (Maqsood et al., 2004). When customers rely on their intuitions or articulate their
needs based on what they are familiar with, this leads to only small, incremental
improvements of existing products or short-sighted product innovation (Kotler & Keller,
2009; Luecke & Katz, 2003; Verhees & Meulenberg, 2004). This may be one explanation
for the problems of the dominant stage-gate innovation process when applied to
breakthrough innovation given its primary focus on VOC research (Cooper & Edgett, 2006,
2007; Deszca et al., 1999). Henry Ford (1988) supported the contention that:
It is not easy to get away from the tradition. That is why all our new operations
are always directed by men who have no previous knowledge of the subject
and therefore have not had the chance to get on really familiar terms with the
impossible.
Some theorists have further argued for the need to “ignore customers” as a source for
completely new product ideas (Martin, 1995). In most cases, customers do not have
sufficient knowledge about the technology required to develop a new product that requires
different behaviour patterns (O'Connor, 1998). They are often overstrained by the high
technological complexities involved in developing breakthrough innovations (Bogers,
Afuah & Bastian, 2010; Lettle, Herstatt & Gemuenden, 2006). As a consequence, it is
unlikely that most customers are able to envision revolutionary products, concepts and
technologies (Kumar et al., 2000). Hamel and Prahalad (1994a, p.67) went so far as to state,
“customers are notoriously lacking in foresight”.
The View of “Market Visioning”
Let’s face it, the customer, in this business, and I suspect in many others, is
usually, at best, just a rear-view mirror. He can tell you what he likes about the
choices that are already out there. But when it comes to the future, why, I ask,
should we expect the customer to be the expert in clairvoyance or creativity?
After all, isn’t that what he expects us to be?
Robert Lutz, Vice-Chairman of Chrysler (Day, 1998, p.5)
The importance of “vision” or “visioning” has recently been highlighted in much NPD
research as a “new” market learning approach for developing successful breakthrough
innovation (Baker & Sinkula, 1999; O'Connor, 1998; Reid & de Brentani, 2010). The
approach is under the notion of “market-driving” orientation, which goes beyond the
84
immediate voice of customer issues and attempts to reshape the market structure and the
preferences or even behaviour of all players in the market (Jaworski et al., 2000).
Effective visioning is a process of sensing and thinking about future scenarios (O'Connor &
Rice, 2001). Several researchers have suggested that the thinking and imagination
underlying the success of breakthrough innovation, particularly technological breakthroughs
is the “technology voice” or “techno-market insight” (Leifer et al., 2000; Leonard-Barton,
1995). This comes from “marketing flair” (Jolly, 1997) or “visioning the future market”
(Hamel & Prahalad, 1994b) or an ability to recognise that a certain new technology has
compelling benefits and commercial implications, and to embed those benefits into a
product for which a market may not have previously existed. This also involves how a firm
developing a new product approaches a problem technically, plays with the technology and
deals with interaction with the end users, particularly lead users.
A “lead user” can be a valuable source of highly innovative ideas (Urban & von Hippel,
1988; von Hippel, 1989). Lead users are not standard users, but expert customers who are
highly motivated to seek solutions for their unmet needs (Lilien, Morrison, Searls, Sonnack
& von Hippel, 2002; von Hippel, 1986). There is, however, only a small number of lead
users in the market (Moore, 1991). According to Lynn et al. (1996, p.16), lead user analysis
is the process of “probing and learning” about users and the technology to introduce “an
early version of the product to a plausible initial market” and its subsequent redesign for
customer acceptance. The probe and learn process offers a unique approach of discovering
rich information on emerging and future customer needs (Eisenberg, 2011).
Notwithstanding this process, O'Connor and Veryzer (2001, p.244) argued that:
Customers or lead users seem to play little if any role in the visioning process
in this development context. While it may be that customer input is indirectly
funnelled into the process via knowledgeable members of the development
teams, the implication is still that “market visioning” for radical new productsis not heavily customer driven in the traditional sense.
In many cases, the use of lead-user analysis appears to support the front end of breakthrough
innovation because it centres on: “(a) obtaining a deep understanding of the customer’s
current and future usage situation and (b) accelerating the customer’s level of interaction
with the product” (O'Connor, 1998, p.153). This may enable a firm to attain a market insight
or market vision.

85
Having a strategic focus (NPD strategy) may provide a firm with a general framework for
its innovation efforts, but market vision is more specific, being about “a desired and
important product-market for a new advanced technology” (Reid & de Brentani, 2010,
p.500). Effective market vision has a clear focus related to employee effort as well as the
firm’s activities related to customers, technology and competitors to reduce innovation risk
(O'Connor & Veryzer, 2001). A lack of market vision clarity may discourage the initiative
of prospective innovators in the firm (Kelley, 2009). Market vision must therefore be
grounded in a stimulating, future-looking view and strategically based on proactive use of
market learning tools and competence (Reid & de Brentani, 2010). These involve
entrepreneurial behaviour and the process of opportunity discovery/identification through
exploratory and collaborative learning (Kirzner, 1997; Schindehutte et al., 2008;
Venkataraman, 1997). Then, networking can drive the vision through the firm to support
individuals and NPD team members to work in a coordinated manner towards the desired
vision (Lynn & Akgün, 2001; Reid & de Brentani, 2010). The vision may also redirect the
strategic focus of a firm’s innovative efforts to respond to market forces and new
technologies that are not evident to competitors (Tellis et al., 2009).
(5) Metrics and performance measurement
Front end performance metrics
The last front end success factor is the front end performance metrics, which are
measureable goals to track idea generation and enrichment. Although the front end
performance metrics do not lead to market-driven or market-driving ideas, they capture the
front end success that is a predictor of NPD performance. These metrics may include the
following:
Number of ideas retrieved and enhanced from an idea portfolio
Number of ideas generated/enriched over a certain period
Percentage of ideas commercialised
Value of ideas in an idea portfolio (or idea bank)
Percentage of ideas that entered the NPD process
Percentage of ideas that resulted in patents
Percentage of ideas accepted by a business unit for development
(Koen et al., 2002, p.20-21)

86
2.5.5 Section Conclusion
Drawn from the seven multidimensional factors of NPD success, five dimensions that are
relevant and critical to the front end success were identified in this section. The five front
end success dimensions are: (1) organisational culture/behaviour (organisational learning
process and front end individuals), (2) NPD process (front end development process and
related aspects, (3) strategic focus (front end product portfolio strategy), (4) research
(market learning) and (5) metrics and performance measurement (front end performance
metrics). Within each dimension, the front end characteristics and issues associated with the
development of market-driving innovation were discussed and, where applicable, compared
to those associated with the development of market-driven innovation.
A review of the product innovation and management literature has suggested that the nature
of market learning through market visioning is now emerging and is of particular
importance in ensuring the front end success of market-driving innovation (Reid & de
Brentani, 2010). The key issue of the front end of market-driving innovation is how
successful the front end is in delivering highly innovative concepts into development and
commercialisation phases. However, getting market-driving innovations across the stages
between opportunity discovery and product development, whilst retaining their
innovativeness, is fraught with difficulties and remains a challenge for many firms. Firms
must therefore determine how to prevent the rejection or modification of the highly
innovative ideas, which may eventually cannibalise their existing businesses (Koen et al.,
2002). Kumar et al. (2000, p.136) stated:
An established firm that wishes to engage in market driving must meet two
challenges; it must have the vision and environment to generate breakthrough
ideas and it must have the capital, fortitude, and risk tolerance to persevere and
allow the radical idea to have a fair chance to succeed.
The process of market visioning during the front end of market-driving innovation is not
well understood. In particular, it is unclear how a vision can be created based on the
proactive use of market learning tools or individual competence and then sustained in the
face of the short-term pressures of the firm’s activities. Further, the organisational learning
process – the firm’s capability to manage and process external information – appears to be
an important proxy for vision creation and market intelligence (Dröge, Jayaram & Vickery,
2000). Information flow and informal/external networking during the front end of market-

87
driving innovation have not been well understood or managed at the broader organisational
level. It is therefore critical to understand what firms can do to create the environment that
stimulates market-driving behaviour, in particular exploratory learning and thinking about
future market opportunities (O'Connor & Veryzer, 2001; Schindehutte et al., 2008). There
must be some organisational structures or learning processes that can be instituted to better
manage the front end of market-driving innovation (Davenport, 1993; de Brentani & Reid,
2012; Reid & de Brentani, 2004). This need highlights the significance of a firm’s
absorptive capacity as an emerging organisational dynamic learning capability to the front
end success of market-driving innovation (Zahra & George, 2002).
The next sections review the elements of these emerging front end success factors – market
visioning and absorptive capacity – in more detail.
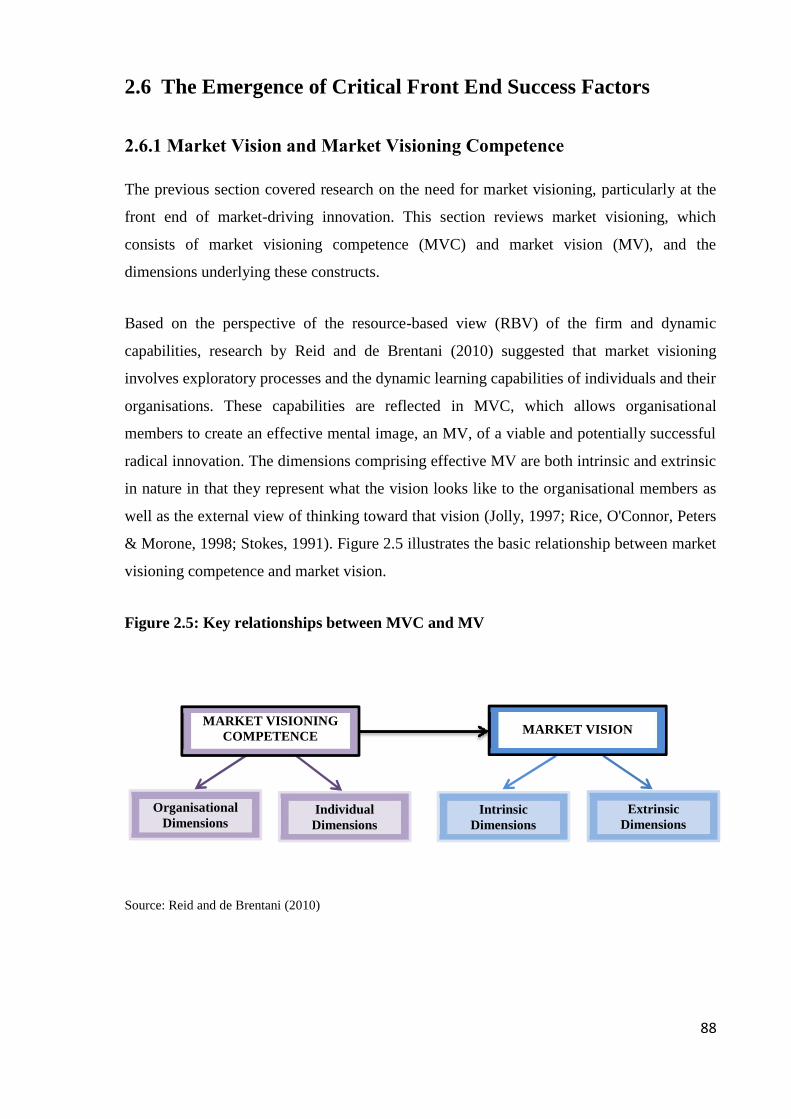
88
2.6 The Emergence of Critical Front End Success Factors
2.6.1 Market Vision and Market Visioning Competence
The previous section covered research on the need for market visioning, particularly at the
front end of market-driving innovation. This section reviews market visioning, which
consists of market visioning competence (MVC) and market vision (MV), and the
dimensions underlying these constructs.
Based on the perspective of the resource-based view (RBV) of the firm and dynamic
capabilities, research by Reid and de Brentani (2010) suggested that market visioning
involves exploratory processes and the dynamic learning capabilities of individuals and their
organisations. These capabilities are reflected in MVC, which allows organisational
members to create an effective mental image, an MV, of a viable and potentially successful
radical innovation. The dimensions comprising effective MV are both intrinsic and extrinsic
in nature in that they represent what the vision looks like to the organisational members as
well as the external view of thinking toward that vision (Jolly, 1997; Rice, O'Connor, Peters
& Morone, 1998; Stokes, 1991). Figure 2.5 illustrates the basic relationship between market
visioning competence and market vision.
Figure 2.5: Key relationships between MVC and MV
Source: Reid and de Brentani (2010)
IntrinsicDimensions
ExtrinsicDimensions
OrganisationalDimensions
IndividualDimensions
MARKET VISIONMARKET VISIONING
COMPETENCE
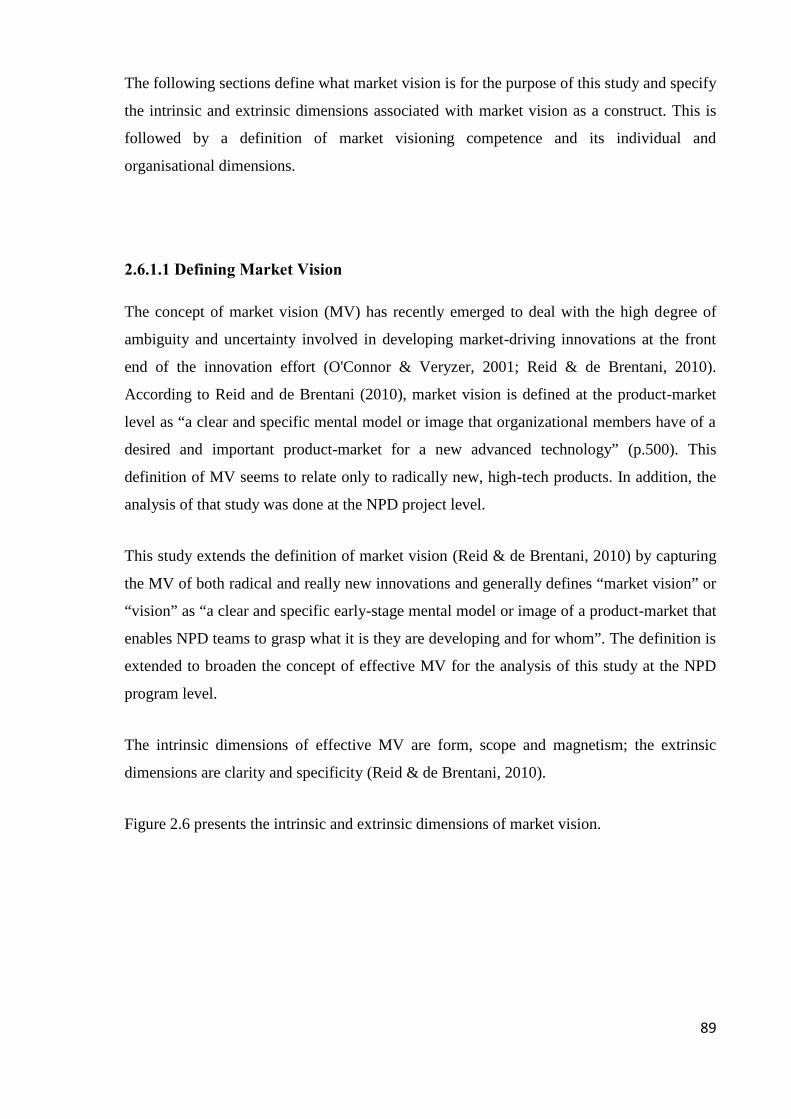
89
The following sections define what market vision is for the purpose of this study and specify
the intrinsic and extrinsic dimensions associated with market vision as a construct. This is
followed by a definition of market visioning competence and its individual and
organisational dimensions.
2.6.1.1 Defining Market Vision
The concept of market vision (MV) has recently emerged to deal with the high degree of
ambiguity and uncertainty involved in developing market-driving innovations at the front
end of the innovation effort (O'Connor & Veryzer, 2001; Reid & de Brentani, 2010).
According to Reid and de Brentani (2010), market vision is defined at the product-market
level as “a clear and specific mental model or image that organizational members have of a
desired and important product-market for a new advanced technology” (p.500). This
definition of MV seems to relate only to radically new, high-tech products. In addition, the
analysis of that study was done at the NPD project level.
This study extends the definition of market vision (Reid & de Brentani, 2010) by capturing
the MV of both radical and really new innovations and generally defines “market vision” or
“vision” as “a clear and specific early-stage mental model or image of a product-market that
enables NPD teams to grasp what it is they are developing and for whom”. The definition is
extended to broaden the concept of effective MV for the analysis of this study at the NPD
program level.
The intrinsic dimensions of effective MV are form, scope and magnetism; the extrinsic
dimensions are clarity and specificity (Reid & de Brentani, 2010).
Figure 2.6 presents the intrinsic and extrinsic dimensions of market vision.

90
Figure 2.6: Intrinsic and Extrinsic Dimensions of Market Vision
Source: Reid and de Brentani (2010)
Intrinsic Dimensions of MV
The intrinsic dimensions of MV are form, scope and magnetism (Reid & de Brentani, 2010).
These dimensions are described as follows.
Form (FO)
In general, vision form refers to the tangibility or specific conditions of the image. Collins
and Porras (1991) explained tangibility as a clear focus of mission or goal. When such a
description is incorporated into the MV, vision form is related to the market goal. The
market is “the set of all actual and potential buyers of a product or service” (Kotler &
Keller, 2005, p.10). MV form, therefore, refers to the potential or desired market as part of
the market focal point/goal (Reid & de Brentani, 2010).
The perspective of MV form captures the design and concept of a product as well as the
product in use. This involves the idea for the product components and their integration
espoused through a prototype, and a consideration of the anticipated product features in
relation to customer benefits and product-user interaction (Reid & de Brentani, 2010; Ulrich
& Eppinger, 1995). Understanding the anticipated product fit to customers’ needs and
product-user interaction in the use environment has been shown to be critical for new
product success (Crawford, 1980; de Brentani, 1989; Tripsas, 2000).
Magnetism
IntrinsicDimensions
ExtrinsicDimensions
MARKET VISION
Scope
FormClarity
Specificity

91
Scope (SC)
MV scope involves the target market and the target magnitude (Reid & de Brentani, 2010).
The target market (target business) provides the specific market goal (end-user group and
activity) for new product development (Cooper, 1993; Crawford, 1980). The target
magnitude is the scope and breadth of the envisioned potential market. Several studies in
NPD have supported that the size of the potential market can influence the product
outcomes and the success of developing innovative products. Typically, the larger the size
and greater the importance of the market, the more successful the outcome (e.g. Cooper,
1984, 2011; Cooper & Kleinschmidt, 1995a; de Brentani, 1989). Some researchers have
asserted that large markets do not exist for breakthrough innovations and that it is not
appropriate to consider the size of the market at the front end of breakthrough innovation
(e.g. Christensen, 1997; O'Connor, 1998). However, Reid and de Brentani (2010) argued
that a forecast of long-term market potential in terms of size and importance is essential to
fire employees’ imaginations.
Magnetism (MG)
MV magnetism reflects “how compelling, important, or desirable the vision is” in the eyes
of the organisation members and the way that they are drawn to “an idea pertaining to a
product-market” (Reid & de Brentani, 2010, p.505). Collins and Porras (1991) described the
notion of a guiding philosophy in terms of how people are attracted to ideas which relate to
their core beliefs, values and purpose. Applying this to MV, a vision comprising magnetism
dimension can infuse value into the firm by motivating individuals to move in a coordinated
direction and attain a given vision of the product-market interface because they believe in
the value of the vision (Reid & de Brentani, 2010).
92
Extrinsic Dimensions of MV
In addition to the intrinsic dimensions, Reid and de Brentani (2010) stated that “an image
itself is separate from thinking directed toward that image” (p.503). An image can be seen
differently over time but this uncertainty can be separated from the image itself, as it has
independent, extrinsic dimensions. The emergent strategic process may direct the intrinsic
components of the vision. The strength of the vision, however, evolves over time and clarity
and specificity are the extrinsic dimensions of the generic vision. These extrinsic
dimensions are described as follows.
Clarity (CL) and Specificity (SP)
According to Lynn and Akgün (2001), “vision clarity” is defined as “a well-articulated,
easy-to-understand target – a very specific goal that provides direction to others in the
organization” (p.375). At the project level, vision clarity has been found to relate positively
to the success of both radical and really new innovations (Lynn & Akgün, 2001). Having a
vision at the project level (a project vision) has generally been identified as a significant
NPD success factor (e.g. Lynn et al., 1999a; Lynn et al., 1999b). A “project vision”, also
known as a “product vision”, has been defined as the consistency between a firm’s strategy
and the need of the market to develop an effective product concept (Brown & Eisenhardt,
1995); clear goals and objectives that enable NPD teams to develop a product (Crawford &
di Benedetto, 2003); and “a firm’s ability to define clear objectives and a well-recognized
strategy for the development process and to share these objectives and strategy with all
those involved in the development” (Tessarolo, 2007, p.74). A project vision, however,
comes only after a market vision of a particular new product-market scenario has been
formalised, elaborated and accepted for further development.
At the product-market level, vision clarity can be separated into “clarity” and “specificity”
dimensions (Reid & de Brentani, 2010). On one hand, MV clarity is specifically related to
MV form and represents a clear vision of how the product will be used, who the target user
is and what the target customers’ needs would be. On the other hand, MV specificity is
“more general and at a higher level of abstraction pertaining to specificity of the overall
vision” (Reid & de Brentani, 2010, p.511). Thus, specificity refers to a clear, specific and
easy to visualise (tangible) market vision that is able to provide direction to individuals and
NPD teams even prior to formal project status (Reid & de Brentani, 2010).

93
2.6.1.2 Defining Market Visioning Competence
Cast in RBV, the development of an effective market vision (MV) requires market visioning
competence (MVC) to be successful (Reid & de Brentani, 2010). Reid and de Brentani
(2010, p.500) defined MVC as “the ability of individuals in organizations to link advanced
technologies to market opportunities of the future”. Similar to their definition of MV, the
definition of MVC was limited to radically new, high-tech products. In addition, the
analysis of their study was done at the NPD project level.
Based on the study by Reid and de Brentani (2010), this study broadens the concept of
effective MVC to capture both radical and really new innovations at NPD program level by
defining it as: “the ability of individuals or NPD teams in organisations to link new ideas or
advanced technologies to future market opportunities”. The organisational and individual
dimensions of MVC comprise proactive market orientation, market learning tools,
networking and idea driving (Reid & de Brentani, 2010). Figure 2.7 presents the
organisational and individual dimensions of market visioning competence.
Figure 2.7: Organisational and Individual Dimensions of Market VisioningCompetence
Source: Reid and de Brentani (2010)
OrganisationalDimensions
IndividualDimensions
MARKET VISIONINGCOMPETENCE
Proactive MarketOrientation
Market LearningTools
Networking
Idea Driving

94
Organisational Dimensions of MVC
At the NPD project level, Reid and de Brentani (2010) identified the organisational
dimension of MVC, which consists of proactive market orientation and market learning
tools. These dimensions are described as follows.
Proactive market orientation (MO)
In line with previous literature review, the proactive market orientation dimension captures
the notion of market driving which has been identified as critical to the success of market-
driving innovation. “Proactive market orientation” is the first organisational dimension of
MVC, which focuses on discovering and incorporating solutions to unarticulated needs or
additional needs of customers in new products (Narver & Slater, 1990; Reid & de Brentani,
2010). This is in contrast to “reactive market orientation”, which focuses on listening
closely to customers and reactively responding to customers’ expressed needs, which
appears to be useful only in the case of market-driven innovation (Christensen, 1997).
Market learning tools (ML)
Market learning was identified as the key success factor/dimension at the front end of
market-driving innovation. The market learning approach for market-driving innovation
involves the process of sensing and thinking about future scenarios. In a similar vein, Reid
and de Brentani (2010) specifically considered “market learning tools” as a second
organisational dimension of MVC for probing and learning about future technological
scenarios and potential market opportunities (Lynn et al., 1996; Reid & de Brentani, 2010).
As noted earlier, deep interaction with customers through VOC or market listening is simply
not appropriate during the front end development of market-driving innovation (de Brentani,
2001; Song & Montoya-Weiss, 1998). Other tools and techniques for visioning the future
market are needed before making a market selection (Deszca et al., 1999). These tools and
techniques include back casting, scenario analysis and planning, technology opportunity
analysis, road mapping and learning by using (Kostoff & Schaller, 2000; Noori, Munro,
Deszca & McWilliams, 1999; Porter, 1994; Schoemaker, 1995), and have been found to be
most effective when used in combination (Meade & Islam, 1998).
95
Individual Dimensions of MVC
The individual dimensions of MVC are networking and idea networking. Consistent with
one of the emerging front end success factors identified to relate to “the front end
individuals”, the individual dimensions relate specifically to the boundary spanners and
champions who play critical roles at the front end of market-driving innovation (Reid & de
Brentani, 2010). These individual dimensions are described as follows.
Networking (NW)
Networking is considered a key individual dimension in creating effective MVC. In the
context of MVC, networking involves “boundary spanners” who develop external webs of
relationships with people outside the firm (Reid & de Brentani, 2004, 2010). The important
aspects of an external network are its structural features (size, variety and centrality) and its
potential to capitalise on competitive advantage (Reid & de Brentani, 2010). The
development of an external network allows individuals to draw on new and diverse
knowledge and product applications, thereby broadening their knowledge base and thinking
for breakthrough innovations. The underlying focus of networking is related to the processes
of “vision migration” (also called “divergent visioning”), as opposed to focusing on current
uses and markets (O'Connor & Veryzer, 2001).
Idea driving (ID)
The literature has supported the notion of “champions” as the individuals responsible for
moving ideas (the vision) forward from the individual level to the organisational level for
breakthrough innovation (e.g. Burgelman & Sayles, 1986; O'Connor & Veryzer, 2001).
Similarly, Reid and de Brentani (2010) proposed champions or idea drivers as one of the
individual level capabilities of MVC in market-driving innovation scenarios. At the front
end of market-driving innovation, a market-driving idea is often squelched or loses its
innovativeness before moving through to development and into launch, given the high risk
and uncertainty associated with the idea (Hill & Rothaermel, 2003; McDermott &
O'Connor, 2002). It is therefore important to have an idea driver who can obtain and
accelerate support and commitment from key decision makers and senior managers to drive
the market-driving idea (MV) forward.

96
2.6.2 Absorptive Capacity
A review of the product innovation and management literature has suggested the notion of
“absorptive capacity” (that is, an organisational dynamic learning capability) as another
emerging factor that is critical to the front end success of market-driving innovation.
This section first reviews the general concept of absorptive capacity and the definition
adopted for the purpose of this research. This is followed by a review of the key studies on
absorptive capacity and innovation, particularly in relation to the front end of market-
driving innovation.
2.6.2.1 Defining Absorptive Capacity
The concept of absorptive capacity first arose from the field of macroeconomics and
referred to the ability of an economy to exploit and absorb external information and
resources (Adler, 1965). Many different research fields have utilised the concept of
absorptive capacity (e.g., strategic management and industrial policy). Following Adler
(1965), the original concept of absorptive capacity was adjusted by Cohen and Levinthal
(1990) to provide a new perspective on learning and innovation, and since then it has
become one of the most important concepts in the field of organisational research (Lane et
al., 2006). In general, the concept of absorptive capacity focuses on a firm’s existing base of
knowledge and the exploitation of external sources of knowledge as a key to organisational
innovation. In that view, absorptive capacity is the capacity of a firm to innovate (innovative
capacity) by adopting and implementing new ideas, processes or products successfully
(Cohen & Levinthal, 1990).
Most researchers have slightly modified the definition of absorptive capacity proposed by
Cohen and Levinthal (1990). Their definition of “absorptive capacity” was “the ability of a
firm to recognize the value of new, external information, assimilate it and apply it to
commercial ends” (p.128). In a similar vein, Mowery and Oxley (1995) defined absorptive
capacity as the range of skills required to deal with the tacit element of transferred
knowledge and the ability to transform externally acquired knowledge. According to Kim
(1997, 1998) absorptive capacity is defined as the learning system or capacity to learn and
solve problems. Importantly, Zahra and George (2002) reconceptualised and further
extended the definition of absorptive capacity by Cohen and Levinthal (1990) and their

97
definition has been adopted by several studies on the contribution of knowledge processes to
organisational performance (e.g. Da Silva & Davis, 2011; Lev, Fiegenbaum & Shoham,
2009; Sun & Anderson, 2010).
Following the work by Zahra and George (2002), this study adopts the definition of
absorptive capacity (ACAP) as: “a set of organizational routines and process by which firms
acquire, assimilate, transform and exploit knowledge to produce a dynamic organizational
capability” (p.186). Their definition is in line with the perspective in the RBV of the firm
and dynamic capabilities literature. By definition, ACAP comprises two subsets of potential
and realised absorptive capacities, which have acquisition, assimilation, transformation and
exploitation dimensions (Zahra & George, 2002). Figure 2.8 presents the potential and
realised subsets of absorptive capacity.
Figure 2.8: Absorptive capacity, its potential and realised subsets and dimensions
Source: Zahra and George (2002)
PotentialAbsorptive Capacity
RealisedAbsorptive Capacity
ABSORPTIVECAPACITY
Acquisition
Assimilation
Transformation
Exploitation
98
Potential Absorptive Capacity (PACAP)
The dimensions of potential absorptive capacity allow a firm to discover new sources of
knowledge by:
Acquisition: a firm’s capability to identify and acquire external knowledge that is
important to its operations, especially for NPD and innovation (e.g., new technology
and market information)
Assimilation: a firm’s capability to develop routines and processes that are useful for
analysing, interpreting and understanding the information obtained from external
sources
Realised Absorptive Capacity (RACAP)
The dimensions of realised absorptive capacity allow a firm to use transformed knowledge
for a commercial purpose by means of:
Transformation: a firm’s capability to develop and improve existing routines that
promote the future use of existing knowledge with newly acquired and assimilated
knowledge
Exploitation: a firm’s capability to constantly use the “transformed” knowledge, and
explore its existing routines, competencies and technologies for improvement and
expansion in order to create something new for commercial purpose
(Zahra & George, 2002; Zahra et al., 2006)
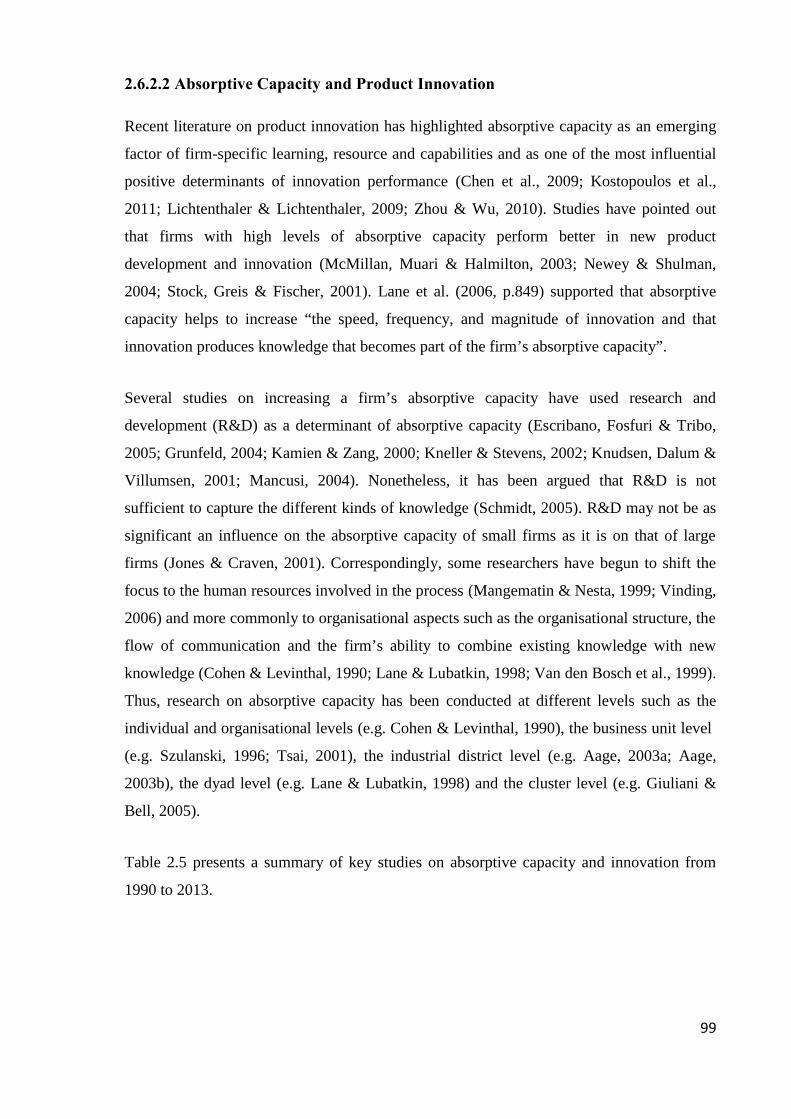
99
2.6.2.2 Absorptive Capacity and Product Innovation
Recent literature on product innovation has highlighted absorptive capacity as an emerging
factor of firm-specific learning, resource and capabilities and as one of the most influential
positive determinants of innovation performance (Chen et al., 2009; Kostopoulos et al.,
2011; Lichtenthaler & Lichtenthaler, 2009; Zhou & Wu, 2010). Studies have pointed out
that firms with high levels of absorptive capacity perform better in new product
development and innovation (McMillan, Muari & Halmilton, 2003; Newey & Shulman,
2004; Stock, Greis & Fischer, 2001). Lane et al. (2006, p.849) supported that absorptive
capacity helps to increase “the speed, frequency, and magnitude of innovation and that
innovation produces knowledge that becomes part of the firm’s absorptive capacity”.
Several studies on increasing a firm’s absorptive capacity have used research and
development (R&D) as a determinant of absorptive capacity (Escribano, Fosfuri & Tribo,
2005; Grunfeld, 2004; Kamien & Zang, 2000; Kneller & Stevens, 2002; Knudsen, Dalum &
Villumsen, 2001; Mancusi, 2004). Nonetheless, it has been argued that R&D is not
sufficient to capture the different kinds of knowledge (Schmidt, 2005). R&D may not be as
significant an influence on the absorptive capacity of small firms as it is on that of large
firms (Jones & Craven, 2001). Correspondingly, some researchers have begun to shift the
focus to the human resources involved in the process (Mangematin & Nesta, 1999; Vinding,
2006) and more commonly to organisational aspects such as the organisational structure, the
flow of communication and the firm’s ability to combine existing knowledge with new
knowledge (Cohen & Levinthal, 1990; Lane & Lubatkin, 1998; Van den Bosch et al., 1999).
Thus, research on absorptive capacity has been conducted at different levels such as the
individual and organisational levels (e.g. Cohen & Levinthal, 1990), the business unit level
(e.g. Szulanski, 1996; Tsai, 2001), the industrial district level (e.g. Aage, 2003a; Aage,
2003b), the dyad level (e.g. Lane & Lubatkin, 1998) and the cluster level (e.g. Giuliani &
Bell, 2005).
Table 2.5 presents a summary of key studies on absorptive capacity and innovation from
1990 to 2013.
100
Table 2.5: Summary of Key Studies on Absorptive Capacity and Innovation
Author Year Journal Ranking Findings
1 Cohen andLevinthal
1990 Administrative ScienceQuarterly
A* Absorptive capacity is used as predictor of innovative activity; R&D creates a capacity toassimilate and exploit new knowledge.
2 Lui and White 1997 Technovation B Absorptive capacity is a predictor of innovative output; the synergy of investments in absorptivecapacity (R&D personnel) and new sources of knowledge (foreign technology) drive innovationin developing economies.
3 Kim 1998 Organisation Science A* Absorptive capacity is an integral part of a learning system (organisational learning is a functionof ACAP), that is, the capacity to create new knowledge (for innovation); the investment inknowledge development and increased efforts in learning come from the creation of crises.
4 Lane andLubatkin
1998 Strategic ManagementJournal
A* “Relative absorptive capacity”: The factors that determine success of firms in the (R&D)alliances are: (1) relevance of the learning firm’s basic knowledge to the teaching firm, (2)similarity in pay and benefits practices, (3) similarity in areas of research, (4) similarity oforganisational structures.
5 Van den Bosch,Volberda and DeBoer
1999 Organisation Science A* In a turbulent knowledge environment, firms are likely to increase their level of absorptivecapacity; the focus is on exploration of knowledge that is beyond essence of refining andextending existing competencies, technologies and paradigms.
6 Tsai 2001 Academy ofManagement Journal
A* Absorptive capacity acts as a conduit of knowledge transfer among organisational units andhence facilitates the use of new knowledge for a firm’s innovation activities [the significantpositive effects of absorptive capacity on innovation and business performance].
7 Zahra andGeorge
2002 Academy ofManagement Review
A* The reconceptualisation of absorptive capacity into potential and realised absorptive capacitiesand their different influences on firm performance through product and process innovation;ultimately firms are more likely to achieve and sustain a competitive advantage.

101
Table 2.5: Summary of Key Studies on Absorptive Capacity and Innovation (continued)
Author Year Journal Ranking Findings
8 Lane and Koka 2006 Academy ofManagement Review
A* A detailed analysis of 289 papers on absorptive capacity (14 major peer-reviewed managementjournals) found that the significant positive impact of absorptive capacity and its effect oninnovation (i.e., patents or new products) has been highlighted in many studies. The studyclearly indicated a lack of research between current absorptive capacity and radical innovation.
9 Abecassis-Moedas andMahmoud-Jouini
2008 Journal of ProductInnovation Management
A* The source-recipient knowledge complementarity, particularly the role of design knowledgewith prior knowledge (marketing or technological) has a positive moderating effect on theabsorption process (knowledge transformation and exploration) and NPD performance.
10 Fosfuri and Tribo 2008 The InternationalJournal of Management
Science
A Potential absorptive capacity is a crucial source of competitive advantage in innovation (e.g., ingaining large shares of sales from new or substantially improved products). The externallinkages in the process of experiential learning increase heterogeneity in the level of potentialabsorptive capacity, and hence produce a stronger ability to understand and assimilate internalinformation flows.
11 Chen, Lin andChang
2009 Industrial MarketingManagement
A Absorptive capacity positively influences a firm’s innovation performances and competitiveadvantage (e.g., in developing and accelerating the launch of new product innovations and innew technology to improve operation processes).
12 Kostopoulos,Papalexandris,Papachroni and,Ioannou
2010 Journal of BusinessResearch
A Absorptive capacity is a mechanism of external knowledge inflows and a means of achievingsuperior innovation and financial performance.
13 Ritala andHurmelinna-Laukkanen
2013 Journal of ProductInnovation Management
A* Potential absorptive capacity (knowledge acquisition and assimilation) has a significant positiverelationship with the creation of radical innovations with high levels of appropriability. Todevelop radical innovation with rivals, the emphasis should be on protecting existing coreknowledge, particularly for the emergence of novel innovations and new market opportunities.

102
The review of the key studies on absorptive capacity has suggested that it has gained
recognition predominantly in organisational and management studies. Despite the
considerable number of studies, previous research that has specifically dealt with radical or
really new innovation appears to be limited. ACAP, as a dynamic capability, involves
“difficult-to-replicate” (knowledge) capabilities and process improvement techniques that
constitute a firm’s capability to adapt its operating routines (organisational structure,
processes, procedures and decision-making rules) to changing market and technological
opportunities (Teece, 2007; Zahra et al., 2006). The focus of ACAP on creating, enhancing
and reconfiguring organisational knowledge (intangible assets) reflects an exploratory
learning process, which facilitates the development of market-driving innovation.
Nevertheless, Lane et al. (2006, p.850) stated that “consistent with the organizational
learning theme’s omission of exploratory learning, there has been little attempt at
understanding the relationship between current absorptive capacity and radical innovation”,
in particular at the front end of the development process.
2.6.2.3 Absorptive Capacity and the Front End of Market-Driving Innovation
The front end of market-driving innovation can be best supported by absorptive capacity.
The front end activities of market-driving innovation include novel combinations of existing
or new ideas/technologies during the idea generation stage and the evaluation/selection of
the “right” new product concept for development and commercialisation (Koen et al., 2002;
Kogut & Zander, 1992; Van den Bosch et al., 1999). Broring et al. (2006) argued that the
prevailing trigger of the awareness stage for idea generation is the ability to recognise an
opportunity and is related to the concept of absorptive capacity. In a similar vein, Verganti
(2008) supported that absorptive capacity is one of the most important concepts for design
discourse of “design-driven innovation”, that is, radical innovation, in regard to the ability
to develop unique vision and recognise possible radical changes in product meanings.
Drawing on cognitive and behavioural sciences, the level of absorptive capacity is linked to
prior related knowledge and skills (Harvey et al., 2010). Absorptive capacity is path
dependent by means past activities and accumulated experiences (i.e. with the targeted
markets and/or technologies), which influence the ability to acquire and absorb external

103
knowledge and the relevant information required to seize an opportunity for idea generation.
The path dependency evolves over time as the cognitive processes are cumulative and
idiosyncratic (Broring et al., 2006; Cohen & Levinthal, 1990; Zahra & George, 2002). Thus,
absorptive capacity helps to further increase the broad range of loosely related knowledge
(breadth) required during the front end of market-driving innovation. The breadth or
diversity of knowledge and divergent thinking may give rise to creativity, allowing linkages
between what is already known and novel associations (Cohen & Levinthal, 1990).
The level of creativity is a vital factor in the creation of breakthrough ideas (Bertels et al.,
2011; Da Silva & Davis, 2011). The nature of market learning at the front end of
breakthrough innovation is inherently explorative, which explains the behavioural
phenomenon of “insight” (Bertels et al., 2011; Cohen & Levinthal, 1990; March, 1991).
Tacit knowledge or an insight is a central stock at the front end of innovation where
activities such opportunity recognition, idea generation and concept definition are conceived
(e.g. Khurana & Rosenthal, 1998; Koen et al., 2002; Koen et al., 2001; Montoya-Weiss &
O'Driscoll, 2000; Reid & de Brentani, 2004). This type of knowledge is essential for dealing
with uncertainty and the extraordinary requirements for creativity (Bertels et al., 2011). In
this respect, creative capacity and absorptive capacity are relatively similar in the
psychology literature (Cohen & Levinthal, 1990).
Previous research has also supported the significance of intuition at the idea and concept
screening stages of the NPD process (e.g. Hart, Hultink, Tzokas & Commandeur, 2003).
Stevens, Burley, and Divine (1998, 1999), for instance, explained that individuals with high
intuition and thinking can evaluate and make decisions about project selections better than
individuals with low intuition. This is particularly the case for highly innovative, market-
driving ideas when much of the information is not readily available to support rational
decision making (evaluation) (O'Connor, 2008). The traditional evaluation tools and
techniques such as financial measures have been shown as unsuitable for market-driving
innovation. Other techniques such as risk options theory and future cash flow have only
recently emerged and there is no consensus in terms of which technique is best to evaluate
market-driving innovation (Koen et al., 2002).
In fact, intuition is a non-logical mental process that is known to support creativity,
innovation and foresight (Sadler-Smith, Hodgkinson & Sinclair, 2008). It is rapid, non-

104
conscious and essential in high speed decision making (Cunha, 2007; Dane & Pratt, 2007).
Intuitive decision making involves the ability to quickly perceive, reconstruct and classify
unstructured or complex problems without imposing rational or logical thinking (Allinson,
Chell & Hayes, 2000; Alves, Marques, Saur & Marques, 2007; Ben & Cruz, 2009; Dane &
Pratt, 2007; Sadler-Smith & Shefy, 2004). A firm’s exposure to external knowledge in its
environment also affects the quality of its decision making (Kostopoulos et al., 2011; Zahra
& George, 2002). Often NPD team members make intuitive decisions by seeing the
solutions with no conscious ability to describe their vision for breakthrough innovation but
with a compulsion to pursue it (Goffin & Koners, 2011; Mascitelli, 2000). Polanyi (1966)
stated that “we can have a tacit foreknowledge of yet undiscovered things” (p.23).
Further, the development and deployment of absorptive capacity as dynamic capability
require enough experience to store tacit organisational knowledge in new patterns of activity
in known routines and processes. Such capabilities allow firms to take on the newly
acquired information and reconfigure capabilities to transform them into knowledge useful
for breakthrough innovation, particularly at the front end of the development process. Lane
et al. (2006) stated that the magnitude of innovation could have implications for future
absorptive capacity; a revolutionary innovation is likely to create absorptive capacity in
valuable new areas” (p.850).

105
2.6.3 Section Conclusion
This section of the literature review has identified a firm’s absorptive capacity (ACAP) and
its subsets of potential absorptive capacity (PACAP) and realised absorptive capacity
(RACAP), and market visioning competence (MVC) and its resultant market vision (MV) as
the emerging critical success factors at the front end of market-driving innovation. While
much progress has been made in increasing the understanding of the general management
processes of developing market-driving innovation, research on the front end of market-
driving innovation remains a gap in the literature, especially during the stages where
breakthrough ideas are generated and evaluated for potential development and
commercialisation.
This research seeks to incorporate ACAP (PACAP and RACAP), MVC and MV factors and
their associated dimensions based on the RBV of the firm and dynamic capabilities theory.
The process of visioning (MVC/MV) is important for managing the “upstream creative
challenge” as the ability of individuals and NPD teams to link new ideas or technologies to
future market opportunities (MVC) can lead to the creation of potentially successful future
market applications/product-market options (MV), thereby influencing the front end success
of market-driving innovation (Koen et al., 2002; Kumar et al., 2000; Reid & de Brentani,
2010). At the organisational level, ACAP, an organisational dynamic learning capability,
involves routines and process by which firms acquire, assimilate, transform and exploit
knowledge” (Zahra & George, 2002, p.186), especially for NPD and innovation. It therefore
has an implication for idea generation and evaluation at the front end of market-driving
innovation (Cantner & Pyka, 1998; Lane et al., 2006). Lindgren and O'Connor (2011, p.789)
stated that:
The sources of ideas, the skills of the actors early in the project, the processes
utilized in the early stages and the screening criteria for radical innovation
projects are markedly different than those utilised for incremental innovations.
And yet, studies are equivocal.
The next section further assesses the emerging front end success factors – ACAP, MVC and
its resultant MV – and hypothesises potential relationships. As these factors are expected to
influence the front end and final success of market-driving innovation, a conceptual model
that captures the proposed hypotheses is also developed for this research.
106
2.7 Conceptual Model and Hypotheses Development
The previous section identified market visioning competence (MVC) and its resultant
market vision (MV) as the critical front end success factors for market-driving innovation,
thus influencing the front end of the NPD effort (Reid & de Brentani, 2010). Furthermore, if
both MVC and MV are important, it is similarly important to understand what might be
antecedents to these factors. Absorptive capacity (ACAP) has emerged as an organisational
dynamic learning capability and is related to the front end and final success of market-
driving innovation.
This leads to the main research question of this research as:
To what extent does a firm’s absorptive capacity, market visioning competenceand its resultant market vision influence the firm’s success at developing
market-driving innovations?
Firstly, this section examines and hypothesises the key relationships between a firm’s
ACAP and MVC and between MVC and MV at the front end of market-driving innovation.
Secondly, the performance consequences of MV, that is, the before-launch stage
performance and the post-launch stage performance, are examined, including the
relationships among these performance outcomes and their relationships to financial
performance. Thirdly, some characteristics that might influence the impact of MV on the
before-launch stage and the post-launch stage performance outcomes are considered. These
include the external environment, the degree of rigidity inherent in the NPD process and the
firm size (number of employees). The section concludes with the development and
presentation of the conceptual model and the summary of the research hypotheses of this
research.

107
2.7.1 Absorptive Capacity as an Antecedent to Market VisioningCompetence
At the broader organisational level, absorptive capacity (ACAP) and its subsets of potential
and realised absorptive capacities (PACAP and RACAP, respectively) have a high
likelihood of being significant antecedents to market visioning competence (MVC) at the
NPD program level of the front end of market-driving innovation. The definition of MVC in
this study, previously extended to capture both radical and really new innovations, is “the
ability of individuals or NPD teams in organisations to link new ideas or advanced
technologies to future market opportunities”. By definition, MVC captures the dynamic
learning capabilities of individuals and of the organisation in which they participate (Reid &
de Brentani, 2010). In view of that, ACAP refers to general organisational routines and
learning processes that allow firms to refine, extend and leverage existing competencies,
technologies and knowledge for new product development (Kostopoulos et al., 2011; Zahra
& George, 2002).
The subsets of ACAP (PACAP and RACAP) are expected to play different roles in terms of
influencing MVC at the front end of market-driving innovation. On one hand, PACAP is the
main source of market-driving ideas (Chen et al., 2009). PACAP involves acquisition and
assimilation of knowledge – the capabilities of a firm to obtain and process externally
acquired knowledge. Acquiring outside sources of knowledge and information about
markets, technologies, competitors and resources, and translating that knowledge into a
product design and strategy is critical for new product success, especially at the front end of
market-driving innovation (de Brentani & Reid, 2012). On the other hand, RACAP is the
main source of performance improvements (Zahra & George, 2002). RACAP involves
transformation and exploitation of knowledge – the capabilities of a firm to develop and
refine existing routines that facilitate the combination of existing knowledge with newly
acquired/assimilated knowledge generated through PACAP (transformed knowledge) and to
exploit this transformed knowledge to develop innovative products for commercial purpose
(Cantner & Pyka, 1998; Zahra & George, 2002).
Therefore, ACAP and its subsets could potentially help to facilitate the individual and
organisational dimensions of MVC. These are described in detail below.
108
The Influence of ACAP on the Organisational Dimensions of MVC
Proactive Market Orientation (MO)
As previously described, proactive market orientation focuses on providing solutions to the
unarticulated and/or latent needs of customers. New market information gained from the
external environment through PACAP may translate into the discovery of new needs of
customers, rather than following current demands or existing needs of customers. Linking
existing knowledge with newly acquired knowledge, as occurs through RACAP, may create
new insights that enable individuals or NPD teams to incorporate solutions into new
products.
Market Learning Tools (ML)
PACAP may facilitate the use of market learning tools in terms of analysing and planning
for future product and technology scenarios. Identifying, analysing and interpreting
externally acquired knowledge through PACAP may translate into technology opportunity
and visioning for several potential markets, seeing both short-term and long-term
opportunities for a given idea or technology. In addition, RACAP involves a firm’s
capability to work more effectively by regularly reconsidering ideas or new technologies
and adapting them according to new knowledge. This could also support the decision-
making process in terms of choosing which market to pursue.
The Influence of ACAP on the Individual Dimensions of MVC
Networking (NW)
Boundary spanners are at the centre of “the knowledge network” made up of a variety of
people with different backgrounds. As previously described, they are people who deal with
organisationally relevant tasks at the border of a firm and stimulate the flow of new
innovation-related information and ideas from the external environment to the firm
(information search).
The boundary-spanning role is dependent on pattern recognition at the individual level in
terms of directing information search, and in identifying and understanding patterns and

109
new ideas (using intuition) in their environment (Kuhn, 1962; Roos, 1996). An individual’s
perception or recognition of an idea and/or information pattern is dependent on the sources
of the environment, the interaction between internal and external people and the individuals
themselves. de Brentani and Reid (2012, p.75) stated that:
The greater the discontinuity of an innovation, the higher the level of
complexity, the greater the difficulty to observe, try out, and have a compatible
context for understanding its relevance or benefits and, thus, to recognize it as
a pattern in the environment.
Individuals have limited capacities and find it difficult to perceive, understand and make
decisions with respect to new information in the case of breakthrough innovation. They
often need to acquire more information by continuing to interact with external network
contacts, which results in “multiple waves of opportunity recognition” during early pattern
recognition (O'Connor & Rice, 2001, p.109). Each individual also varies in their ability to
discern new patterns in the environment. It is therefore important for firms to manage the
individual pattern recognition and resultant decision initiatives associated with breakthrough
innovation (de Brentani & Reid, 2012).
With respect to PACAP as an organisational capability is likely to influence the pattern
recognition ability of individuals in that the more information patterns and concepts a
person has acquired and assimilated as prior related knowledge, the more readily can that
person recall and use the information in new and complex settings (Cohen & Levinthal,
1990). The development of knowledge processing and routines through PACAP could
potentially benefit boundary spanners in terms of broadening their thinking and allowing
them to draw on new and diverse knowledge about product application situations. Thus,
PACAP is likely to influence the ability of boundary spanners to recognise new
opportunities quickly and to effectively analyse and interpret the information they have
obtained before moving the new information across the boundary interface and connecting
the firm with external environment aspects (de Brentani & Reid, 2012).
Furthermore, PACAP emphasises the importance of searching for relevant information both
within and beyond the industry and communicating ideas and concepts quickly across
departments to exchange information on new developments and to solve problems. This is
likely to generate broad networks of people from different backgrounds (e.g. different

110
industries, different functions) both within and outside the firm, thus supporting the role of
boundary spanners. In addition, the ability to structure and apply collected new knowledge
to practical work as well as to make it available for further purposes, through RACAP, may
stimulate boundary spanners to collect additional information and ideas from external
sources in order to make the information more useable and meaningful.
Idea driving (ID)
The routines and processes developed to analyse, interpret and understand externally
acquired knowledge through PACAP may enable “champions” to actively and
enthusiastically drive new ideas, draw attention to opportunities internally and overcome
resistance to uncertainty during the early phase of the NPD process. Further, RACAP
reflects management support of the development of new products including product
prototypes. This enables champions to secure the required support from senior
management/key decision makers early and to share information quickly.
In summary, ACAP and its subsets PACAP and RACAP are related to MVC at the front end
of the NPD effort for market-driving innovation. The relationships between these constructs
occur during idea generation/exploration and evaluation stages of the front end phase. These
stages of the front end are also referred to as the boundary and gating decision-making
interfaces (prior to project interface) (Reid & de Brentani, 2004) and can also be referred to
as pre-phase zero (preliminary opportunity identification) (Khurana & Rosenthal, 1998).
The idea generation stage begins with information flowing from the external environment
through PACAP to boundary spanners or other individuals (as reflected in the networking
dimension of MVC), who investigate the meaning of the information by translating “that
something is” to “what something is”. After the idea generation stage, the evaluation
process begins through RACAP. This is where the information flows from gatekeepers (as
in the idea-driving dimension of MVC), who evaluate the value of externally acquired
information by translating “what something is” to “what something means” and then share it
with other organisational members (de Brentani & Reid, 2012, p.71). de Brentani and Reid
(2012, p.72) stated that “the way in which information flows are managed, or ‘transformed’
into products, during the FFE can profoundly impact their effectiveness and ultimately the
success of the firm in developing and marketing new-to-the-world products”.

111
ACAP and its subsets PACAP and RACAP are expected to facilitate the creation and
successful implementation of market-driving ideas into products (Da Silva & Davis, 2011).
The higher the level of absorptive capacity, particularly PACAP, the higher the level of
business performance in terms of creating new product ideas (Tsai, 2001). Further RACAP
could potentially shape the entrepreneurial mindset/action of the individuals or the NPD
teams, facilitating new insights and opportunity recognition in MVC. PACAP and RACAP
coexist at all times. They are separate entities but have complementary roles that enable
firms to capitalise on changing environmental conditions and strategic changes by
leveraging organisational resources and capabilities for NPD and innovation (Zahra &
George, 2002). New knowledge or a market-driving idea must first be acquired and
assimilated before it can be transformed and exploited into an innovative product that
recognises the needs of a future market. In the same vein, firms might be efficient in
acquiring and assimilating knowledge but lack the capabilities to transform and exploit that
knowledge into a future product-market. Hence, firms that focus on developing both subsets
of ACAP have a high likelihood of linking new ideas or advanced technologies to future
market opportunities (MVC). The significance of ACAP overall and its subsets PACAP and
RACAP can be argued to be during the idea generation/exploration and evaluation stages
(the front end) of market-driving innovation and its result of MVC.
The discussion in this section leads to the following hypotheses.
H1a: ACAP has a significant and positive impact on MVC.
H1b: PACAP has a significant and positive impact on MVC.
H1c: RACAP has a significant and positive impact on MVC.
112
2.7.2 Market Visioning Competence and Market Vision
Market Visioning Competence (MVC) - the relationship factor of Market Vision (MV)
Based on the RBV of the firm and dynamic capabilities, MVC has the ability to influence
MV at the front end of the NPD effort for market-driving innovation. The relationship
between the two factors occurs during the idea evaluation/selection stage of the front end
phase. This stage of the front end of innovation is also referred to as the gating interface or
phase zero to phase one in terms of moving a product concept forward to feasibility/project
planning (Khurana & Rosenthal, 1998; Reid & de Brentani, 2004). As previously stated, the
evaluation process begins after the idea generation phase where externally acquired
information is translated in order to move from understanding “what something is” to “what
something means” (de Brentani & Reid, 2012, p.71), as reflected in MVC. The meaning and
value of the newly created knowledge or the emergent MV is assessed for business and
technical feasibility. The outcome of idea evaluation/selection is a decision to approve or
reject the MV. If approved, MV moves to the project interface where it becomes a project
vision (Broring et al., 2006; de Brentani & Reid, 2012).
Following Reid and de Brentani (2010), MVC comprises “a set of capabilities that enable
the linking of advanced technologies to a future market opportunity” (p.500). This results in
MV, that is, “a clear and specific mental model or image that organizational members have
of a desired and important product-market for a new advanced technology” (p.500).
Specifically, the combined impact of the MVC dimensions (MO, ML, ID and NW) results
in effective MV which comprises both intrinsic and extrinsic dimensions. The key elements
of effective MV, as previously described, are form (product design, product concept and
product in use), scope (target market and target magnitude), magnetism (how the inherent
value of the vision infuses into the firm), clarity (well-articulated, easy-to-understand target)
and MV specificity (specific and tangible to direct organisational members). The literature
has suggested that MVC dimensions allow organisational members to learn quickly from
the environment and use ideas stemming from early technology development to create a
shared mental model of future product-market or effective MV of a radically new product.
This study broadens the perspective of MVC–MV to the NPD program level and proposes
the relationship in the context of market-driving innovation. Market-driving innovation, as
113
defined in this research, captures both radical and really new innovations. The perspective
of the MVC and MV factors is not limited to the exploration of new technologies but is
extended to include new product ideas that are able to transform existing markets or create
new ones. MVC, in this study, is “the ability of individuals or NPD teams in organisations
to link new ideas or advanced technologies to future market opportunities”. It is therefore
expected to result in knowledge, insight and foresight of a radically or really new product
(MV), that is, “a clear and specific early-stage mental model or image of a product-market
that enables NPD teams to grasp what it is they are developing and for whom”. Because
exploratory learning is an underlying process of MVC, this factor has a high likelihood of
influencing the environment by initiating disruptive variance through effective selection of
best markets and moving quickly to shared mental models of future markets, and hence
resulting in effective MV of a radically new or really new product.
The discussion in this section leads to the following hypothesis:
H2: MVC has a significant and positive impact on MV.
2.7.3 Performance Consequences of Market Vision
2.7.3.1 Before-Launch Stage Performance
Ensuring the “right” selection of MV at the front end of the NPD is critical as it influences
the specific focus of the NPD process and ultimately its likelihood of success (Cooper,
1993, 1996; Murphy & Kumar, 1997). MV emerging from the front end of innovation
determines the activities in the development phase or NPD execution. Accordingly, MV is
the first major strategic decision in product development and can strongly influence the
overall process of NPD, innovation performance and a firm’s competitive advantage
(Calantone, Chan & Cui, 2006; Langerak, Hultink & Robben, 2004). In particular, MV is
expected to have a positive influence on the front end or “early performance” (Reid & de
Brentani, 2010), also referred to as before-launch stage performance.
Based on the literature review on the front end outcomes of market-driving innovation,
before-launch stage performance (BLSP) in this study captures two dimensions – product-
114
related and customer-related – as the outcome measures of MV, namely, breakthrough
integrity (BI) and early success with customers (ESC), respectively (Reid & de Brentani,
2010, p.507). The review of the literature on NPD success measures has suggested that the
traditional measures are based on standard post-launch metrics, which appear to be
irrelevant at the front end of the NPD process (O'Connor, 1998; O'Connor et al., 2008). In
taking both breakthrough integrity and early success with customers as measures, BLSP in
this study refers to the extent to which a clear and highly innovative concept of a potential
new product is maintained after it enters the development and commercialisation phases of
being satisfied and accepted by early customers (Clark & Fujimoto, 1991; Reid & de
Brentani, 2010; Seidel, 2007).
The key challenge of developing market-driving innovation is the ability to maintain the
highly innovative product concept from the front end through to launch (“breakthrough
integrity”); this is likely to be achievable through effective MV (Reid & de Brentani, 2010).
The inherent uncertainty and unforeseen challenges at the front end of market-driving
innovation may influence NPD team members to shift or adapt the original product concept.
This is often the situation in market-driven firms that listen closely to their customers.
Christensen (1997) stated that “we cannot expect our customers to lead us toward
innovations that they do not now need” (1997, p.258). The highly innovative concept of a
potential new product often becomes “dumbed down” or led astray by the customers
(Deszca et al., 1999; Wind & Mahajan, 1997). Concept shifting may also cause a lack in
vision clarity and lead to a delay in coordinating decisions and confusion among team
members (Lynn & Akgün, 2001; Seidel, 2007). In this respect, MV is a clear and specific
image of a radical or really new innovation (vision/goal) that enables NPD teams to grasp
what it is they are developing and for whom even in the early stages of the development
process. Thus, the emergent MV has a high likelihood of being validated and translated into
a highly innovative product concept, moving through to development and into
commercialisation (Kim & Wilemon, 2002b; Koen et al., 2001; O'Connor et al., 2008).
Seidel (2007) supported that “the maintenance of an original concept as a deferred goal
allows the team to maintain momentum and commitment to broad objectives, even in the
face of underlying concept shifting” (p.531). The significance of MV can therefore be
argued to influence breakthrough integrity, thereby avoiding the customer’s short-term and
current experience bias.

115
This study also captures “early success with customers” (ESC) as an outcome measure of
MV. At the NPD project level, Reid and de Brentani (2010p. 507) described effective MV
as fulfilling ESC, that is, “satisfaction and acceptance of a new product idea” by early
customers, in the case of radical innovation. At the NPD program level analysis, ESC in this
study refers to the degree to which “early customers are satisfied and readily accept
breakthrough innovations even prior to their formal launch”. Accordingly, an effective MV
focuses on reshaping and delivering customer value and benefits. The clarity and specificity
dimensions of an effective MV allow a firm to move towards the shared vision of the future
quickly. Form facilitates the product concept that offers to meet the ahead-of-the-trend
needs and wants of potential customers. Magnetism attracts NPD members and others in the
firm towards the same goal of impacting on the most profitable and the most important,
largest target market (scope). Thus, the MV of a radical or really new innovation that is
magnetic, clear, specific and with the right form and scope can maximise the effect on ESC.
The discussion in this section leads to the following hypothesis:
H3: MV has a significant and positive impact on before-launch stage performance.
2.7.3.2 Post-Launch Stage Performance
In recent studies in product development, competitive advantage has been used as the most
strategically useful construct for performance-based success, particularly for market-driving
innovation or new-to-the-world products (e.g. Bertels et al., 2011). A review of the literature
has suggested that competitive advantage can be viewed from both strategic (non-financial)
and financial dimensions, which is consistent with the RBV and dynamic capabilities
theory. Noting that superior financial returns for market-driving innovation can only be
expected in the long term (Chandy & Tellis, 2000), the short-term strategic dimensions are
considered to be easily determined post-launch performance measures for market-driving
innovation (Kleinschmidt et al., 2007).
This study captures two dimensions of post-launch stage performance (PLSP) as the
strategic outcome measures (process- and firm-related) of MV, namely, speed-to-market
(STM) and windows of opportunity (WO). In taking both STM and WO as outcome

116
measures of MV, PLSP in this study refers to “the speed at which breakthrough innovations
are moved to market and ultimately open new markets, product or technological arenas” (de
Brentani et al., 2010; Lynn et al., 1999b). de Brentani et al. (2010) supported the use of
STM and WO as the outcome measures in their finding of a significant positive impact of a
global presence strategy entailing vision on NPD program performance in terms of time-to-
market and windows of opportunity.
STM is a strategic measure related to efficiency and ultimately competitve advantage
(Millson et al., 1992). In general, STM measure relates to the time elasped between idea
generation and formal product launch (Kessler & Chakrabarti, 1999; McNally et al., 2011).
STM has been shown to positively result in an edge over competitors, a first mover
advantage. In a similar vein, several studies have suggested that STM has an important role
in successful NPD, particularly in high-tech industries (de Brentani & Reid, 2012).
However, some scholars and practitioners have disregarded the notion of a positive
relationship between accelerated product development (speed) and new product success
because of the likelihood of increased mistakes and increased development and
commercialisation costs (Crawford, 1992). Thus, it is critical to understand what could be
an antecedent to STM.
Effective MV has a high likelihood of positively influencing STM. A number of empirical
studies have highlighted the importance of product vision in accelerating the development
process (e.g. Lynn & Akgün, 2001; Lynn, Akgün & Keskin, 2003; Lynn et al., 1999b).
Effective MV, comprising its dimensions of clarity, specificity and magnetism, can attract
and clearly signal to NPD members to work efficiently and move quickly towards
development goals. An empirical study by Lynn et al. (1999b) found that vision creates a
psychologically safe environment for NPD team members to understand the development
goals. Song, Montoya-Weiss, and Schmidt (1997) empirically found that sharing common
goals, vision and strategy can make teamwork more collaborative and efficient. Lynn and
Akgün (2001), in a case-based study comparing and contrasting successful and unsuccessful
NPD projects, suggested that unsuccessful new products are those ones without clear
visions. An unclear product-market vision may cause uncertainty and conflict about what is
to be developed, resulting in time-consuming readjustments and debates, and delaying the
new product development (Dyer, Gupta & Wilemon, 1999a, 1999b; Kessler & Chakrabarti,
1996). Therefore, effective MV is needed in the early, pre-project stages of market-driving
117
innovation so that the new product can be developed and launched on or ahead of the
original schedule developed at the initial project go-ahead.
Further, effective MV has a high likelihood of influencing “windows of opportunity” (WO)
performance. WO is another strategic dimension of PLSP and in this study refers to the
extent to which “market-driving innovations opened a window of opportunity on a new
category of products or on a new market for the firm” (Cooper & Kleinschmidt, 1987a,
2000; Knight & Cavusgil, 2004; Salomo et al., 2010). A clearly defined vision provides
important mindset for firms to explore unique market and product opportunities. MV, as a
result of MVC, creates future business potential, an opportunity window for firms to enter
new markets (WO) or new product development activities. Consequently, firms are more
likely to take advantage of the pioneering opportunities that enable them to leap forward and
achieve a competitive advantage (Cooper & Kleinschmidt, 1986; Zou & Cavusgil, 2002).
The discussion in this section leads to the following hypothesis:
H4: MV has a significant and positive impact on post-launch stage performance.
2.7.4 Market-Driving Innovation Performance
Based on the review of commonly used NPD performance measures, the existing measures
of new product success are deemed inadequate for capturing the complete performance of
market-driving innovation. Researchers have often used performance measures as
independent dimensions such as product-related (product performance), customer
acceptance (customer based), process-related (speed-to-market), firm-related (new
opportunities for new products) and financial related aspects (profitability, return on asset-
investment) (Griffin & Page, 1993; Langerak et al., 2004). Further, Kahn (2001) categorised
the measures of general product development performance by pre-launch and post-launch
activities.
This study examines relevant performance dimensions in NPD studies for the purpose of
setting up a more complete performance measure of market-driving innovation. Several
dimensions based on the key non-financial and financial outcomes are primarily drawn from

118
existing studies of market-driving innovation (e.g. Clark & Fujimoto, 1991; Cooper &
Kleinschmidt, 2000; Griffin & Page, 1996; Knight & Cavusgil, 2004; Reid, 2005). This
results in a set of product innovation performance dimensions, categorised by a different
time horizons, to measure the front end success and the final success of market-driving
innovation (Cordero, 1990; Utterback & Abernathy, 1975).
Market-driving innovation performance (MDIP), in this study, refers to the extent to which
“a clear and highly innovative concept of a potential new product is maintained after it
enters the development phase of being satisfied and accepted by early customers, and
quickly moves into commercialisation, opening a new market or product/technological
arena and ultimately generating financial returns”. By this definition, MDIP captures the
success of market-driving innovation in terms of:
Before-launch stage performance: breakthrough integrity and early success with
customers
Post-launch stage performance: speed-to-market and windows of opportunity
Financial performance
The following section discusses the relationships between the before-launch stage
performance and the post-launch stage performance and their influences on financial
performance outcomes.
In line with RBV and with the empirical results in NPD research, there is an implied
relationship between before-launch stage performance (BLSP) and post-launch stage
performance (PLSP). A highly innovative product concept accepted by customers is likely
to speed up the entire process and be translated into a market-driving innovation, thereby
opening up a new market or a new product or technological arena (Kim & Wilemon, 2002a;
O'Connor et al., 2008). BLSP and PLSP are seen as antecedents to the overall financial
performance. Financial performance (FP) is the extent to which “breakthrough innovations
meet their sales (value/volume) and profit objectives relative to the resources invested in
them” (Kleinschmidt et al., 2007). At BLSP, early acceptance of a breakthrough innovation
by customers can stimulate sales and product adoption by other customers. Maintaining
breakthrough integrity ensures the delivery of a superior product to the marketplace, and
thus is likely to influence the firm’s long-term products advantage (Henard & Szymanski,
2001) and ultimately its financial performance (Calantone et al., 2006; Song & Parry, 1996).
119
At PLSP, both speed-to-market and windows of opportunity are likely to be antecedents to
financial performance. Speed-to-market is important for new product success, particularly
for the development of market-driving innovations in high-tech industries (de Brentani &
Reid, 2012). Fast paced development and commercialisation may result in firms achieving
first-mover advantage (Kerin, Varadarajan & Peterson, 1992), which in turn may have a
significant and positive impact on the firm’s overall financial performance (Calantone et al.,
2006; de Brentani et al., 2010; Langerak & Hultink, 2005). Additionally, firms involved in
new product development activities, specifically new market entries, can generate financial
returns by creating future exigencies. Empirical studies on global NPD program
performance support this contention that speed-to-market and windows of opportunity have
strong and positive effects on financial performance (e.g. de Brentani et al., 2010;
Kleinschmidt et al., 2007).
The discussion in this section leads to the following hypotheses:
H5: Before-launch stage-performance has a significant and positive impact on post-launch
stage performance.
H6: Before-launch stage-performance has a significant and positive impact on financial
performance.
H7: Post-launch stage-performance has a significant and positive impact on financial
performance.
120
2.7.5 Proposed Moderation Effects
Both the external and internal structural factors of the firm are considered to have
moderating effects on the emergent MV and BLSP/PLSP outcomes. Li and Atuahene-Gima
(2001) explained the need to investigate these moderating factors in examining product
innovation strategy and the performance of new technology investments. A recent study
highlighted the importance of factoring in a firm’s competitive environment and its internal
environment as moderators on MVC, MV and performance paths (Reid & de Brentani,
2012). Accordingly, this study has determined that the relevant moderating factors in terms
of their effects on the relationships between MV and BLSP/PLSP outcomes, which are: a
firm’s external environment, the degree of rigidity inherent in the NPD process (NPDR) and
firm size.
The following sections discuss each of these moderating factors and their influences on MV
and BLSP/PLSP outcomes in more detail.
2.7.5.1 External Environment
Many studies have reported the moderating effect of environmental variables on product
innovation performance (new product success and failure) (e.g. Li & Atuahene-Gima, 2001;
Yap & Souder, 1994). Environmental factors have been considered as moderators on the
effectiveness of different strategic choices or orientations in new product development
studies (e.g. Jaworski & Kohli, 1993; Lukas & Ferrell, 2000; Zhang & Duan, 2010). The
three commonly used external environmental factors in the NPD studies are: (1) competitive
intensity, (2) technological turbulence and (3) market turbulence. Competitive intensity
(CI), in this study, refers to the environment where competition in an industry is very high,
indicated by activities such as promotion wars and price matches. Technological turbulence
(TT) refers to the environment where there is a rapid change of technology in an industry
that may provide opportunities for firms to develop new product ideas through technological
breakthroughs. Market turbulence (MT) refers to the environment where customers’ product
preferences or demands change frequently and new customers have different product-related
needs from existing customers (Jaworski & Kohli, 1993).
121
The external environment (EE) is particularly related to the very early decisions made by
NPD teams at the front end of developing breakthrough innovation. As previously
discussed, EE is the main source of new ideas for breakthrough innovation. New ideas are
often initiated from outside the firm beyond its existing industry through both individuals
and organisational level processes (Reid & de Brentani, 2004). Firms need to engage in the
pursuit of information regarding new technology and market adoption patterns to generate
new ideas and support decision making (Dröge, Calantone & Harmancioglu, 2008). A
firm’s competence to obtain, share and use market information (market intelligence) is
considered a strategic asset that enables the firm to possibly alter the competitive dynamics
(Li & Calantone, 1998).
In an environment of technological turbulence (TT) and market turbulence (MT), acquiring
and evaluating very new or radical market information, analysing technology opportunities
and determining product-technical specifications and the demand for certain product
characteristics can be difficult (Zhang & Doll, 2001). Comprehensive information is often
not readily available and the decision making process for breakthrough innovation is likely
to be much slower and more difficult than for incremental innovation (O'Connor, 2008). The
changing needs of customers and their inability to visualise and articulate needs may also
increase the difficulty of developing radically new or really new products that would create
early customer acceptance/satisfaction (ESC) (Mullins & Sutherland, 1998). Such products
introduced into markets with a high degree of market uncertainty may lead to market failure
because the opening of windows of opportunity (WO) often falls short (Zhang & Doll,
2001). Thus, high technological turbulence and market turbulence are likely to increase the
overall risk and uncertainties of investing in new product development, particularly for
breakthrough innovation (March, 1991).
Further, high levels of competitive activity (CI) may create uncertainties and difficulty for
firms in terms of targeting a competitive situation and becoming a leading innovator (Zhang
& Doll, 2001). CI implies a large number of players in the industry or a low industry
concentration (Robinson, 1988). Many industry players in the marketplace intensify market
uncertainties and the likelihood of a firm’s losing its competitive position (Jaworski &
Kohli, 1993; Kohli & Jaworski, 1990; Slater & Narver, 1994). In fact, firms often focus on
protecting the “tyranny of the served market” when facing competitive threat and pressures
(Hamel & Prahalad, 1994a). Environmental threats may discourage a firm from taking

122
further risks and exploring new competencies, and instead facilitate dominant organisational
routines and the exploitation of existing resources and competencies. In so doing, they are
paying close attention to the needs of existing customers in established markets. This
organisational inertia prevents firms from experimenting with technological breakthroughs
or exploiting newly acquired knowledge into breakthrough innovation (Christensen, 1997;
Gilbert, 2005).
Accordingly, the external environmental factors of CI, TT and MT form turbulent
environments that may hinder the ability to translate MV into BLSP and PLSP outcomes.
Some authors may have argued that environmental dynamism enhances innovativeness and
radical innovation (e.g. Koberg, Detienne & Heppard, 2003; Zhang & Duan, 2010). The
dynamic conditions of the environment can create market uncertainties that force firms to
engage in radical innovative activities to survive (Brown & Eisenhardt, 1997). But turbulent
environments are, indeed, beyond a firm’s manipulative and direct managerial control, in
the short term, at least (Yap & Souder, 1994). Such conditions can amplify the level of
ambiguity and uncertainty associated with the development of breakthrough innovation,
particularly at the front end of the NPD process. These conditions may create difficulties in
speeding up the NPD process (STM), and may render obsolete a formal assessment system
for maintaining the breakthrough integrity (BI) of potential new products that are being
developed (Calantone, Garcia & Droge, 2003; Calantone, Schmidt & di Benedetto, 1997;
Iansiti, 1995; Wheelwright & Clark, 1992).
The discussion in this section leads to the following hypotheses:
H8a: The relationship between MV and before-launch stage performance is negatively
influenced by CI, TT and MT.
H8b: The relationship between MV and post-launch stage performance is negatively
influenced by CI, TT and MT.

123
2.7.5.2 NPD Process Rigidity
Several process models have been developed in attempts to structure the front end of
innovation (FEI) in spite of its inherent ambiguity and uncertainty (e.g. Cooper, 1988;
Khurana & Rosenthal, 1998; Murphy & Kumar, 1997). The key deliverable of the front end
stage is a clear product concept/definition that, once approved, translates into NPD
implementation (Verworn & Herstatt, 1999). A review of the product innovation literature
has suggested that Cooper’s stage-gate process is one of the most recognised models used to
structure the front end activities to reduce their fuzziness. The stage-gate process for FEI
involves four formalised sub-phases from idea generation to concept evaluation, and highly
structured gates which act as quality control or go/kill decision check points before moving
into the next stage (Cooper, 2008). Thus, there was some evidence that a formal NPD
process is positively linked to NPD outcome success (Bonner, Ruekert & Walker, 2002;
Schmidt & Calantone, 2002).
The relevance of a formal NPD process to breakthrough development is, however, the
subject of some debate in the literature on the front end of new product development. A
sequential, highly formalised approach has often been criticised as being inflexible or too
rigid and possibly harmful to creativity and breakthrough ideas (de Brentani, 2001).
Although different versions of stage-gate exist and it acknowledges the need for iteration
and within-stage feedback, the process primarily relies on market-driven NPD and
predetermined sets of routines and evaluation criteria (gates) that may not facilitate highly
innovative, breakthrough projects with their multitude of inherent risks and uncertainties
(Garcia, Calantone & Levine, 2003; Lynn & Akgün, 1998; Lynn & Green, 1998;
McDermott & O'Connor, 2002; Rice et al., 1998). The high market and/or technical
uncertainty involved at each gate creates no confidence for top managers in making an
informed go/no-go decision and resource commitments (Mullins & Sutherland, 1998). In
fact, some evidence has been found that too inflexible a process can result in a negative
performance effect (Kleinschmidt et al., 2007). And yet, there is no direct evidence that a
modified stage-gate NPD process can lead firms to increase new product launch of
breakthrough type products (Ettlie & Elsenbach, 2007).
Accordingly, this study conceptualises a highly formalised or inflexible stage-gate process
and clearly defined go/no-go decision points (gates) as “NPD process rigidity” (NPDR).

124
This type of NPD process model offers little scope to do things differently and rather
reinforces the status quo by solving customers’ existing problems or stated preferences in
current markets (Sethi & Iqbal, 2008). As such, the traditional short-term, cost-oriented
evaluation at sequential gates or NPDR is likely to hinder breakthrough developments
(Verworn & Herstatt, 2001). This negative influence can be argued to undermine the
effectiveness of MV’s impact on BLSP by reducing breakthrough integrity and early
success customers and the effectiveness of MV’s impact on PLSP outcomes by slowing
down the product-to-launch and shortening windows of opportunity.
The discussion in this section leads to the following hypotheses:
H9a: The degree of NPD process rigidity negatively influences the relationship between MV
and before-launch stage performance.
H9b: The degree of NPD process rigidity negatively influences the relationship between MV
and post-launch stage performance.

125
2.7.5.3 Firm Size (number of employees)
Firm size has been a subject of extensive and continuing research in terms of its effects on
innovation (Audretsch & Acs, 1991; Cohen, 1995; Scherer, 1991; Schumpeter, 1942). The
research outcomes, however, have been decidedly varied. On one hand, several researchers
have argued that large firms are at a disadvantage because they often respond to changes
more slowly, and are more bureaucratic and conservative in risk taking than small firms
(e.g. Ettlie, Bridges & O'Keefe, 1984; Gellman Research Associates, 1982; Globerman,
1975; Rothwell, 1978; Rothwell & Zegveld, 1982). Therefore, smaller firms are more likely
to develop breakthrough innovations. On the other hand, other researchers have suggested
that small firms are less innovative than large firms. This is because large firms have the
ability to research and develop breakthrough innovations in economies of scale. Through
economies of scale, the risks associated in developing breakthrough innovations can be
spread broadly, while greater financial support can be gained (Cohen, 1995; Scherer, 1992).
Breakthrough innovation involves high complexity, high cost and considerable risk in
business strategy (Treacy, 2004). This type of innovation requires an exploration in new
technologies and new markets, a large investment in new processes (production and R&D),
a long-term focus and long-time spans (Freeman, 1994). Thus, the costs of developing and
bringing a breakthrough innovation to market can be extremely high (Lynn et al., 1996). In
responding to all these requirements, large incumbent firms are often the ones who develop
breakthrough innovations rather than small start-ups (Ahuja & Morris Lampert, 2001; Hill
& Rothaermel, 2003). A large firm size implies that more functional areas and people are
involved in an innovative project. This could be beneficial in reviewing and monitoring the
progress of developing a breakthrough innovation given its high uncertainties and
ambiguities in design, production and marketing approaches (Green, Gavin & Aiman-Smith,
1995). Further, Mowery, Oxley, and Silverman (1996) argued that larger firms have more
accumulated knowledge, which can be assimilated into innovation through developed
routines and processes.
Accordingly, large firm size, through its “slack resources” (finance, people, and
accumulated knowledge) (Bower, 1970), is expected to positively influence MV to be
translated into BLSP and PLSP outcomes. The commitment of the resources required to
develop breakthrough innovations, particularly when the cost increases over the NPD

126
stages, is likely to increase the likelihood of maintaining breakthrough integrity, achieving
success with early customers, and speeding up the development process, thereby opening up
new markets or new product/technological arenas. Recent research by Reid and de Brentani
(2012, p.136) supported this contention that “large firms appear to be getting better at
radical innovation, and therefore, their size does not have as negative an impact on the
ability to move forward in the early stages of the radical process as was the case
historically”.
The discussion in this section leads to the following hypotheses:
H10a: Large firm size (number of employees) positively influences the relationship between
MV and before-launch stage performance.
H10b: Large firm size (number of employees) positively influences the relationship between
MV and post-launch stage performance.
127
2.7.6 Conceptual Model and Summary of Research Hypotheses
The conceptual model presented in Figure 2.9 sets out an interpretation of the literature
review and presents the proposed relationships, which will be tested in this research.
The resource-based view (RBV) of the firm as proposed in the dynamic capabilities
literature is the basic premise of this study. Accordingly, the assumption is that a firm’s
resources incorporating capabilities and competencies play a central role in achieving a
competitive advantage and successful innovation performance (Acur, Kandemir, de Weerd-
Nederhof & Song, 2010; Narvekar & Jain, 2006; Salomo et al., 2010). In line with the
literature, this study seeks to improve the understanding of the market-driving phenomenon
and visioning by extending the concept of Reid and de Brentani (2010) on market visioning
competence and market vision.
At the broader organisational level, the addition of absorptive capacity and its potential and
realised subsets is proposed as a dynamic learning capability, which influences the market
visioning competence (of individuals and NPD teams). Market vision results from market
visioning competence, and mediates the effects on before-launch stage performance and
post-launch stage performance. Before-launch stage performance, post-launch stage
performance and financial performance are conceptualised as market-driving innovation
performance. Further, the effects of market vision on before-launch stage performance and
post-launch stage performance outcomes are moderated by the external environment, NPD
process rigidity and firm size.
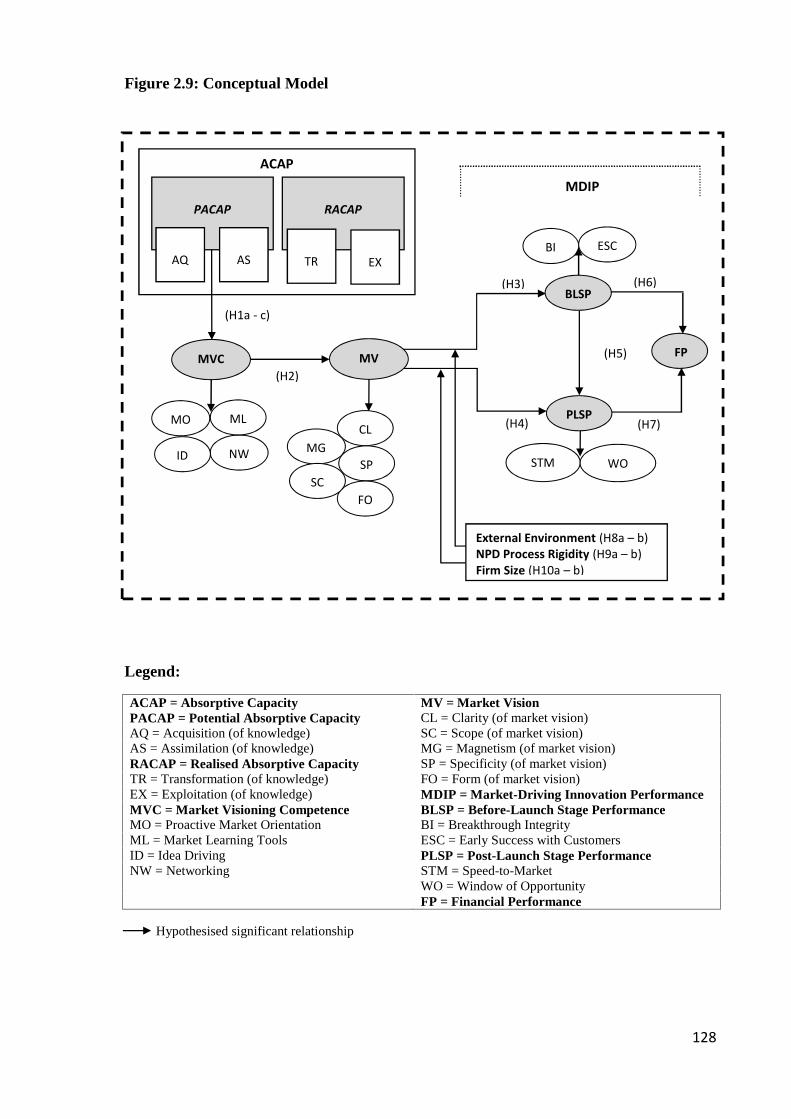
128
Figure 2.9: Conceptual Model
Legend:
ACAP = Absorptive Capacity MV = Market VisionPACAP = Potential Absorptive Capacity CL = Clarity (of market vision)AQ = Acquisition (of knowledge) SC = Scope (of market vision)AS = Assimilation (of knowledge) MG = Magnetism (of market vision)RACAP = Realised Absorptive Capacity SP = Specificity (of market vision)TR = Transformation (of knowledge) FO = Form (of market vision)EX = Exploitation (of knowledge) MDIP = Market-Driving Innovation PerformanceMVC = Market Visioning Competence BLSP = Before-Launch Stage PerformanceMO = Proactive Market Orientation BI = Breakthrough IntegrityML = Market Learning Tools ESC = Early Success with CustomersID = Idea Driving PLSP = Post-Launch Stage PerformanceNW = Networking STM = Speed-to-Market
WO = Window of OpportunityFP = Financial Performance
Hypothesised significant relationship
(H2)
(H7)
(H3)
(H4)
(H5)
(H6)
MDIPACAP
MVC
NWID
MO MLCL
SPMG
FOSC
PACAP
AQ AS
RACAP
TR EX
FP
BI ESC
STM WO
MV
External Environment (H8a – b)NPD Process Rigidity (H9a – b)Firm Size (H10a – b)
BLSP
PLSP
(H1a - c)

129
Summary of Research Hypotheses
The review of the literature results in the identification of the following research
hypotheses:
Absorptive Capacity as an Antecedent to Market Visioning Competence
H1a: ACAP has a significant and positive impact on MVC.
H1b: PACAP has a significant and positive impact on MVC.
H1c: RACAP has a significant and positive impact on MVC.
Market Visioning Competence and Market Vision
H2: MVC has a significant and positive impact on MV.
Performance Consequences of Market Vision
H3: MV has a significant and positive impact on before-launch stage performance.
H4: MV has a significant and positive impact on post-launch stage performance.
Market-Driving Innovation Performance
H5: Before-launch stage performance has a significant and positive impact on post-
launch stage performance.
H6: Before-launch stage performance has a significant and positive impact on financial
performance.
H7: Post-launch stage performance has a significant and positive impact on financial
performance.

130
Proposed Moderation Effects
H8a: The relationship between MV and before-launch stage performance is negatively
influenced by CI, TT and MT.
H8b: The relationship between MV and post-launch stage performance is negatively
influenced by CI, TT and MT.
H9a: The degree of NPD process rigidity negatively influences the relationship between
MV and before-launch stage performance.
H9b: The degree of NPD process rigidity negatively influences the relationship between
MV and post-launch stage performance.
H10a: Large firm size (number of employees) positively influences the relationship
between MV and before-launch stage performance.
H10b: Large firm size (number of employees) positively influences the relationship
between MV and post-launch stage performance.

131
2.8 Chapter Summary
This chapter has reviewed the relevant literature in product innovation and management
domains, particularly for market-driving innovation. The term “market-driving innovation”
was defined to capture both radically new and really new products. The review of the
common success factors of market-driving innovation suggested the front end of the
development process as the key area of focus. Noting the high uncertainty and ambiguity
found at the front end of market-driving innovation, market visioning (market visioning
competence/market vision) emerged as instrumental to maintain breakthrough integrity from
the front end of innovation through to commercialisation. Accordingly, the study has
reviewed the relevant literature to provide a coherent picture of what the emerging market
visioning entails, what its antecedents might be and what associations exist with market-
driving innovation performance. The assumption is based on the resource-based view of the
firm and dynamic capabilities literature.
The proposed key antecedents of market visioning competence and its resultant market
vision – absorptive capacity and its subsets potential and realised – were identified on the
strength of the literature review to conceptually and potentially operationally draw linkages
between the constructs. While previous studies have highlighted the importance of market
visioning and absorptive capacity, the understanding regarding their roles and the
relationships between these factors is limited, particularly at the front end of market-driving
innovation. It is expected that these factors have some influence on before-launch stage
performance and post-launch stage performance and ultimately on financial performance.
The relationships between these performance outcomes have also been identified. Further, it
is proposed that the external environment, NPD process rigidity and firm size are
moderators in the relationships between market vision and both before-launch stage and
post-launch stage performance outcomes.
This chapter concludes with a conceptual model illustrating the relationships among the
constructs based on the literature reviewed. A series of hypothesised relationships is
presented to form the foundation of a response to the research problem. The next chapter
provides a comprehensive discussion and justification of the research methodology and data
collection.
132
CHAPTER 3: RESEARCH METHODOLOGY
3.1 Introduction
The conceptual framework and the 15 hypotheses of this study were presented in Chapter 2.
From the review of the relevant literature, the key constructs and their relationships were
identified as the focus of investigation, the premise being that absorptive capacity, market
visioning competence and its resultant market vision influence market-driving innovation
performance.
This chapter discusses and justifies the research paradigm, design, methodology and data
analysis chosen to test the hypotheses and to develop and administer a measurement
instrument. The methodology adopted is quantitative research based on the theoretical
paradigm of positivism. The research design was conducted in two phases. Phase One is the
literature review and conceptual model development, as described in Chapter 2. Phase Two
consists of conclusive research using a cross-sectional descriptive study. The development
and administration of the questionnaire instrument for a web-based survey is described. The
chapter concludes with preliminary data examination and a description of the analysis
procedure, including sample characteristics of the survey respondents.
3.2 Research Paradigm
The philosophical approach or research paradigm provides a framework for academic
research (Proctor, 2005). The paradigm is “the basic belief system or world view that guides
the investigator, not only in choices of method but in ontologically and epistemologically
fundamental way” (Guba & Lincoln, 1994, p.105). There are two prevailing yet opposing
approaches of research paradigms in the social sciences: the phenomenological or
naturalistic (interpretivist) paradigm and the positivist paradigm (Evered & Louis, 1991;
Guba & Lincoln, 1994; Hussey & Hussey, 1997; Saunders, Jenkin, Derwent & Pilling,
2003; Weber, 2004). In addition to these paradigms, “realism”, also known as “critical

133
realism” (Hunt, 1991) and “post-positivism” (Denzin & Lincoln, 1994; Guba & Lincoln,
1994), is also suggested by contemporary researchers to bridge the views of the
interpretivist and the positivist approaches (Manicas & Secord, 1983; May, 1993; Stiles,
2003). Each of these research paradigms has various methodological implications and
traditions associated with its positions, assumptions and practices.
The philosophical paradigms are lenses for researchers to use different types of research
methodology. The two main types of research methods are quantitative and qualitative. The
qualitative method is fundamental to the interpretivist paradigm, whereas quantitative
research is aligned with the positivist paradigm (Connole, Smith & Wiseman, 1995; Denzin
& Lincoln, 1994). Positivism is formal and objective and is deductive in problem solving. It
advocates the standpoint of objective truth requiring empirical, tangible evidence,
observable and measureable facts or scientific investigation. Positivism therefore disregards
intangible, unobservable or unmeasurable evidence such as imagination, emotion, thoughts,
awareness and perceptions (Van Fraassen, 1980; Weber, 2004). In the view of positivism,
an investigation uses a quantitative approach, a common approach being survey
questionnaires for data collection and quantitative analysis (Evered & Louis, 1991). The aim
of the positivist approach is “to construct a set of theoretical statements that are
generalizable and service the development of universal knowledge” (Stiles, 2003, p.264).
In contrast, interpretivism or the qualitative approach is more informal and subjective and is
inductive in problem solving. This approach gains insights through the observation of
phenomena and subjective interpretation to obtain a comprehensive description and
explanation of a problem. It advocates that objective truth is less important because reality
can be analysed by exploring the richness, depth and complexity of phenomena.
Interpretivism presents subjective truth based on the study of the natural environment and
the effects on phenomena in the natural environment. Unlike the view of positivism, the
interpretivist approach thus “produces findings not arrived at by means of statistical
procedures or other means of quantification” (Strauss & Corbin, 1990, p. 17). By its nature,
the interpretivist approach promotes the value of qualitative data in the pursuit of
knowledge, to discover how things occur in reality and how people react to occurrences
rather than to make generalisations based on standard laws (Kaplan & Maxwell, 1994).
134
The realist approach uses mixed methods that include both qualitative and quantitative
methods (Healy & Perry, 2000). Qualitative approaches such as case studies and
unstructured or semi-structured in-depth interviews and group observation to gather
subjective information are acceptable in the paradigm of realism. The qualitative approaches
can be followed and reinforced with surveys, the results of extant research and statistical
analysis such as structural equation modelling, partial least squares or other techniques
(Bisman, 2002; Morgan, 2007; Perry, Alizadeh & Riege, 1997; Tashakkori & Creswell,
2008). This process of analysis, called “triangulation”, incorporates both subjective and
objective standpoints, reflecting inductive and deductive reasoning, respectively (Bhaskar,
1989; May, 1993; Morse, 2003).
The theoretical paradigm for this research is the positivist approach. The research aims to
understand the critical success factors influencing market-driving innovations at the front
end of the new product development process. Drawing from the literature review in Chapter
2, the research objective of the present study is:
to investigate the degree to which market visioning competence and market
vision influence the ability of a firm to develop and commercialise market-
driving innovations and, further, to examine the way in which absorptive
capacity acts as an antecedent to these factors.
The research objective captures the key constructs that emerged from the literature review.
These constructs have been defined and can be quantified as briefly described above. As the
hypotheses were presented in propositional form, as shown in the conceptual framework,
they are subjected to empirical tests to verify them.
3.3 Research Design
Developing an appropriate research design is fundamental for any research as it serves as
the blueprint that determines the choice of methodology and the actions necessary to address
the research problem (Sekaran, 2003). This involves a series of choices in relation to the
type of sample and data collection methods to be employed, and how the variables in the
questionnaire are to be measured, including scaling procedures and data analysis techniques.
135
The research design also identifies the time frame, the setting of the study and the unit of
analysis (Aaker, Kumar & Day, 2001; Churchill, 1995; Zikmund, 2000). The initial goal of
the research is to identify a strategy that will enable the project to achieve its established
objectives and answer questions by means of providing the logic that links the collected data
to the initial research questions (Churchill & Iacobucci, 2005; Malhotra, 2007).
The theoretical paradigm and the assumptions underlying qualitative or quantitative
methodologies provide guidance for the research design (Creswell, 1994). The research
design can be classified mainly as exploratory or conclusive research (Burns & Bush, 2008;
Malhotra, 2007). Accordingly, the research design of the present study comprises two
sequential approaches:
Phase One: Literature review
A literature review is required to gain information about the nature of the research problem
(Burns & Bush, 2009). This initial stage provides a strategic direction for research by
generating a hypothetical idea and a theoretical problem. At this phase, specific research
objectives are also formulated to address the research problem (Malhotra et al., 2004).
Phase Two: Conclusive research using a cross-sectional descriptive study
The nature of the research question and the target population determined that cross-sectional
descriptive research would be the most appropriate technique in this study to obtain and
represent the required information. Descriptive research is applied to test the theory and
propositions by obtaining precise answers to questions about “how many?” or “what
proportion?” (Emory & Cooper, 1991). As previously stated, the main research question of
this study is: To what extent does a firm’s absorptive capacity, its market visioning
competence and market vision influence the firm’s success at developing market-driving
innovation? The descriptive research design supports the investigation of meaningful
relationships, testing their validity and verifying whether true differences exist (Hair et al.,
2012a).
Figure 3.1 illustrates the overview of the research activities designed to achieve the research
objectives of this study.
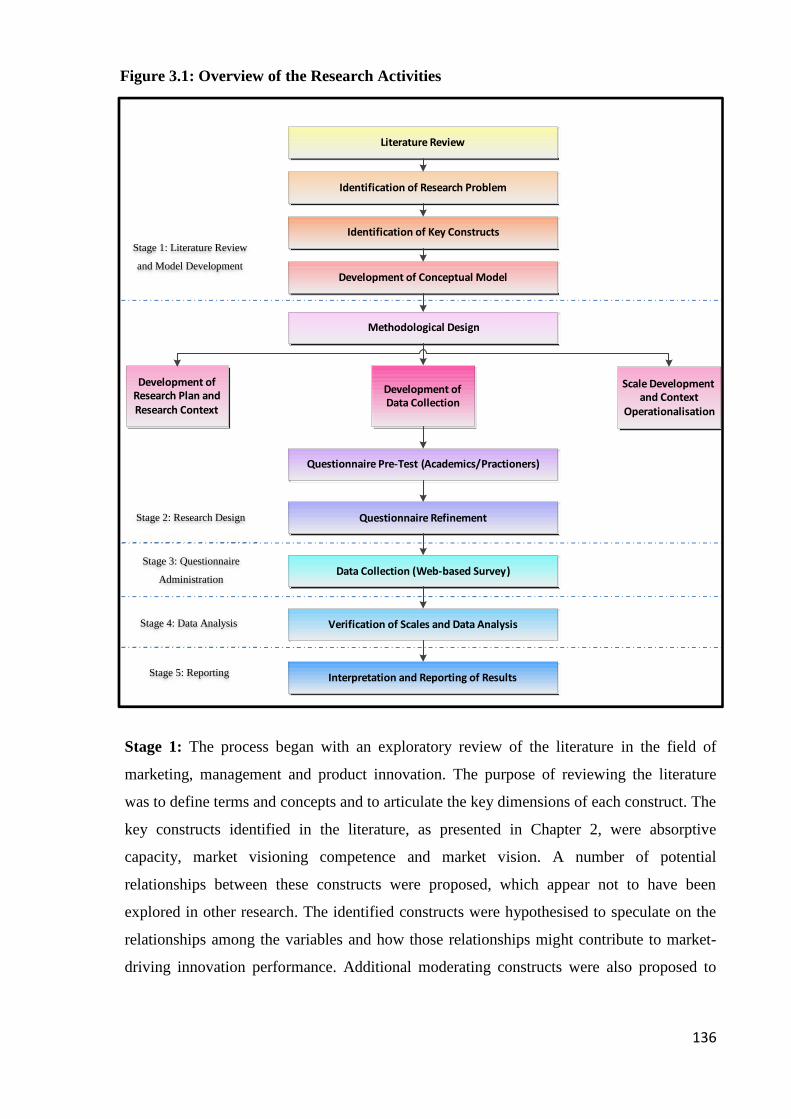
136
Literature Review
Identification of Research Problem
Identification of Key Constructs
Development of Conceptual Model
Methodological Design
Development ofData Collection
Scale Developmentand Context
Operationalisation
Development ofResearch Plan andResearch Context
Questionnaire Pre-Test (Academics/Practioners)
Questionnaire Refinement
Data Collection (Web-based Survey)
Verification of Scales and Data Analysis
Interpretation and Reporting of Results
Stage 1: The process began with an exploratory review of the literature in the field of
marketing, management and product innovation. The purpose of reviewing the literature
was to define terms and concepts and to articulate the key dimensions of each construct. The
key constructs identified in the literature, as presented in Chapter 2, were absorptive
capacity, market visioning competence and market vision. A number of potential
relationships between these constructs were proposed, which appear not to have been
explored in other research. The identified constructs were hypothesised to speculate on the
relationships among the variables and how those relationships might contribute to market-
driving innovation performance. Additional moderating constructs were also proposed to
Stage 1: Literature Review
and Model Development
Stage 2: Research Design
Stage 3: Questionnaire
Administration
Stage 4: Data Analysis
Stage 5: Reporting
Figure 3.1: Overview of the Research Activities
137
examine their influence on the relationship between market vision and market-driving
innovation performance. This resulted in the development of a conceptual model
underpinning the research propositions and hypotheses. At this stage the researcher also
assessed whether the key constructs had existing measures and whether they had been
operationalised and tested in previous research.
Stage 2: This stage involved the preliminary development of the questionnaire that was to
be the primary research tool. Constructs with existing measures were adapted and
operationalised. In particular, a scale to measure the concept of breakthrough integrity was
developed, as this concept had not been fully operationalised in previous studies. This stage
also involved a sampling process of defining the population of concern and determining the
sample size for the study. The web-based questionnaire was tested with academic and
industry experts in the field to check for content validity, wording and ease of
understanding. The final version of the questionnaire was available in both English and
Thai, the questions in each language having been pre-tested. As a result of the pre-testing,
the questionnaire was slightly refined and modified prior to data collection in Stage 3.
Stage 3: At this stage, the study employed cross-sectional descriptive research by means of
a web-based survey for data collection. Managers responsible for developing and
commercialising product innovations across several industries in Thailand were contacted
and invited to complete the web-based survey. The study measures units from the snapshots
of these specific populations at one point in time.
Stage 4: The data obtained from the web-based survey were subjected to a preliminarily
examination and were prepared for data analysis. The data were then assessed for the
reliability and validity of the constructs (see Chapter 4). This stage also involved testing the
proposed hypotheses and relationships through quantitative data analysis (see Chapter 5).
The aim is to produce a final empirical model that best captures the interrelationships the
proposed constructs.
Stage 5: This last stage involved the interpretation, reporting and discussion of the results,
presented in Chapters 5 and 6.
138
3.4 Quantitative Research
This thesis employed quantitative research methodology through the use of a cross-sectional
survey. According to Guo (2008) analysis of 22 years of research in product innovation
literature, the survey was found to be the most widely used method (45.2%) of all research
methods, including case studies, interviews and experiments. The survey questionnaire
provides uniformity as questions and their response options (scales) are pre-set identically in
the same format and in a particular order. The standardisation of this approach results in a
high quality of information. Participants can be challenged with structured, direct questions
related to the research objectives of the study, while the questions also provide participants
with clarification and a point of reference. Thus, the survey approach lends support to the
reliability of the study (Malhotra, 2009a).
Traditional survey methods that can be used for data collection includes face-to-face, mail,
fax and telephone (Malhotra, 2009a). However, new efficient techniques for survey data
collection have emerged from substantial advances in computer and telecommunications
technology, and alternative modes of survey data collection have begun to replace the
traditional methods. These new modes are computer-assisted personal interviews (CAPI),
computer-assisted telephone interviews (CATI) and web-based surveys. These methods
allow researchers to use statistical analysis and quick tallies, especially with web-based
questionnaire design software (Burns & Bush, 2008).
3.4.1 Development of Web-based Survey Tool
The web-based survey has become the industry standard for respondents to answer
questions in an online questionnaire. The online questionnaire enables a wide geographical
coverage and is employed in many countries, particularly those with high internet access
and usage (Burns & Bush, 2008; Ilieva, Baron & Healey, 2002). With the rapid growth in
the use of the internet and its increased availability to the general public, recent researchers
have begun to adopt web-based surveys as the research method of choice (Cobanoglu,
Warde & Moreo, 2001; Dillman, 2000a; Dixon & Turner, 2007), particularly researchers in
the area of product innovation and management (e.g. Bartl, Füller, Mühlbacher & Ernst,
2012; Hofstetter, Miller, Krohmer & Zhang, 2013; Holahan, Sullivan & Markham, 2014;
139
Lamore, Berkowitz & Farrington, 2013; Stanko, Molina Castillo & Munuera Aleman,
2012).
For the reasons outlined above, the web-based survey was deemed the most appropriate
method of research for this study. Accordingly, the study utilised the web-based
questionnaire design software Qualtrics to host the questionnaire through a specific URL
(Uniform Resource Locator; a global address of the document on the World Wide Web)
(Qualtrics, 2013). The Qualtrics software offers a more complete control of the research
process and facilitates the creation, distribution, storage and analysis of a web-based survey.
This study adopted the use of a web-based survey (Simsek, Veiga & Lubatkin, 2005) using
Qualtrics questionnaire design software for the five reasons explained below.
i. Thailand’s Internet Penetration
The country of focus for this research is Thailand. According to the International
Telecommunication Union (ITU), there are several information and communications
technology (ICT) indicators to measure internet penetration in a country. ICT indicators
include the ICT development and infrastructure, domain names or website registration and
internet access (ITU, 2005). These indicators are important to consider when deciding to
conduct a research through a web-based survey due to limited sampling (sample frame) in
the online environment (Andrews, Nonnecke & Preece, 2003; Dillman, 2000b; Wright,
2005). This is the most commonly cited disadvantage of web-based survey because certain
demographics are less likely to have internet access. As a result, it may be harder to draw
probability samples based on e-mail addresses and to encourage respond to the online
questionnaire (Fleming & Bowden, 2009). This study therefore considered some of the ICT
indicators to determine the level of internet penetration in Thailand.
First, recent government activities in Thailand have provided support for expanding ICT
infrastructure leading to a broader internet penetration. This has been enhanced by
legislation on internet usage in 2007 and the ICT plan of enhancing the online environment
for trading and transactions among businesses and consumers from 2000 to 2010. The aim
was to support and promote the usage of ICT to strengthen businesses and e-commerce
technology (Department of Commerce, 2013). Second, the survey by NECTEC (2008)
indicated an increased number of domain names registered under .TH (indicating Thailand)

140
from 2005, resulting in a total of 37,850 registered domain names by 2008 (Charnsripinyo,
2008). Last, Thailand’s overall internet population was estimated at approximately 37% of
the population (about 26 million people) according to the ICT Ministry’s survey in 2011 by
Thailand’s Electronic Transaction Development Agency (ETDA). The number of internet
users in Thailand was also expected to increase to 52 million by the end of 2013 (Williams,
2013). In general, the internet population in Thailand can be classified into corporate and
home access services or business and individual use, respectively (Charnsripinyo, 2008).
According to an ICT Business Survey by Thailand’s National Statistical Office in 2009, the
number of businesses in Thailand employing 16 people or more indicated a high proportion
of computer (81.1%), internet (68.5%) and e-mail usage (57.1%) (Santipaporn, 2010).
Overall, evidence of ICT indicators suggests an acceptable level of internet penetration in
Thailand, thus supporting the method of a web-based survey.
ii. Ease of Access and User-Friendliness
The online questionnaire is available virtually for ease of access and offers respondents the
flexibility of answering the questions at a personally convenient time. This facility can be
considered to increase the accuracy of the data collected (Churchill, 1999; Sekaran, 2003).
User-friendliness is an important element in the design of a web-based questionnaire.
Accordingly, the graphical user interface (GUI) enables ease of use for the survey
respondents. The use of the Qualtrics questionnaire design software enabled the web-based
questionnaire to be easily set up to accommodate the standard question format with simple
navigation on the website. Qualtrics allows the respondents to change their responses by
clicking on the Back button. A Save and Continue function also allows the respondents to
interrupt their completion of the survey. This function is enabled through a cookie on the
respondent’s browser which tracks the progress of the survey. Once the questionnaire is
completed, the respondents can simply click the Submit button (Qualtrics, 2013).
Some other user-friendly design features are the use of space to enhance clarity, grouping
related questions in a section, limiting the number of questions per page to prevent clutter,
the use of a progress bar to display the percentage of the questionnaire completed and
minimal design to enable straightforward navigation. This can reduce the time and effort
required for the respondents to complete the questionnaire. Overall, a user-friendly GUI can

141
facilitate respondents’ participative interest and reduces operational fatigue (Roman, 2002).
The web-based instrument helps to reduce possible common-method variance problems that
may lead to inflated reliability measures (Stanton, 1998).
iii. Efficiency in Data Collection
The main benefits of a web-based survey for data collection are speed of distribution and
fast turnaround time. This is particularly useful for a research project that has time
constraints (Zikmund & Babin, 2007). Given that the survey in this research had a three-
month span, a web-based survey appeared to be suitable. Web-based surveys are self-
administered, meaning that respondents can complete the questionnaire unattended. This has
a significant administrative advantage compared to methods such as telephone surveys
(Burns & Bush, 2008). Furthermore, some studies of web-based survey methods have found
that response rates in email surveys are also equal to or better than those for traditional
mailed surveys (Mehta & Suvadas, 1995; Stanton, 1998; Thompson, Surface, Martin &
Sanders, 2003).
iv. Efficiency in Database Management
The web-based survey minimises and eliminates errors that may be made by the
respondents, the database system or the researchers.
To reduce data entry errors by respondents, the following control mechanisms were used:
(Roman, 2002):
Prevent ballot box stuffing: This setting prevents a respondent from submitting the
questionnaire more than once (dual entry), by placing a cookie on the individual’s
browser.
Multiple entries: The design allows only one answer (option) to be chosen for each
question.
Incomplete questions/questionnaire: The option “force response” was used via
Qualtrics web-based questionnaire design software for data collection. This means that
respondents will not be able to proceed with the survey unless they provide an answer.
142
Each question has to be completed before the respondent can move to the next page of
the questionnaire. In addition, the questionnaire cannot be submitted until all questions
have been answered.
The forced response option is a solution to item non-response for any web-based
surveys. This prevents the problem of missing data throughout the collection process.
Despite this advantage, some researchers have argued that it can be offset by the
decreased quality of responses (i.e. potential for incorrect forced data) or increased
respondent drop-off rate (e.g. Couper, 2008; Dillman, 1998). However, a recent study
conducted by the Graduate Management Admission Council (GMAC) investigates the
impact of forced response items on respondent drop-off and differences in items
answers and indicates that no differences in terms of response drop-off, attitudinal
nature of the response items and content of responses were found between the forced
response and requested response item conditions. The only impact on the content of
responses by forced item condition is to reveal sensitive information, which is a
common survey respondent issue (Leach, 2013). This was not the case for this
research as no sensitive personal questions were asked in the survey and that all data is
analysed at the aggregate level, thus, individual participant cannot be personally
identified (see Appendix 1 for project information statement). The force response
option was therefore considered appropriate and utilised in this research.
Backward navigation: This feature prevents data loss from accidental clicking on the
Back or Refresh buttons.
Further, the web-based survey offers error control mechanisms that enable the researchers to
efficiently manage the collected data with the following features:
Data storage and security: The collected data are stored securely on the Qualtric
servers, which are protected by a high-end firewall system. Vulnerability scans are
performed regularly and complete backups are done daily to prevent data loss and
ensure that the data collection process can be conducted successfully within the
scheduled time (Qualtrics, 2013).
Real-time data access and monitoring: The web-based survey allows real-time 24/7
access to the research data. Program security codes prevent unauthorised alteration of
the survey and access to the survey is protected with passwords. Only researchers can
143
access the web-based survey to make necessary modifications or obtain the data that
have been collected.
Researchers can continuously monitor the progress of the web-based survey
throughout the data collection process, which makes it possible to identify any
problems with the survey quickly. A web-based survey is therefore believed to create
responses equal in quality to responses to telephone or mail surveys (Burns & Bush,
2008).
Data conversion and compatibility across linked programs: The data from the web-
based survey is stored in a consolidated database, which can be downloaded and
tabulated into computer data files (data conversion). This feature of data conversion
eliminates the handling of paper questionnaires, with manual and multiple data entry
that may lead to data errors (Ilieva et al., 2002). The exported data files are compatible
with MS Office programs and some statistical analysis programs including the
Statistical Package for Social Sciences (SPSS). This compatibility provides an
efficient data management tool that enables further data analysis.
v. Use of Qualtrics at RMIT University
The Qualtrics questionnaire design software (Qualtrics, 2013) is freely available to RMIT’s
researchers to support the use of web-based survey research for university-related work.
This enabled the setup of the web-based survey tool at no cost.

144
3.4.2 Sampling and Data Collection
Sampling is “the selection of a small number of elements from a larger defined target group
of elements and expecting that the information gathered from the small group will allow
judgments to be made about the large group” (Hair et al., 2012a, p.260). With surveys, the
sampling process involves statistical analysis to predetermine a set and proportion of unit to
be taken from a larger population. The key consideration of sampling is the selection of a
small number of units that truly represent the general population being surveyed (Hill &
Alexander, 2006).
3.4.2.1 Unit of Analysis
The unit of analysis indicates the level of aggregation on which the study focuses,
particularly what or who to be investigated. The unit can be any element such as individuals
(e.g., employees or owners) or organisations (e.g., business units) in the target population
being studied (Hair et al., 2012a). The unit of analysis must be specified during the
problem-definition stage of the research because it influences the conceptual framework,
including the sampling frame and variables and the approach for data collection (Zikmund
& Babin, 2007). To address the research propositions, the data collection must capture the
appropriate respondents (Sekaran, 2003).
The unit of analysis of focus for this study is the product innovation (new product
development [NPD]) program rather than any one product (project). A significant number of
product innovation and management studies have adopted program level of analysis for
their research (e.g. Acur et al., 2010; Kleinschmidt et al., 2007; Salomo et al., 2010). In
other related literature, Cooper and Kleinschmidt (1995a) argue that there is a difference in
terms of result scope between studies conducted at project level and program level.
Although studies at a project level analysis are important for increasing knowledge on NPD
processes, the authors highlight that “there may be company practices that are not apparent
at the project level and yet are important … These practices may be missed—simply not
observed or measured—when the unit of analysis is the project” (p.376). A study at a
program level analysis allows “standard NPD review practices of organizations to be
examined instead of practices that may be idiosyncratic to a particular project” (Schmidt,
Sarangee & Montoya, 2009, p.526). More specifically, a program level analysis seems to be
145
more effective than a project level analysis for studies involving the effects of some higher-
level specific practices such as a clear and well-defined product innovation strategy or
defined product vision (Crawford & di Benedetto, 2003)—this is consistent to the focus of
this research.
The focus on program level analysis is also something that has been called for in the product
innovation and management literature (e.g. Cooper & Kleinschmidt, 1995a; Schmidt et al.,
2009; Stock & Zacharias, 2013). A recent study by Stock and Zacharias (2013, p.517) state
that “innovativeness at the program level remains underresearched”, and thus innovation
research “must move from the micro [or product level] of analysis to the company or macro
level” (Cooper & Kleinschmidt, 1995a, p.375). The present study therefore adopted a
program level unit of analysis, which on the basis of the aforementioned considerations
appeared to be most appropriate to achieving the research objective.
Accordingly, this study investigates the company level or strategic business unit (SBU)
level of an organisation where research, development and commercialisation of
breakthrough innovations were undertaken. It must be noted that this study uses “firm” as an
overall term to capture the specific types of respondents and entities (i.e. company or SBU).
The result is the collection of information about each variable at the program level of NPD
in order to examine the hypothesised relationships.
3.4.2.2 Sample Selection
The sample was drawn from the top innovative firms in Thailand. The top innovative firms
were considered as they are actively involved in NPD and product innovation. Initial
information was gained through an on-site visit and member registration at the National
Innovation Agency (NIA), Thailand. The NIA is one of the specialised agencies which
operate under the umbrella of the Ministry of Science and Technology. The main aim of
NIA is to transform Thailand into an innovation-driven economy by fostering innovation-
related activities, culture and developments.
Recent innovative activities supported by NIA include National Innovation Day, Innovation
Development and Research and Technology Fund, international conferences such as
ASEAN Economic Community (AEC) Biomedical Innovation, and innovation showcases

146
such as InnoBioPlast, InnovAsia and TechnoMart InnoMart. Other NIA innovative
activities are awards and other recognition given to selected Thai innovative firms and
entrepreneurs for their achievements in product development and innovation. Examples are
awards for the Top Ten Innovative Businesses, National Innovation Awards, Rice
Innovation Awards and the Design Innovation Contest. Moreover, NIA plays a central role
in coordinating, networking and partnering with innovative firms across different industrial
clusters, at both the policy and operational levels (National Innovation Agency, 2010b).
Accordingly, the initial list of the sample was drawn from the database of NIA Thailand
Top Innovative Companies in the year 2011–2012 (National Innovation Agency, 2011,
2012). The top innovative companies were listed as award winners across various industries
and product categories. The key selection criteria for the winners were related to: (1) the
degree of novelty of the product at the international, national or corporate level, (2) the
management process and effectiveness of operation in terms of knowledge and exploitation
of locally available materials and resources, and (3) the overall benefit of the innovation in
terms of adding value to related business, local community and the grass-roots economy
(National Innovation Agency, 2006). Thus, the NIA database narrowed down the search for
highly innovative Thai firms involved in new product development.
Drawn from the NIA database, the initial list comprised 249 innovative Thai firms with
details of company profile and key contact persons (mainly managing directors) including
phone numbers and e-mail addresses. In order to distribute the survey to a wider audience,
75 additional contacts of Thai innovative firms were obtained through a network-based
approach at NIA innovation showcases. TechnoMart InnoMart, for instance, was the year’s
2012 biggest technology and innovation event in Thailand. The event gathered more than
300 innovative products from Thai and large international firms to showcase their research
and development, primarily Thai technology and innovation, industrial machinery, Thai
SME (small-to-medium enterprises) products and innovative projects initiated by the King
of Thailand (BITEC, 2012). In addition, another list of 46 innovative firms (both Thai and
multinational) was compiled, originating from 28 known industry contacts. Care was taken
to ensure that the list consisted of firms considered top innovators by commentators in the
market. The final sampling frame comprised 370 innovative firms in Thailand operating
across various sectors, thereby offering a practical means of capturing a sample sufficiently
large and representative of the total population being studied.
147
3.4.2.3 Sample Size
For any statistical technique, it is important to determine the minimum sample size required
to facilitate the generalisability and validity of the result in a given model before data
collection occurs. The sample size suggests how accurate a sample is (Tabachnick & Fidell,
2007). The required sample size is based on the proposed data analysis technique and its
requirements. This study involves data analysis through simple/multiple regression and
partial-least square structual equation modelling (PLS-SEM).
To meet the assumption of multiple regression analysis, Tabachnick and Fidell (2007)
recommend a formula to determine the required sample size: N > 50 + 8m, where N is the
required sample size (number of participants) and M is the number of independent variables.
In this regard, the maximum number of predictors used in any one model totalled 10, which
yielded a required sample size of 130 participants for this study.
For PLS-SEM, the minimum sample size needs to be equal to or larger than: (1) “ten times
the largest number of formative indicators used to measure on construct” or (2) “ten times
the largest number of structural paths directed at a particular latent construct in the structural
model” (Hair, Ringle & Sarstedt, 2011, p.144). As the given model of the present study
represents reflective constructs and the largest structural path was equivalent to 10, this
suggests a minimum of 110 cases required to generate valid model fit measures for PLS-
SEM.
To incorporate both requirements of the proposed data analysis techniques, the study thus
required a minimum sample size of 130 respondents.
3.4.2.4 Key Informants
The approach of using key informants is often adopted and more favoured than multiple
informants in empirical research (Kortmann, 2014) and has been used in prior studies in
product innovation and management literature (e.g. Calantone et al., 2003; Stanko et al.,
2012). Accordingly, the key informant technique was adopted for this research. Importantly,
the most appropriate key informant must be chosen to ensure that the respondents are
exceptionally knowledgeable and competent to specifically answer the questions related to
the subject being examined (Kumar, Stern & Anderson, 1993).
148
As mentioned in Section 3.4.2.2, the target sample was top innovative firms because firms
developing breakthrough innovations are a subset of firms which undertake product
innovation. Correspondingly, the key informants of the present study were identified as
managers with responsibility for the development and commercialisation of market-driving
innovations (as defined in this study). In line with the unit of analysis, the informants were
asked to refer to their SBU, or, when the firm had only a single SBU, to their firm. An SBU
is an autonomous division or organisational unit with its own approach for NPD, defined
business strategy and formulation, including a manager with sales and profit responsibility
(Aaker, 1988).
A qualifying criterion was applied to filter that the informants would be able to shed light on
the activities associated with the front end and final success of market-driving innovation.
This involved two qualifying questions to screen pool of participants. To be eligible,
participants had to: (1) be significantly involved in the development and commercialisation
of market-driving innovation and (2) have a strong understanding of organisational routines
in general, and NPD processes, resources and capabilities. The target respondents included
people with various positions working at different levels of a firm or SBU such as managing
director, chief executive officer (CEO), vice president of marketing, product and sales
manager and R&D engineer.
3.4.2.5 Survey Design and Process
Data were collected via a web-based questionnaire over a three month period. Before the
first e-mail round, all potential respondents were contacted by phone to verify their status as
knowledgeable informants and their appropriateness for the survey based on their
understanding of organisational routines, processes, resources and capabilities related to
NPD and innovation. If they did not meet the qualifying criterion, they were asked for
contact information of appropriate people in their company or strategic business unit (SBU).
The phone calls also served as an opportunity to explain the purpose of the study and
encourage participation.
For the first e-mail round, the purposive sampling strategy was to invite participants into the
study with a short motivational introduction to encourage their commitment to undertake the
web-based survey. Drawing from the final sampling frame of 370, managers across a
149
diverse range of innovative companies in Thailand received an e-mail stating the intention
and relevance of the study and including a unique hyperlink directed to the web-based
survey (specific URL). The introductory e-mail message stated that the purpose of the
survey was to gain an understanding of organisational knowledge and information
processing, particularly visioning capabilities, for breakthrough innovations as they related
to innovation strategies and business unit level (NPD program) success.
In addition, a project information statement approved by the RMIT University Ethics
Committee was attached to the e-mail, including the following information:
Introduction of the researcher and main supervisor
An overview of the project (objective and significance)
Detailed instructions for survey completion
The rights of the participant, associated risks or disadvantages and benefits
Requested date of return
Contact details for the researcher and main supervisor (in the event that additional
information or further clarification is required by respondents)
Contact details of the Chair of the RMIT Business College Human Ethics Advisory
Network (in the event of any complaints about the conduct of the research project)
The overall design of the survey was checked for compliance with the RMIT University
protocol. The design of the web-based survey was reviewed by web designers to ensure a
professional look and feel. Importantly, participants were assured of confidentiality and
anonymity for any information provided at every stage of the investigation (see Appendix 1
for the project information statement). Section 3.6 will discuss the project’s ethical
considerations in greater detail.
Strategies to encourage participation
To further encourage participation in the web-based survey, the participants were offered a
free summary report on findings at the completion of the study. Moreover, a donation of
AUD$2 was offered to the Starlight Children’s Foundation Australia for every completed
survey – a common type of incentive used by researchers to increase the response rate to
mail questionnaires (Gendall & Healey, 2008). Respondents also had the option of
completing a paper-based survey. Any participants who viewed the internet as an insecure
150
network could request a hard copy of the questionnaire to be posted to a given address, for it
to be completed in a paper format and return their responses by regular mail at no cost.
To increase the response rate, particularly in the case of the unavailability of a person who
was sent the initial e-mail, the recipients were asked to forward the hyperlink of the web-
based survey to other appropriate managers. This approach can be referred to as referral
sampling, which can help to identify additional potential respondents with similar
characteristics (Hair et al., 2012a). The approach is typically suitable for small, hard-to-
reach, unique target populations. Since breakthrough innovations are much rarer than
incremental innovation, finding a sufficient number of prospective respondents could have
been difficult. This referral approach also allows researchers to yield better results in less
time and at a relatively low cost (Hair et al., 2012a). This notwithstanding, there was a limit
of five participants per unit of analysis (company or SBU) to prevent research bias (Seidler,
1974).
After the administration of the web-based survey, up to three follow-up e-mails were sent to
remind the potential informants of the importance of their involvement in the study. The e-
mail messages included an acknowledgment of the reasons for not participating, the time
required for survey completion, an emphasis on the incentives, the date for survey return
and an advance thank-you statement for willingness to participate (Dillman, 2000a).
3.4.2.6 Survey Response
A total of 179 questionnaires were considered usable for analysis, yielding a 48.38%
response rate. This was considered satisfactory when compared to other empirical studies
that had employed a web-based survey in the product and innovation management literature.
In the studies of Bartl et al. (2012) and Stanko et al. (2012), for instance, the response rates
for web-based questionnaires were 12.7% and 14.01%, respectively. Sheehan (2001) study
on online users found an average response rate to e-mail surveys of 24% in the year 2000, a
significant decrease since 1986 (61.5%).
To detect nonresponse bias, a simple paired-sample t-test (equal variances) was computed to
compare if there were differences between early and late respondents in terms of main
variables relevant to the research hypothesis (Armstrong & Overton, 1977). The data was
151
organised into two groups. The first group contained the average values found by the survey
of the first 10% of respondents for the main variables of absorptive capacity, market
visioning competence, market vision and performance variables. The second group
contained the same variables of the last 10% of respondents. The results of the t-test
comparison revealed no statistical significant difference (p < 0.05) between the two groups
in terms of the means of the variables tested. This finding indicates that the data are free
from substantial nonresponse bias.
The 179 respondents were primarily in top management positions and responsible for both
marketing and R&D activities (40.2%). The company size varied from small to large, where
42.5% were small-to-medium sized firms and 57.5% were large sized firms. The majority of
the firms (company/SBU) were Thai owned and were in the consumer packaged goods
market (33%), and spent about 10.5% to 20% of their annual turnover on R&D for product
development.
On average, respondents indicated they had introduced 1.54 radical breakthroughs, 1.26
technological breakthroughs, 2.04 market breakthroughs and 4.66 incremental innovations
over a three-year period. This suggests that their main type of market-driving innovation
activity is based on market breakthroughs and radical breakthroughs followed by
technological breakthroughs. In terms of how innovative firms are overall, a total of 1665
innovations were found to be introduced by firms over the three-year period, based on the
total sample of 179. Accordingly, the innovation portfolio can be broken down into 270
radical innovations (14.8%), 226 technological breakthrough (13.6%), 303 market
breakthrough (21.80%), 829 incremental innovation (49.8%). As part of a balanced
innovation portfolio, 50.2% of innovations were thus considered as “market-driving”
innovations (see Section 3.5.3 for characteristics of the sample).
152
3.4.3 Survey Questionnaire Development
A questionnaire, also referred to as a survey instrument, is the “critical key for unlocking
understanding and truth about predetermined elements of a defined problem situation” (Hair
et al., 2012a, p. 350). The questionnaire is a tool to generate primary data through a set of
structured, closed-ended questions and a prearranged set of scale points. The design of the
questionnaire was based on the literature review of relevant concepts and previously
validated measurement scales in product and innovation management studies. The scale
items were developed and slightly modified as clearly, concisely and specifically as
possible, to be program-related rather than product-related. Preliminary information was
gathered and the overall survey instrument was checked to enhance the accuracy of the data
collected for further statistical analysis.
In this study, the survey questionnaire development involved five key components:
i. Measurement scale;
ii. Survey instructions;
iii. Survey structure and layout;
iv. Survey pre-testing and translation;
v. Considerations for common method bias.
The following five sections discuss the development of the survey questionnaire in more
detail.
3.4.3.1 Measurement Scale
All constructs were measured using multiple items and seven-point Likert-type scales. As
first purposed by Likert (1932), the Likert scale was a technique for the measurement of
attitudes in psychology. It can also be referred to as a summated rating scale or itemised
rating scale (Hair, Black, Babin & Anderson, 2010; Malhotra, 2009b). A Likert scale is “an
ordinal scale format that asks respondents to indicate the extent to which they agree or
disagree with a series of mental belief or behavioural belief statements about a given object”
(Hair et al., 2012a, p. 314). The Likert scale is one of the most commonly used attitude-
scaling techniques in the social sciences and marketing research (Albaum, 1997; Dawes,
2008). This also applies to product innovation research, is as evident in a number of recent
153
studies using Likert scales, particularly seven-point scales (e.g. Chiva & Alegre, 2009;
Hyung-Jin Park, Lim & Birnbaum-More, 2009; Patzelt, Lechner & Klaukien, 2011). The
main advantages of the Likert scale are the simplicity of directions to respondents and the
ease of scale construction (Malhotra, 2009b).
The use of a Likert-scale was particularly helpful for the present study in terms of
measuring items such as absorptive capacity, market visioning and breakthrough integrity,
as it allows respondents to express their perceptions about how well their firms were able to
manage and achieve these.
More specifically, there are three options to consider involving the format of a Likert scale:
i. Number of response options
The number of response options for Likert scale measurement can vary from three to eleven
in odd numbers or in even numbers of four, six or ten (Dawes, 2008; Lorken, Pirie, Virnig,
Hinkle & Salmon, 1987). It has been suggested that researchers should allow respondents to
reveal their true feelings about a given object with a choice of a neutral response (Malhotra,
2009b). The present study therefore utilised an odd number of response options.
ii. Number of scale options
A scale point reflects “designated of intensity assigned to the response in a given
questioning or observation method” (Hair et al., 2012a, p. 308). The use of scale points can
be different for each researcher as there is no set rule in social science studies. Nonetheless,
several researchers have claimed that seven-point scales are best for capturing respondents’
opinions (Aaker et al., 2001; Malhotra, 2009a). As previously noted, the seven-point scale
has been widely used in recent product innovation research. It has been regarded as a more
sensitive scaling than a five-point scale and is suitable for data analysis involving
sophisticated statistical techniques such as SEM. Moreover, the seven-point scale deals with
cognitive limitations and reliability issues as well as avoiding the confusion that a nine-point
scale may pose (Diefenbach, Weinstein & O'Reilly, 1993; Hair et al., 2010; Malhotra,
2009b).

154
Accordingly, this study adopted the seven-point Likert-scale for measuring survey items
with the following anchors:
(a) 1 = Strongly disagree to 7 = Strongly agree
(b) 1 = Not at all to 7 = To a very great extent
(c) 1 = Not at all successful to 7 = Extremely successful
iii. Choice of response options
The choice of response options involves either a forced-choice scale or a non-forced scale.
The adoption of an odd number of response categories, as in this study, typically indicates
that a neutral or middle ground is allowed, that is, a non-forced scale. A non-forced scale
gives respondents the opportunity to express their true feelings in order to receive a true
response. Therefore, the respondents may feel more comfortable about answering the
questions than if they were forced to give a positive or negative opinion about a given object
or statements (forced-choice scale) (Malhotra, 2009b; Parasuraman, Grewal & Krishnan,
2004).
3.4.3.2 Survey Instructions
It is vital to provide clear instructions to participants before they respond to the
questionnaire. The survey instructions emphasised that only knowledgeable key informants
were encouraged to participate in the survey.
Once the respondents had clicked on the hyperlink to the web-based survey, the survey
instructions advised them to think about the breakthrough innovations which their
companies or SBUs had developed and commercialised at program level in the last three
years (regardless of whether they were successful), and in which they actively participated.
In line with Song and Montoya-Weiss (1998) and Leifer et al. (2000), the definition of
“breakthrough innovation” was adopted and clearly stated in the survey instructions. By
surveying managers who had participated in the developments of breakthrough innovations
at the NPD program level and limiting the recall time frame to three years, bias on
retrospective data was minimised.

155
In terms of making judgements, the respondents were asked to answer the questions as
honestly and forthrightly as possible while they were reassured of confidentiality and
anonymity. Following the survey instructions, the respondents were requested to reflect on
how things actually were rather than their opinion of how things ought to be (see Appendix
2 for survey instructions).
3.4.3.3 Survey Structure and Layout
The layout and format of the questionnaire sections, item sequence, wording and survey
instructions were checked by the researchers for logical coherence and smooth transition,
professional appearance and visual appeal (Brace, 2004; Oppenheim, 1992). The
questionnaire had five sections. For improved clarity and accuracy, each section had
explanations and instructions for individual questions that were placed as close to the
questions as possible. An overview of the five sections is presented as follows.
Section 1: General Characteristics of Your Job, Company Product Development Activities
The first section of the questionnaire captured the demographic profiles of the respondent,
the company or SBU and the product development within the company/SBU. For instance,
this included job emphasis, organisational structure, number of employees and new product
effort structure. Importantly, the respondents were asked to reflect on the NPD activity and
to indicate the number of different types of product innovation introduced over the last three
years. The types of product innovation defined in this study were explained, with examples
given of each type of product. These were radical breakthrough, technological
breakthrough, market breakthrough and incremental innovation. The number of new
products and their degree of novelty represented how innovative the company or SBU was.
Section 2: Aspects of Breakthrough Innovation Performance
The second section of the questionnaire measured the aspects of breakthrough innovation
performance, defined as market-driving innovation performance construct in the study.
Accordingly, the sub-section captured the instructions and scale items of breakthrough
integrity, early success with customers, speed-to-market, windows of opportunity and
156
ultimately financial performance measures. Respondents were asked to think about the
performance of the breakthrough innovations developed by their company/SBU over the last
three years, from the early phase of the NPD process through to launch. The aim was to
determine specific program level performance outcomes related to breakthrough innovation
at before-launch stage and post-launch stage as well as financial success. The responses may
suggest how well the studied firms have dealt with the development of breakthrough
innovations.
Section 3: Information Processing and Knowledge Management (Absorptive Capacity) of
your Company/SBU
The third section of the questionnaire focused on the antecedents of market visioning
competence and its resultant market vision. This section was designed to capture an
understanding of the general organisational routines and processes of the company/SBU
apart from the innovation-related activities. Respondents were asked to think about all of
their company’s departments such as R&D, production, marketing and accounting. The
respondents were to answer questions about how well they communicated with each other,
their connections both within and outside their industry, and how they applied new
knowledge in their practical work. These questions reflected information processing and
knowledge management at the broad organisational level and the absorptive capacity
construct. The sub-section was clearly divided into the four dimensions of absorptive
capacity: acquisition of knowledge, assimilation of knowledge, transformation of
knowledge and exploitation of knowledge.
Section 4: Organisational Visioning Capabilities
The fourth section of the questionnaire measured market visioning competence and market
vision constructs. The section required respondents to think about breakthrough innovations
again, but at the strategic business unit level (NPD program). The questions were designed
to elicit information related specifically to all of the dimensions of market visioning
competence and market vision. The purpose of capturing the information in this section was
to understand how people undertake product-innovation-related tasks and thinking in their
company/SBU, particularly the nature of market visioning for breakthrough innovations in
the very early stages of the development process.
157
Section 5: External Business Environment and NPD Process
The final section of the questionnaire sought to capture data on the external and internal
business environment associated with the development of breakthrough innovations. The
first sub-section measured the external environment factors of technological turbulence,
market turbulence and competitive intensity. The second sub-section measured the new
product development process and stages, factoring in the degree of NPD process rigidity
(formality). The aim was to elicit information about the circumstances and the types of
processes that may negatively or positively influence the front end development of
breakthrough innovations.
3.4.3.4 Survey Pre-Testing and Translation
Pre-testing of the survey was conducted to identify and eliminate any ambiguous wording or
other errors in the items and any questionnaire design shortcomings before the actual launch
of the survey. Generally, the process involves testing the original questionnaire with a small
number of respondents to generate an improved version of the questionnaire (Malhotra,
2010; Zikmund, 2000). Oppenheim (1992) described survey pre-testing as “the process of
conceptualizing and re-conceptualizing the key aims for the study and marking preparations
for the fieldwork and analysis so that not too much will go wrong and nothing will have
been left out” (p. 64).
The pre-testing process involved two stages with panels of experts, consisting of academics
and industry informants. The academics and industry informants were invited to review and
provide feedback on the structure, questions and language, and the general appearance and
design of the survey instrument.
The English version of the questionnaire was first reviewed by five academics in Australia
who were familiar with the research area. They were asked to check the questionnaire for
content validity and to comment on the appropriateness and comprehensiveness for testing
the proposed hypotheses. “Content validity” is “the type of validity, sometimes called face
validity, that consists of a subjective but systematic evaluation of the representativeness of
the content of a scale for the measuring task at hand” (Malhotra, 2010, p.288). The experts’
158
suggestions regarding the design structure and some of the questions were subsequently
incorporated, which enhanced content validity.
In the second stage, three industry experts from the Product Development Management
Association of Australia (PDMAA) were involved in the pre-test of the English
questionnaire. These experts were asked to assess the relevance and applicability of the
questions and to verify the salience of the listed items, particularly to avoid ambiguous
terms and complex syntax. The industry informants were also requested to note the length of
time (minutes) it would take to complete the survey. Based on their responses, some
modifications were made to the survey instrument in terms of sentence structure and
wording.
In addition to English questionnaire, potential respondents in Thailand commented that an
alternative version of the questionnaire in Thai language should be offered to overcome the
language barrier. Using bi-lingual communication is likely to have a positive influence on
the acculturation segment (Holland & Gentry, 1999; Koslow, Shamdasani & Touchstone,
1994; Palumbo & Teich, 2004). This necessitated translating the English questionnaire into
Thai language. The key objective of the translation procedure is to ensure translation
equivalence (Douglas & Craig, 2007). A direct translation approach was adopted first
(Sechrest, Fay & Zaidi, 1972). Afterwards, the Thai questionnaire was back-translated into
English by a translator (bilingual expert) who had not seen the original English version. The
back-translation method is used primarily in marketing research to reduce possible
translation errors to ensure the development of comparable versions of a questionnaire
(Douglas & Craig, 2007). Some discrepancies in meaning between the original and
retranslated questionnaires were detected and reconciled.
Following the two stages of pre-testing, the Thai survey instrument then went through the
process of improving the clarity of the questions and the overall validity of the content. The
Thai questionnaire was pre-tested with four academics and six industry experts in Thailand.
Based on the feedback and suggestion received, a number of items were reworded.
The final version of the survey questionnaire employed a bilingual instrument that included
both English and Thai languages. On the strength of feedback from both academics and
159
industry experts, the questionnaire was slightly refined and readied for launching in the field
(see Appendix 2 for survey instrument in English and Thai languages).
3.4.3.5 Considerations for Common Method Bias
The issues of common method bias is well acknowledged in several literature (e.g. Bagozzi,
1980; Bagozzi, 1984; Campbell & Fiske, 1959; Fiske, 1982; Greenleaf, 1992). The term
“method” involves various aspects of the measurement process, which are:
the content of the items, the response format, the general instructions and other
features of the test-task as a whole, the characteristics of the examiner, other
features of the total setting, and the reason why the subject is taking the test.
(Fiske, 1982, p. 82)
In this regard, there are two possible effects of method bias found on item reliability and
validity as well as on the covariation between constructs i.e. effects of response styles,
proximity and item wording (Podsakoff, MacKenzie & Podsakoff, 2012). These biases may
lead to incorrect conclusions about a scale’s reliability, convergent and/or discriminant
validity and bias hypothesis testing. This study considered a number of factors indicated to
increase method bias (MacKenzie & Podsakoff, 2012) and adopted the appropriate remedies
to reduce bias, as shown in Table 3.1.

160
Table 3.1: Common Cause of Method Bias and Adopted Remedies
Common cause of method bias Remedies adopted for the study
Lack of verbal ability,education, or cognitivesophistication
Pre-testing procedure ensured questions and item characteristics wereeasily comprehended by respondents who were those typical of thesame population.
Lack of experience inthinking about the topic
Key informants with significant knowledge and experiences aboutproduct innovation were recruited to participate in the survey.
Complex or abstractquestions
Clear definitions provided with examples of the concepts (e.g.,examples of radical and really new innovations).
Low personal relevance ofthe issue
Offered free summary of reports useful to the respondents and thefirms to increase accuracy of the responses (i.e., the critical successfactors for the development of breakthrough innovations).
Written presentation of item,presence of interviewers
The use of a web-based survey helped to simplify questions andresponse options; a self-administered method of data collection thatmay avoid social desirability bias.
Low self-efficacy or self-expression to provide acorrect answer
Common scales (e.g., samescale types and anchorlabels)
Survey instruction emphasised that respondents answer questions as“how things actually are”, not “how they ought to be” – The mostimportant thing is only their personal experience and knowledgeabout NPD and breakthrough innovation.
Explained to respondents that although some questions may seemvery similar, each is unique and requires careful considerationsbefore answering.
Low need for self-expression,self-disclosure
Enhanced the motivation for self-expression by stating in theinstructions that “Thank you in advance for taking part in this study.Your contribution and insights will help make this a successful anduseful study”.
Low feelings of altruism Clearly explained to the respondents in the project information sheetthat they have been approached to participate because of the value oftheir experiences in shedding light on the front end of innovationactivities.
Impulsiveness Asked the respondents to read the instructions for each question andconsciously think about the issue i.e. the use of preambles.
Lengthy scales Feedback from the pre-tests suggested a survey completion time ofapproximately 20 minutes; a reasonable request for managers’ time.
Contexts that arousesuspicions
Project approved by the RMIT University Human Research EthicsCommittee. Information about how the data would be used and keptsecure, ensuring anonymity and confidentiality, was provided in theproject information sheet.
Grouping of related items Arranging similar items and subjects in the same section, and in alogical order from general to specific; the NPD survey of thisresearch comprised of five sections and begun by asking aboutgeneral characteristics of job, company, and product developmentactivities before moving onto the aspects of breakthroughperformance.
Source: MacKenzie & Podsakoff, 2012
161
3.5 Data Preparation and Analysis Procedure
3.5.1 Preliminary Data Examination
Once enough data for the study measures have been collected, the researcher must prepare
the data for analysis (that is, a data preparation process) by preliminarily examining the
collected data and transforming them into a form suitable for data analysis. This is the
mechanical stage of a research project that enables the data to ultimately be translated into
useful knowledge (Malhotra, 2009b).
The four steps undertaken to prepare the data for analysis are:
i. Questionnaire checking: Checking the completed questionnaires for overall
completeness, accuracy and general usability e.g., eliminating incomplete or
unqualified questionnaires
ii. Editing: Correcting, where applicable, illegible or ambiguous answers
iii. Coding: Assigning questions into numeric codes in the design phase (e.g.,
demographic information) (Luck & Rubin, 1987)
iv. Cleaning: Reviewing data for inconsistencies that may arise from faulty logic (e.g.,
out-of- range or extreme values) (Malhotra, 2009b)
As indicated in Section 3.4.1, the use of a web-based survey using Qualtrics questionnaire
design software can simplify or eliminate some of the stages of the data preparation process,
thereby accelerating the overall research process. For example, the programming logic and
features prevent participants from skipping questions, and exclude incomplete
questionnaires and out-of-range values from the data set. As such, the data set contained no
missing values or erroneous values.
162
3.5.2 Data Analysis Procedure
Multiple statistical procedures were involved in the quantitative data analysis. The primary
aim was to address the main research questions, the proposed research hypotheses and the
conceptual model of the study. Two main stages were conducted for the data analysis:
Stage One: Testing reliability and validity of the constructs using SPSS (version 21.0) and
AMOS (version 21.0):
Cronbach’s alpha (split-half technique) and correlation analysis: reliability test of
multi-item scales
Confirmatory factor analysis (CFA): validity and unidimensionality test
More details of the data analysis techniques are provided in Chapter 4, including the
operationalisation of constructs.
Stage Two: Testing the interrelationships among a set of constructs (variables) and the
overall conceptual model
Standard regression through Simple and Multiple Regression analysis:
o Assumptions of multiple regression: sample size, multicollinearity, outliers,
normality, linearity and homoscedasticity, and independence of error
o Including moderation analysis using the SPSS macro MODPROBE (Hayes &
Matthes, 2009)
Partial-least square structural equation modelling (PLS-SEM) using SmartPLS
(version 21.0) (Ringle et al., 2005)
Details of the data analysis techniques are discussed in Chapter 5, including the report and
interpretation of findings.

163
3.5.3 Sample Characteristics
Respondent Job Area Respondent Job Emphasis
General/Top Management 40.20% Totally marketing focused 7.30%
Sales and Marketing 28.50% More marketing focused than R&D 31.80%
R&D/Engineering 20.70% Balanced marketing and R&D 40.20%
Others 10.60% More R&D focused than marketing 13.40%
Totally R&D focused 3.90%
Other 3.40%
Number of years- Respondents in current position Respondents with organisation
1 - 3 years 50.30% 29.60%
4 - 6 years 26.80% 25.10%7 - 10 years 14.00% 16.20%
More than 10 years 8.90% 29.10%
Industry Type Number of Employees (Company/SBU)
Consumer Packaged Goods 33.00% 1 – 20 26.30%
Consumer Durable Goods 15.10% 21 – 40 12.30%
Business to Business Industrial Goods 21.20% 41 – 60 3.90%
Consumer Services 9.50% 61 – 100 12.30%
Other 21.20% 101 – 200 14.50%
201 – 500 8.40%
500+ 22.30%
Organisational Structure
Single structure and only one NPD program for all products 55.90%
A division/strategic business unit (SBU) with its own approach to NPD and strategy formulation 44.10%
NPD Structure
New product development with permanent staff members 25.70%
Distinct division or venture group 5.00%
A new product committee oversees all development efforts 7.30%
Each business unit's general manager directs their own NPD efforts 20.10%
A single function is responsible for NPD 22.30%
A product development process owner helps deploy our process across the firm 15.10%
Other 4.50%
Annual Turnover (Sales) Annual Turnover Spent on R&D
Under A$1 million 25.70% 0.5% - 3% 17.32%
Between A$1 million - A$2 million 11.70% 3.5% - 6% 14.53%
Between A$2.01 million - A$3 million 2.20% 6.5% - 9% 4.47%
Between A$3.01 million - A$4 million 5.00% 9.5% - 10% 13.41%
Between A$4.01 million - A$5 million 4.50% 10.5% - 20% 18.99%
Between A$5.01 million - A$15 million 10.10% 20.5% - 30% 15.08%
Between A$15.01 million - A$25 million 6.10% 30.5% - 100% 13.97%
Between A$25.01 million - A$50 million 8.90% Unknown 2.23%
Between A$50.01 million - A$100 million 4.50%Over A$100 million 21.20%

164
3.5.3 Sample Characteristics (Continue)
Types of Product Innovation introduced by company/SBU over a three-year period
No. of product innovation (Average)Innovation Portfolio
No. of product innovation (%)
Radical breakthroughs 1.54 270 (14.80%)
Technological breakthroughs 1.26 226 (13.60%)
Market breakthroughs 2.04 303 (21.80%)
Incremental innovations 4.66 829 (49.80%)
Total 1665 (100.00%)

165
3.6 Ethical Considerations and Confidentiality
This research project was reviewed and approved by the RMIT University Human Research
Ethics Committee (project number 1000360), and strictly followed the ethical guidelines of
RMIT University. It is the responsibility of the researcher in research involving human
subjects to protect the interests of the participants (Neuman, 2000). The primary concerns of
ethical surveying are anonymity, confidentiality and avoiding the exploitation of the subject
(Zikmund, 2000). Addressing these concerns may also increase the response rate and
accuracy of the data; participants are more willing to response to a survey and answer the
questions truthfully when their identity is undisclosed (Oppenheim, 1992).
Adhering to the ethical guidelines of RMIT University, the following statement was
included in the project information statement attached to the questionnaire:
If you have any complaints about the conduct of this research project, please
contact the Chair, RMIT Business College Human Ethics Advisory Network,
GPO Box 2476V, Melbourne, 3001, telephone +61 3 9925 5596, email
[email protected] Details of the complaints procedures are available
at http://www.rmit.edu.au/browse;ID=2jqrnb7hnpyo
Participants were assured of anonymity in that they would not be personally identified in
any subsequent reports, publications or presentations arising from the study. All data would
be analysed at the aggregate level. All the information that the participants provided was
strictly and securely controlled and would be accessible only to the identified researchers.
If the participants wished to receive a summary of the relevant findings of the study, they
could provide an e-mail address for the report to be sent to. A note attached to the online
questionnaire addressed the issues of confidentiality and exploitation of the subject:
IMPORTANT: Your information will be held strictly confidential and kept
securely on a host server, supported by RMIT University. The e-mail address
will be used solely by us for sending you the promised report and will never be
used for any other purposes.

166
3.7 Chapter Summary
The previous chapters explained the conceptual model of the research and the theoretical
foundations of the proposed hypotheses related to the research questions of this thesis. This
chapter has described the research method adopted for the study. A philosophical approach
of positivism was applied to the research through quantitative study using a cross-sectional
web-based survey. The web-based survey was designed using Qualtrics questionnaire
design software (Qualtrics, 2013). The design of the web-based survey was reviewed by
web designers to ensure a professional look and feel.
Details of the sampling, survey design and data collection process have been provided in
this chapter, including the response rate (179 usable questionnaires or 48.38% response
rate). The sampling frame of 370 highly innovative firms in Thailand was obtained
primarily from the database of the National Innovation Agency, Thailand (National
Innovation Agency, 2011, 2012). The survey questionnaire was developed after taking into
consideration an appropriate measurement scale, layout, accurate translation and use of
languages suitable for participants. Pre-testing of the questionnaire was conducted with key
academic and industry informants to ensure the readability and appropriateness of the
questions and alternative answers, and an appropriate survey completion time. Slight
refinements were made prior to the survey administration. The final version of the survey
questionnaire employed a bilingual instrument with English and Thai languages. Ethical
considerations were implemented throughout the data collection process according to the
guidelines provided by RMIT University.
The data collected were subjected to a preliminary examination and then edited, coded and
cleaned in preparation for the data analysis. The process of quantitative analysis, using
multiple statistical procedures, programs and analytical techniques, was explained in this
chapter.
The following chapter discusses the operationalisation, reliability and validity of the measures
used to capture the key constructs of the study. Chapter 5 reports on the testing of the
hypothesised relationships and the examination of the interrelationships in the path model.

167
CHAPTER 4: CONSTRUCT MEASUREMENT
4.1 Introduction to Measurement Scale Development
Chapter 4 first explains the operationalisation of the constructs that were introduced in the
theoretical model presented in Chapter 2. In order to analyse the casual linkages and
relationships between constructs, these constructs must be measured. Accordingly, the
constructs must be clearly conceptualised to gain a solid understanding of their true meaning
and nature. Each construct was operationalised through indicators (items), representing the
essential aspects and facets of the construct. The operationalisation was based on findings
from the literature review and previously tested scales considered to be the most appropriate
for the context of this study. Then, the indicators were pre-tested with industry experts and
academics for their relevance and suitability and were modified if necessary prior to the
administration of the survey.
On the basis of the empirical data, the tested indicators were formed into the measurement
models. The tested indicators were assessed in terms of their reliability and validity as part
of the structural model analysis (see Chapter 5). In accordance with several criteria, among
them those of Bagozzi (1979), Churchill (1979) and Peter (1979), the constructs were
evaluated and validated. These authors have criticised the field of marketing for not paying
enough attention to construct validity associated with measurement until the later 1970s.
Peter (1979), for instance, presented a comprehensive review of the traditional psychometric
approach to reliability and stated that “construct validity is a necessary condition for theory
development and testing. Thus, it is enigmatic that marketing researchers have given little
explicit attention to construct validation as is well documented in the marketing literature”
(Peter, 1981, p.133). Bagozzi (1981, p.376) argued that “convergence in measurement
should be considered a criterion to apply before performing the casual analysis because it
represents a condition that must be satisfied as a matter of logical necessity”.
This chapter reports on the analysis undertaken via coefficient alpha to examine construct
reliability. In terms of construct measurement, only reflective indicators are used to form the
measurement models as they better capture the variables described in Chapter 2. Construct
168
validity is of central concern to the scientific process (Churchill, 1999). It is primarily used
to assess the accuracy of the measurement scales to determine whether the intended
construct is the underlying cause of item co-variation. In this regard, confirmatory factor
analysis (CFA) is a special case of structural equation modelling that enables an assessment
of construct validity (Malhotra, Kim & Patil, 2006; Narver & Slater, 1990). CFA was
therefore conducted in AMOS v21 to assess the constructs in terms of convergent,
discriminant and monological validity. The measurement model, which can also be
formulated as a system of structural equations, was adjusted, where appropriate, to establish
measurement fit to the empirical data (Nunnally, 1978).
4.1.1 Operationalisation of Constructs
The operationalisation of the constructs involves how the measures are configured in order
for the constructs to be quantified (Rossiter, 2002). The literature review revealed that more
than one measure was pertinent to each construct. To develop the measurement instrument,
the most appropriate measurement scales were, therefore, selected for this study.
Considerations for the scale selection were based on relevance to the concepts and adoption
by other researchers in the domains of product innovation and management.
The scales were slightly modified to capture the NPD program level rather than the
individual project, and a few new items were added specifically for the purpose of this
study. Despite the minor modifications, the original meaning of each measurement item was
maintained. The new items were derived from the conceptual definitions of the constructs
and the literature in the relevant domains. The focus on the program level is a holistic
approach for understanding what factors account for the repeated success of a firm in
developing breakthrough innovations (Johne & Snelson, 1988).
Following the existing scales, all constructs were conceptualised as being of a reflective
nature. In general, formative and reflective indicators can be used for construct
measurement (Bagozzi, 1979). The decision whether a construct should be operationalised
as formative and/or reflective indicators was based on theoretical considerations of the
causal relationships between the latent variable and its respective indicators
169
(Diamantopoulos, Riefler & Roth, 2008; Diamantopoulos & Siguaw, 2006; Fornell &
Bookstein, 1982). A formative indicator is a function of its indicators, while reflective
indicators are caused by the construct. Thus, the reflective indicators presented in this study
are interchangeable, strongly correlated and have the same antecedents and consequences
(Jarvis, MacKenzie & Podsakoff, 2003).
4.1.1.1 Multiple-item Scales
The development of multi-item scales in marketing was adopted from the psychometric
literature and was influenced by the early work of Churchill (1979) and Peter (1979).
Accordingly, this study applied multi-item scales of constructs, as an approach preferred to
single item scales (Churchill, 1979). Using multi-item scales provides an opportunity to
measure multifaceted and complex constructs through aggregation. It allows averaging out
the degree of specificity where an item may present a low correlation with the construct
measured or correlate with other constructs. The determination of a multi-item scales is
necessary and each construct in the model should be measured by at least two items
(indicators) (Baumgartner & Homburg, 1996; Nunnally & Bernstein, 1994; Peter, 1979).
This is to demonstrate theoretical utility and to allow an assessment of both measurement
reliability and construct validity (Dillon, Madden & Firtle, 1990; Edwards, 2001; Ping,
2004).
4.1.1.2 Content Validity
“Content validity” (face validity) can be defined as “the degree to which elements of an
assessment instrument are relevant to and representative of the targeted construct for a
particular purpose” (Haynes, Richard & Kubany, 1995, p.238). This means that the
indicators must capture the domain of the construct being measured (Bohrnstedt, 1970;
Churchill, 1991). By specifying the domain of the construct and the items that exhaust the
domain, the resulting scale must be purified by experts in the field to obtain a content valid
instrument (Churchill, 1979).
As reported in Chapter 3, the measurement scales were assessed and validated in the pre-test
with a number of industry experts and academics in both Australia and Thailand, who were
knowledgeable in the areas of product innovation, marketing and management. This
expertise was also evident in the support obtained from the Product Development and

170
Management Association of Australia (PDMAA). These experts were also asked to evaluate
whether the assigned items measured the constructs prior to the survey being administered.
Valuable feedback on the instrument was received and minor modifications were made
accordingly. For instance, the language used in the questionnaire as adapted to be
practitioner (manager) focused rather than academic focused to improve comprehension of
the questions. Following the standard procedure for pre-testing, the final version of the
instrument was also informed by these experts.
Subsequently, the measurement instruments of the study were considered to have content
validity. The use of previously tested scales and the pre-testing procedure ensured that each
item was expressed with clarity and that the scales captured the domain of the constructs.
After administering the final version of the questionnaire and collecting the resultant data,
further evaluation was undertaken to assess construct reliability and validity. This is
discussed in the following section.
4.1.2 Reliability and Validity of Constructs
To assess the quality of the measurement instruments, reliability and validity have to be
evaluated. “Reliability” can be defined as the “degree to which measures are free from
random error” (Peter & Churchill, 1986, p.4). Assessing reliability determines whether the
scale or measurement of a phenomenon is precisely consistent and replicable (Carmines &
Zeller, 1979; Rossiter, 2002). Rossiter (2002, p.328) claimed that:
A score from a scale can be assessed for reliability (precision) but not the scale
itself. To be useful, both theoretical and practically, the score has to come from
a valid scale. Highly precise, reliable scores can be obtained from non valid
scales, and high reliability, per se, says nothing about validity.
“Construct validity” describes the relationship between the construct and its indicators or
measurement tool. It confirms that the constructs are measured by a network of related
hypotheses generated from a theory. Thus, high construct validity means that the
measurement is conceptually correct (Kline, 2005). Churchill (1979, p.65) stated that “a
measure is valid when the differences in observed scores reflect true differences on the
characteristic one is attempting to measure and nothing else”.
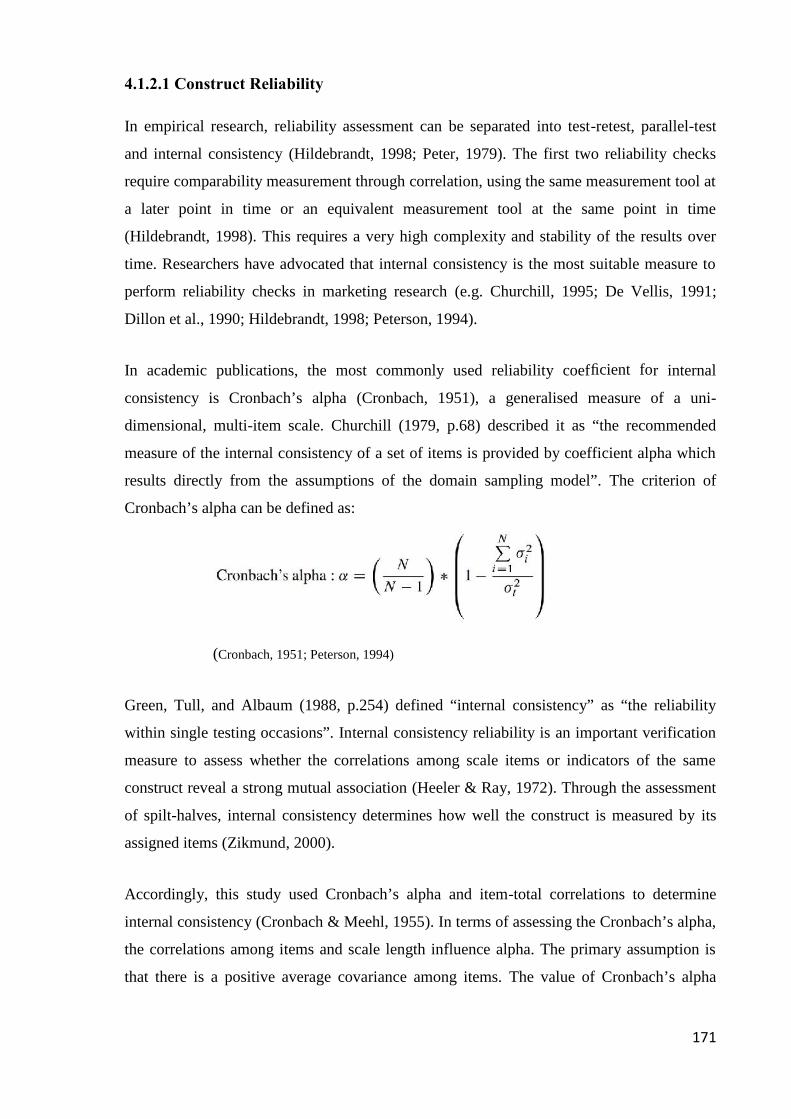
171
4.1.2.1 Construct Reliability
In empirical research, reliability assessment can be separated into test-retest, parallel-test
and internal consistency (Hildebrandt, 1998; Peter, 1979). The first two reliability checks
require comparability measurement through correlation, using the same measurement tool at
a later point in time or an equivalent measurement tool at the same point in time
(Hildebrandt, 1998). This requires a very high complexity and stability of the results over
time. Researchers have advocated that internal consistency is the most suitable measure to
perform reliability checks in marketing research (e.g. Churchill, 1995; De Vellis, 1991;
Dillon et al., 1990; Hildebrandt, 1998; Peterson, 1994).
In academic publications, the most commonly used reliability coefficient for internal
consistency is Cronbach’s alpha (Cronbach, 1951), a generalised measure of a uni-
dimensional, multi-item scale. Churchill (1979, p.68) described it as “the recommended
measure of the internal consistency of a set of items is provided by coefficient alpha which
results directly from the assumptions of the domain sampling model”. The criterion of
Cronbach’s alpha can be defined as:
(Cronbach, 1951; Peterson, 1994)
Green, Tull, and Albaum (1988, p.254) defined “internal consistency” as “the reliability
within single testing occasions”. Internal consistency reliability is an important verification
measure to assess whether the correlations among scale items or indicators of the same
construct reveal a strong mutual association (Heeler & Ray, 1972). Through the assessment
of spilt-halves, internal consistency determines how well the construct is measured by its
assigned items (Zikmund, 2000).
Accordingly, this study used Cronbach’s alpha and item-total correlations to determine
internal consistency (Cronbach & Meehl, 1955). In terms of assessing the Cronbach’s alpha,
the correlations among items and scale length influence alpha. The primary assumption is
that there is a positive average covariance among items. The value of Cronbach’s alpha
172
varies between 0 and 1, where a value closer to 1 indicates stronger reliability. A low alpha
score implies that there is either an insufficient number of items or that the combination of
items does not adequately capture the construct or attribute (Churchill & Iacobucci, 2005).
Some researchers have recommended a common threshold for sufficient values of
Cronbach’s alpha or internal consistency and item-total correlations between 0.5 and 0.6
(Hair, Black, Babin, Anderson & Tatham, 2006; Nunnally, 1967; Nunnally & Bernstein,
1994; Venkatraman & Ramanujam, 1986). However, other social sciences and marketing
scholars have advocated an alpha score of 0.70 or greater as adequate (e.g. Cortina, 1993; de
Vaus, 1985, 1995; De Vellis, 1991; Hulland, Chow & Lam, 1996; Kline, 2005; Nunnally,
1978; Pallant, 2005; Peterson, 1994). Following this more recent research, this study used
an alpha score of 0.7 or greater to assess construct reliability.
4.1.2.2 Convergent Validity
“Convergent validity” can be defined as “the degree to which two or more attempts to
measure the same concept through maximally dissimilar methods are in agreement”
(Bagozzi & Phillips, 1982, p.468) or “the extent to which it correlates highly with other
methods designed to measure the same construct” (Churchill, 1979, p.70). In other words,
convergent validity refers to the extent to which the indicators or items of a specific
construct share a considerably high proportion of relatedness (correlation) among each other
(Churchill, 1979; Hair et al., 2006). A construct is valid only if it measures what it is
supposed to measure (Zikmund, 2000). In this respect, the measurement models were
operationalised reflectively where confirmatory factory analysis was undertaken to assess
convergent validity (Podsakoff, Todor, Grover & Huber, 1984). Section 4.1.2.4 explains the
measurement model assessment for convergent validity.
4.1.2.3 Discriminant Validity
“Discriminant validity” can be defined as “the degree to which measures of distinct
concepts differ” (Bagozzi & Phillips, 1982, p.469) or “the extent to which the measure is
indeed novel and not simply a reflection of some other variable” (Churchill, 1979, p.70). In
other words, discriminant validity refers to “the dissimilarity in a measurement tool’s
measurement of different constructs” (Götz, Liehr-Gobbers & Krafft, 2010, p.696).
173
While convergent validity suggests that a high degree of relatedness for indicators of the
same factor, discriminant validity indicates that the indicators of different latent variables
should exhibit a low degree of relatedness or correlation between each other (Bagozzi, Yi &
Singh, 1991). Discriminant validity was tested in this study through the confirmatory factor
analysis model, which is explained in the following section.
4.1.2.4 Measurement Models
A measurement model is used to describe a series of relationships that advocate how
measured variables signify a construct that is not measured directly (Hair et al., 2006).
Confirmatory factor analysis (CFA) is a measurement model that specifies relationships
among the measured or observed variables underlying the latent variables. CFA models are
commonly used to assess the convergent validity and discriminant validity (Anderson &
Gerbing, 1988; Steenkamp & van Trijp, 1991). CFA examines a measurement model for
testing the hypothesised relationships and addressing the adequacy of the observed items as
measures for the construct in order to establish validity and uni-dimensionality.
“Unidimensionality” is “the existence of one latent trait or construct underlying a set of
measures”(Anderson, Gerbing & Hunter, 1987, p.432).
This study employed CFA for measurement model assessment (Anderson & Gerbing,
1988). Respectively, the examination and assessment of the proposed measurement is
presented in this Chapter using CFA models. The next Chapter reports on the examination
and assessment of the relationships between the model constructs using partial least square
structural equation modelling (PLS-SEM) (Ringle, Sarstedt & Mooi, 2010; Ringle et al.,
2005).
Following the standard CFA process, the development of the measurement models for each
construct was based on theoretical principles where covariance structure analysis were
conducted in Analysis of Moment Structures (AMOS) v21. Covariance structure analysis is
a multivariate technique that tests the theoretical structure of the measurement model, as
presented in Figures 4.1 to 4.8 (Schumacker & Lomax, 2010).

174
The covariance structure analysis combines confirmatory factor analysis with structural
equation models. Squares or rectangles represent observed variables and circles or ellipses
represent latent variables to provide a diagram of the combined measurement and structural
models. Arrows indicate the theoretical linkage of items/indicators (observed variables) as
attributes to the construct (latent variables). As the indicators for this study are of a
reflective nature, the measurement items are associated with measurement or response
errors (e.g. ‘e12’) and must be included in the measurement model to represent the extent to
which the variable does not measure the hypothesised variable. Further, factor loadings and
loadings coefficients can range from 0 to 1, which represents the correlation of the latent
variables with the construct and its cohesion with other variables (Arbuckle & Wothke,
1999; Byrne, 2010). The relationships among the latent variables reflected in the
measurement model are subjected to substantive theory such as model validity (Schumacker
& Lomax, 2004).
Convergent validity
To assess the convergent validity, a common measure is the average variance extracted
(AVE) (Fornell & Larcker, 1981). Convergent validity is based on the
correlation/relatedness between responses obtained by maximally different methods of
measuring the same construct (Peter, 1981). AVE is the degree of variance of its indicators
captured by the construct in relation to the total amount of variance while calculating the
variance due to measurement error. An AVE value of less than 0.5 can be considered
insufficient for the overall fit of the model, as more variance is due to error variance than to
indicator variance (Homburg & Giering, 1996). AVE is formally defined as follows:
(Fornell & Larcker, 1981, p.45)
To further assess the convergent validity, internal consistency can be determined by
computing composite reliabilities (Fornell & Larcker, 1981). Composite reliability (CR)
requires that all the assigned indicators jointly measure the same construct adequately,
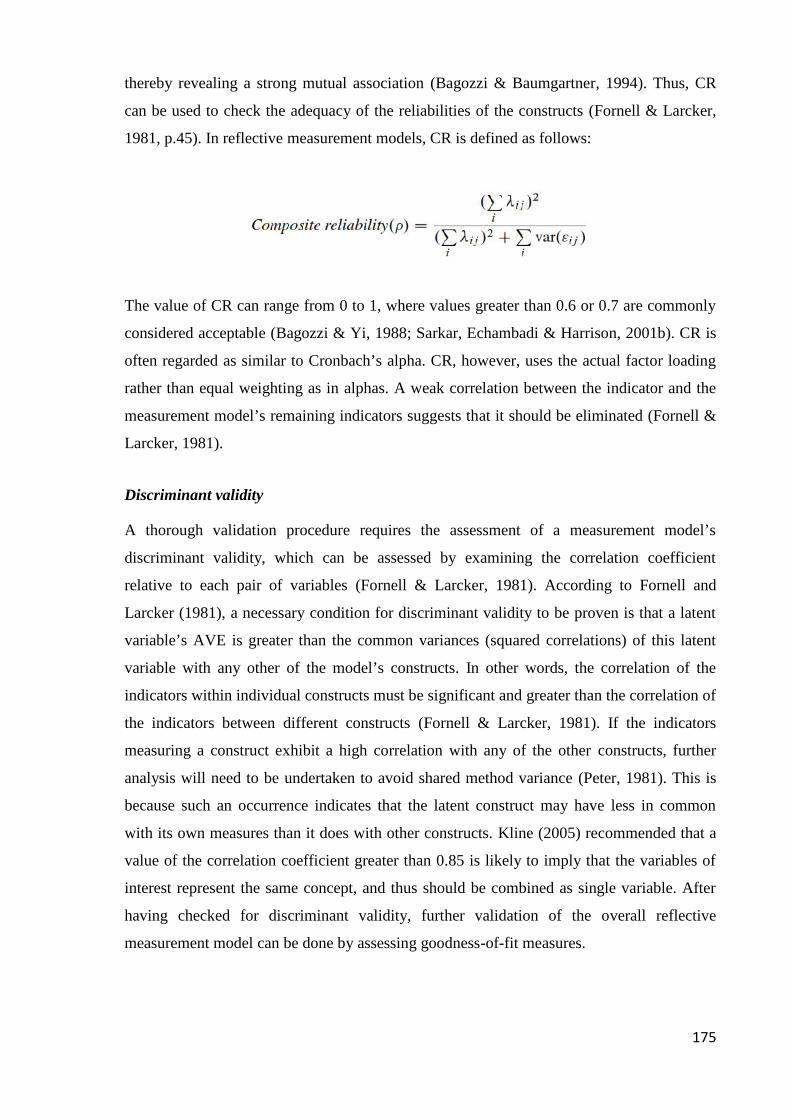
175
thereby revealing a strong mutual association (Bagozzi & Baumgartner, 1994). Thus, CR
can be used to check the adequacy of the reliabilities of the constructs (Fornell & Larcker,
1981, p.45). In reflective measurement models, CR is defined as follows:
The value of CR can range from 0 to 1, where values greater than 0.6 or 0.7 are commonly
considered acceptable (Bagozzi & Yi, 1988; Sarkar, Echambadi & Harrison, 2001b). CR is
often regarded as similar to Cronbach’s alpha. CR, however, uses the actual factor loading
rather than equal weighting as in alphas. A weak correlation between the indicator and the
measurement model’s remaining indicators suggests that it should be eliminated (Fornell &
Larcker, 1981).
Discriminant validity
A thorough validation procedure requires the assessment of a measurement model’s
discriminant validity, which can be assessed by examining the correlation coefficient
relative to each pair of variables (Fornell & Larcker, 1981). According to Fornell and
Larcker (1981), a necessary condition for discriminant validity to be proven is that a latent
variable’s AVE is greater than the common variances (squared correlations) of this latent
variable with any other of the model’s constructs. In other words, the correlation of the
indicators within individual constructs must be significant and greater than the correlation of
the indicators between different constructs (Fornell & Larcker, 1981). If the indicators
measuring a construct exhibit a high correlation with any of the other constructs, further
analysis will need to be undertaken to avoid shared method variance (Peter, 1981). This is
because such an occurrence indicates that the latent construct may have less in common
with its own measures than it does with other constructs. Kline (2005) recommended that a
value of the correlation coefficient greater than 0.85 is likely to imply that the variables of
interest represent the same concept, and thus should be combined as single variable. After
having checked for discriminant validity, further validation of the overall reflective
measurement model can be done by assessing goodness-of-fit measures.
176
4.1.2.5 Goodness-of-Fit Measures
For the evaluation of an overall measurement model, there are several fit criteria and
inference statistical measures. The measurement models were developed in AMOS v21 and
analysed using the CFA model fit assessments (Goodness-of-fit measures). The use of the
CFA model fit assessments provides criteria to determine how well the specified factor
model or hypothesised model fits the data (Kline, 2005). This involves two commonly
accepted types of model fit indices: absolute fit and incremental fit (Hoyle & Panter, 1995).
Absolute fit can be used to observe model fit as it concerns the degree to which the
hypothesised model reproduces the covariance matrix (Shah & Goldstein, 2006). This
includes the basic indices, which are chi-square (x²) statistics, degree of freedom (df) and
significance level (p value). According to Hoyle and Panter (1995) and Kline (2005), some
ambiguities associated with interpreting chi-square might occur when the study involves a
large sample size. Alternative fit indices to quantify the degree of model fit include relative
chi-square (x²/df) and root mean square error of approximation (RMSEA).
Incremental fit indicates the degree to which the model is superior to the alternative models;
the null model in which no covariances among the variables are specified and the model that
perfectly fits the data (Hoyle & Panter, 1995; Shah & Goldstein, 2006). Common
incremental fit indices are Normed Fit Index (NFI), Tucker-Lewis Index (TLI) and
Comparative Fit Index (CFI) (Shah & Goldstein, 2006). Generally, the fit indices need to be
good for the model to be accepted. If the model represents unsatisfactory fit indices, it will
typically be re-specified to improve the model fit rather than be rejected. Further model fit
can be evaluated from model parsimony by comparing an over-identified model with a
restricted model in order to see the number of estimated coefficients required to achieve a
specific level of fit (Kline, 2005).
In this study, a combination of model fit indicators and model comparison criteria using
maximum likelihood estimation (MLE) is presented in Table 4.1, as the most widely used
model fit assessment (Garson, 2009; Hair et al., 2006; Kline, 2005; Shah & Goldstein,
2006). The application of the MLE method was conducted under the assumption of
multivariate normality distribution (Hair, Anderson, Tatham & Black, 1998; Schumacker &
Lomax, 1996).
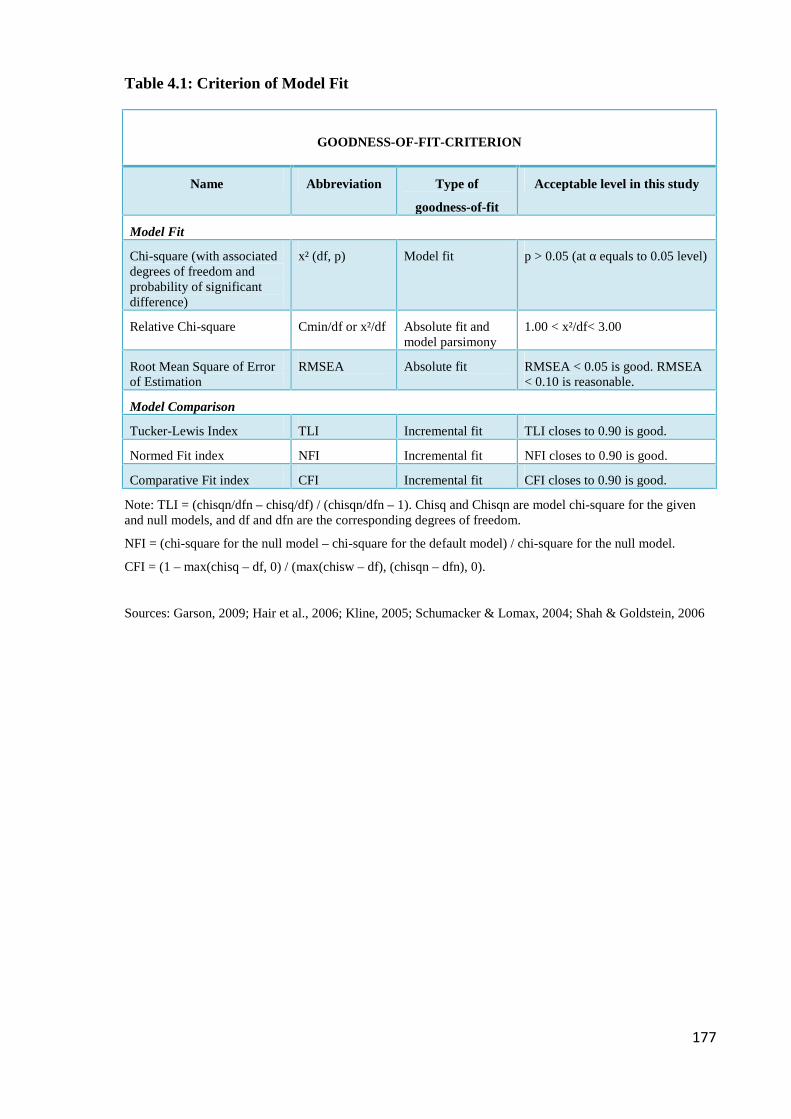
177
Table 4.1: Criterion of Model Fit
GOODNESS-OF-FIT-CRITERION
Name Abbreviation Type of
goodness-of-fit
Acceptable level in this study
Model Fit
Chi-square (with associateddegrees of freedom andprobability of significantdifference)
x² (df, p) Model fit p > 0.05 (at α equals to 0.05 level)
Relative Chi-square Cmin/df or x²/df Absolute fit andmodel parsimony
1.00 < x²/df< 3.00
Root Mean Square of Errorof Estimation
RMSEA Absolute fit RMSEA < 0.05 is good. RMSEA< 0.10 is reasonable.
Model Comparison
Tucker-Lewis Index TLI Incremental fit TLI closes to 0.90 is good.
Normed Fit index NFI Incremental fit NFI closes to 0.90 is good.
Comparative Fit index CFI Incremental fit CFI closes to 0.90 is good.
Note: TLI = (chisqn/dfn – chisq/df) / (chisqn/dfn – 1). Chisq and Chisqn are model chi-square for the givenand null models, and df and dfn are the corresponding degrees of freedom.
NFI = (chi-square for the null model – chi-square for the default model) / chi-square for the null model.
CFI = (1 – max(chisq – df, 0) / (max(chisw – df), (chisqn – dfn), 0).
Sources: Garson, 2009; Hair et al., 2006; Kline, 2005; Schumacker & Lomax, 2004; Shah & Goldstein, 2006
178
4.2 Operationalisation, Reliability and Validity of Main
Independent Measures
4.2.1 Absorptive Capacity (ACAP)
4.2.1.1 Operationalisation of ACAP
Building on the work of Cohen and Levinthal (1990), the concept of absorptive capacity has
received considerable interest from academics for the last two decades. In the literature,
absorptive capacity has been shown to influence organisational learning (Lane & Lubatkin,
1998; Lane, Salk & Lyles, 2001), firm performance, knowledge sharing (Gupta &
Govindarajan, 2000; Szulanski, 1996), capability building and innovation (Tsai, 2001).
Although Cohen and Levinthal (1990) highlighted the importance of absorptive capacity
and its multidimensionality, most researchers have typically measured it as a uni-
dimensional construct through simple R&D proxies (Lane et al., 2006). Previous studies
have often used a firm’s R&D spending intensity to capture absorptive capacity (e.g.
Belderbos, Carree, Diederen, Lokshin & Veugelers, 2004; Oltra & Flor, 2003; Stock et al.,
2001; Tsai, 2001). As mentioned in Chapter 2, it has been argued that R&D is not sufficient
to capture absorptive capacity, particularly for all kinds of knowledge. Absorptive capacity
involves a variety of dimensions and a degree of complexity that have implications for
different organisational outcomes. The sources of absorptive capacity build on prior
organisational knowledge and experience which contribute to a firm’s overall absorptive
capacity in due course (Schmidt, 2005). Thus, the use of single dimensional measure such as
an R&D proxy is unable to fully gauge the concept of absorptive capacity and may result in
misleading findings about its nature and contributions.
Zahra and George (2002) described absorptive capacity (ACAP) and its potential of being a
multidimensional construct. Lane et al. (2006) stated that “absorptive capacity should be
empirically explored in non-R&D contexts using metrics that capture each dimension of the
absorptive capacity process in a manner appropriate for that context” (p.858). The use of
R&D measures typically treat “absorptive capacity as a static resource and not as a process
or capability” (Lane et al., 2006, p.838). Despite a considerable number of studies that have
operationalised ACAP, the measures seem to limit the generalis ability of the results due to
179
their small sample sizes (Jansen, Van Den Bosch & Volberda, 2005; Szulanski, 1996). An
appropriate measure of ACAP and its various dimensions is not clearly evident in the
literature (Wang & Ahmed, 2007).
The study by Flatten et al. (2011) developed and validated a multidimensional measure of
ACAP. It built on the relevant prior literature and extended the simple proxies commonly
used in the literature through a series of pre-tests and two large surveys of German
companies. Accordingly, Flatten et al. (2011) scale has been adopted in this study to
operationalise the ACAP construct. The ACAP scale by Flatten et al. (2011) captured the
four dimensions proposed by Zahra and George (2002), which are also used in this study.
The original measure consisted of 14 items representing reflective measures.
Building on the work of Flatten et al. (2011), the scale of absorptive capacity for this study
is comprised of 15 items best representing evaluation of the general organisational routines
and processes related to information processing and knowledge management. The ACAP
construct was operationalised by its subsets of potential and realised absorptive capacities
(PACAP/RACAP), which consist of acquisition, assimilation, transformation and
exploitation of knowledge dimensions. Slight modifications were made to the items to
capture the company and SBU level (NPD program). An additional item was added to the
knowledge exploitation dimension to capture the extent to which the company or SBU has
the ability to work more effectively by adopting new ideas. In line with the definition of
breakthrough innovation, this study explores both new ideas and new technologies for a new
product line; therefore, the existing item for the adoption of new technologies was extended.
Further, the existing preambles for each of the dimensions were slightly adapted.
Table 4.2 presents the ACAP measure and a total of 15 items.
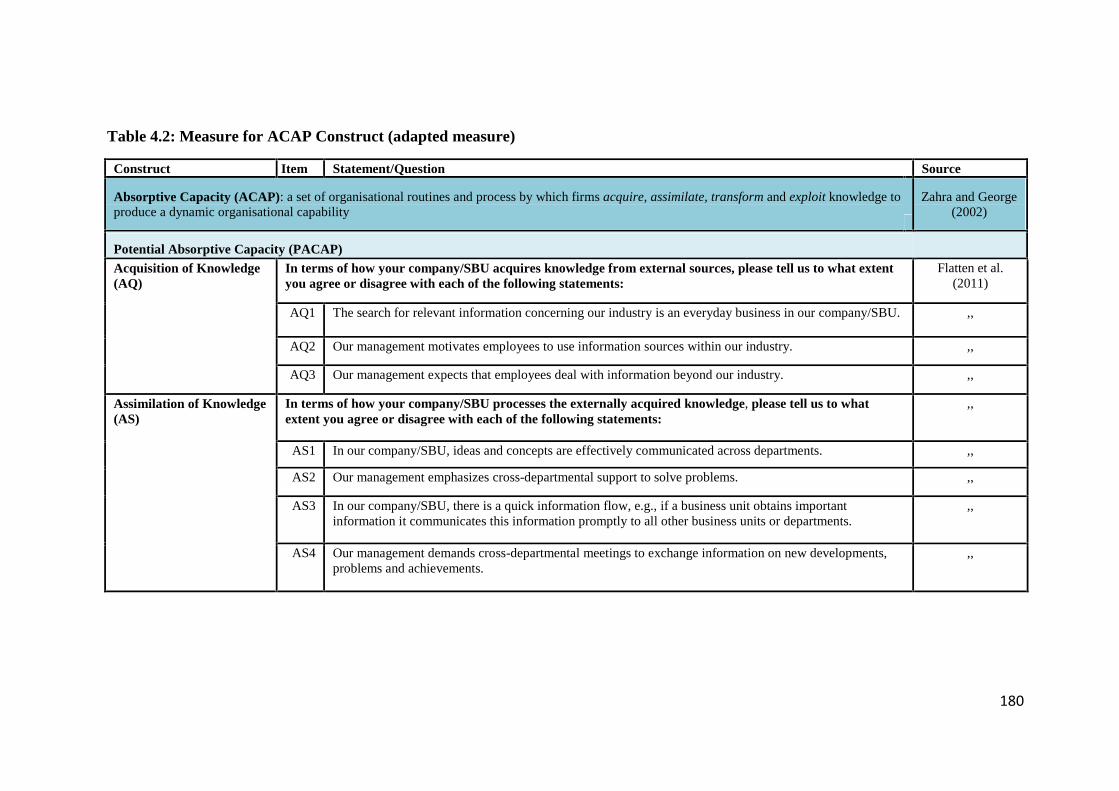
180
Table 4.2: Measure for ACAP Construct (adapted measure)
Construct Item Statement/Question Source
Absorptive Capacity (ACAP): a set of organisational routines and process by which firms acquire, assimilate, transform and exploit knowledge toproduce a dynamic organisational capability
Zahra and George(2002)
Potential Absorptive Capacity (PACAP)Acquisition of Knowledge(AQ)
In terms of how your company/SBU acquires knowledge from external sources, please tell us to what extentyou agree or disagree with each of the following statements:
Flatten et al.(2011)
AQ1 The search for relevant information concerning our industry is an everyday business in our company/SBU. ,,
AQ2 Our management motivates employees to use information sources within our industry. ,,
AQ3 Our management expects that employees deal with information beyond our industry. ,,
Assimilation of Knowledge(AS)
In terms of how your company/SBU processes the externally acquired knowledge, please tell us to whatextent you agree or disagree with each of the following statements:
,,
AS1 In our company/SBU, ideas and concepts are effectively communicated across departments. ,,
AS2 Our management emphasizes cross-departmental support to solve problems. ,,
AS3 In our company/SBU, there is a quick information flow, e.g., if a business unit obtains importantinformation it communicates this information promptly to all other business units or departments.
,,
AS4 Our management demands cross-departmental meetings to exchange information on new developments,problems and achievements.
,,

181
Table 4.2: Measure for ACAP Construct (continued)
Construct Item Statement/Question Source
Absorptive Capacity (ACAP)
Realised Absorptive Capacity (RACAP)
Transformation ofKnowledge (TR)
In terms of how employees within your company/SBU combine their existing knowledge with newknowledge, please tell us to what extent you agree or disagree with each of the following statements:
Flatten et al. (2011)
TR1 Our employees have an exceptional ability to structure and to use collected knowledge. ,,
TR2 Our employees are used to absorbing new knowledge as well as preparing it for further purposes and tomake it available.
,,
TR3 Our employees successfully link existing knowledge with new insights. ,,
TR4 Our employees are able to apply new knowledge in their practical work. ,,
Exploitation of Knowledge(EX)
In terms of how your company/SBU exploits new knowledge to develop new products, please tell us to whatextent you agree or disagree with each of the following statements:
,,
EX1 Our management supports the development of product prototypes to test a concept or process and makesure things work before starting actual development.
,,
EX2 Our company/SBU regularly reconsiders technologies and ideas and adapts them according to newknowledge.
,,
EX3 Our company/SBU has the ability to work more effectively by adopting new technologies. ,,
EX4 Our company/SBU has the ability to work more effectively by adopting new ideas. New item

182
4.2.1.2 Reliability and Validity of ACAP
The reliability of ACAP measure is shown in the following Table 4.3. ACAP exhibits good
reliability, with coefficient alphas of acquisition of knowledge 0.868, assimilation of
knowledge 0.899, transformation of knowledge 0.942 and exploitation of knowledge 0.917.
The coefficient alphas of ACAP ranged from 0.868 to 0.917, showing that they were well
above the acceptable level of 0.5 to 0.6 (Nunnally & Bernstein, 1994; Venkatraman &
Ramanujam, 1986) and were greater than the range of 0.7 that has been recently advocated
(Cortina, 1993; de Vaus, 1995). The results indicate that the particular set of items share the
common core of ACAP and capture it well as a construct.
Table 4.3: Reliability for ACAP measure
Numberof
Items
Cronbach’sAlpha
Construct N = 179
AbsorptiveCapacity(ACAP)
PotentialAbsorptiveCapacity(PACAP)
Acquisition of Knowledge (AQ) 3 0.868
Assimilation of Knowledge (AS) 4 0.899
RealisedAbsorptiveCapacity(RACAP)
Transformation of Knowledge (TR) 4 0.942
Exploitation of Knowledge (EX) 4 0.917
To assess the validity of the ACAP measure, internal consistency, average variance
extracted (AVE) and correlation matrix were examined and are shown in Table 4.4.
Table 4.4: Internal consistency, square roots of average variance extracted andcorrelation matrix and model fit of – ACAP
Construct Internal Consistency AVE
1 2 3 4
AQ 0.88 0.84
AS 0.90 0.59 0.83
TR 0.94 0.58 0.64 0.90
EX 0.92 0.65 0.71 0.70 0.85

183
The AVE accounted for by acquisition of knowledge (0.84) was greater than the correlation
between acquisition of knowledge and assimilation of knowledge (0.59) and greater than
both the correlation between acquisition of knowledge and transformation of knowledge
(0.58) and the correlation between acquisition of knowledge and exploitation of knowledge
(0.65).
The AVE accounted for by assimilation of knowledge (0.83) was greater than the
correlation between assimilation of knowledge and transformation of knowledge (0.64) and
greater than the correlation between assimilation of knowledge and exploitation of
knowledge (0.71). The AVE accounted for by transformation of knowledge (0.90) was
greater the correlation between transformation of knowledge and exploitation of knowledge
(0.70).
The AVE accounted for by exploitation of knowledge (0.85) was greater than the
correlation between exploitation of knowledge and acquisition of knowledge (0.65),
between exploitation of knowledge and assimilation of knowledge (0.71) and between
exploitation of knowledge and transformation of knowledge (0.70).
Overall, the average variance extracted for each of the four dimensions was well above 0.5,
which indicates good convergent validity. Further, the internal consistency measures
support the presence of convergent validity of the constructs with internal consistency
scores above 0.8 (Sarkar et al., 2001b). The results suggest that acquisition, assimilation,
transformation and exploitation of knowledge are distinct measures of absorptive capacity;
the 15 items were therefore retained in the study. Furthermore, the goodness-of-fit analysis
for ACAP is shown in Table 4.5 below and indicates a good model fit.
Table 4.5: Goodness-of-fit analysis – ACAP
GOODNESS-OF-FITMEASURE RESULT GOODNESS-OF-FIT MEASURE RESULT
Model Fit Model Comparison
Chi-squared 213.861 Tucker-Lewis Index (TLI) 0.931
Degree of Freedom 83 Normed Fit Index (NFI) 0.915
p-value 0.000 Comparative Fit Index (CFI) 0.946
Cmin/df 2.577
RMSEA 0.094
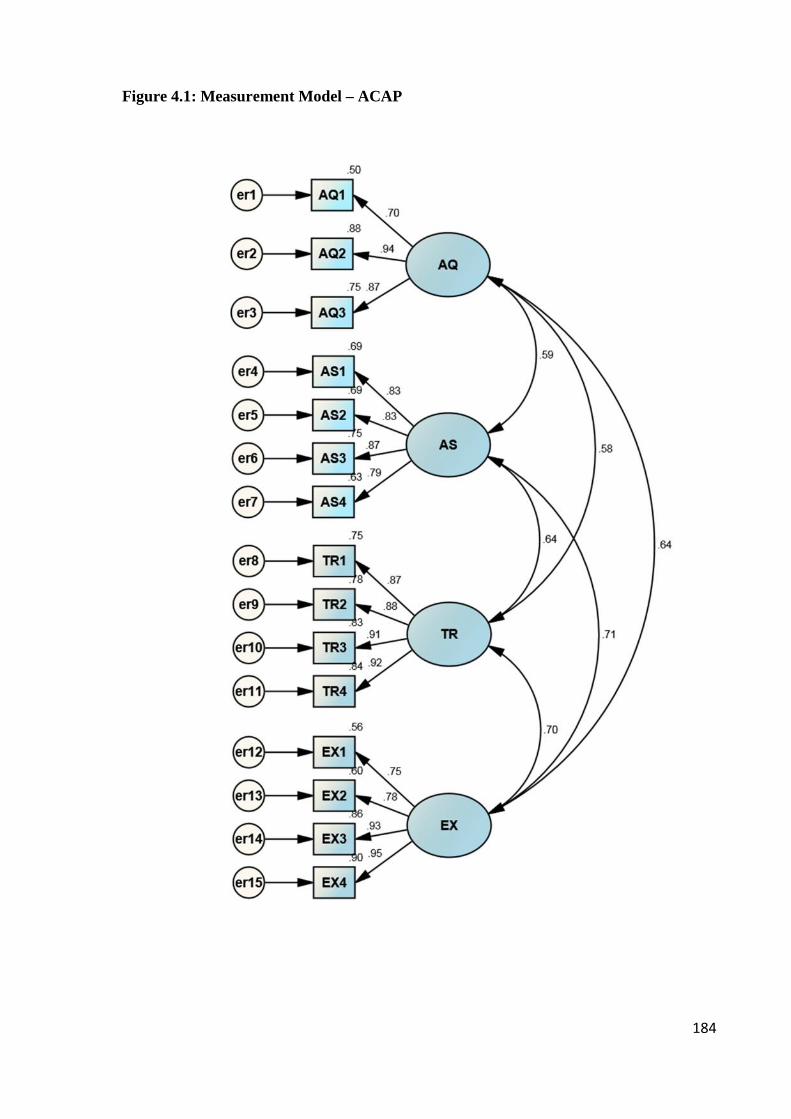
184
Figure 4.1: Measurement Model – ACAP
185
4.2.2 Market Visioning Competence (MVC)
4.2.2.1 Operationalisation of MVC
According to Reid and de Brentani (2010), market visioning competence (MVC) is a
multidimensional, second-order construct made up of four first-order constructs: market
learning tools, proactive market orientation, idea driving and networking dimensions. In
terms of the MVC scale, these dimensions consist of 13 items. Some adaptation and
modifications were made to these original items, including a preamble to reflect product-
innovation-related tasks and thinking related to the front end of breakthrough innovation in
a company/SBU. In particular, these original items were modified to capture the NPD
program level rather than an individual project.
The preamble to idea driving and networking dimensions was slightly adapted to fit the
context of breakthrough innovation. In this study, the definition of breakthrough innovation
captures both radical and really new innovations. Accordingly, the unit of analysis, as
identified in Chapter 3, is the company/business unit level (NPD program), where research,
development and commercialisation of radical innovation, market breakthrough and/or
technological breakthrough were undertaken. The existing preamble to idea driving and
networking stated that “the person who first championed this technology in our firm…”
(Reid & de Brentani, 2010, p.517). It thus appeared to limit the measure to radically new,
high-tech products.
A new preamble was developed for the market learning tools and proactive market
orientation dimensions. No existing preamble was found that supported both of the
dimensions. The purpose of developing the preamble was to improve the accuracy of the
responses by providing a clear explanation and instruction leading the participants into the
questions. The developed preamble states: “please think about the nature of market
visioning for breakthrough innovations within your company/SBU and indicate the degree
to which you agree or disagree with these statements”.
Further analysis of the MVC construct suggested dropping an item in the original market
learning tool dimension. The item was: “we use forecasting and market estimation
techniques before making a market selection” (Reid & de Brentani, 2010, p.518). The item
186
appeared to have a low eigenvalue (0.651) and is closely related to another item of MVC
(ML3): “we use several forecasting and market estimation techniques before making a final
market selection” (Reid & de Brentani, 2010, p.518). As discussed in Chapter 3, a number
of industry experts and academics familiar with this area of study were asked to assess
whether the assigned items measured the constructs. In this regard, there were suggestions
from the experts to remove the described item from the original MVC construct because the
item might confound the clarity of the MVC measure and result in poor content validity.
The removal of such item would also add to instrument parsimony. The modification to the
MVC construct was therefore made.
In addition, one of the items of the market learning tool dimension was adapted to fit the
context of breakthrough innovation. The original item was: “we tried to keep our market
opportunity options open as long as possible for the new technology” (Reid & de Brentani,
2010, p.518). The adapted item now measures: “we try to keep our market opportunity
options open as long as possible for potential breakthrough products” (ML1). In a similar
vein, one of the items of networking was extended to capture the current state of product-
related networking, rather than being limited to new technology. The original item “was at
the centre of the network growing up around the technology” (Reid & de Brentani, 2010, p.
517). The adapted item now measures: “are at the centre of the network growing around the
products and their technologies” (NW3).
Slight modifications were made to one of the items of idea driving (ID2) and one of the
items of networking (NW1) to capture both the company and SBU levels. The original items
referred only to the company level. In addition, an item (ID2) was clarified to reflect the
early activities of the NPD process. The original item was: “…got key decision makers in
our firm involved” (Reid & de Brentani, 2010, p. 517). The adapted item now measures:
“…get key decision makers in our company/SBU involved early”. This modification also
applied to the item (ID4) of the idea driving dimension.
A new item was also added specifically to the idea driving dimension to capture the unique
context of front end decision making in the case of breakthrough innovations. This item
captures the extent to which individuals who first champion breakthrough innovations in the
company/SBU often make important decisions based on their intuition rather than on data.

187
As noted in Chapter 2, the importance of intuition has been highlighted particularly at the
front end of breakthrough innovation. This is because intuition, at its core of pattern
recognition, may lead to the discovery of an unaddressed market need or a new technology
path (de Brentani & Reid, 2012; Reid & de Brentani, 2004). The item was adopted from
existing measures on intuition proposed by Khatri and Ng (2000) and Dayan and Elbanna
(2011).
The MVC construct is comprised of a total of 13 items after the adjustments were made.
The industry experts and academics were involved in finalising these items and making sure
that they captured the domain of MVC construct.
Table 4.6 presents the MVC measure and the 13 items prior to exposure to MVC
measurement model.
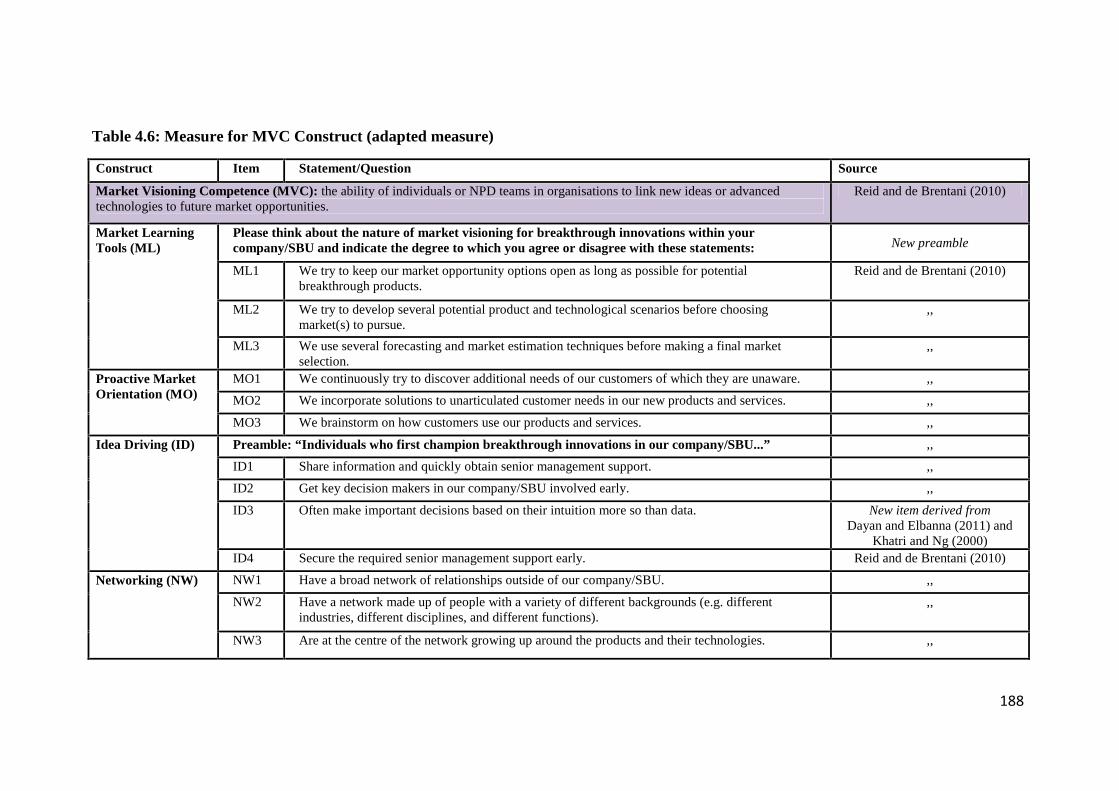
188
Table 4.6: Measure for MVC Construct (adapted measure)
Construct Item Statement/Question Source
Market Visioning Competence (MVC): the ability of individuals or NPD teams in organisations to link new ideas or advancedtechnologies to future market opportunities.
Reid and de Brentani (2010)
Market LearningTools (ML)
Please think about the nature of market visioning for breakthrough innovations within yourcompany/SBU and indicate the degree to which you agree or disagree with these statements: New preamble
ML1 We try to keep our market opportunity options open as long as possible for potentialbreakthrough products.
Reid and de Brentani (2010)
ML2 We try to develop several potential product and technological scenarios before choosingmarket(s) to pursue.
,,
ML3 We use several forecasting and market estimation techniques before making a final marketselection.
,,
Proactive MarketOrientation (MO)
MO1 We continuously try to discover additional needs of our customers of which they are unaware. ,,
MO2 We incorporate solutions to unarticulated customer needs in our new products and services. ,,
MO3 We brainstorm on how customers use our products and services. ,,
Idea Driving (ID) Preamble: “Individuals who first champion breakthrough innovations in our company/SBU...” ,,
ID1 Share information and quickly obtain senior management support. ,,
ID2 Get key decision makers in our company/SBU involved early. ,,
ID3 Often make important decisions based on their intuition more so than data. New item derived fromDayan and Elbanna (2011) and
Khatri and Ng (2000)ID4 Secure the required senior management support early. Reid and de Brentani (2010)
Networking (NW) NW1 Have a broad network of relationships outside of our company/SBU. ,,
NW2 Have a network made up of people with a variety of different backgrounds (e.g. differentindustries, different disciplines, and different functions).
,,
NW3 Are at the centre of the network growing up around the products and their technologies. ,,

189
4.2.2.2 Reliability and Validity of MVC
The reliability of the MVC measure is shown in Table 4.7. The MVC measure exhibits good
reliability, with coefficient alphas of market learning tools 0.741, proactive market
orientation 0.780, idea networking 0.706 and networking 0.874. The coefficient alphas of
MVC ranged from 0.706 to 0.874, showing that they are higher than the acceptable level of
0.7 (Nunnally, 1967). This indicates that the particular set of items adequately captures
MVC as a construct.
Table 4.7: Reliability for MVC measure
Cronbach’ sAlpha
ConstructNumberof Items N = 179
Market VisioningCompetence (MVC)
Market Learning Tools (ML) 3 0.741
Proactive Market Orientation (MO) 3 0.780
Idea Driving (ID) 4 0.706
Networking (NW) 3 0.874
To assess the validity of the MVC measure, internal consistency, average variance extracted
(AVE) and correlation matrix were examined and are shown in Table 4.8.
Table 4.8: Internal consistency, square roots of average variance extracted andcorrelation matrix and model fit – MVC
Construct Internal Consistency AVE
1 2 3 4
ML 0.74 0.69
MO 0.78 0.98 0.73
ID 0.80 0.77 0.82 0.68
NW 0.88 0.76 0.79 0.83 0.84
The average variance extracted for each of the four dimensions was well above 0.5, which
suggests good convergent validity. Unexpectedly, the indicators of MVC correlated highly
with each other. The AVE accounted for by market learning tool (0.69) was comparatively
lower than the correlation between market learning tool and proactive market orientation
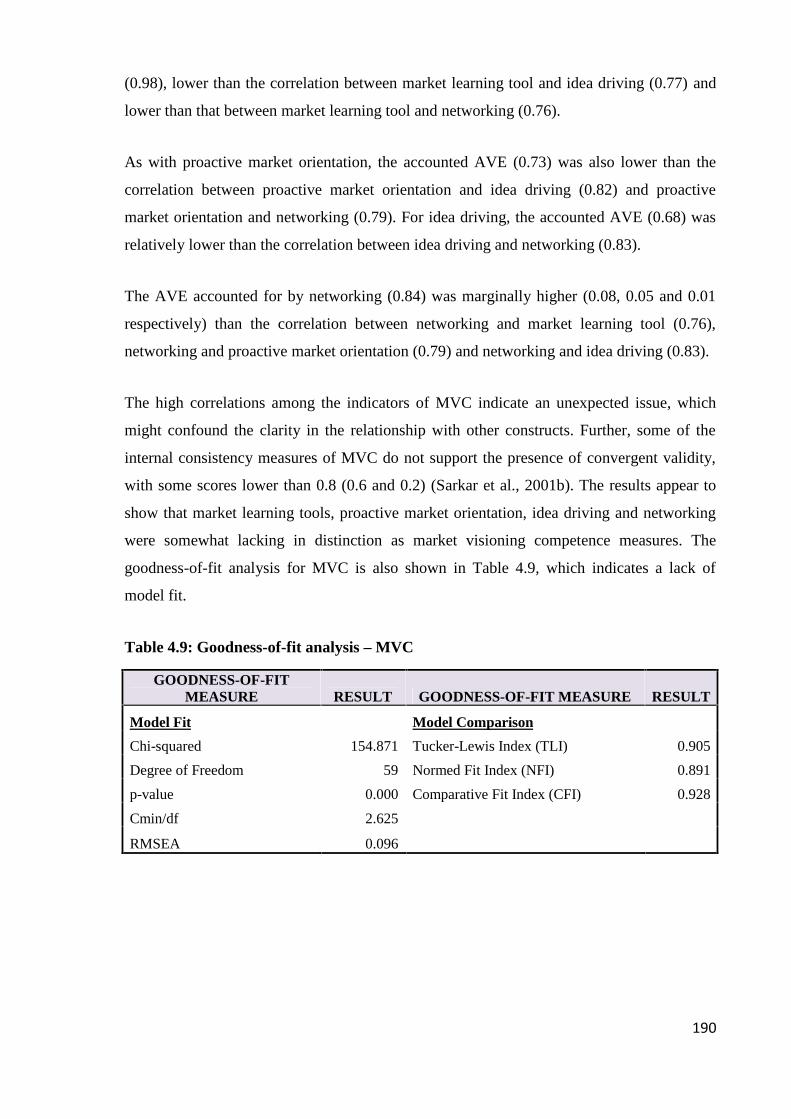
190
(0.98), lower than the correlation between market learning tool and idea driving (0.77) and
lower than that between market learning tool and networking (0.76).
As with proactive market orientation, the accounted AVE (0.73) was also lower than the
correlation between proactive market orientation and idea driving (0.82) and proactive
market orientation and networking (0.79). For idea driving, the accounted AVE (0.68) was
relatively lower than the correlation between idea driving and networking (0.83).
The AVE accounted for by networking (0.84) was marginally higher (0.08, 0.05 and 0.01
respectively) than the correlation between networking and market learning tool (0.76),
networking and proactive market orientation (0.79) and networking and idea driving (0.83).
The high correlations among the indicators of MVC indicate an unexpected issue, which
might confound the clarity in the relationship with other constructs. Further, some of the
internal consistency measures of MVC do not support the presence of convergent validity,
with some scores lower than 0.8 (0.6 and 0.2) (Sarkar et al., 2001b). The results appear to
show that market learning tools, proactive market orientation, idea driving and networking
were somewhat lacking in distinction as market visioning competence measures. The
goodness-of-fit analysis for MVC is also shown in Table 4.9, which indicates a lack of
model fit.
Table 4.9: Goodness-of-fit analysis – MVC
GOODNESS-OF-FITMEASURE RESULT GOODNESS-OF-FIT MEASURE RESULT
Model Fit Model Comparison
Chi-squared 154.871 Tucker-Lewis Index (TLI) 0.905
Degree of Freedom 59 Normed Fit Index (NFI) 0.891
p-value 0.000 Comparative Fit Index (CFI) 0.928
Cmin/df 2.625
RMSEA 0.096
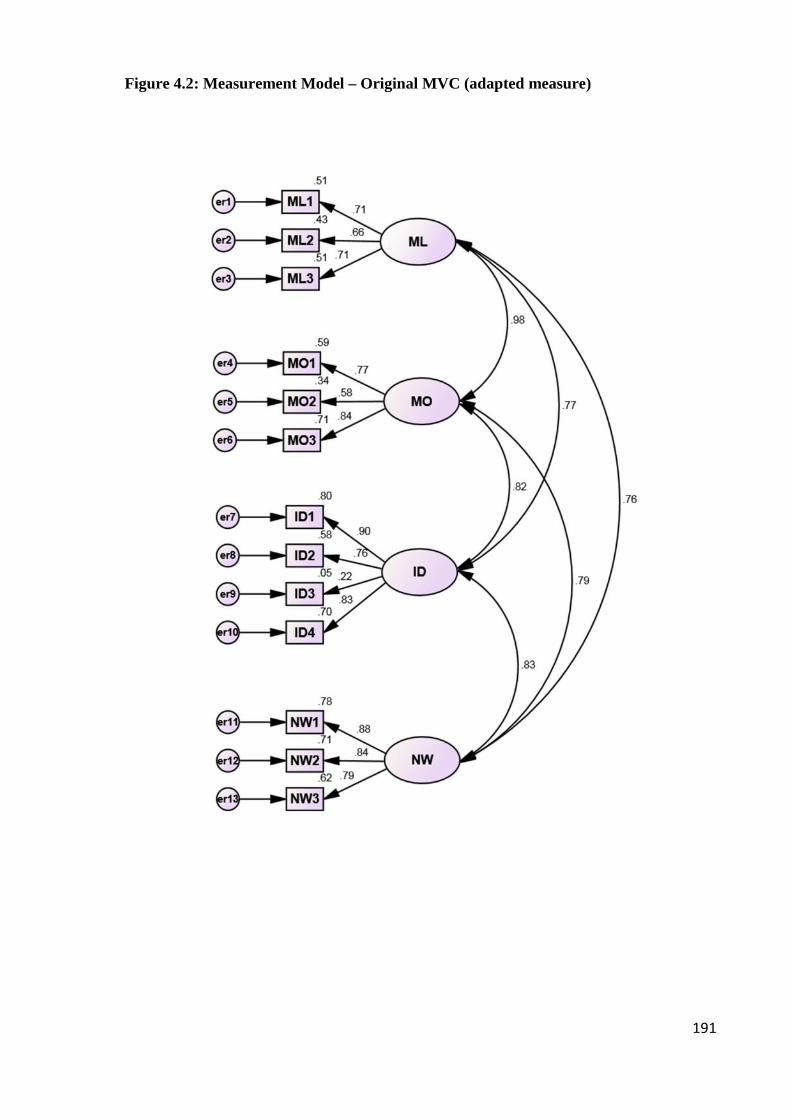
191
Figure 4.2: Measurement Model – Original MVC (adapted measure)
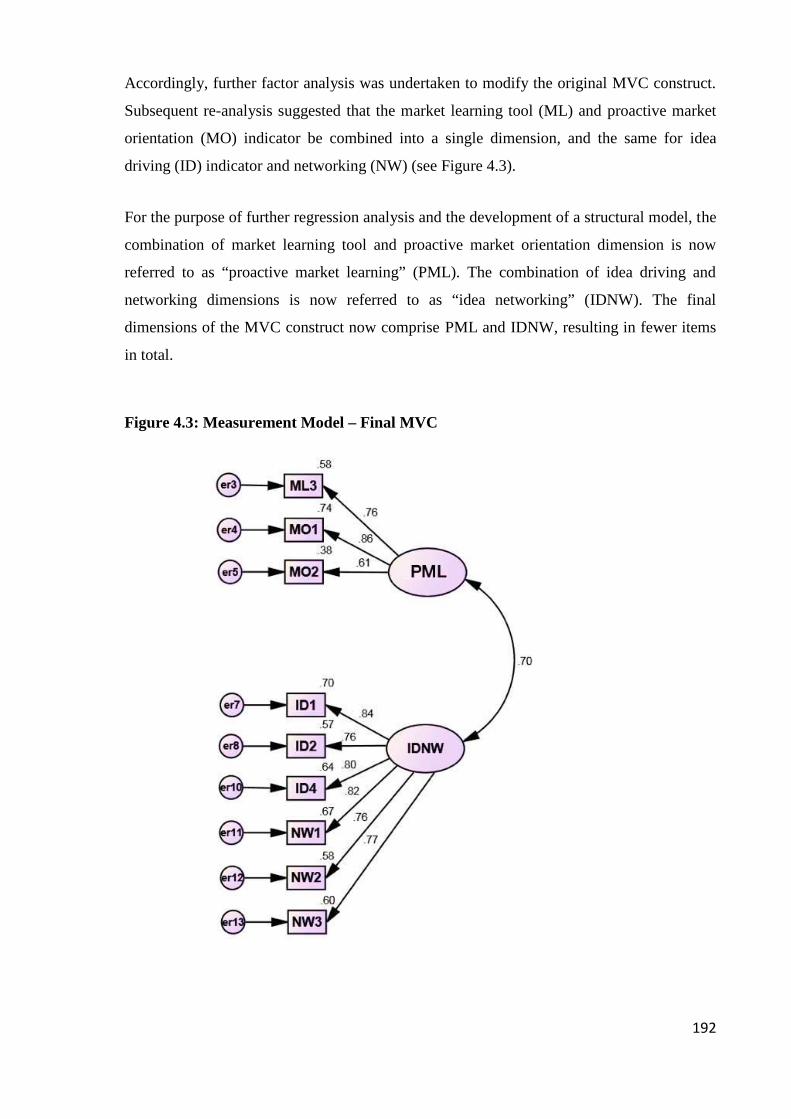
192
Accordingly, further factor analysis was undertaken to modify the original MVC construct.
Subsequent re-analysis suggested that the market learning tool (ML) and proactive market
orientation (MO) indicator be combined into a single dimension, and the same for idea
driving (ID) indicator and networking (NW) (see Figure 4.3).
For the purpose of further regression analysis and the development of a structural model, the
combination of market learning tool and proactive market orientation dimension is now
referred to as “proactive market learning” (PML). The combination of idea driving and
networking dimensions is now referred to as “idea networking” (IDNW). The final
dimensions of the MVC construct now comprise PML and IDNW, resulting in fewer items
in total.
Figure 4.3: Measurement Model – Final MVC

193
The reliability of the final MVC measure is shown in Table 4.10. The final MVC measure
exhibits good reliability, with coefficient alphas of proactive market learning 0.794 and idea
networking 0.910. The coefficient alphas of MVC were higher than the acceptable level of
0.5 to0.6 (Nunnally & Bernstein, 1994; Venkatraman & Ramanujam, 1986) and were
greater than the range of 0.7 that has recently been advocated (Cortina, 1993; de Vaus,
1995). The results indicate that the particular set of items share the common core of MVC
and adequately capture it better than the previous results as a construct.
Table 4.10: Reliability for Final MVC measure
Number
Cronbach’sAlpha
Construct of Items N = 179
Market VisioningCompetence (MVC)
Market Learning Tools- Proactive MarketOrientation(Proactive Market Learning: PML) 3 0.794
Idea Driving-Networking(Idea Networking: IDNW) 6 0.910
The validity of the final MVC measure was assessed by internal consistency, average
variance extracted (AVE) and correlation matrix as shown in Table 4.11.
Table 4.11: Internal consistency, square roots of average variance extracted andcorrelation matrix and model fit – Final MVC
Construct Internal Consistency AVE1 2
PML 0.79 0.74IDNW 0.91 0.70 0.79
The average variance extracted for the proactive market learning and idea networking
dimensions was well above 0.5, which demonstrated good convergent validity. The AVE
accounted for by proactive market learning (0.74) was greater than the correlation between
proactive market learning and idea networking (0.70). The AVE accounted for by idea
networking (0.79) was also greater than the correlation between idea networking and
proactive market learning (0.70).
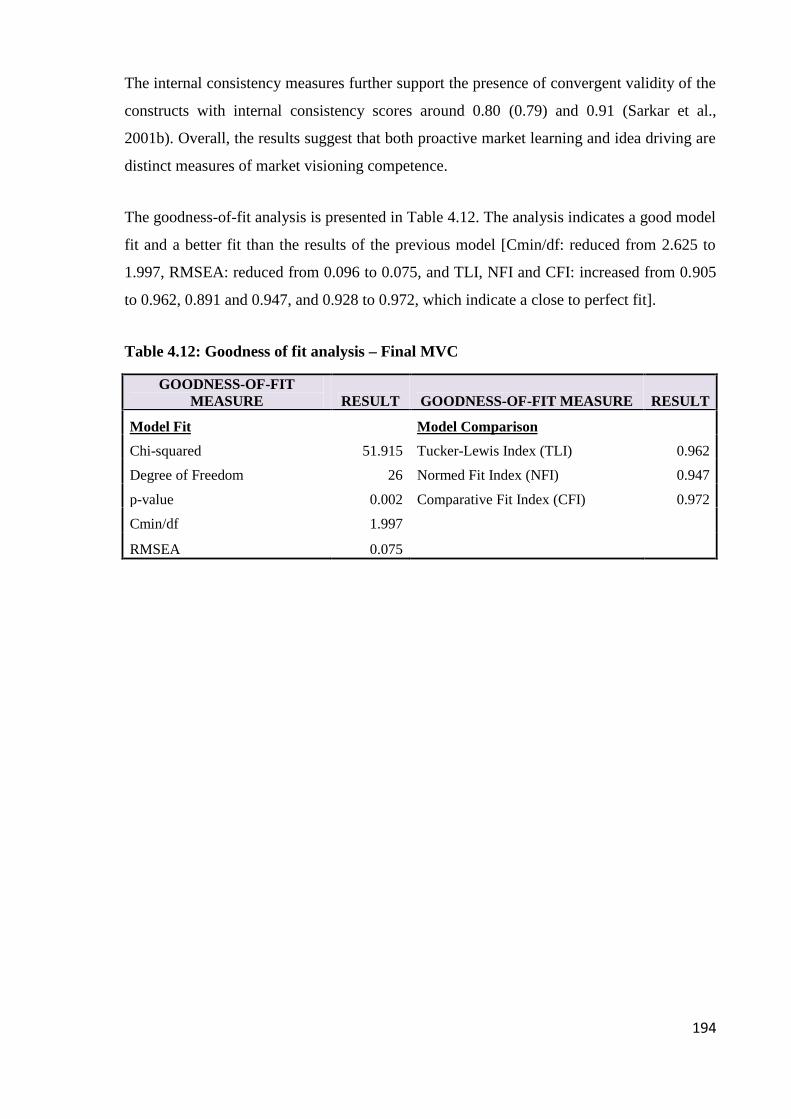
194
The internal consistency measures further support the presence of convergent validity of the
constructs with internal consistency scores around 0.80 (0.79) and 0.91 (Sarkar et al.,
2001b). Overall, the results suggest that both proactive market learning and idea driving are
distinct measures of market visioning competence.
The goodness-of-fit analysis is presented in Table 4.12. The analysis indicates a good model
fit and a better fit than the results of the previous model [Cmin/df: reduced from 2.625 to
1.997, RMSEA: reduced from 0.096 to 0.075, and TLI, NFI and CFI: increased from 0.905
to 0.962, 0.891 and 0.947, and 0.928 to 0.972, which indicate a close to perfect fit].
Table 4.12: Goodness of fit analysis – Final MVC
GOODNESS-OF-FITMEASURE RESULT GOODNESS-OF-FIT MEASURE RESULT
Model Fit Model Comparison
Chi-squared 51.915 Tucker-Lewis Index (TLI) 0.962
Degree of Freedom 26 Normed Fit Index (NFI) 0.947
p-value 0.002 Comparative Fit Index (CFI) 0.972
Cmin/df 1.997
RMSEA 0.075
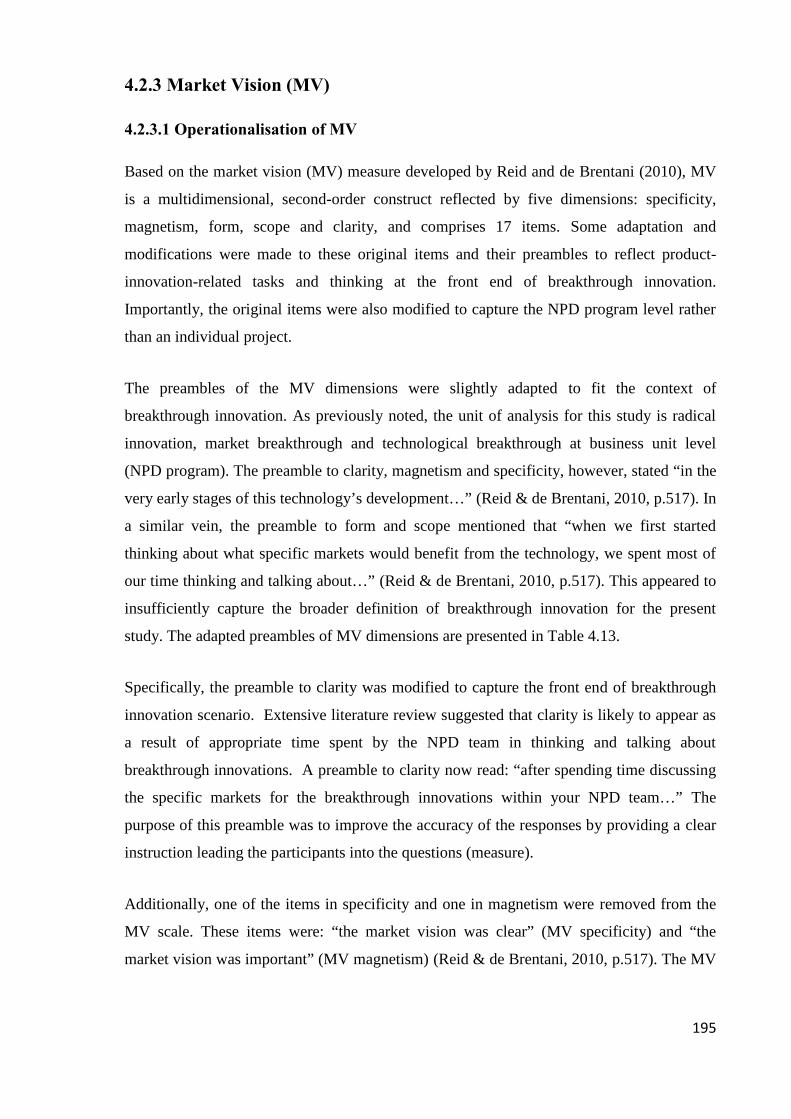
195
4.2.3 Market Vision (MV)
4.2.3.1 Operationalisation of MV
Based on the market vision (MV) measure developed by Reid and de Brentani (2010), MV
is a multidimensional, second-order construct reflected by five dimensions: specificity,
magnetism, form, scope and clarity, and comprises 17 items. Some adaptation and
modifications were made to these original items and their preambles to reflect product-
innovation-related tasks and thinking at the front end of breakthrough innovation.
Importantly, the original items were also modified to capture the NPD program level rather
than an individual project.
The preambles of the MV dimensions were slightly adapted to fit the context of
breakthrough innovation. As previously noted, the unit of analysis for this study is radical
innovation, market breakthrough and technological breakthrough at business unit level
(NPD program). The preamble to clarity, magnetism and specificity, however, stated “in the
very early stages of this technology’s development…” (Reid & de Brentani, 2010, p.517). In
a similar vein, the preamble to form and scope mentioned that “when we first started
thinking about what specific markets would benefit from the technology, we spent most of
our time thinking and talking about…” (Reid & de Brentani, 2010, p.517). This appeared to
insufficiently capture the broader definition of breakthrough innovation for the present
study. The adapted preambles of MV dimensions are presented in Table 4.13.
Specifically, the preamble to clarity was modified to capture the front end of breakthrough
innovation scenario. Extensive literature review suggested that clarity is likely to appear as
a result of appropriate time spent by the NPD team in thinking and talking about
breakthrough innovations. A preamble to clarity now read: “after spending time discussing
the specific markets for the breakthrough innovations within your NPD team…” The
purpose of this preamble was to improve the accuracy of the responses by providing a clear
instruction leading the participants into the questions (measure).
Additionally, one of the items in specificity and one in magnetism were removed from the
MV scale. These items were: “the market vision was clear” (MV specificity) and “the
market vision was important” (MV magnetism) (Reid & de Brentani, 2010, p.517). The MV
196
items were reviewed by experts who commented that the two items contained ambiguous
statements. Thus, removal of these items would aid instrument parsimony. The MV
construct now consists of 15 items, the original scale having comprised 17 items.
Further examination on the remaining 15 items was also done by the experts. Feedback was
received and it suggested that some adaptations and clarifications were required to be made
on the remaining items. For instance, the original item of specificity was: “…the market
vision was able to provide direction to others in the organisation”. The item was modified
to: “our market vision provides clear direction to others in the company/SBU regarding
what is being developed and for whom” (SP2). The original item of magnetism was: “…the
market vision was attractive” (Reid & de Brentani, 2010, p.517). This was modified to: “our
market vision clearly highlights the attractiveness of the market opportunity” (MG1). The
original item of clarity was: “…it was clear who the target market (user) would be” (Reid &
de Brentani, 2010, p.517). The adapted item now measures: “…it is generally clear who the
target customers would be for the breakthrough innovations” (CL1). This rationale was
applied to each of the MV items. The purpose of these adaptations was to clarify the
meaning of the items and ensure their content validity, particularly in term of capturing the
context of breakthrough innovation.
Table 4.13 presents the MV measure and a total of 15 items prior to exposure to the MV
measurement model.

197
Table 4.13: Measure for MV Construct (adapted measure)
Construct Item Statement/Question Source
Market Vision (MV): a clear and specific early-stage mental model or image of a product-market that enables NPD teams to grasp what it is they are developing and for whom.
Reid and deBrentani(2010)
Specificity(SP)
Please think about the market vision in the very early stages ofdeveloping breakthrough innovations in your company/SBU andindicate the degree to which you agree or disagree with thesestatements:
Reid and deBrentani(2010)
SP1 We have a very specific Market Vision statement that guideseach NPD project.
,,
SP2 Our Market Vision provides clear direction to others in thecompany/SBU regarding what is being developed and forwhom.
,,
SP3 Our Market Vision helps make tangible what is to bedeveloped and for whom. ,,
Magnetism(MG)
MG1 Our Market Vision clearly highlights the attractiveness of themarket opportunity. ,,
MG2 Our Market Vision generates buy-in from other people andgroups in the company/SBU. ,,
Form (FO) Preamble: “When you first start thinking about what specificmarkets would benefit from your breakthrough innovations, youand your NPD team are able to spend an appropriate amount of timethinking and talking about...”
,,
FO1 How end-users would ultimately interact with and use thebreakthrough innovations. ,,
FO2 How the breakthrough innovations would fit into an overallsystem of use for potential customers. ,,
FO3 How customers might use the breakthrough innovations intheir environments.
,,
FO4 The potentials for standardising the design of the breakthroughinnovations. ,,
Scope (SC) SC1 What the most profitable target market would be for thebreakthrough innovations.
,,
SC2 What the largest target market would be for the breakthroughinnovations. ,,
SC3 What the most important target market would be for thebreakthrough innovations. ,,
Clarity(CL)
Preamble: “After spending time discussing the specific markets forthe breakthrough innovations within your NPD team...”
Newpreamble
CL1 It is generally clear who the target customers would be for thebreakthrough innovations. ,,
CL2 It is generally clear what target customers’ needs would be forthe breakthrough innovations. ,,
CL3 It is generally clear how breakthrough innovations would beused by the target customers. ,,

198
4.2.3.2 Reliability and Validity of MV
The reliability of the MV measure is shown in Table 4.14. MV measure exhibits good
reliability, with coefficient alphas of specificity 0.891, magnetism 0.815, form 0.893, scope
0.900 and clarity 0.916. The coefficient alphas of MV ranged from 0.815 to 0.916, showing
that they were well above the acceptable level of 0.5 to 0.6 (Nunnally & Bernstein, 1994;
Venkatraman & Ramanujam, 1986) and were greater than the range of 0.7 that has recently
been advocated (Cortina, 1993; de Vaus, 1995). The results indicate that the particular set of
items adequately captures MV as a construct.
Table 4.14: Reliability for MV measure
Cronbach’sAlpha
ConstructNumberof Items N = 179
Market Vision (MV)
Specificity (SP) 3 0.891
Magnetism (MG) 2 0.815
Form (FO) 4 0.893
Scope (SC) 3 0.900
Clarity (CL) 3 0.916
To assess validity of the MV measure, internal consistency, average variance extracted
(AVE) and correlation matrix were examined, and are shown in Table 4.15.
Table 4.15: Internal consistency, square roots of average variance extracted andcorrelation matrix and model fit – MV
Construct Internal Consistency AVE
1 2 3 4 5
SP 0.90 0.86
MG 0.82 1.03 0.83
FO 0.89 0.70 0.72 0.83
SC 0.90 0.50 0.57 0.77 0.87
CL 0.92 0.56 0.54 0.66 0.61 0.89
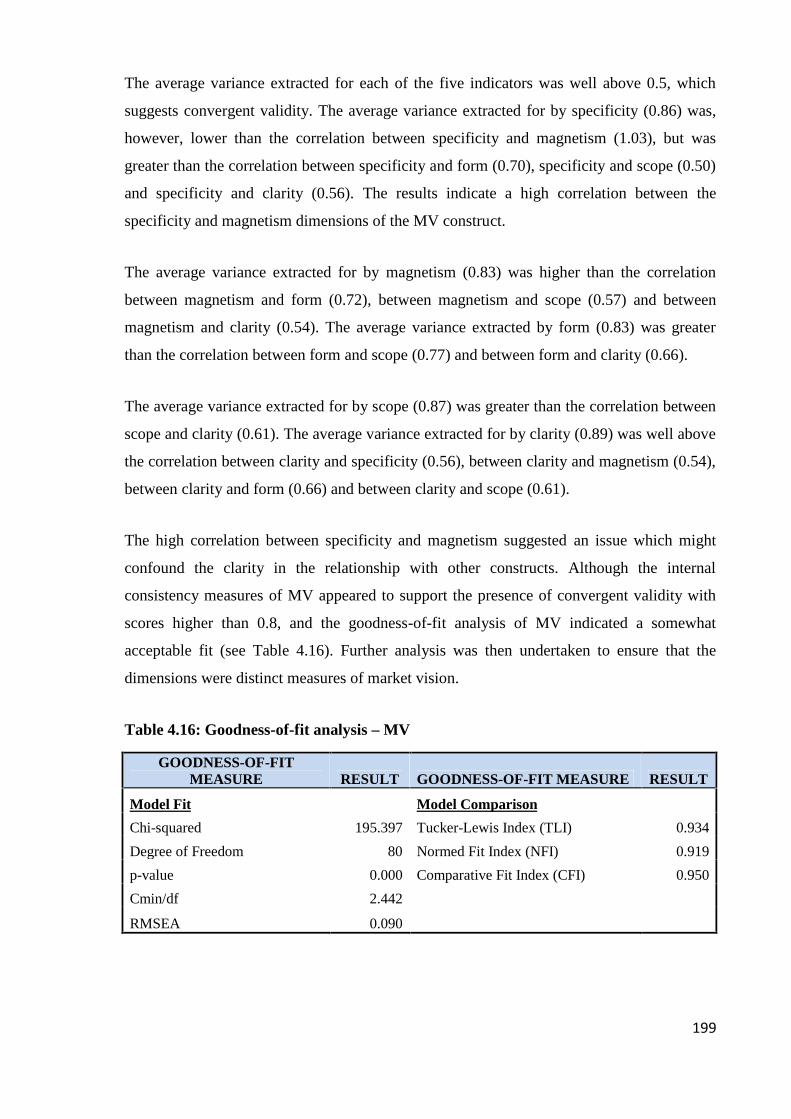
199
The average variance extracted for each of the five indicators was well above 0.5, which
suggests convergent validity. The average variance extracted for by specificity (0.86) was,
however, lower than the correlation between specificity and magnetism (1.03), but was
greater than the correlation between specificity and form (0.70), specificity and scope (0.50)
and specificity and clarity (0.56). The results indicate a high correlation between the
specificity and magnetism dimensions of the MV construct.
The average variance extracted for by magnetism (0.83) was higher than the correlation
between magnetism and form (0.72), between magnetism and scope (0.57) and between
magnetism and clarity (0.54). The average variance extracted by form (0.83) was greater
than the correlation between form and scope (0.77) and between form and clarity (0.66).
The average variance extracted for by scope (0.87) was greater than the correlation between
scope and clarity (0.61). The average variance extracted for by clarity (0.89) was well above
the correlation between clarity and specificity (0.56), between clarity and magnetism (0.54),
between clarity and form (0.66) and between clarity and scope (0.61).
The high correlation between specificity and magnetism suggested an issue which might
confound the clarity in the relationship with other constructs. Although the internal
consistency measures of MV appeared to support the presence of convergent validity with
scores higher than 0.8, and the goodness-of-fit analysis of MV indicated a somewhat
acceptable fit (see Table 4.16). Further analysis was then undertaken to ensure that the
dimensions were distinct measures of market vision.
Table 4.16: Goodness-of-fit analysis – MV
GOODNESS-OF-FITMEASURE RESULT GOODNESS-OF-FIT MEASURE RESULT
Model Fit Model Comparison
Chi-squared 195.397 Tucker-Lewis Index (TLI) 0.934
Degree of Freedom 80 Normed Fit Index (NFI) 0.919
p-value 0.000 Comparative Fit Index (CFI) 0.950
Cmin/df 2.442
RMSEA 0.090
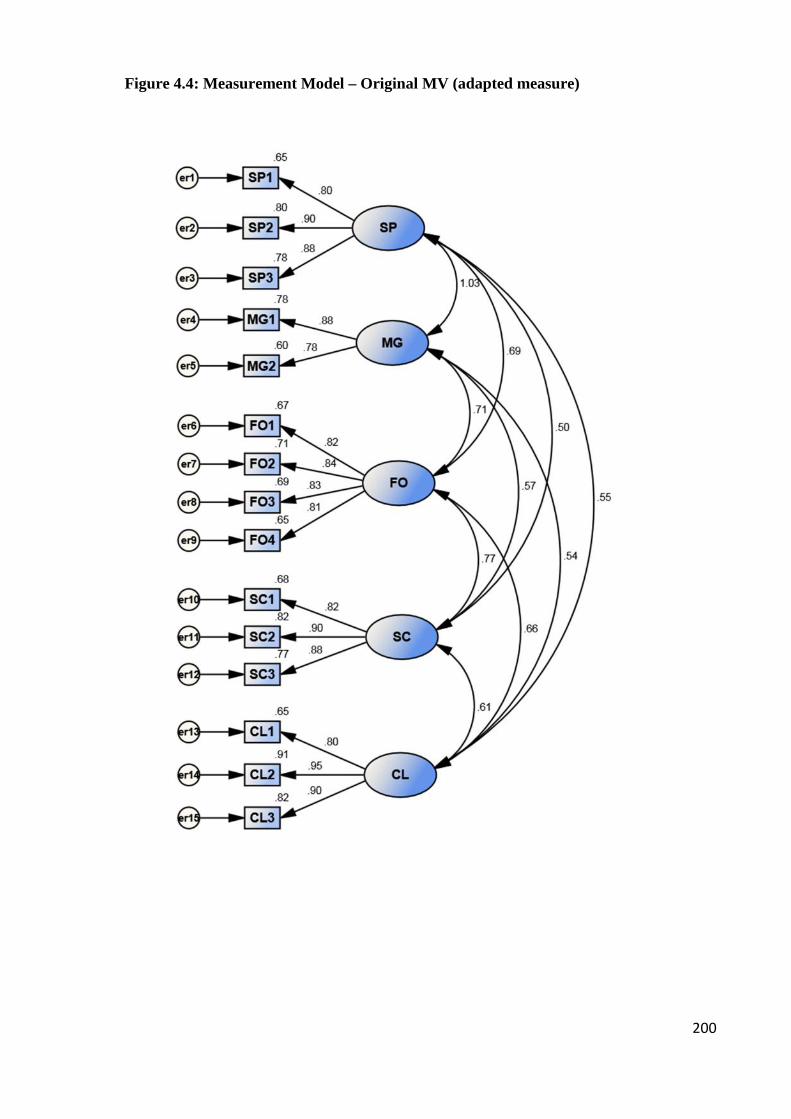
200
Figure 4.4: Measurement Model – Original MV (adapted measure)
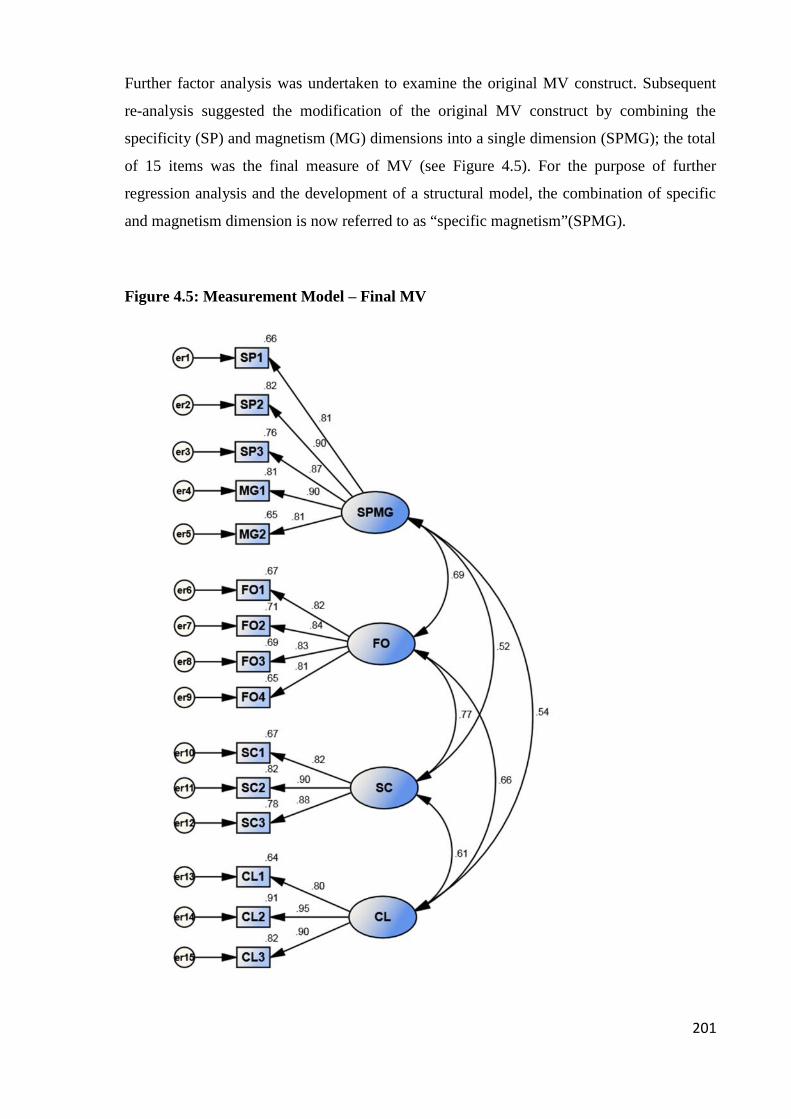
201
Further factor analysis was undertaken to examine the original MV construct. Subsequent
re-analysis suggested the modification of the original MV construct by combining the
specificity (SP) and magnetism (MG) dimensions into a single dimension (SPMG); the total
of 15 items was the final measure of MV (see Figure 4.5). For the purpose of further
regression analysis and the development of a structural model, the combination of specific
and magnetism dimension is now referred to as “specific magnetism”(SPMG).
Figure 4.5: Measurement Model – Final MV

202
The reliability of the final MV measure is shown in Table 4.17. The final MV measure
exhibits good reliability, with coefficient alphas of specific magnetism 0.929, form 0.893,
scope 0.900 and clarity 0.916. The coefficient alphas of MV were greater than the range of
0.7 that has recently been advocated (Cortina, 1993; de Vaus, 1995). The results indicate
that the finalised items share the common core of MV and adequately capture it as a
construct.
Table 4.17: Reliability for Final MV measure
Cronbach’s Alpha
ConstructNumberof Items N = 179
Market Vision (MV)
Specific Magnetism (SPMG) 5 0.929
Form (FO) 4 0.893
Scope (SC) 3 0.900
Clarity (CL) 3 0.916
The validity of the final MV measure was assessed using internal consistency, average
variance extracted (AVE) and correlation matrix. These assessments are shown in Table
4.18. The average variance extracted for each of the four dimensions was well above 0.5,
which demonstrates good convergent validity.
Table 4.18: Internal consistency, square roots of average variance extracted andcorrelation matrix and model fit – Final MV
Construct Internal Consistency AVE
1 2 3 4
SPMG 0.93 0.86
FO 0.89 0.70 0.83
SC 0.90 0.52 0.77 0.87
CL 0.92 0.54 0.66 0.61 0.88
The AVE accounted for by specific magnetism (0.86) was greater than the correlation
between specific magnetism and form (0.70), between specific magnetism and scope (0.52)
and between specific magnetism and clarity (0.54). Without modifications to the rest of the
dimensions, the AVE accounted for by form, scope and clarity, including the correlations
among each of the three indicators, remained the same.
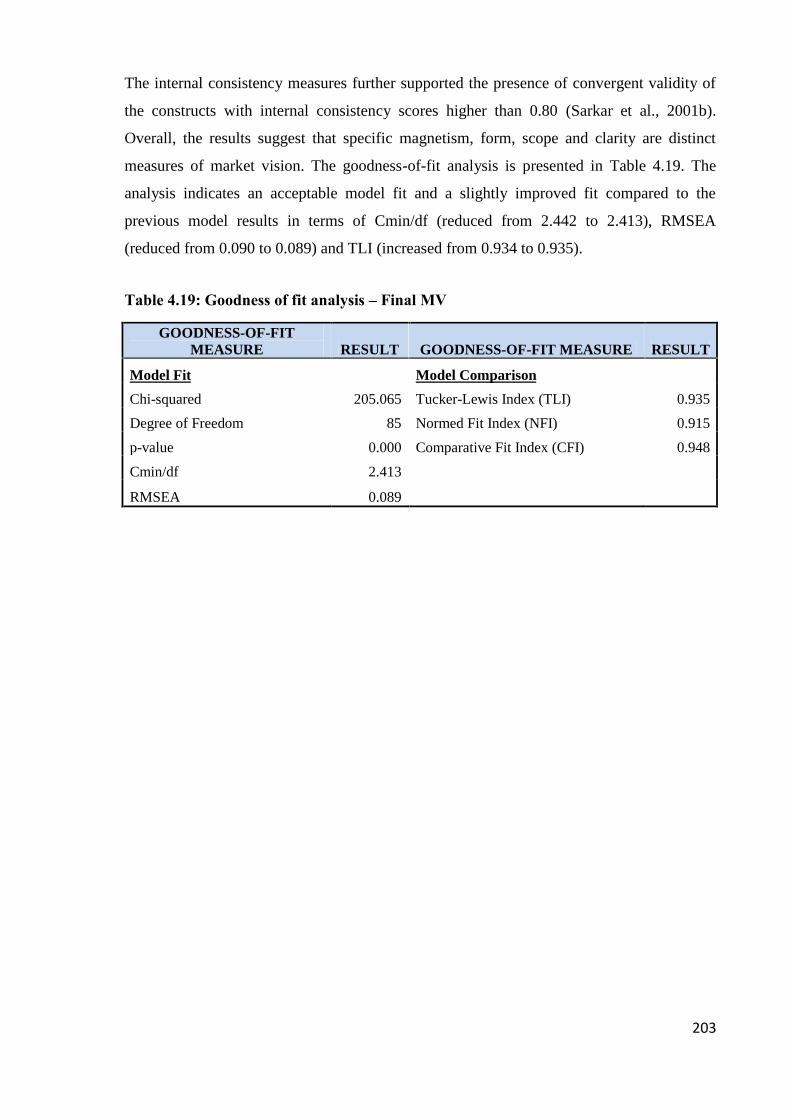
203
The internal consistency measures further supported the presence of convergent validity of
the constructs with internal consistency scores higher than 0.80 (Sarkar et al., 2001b).
Overall, the results suggest that specific magnetism, form, scope and clarity are distinct
measures of market vision. The goodness-of-fit analysis is presented in Table 4.19. The
analysis indicates an acceptable model fit and a slightly improved fit compared to the
previous model results in terms of Cmin/df (reduced from 2.442 to 2.413), RMSEA
(reduced from 0.090 to 0.089) and TLI (increased from 0.934 to 0.935).
Table 4.19: Goodness of fit analysis – Final MV
GOODNESS-OF-FITMEASURE RESULT GOODNESS-OF-FIT MEASURE RESULT
Model Fit Model Comparison
Chi-squared 205.065 Tucker-Lewis Index (TLI) 0.935
Degree of Freedom 85 Normed Fit Index (NFI) 0.915
p-value 0.000 Comparative Fit Index (CFI) 0.948
Cmin/df 2.413
RMSEA 0.089

204
4.2.4 Summary of Reliability and Validity for Main IndependentMeasures
The overall reliability for the main independent measures is shown in Table 4.20. The
coefficient alphas of all the measures were greater than 0.7 (Cortina, 1993; de Vaus, 1995).
The final results indicate that the particular set of the items for each of the dimensions
adequately captures the underlying core of their constructs.
Table 4.20: Overall Reliability for Main Independent Measures (Final)
ConstructNumberof Items
Cronbach’sAlpha
N = 179
AbsorptiveCapacity(ACAP)
PotentialAbsorptive
Capacity (PACAP)
Acquisition of Knowledge (AQ) 3 0.868
Assimilation of Knowledge (AS) 4 0.899
RealisedAbsorptive
Capacity (RACAP)
Transformation of Knowledge (TR) 4 0.942
Exploitation of Knowledge (EX) 4 0.917
Market Visioning Competence(MVC)
Proactive Market Learning (PML) 3 0.794
Idea-Networking (IDNW) 6 0.910
Market Vision (MV)
Specific Magnetism (SPMG) 5 0.929
Form (FO) 4 0.893
Scope (SC) 3 0.900
Clarity (CL) 3 0.916
In addition, the validity of the independent measures was assessed through internal
consistency, average variance extracted (AVE) and correlation matrix. Overall, the average
variance extracted for each of the dimensions of the independent measures was shown to be
above 0.5, which demonstrates good convergent validity. The internal consistency measures
further supported the presence of convergent validity of the constructs with internal
consistency scores higher than 0.80 (Sarkar et al., 2001b). The results suggest that each of
the dimensions is a distinct measure of its constructs. Furthermore, the goodness-of-fit
analysis of all the independent measures indicates an acceptable model fit.
205
4.3 Operationalisation, Reliability and Validity of Dependent
Measures
4.3.1 Before-Launch Stage Performance (BLSP)
4.3.1.1 Operationalisation of BLSP
Corresponding to the conceptualisation of before-launch stage performance (BLSP) in
Chapter 2, this construct captures the breakthrough integrity (BI) and early success with
customers (ESC) dimensions. Both of these dimensions determine specific program level
performance outcomes related to market-driving innovation at the before-launch stage.
Breakthrough integrity
This study refers to “breakthrough integrity” (BI) as a clear and highly innovative concept
of a potential new product is maintained after it enters the development and
commercialisation phases. The definition of BI was developed with reference to the studies
by Brown and Eisenhardt (1995), Clark and Fujimoto (1990), Clark and Fujimoto (1991),
Lynn and Akgün (2001) and Seidel (2007). Brown and Eisenhardt (1995) asserted that “by
focusing on establishing product integrity, senior management can ensure that an overall
vision for the product is communicated to the project team and, thus, balance the autonomy
gained through heavyweight leadership” (p. 363). The vision for new product and the
meshing of an organisation’s competencies and strategies with the needs of the market can
lead the project team to attain an effective product concept. In particular, the ability to
maintain the radical and innovative characteristics of an original product concept is
important for firms developing breakthrough innovations. This is because the development
of a breakthrough innovation involves high risk and uncertainty and longevity of product
development, often resulting in decisions to modify or “dumbed down” its innovativeness
(McDermott & O'Connor, 2002; O'Connor & Veryzer, 2001).
The review of empirical studies has suggested that none of the current studies has captured
the defined breakthrough integrity as a performance consequence of market vision. The
concept of breakthrough integrity is only beginning to emerge and yet there is no existing or
previously tested scale. The most relevant measure is related to the concept of “vision
206
stability” by Lynn and Akgün (2001). The study highlighted the importance of vision
stability as a clear and supported vision throughout an NPD project, and measured it with
three items: (1) “the pre-prototype design goals remained stable through launch”, (2) “the
pre-prototype technical goals remained stable through launch” and (3) “the pre-prototype
vision of this project remained stable through launch” (p.385). Nevertheless, the measure
was insufficient to explain the concept of breakthrough integrity.
According to the previously identified constituents and the definition of breakthrough
integrity, the concept of breakthrough integrity was operationalised. For the purpose of this
research, the scale measurement of breakthrough integrity was developed to include three
items, referring to the extent to which breakthrough innovations are able to: (1) maintain
their innovativeness from the initial idea through to the final product launched, (2) maintain
their originality from the initial idea through to the launch of the product and (3) resist
pressure from management to modify the idea and reduce their breakthrough integrity. The
final version of the items was also informed, prior to its administration, by feedback
received from the industry experts and academics during the pre-test (as described in
Chapter 3).
Early Success with Customers
In addition to the BI measure, early success with customers (ESC) was adopted as another
dimension of BLSP. As noted in Chapter 2, this customer-related measure can be
particularly useful in the case of market-driving innovation. The customer-related measure
generally captures the degree to which the products are readily accepted and satisfied by
customers (Griffin & Page, 1996), especially lead users or those looking for early and
innovative solutions. The relevant measure for ESC was developed by Reid (2005) with
three items, which are: (1) “early customers were satisfied (even prior to sales)”, (2) “early
customers accepted the products stemming from the technology (even prior to sales)” and
(3) “customers’ needs were (will be) satisfied better by these products than existing ones”
(Reid, 2005, p.144). The ESC measure by Reid (2005) is, however, limited to products
stemming from technology i.e. high-tech products. The present study extends the ESC
measure to capture the early performance of both radical and really new innovations. The
original items were therefore adapted based on the definition of ESC in this study, that is,
the degree to which “early customers were always satisfied and readily accepted the

207
breakthrough innovations even prior to launching them”. Table 4.21 presents the BLSP
measure and its BI and ESC dimensions, with a total of six items.
Table 4.21: Measure for BLSP (adapted measure)
Construct Item Statement/Question Source
Before-Launch Stage Performance (BLSP): the extent in which a clearand highly innovative concept of a potential new product is maintained afterit enters the development and commercialisation phases of being satisfiedand accepted by early customers
Clark and Fujimoto (1991);Reid and de Brentani(2010); Seidel (2007)
BreakthroughIntegrity (BI)
Please think about how the breakthroughinnovations developed by your company/SBU overthe last three years have performed, from the earlyphase of the NPD process through to launch:
In terms of Breakthrough Integrity, please tell us towhat extent “breakthrough innovations were ableto...
New preamble
BI1 Maintain their innovativeness from the initialidea through to the final product launched.
Clark and Fujimoto (1990,1991); Lynn and Akgün
(2001); Seidel (2007)BI2 Maintain their originality from the initial idea
through to the launch of the product.,,
BI3 Resist the pressure from management tomodify the idea and reduce their breakthroughintegrity.
,,
Early Successwith Customers(ESC)
In terms of Early Success with Customers, pleasetell us how strongly you disagree or agree with eachof the following statements:
New preamble
ESC1 Early customers were always satisfied withour breakthrough innovations even prior toformally launching them.
Reid (2005)
ESC2 Early customers readily accepted ourbreakthrough innovations even prior toformally launching them.
,,
ESC3 Early customers’ needs were better metthrough our breakthrough innovations than ourexisting ones.
,,
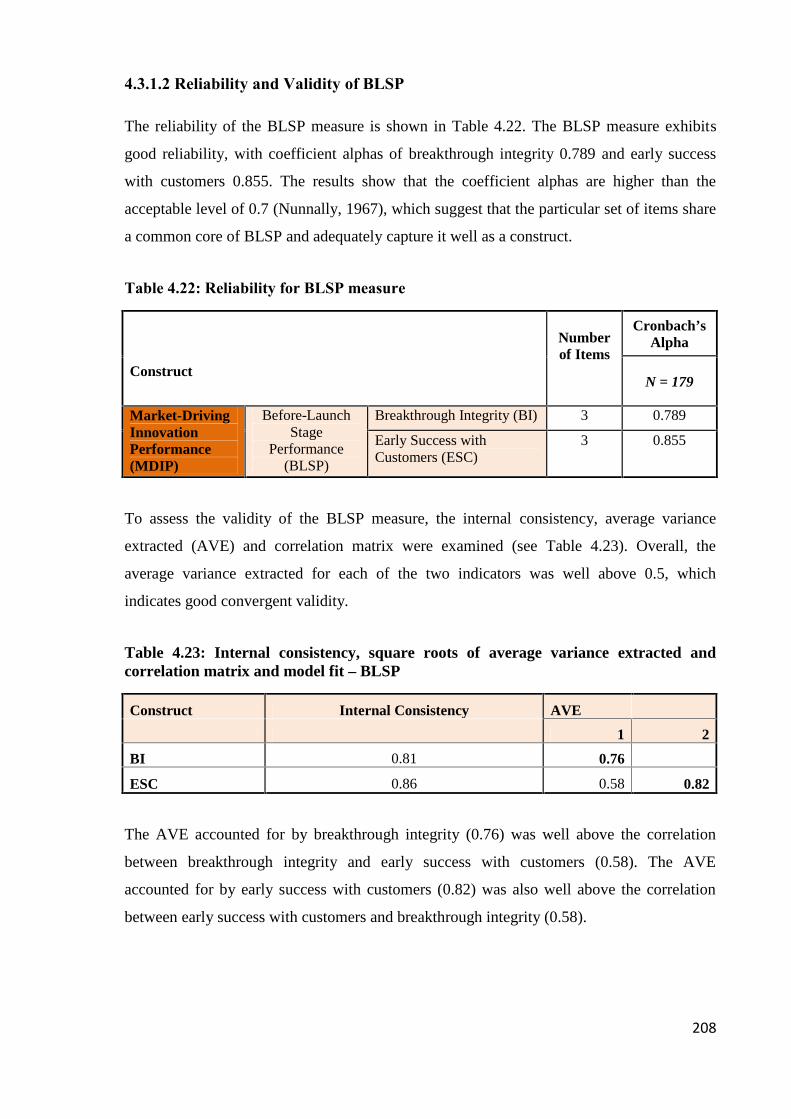
208
4.3.1.2 Reliability and Validity of BLSP
The reliability of the BLSP measure is shown in Table 4.22. The BLSP measure exhibits
good reliability, with coefficient alphas of breakthrough integrity 0.789 and early success
with customers 0.855. The results show that the coefficient alphas are higher than the
acceptable level of 0.7 (Nunnally, 1967), which suggest that the particular set of items share
a common core of BLSP and adequately capture it well as a construct.
Table 4.22: Reliability for BLSP measure
Construct
Numberof Items
Cronbach’sAlpha
N = 179
Market-DrivingInnovationPerformance(MDIP)
Before-LaunchStage
Performance(BLSP)
Breakthrough Integrity (BI) 3 0.789
Early Success withCustomers (ESC)
3 0.855
To assess the validity of the BLSP measure, the internal consistency, average variance
extracted (AVE) and correlation matrix were examined (see Table 4.23). Overall, the
average variance extracted for each of the two indicators was well above 0.5, which
indicates good convergent validity.
Table 4.23: Internal consistency, square roots of average variance extracted andcorrelation matrix and model fit – BLSP
Construct Internal Consistency AVE
1 2
BI 0.81 0.76
ESC 0.86 0.58 0.82
The AVE accounted for by breakthrough integrity (0.76) was well above the correlation
between breakthrough integrity and early success with customers (0.58). The AVE
accounted for by early success with customers (0.82) was also well above the correlation
between early success with customers and breakthrough integrity (0.58).
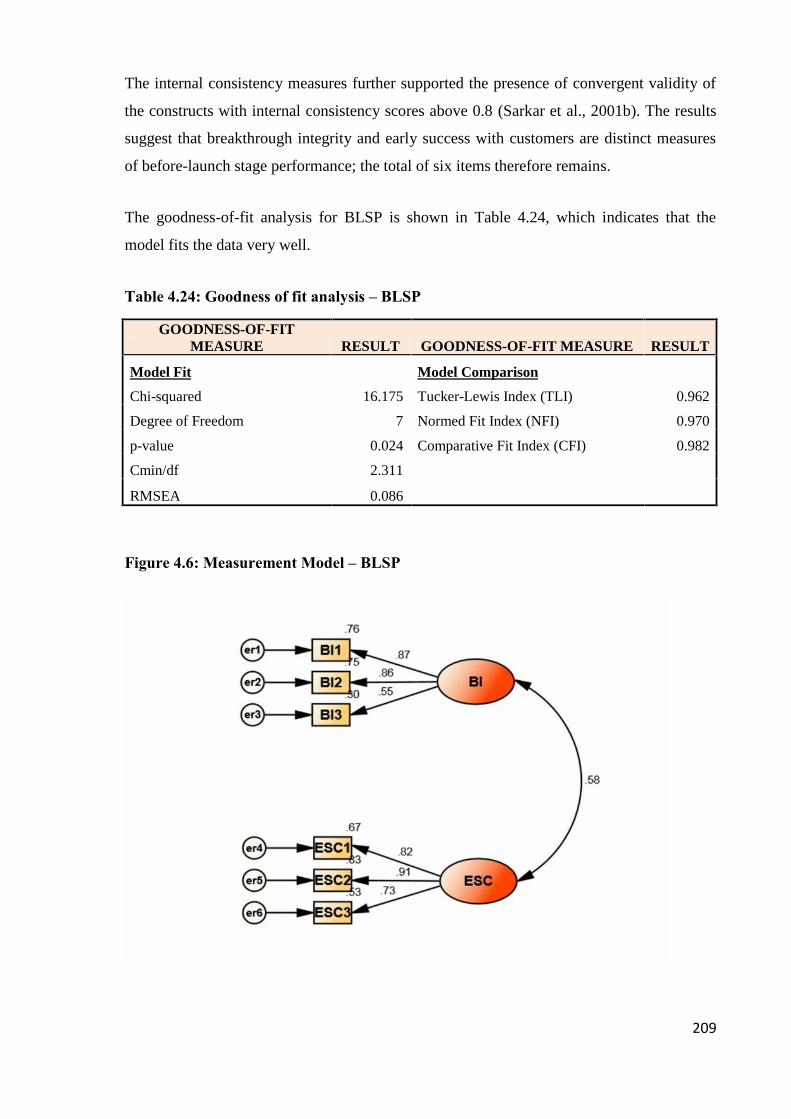
209
The internal consistency measures further supported the presence of convergent validity of
the constructs with internal consistency scores above 0.8 (Sarkar et al., 2001b). The results
suggest that breakthrough integrity and early success with customers are distinct measures
of before-launch stage performance; the total of six items therefore remains.
The goodness-of-fit analysis for BLSP is shown in Table 4.24, which indicates that the
model fits the data very well.
Table 4.24: Goodness of fit analysis – BLSP
GOODNESS-OF-FITMEASURE RESULT GOODNESS-OF-FIT MEASURE RESULT
Model Fit Model Comparison
Chi-squared 16.175 Tucker-Lewis Index (TLI) 0.962
Degree of Freedom 7 Normed Fit Index (NFI) 0.970
p-value 0.024 Comparative Fit Index (CFI) 0.982
Cmin/df 2.311
RMSEA 0.086
Figure 4.6: Measurement Model – BLSP
210
4.3.2 Post-Launch Stage Performance (PLSP)
4.3.2.1 Operationalisation of PLSP
As described in Chapter 2, post-launch stage performance (PLSP) was included as a
dependent measure as part of market-driving innovation performance (the performance
consequence of market vision) in the conceptual model. Accordingly, the PLSP construct
captures the speed-to-market (STM) and windows of opportunity (WO) dimensions. Both of
these dimensions determine specific program level performance outcomes related to market-
driving innovation at the post-launch stage.
Speed-to-market
After reviewing empirical studies in regard to STM, the measurement scale developed by
Lynn et al. (1999b) was selected as most the appropriate for one of the dimensions of PLSP.
Based on the study by Lynn et al. (1999b), the STM measure was developed as a dependent
measure of the influence of vision (goal). Specifically, vision was explained at the project
level as having the three distinct dimensions of goal clarity, goal stability and goal support.
The focus of the goal dimensions is on ensuring that the project goal is clear and remains
stable to what is intended to be achieved, and that resources are provided to help the team to
reach its goal. Importantly, vision stability was the practice that accounted for the most
unique variance of speed-to-market, suggesting that a stable goal is critical for accelerating
the new product development process (Lynn et al., 1999b). Notwithstanding the project
level analysis of goal dimensions, the concept of project vision and its influence on speed-
to-market is in line with the focus of an effective market vision and its performance
consequence (STM) in this study.
Lynn et al. (1999b) original measure of speed-to-market was designed to capture four items:
the extent to which (1) “top management was very pleased with the time it took us to bring
this product to market”, (2) “the project was launched on or ahead of the original schedule”,
(3) “the project was completed in less than what was considered normal and customary for
our industry” and (4) “the project was developed and launched much faster than the major
competitor for a similar product” (Lynn et al., 1999b, p.453). Correspondingly, the items
were slightly modified to fit the context of breakthrough innovation in terms of the speed at
which breakthrough innovations are moved to market.
211
Moreover, a new preamble was developed for the speed-to-market measure as there was no
existing preamble following the measure developed by Lynn et al. (1999b). The aim of
setting the preamble to speed-to-market measure was to provide a clear instruction leading
the participants to think about the development of breakthrough innovation in terms of
speed-to-market. The preamble states: “on average, over the last three years, in terms
of how quickly breakthrough innovations were developed and launched, please tell us how
strongly you disagree or agree with each of the following statements”. This was also worded
to be consistent with the preamble to the windows of opportunity measure.
Windows of opportunity
This study adopted the windows of opportunity measure as another dimension of post-
launch stage performance. The windows of opportunity measure is commonly used in
empirical studies published in product innovation and management literature (de Brentani et
al., 2010; Kleinschmidt, de Brentani & Salomo, 2010). The study by Kleinschmidt et al.
(2007) used the resource-based view to investigate the influence of organisational resources
and NPD process capabilities and routines on the performance of global new product
development programs in terms of windows of opportunity and financial performance. The
study also found a significant and positive impact of homework activities on windows of
opportunity, where “homework activities” was described as “early evaluation of new
product ideas, creating project definitions and studies assessing product potential in markets
worldwide” (Kleinschmidt et al., 2007, p.426). In other words, the work at the front end of
innovation (predevelopment work) influences the global NPD program performance in
terms of windows of opportunity.
The context of the research and the theory-in-use (RBV) in the study of Kleinschmidt et al.
(2007) seems to be consistent with the predominant lens (RBV) and framework of this study
in respect to the impact of organisational processes (absorptive capacity) and early product
innovation strategy (market visioning competence/market vision) on the success of market-
driving innovation performance in terms of windows of opportunity and financial
performance. Consequently, the windows of opportunity measure was adopted for this
study, following the work of Kleinschmidt et al. (2007). Their original item referred to the
extent to which, “on average, the international NPD program was successful in (1) opening
new markets for our firm (division/SBU), (2) leading our firm into new product arenas –
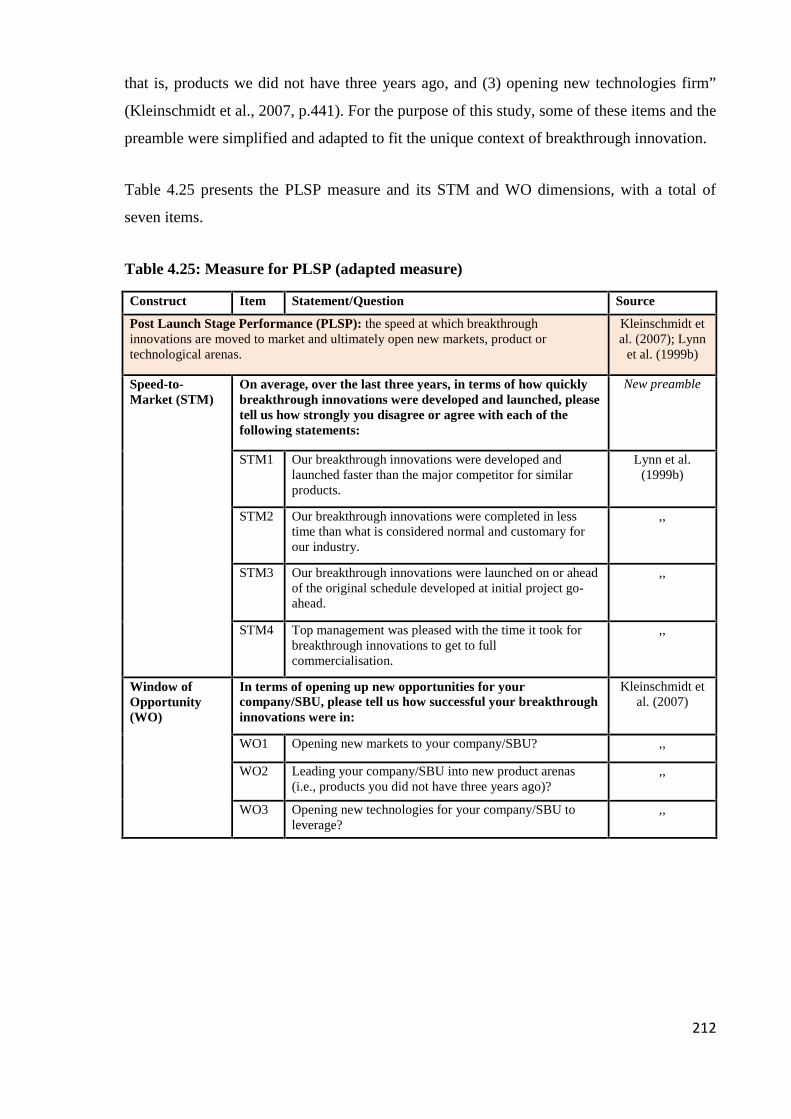
212
that is, products we did not have three years ago, and (3) opening new technologies firm”
(Kleinschmidt et al., 2007, p.441). For the purpose of this study, some of these items and the
preamble were simplified and adapted to fit the unique context of breakthrough innovation.
Table 4.25 presents the PLSP measure and its STM and WO dimensions, with a total of
seven items.
Table 4.25: Measure for PLSP (adapted measure)
Construct Item Statement/Question Source
Post Launch Stage Performance (PLSP): the speed at which breakthroughinnovations are moved to market and ultimately open new markets, product ortechnological arenas.
Kleinschmidt etal. (2007); Lynn
et al. (1999b)
Speed-to-Market (STM)
On average, over the last three years, in terms of how quicklybreakthrough innovations were developed and launched, pleasetell us how strongly you disagree or agree with each of thefollowing statements:
New preamble
STM1 Our breakthrough innovations were developed andlaunched faster than the major competitor for similarproducts.
Lynn et al.(1999b)
STM2 Our breakthrough innovations were completed in lesstime than what is considered normal and customary forour industry.
,,
STM3 Our breakthrough innovations were launched on or aheadof the original schedule developed at initial project go-ahead.
,,
STM4 Top management was pleased with the time it took forbreakthrough innovations to get to fullcommercialisation.
,,
Window ofOpportunity(WO)
In terms of opening up new opportunities for yourcompany/SBU, please tell us how successful your breakthroughinnovations were in:
Kleinschmidt etal. (2007)
WO1 Opening new markets to your company/SBU? ,,
WO2 Leading your company/SBU into new product arenas(i.e., products you did not have three years ago)?
,,
WO3 Opening new technologies for your company/SBU toleverage?
,,
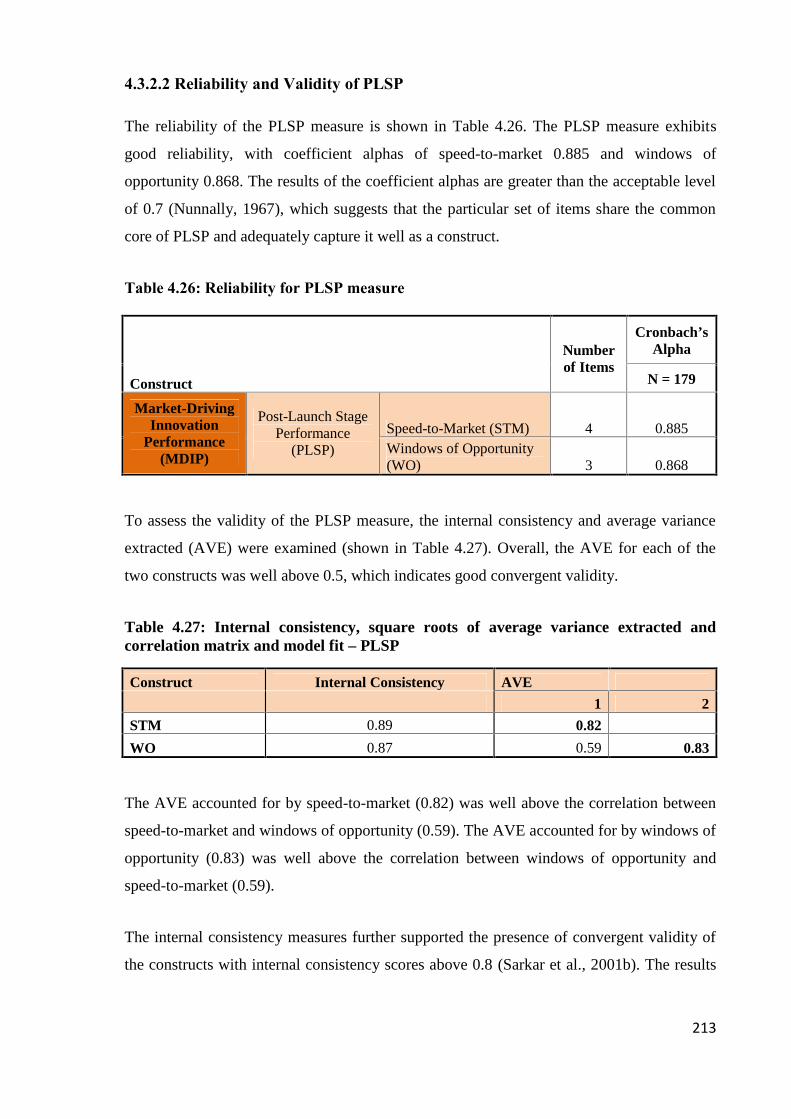
213
4.3.2.2 Reliability and Validity of PLSP
The reliability of the PLSP measure is shown in Table 4.26. The PLSP measure exhibits
good reliability, with coefficient alphas of speed-to-market 0.885 and windows of
opportunity 0.868. The results of the coefficient alphas are greater than the acceptable level
of 0.7 (Nunnally, 1967), which suggests that the particular set of items share the common
core of PLSP and adequately capture it well as a construct.
Table 4.26: Reliability for PLSP measure
Construct
Numberof Items
Cronbach’sAlpha
N = 179
Market-DrivingInnovation
Performance(MDIP)
Post-Launch StagePerformance
(PLSP)
Speed-to-Market (STM) 4 0.885Windows of Opportunity(WO) 3 0.868
To assess the validity of the PLSP measure, the internal consistency and average variance
extracted (AVE) were examined (shown in Table 4.27). Overall, the AVE for each of the
two constructs was well above 0.5, which indicates good convergent validity.
Table 4.27: Internal consistency, square roots of average variance extracted andcorrelation matrix and model fit – PLSP
Construct Internal Consistency AVE
1 2
STM 0.89 0.82
WO 0.87 0.59 0.83
The AVE accounted for by speed-to-market (0.82) was well above the correlation between
speed-to-market and windows of opportunity (0.59). The AVE accounted for by windows of
opportunity (0.83) was well above the correlation between windows of opportunity and
speed-to-market (0.59).
The internal consistency measures further supported the presence of convergent validity of
the constructs with internal consistency scores above 0.8 (Sarkar et al., 2001b). The results

214
suggest that speed-to-market and windows of opportunity are distinct measures of post-
launch stage performance; the total of 7 items therefore remains.
The goodness-of-fit analysis for PLSP is shown in Table 4.28, which indicates that the
model fits reasonably well.
Table 4.28: Goodness-of-fit analysis – PLSP
GOODNESS-OF-FITMEASURE RESULT GOODNESS-OF-FIT MEASURE RESULT
Model Fit Model Comparison
Chi-squared 33.100 Tucker-Lewis Index (TLI) 0.955
Degree of Freedom 13 Normed Fit Index (NFI) 0.955
p-value 0.002 Comparative Fit Index (CFI) 0.972
Cmin / df 2.546
RMSEA 0.093
Figure 4.7: Measurement Model – PLSP

215
4.3.3 Financial Performance (FP)
4.3.3.1 Operationalisation of FP
As reported in Chapter 2, this study adopted the financial performance (FP) measure as the
final success measure of market-driving innovation performance.
Similar to the windows of opportunity measure, this study adopted the measure proposed by
Kleinschmidt et al. (2007) for financial performance. The financial performance measure
comprises the four original items, which capture the extent to which:(1) “over the last three
years, in terms of sales (revenue) performance, how successful was your global NPD
program in meeting its objectives?”, (2) in terms of profitability, “how successful was your
global NPD program in meeting its profit objectives?”, (3) “what was the profitability of
your global NPD program, relative to competitors?” and (4) “what was the impact on your
global NPD program in terms of cost savings achieved?” (Kleinschmidt et al., 2007, p.441).
For the purpose of this research, these items and the preamble were simplified and adapted
to fit the unique context of breakthrough innovation.
Table 4.29 presents the FP measure and a total of four items.
Table 4.29: Measure for FP (adapted measure)
Construct Item Statement/Question Source
Financial Performance (FP): the extent to which breakthrough innovations meet theirsales (value/volume) and profit objectives relative to the resources invested in them.
Kleinschmidtet al. (2007)
FinancialPerformance
Preamble: “In terms of sales and profitability performance inyour company/SBU, how successful were your breakthroughinnovations in…”
,,
FP1 Meeting your sales volume objectives (units sold)? ,,
FP2 Meeting your sales value objectives (revenue generated)? ,,
FP3 Meeting your profit objectives? ,,
FP4 Being profitable relative to the resources invested in them? ,,
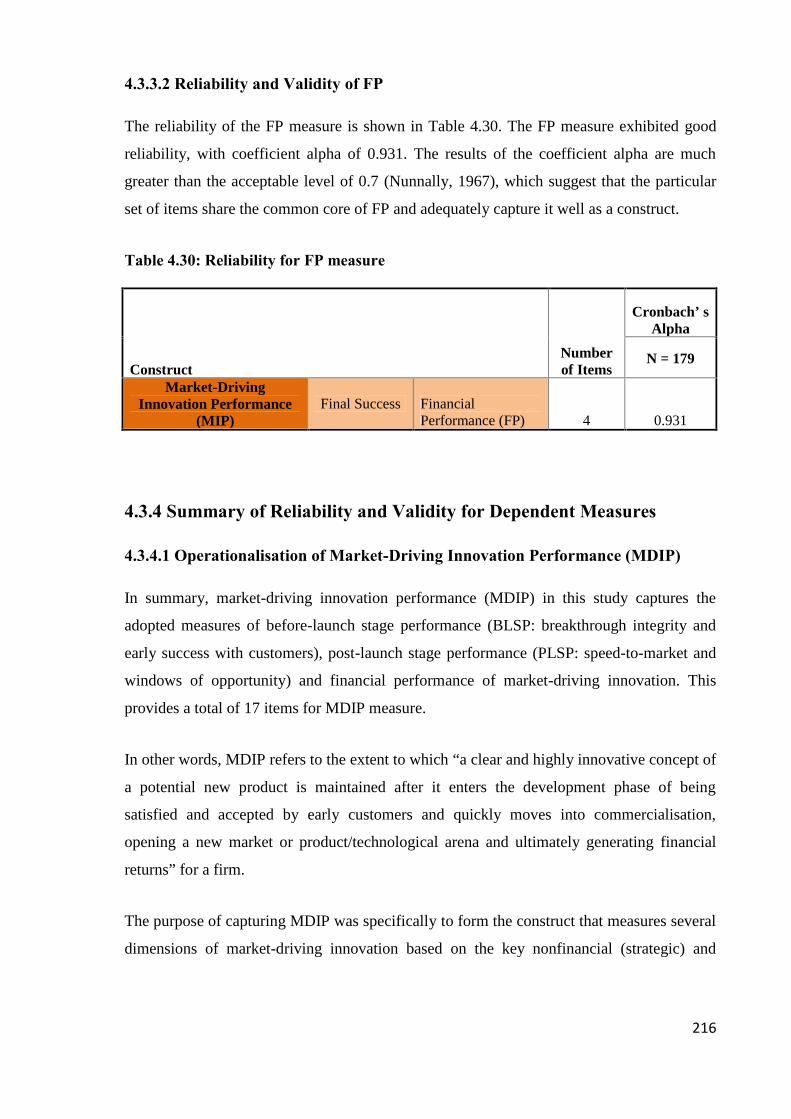
216
4.3.3.2 Reliability and Validity of FP
The reliability of the FP measure is shown in Table 4.30. The FP measure exhibited good
reliability, with coefficient alpha of 0.931. The results of the coefficient alpha are much
greater than the acceptable level of 0.7 (Nunnally, 1967), which suggest that the particular
set of items share the common core of FP and adequately capture it well as a construct.
Table 4.30: Reliability for FP measure
ConstructNumberof Items
Cronbach’ sAlpha
N = 179
Market-DrivingInnovation Performance
(MIP)Final Success Financial
Performance (FP) 4 0.931
4.3.4 Summary of Reliability and Validity for Dependent Measures
4.3.4.1 Operationalisation of Market-Driving Innovation Performance (MDIP)
In summary, market-driving innovation performance (MDIP) in this study captures the
adopted measures of before-launch stage performance (BLSP: breakthrough integrity and
early success with customers), post-launch stage performance (PLSP: speed-to-market and
windows of opportunity) and financial performance of market-driving innovation. This
provides a total of 17 items for MDIP measure.
In other words, MDIP refers to the extent to which “a clear and highly innovative concept of
a potential new product is maintained after it enters the development phase of being
satisfied and accepted by early customers and quickly moves into commercialisation,
opening a new market or product/technological arena and ultimately generating financial
returns” for a firm.
The purpose of capturing MDIP was specifically to form the construct that measures several
dimensions of market-driving innovation based on the key nonfinancial (strategic) and

217
financial outcomes and to categorise the outcomes by a different time horizon (Cordero,
1990; Utterback & Abernathy, 1975).
4.3.4.2 Reliability and Validity of MDIP
The reliability of the MDIP measure overall is shown in Table 4.31. The MDIP measure
exhibits good reliability, with coefficient alphas of breakthrough integrity 0.789, early
success with customers 0.855, speed-to-market 0.885, windows of opportunity 0.868 and
financial performance 0.931. The results show that all the coefficient alphas are higher than
the acceptable level of 0.7 (Nunnally, 1967), which suggests that each set of items share the
common core of MDIP and adequately captures it well as a construct.
Table 4.31: Reliability for MDIP measure
Numberof Items
Cronbach'sAlpha
Construct N = 179
Market-DrivingInnovation
Performance(MDIP)
Before-Launch StagePerformance (BLSP)
BreakthroughIntegrity (BI) 3 0.789Early Success withCustomers (ESC) 3 0.855
Post-Launch StagePerformance (PLSP)
Speed-to-Market(STM) 4 0.885Windows ofOpportunity (WO) 3 0.868
Final SuccessFinancialPerformance (FP) 4 0.931
To assess the validity of the MDIP measure, the internal consistency, average variance
extracted (AVE) and correlation matrix were examined and are shown in Table 4.32.
Overall, the average variance extracted for each of the five constructs was well above 0.5,
which indicates good convergent validity.
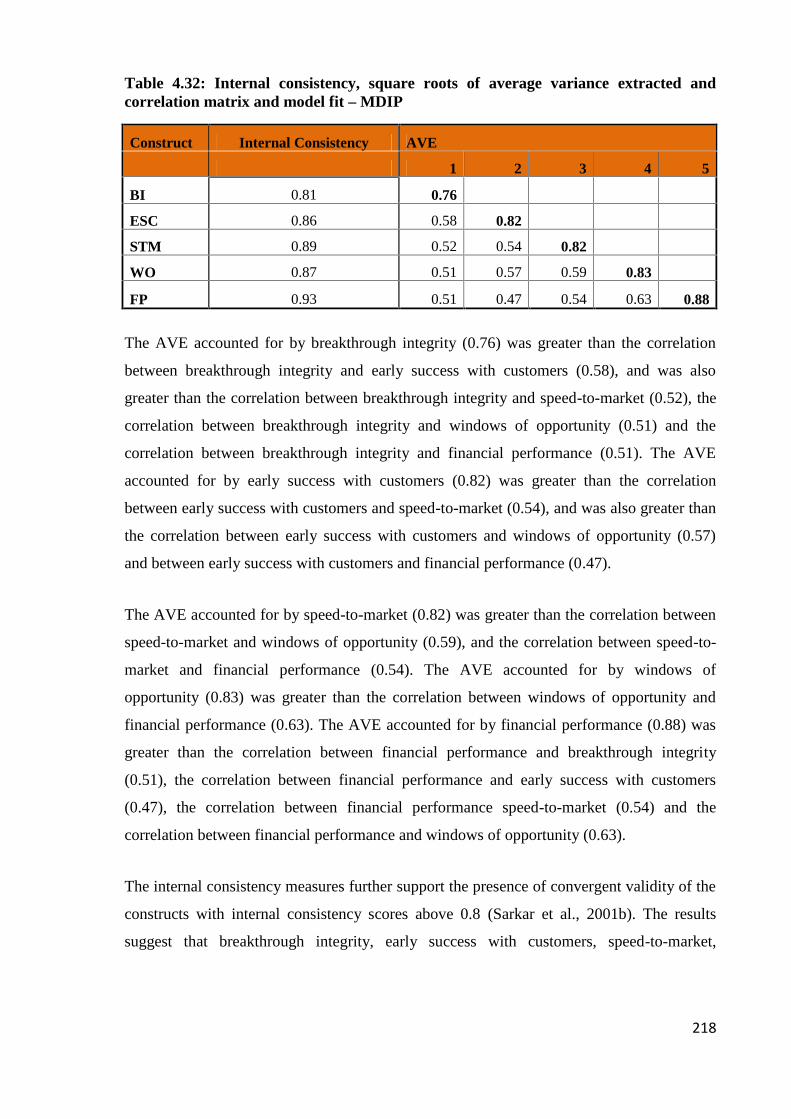
218
Table 4.32: Internal consistency, square roots of average variance extracted andcorrelation matrix and model fit – MDIP
Construct Internal Consistency AVE
1 2 3 4 5
BI 0.81 0.76
ESC 0.86 0.58 0.82
STM 0.89 0.52 0.54 0.82
WO 0.87 0.51 0.57 0.59 0.83
FP 0.93 0.51 0.47 0.54 0.63 0.88
The AVE accounted for by breakthrough integrity (0.76) was greater than the correlation
between breakthrough integrity and early success with customers (0.58), and was also
greater than the correlation between breakthrough integrity and speed-to-market (0.52), the
correlation between breakthrough integrity and windows of opportunity (0.51) and the
correlation between breakthrough integrity and financial performance (0.51). The AVE
accounted for by early success with customers (0.82) was greater than the correlation
between early success with customers and speed-to-market (0.54), and was also greater than
the correlation between early success with customers and windows of opportunity (0.57)
and between early success with customers and financial performance (0.47).
The AVE accounted for by speed-to-market (0.82) was greater than the correlation between
speed-to-market and windows of opportunity (0.59), and the correlation between speed-to-
market and financial performance (0.54). The AVE accounted for by windows of
opportunity (0.83) was greater than the correlation between windows of opportunity and
financial performance (0.63). The AVE accounted for by financial performance (0.88) was
greater than the correlation between financial performance and breakthrough integrity
(0.51), the correlation between financial performance and early success with customers
(0.47), the correlation between financial performance speed-to-market (0.54) and the
correlation between financial performance and windows of opportunity (0.63).
The internal consistency measures further support the presence of convergent validity of the
constructs with internal consistency scores above 0.8 (Sarkar et al., 2001b). The results
suggest that breakthrough integrity, early success with customers, speed-to-market,
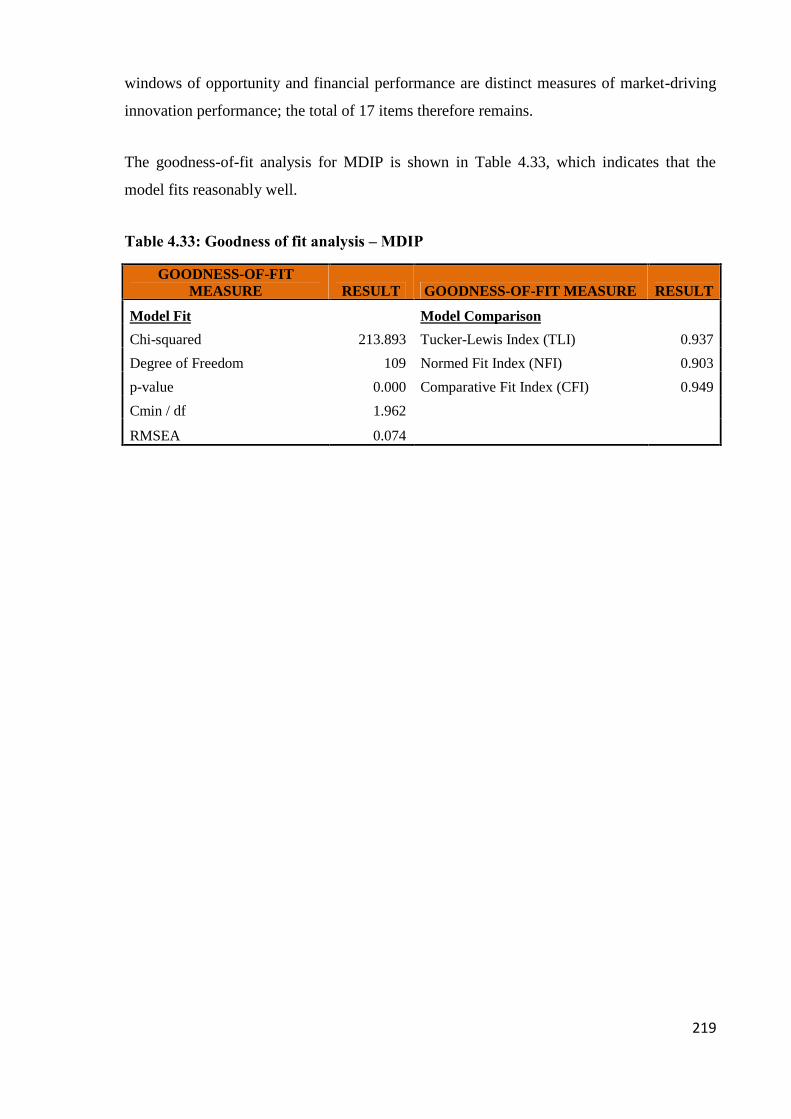
219
windows of opportunity and financial performance are distinct measures of market-driving
innovation performance; the total of 17 items therefore remains.
The goodness-of-fit analysis for MDIP is shown in Table 4.33, which indicates that the
model fits reasonably well.
Table 4.33: Goodness of fit analysis – MDIP
GOODNESS-OF-FITMEASURE RESULT GOODNESS-OF-FIT MEASURE RESULT
Model Fit Model Comparison
Chi-squared 213.893 Tucker-Lewis Index (TLI) 0.937
Degree of Freedom 109 Normed Fit Index (NFI) 0.903
p-value 0.000 Comparative Fit Index (CFI) 0.949
Cmin / df 1.962
RMSEA 0.074
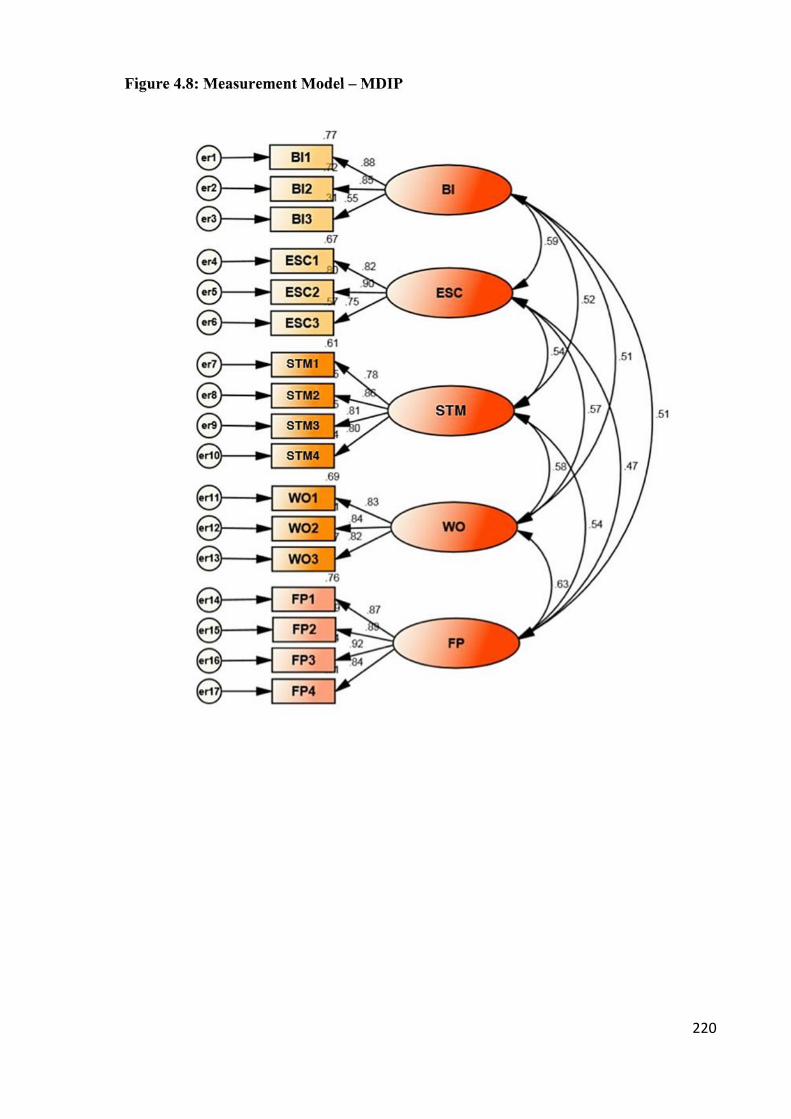
220
Figure 4.8: Measurement Model – MDIP
221
4.4 Operationalisation, Reliability and Validity of Moderation
Measures
In this study, the proposed moderators which are expected to influence the impact of market
vision on before-launch stage performance (BLSP) and post-launch stage performance
(PLSP) are: (1) external environment (EE), (2) NPD process rigidity (NPDR) and (3) firm
size (number of employees).
4.4.1 External Environment (EE)
4.4.1.1 Operationalisation of EE
The role of the external environment (EE) as a moderator on the effectiveness of different
strategic choices or market orientation has been highlighted in many new product
development studies (e.g. Li & Atuahene-Gima, 2001; Lukas & Ferrell, 2000; Yap &
Souder, 1994). As described in Chapter 2, the moderating role of the external environment
was proposed to influence the impact of MV on before-launch stage performance and post-
launch stage performance. There are a few scales that can be used to measure the external
environment. The original external environment scale was developed by Jaworski and Kohli
(1993) with a total of 17 items. The study investigates the roles of technological turbulence,
market turbulence and competitive intensity as moderators between traditional market
orientation and general business performance.
The review of empirical studies on environmental moderators in conjunction with the
feedback received from academic and industry experts indicated that Zhang and Duan
(2010) external environmental measure appeared to be the most appropriate measure for this
study. The study further refined the EE measure on parsimonious grounds using the scales
derived from Jaworski and Kohli (1993). This was done through factor analysis, which
resulted in the removal of some ambiguous items such as “our competitors are relatively
weak” and “we cater too many of the same customers that we used to in the past” (Jaworski
& Kohli, 1993, p.68). As typically characterised, the EE measure has three commonly used
dimensions: competitive intensity, technological turbulence and market turbulence. Their
final measure consists of 11 items in total (Zhang & Duan, 2010).

222
Further justification for adopting the scale of Zhang and Duan (2010) was their study’s
purpose and context, which appeared to be closely related to the framework of this thesis.
One of the aims of Zhang and Duan (2010) study was to “empirically examine whether
proactive and responsive market orientation impact new product performance directly and
indirectly via firm’s innovativeness” (Zhang & Duan, 2010, p.850). The study emphasised
the importance of differentiating the types of market orientation strategies and their impact
on new product performance, rather than following only the traditional market orientation.
As noted in Chapter 2, proactive market orientation emerged as an essential concept in the
case of breakthrough innovation and was captured in the market visioning competence
construct. Additionally, the study adopted the concept of a firm’s innovativeness (Hurley &
Hult, 1998) and assessed its role as a mediator between market orientation strategy and new
product performance. Similar to this study, Zhang and Duan (2010) highlighted the
importance of improving a firm’s innovative capacity, that is, its capacity to develop and
introduce new ideas or product innovations.
More importantly, Zhang and Duan (2010) study aimed to “investigate the moderating role
of external environmental variables in the MO-product innovation performance link”
(p.850). Zhang and Duan (2010) stated that “understanding these relationships can provide
useful insights into how organizations should choose their priority of market orientation
strategy in order to promote new product performance under different environment
conditions” (p.850). This appears to be consistent with the framing of this thesis in that the
early strategic direction (the emergent MV) was proposed to influence market-driving
innovation performance in different environment conditions.
Lastly, Zhang and Duan (2010) gathered empirical evidence from manufacturing firms in
mainland China using a quantitative survey. The informants were highly familiar with new
product development, R&D and marketing strategy, and were asked about product
innovation performance during the last three years. This context appears to be similar to the
framework of this thesis, including a developing country as the region of data collection. In
consequence, the external environment measure developed by Zhang and Duan (2010) was
adopted for this study with 11 items in total. A new preamble was developed to support the
use of the external environment measure.
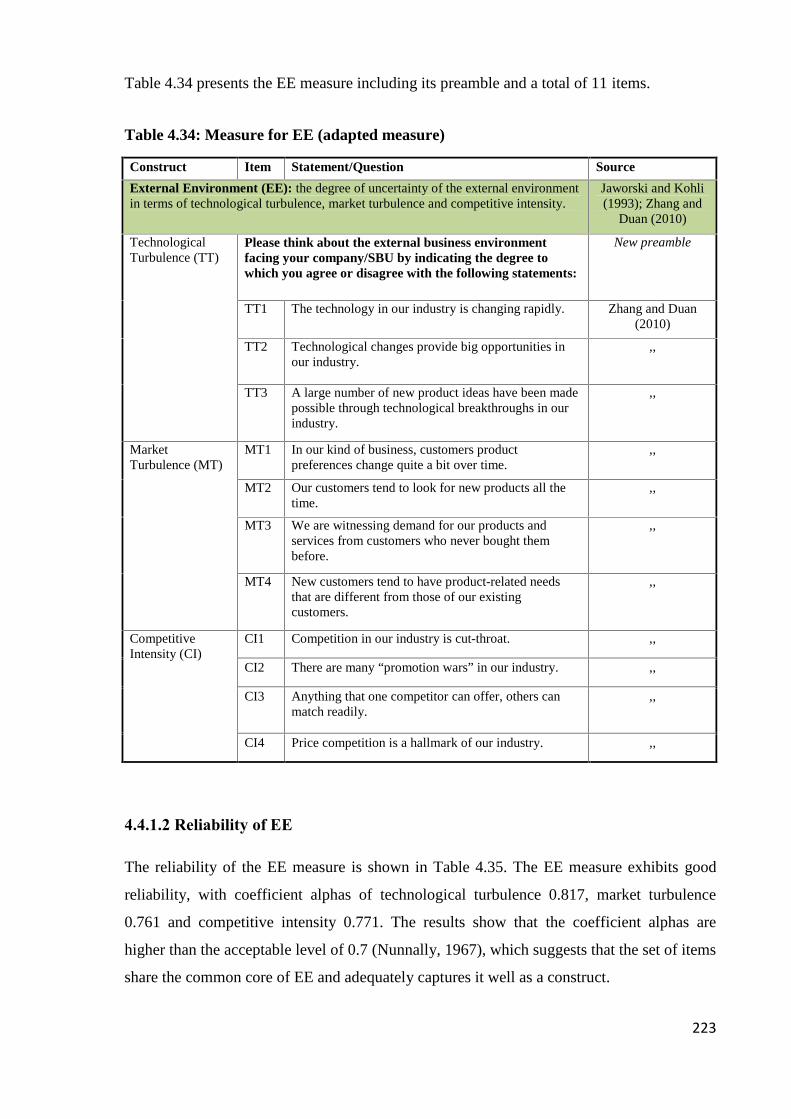
223
Table 4.34 presents the EE measure including its preamble and a total of 11 items.
Table 4.34: Measure for EE (adapted measure)
Construct Item Statement/Question Source
External Environment (EE): the degree of uncertainty of the external environmentin terms of technological turbulence, market turbulence and competitive intensity.
Jaworski and Kohli(1993); Zhang and
Duan (2010)
TechnologicalTurbulence (TT)
Please think about the external business environmentfacing your company/SBU by indicating the degree towhich you agree or disagree with the following statements:
New preamble
TT1 The technology in our industry is changing rapidly. Zhang and Duan(2010)
TT2 Technological changes provide big opportunities inour industry.
,,
TT3 A large number of new product ideas have been madepossible through technological breakthroughs in ourindustry.
,,
MarketTurbulence (MT)
MT1 In our kind of business, customers productpreferences change quite a bit over time.
,,
MT2 Our customers tend to look for new products all thetime.
,,
MT3 We are witnessing demand for our products andservices from customers who never bought thembefore.
,,
MT4 New customers tend to have product-related needsthat are different from those of our existingcustomers.
,,
CompetitiveIntensity (CI)
CI1 Competition in our industry is cut-throat. ,,
CI2 There are many “promotion wars” in our industry. ,,
CI3 Anything that one competitor can offer, others canmatch readily.
,,
CI4 Price competition is a hallmark of our industry. ,,
4.4.1.2 Reliability of EE
The reliability of the EE measure is shown in Table 4.35. The EE measure exhibits good
reliability, with coefficient alphas of technological turbulence 0.817, market turbulence
0.761 and competitive intensity 0.771. The results show that the coefficient alphas are
higher than the acceptable level of 0.7 (Nunnally, 1967), which suggests that the set of items
share the common core of EE and adequately captures it well as a construct.

224
Table 4.35: Reliability for EE measure
Numberof
Items
Cronbach’sAlpha
ConstructN = 179
Moderators ExternalEnvironment (EE)
Technological Turbulence (TT) 3 0.817
Market Turbulence (MT) 4 0.761
Competitive Intensity (CI) 4 0.771
4.4.2 NPD Process Rigidity (NPDR)
4.4.2.1 Operationalisation of NPDR
As defined in Chapter 2, NPD process rigidity (NPDR) reflects the formality of a process,
such as having clearly defined gates, which may result in rigidity or inflexibility inherent in
the NPD process. Similar to the windows of opportunity and financial performance
measures, the measure for NPD process rigidity was adopted based on ‘NPD process
formality’ measure developed by Kleinschmidt et al. (2007). The original scale of NPD
process formality consisted of three items. For the purpose of this research, the scale was
adapted to consist of five items; three items were the existing items and the additional two
items were formulated mainly from the studies by Sethi and Iqbal (2008) and Wind and
Mahajan (1997). The two newly formulated items are the degree to which an NPD process:
(1) is quite linear and inflexible; there is little scope to do things differently and (2)
reinforces the status quo by solving customers’ existing problems or stated preferences in
current markets. The existing preamble to the NPD process formality measure was also
simplified and adapted to fit the context of breakthrough innovation.
Table 4.36 presents the NPDR measure and a total of five items.
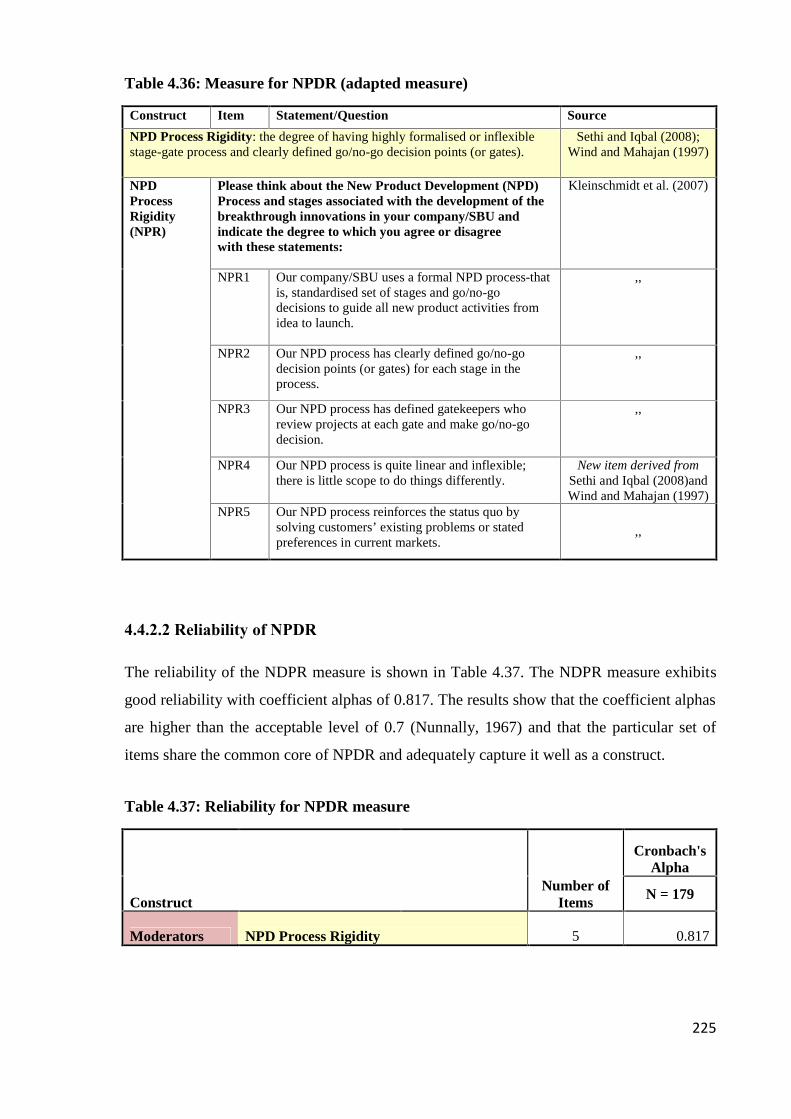
225
Table 4.36: Measure for NPDR (adapted measure)
Construct Item Statement/Question Source
NPD Process Rigidity: the degree of having highly formalised or inflexiblestage-gate process and clearly defined go/no-go decision points (or gates).
Sethi and Iqbal (2008);Wind and Mahajan (1997)
NPDProcessRigidity(NPR)
Please think about the New Product Development (NPD)Process and stages associated with the development of thebreakthrough innovations in your company/SBU andindicate the degree to which you agree or disagreewith these statements:
Kleinschmidt et al. (2007)
NPR1 Our company/SBU uses a formal NPD process-thatis, standardised set of stages and go/no-godecisions to guide all new product activities fromidea to launch.
,,
NPR2 Our NPD process has clearly defined go/no-godecision points (or gates) for each stage in theprocess.
,,
NPR3 Our NPD process has defined gatekeepers whoreview projects at each gate and make go/no-godecision.
,,
NPR4 Our NPD process is quite linear and inflexible;there is little scope to do things differently.
New item derived fromSethi and Iqbal (2008)andWind and Mahajan (1997)
NPR5 Our NPD process reinforces the status quo bysolving customers’ existing problems or statedpreferences in current markets.
,,
4.4.2.2 Reliability of NPDR
The reliability of the NDPR measure is shown in Table 4.37. The NDPR measure exhibits
good reliability with coefficient alphas of 0.817. The results show that the coefficient alphas
are higher than the acceptable level of 0.7 (Nunnally, 1967) and that the particular set of
items share the common core of NPDR and adequately capture it well as a construct.
Table 4.37: Reliability for NPDR measure
Cronbach'sAlpha
ConstructNumber of
Items N = 179
Moderators NPD Process Rigidity 5 0.817

226
4.4.3 Firm Size
4.4.3.1 Operationalisation of Firm Size
The data regarding number of employees was collected categorically in nature. A single
question regarding the firm size was used: “How many employees are there within your
company or SBU?” The informants were asked to refer to their strategic business unit
(SBU) or, when the firm had a single SBU, to their firm. The categories were treated
statistically as an ordinal scale with the scale points running from 1 – 7, where 1 relates to a
company of small size and 7 relates to a company of large size (7 categories: 1- 20, 21 – 40,
41 – 60, 61 -100, 101 – 200, 201 – 500, 500+). This is similar in approach used by other
researchers (e.g. Gronum, Verreynne & Kastelle, 2012). The categories of firm size used in
this way also become amenable for correlation analysis in which positive or negative
correlations with other variables represent the influence of larger or smaller firms. For use in
moderation analysis firms were split into two groups (Burgelman & Sayles, 1986; Simon,
1945), where small- and medium-sized firms were clustered together (≤ 60 employees) and
large-sized firms were clustered (over 60 employees).
4.4.4 Summary of Reliability for Moderation Measures (EE/NPDR)
The overall reliability of the moderation measures for external environment and NPD
process rigidity is shown in Table 4.38. The coefficient alphas of all the measures were
greater than 0.7 (Cortina, 1993; de Vaus, 1995). The results indicate that the set of items for
each of the dimensions/indicators adequately captures the underlying core of their
constructs.
Table 4.38: Reliability for Moderation Measures
Cronbach'sAlpha
ConstructNumber of
Items N = 179
Moderators
ExternalEnvironment(EE)
Technological Turbulence (TT) 3 0.817
Market Turbulence (MT) 4 0.761
Competitive Intensity (CI) 4 0.771
NPD Process Rigidity 5 0.817
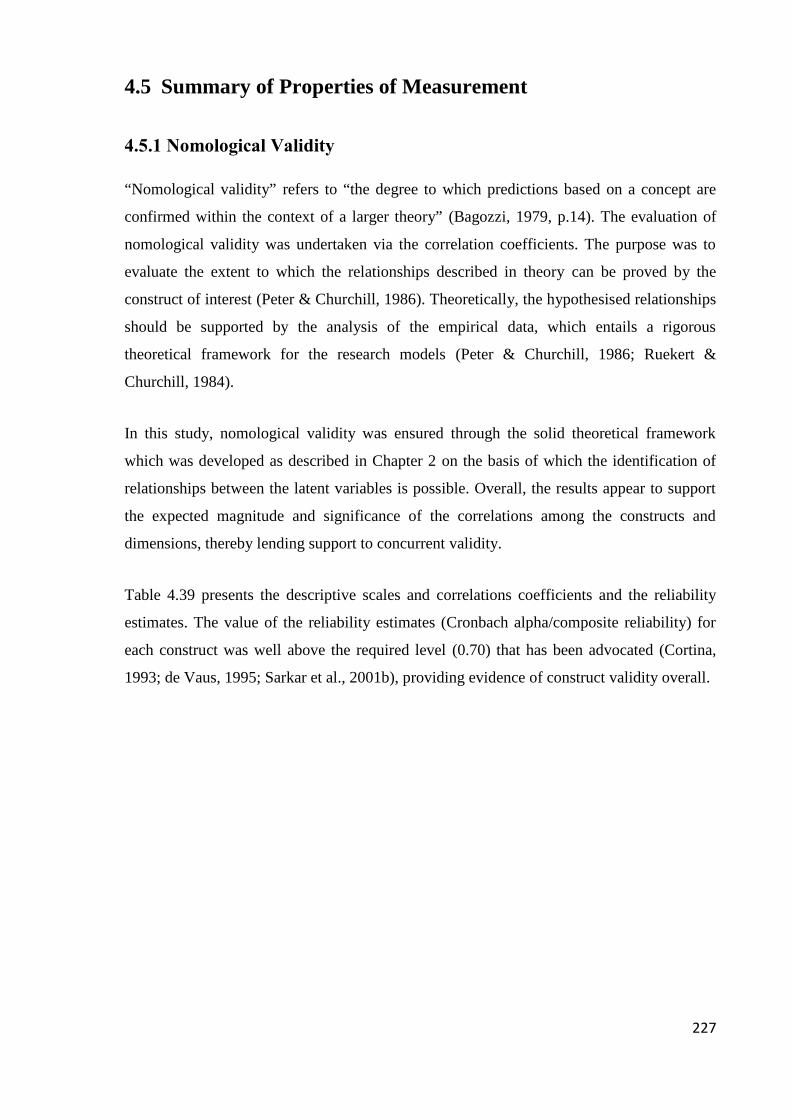
227
4.5 Summary of Properties of Measurement
4.5.1 Nomological Validity
“Nomological validity” refers to “the degree to which predictions based on a concept are
confirmed within the context of a larger theory” (Bagozzi, 1979, p.14). The evaluation of
nomological validity was undertaken via the correlation coefficients. The purpose was to
evaluate the extent to which the relationships described in theory can be proved by the
construct of interest (Peter & Churchill, 1986). Theoretically, the hypothesised relationships
should be supported by the analysis of the empirical data, which entails a rigorous
theoretical framework for the research models (Peter & Churchill, 1986; Ruekert &
Churchill, 1984).
In this study, nomological validity was ensured through the solid theoretical framework
which was developed as described in Chapter 2 on the basis of which the identification of
relationships between the latent variables is possible. Overall, the results appear to support
the expected magnitude and significance of the correlations among the constructs and
dimensions, thereby lending support to concurrent validity.
Table 4.39 presents the descriptive scales and correlations coefficients and the reliability
estimates. The value of the reliability estimates (Cronbach alpha/composite reliability) for
each construct was well above the required level (0.70) that has been advocated (Cortina,
1993; de Vaus, 1995; Sarkar et al., 2001b), providing evidence of construct validity overall.

228
Table 4.39: Descriptive scales and correlations coefficients, and reliability estimatesVariables 1 2 3 4 5 6 7 8 9 10 11 12 13 14 15 16 17 18 19 20
1 Financial Performance
2 Windows of Opportunity 0.57**
3 Speed-to-Market 0.50** 0.53**
4 Early Success with Customers 0.47** 0.51** 0.52**
5 Breakthrough Integrity 0.48** 0.44** 0.47** 0.56**
6 Absorptive Capacity - Acquire Knowledge 0.31** 0.48** 0.34** 0.36** 0.26**
7 Absorptive Capacity - Assimilate Knowledge 0.33** 0.48** 0.46** 0.38** 0.25** 0.54**
8 Absorptive Capacity - Transform Knowledge 0.39** 0.48** 0.55** 0.39** 0.35** 0.53** 0.58**
9 Absorptive Capacity - Exploit Knowledge 0.33** 0.57** 0.49** 0.48** 0.40** 0.65** 0.65** 0.67**
10 Market Visioning Competence - Proactive Market Learning 0.40** 0.50** 0.44** 0.39** 0.40** 0.45** 0.49** 0.53** 0.60**
11 Market Visioning Competence - Idea Networking 0.33** 0.51** 0.47** 0.43** 0.40** 0.58** 0.63** 0.61** 0.76** 0.57**
12 Market Vision - Specific Magnetism 0.27** 0.50** 0.44** 0.40** 0.35** 0.54** 0.61** 0.55** 0.69** 0.62** 0.67**
13 Market Vision - Form 0.32** 0.46** 0.42** 0.45** 0.33** 0.56** 0.55** 0.59** 0.64** 0.58** 0.73** 0.65**
14 Market Vision - Scope 0.14 0.25** 0.28** 0.23** 0.13 0.48** 0.40** 0.42** 0.50** 0.45** 0.52** 0.50** 0.71**
15 Market Vision - Clarity 0.34** 0.42** 0.39** 0.31** 0.27** 0.46** 0.44** 0.50** 0.51** 0.51** 0.55** 0.54** 0.61** 0.55**
16 Number of Employees (Firm Size) -0.04 -0.09 -0.18* -0.26** -0.25** -0.18* -0.20** -0.03 -0.20** -0.16* -0.24** -0.24** -0.16* -0.15* -0.14
17 External environment - Technical Turbulence 0.17* 0.32** 0.25** 0.25** 0.11 0.39** 0.29** 0.42** 0.34** 0.34** 0.31** 0.30** 0.35** 0.28** 0.27** 0.04
18 External environment - Market Turbulence 0.21** 0.31** 0.29** 0.31** 0.26** 0.42** 0.30** 0.42** 0.34** 0.38** 0.41** 0.33** 0.36** 0.27** 0.34** -0.04 0.58**
19 External environment - Competitive Intensity 0.06 0.07 0.08 0.12 0.05 0.19* 0.12 0.20** 0.15* 0.20** 0.15* 0.12 0.24** 0.24** 0.15* 0.22** 0.35** 0.46**
20 NPD Process Rigidity 0.29** 0.33** 0.47** 0.27** 0.26** 0.35** 0.41** 0.51** 0.43** 0.44** 0.44** 0.45** 0.49** 0.43** 0.44** 0.11 0.45** 0.42** 0.40**
Mean 4.89 5.10 4.52 5.14 4.36 5.58 5.13 4.89 5.46 5.22 5.33 5.28 5.35 5.46 5.60 3.91 5.45 5.35 5.40 5.12
S.D. 1.15 0.93 1.35 1.06 1.09 1.10 1.27 1.20 1.03 1.00 1.04 1.07 0.94 0.99 0.91 2.33 1.05 0.91 1.09 0.99
Cronbach ∝ 0.93 0.87 0.89 0.86 0.79 0.87 0.90 0.94 0.92 0.79 0.91 0.93 0.89 0.90 0.92 N/A 0.82 0.76 0.77 0.82
CR 0.93 0.87 0.89 0.86 0.81 0.88 0.90 0.94 0.92 0.79 0.91 0.93 0.89 0.90 0.92 N/A N/A N/A N/A N/A
AVE 0.88 0.83 0.82 0.82 0.76 0.84 0.83 0.90 0.85 0.74 0.79 0.86 0.83 0.87 0.88 N/A N/A N/A N/A N/A
**. Correlation is significant at the 0.01 level (2-tailed).
*. Correlation is significant at the 0.05 level (2-tailed).

229
4.5.2 Inter-Construct Correlation
Table 4.40 displays the correlations of the various dimensions of the constructs in a
correlation matrix. All constructs exhibited the average variance extracted (AVE) of above
0.50, considered indicative for convergent validity. Further, the AVE for each of the
measures has to be greater than its shared variance with any of the other construct to suggest
a discriminant validity (Fornell & Larcker, 1981). While this condition was satisfied for
most of the constructs and their dimensions, there were some minor issues. The average
variance accounted by exploitation of knowledge (0.85) was marginally higher than the
correlation between exploitation of knowledge and idea networking (0.81). The average
variance accounted by proactive market learning (0.74) was equivalent to the correlation
between proactive market learning and specific magnetism (0.74). The average variance
accounted by idea networking (0.79) was slightly lower than the correlation between idea
networking and form (0.81).
Despite these slightly lower AVEs, there is still theoretical and explanatory utility in
keeping these constructs separate. As all other measures indicated sufficient construct
validity, the decision was made not to further purify the measures in order to maintain the
theoretical richness of the constructs. Overall, there is support for the assumption of
convergent validity and an assessment that all constructs and their dimensions are
satisfactorily construct discriminant, and thus they are retained for the development of the
structural equation modelling.
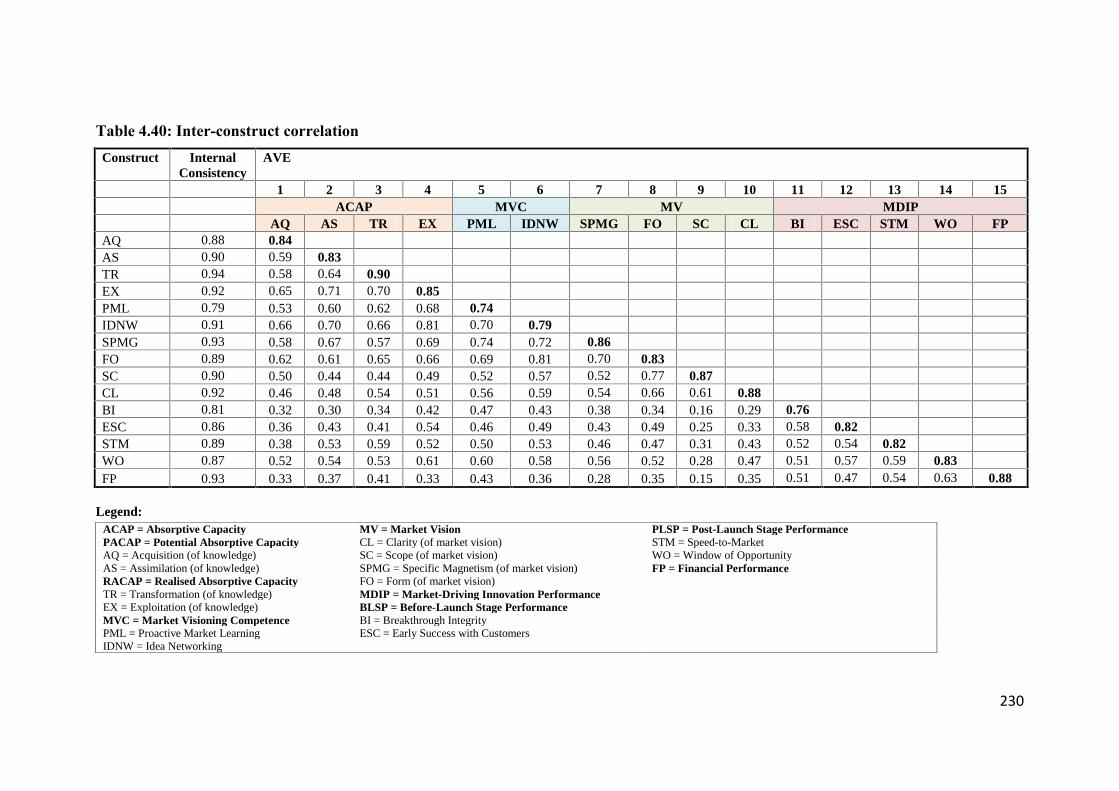
230
Table 4.40: Inter-construct correlationConstruct Internal
ConsistencyAVE
1 2 3 4 5 6 7 8 9 10 11 12 13 14 15ACAP MVC MV MDIP
AQ AS TR EX PML IDNW SPMG FO SC CL BI ESC STM WO FPAQ 0.88 0.84AS 0.90 0.59 0.83TR 0.94 0.58 0.64 0.90EX 0.92 0.65 0.71 0.70 0.85PML 0.79 0.53 0.60 0.62 0.68 0.74IDNW 0.91 0.66 0.70 0.66 0.81 0.70 0.79SPMG 0.93 0.58 0.67 0.57 0.69 0.74 0.72 0.86FO 0.89 0.62 0.61 0.65 0.66 0.69 0.81 0.70 0.83SC 0.90 0.50 0.44 0.44 0.49 0.52 0.57 0.52 0.77 0.87CL 0.92 0.46 0.48 0.54 0.51 0.56 0.59 0.54 0.66 0.61 0.88BI 0.81 0.32 0.30 0.34 0.42 0.47 0.43 0.38 0.34 0.16 0.29 0.76ESC 0.86 0.36 0.43 0.41 0.54 0.46 0.49 0.43 0.49 0.25 0.33 0.58 0.82STM 0.89 0.38 0.53 0.59 0.52 0.50 0.53 0.46 0.47 0.31 0.43 0.52 0.54 0.82WO 0.87 0.52 0.54 0.53 0.61 0.60 0.58 0.56 0.52 0.28 0.47 0.51 0.57 0.59 0.83FP 0.93 0.33 0.37 0.41 0.33 0.43 0.36 0.28 0.35 0.15 0.35 0.51 0.47 0.54 0.63 0.88
Legend:ACAP = Absorptive Capacity MV = Market Vision PLSP = Post-Launch Stage PerformancePACAP = Potential Absorptive Capacity CL = Clarity (of market vision) STM = Speed-to-MarketAQ = Acquisition (of knowledge) SC = Scope (of market vision) WO = Window of OpportunityAS = Assimilation (of knowledge) SPMG = Specific Magnetism (of market vision) FP = Financial PerformanceRACAP = Realised Absorptive Capacity FO = Form (of market vision)TR = Transformation (of knowledge) MDIP = Market-Driving Innovation PerformanceEX = Exploitation (of knowledge) BLSP = Before-Launch Stage PerformanceMVC = Market Visioning Competence BI = Breakthrough IntegrityPML = Proactive Market Learning ESC = Early Success with CustomersIDNW = Idea Networking
231
4.6 Demographics
The general characteristics of the respondents’ job, company and product development
activities were collected. The categories of the demographic data were predominantly drawn
from Product Development Management Association (PDMA) research on new product
development best practices (Griffin, 1997b). Examples of the demographic data include: job
title and duration with the firm, organisational structure and new product effort structure,
annual turnover and percentage spent on R&D, and number of product innovations introduced
in the last three years to reflect a more recent product development activities of the
company/SBU (see Appendix 2 for more details).
232
4.7 Chapter Summary
This chapter explained how the constructs, as described in Chapter 2, were operationalised and
assessed for reliability and validity. Drawing from the literature review, the core of this thesis is
the focus on breakthrough integrity (BI), which is the ability to maintain a clear and highly
innovative concept of a potential new product from the front end of breakthrough innovation
through to launch (Clark & Fujimoto, 1990, 1991; Reid & de Brentani, 2010; Seidel, 2007). As
there was no existing scale published for BI, the development of the measurement scale items
was based on how BI was defined in this study and drawn from relevant studies in the product
innovation, marketing and management literature. The rest of the measurement instruments
were drawn primarily from the scales developed by other researchers in product innovation and
management literature. Some of the existing scales were slightly adapted while a few new items
had to be developed specifically to fit the context of the front end of breakthrough innovation.
The original meaning of each of the measurement items was maintained and validated by the
academics and industry experts familiar with the area of study prior to the administration of the
survey.
The measurement scales, both new and existing, were evaluated on the basis of the empirical
data via Cronbach’s alpha, factor analysis and correlation analysis. The analysis of the results
suggests that, overall, the constructs exhibit acceptable reliability and validity in terms of their
content and their convergent, discriminant and nomological validity. Chapter 5 reports on the
assessment of the constructs in relation to the hypothesised relationships proposed in the
conceptual model, and presents the results and a discussion of the findings.
233
CHAPTER 5: RESULTS AND DISCUSSION
5.1 Introduction
The previous Chapter 4 described the operationalisation of the constructs and the assessment
for reliability and validity.
Chapter 5 presents the results of the analysis undertaken to examine the hypotheses developed
in this thesis, as listed below.
Absorptive Capacity as an Antecedent to Market Visioning Competence
H1a: ACAP has a significant and positive impact on MVC.
H1b: PACAP has a significant and positive impact on MVC.
H1c: RACAP has a significant and positive impact on MVC.
Market Visioning Competence and Market Vision
H2: MVC has a significant and positive impact on MV.
Performance Consequences of Market Vision
H3: MV has a significant and positive impact on before-launch stage performance.
H4: MV has a significant and positive impact on post-launch stage performance.
Market-Driving Innovation Performance
H5: Before-launch stage performance has a significant and positive impact on post-launch
stage performance.

234
H6: Before-launch stage performance has a significant and positive impact on financial
performance.
H7: Post-launch stage performance has a significant and positive impact on financial
performance.
Proposed Moderation Effects
H8a: The relationship between MV and before-launch stage performance is negatively
influenced by CI, TT and MT.
H8b: The relationship between MV and post-launch stage performance is negatively
influenced by CI, TT and MT.
H9a: The degree of NPD process rigidity negatively influences the relationship between MV
and before-launch stage performance.
H9b: The degree of NPD process rigidity negatively influences the relationship between MV
and post-launch stage performance.
H10a: Large firm size (number of employees) positively influences the relationship between
MV and before-launch stage performance.
H10b: Large firm size (number of employees) positively influences the relationship between
MV and post-launch stage performance.

235
5.2 Data Analysis
To examine the proposed hypotheses, the direct relationships between variables were first
tested through the use of simple and multiple regression analyses. This included several tests
undertaken to meet the assumptions of multiple regression prior to the analysis. Then, partial
least square structural equation modelling (PLS-SEM) was utilised for a more comprehensive
analysis of the hypothesised relationships.
5.2.1 Multiple Regression
Multiple regression is viewed as one of the best estimates of a dependent variable from a
number of independent variables (Hair et al., 2010; Malhotra, Peterson & Kleiser, 1999;
Tabachnick & Fidell, 2007). It is a set of statistical techniques based on correlation that
facilitates the exploration of the interrelationships among a set of variables. Specifically, there
are three main types of multiple regression. These are standard (simultaneous), hierarchical
(sequential) and stepwise. The standard technique is the most widely used method that
simultaneously tests the relationship between an entire set of independent (predictor) variables
entered into the equation. Thus, each variable is evaluated in terms of its predictive power over
that offered by all the other independent variables. In regard to hierarchical regression, the
independent variables are entered into the question in a specific order in steps or blocks where
they are assessed in terms of their contributions to the prediction of the dependent variable,
after other variables have been controlled for. With the stepwise regression model, the
independent variables being entered into the SPSS program are selected based on the
incremental explanatory power adding to the regression equation (Hair et al., 2010).
In the context of this research, the standard regression approach was considered to be the most
appropriate for the context of this research because the purpose of the analysis was to examine
the relationship between the whole set of independent and dependent variables. Accordingly,
SPSS (version 21) was utilised to run the standard regression analysis (both simple and
multiple). The key measures of the standard regression analysis are the adjusted R square
values and the F-ratio, which indicate the percentage of variance of the dependent variable and
236
its significance. Further, the beta and t-values also evaluate the importance and significance of
the independent variable in predicting the dependent variable. In this regard, two-tailed t-tests
and confidence intervals were used as the basis to determine support for the hypotheses. The
two-tailed p values are reported in Tables 5.1 to 5.11, using a significance level of p<0.05 or at
95% confidence interval.
Section 5.3 presents the regression analysis of the impacts of absorptive capacity (ACAP) and
its subsets of potential absorptive capacity (PACAP) and realised absorptive capacity (RACAP)
on market visioning competence (MVC). Section 5.4 presents the impact of market visioning
competence (MVC) on market vision (MV). Section 5.5 presents the analysis of performance
consequences of MV. This includes the impacts of MV on before-launch stage performance
(BLSP) and post-launch stage performance (PLSP). Section 5.6 presents the analysis of market-
driving innovation performance (MDIP). This involves the assessment of the associations
between BLSP, PLSP, and ultimately financial performance (FP). Section 5.7 examines the
proposed moderating effects of the external environment (EE), NPD process rigidity (NPDR)
and firm size (number of employees [NOE]) on the relationships between MV and BLSP, and
between MV and PLSP.
5.2.1.1 Assumptions of Multiple Regression
Multiple regression makes several underlying assumptions about the data being analysed,
which need to be accounted for. Prior to the multiple regression analysis, several tests were
undertaken to ensure there had been no violation. These tests were: sample size,
multicollinearity, outliers, normality, linearity and homoscedasticity of residuals and
independence error.
Sample Size
An appropriate sample size is required to facilitate generalisability. There are varying views
regarding the appropriate sample size. As indicated in Section 3.4.2.3, Tabachnick and Fidell
(2007) recommend a formula to determine requirements for sample size, that is, N > 50 + 8m,
237
where N is the required sample size (number of participants), and M is the number of
independent variables. The final sample size in the present study of 179 participants is well
above this criterion. The maximum number of predictors used in any one model totalled 10,
which yielded a required sample size of 130 participants, which was less than the 179 managers
who participated in this study. Accordingly, there was a sufficient sample size to examine all
the hypothesised models.
Multicollinearity
Multicollinearity occurs when the correlation among the independent variables are highly
correlated (generally .90 or higher) (Hair et al., 2010, p.200). This can create problems when
conducting multiple regression equations, as high correlations among independent variables can
result in two or more variables explaining the same area of variance in the dependent variable.
This makes it difficult to separate the effects of the independent variables on the dependent
variable (Field, 2009; Malhotra et al., 2006).
As shown in Table 4.40, a correlation matrix indicated that none of the variables were highly
correlated, with correlations generally around 0.5 and a few exceptions at around 0.7. These
exceptions were made through confirmatory factor analysis and the analysis of variance
extracted that they were discriminantly valid. This indicates no substantial collinearity.
To further ensure a lack of collinearity, the two most common diagnostics were, however,
substantiated: tolerance and its inverse, the variance inflation factor (VIF) (Hair et al., 2010).
The tolerance level is a direct measure that indicates how much of the variability of the
specified independent variable is not explained by other independent variables, and should not
be less than 0.10 (Tabachnick & Fidell, 2007). A small tolerance level indicates that there is a
degree of collinearity between variables. All of the regression equations in this study showed
tolerance levels much higher than 0.10. This suggested that collinearity was unlikely to be a
problem for the regression equations. To determine an appropriate level of tolerance, VIF is a
second measure of multicollinearity, and should not be greater than 10.00 (Grewal, Cote &
Baumgartner, 2004; Tabachnick & Fidell, 2007). All the observed variables were examined and
found to be within the range of acceptability.
238
Outliers
Outliers are a combination of values that are unusually very high or very low, which can be
problematic for multiple regression (Hair et al., 2010). Detecting outliers or extreme values was
part of the initial data screening process. A case-wise plot was used to identify and detect
outlying cases for all regression equations. According to Tabachnick and Fidell (2007),
standardised residual values above 3.3 or less than -3.3 are identified as outliers. In this regard,
four cases were identified as “unusual” or outliers. Nonetheless, the Cook’s Distance value in
the residuals statistics table was far below 1.00 in each case. Tabachnick and Fidell (2007, p.75)
indicate that cases with values larger than 1 can present a major problem. Therefore, these
findings suggest that there was no undue influence on the regression results.
Normality, Linearity, and Homoscedasticity
Multivariate normality is defined by Tabachnick and Fidell (2001) as “the assumption that each
variable and all linear combinations of the variable are normally distributed” (p. 70).
Homoscedasticity and linearity are elements of normality. Linearity is based on the assumptions
that the dependent variable scores should have linear relationship with the residuals.
Homoscedasticity is based on the assumption that the residuals around the dependent variables
should have the same variance for all predicted scores (Field, 2009; Tabachnick & Fidell,
2001). All these assumptions consider many aspects of the distribution of scores and the
underlying relationship between variables.
Accordingly, the assumptions relating to each were examined using residual scatterplots for
each regression equation in this study. The residuals, or differences between the obtained and
predicted dependent variable scores, were normally distributed in a straight line around a line
that was drawn through the O axis point (a reasonably straight diagonal line from bottom left to
top right). Therefore, there was no evidence of violation.
The scatterplots for all regression equations were non curvilinear (see Figure 5.1). Specifically,
most of the scores were concentrated in the centre, along the 0 point. This indicates that there
was no clear relationship between the residuals and predicted values, thereby supporting the
assumptions for linearity and homoscedasticity.
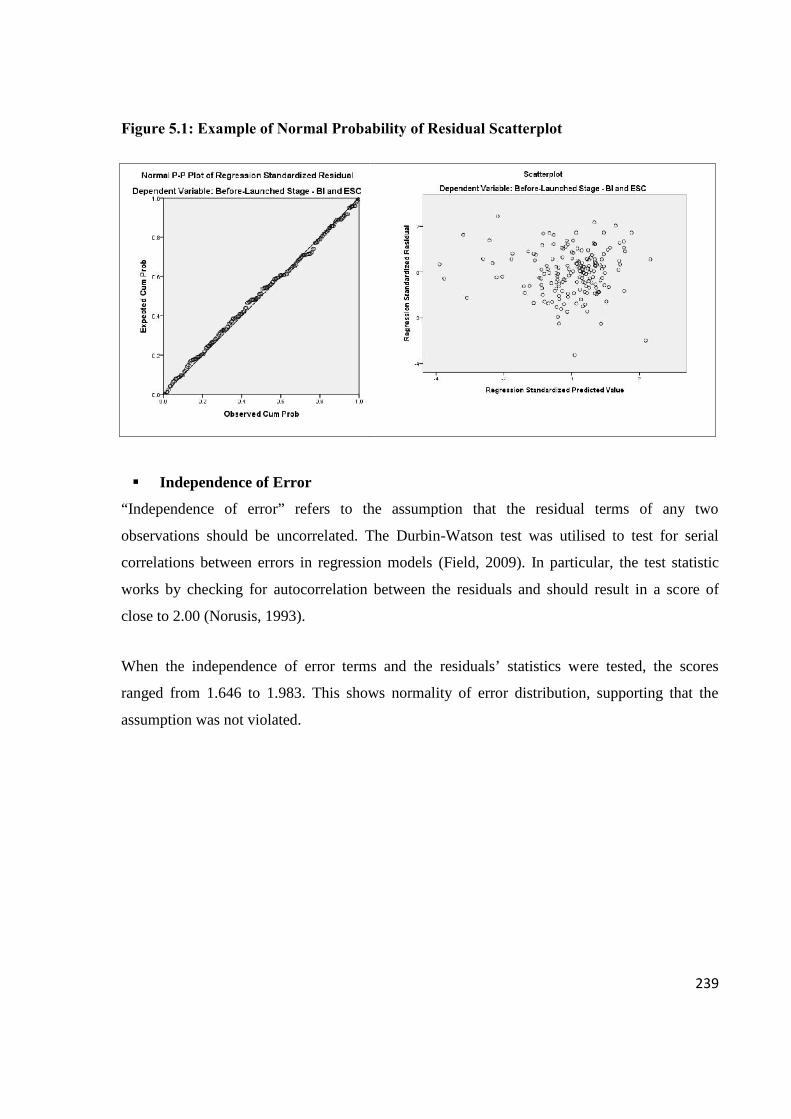
239
Figure 5.1: Example of Normal Probability of Residual Scatterplot
Independence of Error
“Independence of error” refers to the assumption that the residual terms of any two
observations should be uncorrelated. The Durbin-Watson test was utilised to test for serial
correlations between errors in regression models (Field, 2009). In particular, the test statistic
works by checking for autocorrelation between the residuals and should result in a score of
close to 2.00 (Norusis, 1993).
When the independence of error terms and the residuals’ statistics were tested, the scores
ranged from 1.646 to 1.983. This shows normality of error distribution, supporting that the
assumption was not violated.
240
5.2.2 Partial Least Squares Structural Equation Modelling (PLS-SEM)
Structural Equation Modelling (SEM) is important for a thorough examination of the
hypotheses suggested by the conceptual model in this study. The analysis of results is built
upon the use of multiple regression to assess the direct relationships between independent and
dependent variables. It can, however, only be applied to one dependent variable at a time. SEM
examines the interrelationships expressed similarly in a series of multiple regression equations,
and further estimates multiple and interrelated dependence relationships among all of the
variables involved in the model (Hair et al., 2010).
SEM can be referred to as covariance structure analysis, latent variable analysis, or the names
of SEM programs (e.g., Linear Structural Relations [LISREL] or AMOS) (Hair et al., 2010).
There are principally two types of SEM methods: covariance-based techniques (CB-SEM) and
variance-based partial least squares (PLS-SEM). These methods have the same foundation of
SEM. It is the ability to test complete theories and concepts that has made SEM, particularly
CB-SEM, a quasi-standard in marketing research (Hair, Sarstedt, Ringle & Mena, 2012b).
Recently, PLS-SEM has become a commonly used method in various disciplines, including
marketing, and has been applied in several studies published in many leading journals. The
PLS-SEM is also referred to as PLS path modelling in the literature (Hair et al., 2012b; Ringle
et al., 2010). The method has been justified in the Journal of the Academy of Marketing Science
by Hair et al. (2012b), as an increasingly popular alternative to CB-SEM. Hair et al. (2012b)
identified more than 200 studies using PLS-SEM applications published in a 30-year period
from 1981 to 2010 in the 30 top-ranked marketing journals, including Journal of Marketing
Research, Journal of Consumer Research and Journal of Product Innovation Management.
Published studies in the Journal of Product Innovation Management have used PLS-SEM to
look into many issues related to new product development such as new product idea screening
(e.g. Hammedi et al., 2011), success in global new product development (e.g. de Brentani et al.,
2010) and the commercial success of new products (e.g. D'Aveni, Canger & Doyle, 1995).

241
PLS structural equation modelling or variance-based partial least squares (PLS-SEM) originates
from econometrics and chemometrics research (Hair et al., 2010), and was introduced by Wold
(1975). PLS-SEM is a regression-based technique that emerged from path analysis and has
become a prevailing approach to studying casual models involving latent constructs which are
indirectly measured by various indicators (Ringle et al., 2010). In a PLS structural model, the
paths estimated are standardised regression coefficients (beta values). These path coefficients
are estimated based on ordinary least squares (OLS) to reduce the residual variance. The factor
loadings are for the measurement items on the constructs. Further PLS-SEM does not make
“assumptions about the population or scale of measurement” to estimate model parameters
(Fornell & Bookstein, 1982, p.443; Fornell & Larcker, 1981), observation independence or
variables metrics (Barclay, Higgins & Thompson, 1995). Hence, the context of regression, path
analysis and principal component analysis can be applied to interpret and explain findings
(Chin & Newsted, 1999; Ringle et al., 2010).
The rationale for selecting PLS-SEM as the estimation model is that it best suits this study’s
research objective, the type of model and the data characteristics (Fornell & Bookstein, 1982;
Reinartz, Haenlein & Henseler, 2009). There are primarily five reasons for choosing PLS-SEM
over covariance-based methods (CB-SEM) for this study. First, PLS-SEM application (Ringle
et al., 2005) has begun to be recognised by a growing number of researchers for its distinctive
methodological features (Henseler, Ringle & Sinkovics, 2009). According to Albers (2009),
PLS-SEM is also regarded as the method of choice in success factor studies in marketing
research. Thus, it was deemed to be suitable for the context of the analysis of this study as the
main objective is to understand the critical success factors at the front end of the development
process of a market-driving innovation.
Second, the aim of PLS-SEM is to maximise the amount of variance of the dependent variable
explained by the independent variables in the model (Chin & Newsted, 1999). The approach of
the more widely known CB-SEM is differently implemented (Haenlein & Kaplan, 2004), for
instance, in the LISREL software tool that “attempts to minimise the difference between the
sample covariance and those predicted by the theoretical model” (Chin & Newsted, 1999,
242
p.309). In consequence, PLS-SEM seemed more appropriate than CB-SEM for predicting the
hypothesised relationships (Chin, 1998).
Third, PLS-SEM is a prediction-oriented approach, appropriate for particular types of model. In
this study, the type of conceptual model appeared to be a “balanced model”, with
approximately the same number of endogenous latent variables and exogenous latent variables
(Hair et al., 2012bp. 421). This type of model is unlike a focused model where a small number
of endogenous latent variables are explained by many exogenous latent variables in the model
or an unfocused model where the endogenous latent variables are rather higher than the
exogenous latent variables. PLS-SEM’s prediction goal suits a balanced model or a focused
model, while a CB-SEM is likely to be more appropriate for explaining unfocused models (Hair
et al., 2012b). Thus, it was reasonable to apply PLS-SEM to estimate and explain the balanced
model of this study.
Fourth, PLS-SEM supports the use of the final sample size of this study. For any statistical
techniques, the sample size needs to be considered in the context of data characteristics. This is
also the case for PLS-SEM. Compared to traditional CB-SEM techniques, PLS-SEM is viewed
as a technique that works particularly well for testing models with a relatively small sample
size. PLS-SEM is applicable even in the case of a very small sample size, as low as 50 cases
(Chin & Newsted, 1999). CB-SEM, however, generally requires a sample size of more than 200
cases (Boomsma & Hoogland, 2001). As this study introduced a model to examine the
relationships between ACAP, MVC/MV and market-driving innovation performance, and the
sample size is relatively small (n = 179), PLS-SEM therefore appeared to be well-suited. More
importantly, the applicability of PLS-SEM to a small sample size has often been justified as a
reason for selecting this method to estimate a model in marketing research (Hair et al., 2012b).
Fifth, PLS-SEM (SmartPLS by Ringle et al., 2005) has an ability to test interaction effects or
moderating effects. These effects are evoked by variables whose variation influences the
strength or the direction of a relationship between an independent (exogenous) and a dependent
(endogenous) variable (Henseler & Chin, 2010; Henseler & Fassott, 2010). For each of the
moderating effects, the methodology suggested by Chin, Marcolin, and Newsted (2003) was
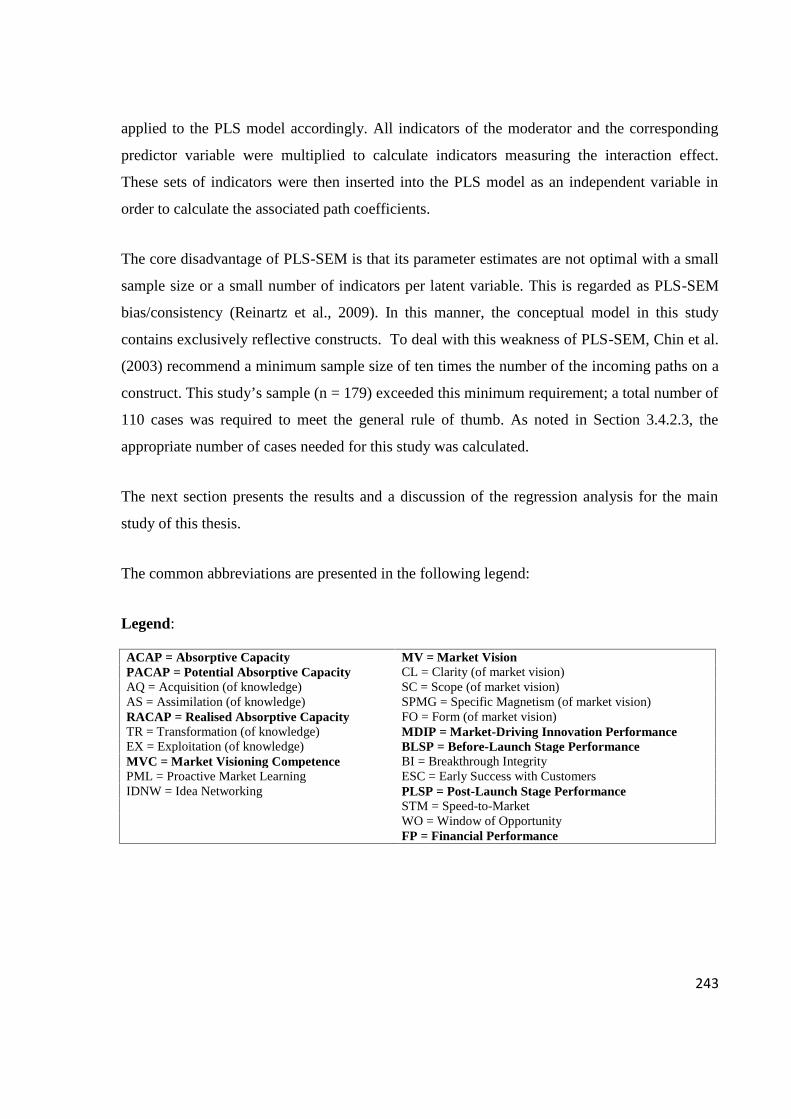
243
applied to the PLS model accordingly. All indicators of the moderator and the corresponding
predictor variable were multiplied to calculate indicators measuring the interaction effect.
These sets of indicators were then inserted into the PLS model as an independent variable in
order to calculate the associated path coefficients.
The core disadvantage of PLS-SEM is that its parameter estimates are not optimal with a small
sample size or a small number of indicators per latent variable. This is regarded as PLS-SEM
bias/consistency (Reinartz et al., 2009). In this manner, the conceptual model in this study
contains exclusively reflective constructs. To deal with this weakness of PLS-SEM, Chin et al.
(2003) recommend a minimum sample size of ten times the number of the incoming paths on a
construct. This study’s sample (n = 179) exceeded this minimum requirement; a total number of
110 cases was required to meet the general rule of thumb. As noted in Section 3.4.2.3, the
appropriate number of cases needed for this study was calculated.
The next section presents the results and a discussion of the regression analysis for the main
study of this thesis.
The common abbreviations are presented in the following legend:
Legend:
ACAP = Absorptive Capacity MV = Market VisionPACAP = Potential Absorptive Capacity CL = Clarity (of market vision)AQ = Acquisition (of knowledge) SC = Scope (of market vision)AS = Assimilation (of knowledge) SPMG = Specific Magnetism (of market vision)RACAP = Realised Absorptive Capacity FO = Form (of market vision)TR = Transformation (of knowledge) MDIP = Market-Driving Innovation PerformanceEX = Exploitation (of knowledge) BLSP = Before-Launch Stage PerformanceMVC = Market Visioning Competence BI = Breakthrough IntegrityPML = Proactive Market Learning ESC = Early Success with CustomersIDNW = Idea Networking PLSP = Post-Launch Stage Performance
STM = Speed-to-MarketWO = Window of OpportunityFP = Financial Performance

244
Main Study
5.3 Absorptive Capacity and Market Visioning Competence
H1a. ACAP has a significant and positive impact on MVC.
H1b. PACAP has a significant and positive impact on MVC.
H1c. RACAP has a significant and positive impact on MVC.
Firms with absorptive capacity have been described as being more proficient at developing new
products, particularly breakthrough innovations (e.g. Newey & Shulman, 2004). Accordingly, it
was hypothesised that firms with ACAP will also exhibit evidence of being proficient in
developing MVC. The perspective is drawn from the literature in the essence that “firms that
are competent with market visioning are good at the exploratory learning process” (Reid & de
Brentani, 2010, p.509). Similarly, ACAP and its PACAP/RACAP subsets are firm-specific
learning capabilities by which firms acquire, assimilate, transform and exploit knowledge to
develop newly created knowledge and competencies (Zahra & George, 2002). The learning
capability reflected in ACAP, likewise appears to act as a key antecedent to MVC. The
relationship between ACAP and MVC is therefore proposed, as discussed in Chapter 2.
Table 4.39 presented the correlations between each of the variables in the conceptual model and
these indicated that a significant relationship exists between the dimensions of ACAP and
MVC, ranging from the results of 0.45 to 0.76 significant at the p=<0.01 level, whilst
confirming that they measure different constructs.
To evaluate the relationship between ACAP and MVC, the aggregate construct of ACAP was
first entered into a simple bivariate regression analysis with the dimensions of MVC, and then
the subsets of ACAP as well as its individual dimensions were subsequently entered into a
multiple regression analysis as a further test of the relationship. Table 5.1 presents the results of
these analyses.

245
Table 5.1: Regression Models: Absorptive Capacity and Market Visioning Competence
Market Visioning Competence Dimensions
Market VisioningCompetence(aggregate)
Proactive MarketLearning (PML)
Idea Networking(IDNW)
Beta t-value Beta t-value Beta t-value
Simple regression model
Absorptive Capacity(aggregate)
0.750*** 15.10 0.607*** 10.17 0.723*** 13.93
R Square 0.563 0.369 0.523
Adjusted R Square 0.561 0.365 0.520
F-ratio 228.043*** 103.438*** 193.968***
Multiple regression model 1
Potential AbsorptiveCapacity (PACAP)
0.338*** 4.89 0.222** 2.65 0.373*** 5.14
Realised AbsorptiveCapacity (RACAP)
0.483*** 6.98 0.442*** 5.29 0.419*** 5.77
R Square 0.578 0.383 0.535
Adjusted R Square 0.573 0.376 0.530
F-ratio 120.515*** 54.662*** 101.205***
+ = p<0.10, ∗ = p<0.05, ∗∗ = p<0.01, ∗∗∗ = p<0.001
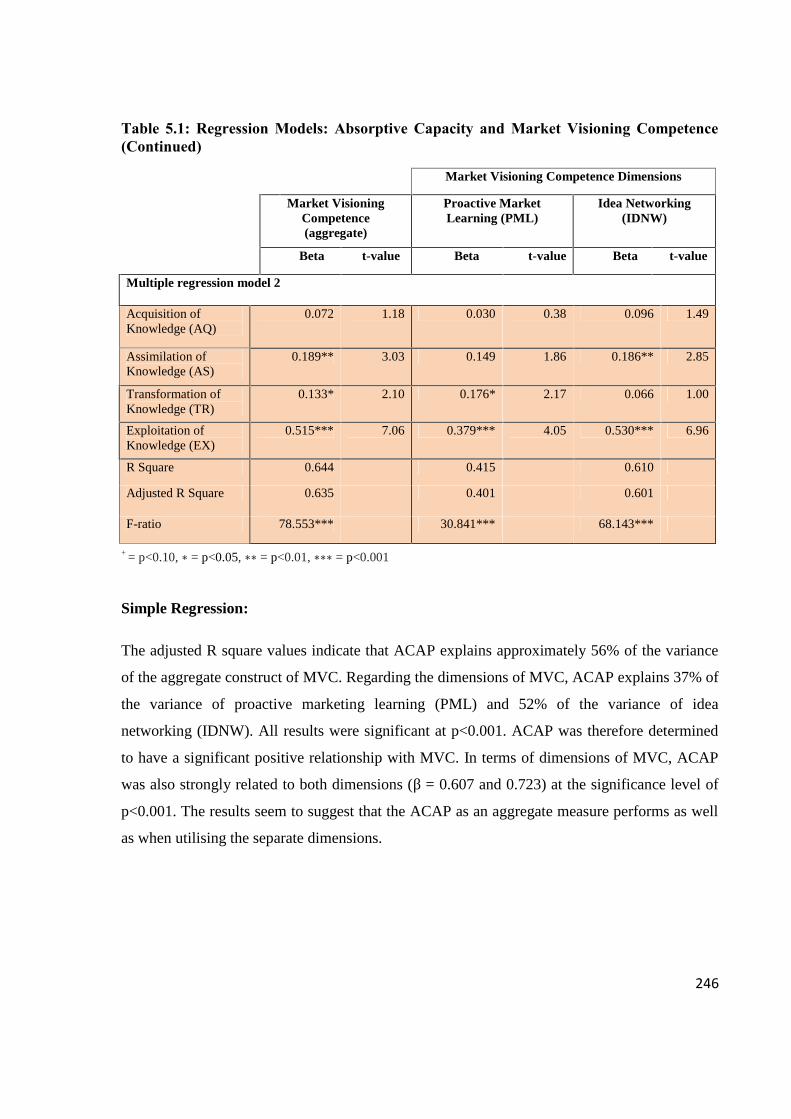
246
Table 5.1: Regression Models: Absorptive Capacity and Market Visioning Competence(Continued)
Market Visioning Competence Dimensions
Market VisioningCompetence(aggregate)
Proactive MarketLearning (PML)
Idea Networking(IDNW)
Beta t-value Beta t-value Beta t-value
Multiple regression model 2
Acquisition ofKnowledge (AQ)
0.072 1.18 0.030 0.38 0.096 1.49
Assimilation ofKnowledge (AS)
0.189** 3.03 0.149 1.86 0.186** 2.85
Transformation ofKnowledge (TR)
0.133* 2.10 0.176* 2.17 0.066 1.00
Exploitation ofKnowledge (EX)
0.515*** 7.06 0.379*** 4.05 0.530*** 6.96
R Square 0.644 0.415 0.610
Adjusted R Square 0.635 0.401 0.601
F-ratio 78.553*** 30.841*** 68.143***
+ = p<0.10, ∗ = p<0.05, ∗∗ = p<0.01, ∗∗∗ = p<0.001
Simple Regression:
The adjusted R square values indicate that ACAP explains approximately 56% of the variance
of the aggregate construct of MVC. Regarding the dimensions of MVC, ACAP explains 37% of
the variance of proactive marketing learning (PML) and 52% of the variance of idea
networking (IDNW). All results were significant at p<0.001. ACAP was therefore determined
to have a significant positive relationship with MVC. In terms of dimensions of MVC, ACAP
was also strongly related to both dimensions (β = 0.607 and 0.723) at the significance level of
p<0.001. The results seem to suggest that the ACAP as an aggregate measure performs as well
as when utilising the separate dimensions.
247
Multiple Regression:
The results of the multiple regression analysis are reported in the multiple regression models 1
and 2 in Table 5.1. In the multiple regression model 1, the results indicate that the subsets of
ACAP explain a significant proportion of the variance in MVC. This is evidenced by the R
square values which show that PACAP and RACAP explain approximately 58% of the
aggregate level of MVC, and explain 38% of the variance of PML and 53% of the variance of
IDNW. In addition, RACAP was found to be the most closely associated with both PML (β =
0.442), and IDNW (β = 0.419). To a lesser extent, PACAP was found to be closely associated
with both PML and IDNW (β = 0.222 and 0.373). Accordingly, all results were significant at
the level of p<0.001.
In the multiple regression model 2, there are four dimensions under ACAP or PACAP and
RACAP in which the R Square values explain approximately 64% of MVC at an aggregate
level, and explain 40% of the variance of PML and 60% of the variance of IDNW. More
specifically, exploitation of knowledge (EX) was found to be the most closely associated with
both PML (β = 0.379), and IDNW (β = 0.530), at the significant level of p<0.001. Assimilation
of knowledge (AS) and transformation of knowledge (TR) play different roles in influencing
two dimensions of MVC. On one hand, AS was found to be closely associated with IDNW (β =
0.186; p<0.01). On the other hand, TR was found to be associated with PML (β = 0.176;
p<0.05). The capability to assimilate, transform and exploit knowledge is central to translating
prior knowledge, and accumulated diverse experiences (what are already known) into frame-
breaking insights or market-driving ideas (Bertels et al., 2011; Cohen & Levinthal, 1990; Da
Silva & Davis, 2011; Sun & Anderson, 2010). These capabilities verify the ability of a firm to
raise creativity as well as to perceive an opportunity (Broring et al., 2006), hence having close
associations with MVC.
The results of the regression analyses provide support for H1a, H1b and H1c that ACAP overall
and its potential and realised subsets of PACAP and RACAP have significant positive impacts
on MVC. These results are in line with the findings in the literature review. The constructs
ACAP and MVC were both drawn from the resource-based view (RBV) and its sub-set of
248
dynamic capabilities literature. ACAP and MVC appeared as the constructs that are likely to
have the greatest impact on early performance (EP) or the front end of the NPD effort (e.g.
Chen et al., 2009; Reid & de Brentani, 2010; Sun & Anderson, 2010; Tsai, 2001; Zahra &
George, 2002).
Cast in RBV, the conceptualisation of ACAP and MVC highlights the importance of the
exploratory learning process that enables knowledge creation and building through information
sharing. At the broader organisational level, ACAP involves a combination of learning
capabilities through a set of organisational routines and process (Zahra & George, 2002). At the
NPD program level, MVC involves the ability of individuals in NPD team to link new ideas or
advanced technologies to future market opportunities (Reid & de Brentani, 2010). The
relationship between these two constructs is important given that both entail a firm’s dynamic
capabilities to build new product exploration capabilities and resources in changing
environmental conditions. The outcomes of the exploratory learning process are firm-specific
competitive advantage and superior performance (Harvey et al., 2010; Kostopoulos et al., 2011;
Reid & de Brentani, 2010).
Exploitation of Knowledge (EX)
Of the four dimensions of ACAP, EX was the most dominant dimension that influences both
the dimensions of market visioning competence (PML: proactive market learning and IDNW:
idea networking). The observed strengths of EX on PML and IDNW were not surprising.
Fundamentally, EX involves a firm’s ability to exploit new knowledge to develop something
new such as a new product (Zahra & George, 2002). This ability is considered critical in
facilitating PML, the discovery of unarticulated customer needs and incorporating solutions
into new products.
In addition, EX involves management support and an emphasis on product prototyping to test a
product concept before starting actual development. The testing of a product concept may
encourage the use of several forecasting and market estimation techniques before making a
final market selection as described in PML. Further, EX involves a firm’s ability to work more
effectively by adopting new technologies and new ideas (Flatten et al., 2011). It is therefore
249
understandable that EX can enhance IDNW by allowing individuals who champion
breakthrough innovations to embrace the new technologies or new ideas and work more
effectively to gain support from others within the firm.
Assimilation and Transformation of Knowledge (AS and TR)
The results also indicate that AS and TR influence different dimensions of MVC. The
association between AS and IDNW is significant and positive, as both dimensions appear to
highlight the importance of a firm’s information sharing and senior management support for
new product developments. AS generally involves cross-departmental communication and
meetings demanded by senior management. The cross-departmental communication pulls
together a network of people from different disciplines and functions. In this respect, the central
focus of AS is effective communication across departments in order to exchange information
quickly on new developments, problems and achievements (Flatten et al., 2011). These abilities
influence IDNW by means of enabling breakthrough product champions to share market-
driving ideas quickly with other people in the firm through established cross-departmental
support and communication. The breakthrough product champions may also be able to obtain
the support of senior management and key decision makers early in the NPD process and
broaden their internal and external networks around the products and technologies. Sun and
Anderson (2010, p. 144) supported this view that “teams consisting of individuals who have
diverse experiences and who have previously worked together are more likely to create radical
innovations”.
In particular, the capability of assimilation is created by “socio-psychological process of
interpretation” (Sun & Anderson, 2010, p.144). The interpretive process can be carried out
through a “dialogue” process among members in the network. The dialogue is important as it
develops values of honesty and trust between members, making it easy to share sensitive
information. “Group members’ cognitive maps are effectively revealed and any radical insights
are given a chance to come to verbal fruition, rather than being dominated by the prevailing
beliefs and assumptions of the organization” (Sun & Anderson, 2010, p.144). Cross-
departmental communication supports the dialogue process, articulating solution-finding. Team
250
members in the network, including the breakthrough product champions (IDNW), can therefore
assimilate novel connections and radical knowledge.
Moreover, the finding of the regression analyses suggests that TR has a significant, positive
impact on proactive market learning (PML). TR involves employees’ ability to successfully
combine their existing knowledge with new knowledge. This ability creates new insights that
influence PML by allowing employees to discover additional needs of customers of which they
are unaware. Further the capability of transformation means that employees are able to absorb
new knowledge and apply it to practical work as well as making it available for other purposes
(Flatten et al., 2011). This absorbed new knowledge can also be used in market forecasting and
estimation, as reflected in PML.
Acquisition of Knowledge (AQ)
While the aggregate relationship between MVC and ACAP indicates a strong association,
which is supported by the two subsets of ACAP and its three dimensions of AS, TR and EX,
acquisition of knowledge appears to have no association with MVC – neither PML nor IDNW.
A possible explanation may be that MVC focuses on discovering unarticulated customer needs
to incorporate into future product-markets. AQ is, however, described as the way in which
management expects employees to acquire externally relevant information from both within
and beyond their existing industry (Flatten et al., 2011). Thus, the value of AQ may be less
apparent when the focus of MVC appeared to lean toward the abilities of the individuals or
NPD team members to transform and exploit knowledge into new products, as opposed to
acquiring new knowledge.
A recent study by Ritala and Hurmelinna-Laukkanen (2013) on potential absorptive capacity
and radical innovation highlighted that acquisition of knowledge for radical innovation may not
be as effective when there is an exchange of similar information and knowledge. As reflected in
AQ, acquisition of knowledge within the industry may lead firms to focus more on the
development of incremental innovations. This is particularly the case when competing firms
decided to collaborate with each other in order to create higher value and a larger market. Only
when sensitive information and knowledge is protected and secure enough for it to be shared
251
can the value-creating effects of potential absorptive capacity materialise in the form of radical
innovations (Ritala & Hurmelinna-Laukkanen, 2013).
Although the external sources of knowledge have been regarded as important to market-driving
innovation (e.g. de Brentani & Reid, 2012; Reid & de Brentani, 2004), firms may find it
difficult to acquire relevant information and knowledge essential for the development of a new
product. The search for new information may also be constrained to what the individuals or
NPD team members defined as relevant to their existing products. Individuals may often
overlook information that could be used for the development of future products, especially for
breakthrough innovations, because they view the information as irrelvant or inconsistent with
the firm’s values (Christensen & Overdorf, 2000).
Another possible reason for not seeking knowledge from external sources may be that breadth
of new knowledge can be sourced and explored internally within the firm through cross-
departmental communication (Sun & Anderson 2010). In this regard, the importance of cross-
departmental communication was described in the capability of assimilation (AS). The
capability is related to exploratory learning and individual’s intuition especially entrepreneurial
intuition. More specifically, it is an individual’s ability to seek unfamiliar situations in order to
access new and diverse experiences through an existing network. This is consistent with the
aspect of networking explained in MVC by means of breadth or size, variety, and centrality
(Reid & de Brentani 2010). The ability to take in new ideas and violate prior beliefs or
assumptions may allow an individual to come up with something beyond incremental
innovation. “The greater the breadth of their prior knowledge, the greater is their ability to
explore new sources of knowledge” (Sun & Anderson, 2010, p.143).

252
5.4 Market Visioning Competence and Market Vision
H2: MVC has a significant and positive impact on MV.
It was noted in the literature review in Chapter 2 that the empirical study of Reid and De
Brentani (2010) indicated the important association between MVC and its resultant MV for a
radically new, high tech products. This study builds on extending the work of Reid and de
Brentani (2010) on MVC/MV by exploring both radical and really new innovations collectively
and across different industry contexts at the NPD program level. “Really new innovations”, in
this study, refer to products that build on an existing or a new/novel “idea” or “technology” to
create new market. By including really new innovations, the exploratory learning process
underlying MVC is extended to include an exploration of ideas that can create shared mental
models of future product-markets or MV. It was therefore hypothesised that firms that are
competent with market visioning or MVC would be able to create MV of radically or really
new products.
Table 4.40 presented the correlations between each of the variables in the conceptual model.
These indicated a significant relationship between the dimensions of MVC and MV ranging
from the results of 0.45 to 0.73 significant at the p=<0.01 level, whilst confirming that they
measure different constructs.
To further evaluate the relationship between MVC and MV, the aggregate construct of MVC
was first entered into a simple bivariate regression analysis with the dimensions of MV, and
then the individual dimensions of MVC were entered into a multiple regression analysis as a
further test of the relationship. Table 5.2 presents the results of these analyses.
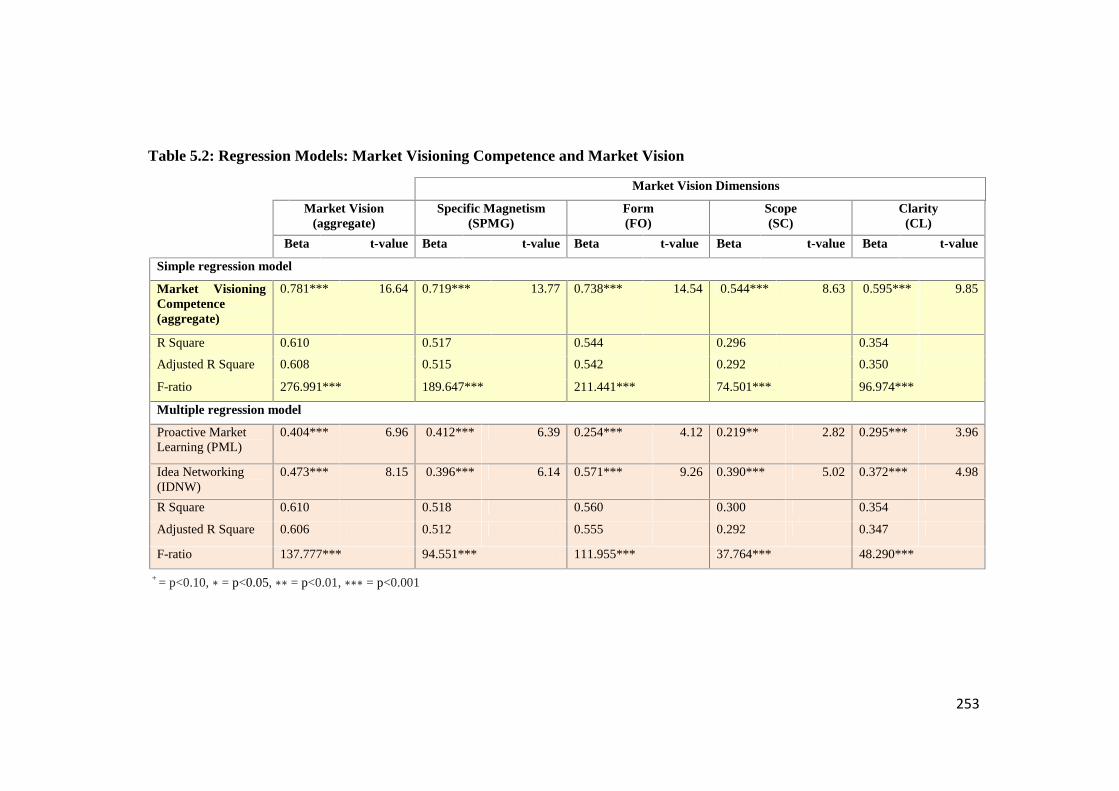
253
Table 5.2: Regression Models: Market Visioning Competence and Market Vision
Market Vision Dimensions
Market Vision(aggregate)
Specific Magnetism(SPMG)
Form(FO)
Scope(SC)
Clarity(CL)
Beta t-value Beta t-value Beta t-value Beta t-value Beta t-value
Simple regression model
Market VisioningCompetence(aggregate)
0.781*** 16.64 0.719*** 13.77 0.738*** 14.54 0.544*** 8.63 0.595*** 9.85
R Square 0.610 0.517 0.544 0.296 0.354
Adjusted R Square 0.608 0.515 0.542 0.292 0.350
F-ratio 276.991*** 189.647*** 211.441*** 74.501*** 96.974***
Multiple regression model
Proactive MarketLearning (PML)
0.404*** 6.96 0.412*** 6.39 0.254*** 4.12 0.219** 2.82 0.295*** 3.96
Idea Networking(IDNW)
0.473*** 8.15 0.396*** 6.14 0.571*** 9.26 0.390*** 5.02 0.372*** 4.98
R Square 0.610 0.518 0.560 0.300 0.354
Adjusted R Square 0.606 0.512 0.555 0.292 0.347
F-ratio 137.777*** 94.551*** 111.955*** 37.764*** 48.290***
+ = p<0.10, ∗ = p<0.05, ∗∗ = p<0.01, ∗∗∗ = p<0.001
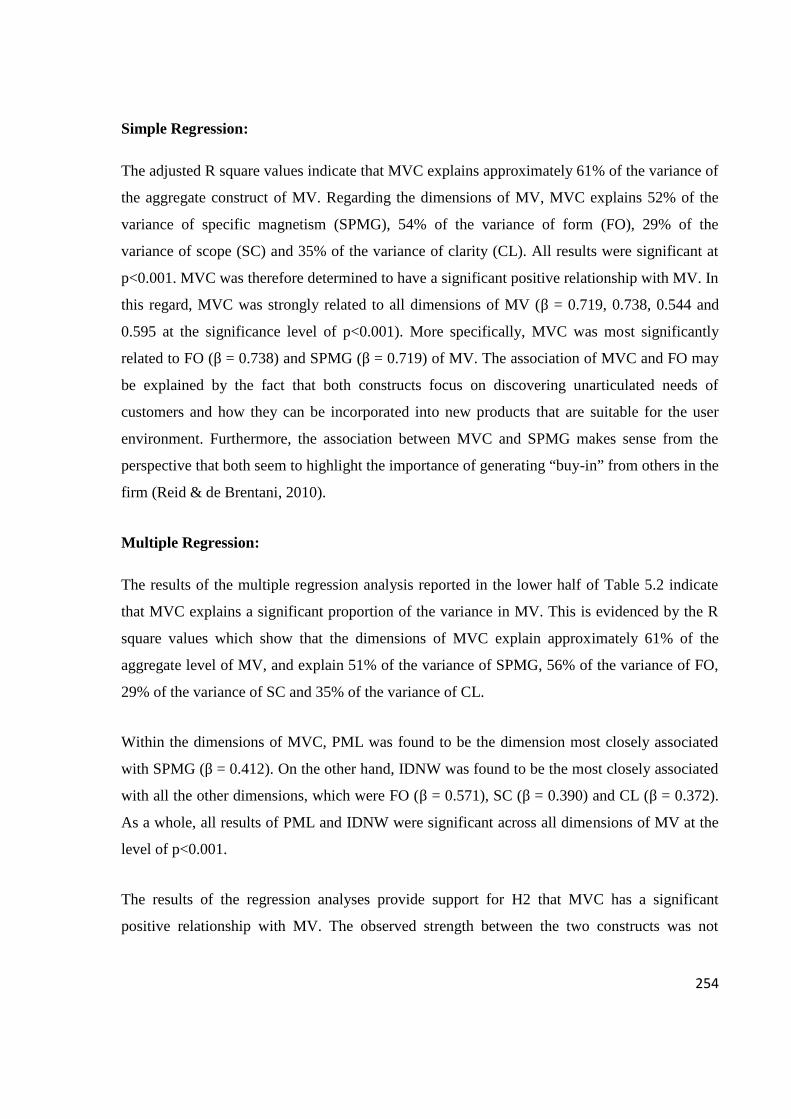
254
Simple Regression:
The adjusted R square values indicate that MVC explains approximately 61% of the variance of
the aggregate construct of MV. Regarding the dimensions of MV, MVC explains 52% of the
variance of specific magnetism (SPMG), 54% of the variance of form (FO), 29% of the
variance of scope (SC) and 35% of the variance of clarity (CL). All results were significant at
p<0.001. MVC was therefore determined to have a significant positive relationship with MV. In
this regard, MVC was strongly related to all dimensions of MV (β = 0.719, 0.738, 0.544 and
0.595 at the significance level of p<0.001). More specifically, MVC was most significantly
related to FO (β = 0.738) and SPMG (β = 0.719) of MV. The association of MVC and FO may
be explained by the fact that both constructs focus on discovering unarticulated needs of
customers and how they can be incorporated into new products that are suitable for the user
environment. Furthermore, the association between MVC and SPMG makes sense from the
perspective that both seem to highlight the importance of generating “buy-in” from others in the
firm (Reid & de Brentani, 2010).
Multiple Regression:
The results of the multiple regression analysis reported in the lower half of Table 5.2 indicate
that MVC explains a significant proportion of the variance in MV. This is evidenced by the R
square values which show that the dimensions of MVC explain approximately 61% of the
aggregate level of MV, and explain 51% of the variance of SPMG, 56% of the variance of FO,
29% of the variance of SC and 35% of the variance of CL.
Within the dimensions of MVC, PML was found to be the dimension most closely associated
with SPMG (β = 0.412). On the other hand, IDNW was found to be the most closely associated
with all the other dimensions, which were FO (β = 0.571), SC (β = 0.390) and CL (β = 0.372).
As a whole, all results of PML and IDNW were significant across all dimensions of MV at the
level of p<0.001.
The results of the regression analyses provide support for H2 that MVC has a significant
positive relationship with MV. The observed strength between the two constructs was not
255
surprising. It is supported by the earlier finding of Reid and de Brentani (2010) and consistent
with the findings in the literature review in Chapter 2 regarding the association of MVC and
MV. MVC was identified as an essential competence in creating an effective mental image, or
MV of a radically new/really new product.
Proactive Market Learning (PML)
PML can be identified as a key element influencing SPMG. Recalling the construct
measurement in Chapter 4, market learning tools (ML) and proactive market orientation (MO)
were the constructs of MVC grouped into PML. In the notion of MO, PML involves an
exploration of customers’ latent needs, solutions to customers’ unarticulated needs or
discovering new needs to be incorporated into new products (Narver et al., 2004). Highly
proactive behaviour is vital in developing breakthrough innovations. This is particularly true
during the idea generation stage of the NPD process. Prior to development, the exploration of
new needs (PML) can help firms to envision for future market opportunities that did not exist
previously in the market (Sandberg, 2007). This helps to simplify the mental model (MV) of the
future product-market for it to highlight the attractiveness of the market opportunity (as
reflected in SPMG).
In the notion of ML, PML also involves combinations of forecasting and market estimation
techniques to vision for the future market (Reid & de Brentani, 2010). Forecasting tools such
backcasting, scenario planning and user analysis through probe-and-learn processes have been
identified as appropriate for breakthrough innovations (Deszca et al., 1999; Lynn et al., 1996).
These tools emphasise exploring customers’ current usage and possible future usage as well as
the level of customer-product interaction (O'Connor, 1998). This exploratory learning process,
as reflected in PML dimension, can therefore create shared mental models of future market
(MV) that enables NPD teams to grasp what is to be developed and for whom.
256
Idea Networking (IDNW)
Another dimension of MVC is IDNW. This dimension is a combination of “idea driving” and
“networking”, as explained in Chapter 4. The notion of idea driving involves the extent to
which champions or idea drivers are able to push market-driving ideas through to the front end
of the NPD process. Idea drivers are willing to make decisive contributions to an innovation as
well as accelerating commitment from senior management and key decision makers to the
proposed idea. This role is critical because a breakthrough innovation requires an organisation
to go through a process of change, to develop new organisational and/or technological
competencies. Moreover, the notion of networking is a fundamental element of MVC, which
entails external webs of relationships. The individuals involved in the external webs are
boundary spanners who perform the tasks of connecting the organisation with the external
environment (Reid & de Brentani, 2004). These networks can draw in a diversity of new
knowledge and product applications beyond those of current customers and markets.
Accordingly, the aspects of IDNW help to explain its close association with FO of MV. FO is
referred to an NPD team’s discussion regarding user interactions with the breakthrough
innovations. Thus, the implication is that IDNW allows the NPD team to ease into the
established networks driven by both the boundary spanners and the idea drivers. NPD team
members can spend time together broadening their thinking and forming the required
discussion. This may lead the NPD team to move quickly to reach a clear consensus of an
image of a future product-market or MV and its target market as well as target customers. This
process also seems to explain the rest of the associations between IDNW and SPMG, SC and
CL.
257
5.5 Performance Consequences of Market Vision
5.5.1 Before-Launch Stage Performance
H3: MV has a significant and positive impact on before-launch stage performance.
In Chapter 2, Literature Review, it was proposed that market vision (MV) has a significant and
positive impact on before-launch stage performance (BLSP). The elements of BLSP are part of
the measures of market-driving innovation performance (MDIP), which include breakthrough
integrity (BI) and early success with customers (ESC). When organisational members have a
market vision, this can influence the development of radically new or really new products and
the likelihood of achieving BI and ESC with the ability to maintain product innovativeness and
satisfy early customers with products that have maintained their radicalness or innovative
integrity (O'Connor et al., 2008; Reid & de Brentani, 2010).
To evaluate the relationship between MV and BLSP, the aggregate construct of MV was first
entered into a simple bivariate regression analysis with the dimensions of BLSP, and then the
individual dimensions of MV were entered into a multiple regression as a further test of the
relationship. Table 5.3 presents the results of these analyses.
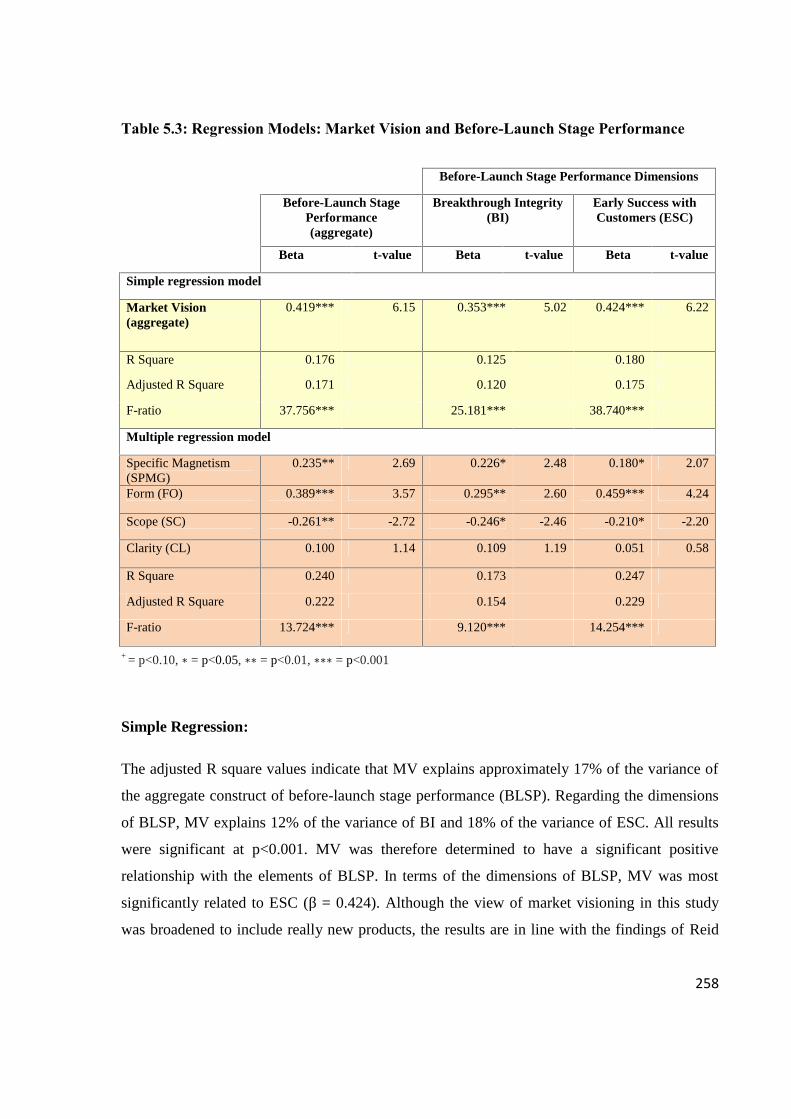
258
Table 5.3: Regression Models: Market Vision and Before-Launch Stage Performance
Before-Launch Stage Performance Dimensions
Before-Launch StagePerformance(aggregate)
Breakthrough Integrity(BI)
Early Success withCustomers (ESC)
Beta t-value Beta t-value Beta t-value
Simple regression model
Market Vision(aggregate)
0.419*** 6.15 0.353*** 5.02 0.424*** 6.22
R Square 0.176 0.125 0.180
Adjusted R Square 0.171 0.120 0.175
F-ratio 37.756*** 25.181*** 38.740***
Multiple regression model
Specific Magnetism(SPMG)
0.235** 2.69 0.226* 2.48 0.180* 2.07
Form (FO) 0.389*** 3.57 0.295** 2.60 0.459*** 4.24
Scope (SC) -0.261** -2.72 -0.246* -2.46 -0.210* -2.20
Clarity (CL) 0.100 1.14 0.109 1.19 0.051 0.58
R Square 0.240 0.173 0.247
Adjusted R Square 0.222 0.154 0.229
F-ratio 13.724*** 9.120*** 14.254***
+ = p<0.10, ∗ = p<0.05, ∗∗ = p<0.01, ∗∗∗ = p<0.001
Simple Regression:
The adjusted R square values indicate that MV explains approximately 17% of the variance of
the aggregate construct of before-launch stage performance (BLSP). Regarding the dimensions
of BLSP, MV explains 12% of the variance of BI and 18% of the variance of ESC. All results
were significant at p<0.001. MV was therefore determined to have a significant positive
relationship with the elements of BLSP. In terms of the dimensions of BLSP, MV was most
significantly related to ESC (β = 0.424). Although the view of market visioning in this study
was broadened to include really new products, the results are in line with the findings of Reid
259
and de Brentani (2010). An effective MV allows an NPD team to focus on delivering unique
benefits and value to customers, thereby significantly and positively impacting on ESC (Reid &
de Brentani, 2010).
Multiple Regression:
The results of the multiple regression analysis reported in the second half of Table 5.3 show
that the constituents of MV explain approximately 22% of the variance of BLSP at an aggregate
level, and explain 15% of the variance of BI and 23% of the variance of ESC.
The results of the regression analyses provide support for H3 that MV has a significant positive
impact on BLSP. Within the dimensions of MV, FO was found to be most significantly related
to both BI (β = 0.295) and ESC (β = 0.459) at the significance level of p<0.001. To a lesser
extent, SPMG was found to be closely associated with both BI (β = 0.226) and ESC (β = 0.180)
at the significance level of p<0.05. Interestingly, SC was found to have a significant negative
relationship with both BI (β = -0.246) and ESC (β = -0.210) at the significance level of p<0.05.
However, CL has no explanatory power to either BI (β = 0.109) or ESC (β = 0.051)
performance.
Form (FO)
In the dimensions of MV, it was not surprising to find FO to be the most significantly related to
BI and ESC performance. FO involves an NPD team’s appropriate time spent on discussing
end-user interactions with the breakthrough innovations. It also refers to the question of how
the breakthrough innovations would fit into an overall system of use for potential customers
(Reid & de Brentani, 2010). The aspects of “how” and end-user interaction in FO, are deemed
appropriate to the development of breakthrough innovations. Simply asking customers what
they want is likely to result in “me-too” products. To explore customers’ usage of a new
product or “product outcome” is important for turning customer input into breakthrough
innovation (Ulwick, 2002).
260
More specifically, understanding the end-user interaction with a breakthrough innovation in FO
can reveal the real meaning of the product, thereby impacting on BI performance. This rationale
is supported by the studies on design-driven innovation by Verganti (2009) and vision in
product design (ViP) by Hekkert and van Dijk (2011), which found that a unique “product
meaning” can be revealed through a lens of user interaction with a product. If the real meaning
of the product is recognised and valued by the NPD teams, it is likely that its integrity will be
maintained for the development of new products. By identifying a clear and specific product
meaning early in the NPD process, the high level of innovativeness and originality of a new
product can be justified in order to resist the pressure from the management to modify the idea
and reduce the breakthrough integrity. This is likely to allow the breakthrough ideas to emerge
into the development stage and to commercialisation. As such, FO has a critical role to play in
terms of achieving BI performance. The study of Lynn et al. (1999b, p.450) referred to visions
as goals and supported the association of FO and BI (in reverse) in that “if a goal is unclear or
not supported by top management or team leaders, then the goal would probably be unstable
and experience changes as the project progressed”.
In a similar vein, FO is also significant in terms of achieving ESC. Since a breakthrough
innovation is developed with consideration of how it fits into an overall system of use for
potential customers, as reflected in FO, it is likely that early customers will readily accept such
innovations. Reid and de Brentani (2010, p. 509) supported this notion: “Having a vision of the
point of interaction between potential customer and potential product – that is, the MV FORM
– enables the firm to develop new products that are likely to meet customer needs and wants”.
When a product’s real meaning is explored and developed into new products, this can bring
about new meanings or value to the customers. The needs of customers can be better met
through the new products and hence result in superior customer satisfaction. Singh and Tromp
(2011, p.3) stated that “radical innovations don’t provide people with an improved
interpretation of what they already know but it purposes a different and unexpected meaning,
which is unsolicited and is what people were actually waiting for”.
261
Specific Magnetism (SPMG)
The results also explain a significant level of strength observed between SPMG and BLSP
dimensions. Chapter 4 described why the original dimensions of MV, specificity and
magnetism, were merged into a new factor called “specific magnetism” (SPMG) to create
discriminant validity. SPMG involves a specific, tangible market vision statement that enables
an NPD team to create “buy-in” from others in the firm. Support from other people and groups
in the firm can lead to gain management support, likewise, helps to maintain BI performance.
In addition, SPMG has a significant positive impact on ESC performance. SPMG indicates that
MV clearly highlights an attractive market opportunity during the early stages of the
development. Further, it provides a clear direction for others in the firm regarding what is being
developed and for whom. This dimension of MV helps to ensure that the NPD team and others
in the firm are committed to a vision that has a high likelihood of impacting on a particular
market and being taken up by particular types of potential users. Hence, the NPD team can
maintain their focus on developing new products that would provide new benefits for target
users. By focusing on delivering the MV, the firm can therefore achieve early customer
satisfaction and acceptance.
Scope (SC)
The result indicates a significant negative impact of SC on both dimensions of BLSP. SC
relates to how an NPD team spending an appropriate amount of time thinking about and
discussing the target market for the breakthrough innovations. The central discussions, reflected
in SC, relate to the target market for the breakthrough innovation, i.e., what would be the most
profitable, the most important and/or the largest target market (Reid & de Brentani, 2010).
In fact, the negative finding of SC suggests that it has an adverse influence on the likelihood of
achieving BI and ESC performance. This finding somewhat contradicts past scholarship which
stated that SC is a significant element of MV and positively contributes to the ESC of radically
new, high-tech products (Reid & de Brentani, 2010). The SC result in this study is, nonetheless,
in line with the findings of other researchers who also considered that the assessments of
262
market size and market potential are less important in the early phases of developing
breakthrough innovations (e.g. Christensen, 1997; O'Connor, 1998). To spend too much time
thinking about what would be the most important or the largest target market for a breakthrough
innovation may not be valuable because those markets may not have emerged. Further, the
negative influence of SC suggests that the more time an NPD team spends on thinking about
and discussing the target market, the more they are at risk of losing the originally desired highly
innovative concept or BI. This might cause the NPD team to lose their focus on delivering the
unique benefits to potential customers (Christensen & Overdorf, 2000).
Clarity (CL)
The CL dimension of MV does not have any significant direct relationship with either BI or
ESC performance. In this study, CL reflects a clear market vision that is derived from the result
of the NPD team’s discussion on the specific markets for breakthrough innovations (as reflected
in FO and SC). The MV itself only facilitates what would be the image of a product-market in
regard to who the target customers would be and what their needs would be for the
breakthrough innovations, as well as how the breakthrough innovations would be used by those
target customers. One plausible explanation for this observation is that CL or market vision
clarity may often appear to be unclear, especially in the early stage or before-launch stage of
developing breakthrough innovations. In the highly uncertain environments of breakthrough
innovations, it may be difficult for everyone in the team to clearly articulate who the specific
target market would be in reality. The specific target market for the breakthrough innovations
may be a subjective matter (Lynn & Akgün, 2001; Rice et al., 1998). The clarity of MV,
likewise, may not always be warranted, particularly to account for a unique variance in either
BI or ESC in the early stage or before-launch stage performance of breakthrough innovations.
In fact, CL was described as an extrinsic dimension of MV because the vision is likely to
become clearer and strengthen over time when a breakthrough innovation evolves over the
stages of the NPD process (Reid & de Brentani, 2010).
263
5.5.2 Post-Launch Stage Performance
H4: MV has a significant and positive impact on post-launch stage performance.
In addition to its role in impacting on the elements of before-launch stage performance, MV
was proposed to influence elements of post-launch stage performance (PLSP). As stated
previously, PLSP is part of the measures of market-driving innovation performance, which
include speed-to-market (STM) and windows of opportunity (WO). Cast in RBV, MV is a
result of resource-based dynamic capabilities built upon various exploratory learning processes,
as reflected in MVC. Thus, the resultant market vision is an effective mental image of a feasible
and potentially prosperous future product-market option (Reid & de Brentani, 2010). It would
be a reasonable expectation that MV stemming from dynamic capability (MVC) would
typically enable firms to deliver breakthrough innovations to future markets in a timely manner
(Chen, Damanpour & Reilly, 2010; Goktan & Miles, 2011). Having a more clearly defined MV
is likely to reduce reworking and avoid changes in direction for an NPD team, thereby speeding
up the product development cycle (Kim & Wilemon, 2002a; Lynn & Akgün, 2001). Moreover,
the mental image of a future market (MV) should encourage firms to take advantage of
pioneering opportunities (Kleinschmidt et al., 2007). It was therefore proposed that if
organisational members have a market vision, this would influence the development of radical
or really new innovations and the likelihood of achieving speed-to-market and opening up
windows of opportunity for the firm.
To evaluate the relationship between MV and PLSP, the aggregate construct of MV was first
entered into a simple bivariate regression analysis with the dimensions of PLSP, and then the
individual dimensions of MV were entered into a multiple regression to further test the
relationship. Table 5.4 presents the results of these analyses.
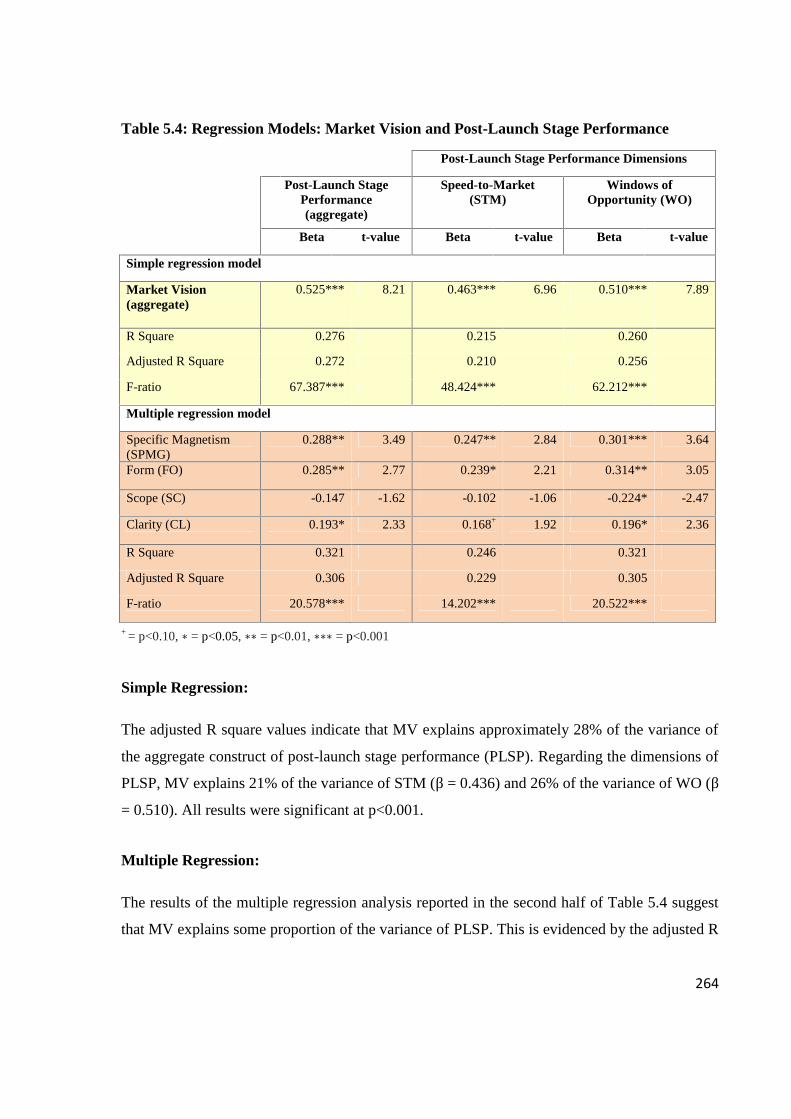
264
Table 5.4: Regression Models: Market Vision and Post-Launch Stage Performance
Post-Launch Stage Performance Dimensions
Post-Launch StagePerformance(aggregate)
Speed-to-Market(STM)
Windows ofOpportunity (WO)
Beta t-value Beta t-value Beta t-value
Simple regression model
Market Vision(aggregate)
0.525*** 8.21 0.463*** 6.96 0.510*** 7.89
R Square 0.276 0.215 0.260
Adjusted R Square 0.272 0.210 0.256
F-ratio 67.387*** 48.424*** 62.212***
Multiple regression model
Specific Magnetism(SPMG)
0.288** 3.49 0.247** 2.84 0.301*** 3.64
Form (FO) 0.285** 2.77 0.239* 2.21 0.314** 3.05
Scope (SC) -0.147 -1.62 -0.102 -1.06 -0.224* -2.47
Clarity (CL) 0.193* 2.33 0.168+ 1.92 0.196* 2.36
R Square 0.321 0.246 0.321
Adjusted R Square 0.306 0.229 0.305
F-ratio 20.578*** 14.202*** 20.522***
+ = p<0.10, ∗ = p<0.05, ∗∗ = p<0.01, ∗∗∗ = p<0.001
Simple Regression:
The adjusted R square values indicate that MV explains approximately 28% of the variance of
the aggregate construct of post-launch stage performance (PLSP). Regarding the dimensions of
PLSP, MV explains 21% of the variance of STM (β = 0.436) and 26% of the variance of WO (β
= 0.510). All results were significant at p<0.001.
Multiple Regression:
The results of the multiple regression analysis reported in the second half of Table 5.4 suggest
that MV explains some proportion of the variance of PLSP. This is evidenced by the adjusted R
265
square values which show that the dimensions of MV explain approximately 31% of the
variance of PLSP at an aggregate level, and explain 23% of the variance of speed-to-market
(STM) and 31% of the variance of windows of opportunity (WO).
The results of the regression analyses support H4 that MV has a significant positive relationship
with PLSP. In the dimensions of MV, specific magnetism (SPMG) was found to have the
strongest positive relationship with STM (β = 0.247; p<0.01). On the other hand, form (FO)
was found to be most significantly related to WO (β = 0.314; p<0.001). Similarly to the finding
for H3, scope (SC) was found to have a negative relationship to speed-to-market; the
relationship was however nonsignificant (β = -0.102). In addition, the results indicate a
significant negative relationship between SC and WO (β= -0.224; p=<0.05). Clarity (CL) has
some explanatory power to WO (β = 0.196; p=<0.05), and to a lesser extent influences STM (β
= 0.168; p=<0.10).
Specific Magnetism (SPMG)
In the dimensions of MV, SPMG was found to be the most significant dimension related to
STM. SPMG was described as a clear and specific market statement that helps make tangible
what is to be developed and for whom (Reid & de Brentani, 2010; Tessarolo, 2007). STM, in
this study, captures the degree to which a breakthrough innovation is completed on or ahead of
the original schedule for moving from initial conception to its full commercialisation, and
thereby pleasing top management (Chen, Reilly & Lynn, 2005; Kessler & Chakrabarti, 1999;
McNally et al., 2011).
The close association between SPMG and STM performance seems reasonable. A clear and
specific market vision (as reflected in SPMG) can reinforce the NPD team and other
organisational members to move as one to attract future market opportunity. This is likely to
speed up the entire product development process (STM). Previous research supports this
finding that a clear product concept or product vision is significantly linked to NPD speed or
time performance (e.g. Chen et al., 2010; Lynn, Reilly & Akgün, 2000; Lynn et al., 1999b;
Swink, 2003). An ambiguous or too broad vision or poorly framed goals may lead to more
uncertainty and disagreements in the NPD team. As a result, the team members may end up
266
working towards different goals and directions. It is therefore vital to keep the vision focused so
as not to delay the project’s original schedule and completion time (Chen et al., 2010).
Form (FO)
It is understandable to find that, of all the elements, FO is the most closely associated with WO
performance. As previously stated, the underlying explanation of FO highlights the importance
of understanding user interaction with a product that uncovers the product’s true meaning. This
true meaning results in a more clearly defined new product that brings a different and
unexpected value to customers (Hekkert & van Dijk, 2011). Accordingly, the new product is
likely to fulfil the customers’ latent or unarticulated needs, which they may be unable to
explicate before the product becomes available in the market. These needs only come to
consciousness when the firm launches the new product (Slater & Narver, 2000). The new
product directs customer’s preferences and behaviour in new directions, and is often perceived
to be better than what had previously been available. FO, likewise, has a significant influence
on the likelihood of achieving WO performance, through opening up new markets or new
technologies or leading the firm into new product arenas (Hills & Sarin, 2003; Kleinschmidt et
al., 2007).
Scope (SC)
The SC dimension of MV was found to have negative relationships with STM and WO
performance. This negative impact of SC on STM and WO performance is in line with H3. In
regard to speed-to-market, the result was negative but not statistically significant. In regard to
windows of opportunity, the result was significant but negative. As previously described, SC
refers to the amount of time spent discussing what might be the most profitable, largest or most
important target markets for a breakthrough innovation (Reid & de Brentani, 2010). The result
suggests that spending too much time focusing on target markets would not lead the firm to
achieve WO or to open a new market or new technologies or product arena.
Developing breakthrough innovations may not result in high profits but may be strategically
important. Yet despite the fact that highly innovative products might attract those customers at
267
the high end of the market, there is an additional overhead cost associated with their special
features and functions. Eventually, this could turn the target market that once promised a high
gross profit into an unattractive one (Christensen & Overdorf, 2000). Focusing too much on the
value of the target market might force managers to go for incremental innovations with lower
cost and risk and likely more immediate profitability. Thus, the firm is likely to lose the focus
on developing breakthrough innovations, thereby missing opportunities to seize control of the
future market (Hamel & Prahalad, 1994a).
The finding of SC is well entrenched in many studies that have referred to breakthrough
innovation as “disruptive” changes to both a firm’s core competencies and the customers in the
mainstream market (e.g. Christensen, 1997; Hamel & Prahalad, 1994a; Utterback, 1994). This
type of product requires new organisational capabilities to cope with the changes and drive the
market rather than being driven by the market. The traditional questions to assess the target
market, as reflected in SC, therefore appear to be inappropriate to the early phases of the NPD
process (O'Connor, 1998).
Clarity (CL)
Although CL does not have any impact on before-launch stage performance, CL was found to
have some explanation of WO and also tentatively of STM performance. These findings are not
surprising since the vision is likely to become clearer after tangible product prototyping or the
probe-and-learn process, or at the post-launch stage performance (Lynn et al., 1996). At the
post-launch stage, it is possible for the NPD team to identify and acknowledge who the real
buyers are. CL, therefore, appears to be relevant to post-launch stage performance.
In particular, CL is most strongly associated with WO. The study of Kleinschmidt et al. (2007)
on “up-front homework activities” and their impact on WO supports the importance of this
association. The activities reflected in homework activities help to understand specific types of
customers and typically result in more clearly defined new products that are responsive to
markets (Kleinschmidt et al., 2007). In this regard, firms are more likely to “pioneer” the
opportunity by means of “being the first to introduce a new product to market” (Hills & Sarin,
2003, p.14). Hence, CL seems to influence the development of radically or really new products
268
and the likelihood of opening up windows of opportunity for the firm. Kleinschmidt et al.
(2007, p.426) stated “the right type and level of homework should result in reduced rework,
should speed up the NPD cycle, and should make the process more efficient”. This may also
help to explain a tentatively significant result observed between CL and speed-to-market
(STM).
While CL of MV was not significant to STM at 95% level of confidence interval (z-value =
1.96), it was significant at 90% level of confidence interval (z-value = 1.645). Although this is a
tentative result, the finding is consistent with the past scholarship of Lynn and Akgün (2001) in
that vision clarity is positively related to new product success, that is, the degree to which “the
product met or exceeded overall senior management’s expectation” (Lynn & Akgün, 2001,
p.385). One of the items measuring STM involves the degree to which “top management was
pleased with the time it took for breakthrough innovations to get to full commercialisation”
(Dayan & Elbanna, 2011, p. 174). In this respect, the measures of both STM and new product
success are seen to involve the aspect of satisfying senior management. This suggests that CL
may have a role in terms of achieving senior management’s satisfaction. As CL was found to
have significant positive relationship with new product success, it also has some explanation of
STM.
In a similar vein, CL has been found to be a significant determinant of speed-to-market in many
studies (e.g. Chen et al., 2010; Swink, 2003; Wheelwright & Clark, 1992). CL, as one
dimension of an effective market vision, is particularly important for breakthrough innovations
given that the NPD team and others in the firm have to confront an unfamiliar environment.
There will be a high level of anxiety if team members do not have clear vision of what needed
to be accomplished. Breakthrough innovation requires an organisational change in terms of new
organisational and/or technological competency for the development of a new line of product
that explores new idea or technologies. Schein (1993) stated that a psychologically safe
environment must be created for a change to happen, that is, team members have to see a
direction and a manageable path forward. A clearly identified product definition and target
market can direct the focus of team members to the objectives of the project. A well-articulated
and acknowledged vision across the team and departments avoids ambiguity and changes in

269
directions while the new product is developed (Harter, Krishnan & Slaughter, 2000; Lynn et al.,
2000; Swink, 2003; Wheelwright & Clark, 1992). Chen et al. (2010, p.28) supported the impact
of CL on STM: “For fast development of a new product (whether simple, complex, radical or
incremental), NPD teams need to have clear product visions and support from top managers
throughout the process”.
5.6 Market-Driving Innovation Performance
5.6.1 Before-Launch Stage and Post-Launch Stage Performance
H5: Before-launch stage performance has a significant and positive impact on post-launch
stage performance.
There is an implied relationship between before-launch stage performance (BLSP) and post-
launch stage performance (PLSP). The before-launch stage performance, as discussed in
Chapter 2, is the extent to which a clear and highly innovative concept of a potential new
product is maintained after it enters the development and commercialisation phases of being
satisfied and accepted by early customers (Brown & Eisenhardt, 1995; Clark & Fujimoto, 1991;
Reid & de Brentani, 2010; Seidel, 2007). As such, BLSP is likely to influence PLSP or the
extent to which market-driving innovations opened a window of opportunity on a new category
of products or on a new market for the firm (Chen et al., 2005; de Brentani et al., 2010; Kessler
& Chakrabarti, 1999; McNally et al., 2011).
To further evaluate this relationship, the aggregate construct of BLSP was first entered into a
simple bivariate regression analysis with the dimensions of PLSP, and then the individual
dimensions of BLSP were entered into a multiple regression analysis as a further test of the
relationship. Table 5.5 presents the results of these analyses.
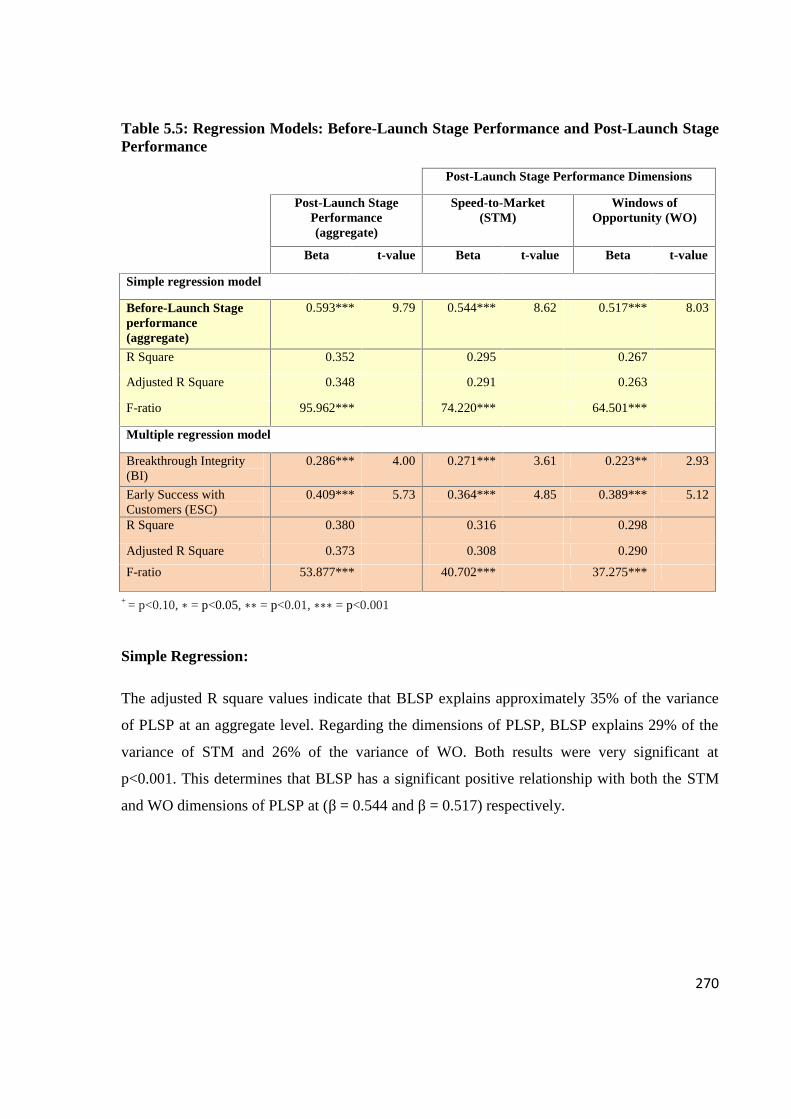
270
Table 5.5: Regression Models: Before-Launch Stage Performance and Post-Launch StagePerformance
Post-Launch Stage Performance Dimensions
Post-Launch StagePerformance(aggregate)
Speed-to-Market(STM)
Windows ofOpportunity (WO)
Beta t-value Beta t-value Beta t-value
Simple regression model
Before-Launch Stageperformance(aggregate)
0.593*** 9.79 0.544*** 8.62 0.517*** 8.03
R Square 0.352 0.295 0.267
Adjusted R Square 0.348 0.291 0.263
F-ratio 95.962*** 74.220*** 64.501***
Multiple regression model
Breakthrough Integrity(BI)
0.286*** 4.00 0.271*** 3.61 0.223** 2.93
Early Success withCustomers (ESC)
0.409*** 5.73 0.364*** 4.85 0.389*** 5.12
R Square 0.380 0.316 0.298
Adjusted R Square 0.373 0.308 0.290
F-ratio 53.877*** 40.702*** 37.275***
+ = p<0.10, ∗ = p<0.05, ∗∗ = p<0.01, ∗∗∗ = p<0.001
Simple Regression:
The adjusted R square values indicate that BLSP explains approximately 35% of the variance
of PLSP at an aggregate level. Regarding the dimensions of PLSP, BLSP explains 29% of the
variance of STM and 26% of the variance of WO. Both results were very significant at
p<0.001. This determines that BLSP has a significant positive relationship with both the STM
and WO dimensions of PLSP at (β = 0.544 and β = 0.517) respectively.
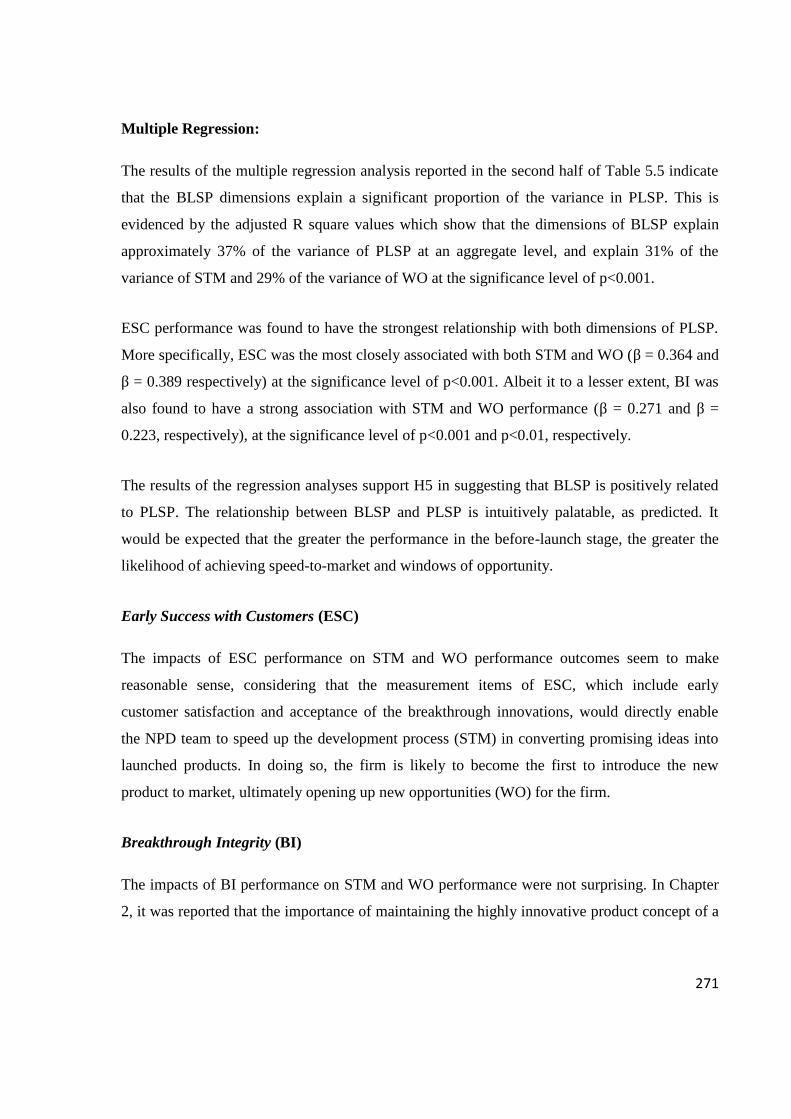
271
Multiple Regression:
The results of the multiple regression analysis reported in the second half of Table 5.5 indicate
that the BLSP dimensions explain a significant proportion of the variance in PLSP. This is
evidenced by the adjusted R square values which show that the dimensions of BLSP explain
approximately 37% of the variance of PLSP at an aggregate level, and explain 31% of the
variance of STM and 29% of the variance of WO at the significance level of p<0.001.
ESC performance was found to have the strongest relationship with both dimensions of PLSP.
More specifically, ESC was the most closely associated with both STM and WO (β = 0.364 and
β = 0.389 respectively) at the significance level of p<0.001. Albeit it to a lesser extent, BI was
also found to have a strong association with STM and WO performance (β = 0.271 and β =
0.223, respectively), at the significance level of p<0.001 and p<0.01, respectively.
The results of the regression analyses support H5 in suggesting that BLSP is positively related
to PLSP. The relationship between BLSP and PLSP is intuitively palatable, as predicted. It
would be expected that the greater the performance in the before-launch stage, the greater the
likelihood of achieving speed-to-market and windows of opportunity.
Early Success with Customers (ESC)
The impacts of ESC performance on STM and WO performance outcomes seem to make
reasonable sense, considering that the measurement items of ESC, which include early
customer satisfaction and acceptance of the breakthrough innovations, would directly enable
the NPD team to speed up the development process (STM) in converting promising ideas into
launched products. In doing so, the firm is likely to become the first to introduce the new
product to market, ultimately opening up new opportunities (WO) for the firm.
Breakthrough Integrity (BI)
The impacts of BI performance on STM and WO performance were not surprising. In Chapter
2, it was reported that the importance of maintaining the highly innovative product concept of a
272
potential new product from the front end and through to the final launch has been highlighted in
previous studies (e.g. Brown & Eisenhardt, 1995; Clark & Fujimoto, 1990, 1991; Lynn &
Akgün, 2001; Seidel, 2007). For breakthrough innovations, inherent ambiguity may cause a
shift in the product concept during the development process and create confusion among NPD
team members. This may cause delays in decisions that require team coordination and may
contribute to lower-than-expected market results (Seidel, 2007). The ability to maintain BI
helps to maintain the momentum of the NPD team members and their commitment to the
desired objectives. The NPD team can share clear objectives and directions with others both
inside and outside the firm (team members and customers). This may speed up the development
of a breakthrough innovation, making it possible to launch the new product on time or even
ahead of the original schedule, as reflected in STM, thereby satisfying top management. The
close association between BI and STM is also in line with the study by Tessarolo (2007), which
found that a clear product vision – clear objectives and a well-recognised strategy for the
development process – is positively related to speed-to-market.
BI has a direct positive impact on a firm in opening up new market opportunities (WO). The
maintenance of BI ensures the creation of superior products for the marketplace. This can be
referred to as “product advantage”, by having “superiority and/or differentiation over
competitive offerings” (Henard & Szymanski, 2001, p. 364). Breakthrough innovation, as a
highly innovative product, captures these aspects of product advantage. This allows the firm to
enter into a new market or new technological domain and consequently results in long-term
product advantage (Cooper, 1996; Henard & Szymanski, 2001).
Overall, the before-launch stage performance (BLSP) appears to be consistent with the outcome
of the “fuzzy front end”, “up-front homework”, and “homework or front end activities” of
developing a product innovation (e.g. Cooper, 1996; McNally et al., 2011). The front end
activities involve a preliminary assessment of the market and technology which results in new
products that are clearly defined (Kleinschmidt et al., 2007; McNally et al., 2011). The outcome
of the front end activities is similar to BLSP – that is, the results of having an early and clear
definition provided by effective market vision. The resulting homework activities have shown
to significantly impact on the NPD process, primarily through faster speed-to-market and

273
higher product quality (McNally et al., 2011). BLSP simplifies the NPD process as well as
identifying windows of opportunity (Kleinschmidt et al., 2007). This highlights the influence of
BLSP on both dimensions of PLSP. BLSP can impact both the focus and efficiency of the
entire NPD process, particularly the actual product development from the beginning. The
outcome of this before-launch stage of the development therefore determines the product’s
likelihood of success in the market (Song & Parry, 1997b).
5.6.2 Before-Launch Stage Performance and Financial Performance
H6: Before-launch stage performance has a significant and positive impact on financial
performance.
Before-launch stage performance (BLSP) and its dimensions can be key determinants for firms
developing market-driving innovations to ultimately achieve financial performance (FP).
Breakthrough integrity (BI) and early success with customers (ESC) dimensions of BLSP,
resulting from MV, capture the front end outcome in ensuring that a clear and highly innovative
concept of a potential new product is maintained after it enters the development and
commercialisation phases of being satisfied and accepted by early customers. The expectation
is that the higher the level of before-launch stage performance (BLSP), the higher the level of
overall financial performance (FP) in terms of sales and profitability i.e. meeting profit or sales
volume objectives (units sold) or being profitable relative to the resources invested in such
product. A direct positive relationship was therefore hypothesised to exist between BLSP and
FP in the conceptual model as proposed in Chapter 2.
To further evaluate the relationship between BLSP and FP, the aggregate construct of BLSP
was first entered into a simple bivariate regression analysis with FP. Then the individual
dimensions of BLSP were entered into a multiple regression analysis as a further test of the
relationship. Table 5.6 presents the results of these analyses.
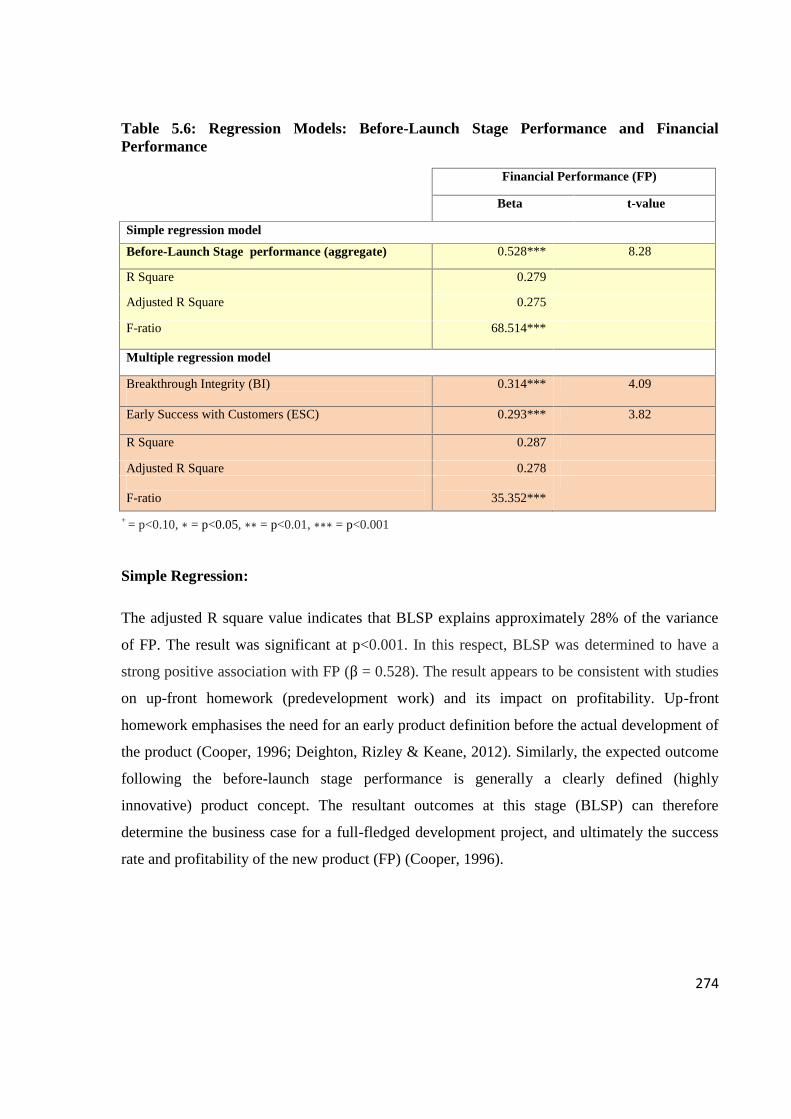
274
Table 5.6: Regression Models: Before-Launch Stage Performance and FinancialPerformance
Financial Performance (FP)
Beta t-value
Simple regression model
Before-Launch Stage performance (aggregate) 0.528*** 8.28
R Square 0.279
Adjusted R Square 0.275
F-ratio 68.514***
Multiple regression model
Breakthrough Integrity (BI) 0.314*** 4.09
Early Success with Customers (ESC) 0.293*** 3.82
R Square 0.287
Adjusted R Square 0.278
F-ratio 35.352***
+ = p<0.10, ∗ = p<0.05, ∗∗ = p<0.01, ∗∗∗ = p<0.001
Simple Regression:
The adjusted R square value indicates that BLSP explains approximately 28% of the variance
of FP. The result was significant at p<0.001. In this respect, BLSP was determined to have a
strong positive association with FP (β = 0.528). The result appears to be consistent with studies
on up-front homework (predevelopment work) and its impact on profitability. Up-front
homework emphasises the need for an early product definition before the actual development of
the product (Cooper, 1996; Deighton, Rizley & Keane, 2012). Similarly, the expected outcome
following the before-launch stage performance is generally a clearly defined (highly
innovative) product concept. The resultant outcomes at this stage (BLSP) can therefore
determine the business case for a full-fledged development project, and ultimately the success
rate and profitability of the new product (FP) (Cooper, 1996).
275
Multiple Regression:
The results of the multiple regression analysis reported in the second half of Table 5.6 show
that BLSP explains approximately 28% of the variance for FP. The results of the regression
analyses provide support for H6, suggesting that BLSP is positively related to FP.
Breakthrough Integrity (BI)
In the dimensions of BLSP, BI was found to have the strongest association with FP (β = 0.314;
p<0.001). The association of BI and FP appears to be consistent with the findings of Cooper
(1996). The measurement items of BI, as previously described, were related to the maintenance
of an originally desired, highly innovative product concept of a potential new product from the
initial idea through to the final product launched. This results from having a clear and specific
early-stage mental model of a product-market as reflected in MV. According to Cooper (1996),
it was found that such sharp and stable, early product definition has a very strong impact on
both the financial performance and the firm’s total new product efforts. It can improve the
project success rate by 59.2%, and has a higher project success rate and market share of 3.7 and
1.6 times, respectively, than projects lacking product-definition.
Early Success with Customers (ESC)
To a lesser degree than BI, ESC was found to be significantly associated with FP (β = 0.293;
p<0.001). The items used to measure ESC in this study were developed based on the lead user
concept proposed by von Hippel (1978) and (Griffin & Page, 1996). Lead user analysis
involves identifying and leveraging primarily innovative customers or users whose needs are
ahead of the market trend (Cooper & Edgett, 2008). The users are integral part of the
development process in defining and testing solutions for the next new product, that is, a
“probing and learning” process Lynn et al. (1996). Customers are bound to verify the
performance of an early version of the product in their use environment. This may result in
redesigning the product, to ensure that early customers’ needs would be better met, hence
providing early customer satisfaction and acceptance (Deighton et al., 2012).
276
In view of that, the outcome measurement of ESC primarily relies on confirmation (success)
with early customers in ensuring that customers’ needs are better met through breakthrough
innovations than those existing ones, and in addition, customers are satisfied and readily
accepted breakthrough innovations even prior to formally launching them. The importance of
this front end outcome (ESC) to financial performance makes reasonable sense. Studies have
found that a new product that highlights the concerns of the customers or users is strongly
associated with the profitability of the business unit’s total new product efforts (Cooper, 1996;
Cooper & Edgett, 2008). In particular, if the customers accept a product from the early stages of
the NPD process, there is likely to be good sales results (Reid & de Brentani, 2010). Thus, early
customer satisfaction and acceptance (ESC) was determined to have a strong relationship with
financial performance.
5.6.3 Post-Launch Stage Performance and Financial Performance
H7: Post-launch stage performance has a significant and positive impact on financial
performance.
Similar to before-launch stage performance (BLSP), post-launch stage performance (PLSP) is
considered to be linked to the level of overall financial performance (FP). The dimensions of
PLSP, which are speed-to-market (STM) and windows of opportunity (WO), are anticipated to
have a downstream positive effect on FP, providing that breakthrough innovations were
developed and launched quickly, thus opening up new opportunities for the firm. A direct
positive relationship was therefore hypothesised between PLSP and FP in the conceptual
model.
To further evaluate the relationship between PLSP and FP, the aggregate construct of PLSP was
firstly entered into a simple bivariate regression analysis with FP, and the individual
dimensions of PLSP were then subsequently entered into a multiple regression analysis as a
further test of the relationship. Table 5.7 presents the results of these analyses.

277
Table 5.7: Regression Models: Post-Launch Stage Performance and FinancialPerformance
Financial Performance (FP)
Beta t-value
Simple regression model
Post-Launch Stage Performance (aggregate) 0.575*** 9.34
R Square 0.330
Adjusted R Square 0.327
F-ratio 87.306***
Multiple regression model
Speed-to-Market (STM) 0.276*** 3.98
Windows of Opportunity (WO) 0.429*** 6.19
R Square 0.385
Adjusted R Square 0.378
F-ratio 55.169***
+ = p<0.10, ∗ = p<0.05, ∗∗ = p<0.01, ∗∗∗ = p<0.001
Simple Regression:
The adjusted R square value indicates that PLSP explains approximately 33% of the variance of
FP. The result was significant at p<0.001. PLSP was therefore determined to have a strong
positive relationship with FP (β = 0.575). In addition, PLSP explains slightly more variance of
FP than BLSP does (33% versus 28%). A plausible explanation may be that at the before-
launch stage, how the product will perform in the market is still uncertain. FP may become
more apparent at PLSP when the breakthrough innovations have been launched, ultimately
opening a new market or product/technological arena.
Multiple Regression:
The results of the multiple regression analysis reported in the second half of Table 5.7 show
that disaggregated PLSP explains 38% of the variance of FP. In the dimensions of PLSP, WO
278
was found to have the strongest association with FP (β = 0.429; p<0.001). Albeit it to a lesser
extent, STM was found to be significantly associated with FP (β = 0.276; p<0.001).
The results of the regression analyses provide support for H7, suggesting that the PLSP and its
dimensions STM and WO are positively related to FP. This finding is consistent with earlier
studies where highly significant (p<.001), positive effects of STM and WO have been found on
FP (de Brentani et al., 2010; Kleinschmidt et al., 2007). Based in RBV and new product
development (NPD) literature, achieving competitive advantage is the ultimate key to a firm’s
superior financial performance and long-term success (Griffin & Page, 1996; Smith et al.,
1996). The short-term performance is nonetheless assessed in terms of a firm’s ability to
increase efficiency (speed-to-market) and market share or to open a new category of products
or a new market.
Speed-to-Market and Windows of Opportunity (STM and WO)
STM and WO are seen as antecedents to FP in that the elements create opportunities to generate
returns from NPD. The NPD team that can move breakthrough innovations quickly onto launch
(STM) is likely to lead their firm to achieve first-mover advantage and ultimately yield
financial returns. This is also often a result of an effective time-to-market plan, which allows
the NPD team to minimise cost overruns caused by errors or delays. The result of STM is in
line with an empirical study by de Brentani et al. (2010) that time-to-market (denoted the same
concept as speed-to-market) has a significant and positive impact on financial performance.
Further, de Brentani et al. (2010) also highlighted the significant impact of WO by stating that
“even more important for ensuring superior financial outcome is the identification and
exploitation of windows of opportunity” (p.154). This may help to explain the stronger
association between WO and FP than between STM and FP. Kleinschmidt et al. (2007)
supported the significant impact of WO on financial outcomes in the context of global NPD
program by indicating that “the higher the performance in opening windows of opportunity, the
higher the financial performance” (p.427). The findings in this study are consistent with the
RBV and empirical results in NPD research. It supports the premise that the ability to obtain
279
market or technology leadership through STM and WO has a significant influence on a firm’s
competitive advantage and ultimately superior financial performance.
5.7 Proposed Moderation Effects
A moderator analysis in the form of a SPSS macro (MODPROBE) was used to probe the
hypothesised interactions (Hayes & Matthes, 2009). Several moderators were involved to test
the interactions that may exist between the relationships of MV and before-launch stage
performance (BLSP) and post-launch stage performance (PLSP). These were:
1) External Environment (EE): competitive intensity (CI), technological turbulence (TT)
and market turbulence (MT);
2) NPD process rigidity (NPDR);
3) Firm size or number of employees (NOE).
The output of the MODPROBE macro is a regression that estimates the effect of the focal
predictor (F) at specified values of a moderator variable (M). The interaction between F and M
represents a single degree-of-freedom (df), showing a single regression coefficient. The output
also provides conditional effects (low, medium, high) of M as well as estimates the effect of F
at those values (Hayes & Matthes, 2009).
It must be noted that the option of Mean Center F and M was selected prior to the estimation of
the model in this study. The purpose of the option is to standardise and interpret the values of F
and M (Hayes & Matthes, 2009). The option of Mean Center is commonly used by empirical
marketing researchers (e.g. Echambadi & Hess, 2007; Kromrey & Foster-Johnson, 1998). This
option has often been selected as it is understood to reduce nonessential multicollinearity. Mean
Center and non-centered appear to yield identical hypothesis tests on the interaction terms
(Echambadi & Hess, 2007; Kromrey & Foster-Johnson, 1998). In other words, the coefficients,
the beta and the t-statistic of the interaction terms are functionally identical regardless of

280
whether the option Mean Center is checked. Nonetheless, the linear effects between the mean-
centered data and the uncentered data would reveal a different result.
The coefficients of mean-centered data represent main effects of the variables, as opposed to
simple effects. The main effects indicate the effects of each variable when the other variables
are at their mean values. The simple effects are those data without mean-center. They represent
the effects of each variable when the other variables are at zero value. The zero value may
provide a concrete understanding of the patterns. The mean values, however, better describe the
overall relationships. This study mean-centered the predictors for more meaningful and
interpretive purposes (Hayes, 2005; Hayes & Matthes, 2009).
5.7.1 External Environment (EE)
From the literature review in Chapter 2, the impact of the External Environment (EE) as a
moderator of the relationship between MV and BLSP was proposed. That relationship can be
affected by the factors of EE, which are: competitive intensity (CI), technological turbulence
(TT) and market turbulence (MT). Thus, the following hypothesis examines whether the factors
of EE have any negative moderating impact on the link between MV and BLSP.
H8a: The relationship between MV and before-launch stage performance is negatively
moderated by CI, TT and MT.
To evaluate whether CI, TT and MT moderate the relationship between MV and BLSP, a
moderator analysis in the form of an SPSS macro, MODPROBE, was used to probe the
interactions in the SPSS program (Hayes & Matthes, 2009). The CI, TT and MT were
respectively entered into the SPSS MODPROBE script dialog box as a moderator variable (M),
where MV is the focal predictor (F) and BLSP is the dependent variable (Y). Table 5.8 presents
the results of these analyses.
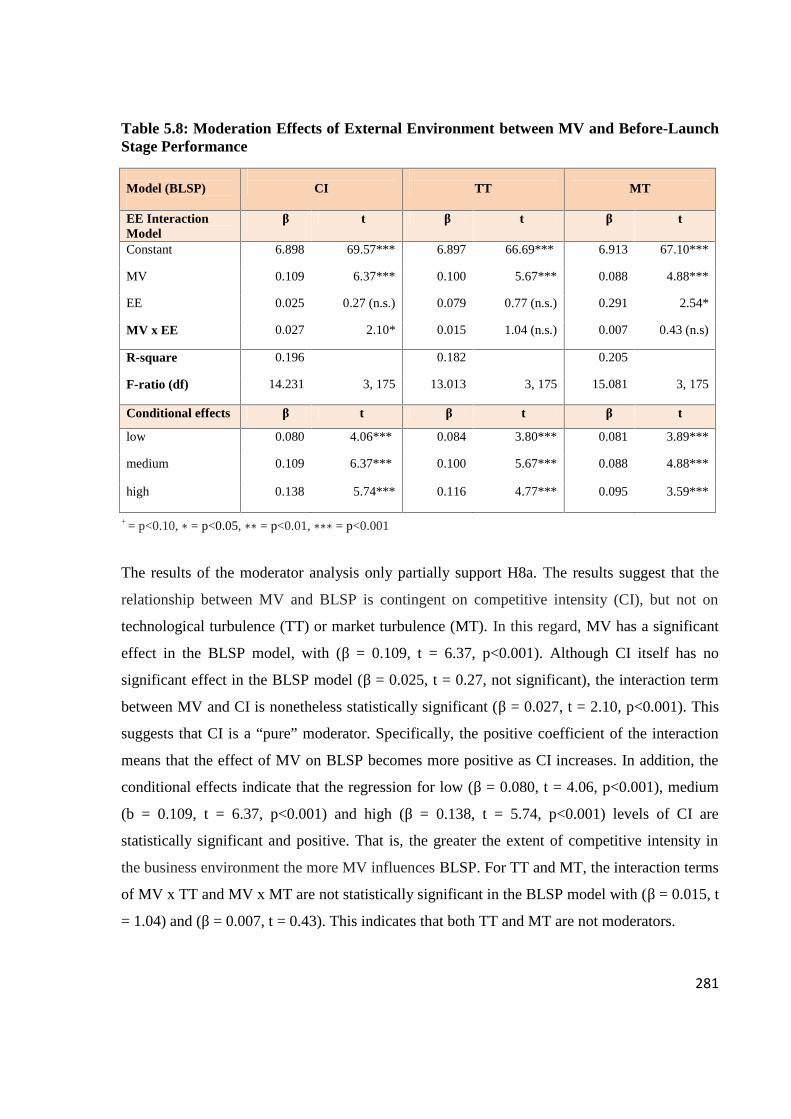
281
Table 5.8: Moderation Effects of External Environment between MV and Before-LaunchStage Performance
Model (BLSP) CI TT MT
EE InteractionModel
β t β t β t
Constant 6.898 69.57*** 6.897 66.69*** 6.913 67.10***
MV 0.109 6.37*** 0.100 5.67*** 0.088 4.88***
EE 0.025 0.27 (n.s.) 0.079 0.77 (n.s.) 0.291 2.54*
MV x EE 0.027 2.10* 0.015 1.04 (n.s.) 0.007 0.43 (n.s)
R-square 0.196 0.182 0.205
F-ratio (df) 14.231 3, 175 13.013 3, 175 15.081 3, 175
Conditional effects β t β t β t
low 0.080 4.06*** 0.084 3.80*** 0.081 3.89***
medium 0.109 6.37*** 0.100 5.67*** 0.088 4.88***
high 0.138 5.74*** 0.116 4.77*** 0.095 3.59***
+ = p<0.10, ∗ = p<0.05, ∗∗ = p<0.01, ∗∗∗ = p<0.001
The results of the moderator analysis only partially support H8a. The results suggest that the
relationship between MV and BLSP is contingent on competitive intensity (CI), but not on
technological turbulence (TT) or market turbulence (MT). In this regard, MV has a significant
effect in the BLSP model, with (β = 0.109, t = 6.37, p<0.001). Although CI itself has no
significant effect in the BLSP model (β = 0.025, t = 0.27, not significant), the interaction term
between MV and CI is nonetheless statistically significant (β = 0.027, t = 2.10, p<0.001). This
suggests that CI is a “pure” moderator. Specifically, the positive coefficient of the interaction
means that the effect of MV on BLSP becomes more positive as CI increases. In addition, the
conditional effects indicate that the regression for low (β = 0.080, t = 4.06, p<0.001), medium
(b = 0.109, t = 6.37, p<0.001) and high (β = 0.138, t = 5.74, p<0.001) levels of CI are
statistically significant and positive. That is, the greater the extent of competitive intensity in
the business environment the more MV influences BLSP. For TT and MT, the interaction terms
of MV x TT and MV x MT are not statistically significant in the BLSP model with (β = 0.015, t
= 1.04) and (β = 0.007, t = 0.43). This indicates that both TT and MT are not moderators.
282
The result regarding competitive intensity was somewhat surprising. The hypothesis was stated
in the opposite direction – that CI negatively impacts on the relationship between MV and
BLSP. The positive influence of CI, however, appears to make reasonable sense when seen in
the context of other research and the study focus on radical innovation. As stated in Chapter 2,
CI refers to high levels of competitive activity in an industry. This is suggestive of low industry
concentration, by means of having a large number of competitive players in the industry
(Robinson, 1988). A low industry concentration often applies to a young industry where the
market is still emerging and fallout has yet to occur (Levitt, 1965). This is particularly the case
in the early stages of radical innovation, taking the examples of the computer industry and
nanotechnology in their early days (Reid & de Brentani, 2012). In this regard, having more
industry players often creates market uncertainties and a tendency for firms to lose their
competitive positions (Zhang & Duan, 2010). There are likely to be many alternative new
products in the market, which allow customers to easily switch from one product to another
(Jaworski & Kohli, 1993; Kohli & Jaworski, 1990; Slater & Narver, 1994).
Increased competitive intensity may put environmental pressure on firms to opt for a proactive
behaviour to try to deliver superior customer value. This involves the development of more
radically new or really new products in order to steer demand and serve customers better than
the competitive alternatives (Santos-Vijande & Álvarez-González, 2007). In this context, firms
need to be more focused and proficient in discovering customers’ needs, specifically latent
exigencies (Li, Lin & Chu, 2008). This may result in dominant product designs or new ideas for
future product-market (MV) emerging more quickly to be translated into the breakthrough
integrity (BI dimension of BLSP). In contrast, firms would often lack enthusiasm in the absence
of competitive intensity for undertaking or emphasising breakthrough innovations. Garcia et al.
(2003, p.326) said that “in environments with little competitive pressure, a need to continually
introduce new innovative products into the marketplace is not a major necessity for maintaining
market share”. Further, strong competition may also increase customers’ awareness and
acceptance of a breakthrough innovation, leading to early success with customers (ESC
dimension of BLSP) because of the innovation being endorsed by several players in the
industry. This finding appears to be consistent with the finding by Reid and de Brentani (2012)

283
that a low level of industry concentration (nanotechnology sector) has a positive moderating
effect on the relationship between MV and early success with customers.
Contrary to expectations, the linkage between MV and BLSP seems to be robust in contexts
categorised by changing levels of technological turbulence (TT) and market turbulence (MT).
TT refers to an external environment of a firm where technology is changing rapidly (Jaworski
& Kohli, 1993), and thus analysising new technology opportunities and maintaining their
applications for new products can be difficult. With MT, it was expected that the ability to
translate MV into BLSP would be hindered by the high degree of uncertainty in the market, and
hence it would be difficult to predict future market preferences. As MV appears to be an
important determinant of BLSP, it may possibly be that the underlying image of MV refers to a
future product-market that is able to drive the market or industry rather than being driven by
them. Thus, a firm’s innovative efforts particularly on breakthrough innovations should not be
disrupted by rapid changes in technology opportunities (TT) or the varying needs of the
customers and market demand (MT).
H8b: The relationship between MV and post-launch stage performance is negatively moderated
by CI, TT and MT.
In addition to the role of the external environment (EE) in impacting on the relationship
between MV and before-launch stage performance, this thesis has also proposed that the
external environment (EE) influences the relationship between MV and post-launch stage
performance (PLSP). The relationship may be affected by one or more of the factors of EE,
namely, competitive intensity (CI), technological turbulence (TT) and market turbulence (MT).
Therefore, H8b examines whether CI, TT and MT have any negative moderating influence on
the relationship between MV and PLSP.

284
To evaluate the moderating effects of the external environment factors, CI, TT and MT were
respectively entered into the SPSS MODPROBE (Hayes & Matthes, 2009) script dialog box as
a moderator variable (M), where MV is the focal predictor (F) and PLSP is the dependent
variable (Y). Table 5.9 presents the results of these analyses.
Table 5.9: Moderation Effects of External Environment between MV and Post-LaunchStage Performance
Model (PLSP) CI TT MT
EE InteractionModel
β t β t β t
Constant 7.033 67.00*** 7.058 64.83*** 7.067 64.47***
MV 0.152 8.44*** 0.133 7.13*** 0.129 6.72***
EE 0.015 0.15 (n.s.) 0.214 2.00* 0.280 2.30*
MV x EE 0.030 2.24* 0.004 0.26 (n.s.) -0.001 -0.04 (n.s.)
R-square 0.296 0.292 0.297
F-ratio (df) 24.526 3, 175 24.052 3, 175 24.646 3, 175
Conditional effects β t β t β t
low 0.120 5.75*** 0.128 5.49*** 0.129 5.83***
medium 0.152 8.44*** 0.133 7.13*** 0.129 6.72***
high 0.185 7.29*** 0.137 5.34*** 0.128 4.56***
+ = p<0.10, ∗ = p<0.05, ∗∗ = p<0.01, ∗∗∗ = p<0.001
Similar to the previous findings on BLSP, the moderating impact of CI, TT and MT on the
relationship between MV and PLSP only partially supported H8b. The results suggest that the
relationship between MV and PLSP is contingent on CI, but not on TT or MT. In this regard,
MV has a significant effect in the PLSP model (β = 0.152, t = 8.44; p<0.001). Despite the fact
that CI itself has no significant effect in the PLSP model (β = 0.015, t = 0.15, not significant),
the interaction term between MV x CI indicates a statistically significant result (β = 0.030, t =
2.24; p<0.05). This suggests again that CI is a “pure” moderator. More specifically, the positive
coefficient of the interaction means that the effect of MV on PLSP becomes more positive as CI
increases. Additionally, the conditional effects show that the regression for low (β = 0.120, t =
285
5.75; p<0.001), medium (β = 0.152, t = 8.44; p<0.001) and high (β = 0.185, t = 7.29; p<0.001)
levels of CI are very highly significant and positive. Indeed, the greater the extent of
competitive intensity in the business environment the more MV influences post-launch stage
performance. For TT and MT, the significant effects were found at p<0.05 in the PLSP model
(β = 0.214, t = 2.00, and β = 0.280, t = 2.30) but the interaction terms of MV x TT and MV x
MT are not statistically significant, with (β = 0.004, t = 0.26 not significant) and (β = -0.001, t =
-0.04, not significant). This shows that TT and MT are not “pure” moderators.
It is interesting that competitive intensity was found to positively moderate the relationship,
instead of having a negative impact as proposed. One rationale for this finding is that such
intensified competition (CI) is likely to move innovations (MV) through the firm and to market
more speedily to compete in the market (D'Aveni, 1994). This is often due to the fact that if
there is a new market opportunity appealing to two firms at the same time, the one that can
react faster to the opportunity is likely to win (D'Aveni et al., 1995). A firm’s ability to translate
MV into a radically new or really new product more rapidly than their competitors in the race to
take advantage of a future market opportunity is therefore critical (Calantone et al., 2003). In
particular, such a new product can create market and/or industry disruption and erode the
competitive advantage of other firms (D'Aveni, 1994; D'Aveni et al., 1995). Thus, it is
understandable that competitive intensity has a positive impact on the ability to translate MV
into post-launch stage performance in terms of increased speed-to-market (STM) (i.e. being the
first mover), and opening up a new market or a new technology or product arena (WO) for the
firm.
The nonsignificant impacts of technological turbulence and market turbulence on the MV/PLSP
relationship suggest that MV is an important determinant of post-launch stage performance.
Firms must therefore strive to create and sustain MV in their efforts to attain higher
performance at post-launch stage regardless of the environment in which they operate.
286
5.7.2 NPD Process Rigidity (NPDR)
H9a: The degree of NPD process rigidity negatively influences the relationship between MV
and before-launch stage performance.
H9b: The degree of NPD process rigidity negatively moderates the relationship between MV
and post-launch stage performance.
Drawing from the literature review presented in Chapter 2, it was proposed that the degree of
NPD process rigidity (NPDR) negatively influences the impact of MV on before-launch stage
performance (BLSP) and post-launch stage performance (PLSP). NPDR, a stage-gate-like NPD
process, appears to be generally linear and primarily focuses on solving customers’ existing
problems (market-driven). Previous studies have suggested that a predetermined market-driven
routine and process can result in a negative performance effect on market-driving innovation
(Bonner et al., 2002; de Brentani, 2001; Garcia et al., 2003). H9a and H9b were therefore
proposed to examine the possible negative influence of NPDR on the relationship between MV
and BLSP/PLSP.
To evaluate whether NPDR influences MV in translating into BLSP and PLSP, the aggregate
construct of NPD process rigidity was entered into the SPSS MODPROBE (Hayes & Matthes,
2009) script dialog box as a moderator variable (M), where MV is the focal predictor (F), and
BLSP and PLSP are the dependent variables (Y). Table 5.10 presents the results of these
analyses.

287
Table 5.10: Moderation Effects of NPD Process Rigidity
Model H9a (BLSP) H9b (PLSP)
Interaction Model β t β t
Constant 6.854 65.36*** 7.025 65.17***
MV 0.098 5.03*** 0.111 5.51***
NPD Process Rigidity (NPDR) 0.146 1.28 (n.s.) 0.464 3.95***
MV x NDPR 0.025 1.99* 0.014 1.06 (n.s.)
R-square 0.202 0.341
F-ratio (df) 14.797 (3, 175) 30.211 3, 175
Conditional effects β t β t
low 0.074 3.60*** 0.097 4.62***
medium 0.098 5.03*** 0.111 5.51***
high 0.123 4.74*** 0.125 4.66***+ = p<0.10, ∗ = p<0.05, ∗∗ = p<0.01, ∗∗∗ = p<0.001
The results suggest that NPDR is a moderator which impacts on the relationship between MV
and BLSP. In this regard, MV has a significant effect in the BLSP model (β = 0.098, t = 5.03;
p<0.001). Although NPDR itself has no significant effect in the BLSP model (β = 0.146, t =
1.28, not significant), the interaction term between MV x NPDR indicates a statistically
significant result (β = 0.025, t = 1.99; p<0.05). This suggests that NPDR is a “pure” moderator.
Specifically, the positive coefficient of the interaction means that the effect of MV on BLSP
becomes more positive as NPDR increases. Further, the conditional effects show that the
regression for low (β = 0.074, t = 3.60; p<0.001), medium (β = 0.098, t = 5.03; p<0.001) and
high (β = 0.123, t = 4.74; p<0.001) degrees of NPDR are very highly significant and positive.
That is, the greater the degree of NPDR the greater the increase in before-launch stage
performance. This counters to what was expected in H9a.
The results suggest that NPDR does not have any moderating influence on the relationship
between MV and PLSP. Despite the fact that both MV and NPDR have significant effects at
p<0.001 in the PLSP model (β = 0.111, t = 5.51, and β = 0.464, t = 3.95), the interaction terms
of MV x NPDR is not statistically significant (β = 0.014, t = 1.06, not significant). This
288
indicates that NPDR is not a “pure” moderator in the PLSP model. NPDR may, however, have
a direct effect on post-launch stage performance.
For H9a, the moderating impact of NPDR on the relationship between MV and BLSP was only
partially supported by the findings. Surprisingly, the degree of NPD process rigidity was found
to positively influence the relationship between MV and BLSP. One rationale for this finding
might be that scale items of NPDR measure have framed the respondents’ thoughts in terms of
a formal process, rather than an inflexible one. The measurement items referred to a formal
NPD process, that is, a standardised set of stages and go/no-go decision points (gates), together
with defined gatekeepers or reviewers associated with the development of breakthrough
innovations in the firm. These items were similar to the scales used by Kleinschmidt et al.
(2007) in regard to “NPD process formality”. Although adjustments were made on the items to
respond to the scope of company/SBU level NPD programs, the NPDR measure may have been
perceived by the respondents to refer to a process or a formal logical progression to manage
breakthrough innovations.
In fact, a study by Schmidt et al. (2009) found radical NPD projects to be using more decision
points (gates) for each stage of the process than incremental projects. This suggests that a
formal process is of particular importance for breakthrough innovations in order to keep the
project on track. The findings in this study regarding NPDR are in line with those of Schmidt et
al. (2009). The impact of MV on before-launch stage performance is more effective when there
is a higher degree of formality – clearly defined go/no-go decision points and the involvement
of senior management to implement supportive NPD processes.
Given the high uncertainties and costs associated with the development of breakthrough
innovations, especially in the early stages, having a somewhat formalised NPD process to
control such projects seems reasonable (Reid & de Brentani, 2004; Schmidt et al., 2009).
Uncertainty and risks can be gradually diminished at each stage through a formalised NPD
process (Van Oorschot, Sengupta, Akkermans & Van Wassenhove, 2010). Accordingly, NPD
process formality can be viewed as an important organisational resource, and it has been linked
to NPD success and superior performance (Cooper, 1999; Griffin, 1997b; Kleinschmidt et al.,
289
2007). A formalised NPD process is characterised by “early and sharp” product definition
(Biazzo, 2009), which also appears to be consistent with MV in this study. Having a formalised
NPD process may help firms to translate the MV of a radically new or really new product into
successful before-launch stage performance, by maintaining breakthrough integrity (BI) and
achieving early success with customers (ESC). It may also help firms to avoid the mistakes of
investing in the “wrong” types of project (Van Oorschot et al., 2010). Overall, a high degree of
NPD process formality may provide the base needed for MV to cope with the uncertainties and
complexity of NPD efforts in breakthrough innovation.
For H9b, the moderating impact of NPDR on the MV/PLSP relationship was found to be
nonsignificant. Despite the importance of having a formal process, as evident in H9a, the
impact of NPDR may be offset by the decrease in the survival rate over the course of the
development process, and thus be unable to influence post-launch stage performance. Indeed,
firms do kill off more breakthrough ideas (MV) than incremental ones. This is particularly the
case for highly innovative ideas that may eventually open new markets, as they are often
inconsistent with the firm’s value. As such, the survival rate for breakthrough projects (MV)
decreases rapidly as the project progresses through each gate of the NPD process (Schmidt et
al., 2009). Moreover, having several decision points may slow down the development process,
causing projects to fall behind the original schedule developed at the initial project go-ahead.
These balanced effects may be what underlie the nonsignificant impact of NPDR on the
relationship between MV and PLSP (STM/WO).
290
5.7.3 Firm Size (Number of Employees)
H10a: Large firm size (number of employees) positively influences the relationship between MV
and before-launch stage performance.
H10b: Large firm size (number of employees) positively influences the relationship between MV
and post-launch stage performance.
Firm size (number of employees) was proposed to positively influence the impact of MV on
before-launch stage performance (BLSP) and post-launch stage performance (PLSP). The
number of employees (NOE) is an indication of firm size. Firm size is categorised according to
NOE (Burgelman & Sayles, 1986; Simon, 1945), where small- and medium-sized firms have
up to 60 employees and large-sized firms have over 60 employees.
The proposed hypothesis was based on the assumption that having a large number of employees
or a large firm size, provides a better chance of success with innovation (Chandy & Tellis,
2000; Griffin & Page, 1996). Large firms have “slack resources” (deep pockets), that is, a high
level of available resources (Bower, 1970). The advantage of a firm having slack resources is
improved NPD performance, particularly for market-driving innovation, supported by financial
capital, social capital, human resources and information resources. A firm with slack resources
can support extensive R&D, learning about new technologies/markets, and can provide
marketing expenditure (Bower, 1970). More information can also be derived through social
networking with, for example, government, suppliers and labour, which leverages the firm’s
experience in product market learning. Further, the large and well established firms often have
long-term relationships with their social networks, channels power and reputation. Such
channels power may also protect the firms against environmental pressures from immediate and
intensive competition. This is typically what small start-up firms do not have (Levinthal, 1994).
H10a and H10b therefore examine whether firm size (NOE) has any positive moderating
influence on the impact of MV on BLSP and PLSP.

291
To evaluate whether firm size influences MV in translating into BLSP and PLSP, NOE was
entered into the SPSS MODPROBE (Hayes & Matthes, 2009) script dialog box as a moderator
variable (M), where MV is the focal predictor (F), and BLSP and PLSP are the dependent
variables (Y). Table 5.11 presents the results of these analyses.
Table 5.11: Moderation Effects of Firm Size (Number of Employees)
Model H10a (BLSP) H10b (PLSP)
Interaction Model β t β t
Constant 6.928 69.28*** 7.129 67.16***
MV 0.091 5.26*** 0.130 7.12***
Firm Size (NOE) -0.119 -2.75** -0.040 -0.88 (n.s.)
MV x Firm Size 0.000 0.04 (n.s.) 0.019 2.59*
R-square 0.210 0.305
F-ratio (df) 15.505 3, 175 25.538 3, 175
Conditional effects β t β t
low 0.090 3.42*** 0.086 3.06**
medium 0.091 5.26*** 0.130 7.12***
high 0.091 4.39*** 0.175 7.91***+ = p<0.10, ∗ = p<0.05, ∗∗ = p<0.01, ∗∗∗ = p<0.001
The results suggest that firm size does not have any moderating influence on the relationship
between MV and BLSP. Although both MV and firm size have significant effects in the BLSP
model at p<0.001 and p<0.01 respectively (β = 0.091, t = 5.26, and β = -0.119, t = -2.75),
respectively, the interaction term of MV x firm size is not statistically significant (β = 0.000, t =
0.04, not significant). As a result, this indicates that firm size is not a “pure” moderator in the
BLSP model, which counters what was predicted in H10a. Firm size, however, may have a
direct effect on BLSP.

292
The results also suggest that firm size is a moderator impacting on the relationship between MV
and PLSP. In this regard, MV has a significant effect in the PLSP model (β = 0.130, t = 7.12;
p<0.001). Even though the firm size itself has no significant effect in the PLSP model (β = -
0.040, t = -0.88, not significant), the interaction term between MV x firm size indicates a
statistically significant result (β = 0.019, t = 2.59; p<0.05). This suggests that firm size is a
“pure” moderator, lending support to H10b. In particular, the positive coefficient of the
interaction means that the effect of MV on PLSP becomes more positive as NOE increases.
Moreover, the conditional effects show that the regression for low (β = 0.086, t = 3.06;
p<0.001), medium (β = 0.130, t = 7.12; p<0.001) and high (β = 0.175, t = 7.91; p<0.001) levels
of NOE are very highly significant and positive. That is, the greater the number of employees
(or the larger the firm), the greater the improvement in post-launch stage performance.
For H10b, the moderating hypothesis of firm size (number of employees) on the relationship
between MV and PLSP was supported by the findings. As large firms have access to slack
resources, the impact of MV on PLSP is greater due to an increased commercialisation budget
size, people resources, improved communication networks and market learning systems.
Typically, the costs associated with the project increase as the project progresses over the NPD
process (Van Oorschot et al., 2010). In particular, the development of breakthrough innovation
can be very risky and costly. Large firms have access to greater financial resources and are able
to spread the costs and associated risk in the economy of scale. A study by Schmidt et al.
(2009) also found that the number of reviewers or decision makers (review team) increases over
the stages of the NPD process for radical innovations. Radical innovation require more
reviewers (number of team members) across the gates than incremental ones do, particularly in
the later stages of the NPD process (Schmidt et al., 2009). A large network of people may speed
up the learning process of translating MV into a new product launch more quickly (STM) and
open up new opportunities for the firm (WO). Given the associated high costs, risk and
uncertainties of bringing radical products to market, the requirement for more resources at the
post-launch stage of the NPD process appears to be understandable.
For H10a, the moderating impact of the firm size (NOE) on the relationship between MV and
BLSP was not supported by the findings. The balanced effect of firm size (NOE) may be what

293
underlies its nonsignificant impact on the relationship between MV and BLSP in this study.
Despite the impetus and opportunity provided through slack resources such as the extensive
communication channels of large firms, this may also hamper the transfer of information and
decision making and influence the before-launch stage performance (BLSP) of the radical NPD
process (Burgelman & Sayles, 1986; Tushman & Anderson, 1986). At the BLSP, information
sharing regarding the future product-market (MV) is critical for creating buy-in from people in
the firm. Go/no-go decisions need to be made to translate the MV of a radically new or really
new product into the development stage and through to launch (Reid & de Brentani, 2004).
Large firms tend to be characterised by inertia, which has a negative influence on the ability to
drive and maintain highly innovative ideas (BI), and facilitate market learning to achieve early
success with customers (ESC) (Dougherty & Heller, 1994; Kanter, 1988). This could levy a
strong counterbalance by hindering the translation of MV into BLSP.
294
5.8 Section Conclusion
This section of Chapter 5 provided a number of implications. Absorptive capacity (ACAP) and
its subsets of potential and realised absorptive capacities (PACAP and RACAP) were found to
have a significant and positive impact on market visioning competence (MVC). More
specifically, RACAP has more impact on MVC than PACAP. RACAP is the main source of
performance improvements and is particularly associated with MVC through the capability to
transform and exploit knowledge into new products that recognise the needs of future markets.
As predicted, MVC was found to have a strong, significant and positive impact on market
vision (MV). MV has a stronger impact on post-launch stage performance (PLSP) than on
before-launch stage performance (BLSP). In the dimensions of MV, form was found to have
the strongest influence on BLSP. While clarity does not have any significant impact on BLSP,
it has a significant and positive influence on PLSP. Furthermore, scope appeared to be the only
dimension of MV that has negative impacts on both BLSP and PLSP. As with BLSP, a
significant and positive impact was found on PLSP. PLSP, however, explains slightly more
variance of financial performance (FP) than BLSP, as would be expected.
In addition to these findings, competitive intensity was found to positively influence the
relationship between MV and BLSP/PLSP. While NPD process rigidity significantly and
positively influences the relationship between MV and BLSP, firm size (number of employees)
was found to significantly and positively influence the relationship between MV and PLSP.
The regression analyses overall supported the main relationships between ACAP, MVC/MV,
BLSP/PLSP and FP, with statistically significant results. Moreover, the results appeared to
support the proposed conceptual model. To further assess these relationships, the final analysis
involved partial least squares structural equation modelling to facilitate an examination of the
various relationships simultaneously.
295
5.9 Partial Least Square Structural Equation Modelling:
Integrated Model
The aim of this integrated path modelling is to further test the hypothesised relationships and to
estimate multiple and interrelated dependence relationships among all of the variables in the
model. Partial least square structural equation modelling (PLS-SEM) allows an evaluation of
complex modelling for this particular study, including models with (1) hierarchical construct,
(2) mediating effects and (3) moderating effects (Chin et al., 2003).
The measurement and path models were estimated using SmartPLS version 21.0 (Ringle et al.,
2005). The level of statistical significance of path coefficients and loadings of both the
measurement and the structural models was determined using a Bootstrap re-sampling
procedure. The Bootstrap re-sampling entailed generating 500 sub-samples of cases randomly
selected, with replacement, from the original data, and a sample size identical to the number of
valid observations or the original sample (Efron & Tibshirani, 1993). Bootstrapping is
recommended since PLS-SEM does not rely on data distributions. Direct inference statistical
tests of the model fit and the model parameters are not presented as CB-SEM does (Chin,
2010). However, PLS-SEM is robust in handling the complex models due to this bootstrapping
– a non-parametric technique based on iterative algorithm for estimating standard errors of the
model parameters (Henseler et al., 2009).
In determining the path models for this study, the regression results were further reviewed to
work out how best to structure the model. Accordingly, ACAP overall, as a single measure, was
deemed to be limited for examining the degree to which it influences MVC. Thus, PACAP and
RACAP, as subsets of ACAP, were used to explore their relations to MVC. Preliminary model
testing was conducted to validate the final measurement. Details of the assessment of the
measurement are presented in the next section. This will be followed by the analysis of the
structural model set up to test the proposed hypotheses in Section 5.9.2.1. Section 5.9.2.2
presents the analysis and results of the mediating effects of MV construct and the final model
(fully-mediated) where additional relationships between PACAP/RACAP and MV were added
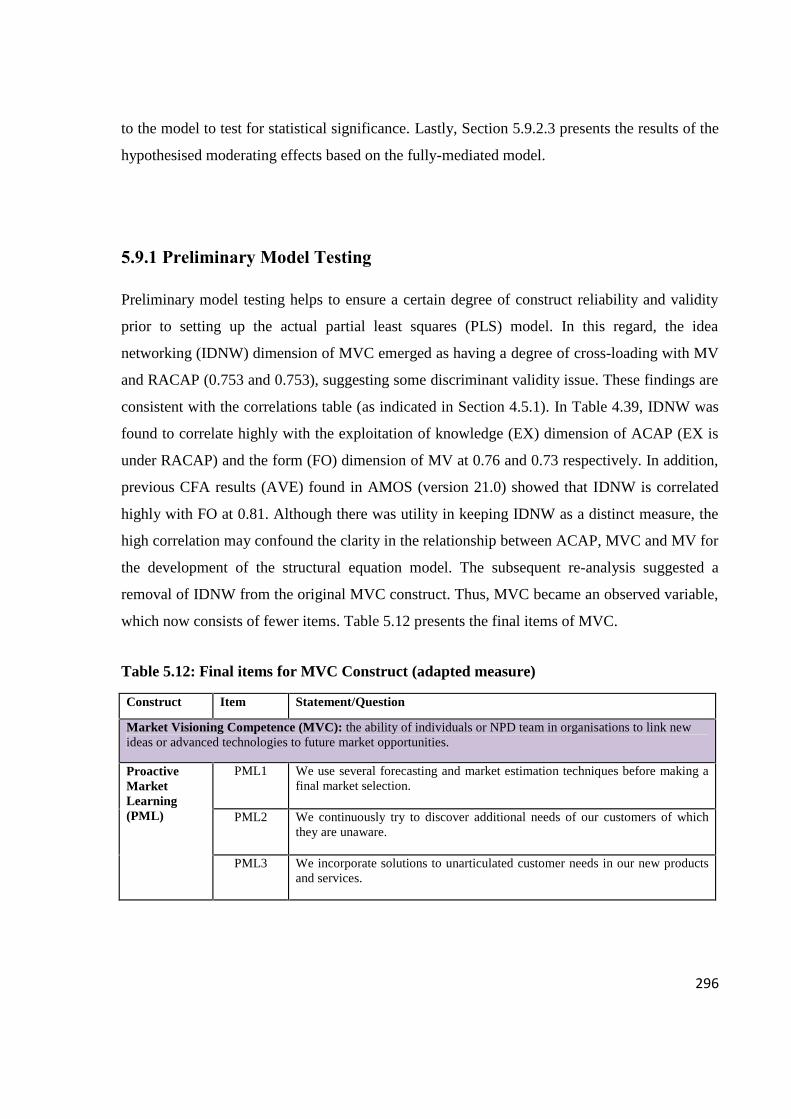
296
to the model to test for statistical significance. Lastly, Section 5.9.2.3 presents the results of the
hypothesised moderating effects based on the fully-mediated model.
5.9.1 Preliminary Model Testing
Preliminary model testing helps to ensure a certain degree of construct reliability and validity
prior to setting up the actual partial least squares (PLS) model. In this regard, the idea
networking (IDNW) dimension of MVC emerged as having a degree of cross-loading with MV
and RACAP (0.753 and 0.753), suggesting some discriminant validity issue. These findings are
consistent with the correlations table (as indicated in Section 4.5.1). In Table 4.39, IDNW was
found to correlate highly with the exploitation of knowledge (EX) dimension of ACAP (EX is
under RACAP) and the form (FO) dimension of MV at 0.76 and 0.73 respectively. In addition,
previous CFA results (AVE) found in AMOS (version 21.0) showed that IDNW is correlated
highly with FO at 0.81. Although there was utility in keeping IDNW as a distinct measure, the
high correlation may confound the clarity in the relationship between ACAP, MVC and MV for
the development of the structural equation model. The subsequent re-analysis suggested a
removal of IDNW from the original MVC construct. Thus, MVC became an observed variable,
which now consists of fewer items. Table 5.12 presents the final items of MVC.
Table 5.12: Final items for MVC Construct (adapted measure)
Construct Item Statement/Question
Market Visioning Competence (MVC): the ability of individuals or NPD team in organisations to link newideas or advanced technologies to future market opportunities.
ProactiveMarketLearning(PML)
PML1 We use several forecasting and market estimation techniques before making afinal market selection.
PML2 We continuously try to discover additional needs of our customers of whichthey are unaware.
PML3 We incorporate solutions to unarticulated customer needs in our new productsand services.

297
To evaluate PLS models for the study, the procedure advocated by Hulland (1999) was
followed. The estimated models were validated and interpreted in two phases. First, the
reliability and validity of the measurement model (outer model) were assessed to specify the
relationship between a latent variable and its observed or manifest variables. Second, the
structural models (inner models) were tested to specify the relationships between unobserved or
latent variables.
In PLS outer relationships or outer model, it is important to evaluate the types of models
whether the measurement involves reflective or formative indicator constructs (Bollen &
Lennox, 1991). This is to determine the appropriate methods for subsequent data analysis and
the criteria for reliability and validity testing (Diamantopoulos & Winklhofer, 2001). A
reflective measurement model has the direction of causality flows from the construct to the
indicators (latent construct to the manifest variables). Thus, the construct is viewed as the cause
that determines its measures or indicators. Further, the indicators of reflective constructs are
interchangeable, strongly correlated and sharing common antecedents and consequences. In
contrast, a formative measurement model has the direction of causality flows from the
indicators to the construct. Thus, the indicators have a casual effect on the construct and
determine the value of a construct (Henseler et al., 2009). As indicated in Chapter 4, all the
constructs in this study were conceptualised as being of reflective nature. The adequacy of the
measurement model was re-validated after the removal of IDNW by examining indicator and
construct reliability, as well as discriminant validity.
Indicator reliability is determined by the factor loadings or outer loadings as reflected in
SmartPLS (Ringle et al., 2005), which should exceed 0.7 (Chin, 1998). This is to indicate a
shared variance of 50% or greater between the item and the construct (Sarkar, Echambadi,
Cavusgil & Aulakh, 2001a). It can also be acceptable when the factor loadings are higher than
0.4 (Hulland, 1999). Accordingly, the individual item reliabilities were examined by assessing
loadings of the measures on the respective constructs. The outer loadings of the constructs were
found to exceed the cut-off suggested by Chin (1998) and Hulland (1999), with the lowest
loading 0.77 and all other constructs with loadings greater than 0.80. Overall, the statistics
indicate that all the items validate good individual-item reliabilities.
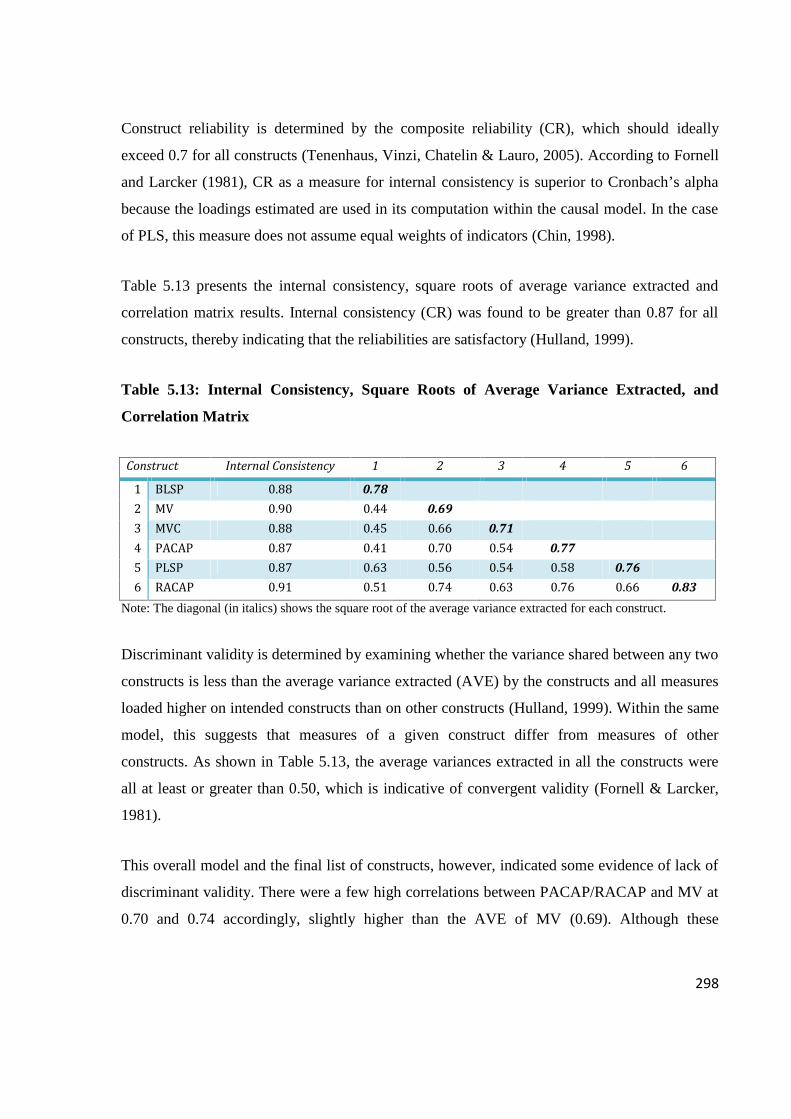
298
Construct reliability is determined by the composite reliability (CR), which should ideally
exceed 0.7 for all constructs (Tenenhaus, Vinzi, Chatelin & Lauro, 2005). According to Fornell
and Larcker (1981), CR as a measure for internal consistency is superior to Cronbach’s alpha
because the loadings estimated are used in its computation within the causal model. In the case
of PLS, this measure does not assume equal weights of indicators (Chin, 1998).
Table 5.13 presents the internal consistency, square roots of average variance extracted and
correlation matrix results. Internal consistency (CR) was found to be greater than 0.87 for all
constructs, thereby indicating that the reliabilities are satisfactory (Hulland, 1999).
Table 5.13: Internal Consistency, Square Roots of Average Variance Extracted, and
Correlation Matrix
Construct Internal Consistency 1 2 3 4 5 61 BLSP 0.88 0.782 MV 0.90 0.44 0.693 MVC 0.88 0.45 0.66 0.714 PACAP 0.87 0.41 0.70 0.54 0.775 PLSP 0.87 0.63 0.56 0.54 0.58 0.766 RACAP 0.91 0.51 0.74 0.63 0.76 0.66 0.83Note: The diagonal (in italics) shows the square root of the average variance extracted for each construct.
Discriminant validity is determined by examining whether the variance shared between any two
constructs is less than the average variance extracted (AVE) by the constructs and all measures
loaded higher on intended constructs than on other constructs (Hulland, 1999). Within the same
model, this suggests that measures of a given construct differ from measures of other
constructs. As shown in Table 5.13, the average variances extracted in all the constructs were
all at least or greater than 0.50, which is indicative of convergent validity (Fornell & Larcker,
1981).
This overall model and the final list of constructs, however, indicated some evidence of lack of
discriminant validity. There were a few high correlations between PACAP/RACAP and MV at
0.70 and 0.74 accordingly, slightly higher than the AVE of MV (0.69). Although these

299
constructs appear to be correlated highly, they are in fact distinct entities. PACAP and RACAP
or ACAP and MV are important measures adapted from the scale proposed by Flatten et al.
(2011) and Reid and de Brentani (2010).
Table 5.14 presents a comparison between PACAP/RACAP and MV constructs.
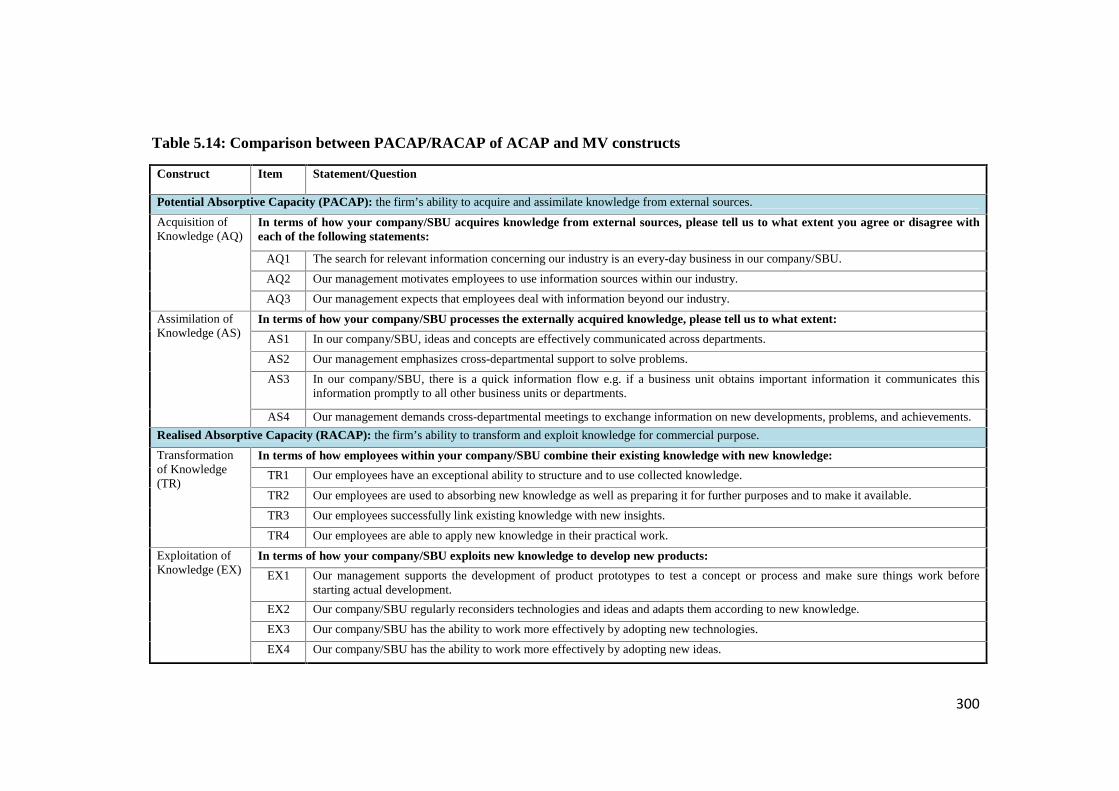
300
Table 5.14: Comparison between PACAP/RACAP of ACAP and MV constructs
Construct Item Statement/Question
Potential Absorptive Capacity (PACAP): the firm’s ability to acquire and assimilate knowledge from external sources.Acquisition ofKnowledge (AQ)
In terms of how your company/SBU acquires knowledge from external sources, please tell us to what extent you agree or disagree witheach of the following statements:
AQ1 The search for relevant information concerning our industry is an every-day business in our company/SBU.
AQ2 Our management motivates employees to use information sources within our industry.
AQ3 Our management expects that employees deal with information beyond our industry.
Assimilation ofKnowledge (AS)
In terms of how your company/SBU processes the externally acquired knowledge, please tell us to what extent:
AS1 In our company/SBU, ideas and concepts are effectively communicated across departments.
AS2 Our management emphasizes cross-departmental support to solve problems.
AS3 In our company/SBU, there is a quick information flow e.g. if a business unit obtains important information it communicates thisinformation promptly to all other business units or departments.
AS4 Our management demands cross-departmental meetings to exchange information on new developments, problems, and achievements.
Realised Absorptive Capacity (RACAP): the firm’s ability to transform and exploit knowledge for commercial purpose.
Transformationof Knowledge(TR)
In terms of how employees within your company/SBU combine their existing knowledge with new knowledge:
TR1 Our employees have an exceptional ability to structure and to use collected knowledge.
TR2 Our employees are used to absorbing new knowledge as well as preparing it for further purposes and to make it available.
TR3 Our employees successfully link existing knowledge with new insights.
TR4 Our employees are able to apply new knowledge in their practical work.
Exploitation ofKnowledge (EX)
In terms of how your company/SBU exploits new knowledge to develop new products:
EX1 Our management supports the development of product prototypes to test a concept or process and make sure things work beforestarting actual development.
EX2 Our company/SBU regularly reconsiders technologies and ideas and adapts them according to new knowledge.
EX3 Our company/SBU has the ability to work more effectively by adopting new technologies.
EX4 Our company/SBU has the ability to work more effectively by adopting new ideas.

301
Table 5.14: Comparison between PACAP/RACAP of ACAP and MV constructs (continued)
Construct Item Statement/Question
Market Vision (MV): A Market Vision is “a clear and specific early-stage mental model or image of a product-market that enables NPD teams to grasp what it isthey are developing and for whom”.
Specific Magnetism(SPMG)
Preamble: Please think about the market vision in the very early stages of developing breakthrough innovations in yourcompany/SBU and indicate the degree to which you agree or disagree with these statements:
SPMG1 We have a very specific Market Vision statement that guides each NPD project.
SPMG2 Our Market Vision provides clear direction to others in the company/SBU regarding what is being developed and for whom.
SPMG3 Our Market Vision helps make tangible what is to be developed and for whom.
SPMG4 Our Market Vision clearly highlights the attractiveness of the market opportunity.
SPMG5 Our Market Vision generates buy-in from other people and groups in the company/SBU.
Form (FO) Preamble: “When you first start thinking about specific markets would benefit from your breakthrough innovations, you and yourNPD team are able to spend an appropriate amount of time thinking and talking about…”
FO1 How end-users would ultimately interact with and use the breakthrough innovations.
FO2 How the breakthrough innovations would fit into an overall system of use for potential customers.
FO3 How customers might use the breakthrough innovations in their environments.
FO4 The potentials for standardizing the design of the breakthrough innovations.
Scope (SC) SC1 What the most profitable target market would be for the breakthrough innovations.
SC2 What the largest target market would be for the breakthrough innovations.
SC3 What the most important target market would be for the breakthrough innovations.
Clarity (CL) Preamble: “After spending time discussing the specific markets for the breakthrough innovations within your NPD team…”
CL1 It is generally clear who the target customers would be for the breakthrough innovations.
CL2 It is generally clear what target customers' needs would be for the breakthrough innovations.
CL3 It is generally clear how breakthrough innovations would be used by the target customers.

302
The measures of ACAP and MV reflect different levels of learning capabilities, related tasks
and thinking within a firm (company/SBU). As shown in Table 5.14, ACAP measures refer to
general organisational routines and processes in a company or SBU quite apart from innovation
related activities. At the broad organisational level, the PACAP dimension captures
organisational learning through the search for new relevant information within and beyond the
industry and across all departments such as R&D, production, marketing and accounting within
a firm, and the ability of all employees within these departments to communicate with each
other. Further, the RACAP dimension captures how well employees apply new knowledge in
their practical work in order to work more effectively towards outcomes such as new product
development. This is consistent with other empirical studies that have adopted ACAP construct
as a predictor of innovative activity (Cohen & Levinthal, 1990) or innovative output (Liu &
White, 1997), and as a firm’s ability to create new knowledge for innovation (Kim, 1998; Zahra
& George, 2002).
On the other hand, MV is distinct from ACAP in that it refers to the specific innovation-related
thinking of an NPD team, in regard to the market vision of the early stages of developing
breakthrough innovations. At the NPD program level analysis, MV in this study is a clear and
specific early-stage mental model or image of a product-market that enables NPD teams to
grasp what it is they are developing and for whom (Reid & de Brentani, 2010). Hence, the
constructs of ACAP and MV can be argued, theoretically, as separate dimensions for the
development of a structural equation model. The statistical results overall indicated that the
final measurement model is sufficiently valid for an interpretation of structural estimates.

303
5.9.2 Structural Model Estimates
In a PLS structural model, variance explained (R²) and t-values of path coefficients were used
to assess the structural relationships among variables (Barclay et al., 1995).
Unlike CB-SEM, PLS path modelling and its current version of SmartPLS does not provide a
global validation of the model or indicator of fit. A method for calculating a global criterion of
goodness-of-fit (GOF) for complete PLS path modelling has been proposed by Tenenhaus et al.
(2005). The GOF index represents an operational solution for validating the PLS model
globally as it takes into account the quality of the structural and measurement models. The
formula for the global GOF index is written as (Tenenhaus et al., 2005, p.173):
is the average of all R-square values in the full path model. The geometric
mean of communality was determined as follows:
According to Fornell and Larcker (1981), the communality is equal to AVE in the PLS path
modelling. In this regard, the special issue of MIS Quarterly on PLS Path Modelling guidelines
by Wetzels, Odekerken-Schroder, and Van Oppen (2009) proposed a cut-off value of 0.5 for
commonality. Wetzels et al. (2009) proposed “the GoF criteria for small, medium, and large
effect sizes of R² by substituting the minimum average AVE of 0.50 and the effect sizes for R²
in the equation defining GoF” (p.187).
For each estimated model, the GoF was therefore computed following the formula and criteria:

304
The GoF value assesses how well a statistical model overall fits its set of observations, as well
as indicating the explanatory power of the model. The GoF index is bounded between 0 and 1.
The GoF criterion is the baseline values that demonstrate small, medium and large effect sizes
of R² for PLS Path Modelling. An assessment of the use of PLS-SEM in marketing research by
Hair et al. (2012b, p.426), however, suggested that this criterion of GoF “does not represent a
true global fit measure (even though its name suggests this), and threshold values for an
acceptable ‘goodness-of-fit’ can hardly be derived because acceptable R square values depend
on the research context and the construct’s role in the model”. Nevertheless, this relatively new
method for GoF has been reported in many recent studies as a useful measure to diagnose
statistical models using PLS Path Modelling (e.g. Caniëls & Bakens, 2012; Hammedi et al.,
2011; Westerlund & Rajala, 2010). Moreover, the GoF is only applicable for PLS-SEM based
on reflective hierarchical construct models (reflective outer model’s commonalities) (Hair et al.,
2012b), and hence it is suitable to evaluate the structural models in this study.
5.9.2.1 Hypothesis Testing
The hypothesised main effects between potential absorptive capacity (PACAP) and realised
absorptive capacity (RACAP), market visioning competence (MVC), market vision (MV),
before-launch stage performance (BLSP) and post-launch stage performance (PLSP) and
financial performance (FP) were assessed. The PLS model explained 42% of variance for FP,
19% of variance for BLSP and 50% for PLSP. The data also explained 40% of variance in
MVC and 65% in MV, and 57% of variance for RACAP by PACAP.
The empirical results of the structural model are depicted in Figure 5.2. Regression coefficients
of the PLS analysis, t-values (between parentheses) and R-squares are reported in the figure.
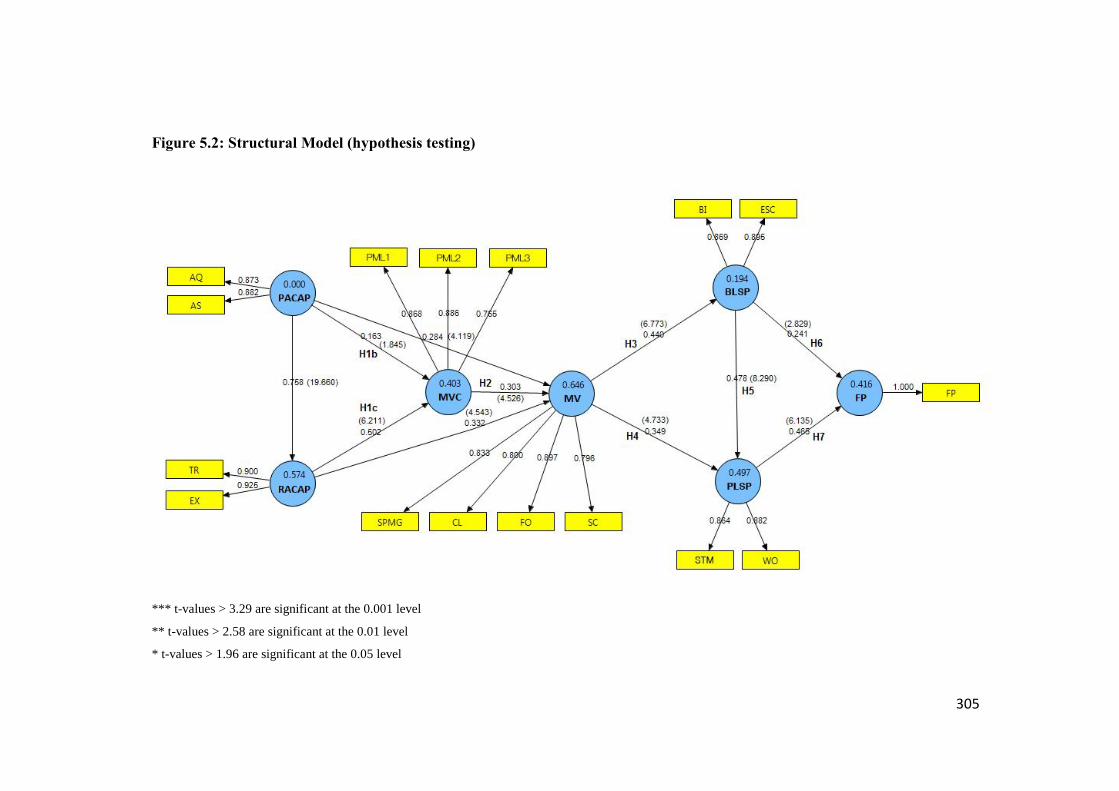
305
Figure 5.2: Structural Model (hypothesis testing)
*** t-values > 3.29 are significant at the 0.001 level
** t-values > 2.58 are significant at the 0.01 level
* t-values > 1.96 are significant at the 0.05 level
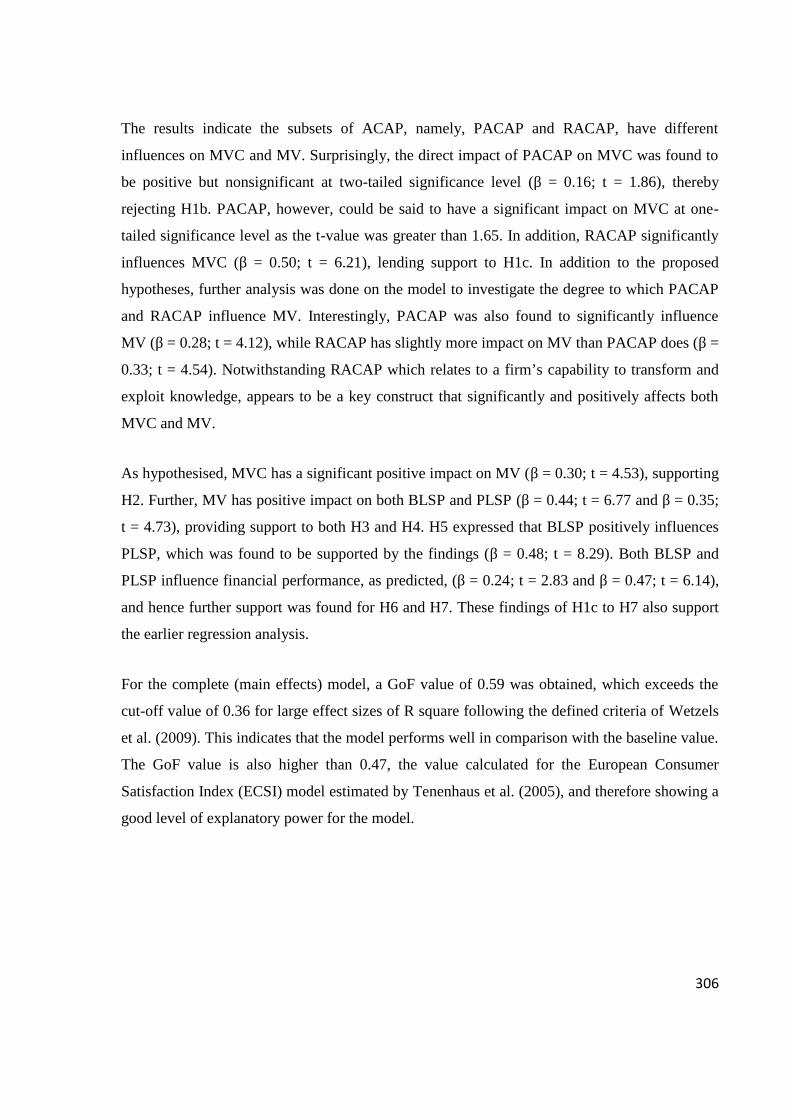
306
The results indicate the subsets of ACAP, namely, PACAP and RACAP, have different
influences on MVC and MV. Surprisingly, the direct impact of PACAP on MVC was found to
be positive but nonsignificant at two-tailed significance level (β = 0.16; t = 1.86), thereby
rejecting H1b. PACAP, however, could be said to have a significant impact on MVC at one-
tailed significance level as the t-value was greater than 1.65. In addition, RACAP significantly
influences MVC (β = 0.50; t = 6.21), lending support to H1c. In addition to the proposed
hypotheses, further analysis was done on the model to investigate the degree to which PACAP
and RACAP influence MV. Interestingly, PACAP was also found to significantly influence
MV (β = 0.28; t = 4.12), while RACAP has slightly more impact on MV than PACAP does (β =
0.33; t = 4.54). Notwithstanding RACAP which relates to a firm’s capability to transform and
exploit knowledge, appears to be a key construct that significantly and positively affects both
MVC and MV.
As hypothesised, MVC has a significant positive impact on MV (β = 0.30; t = 4.53), supporting
H2. Further, MV has positive impact on both BLSP and PLSP (β = 0.44; t = 6.77 and β = 0.35;
t = 4.73), providing support to both H3 and H4. H5 expressed that BLSP positively influences
PLSP, which was found to be supported by the findings (β = 0.48; t = 8.29). Both BLSP and
PLSP influence financial performance, as predicted, (β = 0.24; t = 2.83 and β = 0.47; t = 6.14),
and hence further support was found for H6 and H7. These findings of H1c to H7 also support
the earlier regression analysis.
For the complete (main effects) model, a GoF value of 0.59 was obtained, which exceeds the
cut-off value of 0.36 for large effect sizes of R square following the defined criteria of Wetzels
et al. (2009). This indicates that the model performs well in comparison with the baseline value.
The GoF value is also higher than 0.47, the value calculated for the European Consumer
Satisfaction Index (ECSI) model estimated by Tenenhaus et al. (2005), and therefore showing a
good level of explanatory power for the model.
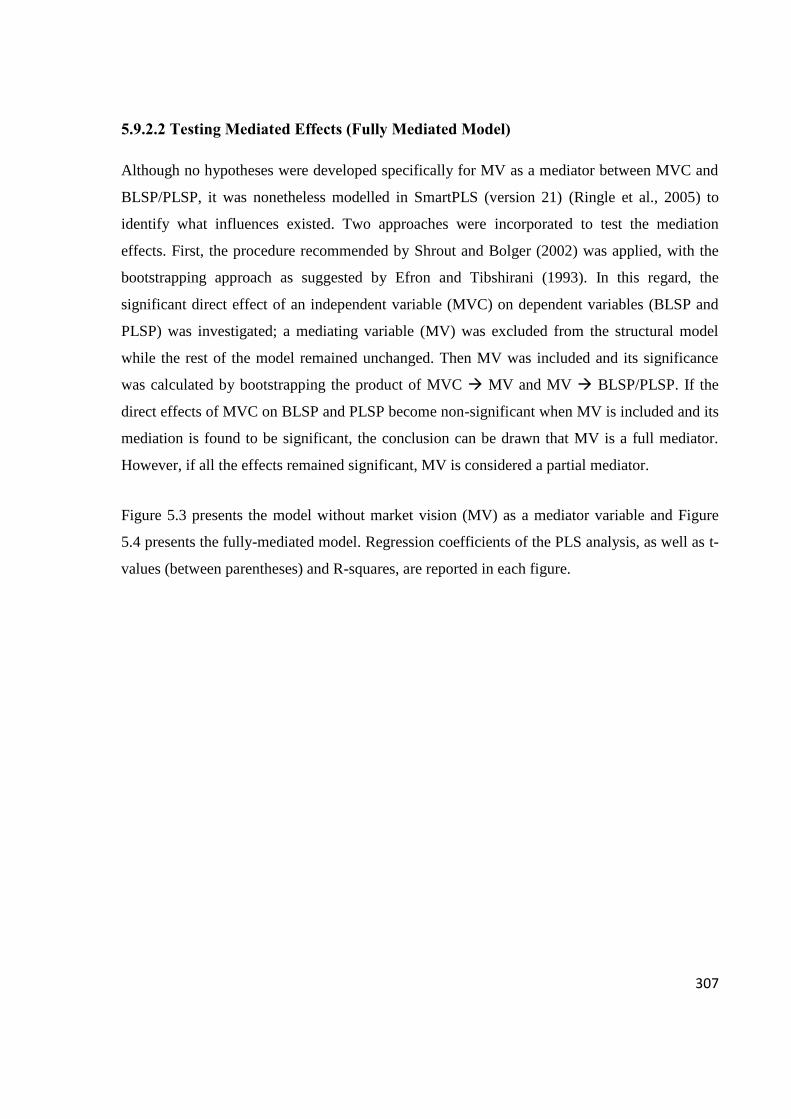
307
5.9.2.2 Testing Mediated Effects (Fully Mediated Model)
Although no hypotheses were developed specifically for MV as a mediator between MVC and
BLSP/PLSP, it was nonetheless modelled in SmartPLS (version 21) (Ringle et al., 2005) to
identify what influences existed. Two approaches were incorporated to test the mediation
effects. First, the procedure recommended by Shrout and Bolger (2002) was applied, with the
bootstrapping approach as suggested by Efron and Tibshirani (1993). In this regard, the
significant direct effect of an independent variable (MVC) on dependent variables (BLSP and
PLSP) was investigated; a mediating variable (MV) was excluded from the structural model
while the rest of the model remained unchanged. Then MV was included and its significance
was calculated by bootstrapping the product of MVC MV and MV BLSP/PLSP. If the
direct effects of MVC on BLSP and PLSP become non-significant when MV is included and its
mediation is found to be significant, the conclusion can be drawn that MV is a full mediator.
However, if all the effects remained significant, MV is considered a partial mediator.
Figure 5.3 presents the model without market vision (MV) as a mediator variable and Figure
5.4 presents the fully-mediated model. Regression coefficients of the PLS analysis, as well as t-
values (between parentheses) and R-squares, are reported in each figure.

308
Figure 5.3: Structural Model Without Market Vision (MV)
*** t-values > 3.29 are significant at the 0.001 level** t-values > 2.58 are significant at the 0.01 level* t-values > 1.96 are significant at the 0.05 level
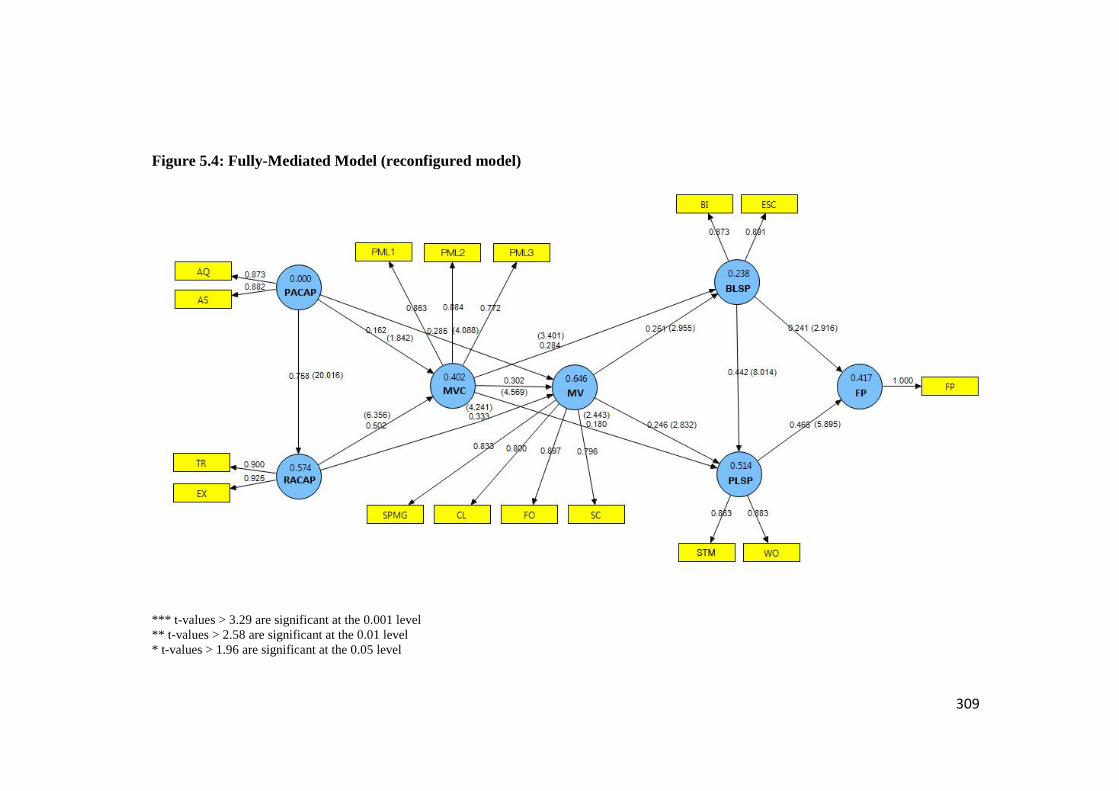
309
Figure 5.4: Fully-Mediated Model (reconfigured model)
*** t-values > 3.29 are significant at the 0.001 level** t-values > 2.58 are significant at the 0.01 level* t-values > 1.96 are significant at the 0.05 level
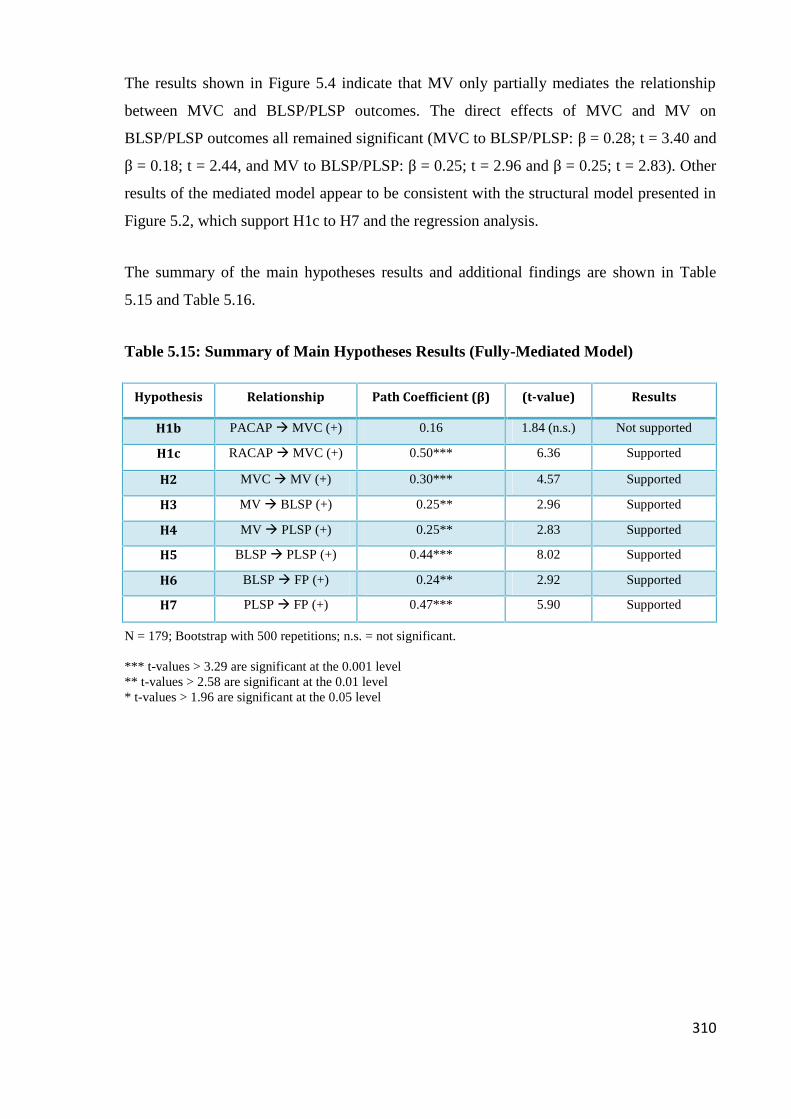
310
The results shown in Figure 5.4 indicate that MV only partially mediates the relationship
between MVC and BLSP/PLSP outcomes. The direct effects of MVC and MV on
BLSP/PLSP outcomes all remained significant (MVC to BLSP/PLSP: β = 0.28; t = 3.40 and
β = 0.18; t = 2.44, and MV to BLSP/PLSP: β = 0.25; t = 2.96 and β = 0.25; t = 2.83). Other
results of the mediated model appear to be consistent with the structural model presented in
Figure 5.2, which support H1c to H7 and the regression analysis.
The summary of the main hypotheses results and additional findings are shown in Table
5.15 and Table 5.16.
Table 5.15: Summary of Main Hypotheses Results (Fully-Mediated Model)
Hypothesis Relationship Path Coefficient (β) (t-value) Results
H1b PACAPMVC (+) 0.16 1.84 (n.s.) Not supported
H1c RACAPMVC (+) 0.50*** 6.36 Supported
H2 MVCMV (+) 0.30*** 4.57 Supported
H3 MV BLSP (+) 0.25** 2.96 Supported
H4 MV PLSP (+) 0.25** 2.83 Supported
H5 BLSP PLSP (+) 0.44*** 8.02 Supported
H6 BLSP FP (+) 0.24** 2.92 Supported
H7 PLSP FP (+) 0.47*** 5.90 Supported
N = 179; Bootstrap with 500 repetitions; n.s. = not significant.
*** t-values > 3.29 are significant at the 0.001 level** t-values > 2.58 are significant at the 0.01 level* t-values > 1.96 are significant at the 0.05 level
311
Table 5.16: Summary of Additional Analysis Results (Fully-Mediated Model)
Relationship Path Coefficient (β) (t-value)
PACAP RACAP 0.76*** 20.02
PACAPMV 0.29*** 4.09
RACAPMV 0.33*** 4.24
MVC BLSP 0.28*** 3.40
MVC PLSP 0.18* 2.44
N = 179; Bootstrap with 500 repetitions; n.s. = not significant.
*** t-values > 3.29 are significant at the 0.001 level** t-values > 2.58 are significant at the 0.01 level* t-values > 1.96 are significant at the 0.05 level
Further, the GoF of the model (with mediated paths from MVC to BLSP and PLSP) was
calculated and compared with a competing model, incorporating direct links between
constructs. The mediated model shows a substantially better fit with a GoF value of 0.59
compared to the 0.47 of the model without the mediating variable (MV). The explained
variance in both R-square of BLSP and PLSP were also higher in the mediated model.
Whereas the model without MV (Figure 5.3) illustrates the R² of 0.20 and 0.48, the
mediated model (Figure 5.4) illustrates the R² of 0.24 and 0.51 for BLSP/PLSP outcomes.
This shows that the mediated model improves the R-square value and provides a better
explanation of performance outcomes at both before-launch stage and post-launch stage.
5.9.2.3 Testing Moderating Effects
The proposed moderators were tested on the fully mediated model, which included firm size
(NOE), NPD process rigidity (NPDR) and competitive intensity (CI), technological
turbulence (TT) and market turbulence (MT) of the external environment (EE). For each of
the moderating effects, the methodology suggested by Chin et al. (2003) was applied into
the reconfigured (fully-mediated) PLS model. All the indicators of the moderator and
corresponding predictor variable were multiplied to calculate the indicators measuring the
interaction effect. These sets of indicators were then inserted into the reconfigured PLS
model as an independent variable in order to calculate the associated path coefficients.
312
Consistent with the regression analysis on the moderating effects, the “mean-center
indicator values” option was selected for interaction effect term generation before
multiplication.
In line with the previous regression analysis using MODPROBE (Hayes & Matthes, 2009),
the moderating impact of firm size (NOE) on the relationship between MV and PLSP was
fully supported by the findings in the model (β = 0.17; t = 2.23), lending support to H10b. In
addition, the moderating impact of NPD process rigidity (NPDR) between MV and PLSP
outcome was found to be nonsignificant but positive. This was very similar to the regression
result, thereby rejecting H9b. For H9a, a significant positive impact of NPDR was found
between MV and BLSP in the regression analysis. The model, however, indicates a
nonsignificant positive impact of NPDR.
As part of H8a and H8b, competitive intensity (CI) was the only dimension of the external
environment (EE) found in regression analysis that has a significant positive influence on
MV to BLSP/PLSP outcomes. In this regard, the result of the model for CI of H8a was not
significant but nonetheless indicating some influence close to one-tailed significance level
of 1.65 at 1.49. According to the model results for H8b, the hypothesised moderating
impacts of EE including CI, market turbulence and technological turbulence (MT and TT)
were all found to be negative, as proposed, but however not significant. The results of the
model and the regression analysis also reveal similar positive and negative non-significant
impacts of MT on MV and BLSP/PLSP outcomes. In addition to these findings, there were
some indications of direct relationships of NPDR and CI to PLSP, as well as firm size
(NOE) to BLSP; (β = 0.18; t = 2.52 and β = -0.16; t = 2.28) and (β = -0.24; t = 3.30)
accordingly. In this regard, the findings of NPDR and NOE and their possible direct effects
on PLSP and BLSP are consistent with the previous regression results.
The summary of the hypothesised moderator results is shown in Table 5.17.

313
Table 5.17: Summary of Moderating Effects Results (Fully-Mediated Model)
Hypothesis RelationshipPath Coefficient
(β)(t-value) Results
H8a MV BLSP moderated
by CI, TT, and MT (-)
0.26, -0.14, 0.06 1.49, 0.76, 0.46 (n.s.) Not supported
H8b MV PLSP moderated
by CI, TT, and MT (-)
-0.06, -0.05, -0.02 0.49, 0.55, 0.23 (n.s.) Not supported
H9a MV BLSP moderated
by NPDR (-)
0.04 0.29 (n.s.) Not supported
H9b MV PLSP moderated
by NPDR (-)
0.06 0.53 (n.s.) Not supported
H10a MV BLSP moderated
by Firm Size (NOE) (+)
-0.07 0.76 (n.s.) Not supported
H10b MV PLSP moderated
by Firm Size (NOE) (+)
0.17* 2.23 Supported
N = 179; Bootstrap with 500 repetitions; n.s. = not significant.
*** t-values > 3.29 are significant at the 0.001 level** t-values > 2.58 are significant at the 0.01 level* t-values > 1.96 are significant at the 0.05 level

314
5.10 Overview of Chapter 5 Findings
This chapter presented the results of regression analyses and structural equation modelling
in examining the research propositions and hypotheses in the conceptual model derived
from the literature review. The analysis of the structural model indicates a good model fit
between the data and the conceptual model. The results from both the regression and
structural model analyses have leaned support to the majority of the research hypotheses. A
number of findings are identified as follows:
i. Absorptive capacity
Absorptive capacity overall and its subsets of potential and realised absorptive capacities
have a significant and positive impact on market visioning competence in the regression
analysis. In a more complex setting (structural model), only realised absorptive capacity has
a significant and positive impact on market visioning competence. This particularly
highlights the importance of the transformation and exploitation of knowledge and its
significant impact on the ability of individuals or NPD teams to link new idea or
technologies to future market opportunities.
ii. Market visioning competence and market vision
In both regression and structural model analyses, market visioning competence has a
significant and positive impact on market vision, that is, the knowledge, insight and
foresight of a radically new or really new product.
iii. Performance consequence of market vision
The results indicate that market vision has a significant and positive impact on both before-
launch stage performance and post-launch stage performance. This suggests that having a
clear and specific market vision can be translated into improved performance in terms of
achieving breakthrough integrity, early success with customers, speed-to-market and
windows of opportunity. The results also indicate that market vision has a greater impact on
post-launch stage performance than on before-launch stage performance.
Form is the dimension of market vision that most influences breakthrough integrity and
early success with customers. An NPD team’s time spent discussing end-user interactions

315
with a breakthrough innovation is a key aspect for firms trying to maintain the breakthrough
integrity of the product and not to “dumbing down” a highly innovative concept (that better
meet the needs of early customers). Scope, however, appears to have an adverse influence
on the likelihood of achieving breakthrough integrity in particular. At the front end of
innovation, a focus of an NPD team on the most profitable, the most important and/or the
largest target market (scope) can impede a breakthrough idea, and thus, losing its
innovativeness. To a lesser extent, scope was also found to negatively impact on early
success with customers and windows of opportunity. In addition to this, the impact of clarity
appears to be significant and positive only on post-launch stage performance. Firms need to
be able to deal with the uncertainty and to recognise that clarity is a luxury for breakthrough
innovation in terms of speeding up the NPD process and opening windows of opportunity.
iv. Market-driving innovation performance
The relationships among market-driving innovation performance constructs exist in both
regression and structural model analysis. Before-launch stage performance significantly and
positively influences post-launch stage performance, and both of these constructs
significantly and positively influence financial performance. Specifically, the results also
indicate that post-launch stage performance has more impact on financial performance than
before-launch stage performance does.
v. Moderation effects
The results from the path model indicate firm size (number of employee) as the only
moderator, and more specifically, on the relationship between market vision and post-launch
stage performance. The regression analysis shows that NPD process rigidity and
competitive intensity moderate the relationship between market vision and before-launch
stage performance. Adding to this, competitive intensity also influences the relationship
between market vision and post-launch stage performance. Overall, the findings on the
proposed moderating effects suggest that moderators have less effect in a complex setting
(structural model).
316
vi. Additional analysis on the fully-mediated model revealed the following results:
Potential absorptive capacity and realised absorptive capacity have a significant
and positive impact on market vision. This may have a significant impact on the
interpretation of the findings.
Potential absorptive capacity has a significant and positive impact on realised
absorptive capacity. This supports their complementary roles as subsets of
absorptive capacity.
Market visioning competence has a significant and positive impact on both
before-launch stage and post-launch stage performance outcomes, suggesting
market vision is a partial mediator. The model estimations overall indicate that
the best way to account for the outcomes is by considering market vision as a
mediating variable.
vii. Possible direct relationships in the regression and structural model analyses:
There was some indication of a direct, positive relationship of NPD process
rigidity (formality) to post-launch stage performance. This may suggest that the
formality of the NPD process can speed up the process of developing
breakthrough innovation into the market and ultimately open a new market or
product/technological arena.
A direct, negative relationship of firm size to before-launch stage performance
was also indicated. The results indicate that large firms may not do as well as
small firms in maintaining the highly innovative product concept from the front
end of the development process and through to launch (the breakthrough
integrity), and may have difficulties in satisfying early customers. Thus,
absorptive capacity, market visioning competence and its resultant market vision
can be key instruments to successful breakthrough innovation.
The next chapter concludes the thesis with a discussion of key findings and the implications
of the research.
317
CHAPTER 6: CONCLUSIONS AND IMPLICATIONS
6.1 Introduction
The research addresses the main research question:
To what extent does a firm’s absorptive capacity, market visioningcompetence and its resultant market vision influence the firm’s success atdeveloping market-driving innovations?
The concept of market visioning competence (MVC) and its resultant market vision (MV)
(Reid & de Brentani, 2010) have emerged as instrumental in ensuring that market-driving
innovations are able to make it out of the front end of innovation through to development
and into commercialisation, without losing their innovativeness or breakthrough integrity.
The findings in this study are not exact replications of the original work on MVC and MV.
This study adds more insight around the importance of MVC/MV concept by:
Extending the concept from a project level analysis to a program level analysis
Examining both radical and really new “market-driving” innovations, across different
industries and not limited to radically new, high-tech products
Exploring the importance of the concept in different research context (i.e. using
sample from a developing country – Thailand)
Being the first empirical study to propose absorptive capacity (ACAP) as an important
organisational level antecedent to MVC/MV.
The preceding Chapter 5 presented the results of the empirical findings and the associated
discussion around the hypothesised relationships, and culminated in the analysis of the
various relationships through the use of partial least square structural equation model (PLS-
SEM). All the results were found to support most of the proposed hypotheses. Additional
analysis results were also presented.
This final chapter presents the key issues and main conclusions of the study relating to each
of the hypotheses and the additional analysis results. The implications of the study, both
theoretical and managerial, are discussed. The chapter concludes with an acknowledgement
of the limitations of the present study and recommendations for future research.
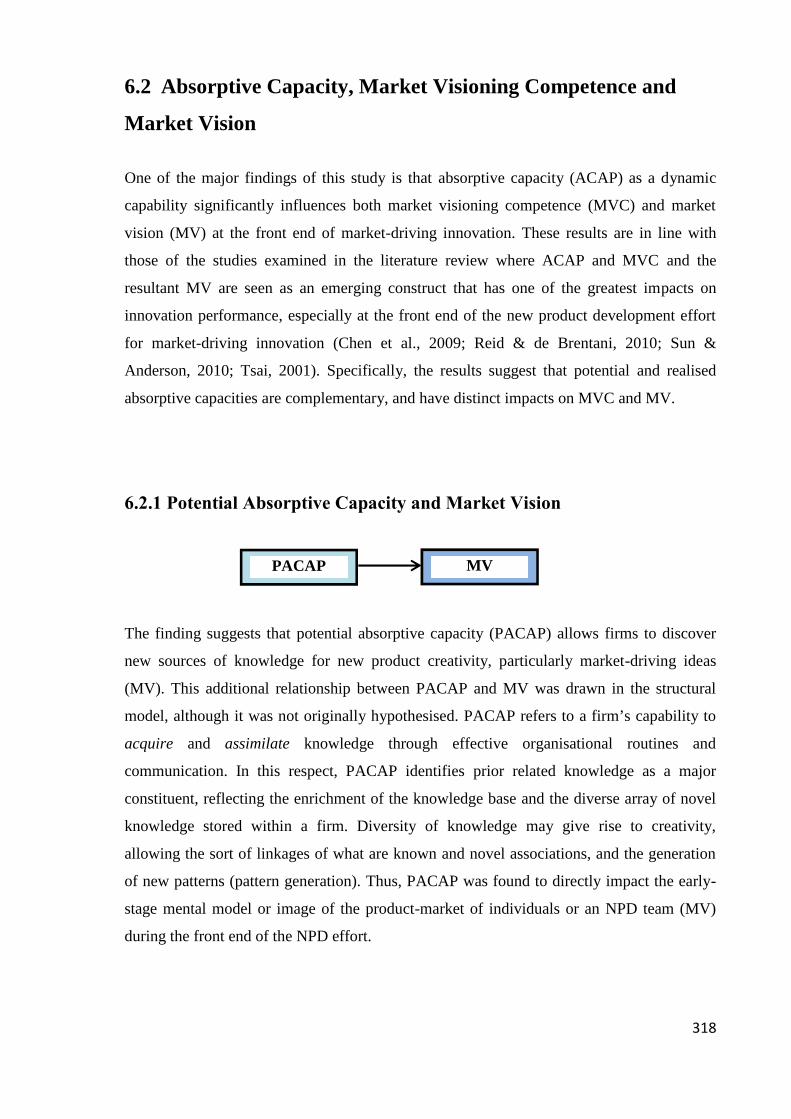
318
6.2 Absorptive Capacity, Market Visioning Competence and
Market Vision
One of the major findings of this study is that absorptive capacity (ACAP) as a dynamic
capability significantly influences both market visioning competence (MVC) and market
vision (MV) at the front end of market-driving innovation. These results are in line with
those of the studies examined in the literature review where ACAP and MVC and the
resultant MV are seen as an emerging construct that has one of the greatest impacts on
innovation performance, especially at the front end of the new product development effort
for market-driving innovation (Chen et al., 2009; Reid & de Brentani, 2010; Sun &
Anderson, 2010; Tsai, 2001). Specifically, the results suggest that potential and realised
absorptive capacities are complementary, and have distinct impacts on MVC and MV.
6.2.1 Potential Absorptive Capacity and Market Vision
The finding suggests that potential absorptive capacity (PACAP) allows firms to discover
new sources of knowledge for new product creativity, particularly market-driving ideas
(MV). This additional relationship between PACAP and MV was drawn in the structural
model, although it was not originally hypothesised. PACAP refers to a firm’s capability to
acquire and assimilate knowledge through effective organisational routines and
communication. In this respect, PACAP identifies prior related knowledge as a major
constituent, reflecting the enrichment of the knowledge base and the diverse array of novel
knowledge stored within a firm. Diversity of knowledge may give rise to creativity,
allowing the sort of linkages of what are known and novel associations, and the generation
of new patterns (pattern generation). Thus, PACAP was found to directly impact the early-
stage mental model or image of the product-market of individuals or an NPD team (MV)
during the front end of the NPD effort.
PACAP MV
319
Several recent studies support the general concept of PACAP that diversity of knowledge is
a source of new product creativity, particularly for market driving innovation (e.g. Kim, Im
& Slater, 2013; O'Connor & Rice, 2013b). Kim et al. (2013), for instance, found that high
complexity of knowledge (volume of knowledge and diversity) increases both the novelty
and the meaningfulness of a new product, that is, the degree of its originality and
uniqueness, as well as its appropriateness and usefulness. A firm’s deeply and diversely
embedded technological and market information stock can provide great potential for
generating “outside-the-box” new product ideas and latent knowledge that enhance the
innovative outcome. O'Connor and Rice (2013b) argued that breakthrough innovation with
its inherent ambiguity and uncertainty requires more intuitive and divergent thinking and a
focus on opportunity and market creation, as opposed to analytical thinking and execution.
Specifically, the knowledge acquisition/assimilation dimensions of PACAP are highlighted
in recent studies on market-driving innovation. Ritala and Hurmelinna-Laukkanen (2013)
concentrated on PACAP and suggested that having a large knowledge base with a rival can
be beneficial for firms acquiring new knowledge for NPD and radical innovation. However,
this happens only if the firm’s core of knowledge is sufficiently protected to allow safe
knowledge exchange. Bao, Chen, and Zhou (2012) suggested that a firm’s acquisition,
processing and integration of external knowledge, particularly external technical knowledge,
increase the chance of radical innovation by fostering a novel integration of diversity and
complementary knowledge resources. In addition, a recent study by Ahmad, Mallick, and
Schroeder (2013) highlighted the importance of knowledge assimilation that team
integration is essential for improved product development, especially for highly innovative
products. In a similar vein, Lamore et al. (2013) study on proactive market orientation found
evidence that a high degree of collaboration between marketing and R&D departments is
required for firms to uncover creative solutions to latent customer needs or future market
needs.
Overall, the significant and positive impact of potential absorptive capacity on market vision
makes sense, and is consistent with the findings in recent literature. However, a high
potential absorptive capacity does not imply that a firm has the capability to transform and
exploit the knowledge for profit generation. In line with Zahra and George (2002)
conceptualisation of ACAP subsets, the impact of realised absorptive capacity on market
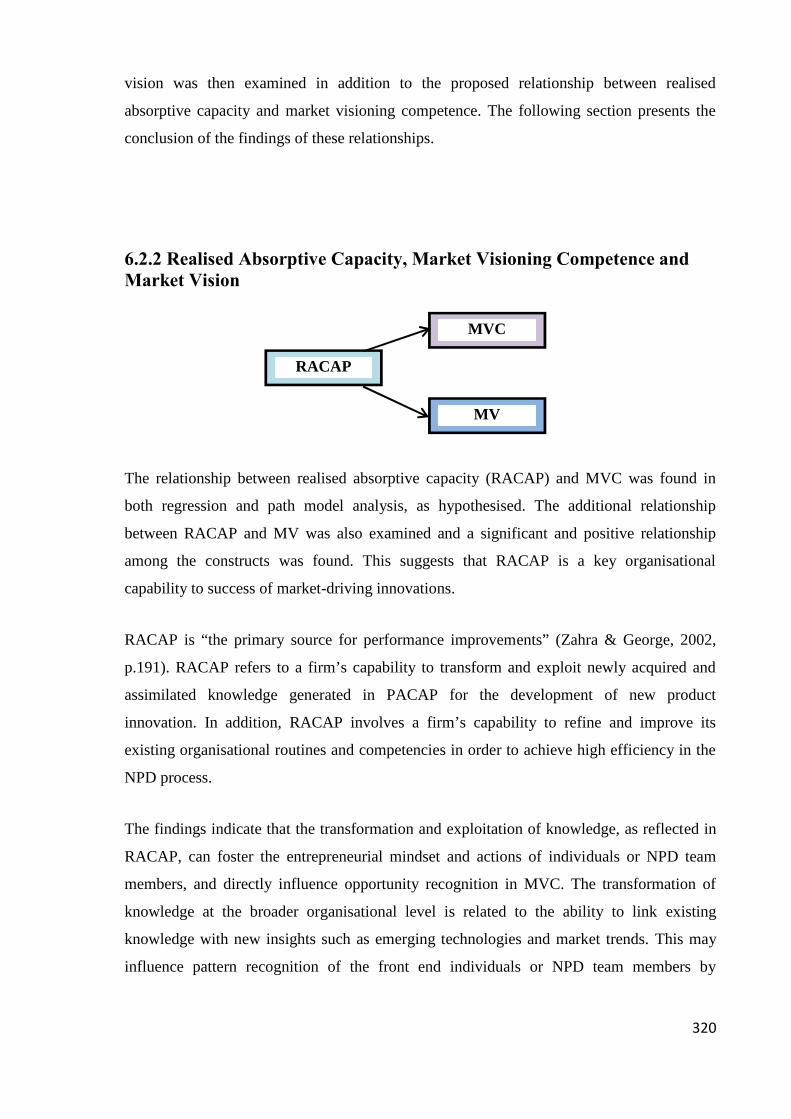
320
vision was then examined in addition to the proposed relationship between realised
absorptive capacity and market visioning competence. The following section presents the
conclusion of the findings of these relationships.
6.2.2 Realised Absorptive Capacity, Market Visioning Competence andMarket Vision
The relationship between realised absorptive capacity (RACAP) and MVC was found in
both regression and path model analysis, as hypothesised. The additional relationship
between RACAP and MV was also examined and a significant and positive relationship
among the constructs was found. This suggests that RACAP is a key organisational
capability to success of market-driving innovations.
RACAP is “the primary source for performance improvements” (Zahra & George, 2002,
p.191). RACAP refers to a firm’s capability to transform and exploit newly acquired and
assimilated knowledge generated in PACAP for the development of new product
innovation. In addition, RACAP involves a firm’s capability to refine and improve its
existing organisational routines and competencies in order to achieve high efficiency in the
NPD process.
The findings indicate that the transformation and exploitation of knowledge, as reflected in
RACAP, can foster the entrepreneurial mindset and actions of individuals or NPD team
members, and directly influence opportunity recognition in MVC. The transformation of
knowledge at the broader organisational level is related to the ability to link existing
knowledge with new insights such as emerging technologies and market trends. This may
influence pattern recognition of the front end individuals or NPD team members by
RACAP
MV
MVC

321
matching new insights to patterns previously generated and schemas already stored in
memory, and thus enable them to discover solutions to additional or unarticulated needs of
the customers (MVC). This transformed knowledge is exploited to generate the new
initiatives and knowledge that are essential for creating a market vision of radically new or
really new product (MV). Recent research supports the finding that knowledge accumulated
at different levels of organisational memory may stimulate creative minds and allow
individuals to discover promising market opportunities (Kim et al., 2013). RACAP,
therefore, provide a strong foundation for firms to generate new sources of competitive
advantage.
322
6.2.3 Section Conclusion
In summary, absorptive capacity overall enables firms to capitalise on changing
environmental conditions and strategic changes by leveraging organisational resources and
capabilities for new product exploration, particularly knowledge inflow into market vision.
The findings provide empirical support for one of the fundamental theoretical assumptions
of absorptive capacity – that innovation benefit can be derived from new external
knowledge, especially when the value of this knowledge is recognised, internalised and
exploited for a commercial purpose (Cohen & Levinthal, 1990; Zahra & George, 2002).
The relationships between absorptive capacity, market visioning competence and market
vision constructs are important given that they constitute firm’s dynamic capabilities.
Focusing on these capabilities can increase the chance of market-driving ideas emerging
from the front end of innovation and into the development process, while reducing the
inherent ambiguity and uncertainty involved. Lacking absorptive capacity, market visioning
competence and market vision, firms may fall into competence traps and not recognise the
opportunities that new external knowledge offers (e.g. new or novel competitive technology
that has the potential to transform a market or an industry). In line with the theoretical
argument in the RBV and dynamic capability literature, the outcome of these capabilities
contributes to achieving a position of competitive advantage and superior performance
through new product development (Harvey et al., 2010; Kostopoulos et al., 2011; Reid & de
Brentani, 2010). O'Connor and Rice (2013a, p.16) stated:
Firms have an opportunity to reduce the uncertainties that radical innovation
project teams must confront by developing new project management
competencies and corporate level organizational structures and processes that
can support radical innovation activity. This is a process of learning and
accumulation of experience, knowledge, and wisdom. To benefit from the
accumulated learning, though, firms must make a long-term commitment to
developing this capability.

323
6.3 Market Visioning Competence and Market Vision
Market visioning competence (MVC) was found to be an essential element in creating an
effective market vision (MV). The observed strength between the two constructs was not
surprising. Whilst not a replication study, the results do somewhat extend the work of Reid
and de Brentani (2010). At the NPD project level analysis, Reid and de Brentani (2010)
have examined the concept of MVC and MV of radically new, high tech products of firms
in developed countries (North America and Europe). The analysis of the MVC/MV linked
in this research was conducted at the NPD program level and under market-driving
scenarios of both radically new and really new products across different industry contexts
and in a developing country. Certain modifications were therefore made to the original
MVC/MV items to reflect the program level analysis.
The final MVC items in this research predominantly reflect ‘proactive market learning’,
which captures the discovery of additional or unarticulated needs to incorporate these into
solutions in the form of new products. The individuals or NPD team members also use
several forecasting and market estimation techniques before making a final market
selection. In fact, the process underlying MVC is based on exploratory learning. Thus,
evidence has been found that MVC results in a market vision or a clear and specific early-
stage mental model or image of a product-market that enables an NPD team to grasp what it
is they are developing and for whom. The significance and positive impact of MVC on MV
appears support the earlier finding of Reid and de Brentani (2010) and broadens the general
knowledge of market visioning and the specific MVC/MV constructs in a different research
setting.
In a similar vein, recent research by O'Connor and Rice (2013b) found that market-driving
behaviour can be regarded as an opportunity to be engaged in the proactive managerial
practice which is essential to new market creation. This helps to explain the observed
relationship between proactive market learning (MVC) and MV as an early image of a
MVC MV
324
future product-market. Further, a recent study by Menguc, Auh, and Yannopoulos (2013)
has appeared to support the importance of market visioning (MVC/MV) as a new market
learning approach (in reverse), in their view regarding the voice of customers (VOC) in the
case of market-driving innovation. Menguc et al. (2013) findings on high-tech companies
suggested a strong harmful effect of too much customer involvement in new product design,
especially for radical innovations. Highly innovative products are inherently associated with
high market and technical uncertainty. It is difficult therefore to obtain early and reliable
input from customers during the front end of the development process. Collaboration with
customers may not be suitable or must be well managed in the case of radical innovation. It
must be noted, however, that Mengue et al.’s study (2013) did not have separate categories
of regular users and lead users in their sample. According to findings in the literature
review, lead users can help to explore unarticulated needs and might be a source for market-
driving ideas (Lilien et al., 2002; von Hippel, Thomke & Sonnack, 2000).
In addition, a recent PDMA comparative performance assessment by Markham and Lee
(2013a) highlighted the need for firms to focus more on exploring the unarticulated needs of
customers in order to determine future market needs. Consistent with the finding in this
study, this appears to indicate that proactive market learning (MVC) is particularly critical
to market vision at the front end of breakthrough innovation. Further, Markham and Lee’s
study (2013a) showed that assessing the unarticulated (unstated) needs of existing customers
and potential customers is done least frequently (41.5%) at the front end of innovation,
while assessing the articulated (stated) needs of existing customers is done most frequently
(66%) at that stage. This finding on the assessment of articulated needs also indicates why
the development of incremental innovation is still practised by the majority of firms, despite
the agreement of scholars and business leaders on the importance of breakthrough
innovation to a company’s long-term growth and renewal.
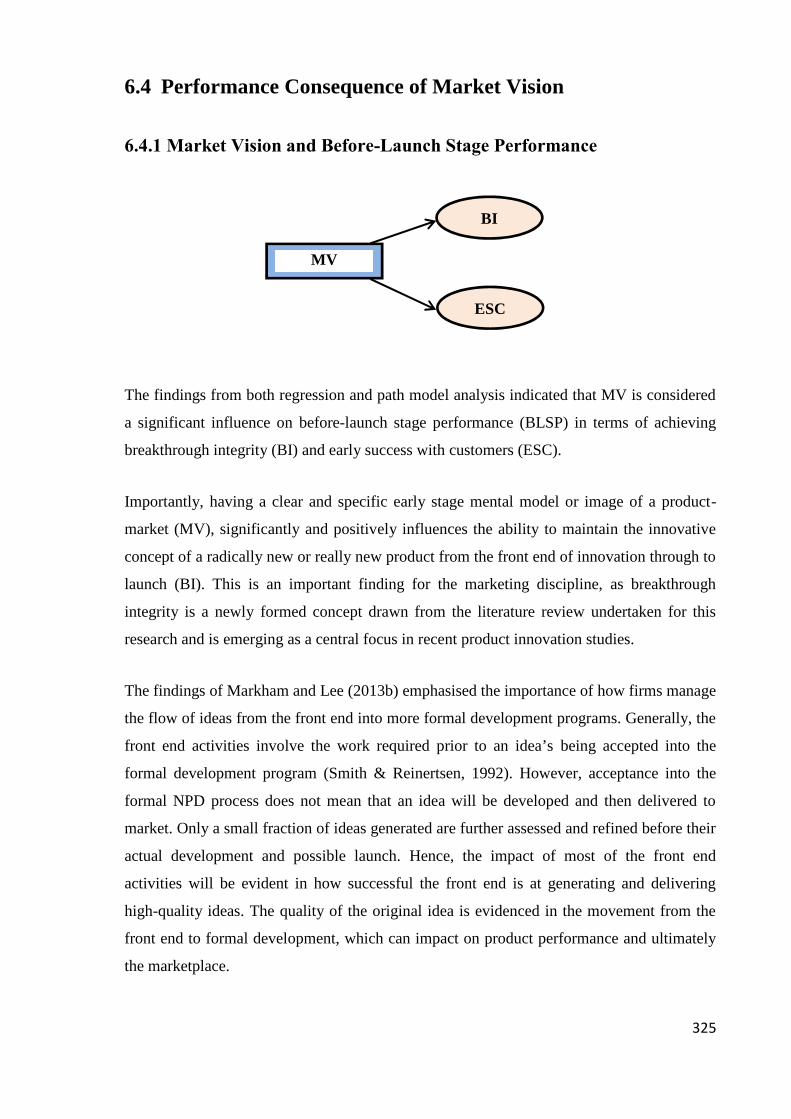
325
6.4 Performance Consequence of Market Vision
6.4.1 Market Vision and Before-Launch Stage Performance
The findings from both regression and path model analysis indicated that MV is considered
a significant influence on before-launch stage performance (BLSP) in terms of achieving
breakthrough integrity (BI) and early success with customers (ESC).
Importantly, having a clear and specific early stage mental model or image of a product-
market (MV), significantly and positively influences the ability to maintain the innovative
concept of a radically new or really new product from the front end of innovation through to
launch (BI). This is an important finding for the marketing discipline, as breakthrough
integrity is a newly formed concept drawn from the literature review undertaken for this
research and is emerging as a central focus in recent product innovation studies.
The findings of Markham and Lee (2013b) emphasised the importance of how firms manage
the flow of ideas from the front end into more formal development programs. Generally, the
front end activities involve the work required prior to an idea’s being accepted into the
formal development program (Smith & Reinertsen, 1992). However, acceptance into the
formal NPD process does not mean that an idea will be developed and then delivered to
market. Only a small fraction of ideas generated are further assessed and refined before their
actual development and possible launch. Hence, the impact of most of the front end
activities will be evident in how successful the front end is at generating and delivering
high-quality ideas. The quality of the original idea is evidenced in the movement from the
front end to formal development, which can impact on product performance and ultimately
the marketplace.
MV
BI
ESC
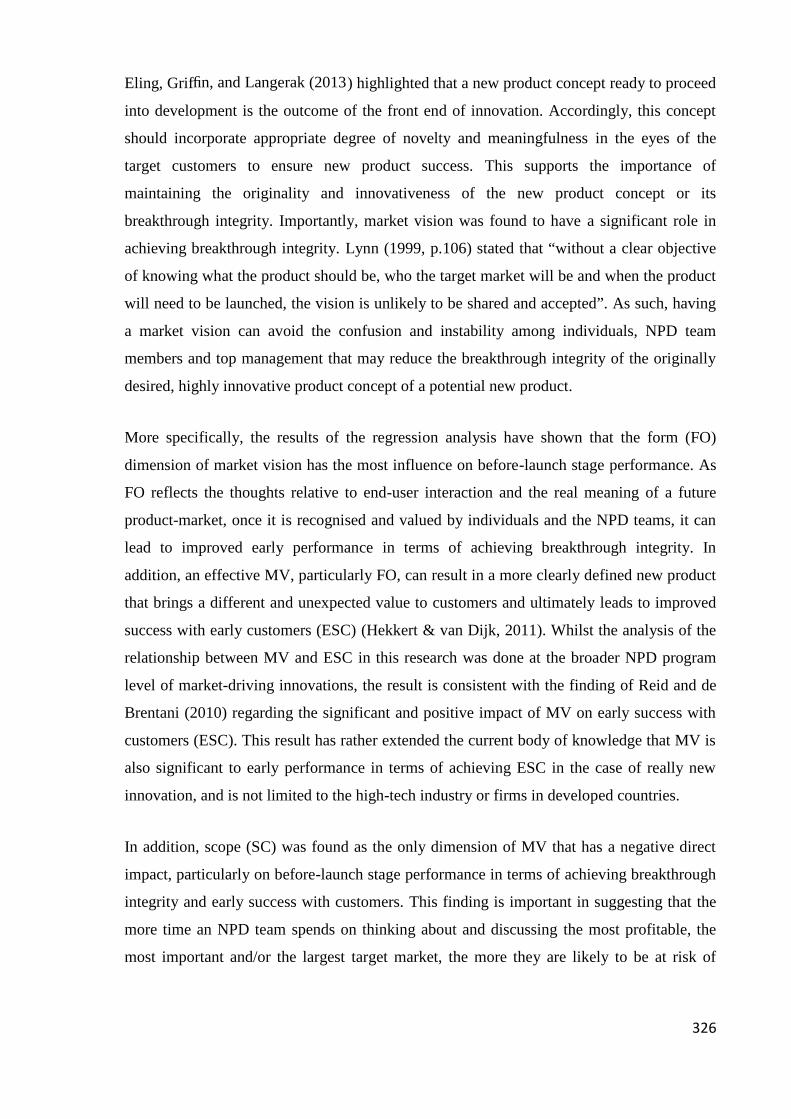
326
Eling, Griffin, and Langerak (2013) highlighted that a new product concept ready to proceed
into development is the outcome of the front end of innovation. Accordingly, this concept
should incorporate appropriate degree of novelty and meaningfulness in the eyes of the
target customers to ensure new product success. This supports the importance of
maintaining the originality and innovativeness of the new product concept or its
breakthrough integrity. Importantly, market vision was found to have a significant role in
achieving breakthrough integrity. Lynn (1999, p.106) stated that “without a clear objective
of knowing what the product should be, who the target market will be and when the product
will need to be launched, the vision is unlikely to be shared and accepted”. As such, having
a market vision can avoid the confusion and instability among individuals, NPD team
members and top management that may reduce the breakthrough integrity of the originally
desired, highly innovative product concept of a potential new product.
More specifically, the results of the regression analysis have shown that the form (FO)
dimension of market vision has the most influence on before-launch stage performance. As
FO reflects the thoughts relative to end-user interaction and the real meaning of a future
product-market, once it is recognised and valued by individuals and the NPD teams, it can
lead to improved early performance in terms of achieving breakthrough integrity. In
addition, an effective MV, particularly FO, can result in a more clearly defined new product
that brings a different and unexpected value to customers and ultimately leads to improved
success with early customers (ESC) (Hekkert & van Dijk, 2011). Whilst the analysis of the
relationship between MV and ESC in this research was done at the broader NPD program
level of market-driving innovations, the result is consistent with the finding of Reid and de
Brentani (2010) regarding the significant and positive impact of MV on early success with
customers (ESC). This result has rather extended the current body of knowledge that MV is
also significant to early performance in terms of achieving ESC in the case of really new
innovation, and is not limited to the high-tech industry or firms in developed countries.
In addition, scope (SC) was found as the only dimension of MV that has a negative direct
impact, particularly on before-launch stage performance in terms of achieving breakthrough
integrity and early success with customers. This finding is important in suggesting that the
more time an NPD team spends on thinking about and discussing the most profitable, the
most important and/or the largest target market, the more they are likely to be at risk of

327
losing breakthrough integrity of a future product-market and may shift the focus away from
delivering unique benefits to potential customers. This study adds to the current literature
relative to scope in supporting that assessments of market size and market potential should
be less of a concern during the front end of market-driving innovation (e.g. Christensen,
1997; O'Connor, 1998).
In fact, the questions about the target market reflected in SC may be more appropriate to a
known market condition of an incremental, evolutionary nature (McCarthy et al., 2006;
Phillips et al., 2006). In an incremental innovation scenario, early market-related questions
can primarily be based on an inward-looking perspective by referring to a question of “how
valuable the market is to the firm in terms of size, potential and growth” (O'Connor, 1998,
p.162). This seems to relate to SC in the way of asking “what would be the most profitable,
largest and most important target market for the breakthrough innovations?” (Reid & de
Brentani, 2010). In contrast, the market-related questions for breakthrough innovations
merely lean towards an outward-looking perspective by referring to “the degree to which the
market will value the offering” (O'Connor, 1998, p.162), which in this case, the right
market-related question regarding SC should probably be “who of the target market will
value and benefit the most from the breakthrough innovation”. Really new innovation or
market breakthrough by definition will “develop” a latent market, that is, one that does not
currently exist or which is only just emerging.
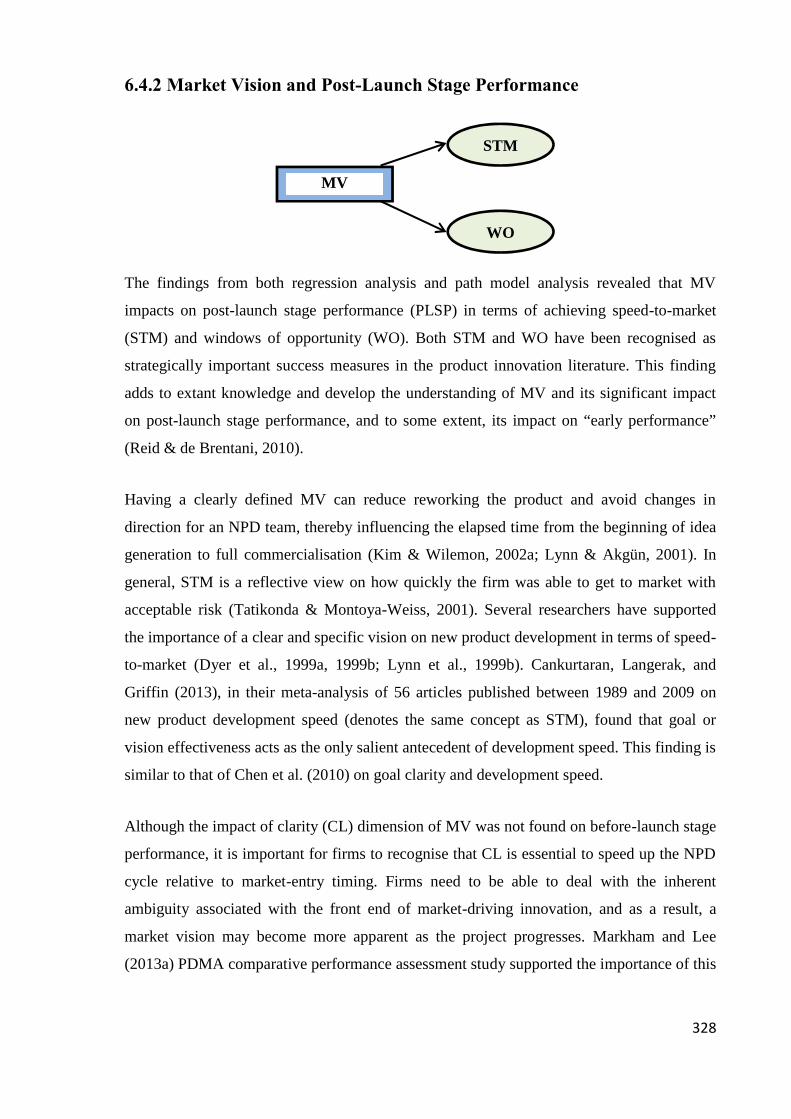
328
6.4.2 Market Vision and Post-Launch Stage Performance
The findings from both regression analysis and path model analysis revealed that MV
impacts on post-launch stage performance (PLSP) in terms of achieving speed-to-market
(STM) and windows of opportunity (WO). Both STM and WO have been recognised as
strategically important success measures in the product innovation literature. This finding
adds to extant knowledge and develop the understanding of MV and its significant impact
on post-launch stage performance, and to some extent, its impact on “early performance”
(Reid & de Brentani, 2010).
Having a clearly defined MV can reduce reworking the product and avoid changes in
direction for an NPD team, thereby influencing the elapsed time from the beginning of idea
generation to full commercialisation (Kim & Wilemon, 2002a; Lynn & Akgün, 2001). In
general, STM is a reflective view on how quickly the firm was able to get to market with
acceptable risk (Tatikonda & Montoya-Weiss, 2001). Several researchers have supported
the importance of a clear and specific vision on new product development in terms of speed-
to-market (Dyer et al., 1999a, 1999b; Lynn et al., 1999b). Cankurtaran, Langerak, and
Griffin (2013), in their meta-analysis of 56 articles published between 1989 and 2009 on
new product development speed (denotes the same concept as STM), found that goal or
vision effectiveness acts as the only salient antecedent of development speed. This finding is
similar to that of Chen et al. (2010) on goal clarity and development speed.
Although the impact of clarity (CL) dimension of MV was not found on before-launch stage
performance, it is important for firms to recognise that CL is essential to speed up the NPD
cycle relative to market-entry timing. Firms need to be able to deal with the inherent
ambiguity associated with the front end of market-driving innovation, and as a result, a
market vision may become more apparent as the project progresses. Markham and Lee
(2013a) PDMA comparative performance assessment study supported the importance of this
MV
STM
WO
329
finding and highlighted that “it is important to understand why goal clarity and relationship
to SBU strategy actually decreased in 2012 when they are so strongly related to
performance” (p. 421).
Moreover, the result suggests that the MV of a future product-market can drive firms to take
advantage of pioneering windows of opportunity (WO). Discovering a product’s true
meaning through effective MV leads to a clearly defined new product that is likely to fulfil
customers’ latent or unarticulated needs which they may be unable to explicate to the firm
(Slater & Narver, 2000), thereby driving the firm into new product, technological or market
arenas (Hills & Sarin, 2003; Kleinschmidt et al., 2007). This finding is consistent with the
study by Kleinschmidt et al. (2007), who found a significant positive impact of homework
activities (clearly defined new product definition) on windows of opportunity. Overall
findings in this section add to the current literature in supporting the importance of
goal/vision (MV) on speed-to-market and windows of opportunity, particularly in the case
of market-driving innovation.
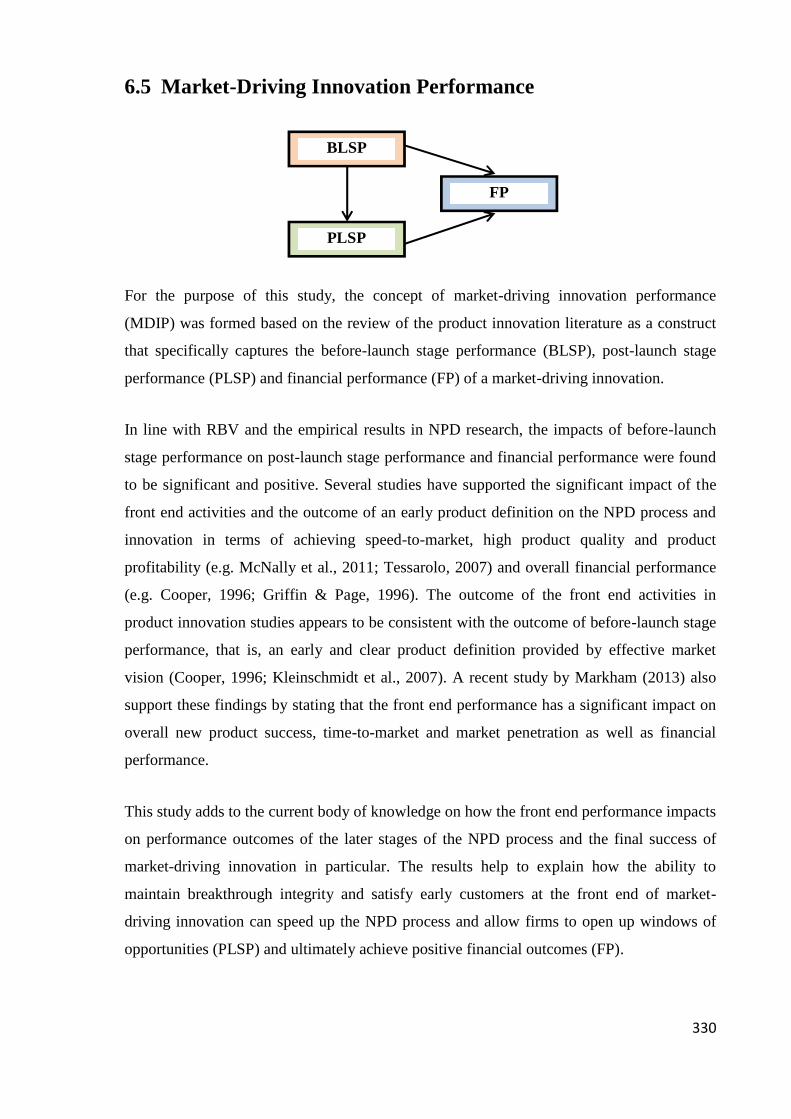
330
6.5 Market-Driving Innovation Performance
For the purpose of this study, the concept of market-driving innovation performance
(MDIP) was formed based on the review of the product innovation literature as a construct
that specifically captures the before-launch stage performance (BLSP), post-launch stage
performance (PLSP) and financial performance (FP) of a market-driving innovation.
In line with RBV and the empirical results in NPD research, the impacts of before-launch
stage performance on post-launch stage performance and financial performance were found
to be significant and positive. Several studies have supported the significant impact of the
front end activities and the outcome of an early product definition on the NPD process and
innovation in terms of achieving speed-to-market, high product quality and product
profitability (e.g. McNally et al., 2011; Tessarolo, 2007) and overall financial performance
(e.g. Cooper, 1996; Griffin & Page, 1996). The outcome of the front end activities in
product innovation studies appears to be consistent with the outcome of before-launch stage
performance, that is, an early and clear product definition provided by effective market
vision (Cooper, 1996; Kleinschmidt et al., 2007). A recent study by Markham (2013) also
support these findings by stating that the front end performance has a significant impact on
overall new product success, time-to-market and market penetration as well as financial
performance.
This study adds to the current body of knowledge on how the front end performance impacts
on performance outcomes of the later stages of the NPD process and the final success of
market-driving innovation in particular. The results help to explain how the ability to
maintain breakthrough integrity and satisfy early customers at the front end of market-
driving innovation can speed up the NPD process and allow firms to open up windows of
opportunities (PLSP) and ultimately achieve positive financial outcomes (FP).
BLSP
PLSP
FP
331
In addition to these findings, post-launch stage performance (STM/WO) was found to have
greater impact on financial performance than before-launch stage performance (BI/ESC)
did. This appears to make sense because the ability to move breakthrough innovations
quickly through to full commercialisation (STM) allows a firm to beginning to obtain its
financial returns and benefits from the resources invested in developing such products. The
aspects of windows of opportunity (WO), which captured in market-driving innovation
(entering into a new market or new product/technological domains), have also been
regarded as a key to achieve long-term product advantage and superior financial
performance (e.g. de Brentani et al., 2010; Henard & Szymanski, 2001; Kleinschmidt et al.,
2007). This result further adds to the overall understanding of the importance of market-
driving innovation and the influence of strategic performance outcomes on financial
performance.

332
6.6 The Mediating Role of Market Vision
Additional relationships were considered in the fully-mediated path analysis model to
examine the relationships between market visioning competence (MVC) and before-launch
stage performance (BLSP) and between MVC and post-launch stage performance (PLSP).
The findings indicate a significant and positive impact of MVC on BLSP/PLSP in terms of
achieving breakthrough integrity, early success with customers, speed-to-market and
windows of opportunity. These findings also suggest that MV is a partial mediator.
The findings of MVC/MV and its relationship with BLSP and PLSP add to the current body
of knowledge on understanding the process of “visioning” or “market visioning” (O'Connor,
1998; Rangan & Bartus, 1995), and to some extent, extending the study of Reid and de
Brentani (2010). At the NPD project level, the original MVC construct developed by Reid
and de Brentani (2010) captured idea driving, networking, proactive market orientation and
market learning tools dimensions. Their study has also indicated that MVC has an influence
on the ability of a firm to attract capital in terms of gaining the attention of financiers or
AAC but not on the ability to achieve early success with customers (ESC) (Reid & de
Brentani, 2010). However, the analysis of MVC construct in this study was conducted at the
NPD program level where the original MVC items were modified accordingly. This study
has also considered the influences of MVC on other performance dimensions apart from
AAC. The findings of MVC in this study demonstrate that excelling in ‘proactive market
learning’ (PML) competencies is important because they help to discover additional needs
of customers and identify several potential future markets for a given idea or technology,
thereby influencing the ability of a firm to achieve breakthrough integrity (BI), speed-to-
market (STM) and windows of opportunity (WO). This can excite individuals or NPD teams
to take on the original idea/technology through to the development and speed up the NPD
BLSP
PLSP
MVMVC
333
process in order to get to the market quickly and take advantage of the pioneering
opportunities.
Adding to this, it must be noted that the influence of MVC on ESC was found in this study.
This is in contrast to the finding of Reid and de Brentani (2010) previously stated; MV was
considered a full mediator of the relationship between MVC and ESC. The finding of the
influence of MVC on ESC in this study was, nonetheless, expected given that the MVC
construct and the related questions posted in the questionnaire of this study were revised to
capture NPD program level capabilities and influences rather than following the work of
Reid and de Brentani (2010) on MVC project level analysis. One might expect some
differences in the results when examining a construct at a different level of analysis and
particularly in the way that NPD program level capabilities (i.e. MVC) might directly
influence program level measures of performance (i.e., program level BLSP and PLSP
outcomes). Despite these findings, the overall model results indicated that the best way to
account for before-launch stage and post-launch stage performance outcomes is by
considering market vision as a mediating variable.

334
6.7 Moderation Effects
6.7.1 External Environment
The external environment (EE) was identified in the literature as an appropriate moderator
of the effectiveness of different strategic choices or orientations in new product
development (e.g. Jaworski & Kohli, 1993; Zhang & Duan, 2010). The construct captures
three external environmental factors: (1) competitive intensity (CI), (2) technological
turbulence (TT) and (3) market turbulence (MT). Accordingly, it was proposed that these
factors would negatively influence the relationships between market vision (MV) and
before-launch stage performance (BLSP) and between MV and post-launch stage
performance (PLSP).
In the regression analysis, competitive intensity was the only moderator found to
significantly and positively influence the relationships between MV and BLSP and between
MV and PLSP. This result may highlight that the value of a clearly defined MV in attaining
performance outcomes – high intensity may be navigated if a clear MV is in place. In a
more complex setting, the results of the path model however suggest that none of the
external moderating factors (CI, TT and MT) influence the proposed relationships between
MV and BLSP/PLSP. These findings indicate that MV is an important determinant of both
before-launch stage and post-launch stage performance, regardless of the market turbulence
or technological turbulence and the competitive intensity of the environment in which it
operates. The findings of the path model are consistent with the study by Reid and de
Brentani (2010) that MV is critical to the early performance of market-driving innovations.
BLSP
PLSP
MV
EE (CI, TT, MT)
335
One possible reason for the nonsignificant result of CI, TT and MT might also be that a
firm’s innovative efforts, particularly on market-driving innovations, should not be
disrupted by immediate changes in market demand or technologies or by competitive
situations. The nonsignificant influence of competitive intensity is in line with previous
empirical investigations on the moderating influence of the external environment on market
orientation. Jaworski and Kohli (1993) and Slater and Narver (1994) found no empirical
evidence of competitive intensity as a moderating influence on market orientation. Recent
research by Lamore et al. (2013) supported the insignificant influence of competitive
intensity on the relationship between proactive market orientation and marketing-R&D
integration. Their study explained that “market conditions with a high level of competitive
intensity are not necessarily an atmosphere conducive to fostering resource- and time-
consuming endeavors into discovering future customer needs” (p. 709).
From this result, which is in line with prior research, it may be concluded in this study that
the external competitive environment does not have a significant moderating influence on
the relationship between market vision and before-launch stage performance and between
market vision and post-launch stage performance of market-driving innovation.
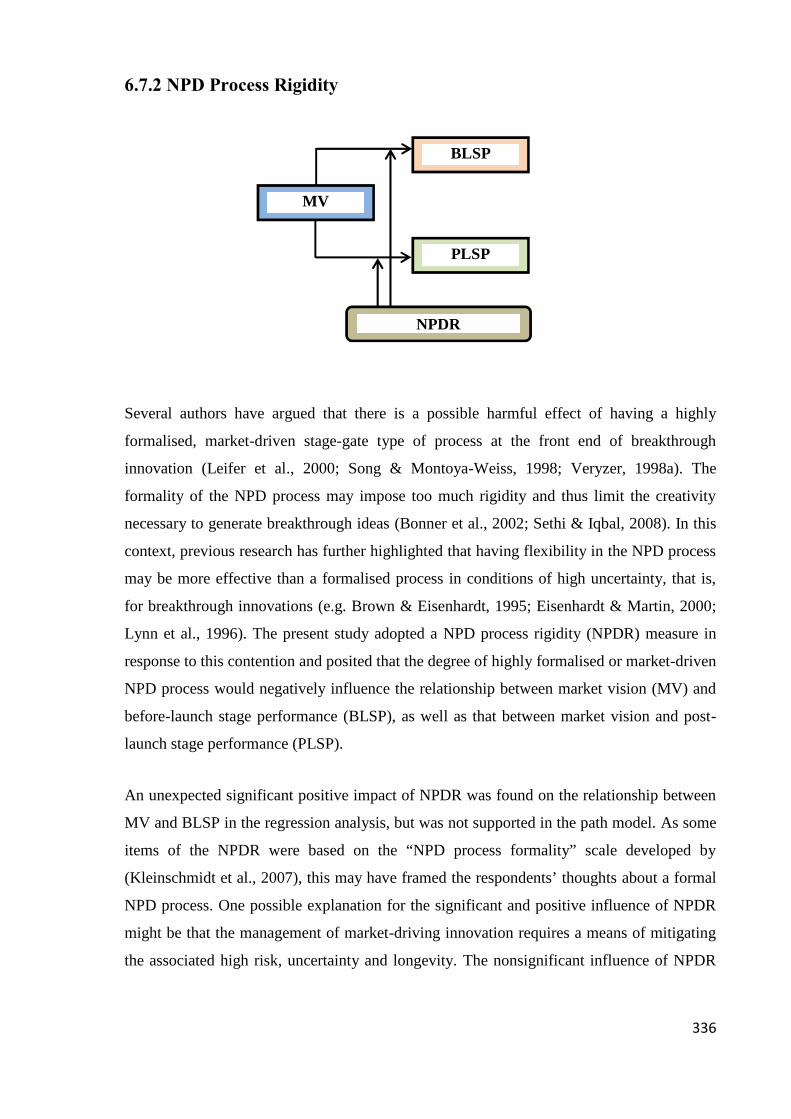
336
6.7.2 NPD Process Rigidity
Several authors have argued that there is a possible harmful effect of having a highly
formalised, market-driven stage-gate type of process at the front end of breakthrough
innovation (Leifer et al., 2000; Song & Montoya-Weiss, 1998; Veryzer, 1998a). The
formality of the NPD process may impose too much rigidity and thus limit the creativity
necessary to generate breakthrough ideas (Bonner et al., 2002; Sethi & Iqbal, 2008). In this
context, previous research has further highlighted that having flexibility in the NPD process
may be more effective than a formalised process in conditions of high uncertainty, that is,
for breakthrough innovations (e.g. Brown & Eisenhardt, 1995; Eisenhardt & Martin, 2000;
Lynn et al., 1996). The present study adopted a NPD process rigidity (NPDR) measure in
response to this contention and posited that the degree of highly formalised or market-driven
NPD process would negatively influence the relationship between market vision (MV) and
before-launch stage performance (BLSP), as well as that between market vision and post-
launch stage performance (PLSP).
An unexpected significant positive impact of NPDR was found on the relationship between
MV and BLSP in the regression analysis, but was not supported in the path model. As some
items of the NPDR were based on the “NPD process formality” scale developed by
(Kleinschmidt et al., 2007), this may have framed the respondents’ thoughts about a formal
NPD process. One possible explanation for the significant and positive influence of NPDR
might be that the management of market-driving innovation requires a means of mitigating
the associated high risk, uncertainty and longevity. The nonsignificant influence of NPDR
BLSP
PLSP
MV
NPDR

337
in the path model, nonetheless, suggests MV as an important determinant of before-launch
stage performance. This may involve a balanced effect of NPDR, which would underlie its
nonsignificant influence. On one hand, having a formal process can significantly influence
front end success. On the other hand, a formal process may hamper a number of potential
ideas moving from the front end into formal NPD (Markham, 2013). Despite the
opportunity provided through a formal NPD process, it may have a negative influence in
terms of translating MV into before-launch stage performance.
Interestingly, the positive finding relative to NPDR from the regression analysis is in line
with recent studies supporting the importance of having a formal process to manage market-
driving innovations, particularly at the front end of the development process (e.g. Holahan
et al., 2014; Schultz, Salomo, de Brentani & Kleinschmidt, 2013). Huchzermeier and Loch
(2001) claimed that project management flexibility should be lower in a high uncertainty
environment (radical innovation) than in a low uncertainty environment (incremental
innovation). Radical innovation projects require more formality in the NPD process and
project management. Holahan et al. (2014) indicated that radical projects are often managed
through more formal methods as opposed to informal entrepreneurial adventures, and are
less flexible than incremental projects. Other researchers including Schultz et al. (2013)
have suggested that a highly formal control system (stage and gate types of processes)
operates effectively at achieving positive decision making clarity when an NPD program
leans towards the radical end of the innovativeness spectrum.
In the complex environments of developing radical innovations, a formal control system can
direct specific process activities to ensure overall vision, new entrepreneurial learning,
creativeness and the actions needed to support the radical aspects of the NPD projects. Thus,
this approach can lead to improved process activities, particularly the up-front homework
(Schultz et al., 2013) (the before-launch stage performance, in this study). Markham and
Lee (2013a) PDMA comparative performance assessment study highlighted the trend
towards using more formal processes at the front of innovation by firms that are
significantly involved in innovative projects, and stated that “at the same time as companies
are eschewing formal processes in the formal development programs, they seem to be
adding process to the front end” (p.427).

338
From the regression result, which is in line with emerging research, it may tentatively be
concluded that NPD process formality has a role to play in terms of influencing the
relationship between market vision and the before-launch stage performance of market-
driving innovation. A formal NPD process may be useful as long as it can cope with the
high risk and uncertainty associated with breakthrough products. If this holds true, it may
add to the recent arguments and the trend to move attention to the formal front end process,
particularly for market-driving innovations.
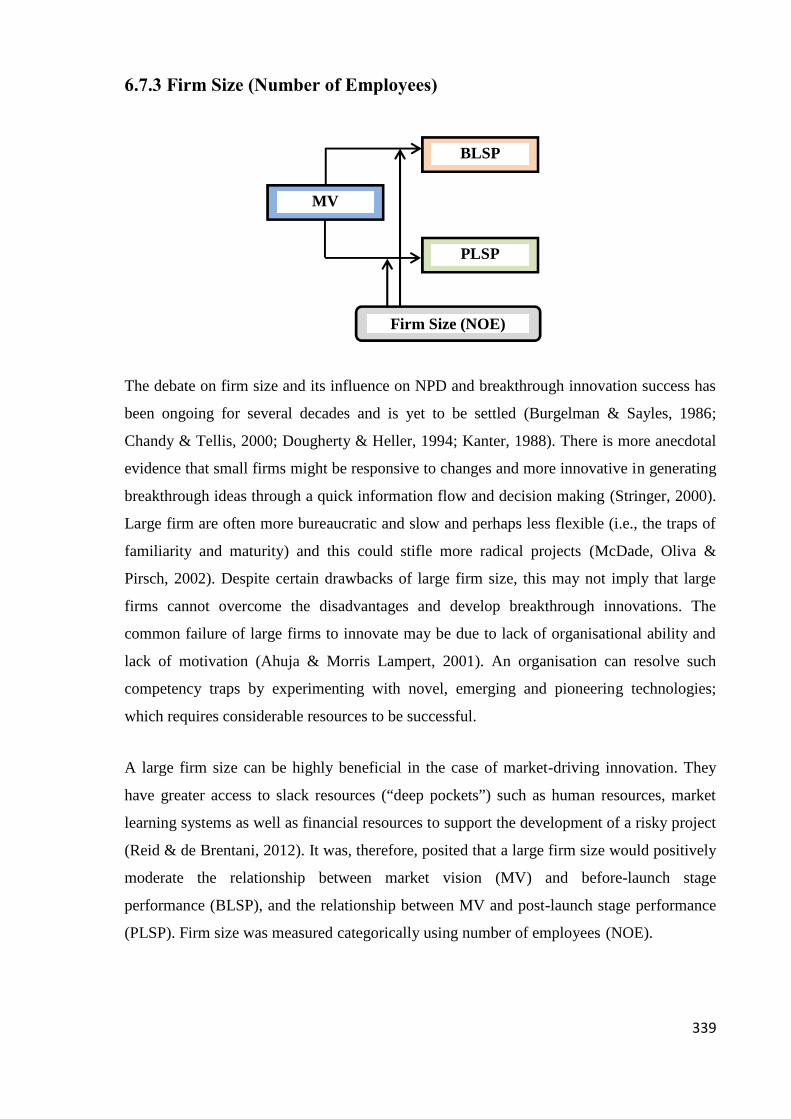
339
6.7.3 Firm Size (Number of Employees)
The debate on firm size and its influence on NPD and breakthrough innovation success has
been ongoing for several decades and is yet to be settled (Burgelman & Sayles, 1986;
Chandy & Tellis, 2000; Dougherty & Heller, 1994; Kanter, 1988). There is more anecdotal
evidence that small firms might be responsive to changes and more innovative in generating
breakthrough ideas through a quick information flow and decision making (Stringer, 2000).
Large firm are often more bureaucratic and slow and perhaps less flexible (i.e., the traps of
familiarity and maturity) and this could stifle more radical projects (McDade, Oliva &
Pirsch, 2002). Despite certain drawbacks of large firm size, this may not imply that large
firms cannot overcome the disadvantages and develop breakthrough innovations. The
common failure of large firms to innovate may be due to lack of organisational ability and
lack of motivation (Ahuja & Morris Lampert, 2001). An organisation can resolve such
competency traps by experimenting with novel, emerging and pioneering technologies;
which requires considerable resources to be successful.
A large firm size can be highly beneficial in the case of market-driving innovation. They
have greater access to slack resources (“deep pockets”) such as human resources, market
learning systems as well as financial resources to support the development of a risky project
(Reid & de Brentani, 2012). It was, therefore, posited that a large firm size would positively
moderate the relationship between market vision (MV) and before-launch stage
performance (BLSP), and the relationship between MV and post-launch stage performance
(PLSP). Firm size was measured categorically using number of employees (NOE).
BLSP
PLSP
MV
Firm Size (NOE)
340
The findings from both the model and regression results indicate that being a large firm has
a significant and positive influence on the relationship between MV and PLSP. This result
appears to make sense. Empirical studies have suggested that once a breakthrough idea
progresses over the stages of the development process, they require more resources in the
forms of human resources (reviewers, decision makers, sales support), broad network and
distribution channels and financial resources. This is due to the associated high/unexpected
costs, risk and uncertainties in developing such product idea and bringing it to the market
(e.g. O'Connor & Rice, 2013b; Schmidt et al., 2009). In this respect, several studies support
the significant and positive impact of large firms and their slack resource on breakthrough
innovation. As evidenced in the benchmarking study by Griffin and Page (1996), a large
firm can support extensive marketing expenditure, which was found to have a positive
impact on innovation success. Ahuja and Morris Lampert (2001) stated that “cash-rich
corporations can far more easily afford certain kinds of speculative and experimental
ventures” (p. 541). Adding to this, large firms often have a better reputation than small
firms. As such, the innovations developed by large firms are perceived by customers to be
less risky (Chandy & Tellis, 2000; Sorescu et al., 2003).
The results of recent research on large firm size and slack resources and their influence on
market-driving innovation are also emerging in the product innovation and management
literature. Troilo, De Luca, and Atuahene-Gima (2013) indicated that higher levels of slack
resources particularly external knowledge are positively correlated to radical innovation
because they can reduce the associated uncertainty and ambiguity in the development
process. Rubera and Kirca (2012) meta-analysis review highlighted that large firms have a
broad network and preferential access to distribution channels than small firms and this
allows easy access to the required resources and opening up of new markets to reach
consumers more quickly, thus, increasing the innovation adoption rate. Andries and Faems
(2013) also indicated that large firms have greater knowledge and expert resources such as
specialised patent departments and patent attorneys to undertake patenting and licensing of
breakthrough innovation than small firms. This allows them to commercial radically new or
really new product and related new knowledge without being hindered by imitators.
From this result, which is in line with the emerging research, it may be concluded in this
study that the effectiveness of market vision on the post-launch stage performance of

341
market-driving innovation is greater for large firms (with slack resources) in terms of
improved speed-to-market and broader windows of opportunity. Despite the anecdotal
evidence regarding the benefits of small firm size, this study adds to the current body of
knowledge on the positive influence of large firm size on market-driving innovation.
In addition to these findings, a possible direct negative effect of firm size on the before-
launch stage performance was found in the path model. This may be explained by the large
body of evidence that large firms are unable to manage the front end exploration well
(O'Connor & Rice, 2013b). A further possible reason for the insignificant influence of large
firm size on market vision and before-launch stage performance may be that market vision
is not largely influenced by firm size. Market vision remains an important determinant of
before-launch stage performance in terms of achieving breakthrough integrity and early
success with customers, regardless of whether a firm has only few employees or hundreds.

342
6.8 The Implications of the Study
6.8.1 Theoretical Implications
A number of theoretical implications have arisen from this research. The contribution to the
literature is mainly fourfold:
(1) Advancing knowledge about the front end of innovation in relation to market vision
and associated competencies and, through absorptive capacity, specifically adding to
theory development.
Core of the major contribution of the thesis is the advancement of knowledge about the front
end of the development process, particularly for market-driving innovation. This study
builds on and extends, in particular, the work of Reid and de Brentani (2010) on market
visioning competence (MVC) and its resultant market vision (MV). The constructs have
emerged from the product innovation and management literature to deal particularly with
the high uncertainty and ambiguity associated with the front end of market-driving
innovation.
Whilst this research is not a replication of Reid and de Brentani (2012), evidence has been
found that MVC and its resultant MV are significantly instrumental in ensuring that market-
driving innovations are able to emerge into the development process, whilst retaining their
originality and innovativeness (breakthrough integrity). The analyses for this research has
been done at the program level, as opposed to the project level (Reid & de Brentani, 2010),
and thus the impacts of MVC/MV were extended to encompass the performance of several
projects. Because the focus was beyond a single product, analysis was able to determine the
degree to which firms had the ability to produce ongoing market-driving innovations,
especially if they were leaders in their field. This study also captures both radical and really
new innovation as market-driving innovation. The research was conducted across different
industries, and was therefore not limited to radically new, high-tech products (Reid & de
Brentani, 2010). Overall, the findings in this study on MVC and MV broaden an overall
understanding of the emerging market learning approach, that is, the process of “visioning”
or “market visioning” and its significance to the front end of market-driving innovation. It
also adds to the current body of knowledge on the specific MVC and MV (Reid & de

343
Brentani, 2010) that helps to explain the importance of this concept in different research
settings.
Importantly, this study specifically adds to the theory on development of MVC/MV through
absorptive capacity (ACAP). The concept of ACAP has emerged from the management
literature as an organisational dynamic learning capability and a predictor of innovative
activity and performance. This study brings the concept of ACAP, primarily based on the
work of Zahra and George (2002), into the field of NPD and product innovation. A review
by Shafique (2013) on innovation-related publications in top journals over a 21-year period
supports this cross-field research and argues that innovation research is becoming
increasingly compartmentalised within management disciplines.
Moreover, prior research has often examined absorptive capacity as single indicator or
unidimensional measure. Cohen and Levinthal (1990) original work on absorptive capacity,
however, suggested the importance of multidimensionality. In this respect, the present study
treats absorptive capacity as a multidimensional construct and operationalises it on the basis
of the recent scale developed by Flatten et al. (2011) to further extend the empirical
research. In addition, the concept of absorptive capacity has often been applied in the
context of incremental innovation, as opposed to radical innovation (Lane et al., 2006).
Thus, this study extends the current body of knowledge on absorptive capacity and
breakthrough innovation, especially at the front end of the development process.
This study is the first empirical study to model the role of absorptive capacity and its
potential and realised subsets as precursors to both market visioning competence and market
vision at the front end of market-driving innovation. This adds to the knowledge of
innovation in terms of visioning for market-driving innovation (an individual’s tacit
knowledge) and the organisational influence as part of the dynamic knowledge creating
process. A recent research by Markham and Lee (2013b) also highlighted that the front end
of innovation and related activities is dependent on a firm’s ability to acquire, transform and
absorb new knowledge. This further indicates the importance of absorptive capacity as an
emerging construct at the front end of innovation.
By positioning absorptive capacity as a dynamic capability, this study demonstrates the
value of higher level process capabilities that serve as a mechanism to explain how firms

344
can attain breakthrough product innovation, subsequent success and benefits, and
competitive advantage over time. Specifically, this study supports the theoretical
assumption of the absorptive capacity concept that is often applied in highly dynamic
environments and in the high-tech industry of developed countries. Thailand, as a
developing country, also faces a dynamic environment with competition from its rapidly
industrialising neighbours and from international competitors targeting its markets and key
customer. Thus, developing breakthrough innovation through an organisational dynamic
learning capability is also an important challenge for firms in developing countries.
In respect to the critical focus of this thesis on the front end of market-driving innovation,
several recent researchers have highlighted that the area is still under-researched (e.g. de
Brentani & Reid, 2012; Markham, 2013; O'Connor & Rice, 2013a; Reid & de Brentani,
2012; Slater, Mohr & Sengupta, 2013; Stevens, 2014). The development of market-driving
innovation at the front end of innovation involves the degree of originality, novelty and
meaningfulness. Further, managing the flow of market-driving innovations (i.e. ideas,
concepts) from the front end into a formal development process has shown as a critical issue
to new product success. This study has captured this emerging area of research and linked
with the importance of absorptive capacity and market visioning, resulting in the formation
of a foundation for further studies to replicate and extend this work. It is hoped that the
study will stimulate scholars in the field of innovation to identify capabilities, competence
(tools, skills) and managerial practices that drive markets, so that firms can leverage new
ideas and exploit these into market-driving innovations.
(2) Bridging the gap in the traditional market orientation to NPD through the resource-
based view and dynamic capability theory and the notion of “market driving”.
The traditional market orientation and the concept of “market-driven” have been dominant
in the strategic marketing literature (Jaworski et al., 2000). However, research on market-
driven orientation has appeared to offer little explanation on the behaviour of market-
driving firms and their development of radical or really new innovations. A recent study by
Büschgens, Bausch, and Balkin (2013) highlighted that “up to now, few studies have
examined the link between organisational culture and radical innovation” (p.771). Market

345
orientation underlies the organisational norms, values and culture that inherently form
specific learning and decision-making behaviour, activities, resources and capabilities
(Slater & Narver, 1995). The need to move the focus of research away from the traditional
market orientation is essential to market-driving innovation (Hills & Sarin, 2003; Kumar et
al., 2000). This study bridges this research gap and provides evidence that a market-driving
orientation is conducive to market-driving innovation.
Cast in the resource-based view (RBV) of the firm and dynamic capabilities literature, this
study uncovers the rich array of factors which underlie a firm’s internal resources and
capabilities, particularly the intangible skills and knowledge related to market-driving that
serve as sources of competitive advantage to achieve and enhance firm performance through
NPD. The paradigm of the traditional RBV alone, as asserted by most researchers, does not
sufficiently capture today’s highly competitive and dynamic marketplace (due to either pace
or ambiguity). This is especially true for an investigation of market-driving innovation in
the context of dynamic capability (Eisenhardt & Martin, 2000; O'Connor, 2008; Teece et al.,
1997). Accordingly, the present study adds to the theoretical argument of RBV and dynamic
capability literature as a robust approach to the analysis of sustainable competitive
advantage, particularly for market-driving innovation.
(3) Improving the understanding of NPD performance-related market-driving
innovation relative to before-launch stage, post-launch stage and financial performance
outcomes, and more specifically adding to theory development through the newly formed
breakthrough integrity measure.
An extensive literature review has suggested a lack of quantitative studies have been
conducted to capture NPD performance outcomes from the front end through to final
success, especially for market-driving innovation. On one hand, recent research by
Markham (2013) found little empirical evidence of the impact of front end activities on
front end performance. The majority of research on the front end has been presented as
conceptual, without specifying or testing the effects of the front end activities. On the other
hand, O'Connor and Rice (2013b) claimed that less attention has been paid to the

346
commercialisation success stage of market-driving innovation, that is, how well a product
performs in creating a successful market, a new business or a new revenue model.
This study underscores the importance of a coherent framework to examine the performance
outcomes of market-driving innovation by adopting a multidimensional measure as referred
to as “market-driving innovation performance” (MDIP). The program level MDIP measure
was adopted and integrated primarily from the scales developed by other researchers in
product innovation and management literature, while a few new items had to be developed
specifically for the purpose of this study, particularly the new measurement scale for
“breakthrough integrity” since this concept has only just begun to emerge from the literature.
MDIP captures the outcome measures in the product, process, customer, firm and financial
related aspects of market-driving innovation from the front end through to its final success.
Specifically, the MDIP dimensions are breakthrough integrity, early success with customers,
speed-to-market, windows of opportunity and financial performance that as a whole
comprise market-driving innovation performance. These dimensions were categorised by
different time horizons into before-launch stage, post-launch stage and financial
performance. In addition, the relationships among these specific performance outcomes
were drawn in the conceptual model and tested for their associations. This provides a new
explanation of the relationships, with a view to understanding how to facilitate greater
performance outcomes of market-driving innovation.
(4) Broadening the scope of the pertinent research on market-driving innovations by
using and testing data from a developing country, which includes both large sized and
small-to-medium sized firms developing market-driving innovations.
This study makes a contribution by its context of the developing country of Thailand. By
virtue of the sample composition of the present research, this contribution is about
broadening the notion of research of market-driving innovation in developing countries by
testing models in Thailand and using the data that includes both large sized and small-to-
medium sized firms developing radically new and/or really new products. This sample also
comes from a cross section of industries and this moves the analysis and implications
347
beyond developed countries such as the USA, the UK or Europe. Further it shifts the focus
of using only large mature firms developing radically new, high-tech products in Silicon
Valley or those on the Fortune 500 list – all of which are so pervasive in the product
innovation and management literature.
Respectively, using Thailand does make a contribution in that the issues faced by firms in
developing countries are similar ineffect to those in developed countries trying to bring
about market-driving innovations (both radically new and really new products) to service
local and global markets. Firms regardless of the country conditions often face similar
strategic, operational and process issues in developing new products, particularly
breakthrough market driving ones. In addition, only a few empirical studies on innovation
have been found that have used Thai firms (e.g. Chaveerug & Ussahawanitchakit, 2008;
Dhamvithee, Shankar, Jangchud & Wuttijumnong, 2005; Suwannaporn & Speece, 2010;
Wattanasupachoke, 2012). This indicates a dearth of research on innovation in Thailand,
particularly in relation to market-driving innovation.
(5) Addressing the debates on the influence of firm size on the development of market-
driving innovation.
Significant and positive influences of large firm size were found on the relationship between
market vision and post-launch stage performance. The findings from the regression analysis
and path models are in line with other recent research supporting the significance of a large
firm as an influencer (e.g. Troilo et al. (2013). The review of the evidence addressed the
debate regarding firm size and the common perception of the negative influence of large
size on the development of market-driving innovations. Large firms are getting better at
market-driving innovation, and through their slack resources, allow them to move forward a
potential new product to the market quickly to open up a new market or
product/technological arena. This led to the conclusion that a large size is likely to be
beneficial to a firm but only if it is not too bureaucratic and has the ability to accept the risk
associated with market-driving innovation.
348
6.8.2 Managerial Implications
6.8.2.1 Implications for Business
This study has significant implications for managers, entrepreneurs and NPD team members
related to how they can best manage and facilitate the development of market-driving
innovation, especially at the front end of the NPD process.
For Firms to Become “Market Driving”
In today’s highly dynamic and competitive business environment, firms should face the
challenges and be engaged in market-driving innovative activities rather than being market-
driven in order to survive. Having visionary leaders and employees with multifunctional
skills and entrepreneurial characteristics can encourage the development of a market-driving
culture in firms or strategic business units. Large firms should recognise the advantage of
having greater access to the resources of finance, people and knowledge than small start-up
firms. Notwithstanding the impetus and opportunity provided through these resources, large
firms should also be encouraged to participate in broad communication networks and to
spread the cost of bringing new products to market through economies of scale. This may
speed up the new product development process and open windows of opportunity for firms
engaging in market-driving innovations.
Visioning for Market-Driving Innovation and Breakthrough Possibilities!
The findings of this study, based on a cross-section of firms in Thailand, broaden the RBV
research agenda to place more emphasis on the roles of managers in visioning for market-
driving innovation. Managers should resist the temptation to fall back on “me-too” products
or market-driven innovations even though undertaking market-driving innovation tends to
increase the levels of uncertainty and complexity in the development process. This is a
competitive necessity for firms to achieve sustainable competitive advantage. To be
involved in a project associated with high risk and uncertainty does not necessarily result in
poor performance. A competitive advantage can often be gained by undertaking more
difficult and complex tasks than the competitors do.
349
Managers should not be too concerned about technical solutions to develop market-driving
innovation but should devote more attention to key nontechnical resources and
competencies early in the process. The ability of individuals and NPD team members to
bring in and use external information from various sources creates the diversity of
knowledge essential to the generation of new product ideas. They should be involved in
exploratory learning by means of discovering additional or unarticulated needs of
customers, and experimenting with new ideas and incorporating them into solutions that
contribute to successful market-driving innovation. Forecasting and market estimation
techniques can also be useful before making a final market selection.
A good understanding of the dimensions of each of the market visioning competence and
market vision constructs can be an enabler for managers to identify breakthrough
possibilities. This understanding helps managers to recognise and understand the real
meaning of the future product-market they are developing, and to have the courage to follow
their intuition when making the front end decisions related to market-driving innovation.
The right questions must be asked among the NPD team members when they first start
thinking about the development of a market-driving innovation, particularly the question of
who of the target market will value and benefit the most from the breakthrough innovation.
Further, the individuals and NPD team must have a clear and specific market vision when
moving towards the later stages of the development process.
Organisational Dynamic Learning Capabilities
Market-driving innovation often demands a reconfiguration and different management of a
firm’s resources and capabilities. Firms must devise ways to mobilise and leverage
resources in order to develop new or novel capabilities to facilitate opportunity
identification leading to market-driving innovation. In the RBV research and dynamic
capabilities agenda, it is clear that the management of key resources and capabilities is
critical and should take a central place in market visioning (MVC/MV).
The market visioning competence (of individuals or an NPD team) must be formulated and
sustained through organisational routines and processes that promote exploratory learning.

350
Knowledge management and information processing are at the core of market visioning at
the front end of market-driving innovation. Management must recognise that a firm’s ability
to acquire and assimilate knowledge is a proxy for market vision. New information from the
environment regarding markets, technology, competitors and resources is the source of
radically new or really new product ideas. More importantly, a firm’s capability to combine
non-redundant or new information with in-house knowledge to transform it influences the
process of market visioning or employees’ vision of a future market opportunity and its
exploitation into a successful market-driving innovation.
Maintaining Breakthrough Integrity from the Front End through to Launch
The real challenge for firms is to maintain the highly innovative concept of a potential new
product, or breakthrough integrity from the front end stage through to the final product
launch. Highly innovative, market-driving ideas are revolutionary, risky and disruptive.
Accordingly, the more innovative ideas (that might create new markets) are often squelched
by managers or led astray by customers’ expressed preferences at the outset, or otherwise
face a number of stops and starts, deaths and revivals before moving through to launch.
Correspondingly, the quality of execution of early NPD activities (market visioning) is
instrumental in achieving breakthrough integrity and early success with customers,
particularly at the front end of market-driving innovation. These early NPD activities and
performance also have significant impacts on the levels of speed in bringing market-driving
innovations to market and in opening up new opportunities for firms and ultimately
achieving sales and profitability. Thus, managers and employees must have the market
vision to generate and allow market-driving ideas to have a fair chance of success.
In addition to these managerial guidelines, if the result related to NPD process formality
holds true, managers must change the way they think about the development of market-
driving innovation. A formal process may allow a market vision to be translated into
improved breakthrough integrity and early success with customers. As opposed to providing
a flexible process, managers should provide some forms of structured NPD process such as
process tools and decision criteria to mitigate the high risk and uncertainties associated with
market-driving innovation.

351
6.8.2.2 Implications for Public Policy Makers
This study utilised a sample of Thailand Top Innovative Companies extracted from the list
of National Innovation Award winners (National Innovation Agency, 2011, 2012). The list
was generated by the National Innovation Agency (NIA), which operates under the umbrella
of the Ministry of Science and Technology in Thailand. The role of NIA is to foster
innovation development in Thailand by enhancing and promoting a national innovation
culture, productivity and international competitiveness, as well as to coordinate industrial
clusters at the policy and operational levels. Through a broad-based and systematic
approach, their goal is to transform Thailand into an innovation-driven economy (National
Innovation Agency, 2010a).
Accordingly, this study can propose modes of facilitating and improving the development of
market-driving innovation for practitioners and policy makers, particularly those in
Thailand, as well as those in other countries and locations. The policies can be formulated in
terms of stimulating a firm’s absorptive capacity and related knowledge and information
resources, i.e., promoting the importance of external linkages between producers, suppliers,
clients and research organisations, and improving the technological knowledge and skills of
employees and the mobility of scientists to exploit locally available materials and resources.
This can be an effective means of building cross-industry networks for exchanging and
exploiting external innovation and knowledge that can lead to an increased development of
market-driving innovations at the national level. Over time it may also produce the
necessary economic resources to support future knowledge inflows and innovation
activities, and add value to the local community and the grass-roots economy.
Absorptive capacity as a dynamic capability can advance the traditional array of policy
interventions directly by facilitating the market-driving innovation performance of both
developed countries and developing countries such as Thailand. The importance of a firm’s
absorptive capacity is related to the country’s absorptive capacity (Mowery & Oxley, 1995).
To develop a policy that fosters knowledge management and information processing
through a firm’s absorptive capacity may turn out to be “very effective in making the
country more receptive to international knowledge flows” (Escribano, Fosfuri & Tribó,
2009, p.104). In particular, it is essential for developing countries to develop a worldwide
network due to the inadequacies in some extent factors such as technological knowledge,

352
infrastructure and high value added components, which often require support from
developed countries, in order to encourage market-driving innovations (Intarakumnerd et
al., 2002).
6.8.3 Limitations and Future Research
Five main limitations that restrict the generalisability of the findings of this research are
explained in detail in this section. The first limitation is that the research focuses on one
specific country, Thailand, and thus, country-based limitations apply, and it focuses on Thai
firms across industries, which might have certain idiosyncrasies and face unique
environmental contingencies that affect their NPD efforts related to market-driving
innovations. Thailand as a developing country, for instance, may often appear to play a role
of technological catching-up (Klochikhin & Shapira, 2012). This may limit the
generalisability of the findings to other countries, specific industries or businesses. Future
research could investigate the research question and the conceptual model by using firms in
other countries (e.g. developed countries), using firms which operate in an international
context or using alternative industries, to examine whether the findings hold in other
contexts. In addition, future research could explore specific issues confronting firms in
Thailand or other developing countries such as Vietnam and Cambodia, particularly by
looking at how the infrastructure of a developing country helps or hinder the ability of
innovative firms such as the ones in this research to develop new and breakthrough products
and to see how the results may differ from the extant literature. For researchers considering
this focus, new literature, hypotheses or propositions will need to be developed and
to discuss the results more in this context; a longitudinal focus via tracking or case studies
can be a useful method to provide greater insights in this case.
Second, the present study has captured both radical and really new innovations as “market-
driving innovations”. Further research should examine the level of effects of absorptive
capacity and its subsets, as mediated by market visioning (MVC/MV), on the market-
driving innovation performance for a specific type of product innovation. For instance, it
would be interesting to see whether higher levels of absorptive capacity and market
visioning competence/market vision are required for firms to develop radical innovations
353
than to develop really new or incremental innovations. Future studies should explore how
high performing firms (those producing a high number of product innovations, particularly
radical innovations, or those that perform well at before-launch stage and post-launch stage
performance and financial performance) manage their absorptive capacity, market visioning
competence/market vision compared to lower performing firms.
Third, supposing that the effects of absorptive capacity antecedents on market visioning
competence/market vision may differ as a function of a moderator, future research should
explore and identify moderators of the first paths in the model. The same set of moderators
at different paths and/or other possible moderators could be considered in future analyses.
Reid and de Brentani (2012) began to explore some moderating effects (such as origin
relatedness, incumbency and resource availability) on the relationship between market
visioning competence and market vision. In this regard, a new set of moderators may also be
used to assess such relationship based on the model of the present study. Testing moderated
mediation effects may further advance the understanding of market visioning competence
and market vision, with absorptive capacity as an antecedent, and the performance
consequences.
Fourth, direct paths were found from market visioning competence to before-launch stage
performance and post-launch stage performance outcomes that cannot be fully explained by
market vision. Market vision could, in fact, be an important mediator leading to before-
launch stage performance and post-launch stage performance. Further research should
investigate how market vision influences specific aspects of the performance outcomes at
these stages. Using mixed method research that includes in-depth interviews and case
studies can offer a more comprehensive explanation of the role of market vision.
Fifth and finally, the use of cross-sectional data may create difficulties in inferring causal
links from the results. The dynamic effect of absorptive capacity as higher organisational
level capabilities on market visioning competence and market vision at NPD program level
may change over time. A change may be due to external pressures or to changes in strategic
decisions (due, for example, to venture capital pressures to pursue short-term product
market ideas in preference to longer-term ones). With recent research in marketing, a
longitudinal study, although time-consuming, would enable an assessment of the causal
354
effects in the relationships underpinning the conceptual framework. This would provide
further insight into changes in the nature and dynamic effect of the influence of absorptive
capacity on the course of market visioning competence, the originally intended market
vision and the performance of market-driving innovation over time. In particular, it might
clarify the high correlation detected between absorptive capacity and market visioning
competence. As the constructs are emerging concepts and in fact are conceptually distinct
entities, a longitudinal study would help to explain, in the notion of market driving, how a
higher-order absorptive capacity (organisational level sensing) influences market visioning
competence (NPD program level sensing). Such a study could also lead to a better
understanding of the long-term effects of establishing knowledge and the other external or
internal factors that may influence the relationships.
Notwithstanding the five main limitations and the recommendations for future research
directions, there are also other considerations for future research in this area. The
questionnaire developed for this research has asked respondents for the number of product
innovations of different types that their firms had introduced over three-year period. This
was in the knowledge that firms targeted were highly innovative and had commercialised
products of the types under investigation (that is, radical breakthrough, technological
breakthrough and/or market breakthrough new products). The questionnaire instructions
therefore focus respondents on these types of breakthrough innovations that have been
developed rather than other types. Future research could, however, seek to capture activity
from a wider date (e.g. five-year period) because market-driving innovations often take
some time to get to market. Moreover, investigators should consider asking about products
in the innovation pipeline as there may be further market-driving innovations currently
under development that can be used as reference points in answering questions.
The importance of a market driving innovation to the firm or the size of the particular
introductions can also be considered in the future research. Future research could pose
questions regarding how specifically important market-driving innovation in general is to
the firm relativeto all the product innovation activities undertaken, including incremental
innovation. Similarly a question could be asked as to the value ($) and/or ROI contributed to
the firm by market-driving innovations relative to the other forms of product innovation.

355
The above section outlined the limitations of the research, but these limitations do not
detract from the significance of the findings. Instead, the limitations provide platforms for
future research. While the use of path models provides an indication of the relations
between tested variables, a good model fit of the final model is not necessarily a valid
reflection of real-world behaviour. The accepted model, on the basis of the empirical data,
provides the best mix of theoretical and logical justifications. Thus, the results are relative,
rather than absolute, by virtue of the competing models strategy performed in this research
(Hair et al., 2010). Above all, the strengths of the research remain and add to the body of
knowledge on the front end of market-driving innovation.
356
6.9 Conclusion and Personal Reflection
In conclusion, this study has conducted the first empirical examinations of the effects of
absorptive capacity on market visioning competence and its resultant market vision, and on
the specific performance outcomes of market-driving innovation. The resultant better
understanding of these dynamic capabilities associated with market-driving innovation can
help researchers, managers and employees to manage this intrinsically complex, risky but
high potential NPD scenario. This may help firms to avoid getting into “the current-
customer trap” and leading them to achieve superior innovation performance and
sustainable competitive advantage.
Through this worthwhile journey to the PhD, I truly believe that the important ability
underlying all successes is to vision – to follow instinct, gut-feel or intuition. In the case of
market-driving innovation, this simply means that one needs to have a market vision. I hope
that the results of this study will encourage any individual involved in NPD, not only in
Thailand but also in other countries, to seize control of tomorrow’s market. A greatly
designed market-driving innovation can make history, revolutionising an industry and
enhancing both customer value and firm value, allowing more and/or faster growth in the
broad economy.
As Steve Jobs (1984) put it in one of his well-known quotes:
We’re gambling on our vision, and we would rather do that than make ‘me, too’
products. Let some other companies do that. For us, it’s always the next dream
Apple product event for the first Macintosh computer, Steve Jobs,1984
357
REFERENCES
Aage, T. (2003a). Absorptive capabilities in industrial districts: The role of knowledgecreation and learning and boundary spanning mechanisms, DRUID, Copenhagen.
Aage, T. (2003b). Absorptive capacity of industrial districts, DRUID, Copenhagen.Aaker, D. A. (1988). Strategic Market Management (2nd Edition). New York: John Wiley &
Sons, Inc.Aaker, D. A., Kumar, V., & Day, G. S. (2001). Marketing Research (7th Edition) John
Wiley&Sons Inc. New York.Accenture Research. (2009, Nov 10). Companies Make Innovation a Priority for Growth in
Aftermath of Downturn But Management Shortcomings Hinder Results, AccentureResearch Finds. Retrieved 10 November, 2012, fromhttp://newsroom.accenture.com/article_display.cfm?article_id=4901
Acedo, F. J., Barroso, C., & Galan, J. L. (2006). The resource-based theory: disseminationand main trends. Strategic Management Journal, 27(7), 621-636.
Acur, N., Kandemir, D., de Weerd-Nederhof, P. C., & Song, X. M. (2010). Exploring theimpact of technological competence development on speed and NPD programperformance. Journal of Product Innovation Management, 27, 915-929.
Adler, J. H. (1965). Absorptive capacity: The concept and its determinants. BrookingsInstitution: Washington.
Ahmad, S., Mallick, D. N., & Schroeder, R. G. (2013). New Product Development: Impact ofProject Characteristics and Development Practices on Performance. Journal ofProduct Innovation Management, 30(2), 331-348.
Ahuja, G., & Morris Lampert, C. (2001). Entrepreneurship in the large corporation: alongitudinal study of how established firms create breakthrough inventions. StrategicManagement Journal, 22(6-7), 521-543.
Albaum, G. (1997). The Likert scale revisited: An alternate version. Journal of the MarketResearch Society, 39(2), 331-348.
Albers, S. (2009). PLS and Success Factor Studies in Marketing. In Esposito Vinzi, V., Chin,W. W., Henseler, J., & Wang, H. (Eds.), Handbook of Partial Least Squares.Concepts, Methods, and Applications in Marketing and Related Areas: SpringerHandbooks of Computational Statistics.
Allinson, W. C., Chell, E., & Hayes, J. (2000). Intuition and Entrepreneurial Behaviour.European Journal of work and Organizational Psychology, 9(1), 31-43.
Alves, J., Marques, M. J., Saur, I., & Marques, P. (2007). Creativity and Innovation throughmultidisciplinary and multisectoral cooperation. Creativity and InnovationManagement, 16(1), 27-34.
American Productivity & Quality Center. (2003). Improving New Product DevelopmentPerformance and Practices. Houston (TX): APQC (www.apqc.org/pubs/NPD2003).
Amit, R., & Schoemaker, P. J. H. (1993). Strategic assets and organizational rent. StrategicManagement Journal, 14(1), 33-46.
Anderson, J. C., & Gerbing, D. W. (1988). Structural equation modeling in practice: A reviewand recommended two-step approach. Psychological bulletin, 103(3), 411-423.
Anderson, J. C., Gerbing, D. W., & Hunter, J. E. (1987). On the Assessment ofUnidimensional Measurement: Internal and External Consistency, and OverallConsistency Criteria. Journal of Marketing Research, 24(4), 432-437.
Andrew, J., Manget, J., Michael, D. C., Taylor, A., & Zablit, H. (2010). Innovation 2010. AReturn to prominence - and the Emergence of a New World Order. Retrieved 15 July,2011, from http://www.bcg.com/documents/file42620.pdf
358
Andrews, D., Nonnecke, B., & Preece, J. (2003). Electronic survey methodology: A casestudy in reaching hard-to-involve Internet users. International Journal of Human-Computer Interaction, 16(2), 185-210.
Andries, P., & Faems, D. (2013). Patenting Activities and Firm Performance: Does Firm SizeMatter? Journal of Product Innovation Management, 30(6), 1089-1098.
Andriopoulos, C., & Lewis, M. W. (2009). Exploitation-exploration tensions andorganizational ambidexterity: Managing paradoxes of innovation. OrganizationScience, 20(4), 696-717.
Arbuckle, J. L., & Wothke, W. (1999). AMOS 4.0 user's guide. Chicago: SPSS.Armstrong, J. S., & Overton, T. S. (1977). Estimating Nonresponse Bias in Mail Surveys.
Journal of Marketing Research, 14(3), 396-402.Atuahene-Gima, K. (2005). Resolving the Capability-Rigidity Paradox in New Product
Innovation. Journal of Marketing, 69, 61-83.Atuahene-Gima, K., & Ko, A. (2001). An Empirical Investigation of the Effect of Market
Orientation and Entrepreneurship. Organizational Science, 12(1), 54-74.Atuahene-Gima, K., Slater, S. F., & Olson, E. M. (2005). The Contingent Value of
Responsive and Proactive Market Orientations for New Product ProgramPerformance*. Journal of Product Innovation Management, 22(6), 464-482.
Audretsch, D. B., & Acs, Z. J. (1991). Innovation and Size at the Firm Level. SouthernEconomic Journal, 57(3), 739-744.
Autio, E., Sapienza, H. J., & Almeida, J. G. (2000). Effects of age at entry, knowledgeintensity, and imitability on international growth. Academy of Management Journal,43(5), 909-924.
Backman, M., Borjesson, S., & Setterberg, S. (2007). Working with concepts in the fuzzyfront end: exploring the context for innovation for different types of concepts at VolvoCars. R&D Management, 37(1), 17-28.
Baer, M., Oldham, G. R., & Cummings, A. (2003). Rewarding creativity: when does it reallymatter? The Leadership Quarterly, 14(4–5), 569-586.
Bagozzi, R. P. (1979). The role of measurement in theory construction and hypothesis testing:toward a holistic model. In O. C. Ferrell, S. W. Brown, C. W. Lamb (Eds.),Conceptual and theoretical developments in marketing (pp. 15–32). Chicago:American Marketing Association.
Bagozzi, R. P. (1980). Causal Models in Marketing. NewYork: John Wiley.Bagozzi, R. P. (1981). Attitudes, intentions, and behavior: A test of some key hypotheses.
Journal of personality and social psychology, 41(4), 607.Bagozzi, R. P. (1984). A Prospectus for Theory Construction in Marketing. Journal of
Marketing, 48(1), 11-29.Bagozzi, R. P., & Baumgartner, H. (1994). The evaluation of structural equation models and
hypothesis testing. In R. P. Bagozzi (Ed.), Principles of marketing research (pp. 386–422). Cambridge: Blackwell.
Bagozzi, R. P., & Phillips, L. W. (1982). Representing and Testing Organizational Theories:A Holistic Construal. Administrative Science Quarterly, 27(3), 459-489.
Bagozzi, R. P., & Yi, Y. (1988). On the evaluation of structural equation models. Journal ofthe academy of marketing science, 16(1), 74-94.
Bagozzi, R. P., Yi, Y., & Singh, S. (1991). On the use of structural equation models inexperimental designs: Two extensions. International Journal of Research inMarketing, 8(2), 125-140.
359
Bakar, L. J. A., & Ahmad, H. (2010). Assessing the relationship between firm resources andproduct innovation performance: A resource-based view. Business ProcessManagement Journal, 16(3), 420-435.
Baker, W. E., & Sinkula, J. M. (1999). Learning Orientation, Market Orientation andInnovation: Integration and Extending Models of Organizational Performance.Journal of Market Focused Management, 4, 295-308.
Baker, W. E., & Sinkula, J. M. (2002). Market Orientation, Learning Orientation and ProductInnovation: Delving into the Organization's Black Box. Journal of Market-FocusedManagement, 5(1), 5-23.
Bao, Y., Chen, X., & Zhou, K. Z. (2012). External learning, market dynamics, and radicalinnovation: Evidence from China's high-tech firms. Journal of Business Research,65(8), 1226-1233.
Barclay, D., Higgins, C., & Thompson, R. (1995). The partial least squares (PLS) approach tocausal modeling: Personal computer adoption and use as an illustration. Technologystudies, 2(2), 285-309.
Barczak, G., Griffin, A., & Kahn, K. B. (2009). PERSPECTIVE: Trends and Drivers ofSuccess in NPD Practices: Results of the 2003 PDMA Best Practices Study*. Journalof Product Innovation Management, 26(1), 3-23.
Barczak, G., & Kahn, K. B. (2012). Identifying new product development best practice.Business Horizons, 55(3), 293-305.
Barney, J. B. (1986). Strategic factor markets: Expectations, luck, and business strategy.Management Science, 32(10), 1231-1241.
Barney, J. B. (1991). Firm Resources and Sustained Competitive Advantage. Journal ofManagement, 17(1), 99-120.
Baron, R. A. (1998). Cognitive mechanisms in entrepreneurship: Why and whenenterpreneurs think differently than other people. Journal of Business Venturing,13(4), 275-294.
Bartl, M., Füller, J., Mühlbacher, H., & Ernst, H. (2012). A Manager's Perspective on VirtualCustomer Integration for New Product Development. Journal of Product InnovationManagement, 29(6), 1031-1046.
Bass, F. M. (1969). A new-product growth model for consumer durables. ManagementScience, 1, 215-227.
Baumgartner, H., & Homburg, C. (1996). Applications of structural equation modeling inmarketing and consumer research: A review. International Journal of Research inMarketing, 13(2), 139-161.
Belderbos, R., Carree, M., Diederen, B., Lokshin, B., & Veugelers, R. (2004). Heterogeneityin R&D cooperation strategies. International Journal of Industrial Organization,22(8–9), 1237-1263.
Bell, S. S., Holbrook, M. B., & Solomon, M. R. (1991). Combining esthetic and social valueto explain preferences for product styles with the incorporation of personality andensemble effects. Journal of Social Behavior & Personality.
Ben, L. K., & Cruz, A. P. (2009). Intuition: an often overlooked component in organizationaldecision-making, 16(1). Paper presented at the ASBBS Annual Conference: LasVegas.
Benner, M. J., & Tushman, M. L. (2003). Exploitation, exploration, and process management:The productivity dilemma revisited. Academy of Management Review, 28(2), 238-256.
Berchicci, L., & Tucci, C. L. (2010). There Is More to Market Learning than Gathering GoodInformation: The Role of Shared Team Values in Radical Product Definition*.Journal of Product Innovation Management, 27(7), 972-990.
360
Bertels, H. M. J., Kleinschmidt, E. J., & Koen, P. (2011). Communities of Practice versusOrganizational Climate: Which One Matters More to Dispersed Collaboration in theFront End of Innovation?*. Journal of Product Innovation Management, 28(5), 757-772.
Bertrand, O., & Mol, M. J. (2013). The antecedents and innovation effects of domestic andoffshore R&D outsourcing: The contingent impact of cognitive distance andabsorptive capacity. Strategic Management Journal, 34(6), 751-760.
Bessant, J., Birkinshaw, J., & Delbridge, R. (2004). Innovation as Unusual. Business StrategyReview, 15(3), 32-35.
Bessant, J., Von Stamm, B., Moeslein, K. M., & Neyer, A. K. (2010). Backing outsiders:selection strategies for discontinuous innovation. R&D Management, 40(4), 345-356.
Beverland, M., Ewing, M. T., & Matanda, M. J. (2006). Driving-market or Market-driven? ACase Study Analysis of the New Product Development Practices of Chinese Business-to-Business Firms. Industrial Marketing Management, 35, 383-393.
Bhaskar, R. (1989). Reclaiming reality: A critical introduction to contemporary philosophy.London: Verso.
Biazzo, S. (2009). Flexibility, Structuration, and Simultaneity in New Product Development.Journal of Product Innovation Management, 26(3), 336-353.
Bisman, J. E. (Writer). (2002). The critical realist paradigm as an approach to research inaccounting, In poster presentation at the Accounting Association of Australian andNew Zealand Annual Conference, Perth, Australia, July.
BITEC. (2012). TechnoMart InnoMart 2012 Year's Biggest technology and innovation EventKicks off! Retrieved 25 October, 2012, fromhttp://www.bitec.co.th/index.php/113000219/content/detail/en
Bogers, M., Afuah, A., & Bastian, B. (2010). Users as Innovators: A Review, Critique andFuture Research Directions. Journal of Management, February, 1-19.
Bohrnstedt, G. W. (1970). Reliability and validity assessment in attitude measurement. In G.F. Summers (Ed.), Attitude measurement (pp. 80–99). London: Rand McNally.
Bollen, K., & Lennox, R. (1991). Conventional wisdom on measurement: A structuralequation perspective. Psychological bulletin, 110(2), 305.
Bonner, J. M., Ruekert, R. W., & Walker, O. C. (2002). Upper management control of newproduct development projects and project performance. Journal of Product InnovationManagement, 19(3), 233-245.
Boomsma, A., & Hoogland, J. J. (2001). The Robustness of LISREL Modeling Revisited. InR. Cudeck, K. G. Joreskog & S. H. du Toit (Eds.), Structural Equation Modeling:Present and Future (pp. 139-168). Chicago: Scientific Software International.
Bower, J. L. (1970). Managing the resource allocation process: A study of corporateplanning and investment. Boston, MA: Harvard Business School Press.
Brace, I. (2004). Questionnaire design: how to plan, structure, and write survey material foreffective market research (Vol. 1). London: Kogan Page.
Brem, A., & Voigt, K.-I. (2009). Integration of market pull and technology push in thecorporate front end and innovation management—Insights from the German softwareindustry. Technovation, 29(5), 351-367.
Brimble, P. (2006). Specific Approaches to University-Industry Links of Selected Companiesin Thailand and Their Relative Effectiveness. In S. Yusuf & K. Nabeshima (Eds.),How Universities Promote Economic Growth (pp. 265-273): World Bank
Broring, S., Cloutier, L. M., & Leker, J. (2006). The front end of innovation in an era ofindustry convergence: evidence from nutraceuticals and functional foods. R&DManagement, 36(5), 487-498.
361
Brown, S. L., & Eisenhardt, K. M. (1995). Product Development: Past Research, PresentFindings, and Future Directions. The Academy of Management Review, 20(2), 343-378.
Brown, S. L., & Eisenhardt, K. M. (1997). The Art of Continuous Change: LinkingComplexity Theory and Time-Paced Evolution in Relentlessly Shifting Organizations.Administrative Science Quarterly, 42(1), 1-34.
Burgelman, R. A., & Sayles, L. R. (1986). Inside corporate innovation: Strategy, structureand managerial skills. New York: The Free Press.
Burns, A. C., & Bush, R. F. (2008). Marketing Research & SPSS 13.0 Student CD Pkg. ValuePackage (includes Qualtrics Access).
Burns, A. C., & Bush, R. F. (2009). Marketing Research: Global Edition (6th Edition). OneLake Street, Upper Saddle River, New Jersey: Pearson Education Inc., Prentice Hall.
Büschgens, T., Bausch, A., & Balkin, D. B. (2013). Organizational Culture and Innovation: AMeta-Analytic Review. Journal of Product Innovation Management, 30(4), 763-781.
Byrne, B. M. (2010). Structural equation modeling with AMOS: Basic concepts, applications,and programming (2nd Edition). New York, NY: Routledge.
Calantone, R. J., Chan, K., & Cui, A. S. (2006). Decomposing Product Innovativeness and ItsEffects on New Product Success. Journal of Product Innovation Management, 23(5),408-421.
Calantone, R. J., Garcia, R., & Droge, C. (2003). The Effects of Environmental Turbulence onNew Product Development Strategy Planning. Journal of Product InnovationManagement, 20(2), 90-103.
Calantone, R. J., Schmidt, J. B., & di Benedetto, A. (1997). New Product Activities andPerformance: The Moderating Role of Environmental Hostility. Journal of ProductInnovation Management, 14(3), 179-189.
Callahan, J., & Lasry, E. (2004). The Importance of Customer Input in the Development ofVery New Products. R&D Management, 34(2), 107-120.
Campbell, D. T., & Fiske, D. W. (1959). Convergent and discriminant validation by themultitrait-multimethod matrix. Psychological Bulletin, 56(2), 81-105.
Caniëls, M. C. J., & Bakens, R. J. J. M. (2012). The effects of Project ManagementInformation Systems on decision making in a multi project environment. InternationalJournal of Project Management, 30(2), 162-175.
Cankurtaran, P., Langerak, F., & Griffin, A. (2013). Consequences of New ProductDevelopment Speed: A Meta-Analysis. Journal of Product Innovation Management,30(3), 465-486.
Cantner, U., & Pyka, A. (1998). Absorbing technological spillovers: simulations in anevolutionary framework. Industrial and Corporate Change, 7(2), 369-397.
Carmines, E. G., & Zeller, R. A. (1979). Reliability and Validity Assessment. Beverly Hills,CA: Sage.
Carrillat, F. A., Jaramillo, F., & Locander, W. B. (2004). Market-Driving Organizations: AFramework. Academy of Marketing Science Review, 2004(5), 1-14.
Cavusgil, S. T., & Zou, S. (1994). Marketing Strategy-Performance Relationship: AnInvestigation of the Empirical Link in Export Market Ventures. Journal of Marketing,58(1), 1-21.
Chan, V., Musso, C., & Shankar, V. (2008). McKinsey global survey results: Assessinginnovation metrics. Retrieved 16 November, 2010, fromhttps://www.mckinseyquarterly.com/McKinsey_Global_Survey_Results_Assessing_innovation_metrics_2243
362
Chandy, R. K., & Tellis, G. J. (1998). Organizing for Radical Product Innovation: TheOverlooked Role of Willingness to Cannibalize. Journal of MarketingResearch(November), 474-487.
Chandy, R. K., & Tellis, G. J. (2000). The Incumbent's Curse? Incumbency, Size, and RadicalProduct Innovation. The Journal of Marketing, 64, 1-17.
Charnsripinyo, C. (2008). Measuring the Internet (User) Growth in Thailand. Paper presentedat the AINTEC2008, Pullman Bangkok King Power, Bangkok, Thailand.
Chaveerug, A., & Ussahawanitchakit, P. (2008). Learning Orientation, Innovation Capability,and Organizational Performance in Thai Audit Firms: Moderating Effects ofOrganization Climate and Uncertainty Environment. Review of Business Research,8(2), 92-102.
Chen, J., Damanpour, F., & Reilly, R. R. (2010). Understanding antecedents of new productdevelopment speed: A meta-analysis. Journal of Operations Management, 28(1), 17-33.
Chen, J., Guo, Y., & Zhu, H. (2012). Can me-too products prevail? Performance of newproduct development and sources of idea generation in China – an emerging market.R&D Management, 42(3), 273-288.
Chen, J., Reilly, R. R., & Lynn, G. S. (2005). The impacts of speed-to-market on new productsuccess: the moderating effects of uncertainty. Engineering Management Journal,52(2), 199-212.
Chen, Y.-S., Lin, M.-J. J., & Chang, C.-H. (2009). The positive effects of relationshiplearning and absorptive capacity on innovation performance and competitiveadvantage in industrial markets. Industrial Marketing Management, 38, 152-158.
Chesbrough, H. W., & Appleyard, M. M. (2007). Open innovation and strategy. CaliforniaManagement Review, 50(1), 57-76.
Chin, W. W. (1998). The Partial Least Squares Approach for Structural Equation Modelling.In G.A. Marcoulides (Ed), Modern Methods for Business Research (pp. 295-336):Lawrence Erlbaum, Philadelphia.
Chin, W. W. (2010). Bootstrap Cross-Validation Indices for PLS Path Model Assessment. InV. Esposito Vinzi, W. W. Chin, J. Henseler & H. Wang (Eds.), Handbook of PartialLeast Squares (pp. 83-97): Springer Berlin Heidelberg.
Chin, W. W., Marcolin, B., & Newsted, P. (2003). A Partial Least Squares Latent VariableModeling Approach for Measuring Interaction Effects: Results from a Monte CarloSimulation Study and an Electronic-Mail Emotion/Adoption Study. InformationSystems Research, 14(2), 189-217.
Chin, W. W., & Newsted, P. R. (1999). Structural equation modeling analysis with smallsamples using partial least squares. In: Hoyle, R.H. (Ed.), Statistical Strategies forSmall Sample Research: SAGE, Thousand Oaks, CA, 307-341.
Chiva, R., & Alegre, J. (2009). Investment in Design and Firm Performance: The MediatingRole of Design Management*. Journal of Product Innovation Management, 26(4),424-440.
Cho, D. S., Kim, D. J., & Rhee, D. K. (1998). Latecomer Strategies: Evidence from theSemiconductor Industry in Japan and Korea. Organization Science, 9(4), 489-505.
Cho, H.-J., & Pucik, V. (2005). Relationship between innovativeness, quality, growth,profitability, and market value. Strategic Management Journal, 26(6), 555-575.
Christensen, C. M. (1997). The Innovator's Dilemma: When New Technologies Cause GreatFirms to Fail. Boston, Mass.: Harvard Business School Press.
Christensen, C. M., & Bower, J. L. (1996). Customer Power, Strategic Investment, and theFailure of Leading Firms. Strategic Management Journal, 17(3), 197-218.

363
Christensen, C. M., & Overdorf, M. (2000). Meeting the Challenge of Disruptive Change.Harvard Business Review, 78(2), 66-77.
Churchill, G. A. (1979). A Paradigm for Developing Better Measures of MarketingConstructs. Journal of Marketing Research, 16(1), 64-73.
Churchill, G. A. (1991). Marketing research methodological foundations (5th Edition)Chicago, Dryden.
Churchill, G. A. (1995). Marketing research: Methodology foundation (6th Edition). Chicago,IL: Dryden Press.
Churchill, G. A. (1999). Marketing Research: Methodological foundation (7th Edition). USA,Dryden Press.
Churchill, G. A., & Iacobucci, D. (2005). Marketing Research: Methodological Foundations(9th Edition): Mason, Ohio: Thomson South-Western.
Clark, K. B., & Fujimoto, T. (1990). The Power of Product Integrity. Harvard BusinessReview, 68(6), 107-116.
Clark, K. B., & Fujimoto, T. (1991). Product Development Performance: Strategy,Organization, and Management in the World Auto Industry. Boston: Harvard BusinessSchool Press.
Cobanoglu, C., Warde, B., & Moreo, P. J. (2001). A comparison of mail, fax and web-basedsurvey methods. International journal of market research, 43(4), 441-452.
Cohen, W. M. (1995). Empirical Studies of Innovative Activity, in Stoneman, P (ed.):Handbook of the Economics of Innovation and Technological Change. Oxford:Blackwell.
Cohen, W. M., & Levinthal, D. A. (1990). Absorptive Capacity: A new perspective onlearning and innvoation. Administrative Science Quarterly, 35(1), 128-152.
Collins, J. C., & Porras, J. I. (1991). Organizational vision and visionary organizationsCalifornia Management Review, 34(1), 30-52.
Collis, D. J., & Montgomery, C. A. (1995). Competing on Resources: How do you create andsustain a profitable strategy? Harvard Business Review, 73(4), 118-128.
Conner, K. (1991). A Historical Comparison of Resource-Based Theory and Five Schools ofThought Within Industrial Organization Economics: Do We Have a New Theory ofthe Firm? Journal of Management, 17(1), 121-154.
Connole, H., Smith, R. J., & Wiseman, R. (1995). Research methodology 1: Issues andmethods in research. Study guide: Deakin University.
Cooper, R. G. (1984). New product strategies: What distinguishes the top performers?Journal of Product Innovation Management, 2, 151-164.
Cooper, R. G. (1988). Predevelopment activities determine new product success. IndustrialMarketing Management, 17(3), 237-247.
Cooper, R. G. (1990a). New products - What distinguishes the winners. Research -Technology Management, 33(6), 27-31.
Cooper, R. G. (1990b). Stage-gate systems: a new tool for managing new products. BusinessHorizons, 33(3), 44-54.
Cooper, R. G. (1993). Winning at New Products: Accelerating the Process from Idea toLaunch (2nd Edition): Addison-Wesley, Reading, MA.
Cooper, R. G. (1994). New Products: The Factors that Drive Success. InternationalMarketing Review, 11(1), 60-76.
Cooper, R. G. (1996). Overhauling the new product process. Industrial MarketingManagement, 25(6), 465-482.
Cooper, R. G. (1997). Fixing the fuzzy front end of the new product process: building thebusiness case. CMA magazine, 71(8), 21-23.
364
Cooper, R. G. (1998). Benchmarking new product performance: Results of the best practicesstudy. European Management Journal, 16(1), 1-17.
Cooper, R. G. (1999). The Invisible Success Factors in Product Innovation. Journal ofProduct Innovation Management, 16(2), 115-133.
Cooper, R. G. (2001). Winning at New Products, Accelerating the Process from Idea toLaunch (3rd Edition). Cambridge: Perseus Publishing.
Cooper, R. G. (2008). Perspective: The Stage-Gate® Idea-to Launch Process—Update,What's New, and NexGen Systems*. Journal of Product Innovation Management, 25,213-232.
Cooper, R. G. (2011). Perspective: The Innovation Dilemma: How to Innovate When theMarket Is Mature. Journal of Product Innovation Management, 28(1), 2-27.
Cooper, R. G., & de Brentani, U. (1991). New industrial financial services: Whatdistinguishes the winners. Journal of Product Innovation Management, 8(2), 75-90.
Cooper, R. G., & Edgett, S. J. (2006). Stage-Gate and the Critical Success Factors for NewProduct Development. Retrieved 05 May 2009, from BPTrends; ProductDevelopment Institute
Cooper, R. G., & Edgett, S. J. (2007). Generating Breakthrough New Product Ideas: Feedingthe Innovation Funnel. Ancaster, Ontario, Canada: Product Development Institute.
Cooper, R. G., & Edgett, S. J. (2008). Maximizing Productivity in Product Innovation.Research Technology Management, 51(2), 47-58.
Cooper, R. G., Edgett, S. J., & Kleinschmidt, E. J. (2001). Portfolio Management for NewProducts, 3rd Edition: Perseus Books, Reading.
Cooper, R. G., Edgett, S. J., & Kleinschmidt, E. J. (2002a). Optimizing the Stage-GateProcess: What Best Practice Companies are Doing - Part One. Research TechnologyManagement, 45(5), 1-14.
Cooper, R. G., Edgett, S. J., & Kleinschmidt, E. J. (2002b). Optimizing the Stage-GateProcess: What Best Practice Companies are Doing - Part Two. Research TechnologyManagement, 45(5), 1-11.
Cooper, R. G., Edgett, S. J., & Kleinschmidt, E. J. (2002c). Portfolio management:fundamental to new product success. In Belliveau, P., Griffin, A., and Somermeyer, S.(Eds.), The PDMA Toolbook for New Product Development (pp. 331-364): JohnWiley & Sons, Inc., New York.
Cooper, R. G., Edgett, S. J., & Kleinschmidt, E. J. (2003). Best practices in productinnovation: What distinguishes top performers. Product Development Institute, Inc.
Cooper, R. G., & Kleinschmidt, E. J. (1986). An Investigation into the New Product Process:Steps, Deficiencies, and Impact. Journal of Product Innovation Management, 3, 71-85.
Cooper, R. G., & Kleinschmidt, E. J. (1987a). New products: What separates winners fromlosers? Journal of Product Innovation Management, 4(3), 169-184.
Cooper, R. G., & Kleinschmidt, E. J. (1987b). Success factors in product innovation.Industrial Marketing Management, 16(3), 215-223.
Cooper, R. G., & Kleinschmidt, E. J. (1987c). What makes a new product a winner: Successfactors at the project level. R&D Management, 17(3), 175-189.
Cooper, R. G., & Kleinschmidt, E. J. (1993). Major new products: What distinguishes thewinners in the chemical industry? Journal of Product Innovation Management, 10(2),90-111.
Cooper, R. G., & Kleinschmidt, E. J. (1994a). Determinants of timeliness in productdevelopment. Journal of Product Innovation Management, 11(5), 381-396.
365
Cooper, R. G., & Kleinschmidt, E. J. (1994b). Screening new products for potential winners.IEEE Transactions on Engineering Management Journal, 22(4), 24-30.
Cooper, R. G., & Kleinschmidt, E. J. (1995a). Benchmarking the Firm's Critical SuccessFactors in New Product Development. Journal of Product Innovation Management,12, 374-391.
Cooper, R. G., & Kleinschmidt, E. J. (1995b). New Product performance: keys to success,profitability and cycle time reduction. Journal of Marketing Management, 11, 315-337.
Cooper, R. G., & Kleinschmidt, E. J. (1995c). Performance typologies of new productprojects. Industrial Marketing Management, 24(5), 439-456.
Cooper, R. G., & Kleinschmidt, E. J. (1996). Winning businesses in product development: thecritical success factors. Research Technology Management, 39(4), 18-29.
Cooper, R. G., & Kleinschmidt, E. J. (2000). New Product Performance: What Distinguishesthe Star Products. Australian Journal of Management (University of New SouthWales), 25(1), 17.
Cooper, R. G., & Kleinschmidt, E. J. (2010). Success Factors for New Product DevelopmentWiley International Encyclopedia of Marketing: John Wiley & Sons, Ltd.
Cordero, R. (1990). The measurement of innovation performance in the firm: An overview.Research Policy, 19(2), 185-192.
Cortina, J. M. (1993). What is coefficient alpha? An examination of theory and applications.Journal of applied psychology, 78(1), 98-104.
Couper, M. P. (2008). Designing effective Web surveys. New York: Cambridge UniversityPress.
Cousins, P. D., Lawson, B., Petersen, K. J., & Handfield, R. B. (2011). BreakthroughScanning, Supplier Knowledge Exchange, and New Product DevelopmentPerformance. Journal of Product Innovation Management, 28(6), 930-942.
Craig, A., & Hart, S. (1992). Where to Now in New Product Development Research?European Journal of Marketing, 26(11), 2-49.
Crawford, M. C. (1980). Defining the charter for product innovation. Sloan managementreview, 22(1), 3-12.
Crawford, M. C. (1992). The hidden costs of accelerated product development. Journal ofProduct Innovation Management, 9(3), 188-199.
Crawford, M. C. (1994). New Product Management, (4th Edition). Boston: Richard D. Irwin,Inc.
Crawford, M. C., & di Benedetto, A. (2000). New Products Management. Boston: McGraw-Hill.
Crawford, M. C., & di Benedetto, A. (2003). New Products Management, (7th Edition). NewYork: McGraw Hill/ Irwin.
Creswell, J. W. (1994). Research design: Sage publications Thousand Oaks, CA.Cronbach, L. J. (1951). Coefficient alpha and the internal structure of tests. Psychometrika,
16(3), 297-334.Cronbach, L. J., & Meehl, P. E. (1955). Construct validity in psychological tests.
Psychological bulletin, 52(4), 281-302.Cunha, M. P. E. (2007). Entrepreneurship as decision making: rational, intuitive and
improvisational approaches. Journal of Enterprising Culture, 15(1), 1-20.D'Aveni, R. A. (1994). HyperCompetition. Managing the Dynamics of Strategic Maneuvering
(pp. 83-93). New York: The Free Press.
366
D'Aveni, R. A., Canger, J. M., & Doyle, J. J. (1995). Coping with Hypercompetition:Utilizing the New 7S's Framework [and Executive Commentary]. The Academy ofManagement Executive, 9(3), 45-60.
Da Silva, N., & Davis, A. R. (2011). Absorptive capacity at the individual level: linkingcreativity to innovation in academia. The review of higher education 34(3), 355-379.
Daghfous, A. (2004). Absorptive capacity and the implementation of knowledge-intensivebest practices. SAM Advanced Management Journal, 69(2), 21-27.
Damanpour, F. (1991). Organizational Innovation: A Meta-Analysis of Effects ofDeterminants and Moderators. The Academy of Management Journal, 34(3), 555-591.
Dane, E., & Pratt, M. G. (2007). Exploring intuition and its role in managerial decisionmaking. Academy of Management Review, 32(1), 33-54.
Danneels, E. (2002). The dynamics of product innovation and firm competences. StrategicManagement Journal, 23(12), 1095-1121.
Danneels, E., & Kleinschmidt, E. J. (2001). Product innovativeness from the firm’sperspective: its dimensions and their relation with project selection and performance.Journal of Product Innovation Management, 18(6), 357-373.
Davenport, T. H. (1993). Process innovation: reengineering work through informationtechnology. Boston, MA: Ernst & Young Center for Information & Strategy, HarvardBusiness School Press.
Davis, F. D. (1989). Perceived Usefulness, Perceived Ease of Use, and User Acceptance ofInformation Technology. MIS Quarterly, 13(3), 319-340.
Dawes, J. (2008). Do data characteristics change according to the number of scale pointsused? An experiment using 5 point, 7 point and 10 point scales. International Journalof Market Research, 51(1).
Day, G. S. (1993). The Capabilities of Market-Driven Organizations. Cambridge, MA:Marketing Science Institute Report.
Day, G. S. (1994). The Capabilities of Market-Driven Organizations. the Journal ofMarketing, 58(4), 37-52.
Day, G. S. (1998). What Does it Mean to be Market-Driven? Business Strategy Review, 9(1),1-14.
Dayan, M., & Elbanna, S. (2011). Antecedents of Team Intuition and Its Impact on theSuccess of New Product Development Projects. Journal of Product InnovationManagement, 28(1), 159-174.
de Brentani, U. (1989). Success and failure in new industrial services. Journal of ProductInnovation Management, 6(4), 239-258.
de Brentani, U. (2001). Innovative versus incremental new business services: Different keysfor achieving success. Journal of Product Innovation Management, 18, 169-187.
de Brentani, U., & Kleinschmidt, E. J. (2004). Corporate Culture and Commitment: Impact onPerformance of International New Product Development Programs. Journal ofProduct Innovation Management, 21(5), 309-333.
de Brentani, U., Kleinschmidt, E. J., & Salomo, S. (2010). Success in Global New ProductDevelopment: Impact of Strategy and the Behavioral Environment of the Firm.Journal of Product Innovation Management, 27(2), 143-160.
de Brentani, U., & Reid, S. E. (2012). The Fuzzy Front-End of Discontinuous Innovation:Insights for Research and Management. Journal of Product Innovation Management,29(1), 70-87.
De Clercq, D., Thongpapanl, N., & Dimov, D. (2011). A Closer Look at Cross-FunctionalCollaboration and Product Innovativeness: Contingency Effects of Structural andRelational Context. Journal of Product Innovation Management, 28(5), 680-697.
367
de Vaus, D. A. (1985). Surveys in Social research: London: UCL Press Ltd.de Vaus, D. A. (1995). Surveys in Social research (4th Edition). Sydney, Allen and Unwin.De Vellis, R. F. (1991). Scale development: Theory and applications. Newbury Park, CA:
Sage.Deighton, J. A., Rizley, R., & Keane, S. (2012). Research Priorities of the Marketing Science
Institute. Marketing Science 31(6), 873-877.Denzin, N. K., & Lincoln, Y. S. (1994). Handbook of qualitative research, Thousands Oaks:
Sage Publications.Department of Commerce. (2013). Doing Business in Thailand, 2013 Country Commercial
Guide for U.S. Companies. from U.S. & FOREIGN COMMERCIAL SERVICE ANDU.S. DEPARTMENT OF STATE
Deshpandé, R., Farley, J. U., & Webster, F. E., Jr. (1993). Corporate Culture, CustomerOrientation, and Innovativeness in Japanese Firms: A Quadrad Analysis. Journal ofMarketing, 57(1), 23-37.
Deszca, G., Munro, H., & Noori, H. (1999). Developing Breakthrough Products: Challengesand Options for Market Assessment. Journal of Operations Management, 17, 613-630.
Dhamvithee, P., Shankar, B., Jangchud, A., & Wuttijumnong, P. (2005). New productdevelopment in Thai agro-industry: explaining the rates of innovation and success ininnovation. International Food and Agribusiness Management Review, 8(3), 1-20.
di Benedetto, A., DeSarbo, W. S., & Song, X. M. (2008). Strategic capabilities and radicalinnovation: An empirical study in three countries. Engineering Management, IEEETransactions on, 55(3), 420-433.
Diamantopoulos, A., Riefler, P., & Roth, K. P. (2008). Advancing formative measurementmodels. Journal of Business Research, 61(12), 1203-1218.
Diamantopoulos, A., & Siguaw, J. A. (2006). Formative Versus Reflective Indicators inOrganizational Measure Development: A Comparison and Empirical Illustration.British Journal of Management, 17(4), 263-282.
Diamantopoulos, A., & Winklhofer, H. M. (2001). Index Construction with FormativeIndicators: An Alternative to Scale Development. Journal of Marketing Research,38(2), 269-277.
Diefenbach, M. A., Weinstein, N. D., & O'Reilly, J. (1993). Scales for assessing perceptionsof health hazard susceptibility. Health Education Research, 8(2), 181-192.
Dillman, D. A. (1998). Mail and other self-administered surveys in the 21st century: Thebeginning of a new era. The Gallup Research Journal, 2(1), 121-140.
Dillman, D. A. (2000a). Mail and internet surveys: The tailored design method (Vol. 2). NewYork: John Wiley & Sons.
Dillman, D. A. (2000b). Mail and Internet surveys: The tailored design method. New York:John Wiley & Sons, Inc.
Dillon, W. R., Madden, T. J., & Firtle, N. H. (1990). Marketing research in a marketenvironment. Boston, MA: Irwin.
Dixon, R., & Turner, R. (2007). Electronic vs. conventional surveys. In R. A. Reynolds, R.Woods, & J. D. Baker (Eds.). Handbook of research on electronic surveys andmeasurements, pp. 104-111: Hershey, PA: Idea Group Reference.
Dodgson, M., Gann, D., & Salter, A. (2005). Think, Play, Do: Technology and Organizationin the Emerging Innovation Process: Oxford: Oxford University Press.
Dougherty, D. (1995). Managing your core incompetencies for corporate venturing.Entrepreneurship Theory and Practice, 19, 113-136.
368
Dougherty, D., & Heller, T. (1994). The Illegitimacy of Successful Product Innovation inEstablished Firms. Organization Science, 5(2), 200-218.
Douglas, S. P., & Craig, C. S. (2007). Collaborative and Iterative Translation: An AlternativeApproach to Back Translation. Journal of International Marketing, 15(1), 30-43.
Doyle, P. (1994). Setting business objectives and measuring performance. EuropeanManagement Journal, 12(2), 123-132.
Dröge, C., Calantone, R. J., & Harmancioglu, N. (2008). New Product Success: Is It ReallyControllable by Managers in Highly Turbulent Environments? Journal of ProductInnovation Management, 25(3), 272-286.
Dröge, C., Jayaram, J., & Vickery, S. K. (2000). The Ability to Minimize the Timing of NewProduct Development and Introduction: An Examination of Antecedent Factors in theNorth American Automobile Supplier Industry. Journal of Product InnovationManagement, 17(1), 24-40.
Dunford, B. B., Snell, S. A., & Wright, P. M. (2003). Human Resources and The ResourceBased View of the Firm, School of Industrial and Labour Relations. Center forAdvanced of Human Resource Studies, Cornell University, Ithaca, NY, 1-35.
Dwyer, L., & Mellor, R. (1991a). New product process activities and project outcomes. R&DManagement, 21(1), 31-42.
Dwyer, L., & Mellor, R. (1991b). Organizational environment, new product process activities,and project outcomes. Journal of Product Innovation Management, 8(1), 39-48.
Dyer, B., Gupta, A. K., & Wilemon, D. (1999a). How to be a first-to-market company.Chemtech, 29(6), 56-61.
Dyer, B., Gupta, A. K., & Wilemon, D. (1999b). What first-to-market companies dodifferently. Research-Technology Management, 42(2), 15-21.
Echambadi, R., & Hess, J. D. (2007). Mean-Centering Does Not Alleviate CollinearityProblems in Moderated Multiple Regression Models. Marketing Science, 26(3), 438-445.
Edwards, J. R. (2001). Multidimensional constructs in organizational behavior research: Anintegrative analytical framework. Organizational Research Methods, 4(2), 144-192.
Efron, B., & Tibshirani, R. J. (1993). An introduction to the bootstrap. New York: Chapman& Hall.
Eisenberg, I. (2011). Lead-user research for breakthrough innovation. Research-TechnologyManagement, 54(1), 50-58.
Eisenhardt, K. M. (1999). Strategy as strategic decision making. Sloan management review,40(3), 65-72.
Eisenhardt, K. M., & Martin, J. A. (2000). Dynamic capabilities: what are they? StrategicManagement Journal, 21, 1105-1121.
Eling, K., Griffin, A., & Langerak, F. (2013). Using Intuition in Fuzzy Front-End Decision-Making: A Conceptual Framework. Journal of Product Innovation Management,31(5), 1-17.
Emory, C. W., & Cooper, D. R. (1991). Business Research Methods: Homewood, IL: Irwin.Escribano, A., Fosfuri, A., & Tribo, J. (2005). Managing knowledge spillovers: the impact of
absorptive capacity on innovation performance,http://www.fep.up.pt/conferences/earie2005/cd_rom/session%20v/v.m/escriban.pdf.
Escribano, A., Fosfuri, A., & Tribó, J. A. (2009). Managing external knowledge flows: Themoderating role of absorptive capacity. Research Policy, 38(1), 96-105.
Ettlie, J. E., Bridges, W. P., & O'Keefe, R. D. (1984). Organization Strategy and StructuralDifferences for Radical Versus Incremental Innovation. Management Science, 30(6),682-695.
369
Ettlie, J. E., & Elsenbach, J. M. (2007). Modified Stage-Gate Regimes in New ProductDevelopment. Journal of Product Innovation Management, 24, 20-33.
Evered, R., & Louis, M. R. (1991). Research perspectives. In N. Craig Smith & P. Dainty(Eds.), The Management Research Book. London: Routledge.
Fang, E. (2008). Customer participation and the trade-off between new productinnovativeness and speed to market. Journal of Marketing, 72(4), 90-104.
Field, A. (2009). Discovering Statistics Using SPSS, (3rd Edition). London, England: SagePublications, Ltd.
Fisher, R. J., Maltz, E., & Jaworski, B. J. (1997). Enhancing Communication betweenMarketing and Engineering: The Moderating Role of Relative FunctionalIdentification. Journal of Marketing, 61(3), 54-70.
Fiske, D. W. (1982). Convergent-Discriminant Validation in Measurements and ResearchStrategies. In Brinberg, D. & Kidder, L. H. (Eds.), Forms of Validity in Research, pp.77-92. San Francisco, CA: Jossey-Bass.
Flatten, T. C., Engelen, A., Zahra, S. A., & Brettel, M. (2011). A measure of absorptivecapacity: scale development and validation. European Management Journal, 29, 98-116.
Fleming, C. M., & Bowden, M. (2009). Web-based surveys as an alternative to traditionalmail methods. Journal of Environmental Management, 90(1), 284-292.
Fornell, C., & Bookstein, F. L. (1982). A comparative analysis of two structural equationmodels: LISREL and PLS applied to market data. In C. Fornell (Ed.), A secondgeneration of multivariate analysis (pp. 289–323). New York, Praeger.
Fornell, C., & Larcker, D. F. (1981). Evaluating Structural Equation Models withUnobservable Variables and Measurement Error. Journal of Marketing Research,18(1), 39-50.
Foss, N. J., & Knudsen, T. (2003). The Resource-Based Tangle: Towards a SustainableExplanation of Competitive Advantage. Managerial and Decision Economics, 24(4),291-307.
Fourt, L. A., & Woodlock, J. W. (1960). Early Prediction of Market Success for New GroceryProducts. Journal of Marketing, 25(2), 31-38.
Freeman, C. (1994). The Economics of Technical Change. Cambridge Journal of Economics,18, 463-514.
Garcia, R., & Calantone, R. J. (2002). A Critical Look at Technological Innovation Typologyand Innovativeness Terminology: A Literature Review. Journal of Product InnovationManagement, 19(2), 110-132.
Garcia, R., Calantone, R. J., & Levine, R. (2003). The Role of Knowledge in ResourceAllocation to Exploration versus Exploitation in Technologically OrientedOrganizations*. Decision Sciences, 34(2), 323-349.
Garson, G. D. (2009). Structural equation modeling. Statnotes: Topics in multivariateanalysis.
Gatignon, H., & Xuereb, J.-M. (1997). Strategic Orientation of the Firm and New ProductPerformance. Journal of Marketing Research, 34(1), 77-90.
Gellman Research Associates. (1982). The relationship between industrial concentration, firmsize, and technological innovation, prepared for the Office of Advocacy, U.S. SmallBusiness Administration under award no. SBA-2633-OA-79.
Gendall, P., & Healey, B. (2008). Alternatives to prepaid monetary incentives in mail surveys.International Journal of Public Opinion Research, 20(4), 517-527.
Gilbert, C. (2005). Unbundling the Structure of Inertia: Resource Versus Routine Rigidity.Academy of Management Journal, 48(5), 741-763.
370
Giuliani, E., & Bell, M. (2005). The micro-determinants of meso-level learning andinnovation: evidence from a Chilean wine cluster. Research Policy, 34(1), 47-68.
Global Entrepreneurship Monitor. (2011). GEM Thailand - 2011 National Report. (Bangkok,Thailand).
Globerman, S. (1975). Technological diffusion in the Canadian carpet industry. ResearchPolicy, 4(2), 190-206.
Goffin, K., & Koners, U. (2011). Tacit knowledge, lessons learnt, and new productdevelopment. Journal of Product Innovation Management, 28(2), 300-318.
Goktan, A. B., & Miles, G. (2011). Innovation speed and radicalness: are they inverselyrelated? Management Decision, 49(4), 533-547.
Götz, O., Liehr-Gobbers, K., & Krafft, M. (2010). Evaluation of Structural Equation ModelsUsing the Partial Least Squares (PLS) Approach. In: Vinzi, V E, Chin, W W,Henseler, Jet al (Eds) handbook of Partial Least Squares: Concepts, Methods andApplications, pp 691–711. Springer, Heidelberg.
Government Public Relations Department. (2009). His Majesty King Bhumibol AdulyadejPresented with WIPO's Global Leaders Award. THE MONARCHY. Retrieved 16June, 2010, from http://thailand.prd.go.th/view_news.php?id=4042&a=1
Grant, R. M. (1991). The Resource-Based Theory of Competitive Advantage: Implications forStrategy Formulation California Management Review, 33(3), 114-135.
Green, P. E., Tull, D. S., & Albaum, G. (1988). Research for marketing decisions: EnglewoodCliffs, NJ: Prentice Hall.
Green, S. G., Gavin, M. B., & Aiman-Smith, L. (1995). Assessing a multidimensionalmeasure of radical technological innovation. Engineering Management, IEEETransactions on, 42(3), 203-214.
Greenleaf, E. A. (1992). Improving rating scale measures by detecting and correcting biascomponents in some response styles. Journal of Marketing Research, 29(2), 176-188.
Grewal, R., Cote, J. A., & Baumgartner, H. (2004). Multicollinearity and Measurement Errorin Structural Equation Models: Implications for Theory Testing. Marketing Science,23(4), 519-529.
Griffin, A. (1993). Metrics for measuring product development cycle time. Journal of ProductInnovation Management, 10(2), 112-125.
Griffin, A. (1997a). Modeling and measuring product development cycle time acrossindustires Journal of Engineering and Technology Management, 14, 1-24.
Griffin, A. (1997b). PDMA Research on New Product Development Practices: UpdatingTrends and Benchmarking Best Practices. Journal of Product InnovationManagement, 14, 429-458.
Griffin, A., & Hauser, J. R. (1993). The Voice of the Customer. Marketing Science, 12(1), 1-27.
Griffin, A., & Page, A. L. (1993). An Interim Report on Measuring Product DevelopmentSuccess and Failure. Journal of Product Innovation Management, 10(4), 291-308.
Griffin, A., & Page, A. L. (1996). PDMA Success Measurement Project: RecommendedMeasures for Product Development Success and Failure. Journal of ProductInnovation Management, 13(6), 478-496.
Gronum, S., Verreynne, M.-L., & Kastelle, T. (2012). The Role of Networks in Small andMedium-Sized Enterprise Innovation and Firm Performance. Journal of SmallBusiness Management, 50(2), 257-282.
Grunfeld, L. (2004). The multiple faces of R&D: Absorptive capacity effects and differentsources of spillovers. Norwegian Institute of International Affairs, Oslo.
371
Guba, E. G., & Lincoln, Y. S. (1994). Competing paradigms in qualitative research.Handbook of qualitative research, 2, 105-117.
Guo, L. (2008). PERSPECTIVE: An Analysis of 22 Years of Research in JPIM*. Journal ofProduct Innovation Management, 25(3), 249-260.
Gupta, A. K., & Govindarajan, V. (2000). Knowledge flows within multinationalcorporations. Strategic Management Journal, 21(4), 473-496.
Gupta, A. K., & Wilemon, D. (1990). Accelerating Development of Technology-Based NewProducts. California Management Review, 32(2), 24-44.
Haenlein, M., & Kaplan, A. (2004). A Beginner's Guide to Partial Least Squares Analysis.Understanding Statistics, 3(4), 283-297.
Hair, J. F., Anderson, R. E., Tatham, R. L., & Black, W. C. (1998). Multivariate DataAnalysis with Readings (4th Edition). Englewood Cliffs, NJ: Prentice-Hall.
Hair, J. F., Black, W. C., Babin, B. J., & Anderson, R. E. (2010). Multivariate Data Analysis(7 Edition): Prentice Hall.
Hair, J. F., Black, W. C., Babin, B. J., Anderson, R. E., & Tatham, R. L. (2006). MultivariateData Analysis (6th Edition): Upper Saddle River: Pearson.
Hair, J. F., Lukas, B., Miller, K., Bush, R., & Ortinau, D. (2012a). Marketing Research.Australia: McGraw Hill
Hair, J. F., Ringle, C. M., & Sarstedt, M. (2011). PLS-SEM: Indeed a Silver Bullet. TheJournal of Marketing Theory and Practice, 19(2), 139-151.
Hair, J. F., Sarstedt, M., Ringle, C. M., & Mena, J. A. (2012b). An assessment of the use ofpartial least squares structural equation modeling in marketing research. Journal of theAcademy of Marketing Science, 40(3), 414-433.
Hamel, G., & Prahalad, C. K. (1994a). Competing for the Future: Boston: MA, HarvardBusiness School Press.
Hamel, G., & Prahalad, C. K. (1994b). Seeing the future first. Fortune, 130(September 5), 64-70.
Hamel, G., & Prahalad, C. K. (2005). Strategic intent. Harvard Business Review, 83(7), 148-161.
Hammedi, W., van Riel, A. C. R., & Sasovova, Z. (2011). Antecedents and Consequences ofReflexivity in New Product Idea Screening*. Journal of Product InnovationManagement, 28(5), 662-679.
Han, J. K., Kim, N., & Srivastava, R. K. (1998). Market Orientation and OrganizationalPerformance: Is Innovation a Missing Link? Journal of Marketing, 62, 30-45.
Harmancioglu, N., Dröge, C., & Calantone, R. J. (2009). Theoretical lenses and domaindefinitions in innovation research. European Journal of Marketing, Vol. 43(1/2), 229 -263.
Hart, S., Hultink, E. J., Tzokas, N., & Commandeur, H. R. (2003). Industrial companies'evaluation criteria in new product development gates. Journal of Product InnovationManagement, 20(1), 22-36.
Harter, D. E., Krishnan, M. S., & Slaughter, S. A. (2000). Effects of Process Maturity onQuality, Cycle Time, and Effort in Software Product Development. ManagementScience, 46(4), 451-466.
Harvey, G., Skelcher, C., Spencer, E., Jas, P., & Walshe, K. (2010). Absorptive Capacity in anon-market environment. Public management review, 12(1), 77-97.
Hassenzahl, M. (2001). The Effect of Perceived Hedonic Quality on Product Appealingness.International Journal of Human-Computer Interaction, 13(4), 481-499.
Hauser, J. R., Tellis, G. J., & Griffin, A. (2006). Research on Innovation: A Review andAgenda for Marketing Science. Marketing Science, 25(6), 687-717.

372
Hayes, A. F. (2005). Statistical methods for communication science. NJ, Erlbaum: Mahwah.Hayes, A. F., & Matthes, J. (2009). Computational procedures for probing interactions in OLS
and logistic regression: SPSS and SAS implementations. Behavior Research Methods,41(3), 924-936.
Haynes, S. N., Richard, D. C. S., & Kubany, E. S. (1995). Content Validity in PsychologicalAssessment: A Functional Approach to Concepts and Methods. AmericanPsychological Association, 7(3), 238-247.
Healy, M., & Perry, C. (2000). Comprehensive criteria to judge validity and reliability ofqualitative research within the realism paradigm. Qualitative Market Research: AnInternational Journal, 3(3), 118-126.
Heeler, R. M., & Ray, M. L. (1972). Measure Validation in Marketing. Journal of MarketingResearch, 9(4), 361-370.
Heidt, T. V. D. (2008). Developing and testing a model of cooperative interorganisationalrelationships (IORs) in product innovation in an Australian manufacturing context: amulti-stakeholder perspective. Sourthern Cross University, Lismore.
Hekkert, P., & van Dijk, M. B. (2011). Vision in design: A guidebook for innovators.Amsterdam: BIS publishers.
Henard, D. H., & Szymanski, D. M. (2001). Why Some New Products Are More SuccessfulThan Others. Journal of Marketing Research, 38(3), 362-375.
Henseler, J., & Chin, W. W. (2010). A Comparison of Approaches for the Analysis ofInteraction Effects between Latent Variables Using Partial Least Squares PathModeling. Structural Equation Modeling: A Multidisciplinary Journal, 17(1), 82-109.
Henseler, J., & Fassott, G. (2010). Testing Moderating Effects in PLS Path Models: AnIllustration of Available Procedures. In V. Esposito Vinzi, W. W. Chin, J. Henseler &H. Wang (Eds.), Handbook of Partial Least Squares: Concepts, Methods andApplications (Vol. 2, pp. 713-735). Berlin Heidelberg: Springer Berlin Heidelberg.
Henseler, J., Ringle, C. M., & Sinkovics, R. (2009). The use of partial least squares pathmodeling in international marketing. Advances in International Marketing(20), 277-319.
Herrmann, A., Tomczak, T., & Befurt, R. (2006). Determinants of radical productinnovations. European Journal of Innovation Management, 9(1), 20-43.
Hildebrandt, F. (1998). Identification of a gene for nephronophthisis. Nephrology DialysisTransplantation, 13(6), 1334-1336.
Hill, C. W. L., & Rothaermel, F. T. (2003). The Performance of Incumbent firms in the faceof Radical Technological Innovation. Academy of Management Review, 28(2), 257-274.
Hill, N., & Alexander, J. (2006). The Handbook of Customer Satisfaction and LoyaltyMeasurement: Hampshire: Gower.
Hills, S. B., & Sarin, S. (2003). From Market Driven to Market Driving: An AlternateParadigm for Marketing in High Technology Industries. Journal of MarketingTheoryand Practice, 11(3), 13-24.
Hise, R. T., O'Neal, L., Parasuraman, A., & McNeal, J. U. (1990). Marketing/R&Dinteraction in new product development: Implications for new product success rates.Journal of Product Innovation Management, 7(2), 142-155.
Hofstetter, R., Miller, K. M., Krohmer, H., & Zhang, Z. J. (2013). How Do ConsumerCharacteristics Affect the Bias in Measuring Willingness to Pay for InnovativeProducts? Journal of Product Innovation Management, 30(5), 1042-1053.
Holahan, P. J., Sullivan, Z. Z., & Markham, S. K. (2014). Product Development as CoreCompetence: How Formal Product Development Practices Differ for Radical, More

373
Innovative, and Incremental Product Innovations. Journal of Product InnovationManagement, 31(2), 329-345.
Holland, J., & Gentry, J. W. (1999). Ethnic consumer reaction to targeted marketing: A theoryof intercultural accommodation. Journal of Advertising, 28(1), 65-77.
Homburg , C., & Giering, A. (1996). Conceptualization and operationalization of complexconstructs. Marketing ZFP, 18(1), 5-24.
Hoskisson, R. E., Eden, L., Lau, C. M., & Wright, M. (2000). Strategy in emergingeconomies. Academy of management journal, 43(3), 249-267.
Hoyle, R. H., & Panter, A. T. (1995). Writing about structural equation models. In R. H.Hoyle (Ed.), Structural equation modeling: Concepts, issues, and applications (pp.159-176): Thousand Oaks, CA: Sage.
Huchzermeier, A., & Loch, C. H. (2001). Project Management Under Risk: Using the RealOptions Approach to Evaluate Flexibility in R&D. Management Science, 47(1), 85-101.
Hughes, G. D., & Chafin, D. C. (1996). Turning New Product Development into a ContinuousLearning Process. Journal of Product Innovation Management, 13(2), 89-104.
Hulland, J. (1999). Use of partial least squares (PLS) in strategic management research: areview of four recent studies. Strategic Management Journal, 20(2), 195-204.
Hulland, J., Chow, Y. H., & Lam, S. (1996). Use of causal models in marketing research: Areview. International Journal of Research in Marketing, 13(2), 181-197.
Hultink, E. J., Griffin, A., Hart, S., & Robben, H. S. J. (1997). Industrial New Product LaunchStrategies and Product Development Performance. Journal of Product InnovationManagement, 14(4), 243-257.
Hunt, S. D. (1991). Modern Marketing Theory: Critical Issues in the Philosophy of MarketingScience and Research. Cincinnati (Ohio): South-Western Publishing Co.
Hunt, S. D. (1997). Competing through relationships: Grounding relationship marketing inresource‐advantage theory. Journal of Marketing Management, 13(5), 431-445.
Hurley, R. F., & Hult, G. T. M. (1998). Innovation, Market Orientation, and OrganizationalLearning: An Integration and Empirical Examination. Journal of Marketing, 62(3),42-54.
Hussey, J., & Hussey, R. (1997). Business Research: A Practical Guide for Undergraduateand Postgraduate Students. London: Macmillan Press
Hyung-Jin Park, M., Lim, J. W., & Birnbaum-More, P. H. (2009). The Effect ofMultiknowledge Individuals on Performance in Cross-Functional New ProductDevelopment Teams*. Journal of Product Innovation Management, 26(1), 86-96.
Iansiti, M. (1995). Shooting the rapids: managing product development in turbulentenvironments. California Management Review, 38, 37-58.
Ilieva, J., Baron, S., & Healey, N. M. (2002). Online surveys in marketing research: pros andcons. International Journal of Market Research, 44(3), 361-376.
Intarakumnerd, P., Chairatana, P., & Tangchitpiboon, T. (2002). National innovation systemin less successful developing countries: the case of Thailand. Research Policy, 31(8–9), 1445-1457.
ITU. (2005). Core ICT Indictors, Partnership on Measuring ICT for Development. UN-ESCWA, Beirut.
Jansen, J. J., Van Den Bosch, F. A., & Volberda, H. W. (2005). Managing potential andrealized absorptive capacity: how do organizational antecedents matter? Academy ofManagement Journal, 48(6), 999-1015.
Jaruzelski, B., & Dehoff, K. (2009). Profits down, spending steady: the global innovation1000. Strategy business, 57(Winter).
374
Jarvis, C. B., MacKenzie, S. B., & Podsakoff, P. M. (2003). A Critical Review of ConstructIndicators and Measurement Model Misspecification in Marketing and ConsumerResearch. Journal of Consumer Research, 30(2), 199-218.
Jaworski, B. J., & Kohli, A. K. (1993). Market Orientation: Antecedents and Consequences.The Journal of Marketing, 57(3), 53-70.
Jaworski, B. J., Kohli, A. K., & Sahay, A. (2000). Market-driven Versus Driving Markets.Journal of the Academy Marketing Science, 28(1), 45-54.
Jelinek, M., & Schoonhoven, C. B. (1993). The innovation marathon: Lessons from hightechnology firms: San Francisco: Jossey-Bass.
Johne, F. A., & Snelson, P. A. (1988). Success factors in product innovation: A selectivereview of the literature. Journal of Product Innovation Management, 5(2), 114-128.
Johnson, S. C., & Jones, C. (1957). How to organize for new products. Harvard BusinessReview, 35(3), 49-62.
Jolly, V. K. (1997). Commercializing New Technologies: Getting from Mind to Market.Boston, MA: Harvard Business School Press.
Jones, O., & Craven, M. (2001). Absorptive Capacity and New Organisational Capabilities: ATCS Case Study. Manchester Metropolitan University Business School, WorkingPaper Series No. 01/02, Manchester.
Kahn, K. B. (2001). Market orientation, interdepartmental integration, and productdevelopment performance. Journal of Product Innovation Management, 18(5), 314-323.
Kahn, K. B., Barczak, G., Nicholas, J., Ledwith, A., & Perks, H. (2012). An Examination ofNew Product Development Best Practice. Journal of Product InnovationManagement, 29(2), 180-192.
Kahn, K. B., Castellion, G., & Griffin, A. (2005). The PDMA handbook of new productdevelopment (2nd Edition). Hoboken: John Wiley & Sons, Inc.
Kamien, M. I., & Zang, I. (2000). Meet me halfway: research joint ventures and absorptivecapacity. International Journal of Industrial Organization, 18(2), 995-1012.
Kanter, R. M. (1988). When a thousand flowers bloom. Research in OrganizationalBehaviour, 10, 169-211.
Kapelko, M. (2006). Evaluating efficiency in the framework of resource-based view of thefirm: evidence from Polish and Spanish textile and clothing industry. Bellaterra, 1, 1-56.
Kaplan, B., & Maxwell, J. A. (1994). Qualitative Research Methods for Evaluating ComputerInformation Systems. In J. G. Anderson, C. E. Aydin, and S. J. Jay (Eds.), EvaluatingHealth Care Information Systems, Methods and Applications, pp. 45-68: ThousandOaks, California: Sage Publications.
Katz, G. M. (2001). The “One Right Way” to gather the voice of the customer. PDMA VisionsMagazine, 25(4), 1-6.
Kelley, D. (2009). Adaptation and Organizational Connectedness in Corporate RadicalInnovation Programs*. Journal of Product Innovation Management, 26(5), 487-501.
Kerin, R. A., Varadarajan, P. R., & Peterson, R. A. (1992). First-Mover Advantage: ASynthesis, Conceptual Framework, and Research Propositions. Journal of Marketing,56(4), 33-52.
Kessler, E. H., & Bierly, P. E. (2002). Is faster really better? An empirical test of theimplications of innovation speed. Engineering Management, IEEE Transactions on,49(1), 2-12.
375
Kessler, E. H., & Chakrabarti, A. K. (1996). Innovation Speed: A Conceptual Model ofContext, Antecedents, and Outcomes. The Academy of Management Review, 21(4),1143-1191.
Kessler, E. H., & Chakrabarti, A. K. (1999). Speeding Up the Pace of New ProductDevelopment. Journal of Product Innovation Management, 16(3), 231-247.
Khatri, N., & Ng, H. A. (2000). The role of intuition in strategic decision making. HumanRelations, 53(1), 57-86.
Khurana, A., & Rosenthal, S. R. (1997). Integrating the Fuzzy Front End of New ProductDevelopment. Sloan management review, Winter, 103-120.
Khurana, A., & Rosenthal, S. R. (1998). Towards Holistic 'Front Ends' in New ProductDevelopment. Journal of Product Innovation Management, 15(1), 57-74.
Kim, J., & Wilemon, D. (2002a). Focusing the fuzzy front-end in new product development.R&D Management, 32(4), 269-279.
Kim, J., & Wilemon, D. (2002b). Strategic issues in managing innovation's fuzzy front-end.European Journal of Innovation Management, 5(1), 27-39.
Kim, J., & Wilemon, D. (2010). Accelerating the fuzzy front-end of NPD projects: methodsand management. International Journal of Engineering Management and Economics,1(1), 80-101.
Kim, L. (1997). The dynamics of Samsung's technological learning in semiconductors.California Management Review, 39(3), 86-101.
Kim, L. (1998). Crisis Construction and Organizational Learning: Capability Building inCatching-up at Hyundai Motor. Organization Science, 9(4), 506-521.
Kim, N., & Atuahene-Gima, K. (2010). Using Exploratory and Exploitative Market Learningfor New Product Development. Journal of Product Innovation Management, 27, 519-536.
Kim, N., Im, S., & Slater, S. F. (2013). Impact of Knowledge Type and Strategic Orientationon New Product Creativity and Advantage in High-Technology Firms. Journal ofProduct Innovation Management, 30(1), 136-153.
Kirzner, I. M. (1997). Entrepreneurial Discovery and the Competitive Market Process: AnAustrian Approach. Journal of Economic Literature, 35(1), 60-85.
Kleef, E. V., van Trijp, H. C. M., & Luning, P. (2005). Consumer Research in the EarlyStages of New Product Development: A Critical Review of Methods and Techniques.Food Quality and Preference, 16, 181-201.
Kleinschmidt, E. J., & Cooper, R. G. (1991). The impact of product innovativeness onperformance. Journal of Product Innovation Management, 8(4), 240-251.
Kleinschmidt, E. J., de Brentani, U., & Salomo, S. (2007). Performance of Global newproduct development programs: A resource-based view. Journal of ProductInnovation Management, 24, 419-441.
Kleinschmidt, E. J., de Brentani, U., & Salomo, S. (2010). Information Processing and Firm-Internal Environment Contingencies: Performance Impact on Global New ProductDevelopment. Creativity and Innovation Management, 19(3), 200-218.
Kline, R. B. (2005). Principles and practice of structural equation modeling. New York, NY:Guilford Press.
Klochikhin, E. A., & Shapira, P. (2012). Engineering Small Worlds in a Big Society:Assessing the Early Impacts of Nanotechnology in China. Review of Policy Research,29(6), 752-775.
Kneller, R., & Stevens, P. A. (2002). Absorptive Capacity and Frontier Technology: Evidencefrom OECD Manufacturing Industries. Oxford Bulletin of Economics & Statistics,68(1), 1-21.

376
Knight, G. A., & Cavusgil, S. T. (2004). Innovation, Organizational Capabilities, and theBorn-Global Firm. Journal of International Business Studies, 35(2), 124-141.
Knudsen, M. P., Dalum, B., & Villumsen, G. (2001). Two faces of absorptive capacitycreation: Access and utilisation of knowledge, DRUID, Aalborg.
Koberg, C. S., Detienne, D. R., & Heppard, K. A. (2003). An empirical test of environmental,organizational, and process factors affecting incremental and radical innovation. TheJournal of High Technology Management Research, 14(1), 21-45.
Koen, P. (2005). Chapter 6: The Fuzzy Front End for incremental, platform, and breakthroughproducts. In K. B. Kahn, G. Castellion & A. Griffin (Eds.), The PDMA Handbook ofNew Product Development (2nd Edition., pp. 81-91). Hoboken: John Wiley & Sons.Inc.
Koen, P., Ajamian, G., Boyce, S., Clamen, A., Fisher, E., Fountoulakis, S., . . . Seibert, R.(2002). Fuzzy-Front End: Effective Methods, Tools and Techniques. In P. Belliveau &S. Sorermeyer (Eds.), PDMA Toolbook for New Product Development (pp. 2-35). NewYork: John Wiley and Sons.
Koen, P., Ajamian, G., Burkart, R., Clamen, A. D., J., D'Amore, R., Elkins, C., . . . Wagner,K. (2001). Providing clarity and a common language to the "Fuzzy Front End".Research Technology Management, March-April, 44(2), 46-55.
Kogut, B., & Zander, U. (1992). Knowledge of the firm, combinative capabilities, and thereplication of technology. Organization Science, 3(3), 383-397.
Kohli, A. K., & Jaworski, B. J. (1990). Market Orientation: The Construct, ResearchPropositions, and Managerial Implications. Journal of Marketing, 54(2), 1-18.
Kortmann, S. (2014). The Mediating Role of Strategic Orientations on the Relationshipbetween Ambidexterity-Oriented Decisions and Innovative Ambidexterity. Journal ofProduct Innovation Management.
Koslow, S., Shamdasani, P. N., & Touchstone, E. E. (1994). Exploring Language Effects inEthnic Advertising: A Sociolinguistic Perspective. Journal of Consumer Research,20(4), 575-585.
Kostoff, R. N., & Schaller, R. R. (2000). Science and Technology Roadmaps. IEEETransactions on Engineering Management, 48(2), 132-143.
Kostopoulos, K., Papalexandris, A., Papachroni, M., & Loannou, G. (2011). Absorptivecapacity, innovation, and financial performance. Journal of Business Research,64(12), 1335-1343.
Kotler, P., & Keller, K. L. (2005). Marketing Management, (13th Edition). Upper SaddleRiver, NJ: Pearson Education Inc.
Kotler, P., & Keller, K. L. (2009). Marketing Management (13th Edition). Upper SaddleRiver: NJ: Prentice Hall.
Kromrey, J., & Foster-Johnson, L. (1998). Mean Centering in Moderated MultipleRegression: Much Ado about Nothing. Educational and Psychological Measurement,58(1), 42-67.
Kuhn, T. (1962). The structure of scientific revolutions. Chicago, IL: University of ChicagoPress.
Kumar, N. (1997). The Revolution in Retailing: from Market Driven to Market Driving. LongRange Planning, 30(6), 830-835.
Kumar, N., Scheer, L., & Kotler, P. (2000). From Market Driven to Market Driving.European Management Journal, 18(2), 129-142.
Kumar, N., Stern, L. W., & Anderson, J. C. (1993). Conducting interorganizational researchusing key informants. The Academy of Management Journal, 36(6), 1633-1651.

377
Lamore, P. R., Berkowitz, D., & Farrington, P. A. (2013). Proactive/Responsive MarketOrientation and Marketing—Research and Development Integration. Journal ofProduct Innovation Management, 30(4), 695-711.
Lane, P. J., Koka, B. R., & Pathak, S. (2006). The reification of absorptive capacity: a criticalreview and rejuvenation of the construct. Academy of Management Review, 31(4),833-863.
Lane, P. J., & Lubatkin, M. (1998). Relative absorptive capacity and interorganizationallearning. Strategic Management Journal, 19(5), 461-477.
Lane, P. J., Salk, J. E., & Lyles, M. A. (2001). Absorptive capacity, learning, andperformance in international joint ventures. Strategic Management Journal, 22(12),1139-1161.
Langerak, F., & Hultink, E. J. (2005). The impact of new product development accelerationapproaches on speed and profitability: lessons for pioneers and fast followers.Engineering Management, IEEE Transactions on, 52(1), 30-42.
Langerak, F., Hultink, E. J., & Robben, H. S. J. (2004). The Impact of Market Orientation,Product Advantage, and Launch Proficiency on New Product Performance andOrganizational Performance. Journal of Product Innovation Management, 21(2), 79-94.
Lawless, M. W., & Anderson, P. C. (1996). Generational Technological Change: Effects ofInnovation and Local Rivalry on Performance. The Academy of Management Journal,39(5), 1185-1217.
Leach, L. M. (2013). Eliminate Item Non-Response: The Effect of Forcing Respodents toAnswer in Web Surveys. Paper presented at the The American Association for PublicOpinion Research (AAPOR) 68th Annual Conference Boston, Massachusetts.
Leifer, R. (1998). An information processing approach for facilitating the fuzzy front end ofbreakthrough innovations. IEMC, 130-135.
Leifer, R., McDermott, C. M., O'Connor, G. C., Peters, L. S., Rice, M. P., & Veryzer, R. W.(2000). Radical Innovation: How Mature Companies Can Outsmart Upstarts. Boston,MA: Harvard Business School Press.
Leifer, R., O'Connor, G. C., & Rice, M. P. (2001). Implementing Radical Innovation inMature Firms: the Role of Hubs. Academy of Management Executive, 15(3), 102-113.
Leonard-Barton, D. (1992). Core Capabilities and Core Rigidities: A Paradox in ManagingNew Product Development. Strategic Management Journal, 13, 111-125.
Leonard-Barton, D. (1995). Wellsprings of Knowledge. Boston: Harvard Business SchoolPress.
Leonard-Barton, D., & Doyle, J. L. (1996). Commercializing technology: Imaginativeunderstanding of user needs. In R. Rosenbloom & W. Spencer (Eds.), Engines ofInnovation: U.S. Industrial Research at the End of an Era (pp. 177-207). Boston:Harvard Business School Press.
Lettle, C., Herstatt, C., & Gemuenden, H. G. (2006). Users' contributions to radicalinnovation: evidence from four cases in the field of medical equipment technology.R&D Management, 36(3), 251-272.
Lev, S., Fiegenbaum, A., & Shoham, A. (2009). Managing absorptive capacity stocks toimprove performance: Empirical evidence from the turbulent environment of Israelihospitals. European Management Journal, 27, 13-25.
Levinthal, D. A. (1994). Surviving Schumpeterian: An evolutionary perspective. New York:Oxford University Press.
Levinthal, D. A., & March, J. G. (1993). The myopia of learning. Strategic ManagementJournal, 14(Special Issue), 95-112.
378
Levitt, T. (1965). Exploit the product life cycle. Harvard Business Review, 43(November-December), 81-94.
Li, C. R., Lin, C. J., & Chu, C. P. (2008). The nature of market orientation and theambidexterity of innovations. Management Decision, 46(7), 1002-1026.
Li, H., & Atuahene-Gima, K. (2001). Product Innovation Strategy and The Performance ofNew Technology Ventures in China. Academy of Management Journal, 44(6), 1123-1134.
Li, T., & Calantone, R. J. (1998). The Impact of Market Knowledge Competence on NewProduct Advantage: Conceptualization and Empirical Examination. Journal ofMarketing, 62(4), 13-29.
Lichtenthaler, U., & Lichtenthaler, E. (2009). A Capability-Based Framework for OpenInnovation: Complementing Absorptive Capacity. Journal of Management Studies,46(8), 1315-1338.
Lieberman, M. B., & Montgomery, D. B. (1998). First-mover (dis)advantages: Retrospectiveand link with the resource-based view. Strategic Management Journal, 19, 1111-1125.
Likert, R. (1932). A technique for the measurement of attitudes. Archives of Psychology,140(55).
Lilien, G. L., Morrison, P. D., Searls, K., Sonnack, M., & von Hippel, E. (2002). PerformanceAssessment of the Lead User Idea-Generation Process for New Product Development.Management Science, 48(8), 1042-1059.
Lindgren, L. M., & O'Connor, G. C. (2011). The Role of Future-Market Focus in the EarlyStages of NPD across Varying Levels of Innovativeness. Journal of ProductInnovation Management, 28(5), 787-800.
Liu, X., & White, R. S. (1997). The relative contributions of foreign technology and domesticinputs to innovation in Chinese manufacturing industries. Technovation, 17(3), 119-125.
Lorken, B., Pirie, P., Virnig, K. A., Hinkle, R. L., & Salmon, C. T. (1987). The use of 0-10scales in telephone surveys. Journal of the Market Research Society, 29(3), 353-362.
Luck, D. J., & Rubin, R. S. (1987). Marketing Research (7th Edition). NJ: Englewood Cliffs:Prentice Hall.
Luecke, R., & Katz, R. (2003). Managing creativity and innovation. Boston, MA: HarvardBusiness School Press.
Lukas, B. A., & Ferrell, O. C. (2000). The Effect of Market Orientation on ProductInnovation. Journal of the Academy Marketing Science, 28(2), 239-247.
Lynn, G. S. (1999). An exploratory study of project vision: its components and impact oninnovation success. International Journal of Innovation Management, 3(1), 91-109.
Lynn, G. S., Abel, K. D., Valentine, W. S., & Wright, R. C. (1999a). Key Factors inIncreasing Speed to market and Improving New Product Success Rates. IndustrialMarketing Management, 28, 319-326.
Lynn, G. S., & Akgün, A. E. (1998). Innovation strategies under uncertainty: a contingencyapproach for new product development. Engineering Management Journal, 10(3), 11-18.
Lynn, G. S., & Akgün, A. E. (2001). Project visioning: Its components and impact on newproduct success. Journal of Product Innovation Management, 18, 374-387.
Lynn, G. S., Akgün, A. E., & Keskin, H. (2003). Accelerated learning in new productdevelopment teams. European Journal of Innovation Management, 6(4), 201-212.
Lynn, G. S., & Green, C. (1998). Market Forecasting for High-Tech Vs Low-Tech IndustrialProducts. Engineering Management Journal, 10, 15-18.
379
Lynn, G. S., Morone, J. G., & Paulson, A. S. (1996). Marketing and DiscontinuousInnovation: The Probe and Learn Process. California Management Review, 38(3), 8-37.
Lynn, G. S., Reilly, R. R., & Akgün, A. E. (2000). Knowledge management in new productteams: practices and outcomes. Engineering Management, IEEE Transactions on,47(2), 221-231.
Lynn, G. S., Skov, R. B., & Abel, K. D. (1999b). Practices that Support Team Learning andTheir Impact on Speed to Market and New Product Success. Journal of ProductInnovation Management, 16(5), 439-454.
MacCormack, A., Crandall, W., Henderson, P., & Toft, P. (2012). Do You Need a NewProduct-Development Strategy? Aligning Process With Context. Research-Technology Management, 55(1), 34-43.
MacKenzie, S. B., & Podsakoff, P. M. (2012). Common method bias in marketing: causes,mechanisms, and procedural remedies. Journal of Retailing, 88(4), 542-555.
Mahajan, V., & Wind, Y. (1990). Innovation Diffusion Models of New Product Acceptance.A Reexamination.
Mahoney, J. T., & Pandian, J. R. (1992). The resource-based view within the conversation ofstrategic management. Strategic Management Journal, 13(5), 363-380.
Maidique, M. A., & Zirger, B. J. (1984). A study of success and failure in product innovation:the case of the US electronics industry. IEEE Transactions in EngineeringManagement, 31(4), 192-203.
Malhotra, N. K. (2007). Marketing research: An applied approach. New Jersey: PearsonEducation, Inc.
Malhotra, N. K. (2009a). Basic marketing research: A decision–making approach (3rdEdition). New Jersey: Pearson Education, Inc.
Malhotra, N. K. (2009b). Marketing Research: An Applied Orientation (6th Edition), SPSS:Prentice Hall.
Malhotra, N. K. (2010). Marketing research: An applied orientation: Prentice Hall.Malhotra, N. K., Hall, J., Shaw, M., & Oppenheim, P. P. (2004). Essentials of marketing
research: an applied orientation. Frenchs Forest, NSW, Austrlia: Pearson-PrenticeHall.
Malhotra, N. K., Kim, S. S., & Patil, A. (2006). Common Method Variance in Is Research: AComparison of Alternative Approaches and a Reanalysis of past Research.Management Science, 52(12), 1865-1883.
Malhotra, N. K., Peterson, M., & Kleiser, S. B. (1999). Marketing Research: A state-of-the-artreview and directions for the twenty-first century. Journal of the Academy MarketingScience, 27(2), 160-183.
Mancusi, M. L. (2004). International Spillovers and Absorptive Capacity: A cross-country,cross-sector analysis based on European patents and citations. The Toyota Centre.
Mangematin, V., & Nesta, L. (1999). What kind of knowledge can a firm absorb?International Journal of Technology Management, 18(3), 149-172.
Manicas, P. T., & Secord, P. F. (1983). Implications for psychology of the new philosophy ofscience. American Psychologist, 38(4), 399-413.
Manion, M. T., & Cherion, J. (2009). Impact of Strategic Type on Success Measures forProduct Development Projects*. Journal of Product Innovation Management, 26(1),71-85.
Mansfield, E. (1961). Technical Change and the Rate of Imitation. Econometrica, 29(4), 741-766.
380
Maqsood, T., Finegan, A., & Walker, D. (2004). Biases and Heuristics in judgement anddecision making: the dark side of tacit knowledge. Science and InformationTechnology, 1, 295-301.
March, J. G. (1991). Exploration and exploitation in organizational learning. Organizationscience, 2(1), 71-87.
Markham, S. K. (1998). A Longitudinal Examination of How Champions Influence Others toSupport Their Projects. Journal of Product Innovation Management, 15(6), 490-504.
Markham, S. K. (2013). The Impact of Front-End Innovation Activities on ProductPerformance. Journal of Product Innovation Management, 30, 77-92.
Markham, S. K., & Griffin, A. (1998). The Breakfast of Champions: Associations BetweenChampions and Product Development Environments, Practices and Performance.Journal of Product Innovation Management, 15(5), 436-454.
Markham, S. K., & Lee, H. (2013a). Product Development and Management Association's2012 Comparative Performance Assessment Study. Journal of Product InnovationManagement, 30(3), 408-429.
Markham, S. K., & Lee, H. (2013b). Use of an Innovation Board to Integrate the Front End ofInnovation with Formal NDP Processes: A Longitudinal Study. Research-TechnologyManagement, 56(4), 37-44.
Markham, S. K., Ward, S. J., Aiman-Smith, L., & Kingon, A. I. (2010). The Valley of Deathas Context for Role Theory in Product Innovation. Journal of Product InnovationManagement, 27(3), 402-417.
Martin, J. (1995). Ignore Your Customer. Fortune, 131(8), 123-126.Martinsuo, M., & Poskela, J. (2011). Use of Evaluation Criteria and Innovation Performance
in the Front End of Innovation*. Journal of Product Innovation Management, 28(6),896-914.
Mascitelli, R. (2000). From Experience: Harnessing Tacit Knowledge to AchieveBreakthrough Innovation. Journal of Product Innovation Management, 17, 179-193.
May, T. (1993). Social research: Issues, methods, and process. Buckingham, England: OpenUniversity Press
McCarthy, I. P., Tsinopoulos, C., Allen, P., & Rose-Anderssen, C. (2006). New ProductDevelopment as a Complex Adaptive Systems of Decisions. Journal of ProductInnovation Management, 23, 437-456.
McDade, S. R., Oliva, T. A., & Pirsch, J. A. (2002). The organizational adoption of high-technology products “for use”: Effects of size, preferences, and radicalness of impact.Industrial Marketing Management, 31(5), 441-456.
McDermott, C. M. (1999). Managing Radical Product Development in Large ManufacturingFirms: A Longitudinal Study. Journal of Operations Management, 17, 631-644.
McDermott, C. M., & O'Connor, G. C. (2002). Managing radical innovation: an overview ofemergent strategy issues. Journal of Product Innovation Management, 19, 424-438.
McMillan, G. S., Muari, A., & Halmilton, R. D. (2003). The impact of publishing andpatenting activities on new product development and firm performance. The case ofthe US pharmaceutical industry. International Journal of Innovation Management,7(2), 213-223.
McNally, R. C., Akdeniz, M. B., & Calantone, R. J. (2011). New Product DevelopmentProcesses and New Product Profitability: Exploring the Mediating Role of Speed toMarket and Product Quality. Journal of Product Innovation Management, 28(1), 63-77.

381
McNally, R. C., & Schmidt, J. B. (2011). From the Special Issue Editors: An Introduction tothe Special Issue on Decision Making in New Product Development and Innovation.Journal of Product Innovation Management, 28(5), 619-622.
Meade, N., & Islam, T. (1998). Technological Forecasting—Model Selection, ModelStability, and Combining Models. Management Science, 44(8), 1115-1130.
Mehta, R., & Suvadas, E. (1995). Comparing response rates and response content in mailversus electronic mail surveys. Journal of the Market Research Society, 37(4), 429-439.
Menguc, B., Auh, S., & Yannopoulos, P. (2013). Customer and Supplier Involvement inDesign: The Moderating Role of Incremental and Radical Innovation Capability.Journal of Product Innovation Management, 31(2), 1-16.
Millson, M. R., Raj, S. P., & Wilemon, D. (1992). A survey of major approaches foraccelerating new product development. Journal of Product Innovation Management,9(1), 53-69.
Mishra, S., Kim, D., & Lee, D. H. (1996). Factors Affecting New Product Success: Cross-Country Comparisons. Journal of Product Innovation Management, 13(6), 530-550.
Mohr, J. J. (2001). Marketing of High Technology Products and Innovations. New York:Prentice Hall.
Mohr, J. J., Sengupta, S., & Slater, S. F. (2005). Marketing High Technology Products andInnovations. Englewood Cliffs, NJ: Prentice-Hall.
Montgomery, C. A. (1995). Resource-based and Evolutionary Theories of the Firm: Towardsa Shynthesis. Boston: Kluwer Acadmic Publishers.
Montoya-Weiss, M. M., & Calantone, R. (1994). Determinants of new product performance:A review and meta-analysis. Journal of Product Innovation Management, 11(5), 397-417.
Montoya-Weiss, M. M., & O'Driscoll, T. M. (2000). From Experience: ApplyingPerformance Support Technology in the Fuzzy Front End. Journal of ProductInnovation Management, 17(2), 143-161.
Moore, G. (1991). Crossing the Chasm. New York: Harper Collins Business.Morgan, D. L. (2007). Paradigms lost and pragmatism regained methodological implications
of combining qualitative and quantitative methods. Journal of mixed methodsresearch, 1(1), 48-76.
Moriarty, R. T., & Kosnik, T. J. (1989). High-tech marketing: concepts, continuity, andchange. Sloan management review, 30(4), 7-17.
Morone, J. G. (1993). Winning in High Tech Markets, Boston MA. Harvard Business SchoolPress.
Morse, J. M. (2003). Principles of mixed methods and multimethod research design.Handbook of mixed methods in social and behavioral research, 189-208.
Mowery, D. C., & Oxley, J. E. (1995). Inward technology transfer and competitiveness: therole of national innovation systems. Cambridge Journal of Economics, 19, 67-93.
Mowery, D. C., Oxley, J. E., & Silverman, B. S. (1996). Strategic alliances and interfirmknowledge transfer. Strategic Management Journal, 17, 77-91.
MSI. (2006). MSI Research Priorities 2006-2008. Retrieved 08 September, 2012, fromhttp://www.msi.org/pdf/MSI_RP06-08.pdf
MSI. (2008). MSI Research Priorities 2008-2010. Retrieved 16 August, 2013, fromhttp://www.msi.org/pdf/MSI_RP08-10.pdf
MSI. (2014). MSI Research Priorities 2014-2016. Retrieved 9 September, 2014, fromhttp://www.msi.org/uploads/files/MSI_RP14-16.pdf

382
Mullins, J. W., & Sutherland, D. J. (1998). New Product Development in Rapidly ChangingMarkets: An Exploratory Study. Journal of Product Innovation Management, 15, 224-236.
Murphy, S. A., & Kumar, V. (1997). The front end of new product developemnt: a Canadiansurvery. R&D Management, 27(1), 5-15.
Myers, S., & Marquis, D. G. (1969). Successful industrial innovations: National ScienceFoundation.
Narvekar, R. S., & Jain, K. (2006). A new framework to understand the technologicalinnovation process. Journal of Intellectual Capital, 7(2), 174-186.
Narver, J. C., & Slater, S. F. (1990). The Effect of a Market Orientation on BusinessProfitability. Journal of Marketing, 54(4), 20-35.
Narver, J. C., Slater, S. F., & MacLachlan, D. L. (2000). Total market orientation, businessperformance, and innovation. Cambridge, MA: Marketing Science Institute.
Narver, J. C., Slater, S. F., & MacLachlan, D. L. (2004). Responsive and Proactive MarketOrienation and New-Product Success. Journal of Product Innovation Management,21, 334-347.
National Innovation Agency. (2006). National Innovation Awards. Retrieved 26 December,2012, from http://www.nia.or.th/niaward/index_eng.html
National Innovation Agency. (2010a). Background of the National Innovation Agency,Thailand. Retrieved 17 June, 2013, fromhttp://www.nia.or.th/en/index.php?page=aboutus_background
National Innovation Agency. (2010b). NIA Strategy. Retrieved 17 April, 2012, fromhttp://www.nia.or.th/en/index.php?page=strategy_strategy
National Innovation Agency. (2011). เปดโลกนวตกรรมไทย (เลม4) 200ธรกจนวตกรรมสเศรษฐกจสรางสรรคของคนไทย (Vol. 4): Ministry of Science and Technology,Thailand.
National Innovation Agency. (2012). Thailand Top Innovation Companies 2012: ideas,design, new technologies, creativity: Jointy published by Green World Publication,Bangkok Thailand, and Marshall Cavendish Business Information, Singapore.
Neuman, W. L. (2000). Social research methods: Qualitative and quantitative approaches.Boston: MA: Allyn and Bacon.
Newey, L. R., & Shulman, A. D. (2004). Systemic absorptive capacity: creating early-to-market returns through R&D alliances. R&D Management, 34(5), 495-504.
Noori, H., Munro, H., Deszca, G., & McWilliams, B. (1999). Developing the "right"breakthrough product/service: an umbrella methodology-Part A. International Journalof Technology Management, 17(5), 544-562.
Norton, J., & Bass, F. (1989). A diffusion-theory model of adoption and substitution forsuccessive generations of high technology products. In W. Henry, M. Menasco & H.Tkada (Eds.), New Product Development and Testing. Massachusetts: LexingtonBooks.
Norusis, M. J. (1993). SPSS for Windows: Professional statistics, release 6.0. Chicago: SPSSInc.
Nunnally, J. C. (1967). Psychometric Methods: New York: McGraw Hill.Nunnally, J. C. (1978). Psychometric theory (2nd Edition): New York: McGraw-Hill.Nunnally, J. C., & Bernstein, I. H. (1994). Psychometric theory (3rd Edition). New York:
McGraw-Hill.O'Connor, G. C. (1998). Market Learning and Radical Innovation: A Cross Case Comparison
of Eight Radical Innovation Projects. Journal of Product Innovation Management, 15,151-166.
383
O'Connor, G. C. (2008). Major Innovation as a Dynamic Capability: A Systems Approach.Journal of Product Innovation Management, 25, 313-330.
O'Connor, G. C. (2010). Radical Innovation Wiley International Encyclopedia of Marketing:John Wiley & Sons, Ltd.
O'Connor, G. C., & Ayers, A. D. (2005). Building A Radical Innovation Competency.Research Technology Management, January-February, 23-31.
O'Connor, G. C., & DeMartino, R. (2006). Organizing for Radical Innovation: AnExploratory Study of the Structural Aspects of RI Management Systems in LargeEstablished Firms. Journal of Product Innovation Management, 23, 475-497.
O'Connor, G. C., & McDermott, C. M. (2004). The human side of radical innovation. Journalof Engineering and Technology Management, 21, 11-30.
O'Connor, G. C., Ravichandran, T., & Robeson, D. (2008). Risk management throughlearning: Management practices for radical innovation success. Journal of HighTechnology Management Research, 19, 70-82.
O'Connor, G. C., & Rice, M. P. (2001). Opportunity Recognition and BreakthroughInnovation in Large Established Firms. California Management Review, 43(2), 95-116.
O'Connor, G. C., & Rice, M. P. (2013a). A Comprehensive Model of Uncertainty Associatedwith Radical Innovation. Journal of Product Innovation Management, 30(S1), 2-18.
O'Connor, G. C., & Rice, M. P. (2013b). New Market Creation for Breakthrough Innovations:Enabling and Constraining Mechanisms. Journal of Product Innovation Management,30(2), 209-227.
O'Connor, G. C., & Veryzer, R. W. (2001). The Nature of Market Visioning for Technology-based Radical Innovation. Journal of Product Innovation Management, 18, 231-246.
O’Regan, N., & Ghobadian, A. (2004). The Importance of Capabilities for Strategic Directionand Performance. Management Decision, 42(2), 292-313.
OECD. (2011). OECD Studies on SMEs and Entrepreneurship, Thailand: Key Issues andPolicies: OECD Publishing.
Oliveira, M. G., & Rozenfeld, H. (2010). Integrating technology roadmapping and portfoliomanagement at the front-end of new product development. Technological Forecastingand Social Change, 77(8), 1339-1354.
Olson, E. M., & Slater, S. F. (2002). The balanced scorecard, competitive strategy, andperformance. Business Horizons, 45(3), 11-16.
Olson, E. M., Walker, O. C., Jr., & Ruekert, R. W. (1995). Organizing for Effective NewProduct Development: The Moderating Role of Product Innovativeness. Journal ofMarketing, 59(1), 48-62.
Olson, E. M., Walker, O. C., Ruekerf, R. W., & Bonnerd, J. M. (2001). Patterns ofcooperation during new product development among marketing, operations and R&D:Implications for project performance. Journal of Product Innovation Management,18(4), 258-271.
Oltra, M. J., & Flor, M. (2003). The Impact of Technological Opportunities and InnovativeCapabilities on Firms’ Output Innovation. Creativity and Innovation Management,12(3), 137-144.
Oppenheim, A. N. (1992). Questionnaire design, interviewing and attitude measurement.New York: NY: Pinter.
Ottum, B. D., & Moore, W. L. (1997). The Role of Market Information in New ProductSuccess/Failure. Journal of Product Innovation Management, 14(4), 258-273.
384
Page, A. L. (1993). Assessing new product development practices and performance:Establishing crucial norms. Journal of Product Innovation Management, 10(4), 273-290.
Pakaworawuth, C. (2007). His Majesty the King's Intelltectual Property as a Tool ofDevelopment. Retrieved 16 June 2013, fromhttp://thailand.prd.go.th/thailand_illustrated/content.php?s_id=311
Paladino, A. (2007). Investigating the Drivers of Innovation and New Product Success: AComparison of Strategic Orientations. Journal of Product Innovation Management,24, 534-553.
Pallant, J. (2005). SPSS survival manual. Berkshire, UK: Open University Press.Palumbo, F. A., & Teich, I. (2004). Market segmentation based on level of acculturation.
Marketing Intelligence & Planning, 22(4), 472-484.Parasuraman, A., Grewal, D., & Krishnan, R. (2004). Marketing research: Boston, MA:
Houghton Mifflin.Parry, M. E., & Song, X. M. (1994). Identifying new product successes in China. Journal of
Product Innovation Management, 11(1), 15-30.Patzelt, H., Lechner, C., & Klaukien, A. (2011). Networks and the Decision to Persist with
Underperforming R&D Projects. Journal of Product Innovation Management, 28(5),801-815.
Pawar, K. S., & Riedel, J. C. K. H. (1994). Achieving integration through managingconcurrent engineering. International Journal of production economics, 34(3), 329-345.
Penrose, E. (1959). The theory of the growth of the firm. Wiley, New York.Perry, C., Alizadeh, Y., & Riege, A. (1997, 21-23 September). Qualitative Methods in
Entrepreneurship Research. Paper presented at the the Annual Conference of theSmall Enterprise Association of Australia and New Zealand, Coffs Harbour.
Peter, J. P. (1979). Reliability: A Review of Psychometric Basics and Recent MarketingPractices. Journal of Marketing Research, 16(1), 6-17.
Peter, J. P. (1981). Construct Validity: A Review of Basic Issues and Marketing Practices.Journal of Marketing Research, 18(2), 133-145.
Peter, J. P., & Churchill, G. A. (1986). Relationships among Research Design Choices andPsychometric Properties of Rating Scales: A Meta-Analysis. Journal of MarketingResearch, 23(1), 1-10.
Peteraf, M. A. (1993). The cornerstones of competitive advantage: A resource-based view.Strategic Management Journal, 14(3), 179-191.
Peteraf, M. A., & Barney, J. B. (2003). Unraveling the Resource-Based Tangle. Managerialand Decision Economics, 24(4), 309-323.
Peterson, R. A. (1994). A Meta-Analysis of Cronbach's Coefficient Alpha. Journal ofConsumer Research, 21(2), 381-391.
Phillips, W., Noke, H., Bessant, J., & Lamming, R. (2006). Beyond The Steady State:Managing Discontinuous Product and Process Innovation. International Journal ofInnovation Management, 10(2), 175-196.
Ping, R. A. (2004). On assuring valid measures for theoretical models using survey data.Journal of Business Research, 57(2), 125-141.
Pisano, G. (1994). Knowledge, Integration, and the Locus of Learning: An EmpiricalAnalysis of Process Development. Strategic Management Journal, 15, 85-100.
Pittiglio, C., Rabin, R., Todd, P., & McGrath, M. (1995). Product Development Leadershipfor Technology-based Companies: Measurement and Management–A Prelude toAction. Pittiglio, Rabin, Todd & McGrath: Weston, MA.

385
Podsakoff, P. M., MacKenzie, S. B., & Podsakoff, N. P. (2012). Sources of method bias insocial science research and recommendations on how to control it. Annual review ofpsychology, 63, 539-569.
Podsakoff, P. M., Todor, W. D., Grover, R. A., & Huber, V. L. (1984). Situational moderatorsof leader reward and punishment behaviors: Fact or fiction? Organizational Behaviorand Human Performance, 34(1), 21-63.
Polanyi, M. (1966). The Tacit Dimension. Gloucester: Peter Smith.Porter, A. L. (1994). Technology opportunities analysis: Integrating technology monitoring,
forecasting, and assessment with strategic planning. SRA Journal, 26(2), 21-31.Porter, M. E. (1980). Competitive strategies. The Free Press, New York.Porter, M. E. (1985). Competitive Advantage. The Free Press, New York.Porter, M. E. (1991). Towards a dynamic theory of strategy. Strategic Management Journal,
12(Winter), 95-117.Porter, M. E. (1996). What is strategy? Harvand Business Review, 74(6), 61-78.Prajogo, D. I., & Sohal, A. S. (2003). The relationship between TQM practices, quality
performance, and innovation performance: an empirical examination. Internationaljournal of quality & reliability management, 20(8), 901-918.
PricewaterhouseCoopers survey. (2013). Breakthrough innovation and growth. Retrieved 13October, 2013, from http://www.pwc.com/gx/en/innovationsurvey/index.jhtml
Proctor, T. (2005). Essentials of marketing research: Pearson Education.Qualtrics. (2013). Qualtrics (Version 37,892). Utah, USA: Provo: Qualtrics Research Suite.Rangan, V. K., & Bartus, K. (1995). New Product Commercialization: Common Mistakes.
Harvard Business School, Note#9-594-127.Rangaswamy, A., & Lilien, G. L. (1997). Software Tools for New Product Development.
Journal of Marketing Research, 34(1), 177-184.Reid, S. E. (2005). Market Vision for Radically-New, High-Tech Products. (Unpublished
doctoral dissertation (Administration)), Concordia University, Montreal, Quebec,Canada.
Reid, S. E., & de Brentani, U. (2004). The Fuzzy Front End of New Product Development forDiscontinuous Innovations: A Theoretical Model. Journal of Product InnovationManagement, 21, 170-184.
Reid, S. E., & de Brentani, U. (2010). Market Vision and Market Visioning Competence:Impact on Early Performance for Radically New, High-Tech Products. Journal ofProduct Innovation Management, 27, 500-518.
Reid, S. E., & de Brentani, U. (2012). Market Vision and the Front End of NPD for RadicalInnovation: The Impact of Moderating Effects. Journal of Product InnovationManagement, 29, 124-139.
Reinartz, W., Haenlein, M., & Henseler, J. (2009). An empirical comparison of the efficacy ofcovariance-based and variance-based SEM. International Journal of Research inMarketing, 26(4), 332-344.
Rice, M. P., Leifer, R., & O'Connor, G. C. (2002). Commercializing discontinuousinnovations: bridging the gap from discontinuous innovation project to operations.Engineering Management, IEEE Transactions on, 49(4), 330-340.
Rice, M. P., O'Connor, G. C., Leifer, R., McDermott, C. M., & Standish-Kuon, T. (2000).Corporate Venture Capital Models for Promoting Radical Innovation. Journal ofMarketing Theory and Practice, 8(3), 1-10.
Rice, M. P., O'Connor, G. C., Peters, L. S., & Morone, J. G. (1998). Managing discontinuousinnovation. Research Technology Management, 41(3), 52.
386
Ringle, C. M., Sarstedt, M., & Mooi, E. A. (2010). Response-Based Segmentation UsingFinite Mixture Partial Least Squares. In R. Stahlbock, S. F. Crone & S. Lessmann(Eds.), Data Mining (Vol. 8, pp. 19-49): Springer US.
Ringle, C. M., Wende, S., & Will, A. (2005). SmartPLS 2.0 (beta) [Computer Software,Smart PLS], Hamburg: Germany. from www.smartpls.de
Ritala, P., & Hurmelinna-Laukkanen, P. (2013). Incremental and Radical Innovation inCoopetition—The Role of Absorptive Capacity and Appropriability. Journal ofProduct Innovation Management, 30(1), 154-169.
Robinson, W. T. (1988). Marketing Mix Reactions to Entry. Marketing Science, 7(4), 368-385.
Roman, S. (2002). Access Database Design & Programming (3rd Edition): O'Reilly Media.Roos, J. (1996). Distinction making and pattern recognition in management. European
Management Journal, 14(6), 590-595.Rossiter, J. R. (2002). The C-OAR-SE procedure for scale development in marketing.
International Journal of Research in Marketing, 19(4), 305-335.Rothwell, R. (1978). Small and Medium Sized Manufacturing Firms and Technological
Innovation. Management Decision, 16(6), 362-370.Rothwell, R., & Zegveld, W. (1982). Innovation and the Small and Medium Sized Firm.
University of Illinois at Urbana-Champaign's Academy for EntrepreneurialLeadership Historical Research Reference in Entrepreneurship.
Rubenstein, A., Chakrabarti, A., O’Keefe, R., Souder, W., & Young, S. (1976). Factorsinfluencing innovation success at the project level. Research management, May, 15-20.
Rubera, G., & Kirca, A. H. (2012). Firm innovativeness and its performance outcomes: ameta-analytic review and theoretical integration. Journal of Marketing, 76(2), 130-147.
Ruekert, R. W., & Churchill, G. A. (1984). Reliability and Validity of Alternative Measuresof Channel Member Satisfaction. Journal of Marketing Research, 21(2), 226-233.
Rumelt, R. P. (1984). Towards Strategic Theory of the Firm. In R. D. Lamb (Ed.),Competitive Strategic Management (pp. 131-145). NJ: Englewood Cliffs.
Sadler-Smith, E., Hodgkinson, G. P., & Sinclair, M. (2008). Chapter 2: A Matter of feeling?The Role of intuition in entrepreneurial decision-making and behaviour. Emotions,Ethics and Decision-Making, 4, 35-55.
Sadler-Smith, E., & Shefy, E. (2004). The Intuitive executive: understanding and applying'gut feel' in decision-making. The Academy of Management Executive, 18(4), 76-91.
Salomo, S., Keinschmidt, E. J., & de Brentani, U. (2010). Managing new productdevelopment teams in a globally dispersed NPD program. Journal of ProductInnovation Management, 27, 955-971.
Samiee, S., & Roth, K. (1992). The Influence of Global Marketing Standardization onPerformance. Journal of Marketing, 56(2), 1-17.
Sandberg, B. (2007). Customer-related Proactiveness in the Radical Innovation DevelopmentProcess. European Journal of Innovation Management, 10(2), 252-267.
Santipaporn, S. (2010). Information and Communication Technology Statistics in Thailand.Paper presented at the International Seminar on Information and CommunicationTechnology Statistics Seoul, Republic of Korea.
Santos-Vijande, M. L., & Álvarez-González, L. I. (2007). Innovativeness and organizationalinnovation in total quality oriented firms: The moderating role of market turbulence.Technovation, 27(9), 514-532.

387
Sarkar, M. B., Echambadi, R., Cavusgil, S. T., & Aulakh, P. (2001a). The influence ofcomplementarity, compatibility, and relationship capital on alliance performance.Journal of The Academy of Marketing Science, 29(4), 358-373.
Sarkar, M. B., Echambadi, R., & Harrison, J. S. (2001b). Alliance entrepreneurship and firmmarket performance. Strategic Management Journal, 22(6-7), 701-711.
Saunders, S., Jenkin, M., Derwent, R., & Pilling, M. (2003). Protocol for the development ofthe Master Chemical Mechanism, MCM v3 (Part A): tropospheric degradation of non-aromatic volatile organic compounds. Atmospheric Chemistry and Physics, 3(1), 161-180.
Schein, E. (1993). How can organizations learn faster? The challenge of entering the greenroom. Sloan management review, 34(2), 85-92.
Scherer, F. M. (1991). Changing perspectives on the firm size problem, In Z. J. Acs and D. B.Audretsch (eds.), Innovation and technological change: An international comparison,pp. 24-38. University of Michigan Press.
Scherer, F. M. (1992). Schumpeter and Plausible Capitalism. Journal of Economic Literature,30(3), 1416-1433.
Schindehutte, M., Morris, M. H., & Kocak, A. (2008). Understanding Market-DrivingBehavior: The Role of Entrepreneurship. Journal of Small Business Management,46(1), 4-26.
Schmidt, J. B., & Calantone, R. J. (2002). Escalation of commitment during new productdevelopment. Academy of Marketing Science, 30(2), 103-118.
Schmidt, J. B., Sarangee, K. R., & Montoya, M. M. (2009). Exploring New ProductDevelopment Project Review Practices*. Journal of Product Innovation Management,26(5), 520-535.
Schmidt, T. (2005). What determines absorptive capacity?, Centre for European EconomicResearch (ZEW), Manheim.
Schoemaker, P. J. H. (1995). Scenario planning: a tool for strategic thinking. Sloanmanagement review, 36(2), 25-40.
Schultz, C., Salomo, S., de Brentani, U., & Kleinschmidt, E. J. (2013). How Formal ControlInfluences Decision-Making Clarity and Innovation Performance. Journal of ProductInnovation Management, 30(3), 430-447.
Schumacker, R. E., & Lomax, R. G. (1996). A Beginner's Guide to Structural EquationModeling. Hillsdale, NJ: Lawrence Erlbaum Associates
Schumacker, R. E., & Lomax, R. G. (2004). A beginner's guide to structural equationmodeling. Mahwah, NJ: Lawrence Erlbaum Associates.
Schumacker, R. E., & Lomax, R. G. (2010). A beginner’s guide to structural equationmodeling (3rd Edition). New York: Routledge.
Schumpeter, J. A. (1934). The Theory of Economic Development. Oxford: Oxford UniversityPress.
Schumpeter, J. A. (1942). Socialism, capitalism and democracy: Harper and Brothers.Sechrest, L., Fay, T. L., & Zaidi, S. H. (1972). Problems of translation in cross-cultural
research. Journal of Cross-Cultural Psychology, 3(1), 41-56.Seidel, V. P. (2007). Concept Shifting and The Radical Product Development Process.
Journal of Product Innovation Management, 24, 522-533.Seidler, J. (1974). On Using Informants: A Technique for Collecting Quantitative Data and
Controlling Measurement Error in Organization Analysis. American SociologicalReview, 39(6), 816-831.
Sekaran, C. (2003). Research Methodology for Business. John Wiley and Sons Inc., NewYork.
388
Sethi, R. (2000). New Product Quality and Product Development Teams. Journal ofMarketing, 64(2), 1-15.
Sethi, R., & Iqbal, Z. (2008). Stage-gate Controls, Learning Failure, and Adverse Effect onNovel New Products. Journal of Marketing, 72(1), 118-134.
Shafique, M. (2013). Thinking inside the box? Intellectual structure of the knowledge base ofinnovation research (1988–2008). Strategic Management Journal, 34(1), 62-93.
Shah, R., & Goldstein, S. M. (2006). Use of structural equation modeling in operationsmanagement research: Looking back and forward. Journal of OperationsManagement, 24(2), 148-169.
Shane, S. (2000). Prior knowledge and the discovery of entrepreneurial opportunities.Organization Science, 11(4), 448-469.
Sheehan, K. B. (2001). E-mail Survey Response Rates: A Review. Journal of Computer-Mediated Communication, 6(2).
Shrout, P. E., & Bolger, N. (2002). Mediation in experimental and nonexperimental studies:new procedures and recommendations. Psychological methods, 7(4), 422.
Simon, E. S., McKeough, D. T., Ayers, A. D., Rinehart, E., & Alexia, B. (2003). How do youbest organize for radical innovation? Research Technology Management, 46(5), 17-20.
Simon, H. A. (1945). Administrative behavior. New York, NY: The Free Press.Simsek, Z., Veiga, J. F., & Lubatkin, M. H. (2005). Challenges and guidelines for conducting
Internet-based surveys in strategic management research. In D. J. Kitchen, Jr. and D.D. Bergh (Eds.), Research methodology in strategy and management, pp. 179-196.San Diego, CA: Elsevier.
Singh, G., & Tromp, N. (2011). Design, Meanings and Radical Innovation: Designing for aninformed future context. Paper presented at the Diversity and unity: Proceedings ofIASDR2011, the 4th World Conference on Design Research, Delft, the Netherlands.
Sinkula, J., Baker, W., & Noordewier, T. (1997). A framework for market-basedorganizational learning: Linking values, knowledge, and behavior. Journal of theAcademy of Marketing Science, 25(4), 305-318.
Sivadas, E., & Dwyer, F. R. (2000). An Examination of Organizational Factors InfluencingNew Product Success in Internal and Alliance-Based Processes. Journal of Marketing,64(1), 31-49.
Slater, S. F., Mohr, J. J., & Sengupta, S. (2013). Radical Product Innovation Capability:Literature Review, Synthesis, and Illustrative Research Propositions. Journal ofProduct Innovation Management, 31(3), 1-15.
Slater, S. F., & Narver, J. C. (1994). Does Competitive Environment Moderate the MarketOrientation-Performance Relationship? Journal of Marketing, 58(1), 46-55.
Slater, S. F., & Narver, J. C. (1995). Market Orientation and the Learning Organization.Journal of Marketing, 59(3), 63-74.
Slater, S. F., & Narver, J. C. (1998). Customer-Led and Market-Oriented: Let's Not Confusethe Two. Strategic Management Journal, 19(10), 1001-1006.
Slater, S. F., & Narver, J. C. (2000). Intelligence generation and superior customer value.Journal of the Academy of Marketing Science, 28(1), 120-127.
Slater, S. F., & Olson, E. M. (2001). Marketing's contribution to the implementation ofbusiness strategy: an empirical analysis. Strategic Management Journal, 22(11), 1055-1067.
Smith, K. A., Vasudevan, S. P., & Tanniru, M. R. (1996). Organizational learning andresource-based theory: an integrative model. Journal of Organizational Change, 9(6),41-53.
389
Smith, P. G., & Reinertsen, D. G. (1991). The Strategist's Role in Shortening ProductDevelopment. Journal of Business Strategy, 12(4), 18-22.
Smith, P. G., & Reinertsen, D. G. (1992). Shortening the product development cycle.Research Technology Management, 35(3), 44-49.
Song, X. M., & Montoya-Weiss, M. M. (1998). Critical Development Activities for ReallyNew versus Incremental Products. Journal of Product Innovation Management, 15,124-135.
Song, X. M., Montoya-Weiss, M. M., & Schmidt, J. B. (1997). The Role of Marketing inDeveloping Successful New Products in South Korea and Taiwan. Journal ofInternational Marketing, 5(3), 47-69.
Song, X. M., & Parry, M. E. (1996). What Separates Japanese New Product Winners fromLosers. Journal of Product Innovation Management, 13(5), 422-439.
Song, X. M., & Parry, M. E. (1997a). The Determinants of Japanese New Product Successes.Journal of Marketing Research, 34(1), 64-76.
Song, X. M., & Parry, M. E. (1997b). A Cross-National Comparative Study of New ProductDevelopment Processes: Japan and the United States. Journal of Marketing, 61(2), 1-18.
Song, X. M., & Swink, M. (2009). Marketing & Manufacturing Integration Across Stages ofNew Product Development: Effects on the Success of High- and Low-InnovativenessProducts. Engineering Management, IEEE Transactions on, 56(1), 31-44.
Sorescu, A. B., Chandy, R. K., & Prabhu, J. C. (2003). Sources and Financial Consequencesof Radical Innovation: Insights from Pharmaceuticals. The Journal of Marketing,67(4), 82-102.
Spanjol, J., Tam, L., Qualls, W. J., & Bohlmann, J. D. (2011). New Product Team DecisionMaking: Regulatory Focus Effects on Number, Type, and Timing Decisions*. Journalof Product Innovation Management, 28(5), 623-640.
Stanko, M. A., Molina Castillo, F. J., & Munuera Aleman, J. L. (2012). Speed to Market forInnovative Products: Blessing or Curse? Journal of Product Innovation Management,29(5), 751-765.
Stanton, J. M. (1998). An Empirical Assessment of Data Collection Using the Internet.Personnel Psychology, 51(3), 709-725.
Steenkamp, J.-B. E. M., & van Trijp, H. C. M. (1991). The use of lisrel in validatingmarketing constructs. International Journal of Research in Marketing, 8(4), 283-299.
Stevens, E. (2014). Fuzzy front-end learning strategies: Exploration of a high-tech company.Technovation.
Stevens, G., Burley, J., & Divine, R. (1998). Profits and Personalities: Relationships BetweenProfits from New Product Development and Analyst’s Personalities. ProductDevelopment Management Proceedings, 157-175.
Stevens, G., Burley, J., & Divine, R. (1999). Creativity Business Discipline = Higher ProfitsFaster from New Product Development. Journal of Product Innovation Management,16(5), 455-468.
Stevens, G. A., & Burley, J. (2003). Piloting the rocket of radical innovation. Research-Technology Management, 46(2), 16-25.
Stiles, J. (2003). A philosophical justification for a realist approach to strategic allianceresearch. Qualitative Market Research: An International Journal, 6(4), 263-271.
Stock, G. N., Greis, N. P., & Fischer, W. A. (2001). Absorptive capacity and new productdevelopment. The Journal of High Technology Management Research, 12(1), 77-91.

390
Stock, R. M., & Zacharias, N. A. (2013). Two Sides of the Same Coin: How Do DifferentDimensions of Product Program Innovativeness Affect Customer Loyalty? Journal ofProduct Innovation Management, 30(3), 516-532.
Stokes, S. L. (1991). Controlling the future: Managing technology-driven change. Boston:QED Information Sciences, Inc.
Stolper, M., Blut, M., & Holzmueller, H. H. (2009). Market Driving and Firm Performance.International Marketing Trends Congress. Paris.
Story, V., Hart, S., & O'Malley, L. (2009). Relational resources and competences for radicalproduct innovation. Journal of Marketing Management, 25(5-6), 461-481.
Strauss, A. L., & Corbin, J. (1990). Basics of qualitative research: grounded theoryprocedures and research. New-bury Park: CA, Sage.
Stringer, R. (2000). How to Manage Radical Innovation. California Management Review,42(4), 70-88.
Sun, P. Y. T., & Anderson, M. H. (2010). An Examination of the Relationship betweenabsorptive capacity and organizational learning, and a proposed integration.International Journal of Management Reviews, 130-150.
Suwannaporn, P., & Speece, M. (2003). Marketing research and new product developmentsuccess in Thai food processing. Agribusiness, 19(2), 169-188.
Suwannaporn, P., & Speece, M. (2010). Assessing new product development success factorsin the Thai food industry. British Food Journal, 112(4), 364-386.
Swanson, E. B. (1994). Churchman's Theory of Design Integrity. Interfaces, 24(4), 54-59.Swink, M. (2003). Completing projects on-time: how project acceleration affects new product
development. Journal of Engineering and Technology Management, 20(4), 319-344.Szulanski, G. (1996). Exploring internal stickiness: Impediments to the transfer of best
practice within the firm. Strategic management journal, 17, 27-43.Tabachnick, B. G., & Fidell, L. S. (2001). Using multivariate statistics, (4th Edition). Boston:
Pearson EducationTabachnick, B. G., & Fidell, L. S. (2007). Using multivariate statistics, (5th Edition). Boston:
Pearson EducationTallman, S. (2005). Forming and Managing Shared Organization Ventures: Resources and
Transaction Costs. In D. Faulkner & M. De Rond (Eds.) Cooperative Strategy:Economic, Business, and Organizational Issues. Oxford University Press.
Tashakkori, A., & Creswell, J. W. (2008). Editorial: Mixed methodology across disciplines.Journal of mixed methods research, 2(1), 3-6.
Tatikonda, M. V., & Montoya-Weiss, M. M. (2001). Integrating operations and marketingperspectives of product innovation: The influence of organizational process factorsand capabilities on development performance. Management Science, 47(1), 151-172.
Teece, D. J. (2007). Explicating dynamic capabilities: the nature and microfoundations of(sustainable) enterprise performance. Strategic Management Journal, 28(13), 1319-1350.
Teece, D. J., Pisano, G., & Shuen, A. (1997). Dynamic capabilities and strategic management.Strategic Management Journal, 18(7), 509-533.
Tellis, G. J. (2006). Disruptive Technology or Visionary Leadership. Journal of ProductInnovation Management, 23, 34-38.
Tellis, G. J., Prabhu, J. C., & Chandy, R. K. (2009). Radical innovation across nations: thepreeminence of corporate culture. Journal of Marketing, 73(1), 3-23.
Tenenhaus, M., Vinzi, V. E., Chatelin, Y.-M., & Lauro, C. (2005). PLS path modeling.Computational Statistics & Data Analysis, 48(1), 159-205.
391
Tessarolo, P. (2007). Is Integration Enough for Fast Product Development? An EmpiricalInvestigation of the Contextual Effects of Product Vision*. Journal of ProductInnovation Management, 24(1), 69-82.
Thailand Board of Investment. (2012, 10 December). Thailand: The Detroit of South EastAsia. Retrieved 26 December, 2012, fromhttp://us.industrysourcing.com/articles/260147.aspx
Thailand Board of Investment. (2013). Why Thailand? Retrieved 26 June, 2011, fromhttp://www.boi.go.th/tir/issue/201302_23_2/4.htm
The World Bank. (2011). Thailand Overview. Retrieved 26 June, 2011, fromhttp://www.worldbank.org/en/country/thailand/overview
Thomas, R. J. (1993). New product development: Managing and Forecasting for StrategicSuccess. New York: John Wiley & Sons.
Thomke, S., & von Hippel, E. (2002). Customers as Innovators: A New Way to Create Value.Harvard Business Review, April, 5-11.
Thompson, L. F., Surface, E. A., Martin, D. L., & Sanders, M. G. (2003). From paper topixels: Moving personnel surveys to the Web. Personnel Psychology, 56(1), 197-227.
Treacy, M. (2004). Innovation as a Last Resort. Harvard Business Review, 82 (7/8), 29-30.Tripsas, M. (2000). Commercializing Emerging Technology through Complementary Assets.
In Day, G S & Schoemaker, P. J. H. (Eds.), Wharton on Managing EmergingTechnologies (pp. 172-186). New York: Wiley.
Troilo, G., De Luca, L. M., & Atuahene-Gima, K. (2013). More Innovation with Less? AStrategic Contingency View of Slack Resources, Information Search, and RadicalInnovation. Journal of Product Innovation Management, 31(2), 1-19.
Tsai, W. (2001). Knowledge Transfer in Intraorganizational Networks: effects of networkposition and absorptive capacity on business unit innovation and performance. TheAcademy of Management Journal, 44(5), 996-1004.
Tuominen, M., Rajala, A., & Moller, K. (2004). Market-driving Versus Market-driven:Divergent Roles of Market Orientation in Business Relationships. IndustrialMarketing Management, 33, 207-217.
Tushman, M., & Anderson, P. (1986). Technological Discontinuities and OrganizationalEnvironments. Administrative Science Quarterly, 31(3), 439-465.
Ulrich, K. T., & Eppinger, S. D. (1995). Product Design and Development. New York:McGraw-Hill, Inc.
Ulwick, A. W. (2002). Turn Customer Input into Innovation. Harvard Business Review,January, 5-11.
Urban, G. L., & Hauser, J. R. (1980). Design and Marketing of New Products. EnglewoodCliffs, NJ: Prentice-Hall.
Urban, G. L., & Hauser, J. R. (1993). Design and Marketing of New Products, 2nd Edition.Englewood Cliffs, NJ: Prentice-Hall.
Urban, G. L., & von Hippel, E. (1988). Lead user analyses for the development of newindustrial products. Management Science, 34(5), 569-582.
Utterback, J. M. (1994). Mastering the Dynamics of Innovation: How Companies can SeizeOpportunities in the Face of Technological Change. Boston, MA: Havard BusinessSchool Press.
Utterback, J. M., & Abernathy, W. J. (1975). A dynamic model of process and productinnovation. Omega, 3(6), 639-656.
Van den Bosch, F. A. J., Volberda, H. W., & de Boer, M. (1999). Coevolution of FirmAbsorptive Capacity and Knowledge Environment: Organizational Forms andCombinative Capabilities. Organization Science, 10(5), 551-568.
392
Van Fraassen, B. C. (1980). The scientific image: Oxford: Oxford University Press.Van Oorschot, K., Sengupta, K., Akkermans, H., & Van Wassenhove, L. (2010). Get Fat Fast:
Surviving Stage-Gate® in NPD. Journal of Product Innovation Management, 27(6),828-839.
Varadarajan, P. R. (1996). From the editor: Reflections on research and publishing. Journal ofMarketing, 60(October), 3-6.
Varadarajan, P. R. (2009). Fortune at the Bottom of the Innovation Pyramid: The StrategicLogic of Incremental Innovations. Business Horizon, 52, 21-29.
Venkataraman, S. (1997). The distinctive domain of entrepreneurship research. Advances inEntrepreneurship, Firm Emergence and Growth, 3, 119-138.
Venkatraman, N., & Ramanujam, V. (1986). Measurement of business performance instrategy research: a comparison of approaches. Academy of management review,11(4), 801-814.
Verganti, R. (1997). Leveraging on systemic learning to manage the early phases of productinnovation projects. R&D Management, 27(4), 377-392.
Verganti, R. (2008). Design, Meanings, and Radical Innovation: A Metamodel and a ResearchAgenda. Journal of Product Innovation Management, 25, 436-456.
Verganti, R. (2009). Design-Driven Innovation: Changing the Rules of Competition byRadically Innovating What Things Mean. Boston, MA: Harvard Business Press.
Verhees, F. J. H. M., & Meulenberg, M. T. G. (2004). Market Orientation, Innovativeness,Product Innovation, and Performance in Small Firms. Journal of Small BusinessManagement, 42(2), 134-154.
Verona, G. (1999). A Resource-Based View of Product Development. The Academy ofManagement Review, 24(1), 132-142.
Verworn, B. (2009). A structural equation model of the impact of the "fuzzy front end" on thesuccess of new product development. Research Policy, 38, 1571-1581.
Verworn, B., & Herstatt, C. (1999). Approaches to the "fuzzy front end" of innovation:Working Papers/Technologie-und Innovationsmanagement, Technische UniversitätHamburg-Harburg.
Verworn, B., & Herstatt, C. (2001). Managing the fuzzy front end of innovation: WorkingPaper, Department of Technology and Innovation Management, Technical Universityof Hamburg.
Verworn, B., Herstatt, C., & Nagahira, A. (2008). The fuzzy front end of Japanese newproduct development projects: impact on success and differences between incrementaland radical projects. R&D Management, 38(1), 1-19.
Veryzer, R. W. (1998a). Discontinuous Innovation and the New Product DevelopmentProcess. Journal of Product Innovation Management, 15, 304-321.
Veryzer, R. W. (1998b). Key Factors Affecting Customer Evaluation of Discontinuous NewProducts. Journal of Product Innovation Management, 15, 136-150.
Vincent, L. (2008). Differentiating Competence, Capability and Capacity. InnovatingPerspectives, 16(3), 1-2.
Vinding, A. L. (2006). Absorptive capacity and innovative performance: A human capitalapproach. Economics of Innovation & New Technology, 15(4/5), 507-517.
von Hippel, E. (1978). Successful Industrial Products from Customer Ideas. Journal ofMarketing, 42(1), 39-49.
von Hippel, E. (1986). Lead Users: A Source of Novel Product Concepts. ManagementScience, 32, 791-805.
von Hippel, E. (1989). New product ideas from lead users. Research TechnologyManagement, 32(3), 24-27.
393
von Hippel, E., Thomke, S., & Sonnack, M. (2000). Creating Breakthroughs At 3M. HealthForum Journal, July/August.
Wang, C. L., & Ahmed, P. K. (2007). Dynamic capabilities: A review and research agenda.International Journal of Management Reviews, 9(1), 31-51.
Wattanasupachoke, T. (2012). Design Thinking, Innovativeness and Performance: AnEmpirical Examination. International Journal of Management & Innovation, 4(1), 1-16.
Weber, R. (2004). Editor's comments: the rhetoric of positivism versus interpretivism: apersonal view. MIS Q., 28(1), iii-xii.
Wernerfelt, B. (1984). A resource-based view of the firm. Strategic Management Journal,5(2), 171-180.
Westerlund, M., & Rajala, R. (2010). Learning and innovation in inter-organizational networkcollaboration. Journal of Business & Industrial Marketing, 25(6), 435-442.
Wetzels, M., Odekerken-Schroder, G., & Van Oppen, C. (2009). Using PLS path modelingfor assessing hierarchical construct models: guidelines and empirical illustration. MISQuarterly, 33(1), 177-195.
Wheelwright, S. C., & Clark, K. B. (1992). Revolutionizing Product Development: QuantumLeaps in Speed, Efficiency, and Quality: Free Press.
Williams, A. (2013). Thailand’s internet users set to double. Retrieved 5 January, 2013, fromhttp://investvine.com/thailands-internet-users-set-to-double/
Wind, J., & Mahajan, V. (1997). Issues and Opportunities in New Product Development: AnIntroduction to the Special Issue. Journal of Marketing Research, 34(1), 1-12.
Winter, S. G. (2000). The satisficing principle in capability learning. Strategic ManagementJournal, 21(10), 981-996.
WIPO. (2008). Women Inventors Awarded a WIPO Medal or other Distinction. The WorldIntellectual Property Organization (WIPO). Retrieved 19 June, 2010, fromhttp://www.wipo.int/ip-outreach/en/awards/women/year.html
WIPO. (2009). King of Thailand Receives WIPO Award for Contribution to IntellectualProperty. WIPO Press Releases: World Intelletual Property Organization. Retrieved16 June, 2010, fromhttp://www.wipo.int/pressroom/en/articles/2009/article_0001.html
Wold, H. (1975). Path models with latent variables: The NIPALS approach. QuantitativeSociology: International perspectives on mathematical and statistical model building.
Wright, K. B. (2005). Researching Internet-Based Populations: Advantages andDisadvantages of Online Survey Research, Online Questionnaire Authoring SoftwarePackages, and Web Survey Services. Journal of Computer-Mediated Communication,10(3).
Yap, C. M., & Souder, W. E. (1994). Factors Influencing New Product Success and Failure inSmall Entrepreneurial High-Technology Electronics Firms. Journal of ProductInnovation Management, 11, 418-432.
Youngsuksathaporn, P. (2005). Innovation in Thai Government. In S. L. Emery, W. Ellis &M. Chulavatnatol (Eds.), Thailand Competitive Innovation Strategies (pp. 113-149):National Innovation Agency.
Zahra, S. A. (1996). Technology strategy and financial performance: Examining themoderating role of the firm's competitive environment. Journal of Business Venturing,11(3), 189-219.
Zahra, S. A., & George, G. (2002). Absorptive Capacity: A Review, Reconceptualization, andExtension. The Academy of Management Review, 27(2), 185-203.

394
Zahra, S. A., Sapienza, H. J., & Davidson, P. (2006). Entrepreneurship and Dynamiccapabilities: A Review, Model and Research Agenda. Journal of Management Studies,43(4), 917-955.
Zhang, J., & Duan, Y. (2010). The impact of different types of market orientation on productinnovation performance. Management Decision, 48(6), 849-867.
Zhang, Q., & Doll, W. J. (2001). The fuzzy front end and success of new productdevelopment: a casual model. European Journal of Innovation Management, 4(2), 95-112.
Zhou, K. Z. (2006). Innovation, imitation, and new product performance: The case of China.Industrial Marketing Management, 35(3), 394-402.
Zhou, K. Z., & Wu, F. (2010). Technological capability, strategic flexibility, and productinnovation. Strategic Management Journal, 31, 547-561.
Zhou, K. Z., Yim, C. K., & Tse, D. K. (2005). The Effects of Strategic Orientations onTechnology- and Market-Based Breakthrough Innovations. Journal of Marketing,69(2), 42-60.
Zikmund, W. G. (2000). Business Research Methods (6th Edition). Chicago, IL: The DrydenPress.
Zikmund, W. G., & Babin, B. J. (2007). Exploring Marketing Research (9th Edition). USA:Thomson South-Western.
Zirger, B. J., & Maidique, M. A. (1990). A model of new product development: an empiricaltest. Management Science, 36 (7), 867-883.
Zollo, M., & Winter, S. G. (2002). Deliberate Learning and The Evolution of DynamicCapabilities. Organization Science, 13(3), 339-351.
Zortea-Johnston, E., Darroch, J., & Matear, S. (2012). Business orientations and innovation insmall and medium sized enterprises. International Entrepreneurship and ManagementJournal, 8(2), 145-164.
Zou, S., & Cavusgil, S. T. (2002). The GMS: A Broad Conceptualization of Global MarketingStrategy and Its Effect on Firm Performance. Journal of Marketing, 66(4), 40-56.
395
School of Economics, Finance and MarketingCollege of Business
Building 80, Level 11445 Swanston StreetMelbourne VIC 3000
Australia
GPO Box 2476VMelbourne VIC 3001
Australia
Tel. +61 3 9925 1474Fax +61 3 9925 5986
www.rmit.edu.au
APPENDICES
Appendix 1: Project Information Statement
INVITATION TO PARTICIPATE IN A RESEARCH PROJECT
PROJECT INFORMATION STATEMENT
Project Title:Market-driving Innovation: Understanding the Critical Success Factors at the Front End ofDevelopment Process
Investigators: Onnida Thongpravati, BBA (eCom), MBA IT
Candidate for Doctor of Philosophy (Marketing), RMIT UniversityPh: +61 3 9925 5926Email: [email protected]
Assoc Professor Mike Reid, PhD (Otago)Research Supervisor, RMIT UniversityPh: +61 3 9925 1474Email: [email protected]
Dear Manager,
You are invited to participate in a research project being conducted by RMIT University. Weare required by the University to provide you with this more detailed overview of the project.
The project relates to the management of product innovation and some of the factors thatmake it successful. This information sheet describes the project in straightforwardlanguage. If you have any questions about the project, please email or call Dr Mike Reid.
Who is involved in this research project? Why is it being conducted?This research project is being conducted by Onnida Thongpravati, as part of a Doctor ofPhilosophy degree, under the supervision of Associate Professor Mike Reid. Bothresearchers are based in the School of Economics, Finance and Marketing at RMITUniversity. The project designed to investigate the critical success factors in developingand commercialising innovative new products. This project has been approved by the RMITUniversity Human Research Ethics Committee (project number 1000360).
(Both English and Thai languages)

396
Why have you been approached?The success of this project relies upon receiving insights from managers with experience indeveloping and commercialising new products. We have therefore sent this survey to youas someone who has experience in this area and as someone who is able to shed light onthe activities associated with the front end of innovation.
What is the project about? What are the questions being addressed?The project is focused on very innovative new products or innovations and is also focusedon the front end of the product innovation process. Managing the front end of the new-product development (NPD) process, or the fuzzy front end (FFE), can be a difficult andchallenging task for firms, particularly for radical or really-new innovations. In particularbeing able to maintain the integrity of an innovative idea through concept development andtesting, and into production and launch, seems to be a significant issue for managers.
This study aims to investigate the role of several emerging innovation concepts that shapebreakthrough innovation and integrity including market visioning, market visioningcompetence and absorptive capacity (information and knowledge management). Whilstthere are many factors that shape success, the ones we focus on appear to be gainingsome prominence in both the managerial and academic research literature. The key aimsof the project are:
1. To investigate the significance of market visioning competence and market visionon the front end success of breakthrough-type products;
2. To investigate the significance of absorptive capacity on the effectiveness of marketvisioning competence and market vision for breakthrough-type products;
3. To understand how the above relationships are moderated by NPD team’s intuitivedecision making, the level of NPD process rigidity and the level of customerinvolvement inherent in the NPD process and the nature of the externalenvironment.
We hope to have results from at least 200 managers in order to be able to draws someuseful conclusions about breakthrough product innovation success.
If I agree to participate, what will I be required to do?If you agree to participate in this study you will be asked to complete associated onlinequestionnaire. It is expected that the questionnaire will take approximately 15 -20minutes tocomplete. In order to complete the questionnaire just click on the link provided and it willtake you to the host site. Alternatively if you wish for a hard copy please contact Onnidaand one will be sent to you via email.
We are using Qualtrics Survey Software as the host for this project. Qualtrics is supportedby RMIT University and allows us to create a customised survey and e-mail participantswith a unique URL link that directly tied to the survey.
Please note that every time you hit the “Continue” or “Back” button in the survey, yourcurrent progress is saved automatically. Ideally we would like you to complete the survey inone go. If you have to exit temporarily you can just begin pick up where you left off byclicking on the same survey link.

397
Once you have completed the online questionnaire, please click the “Submit” button at theend of the survey.
What are the risks or disadvantages associated with participation?Users should be aware that the World Wide Web is an insecure public network with thepotential risks that a user’s transactions are being or may be viewed, intercepted ormodified by third parties or that data which the a user downloads may contain computerviruses or other defects. However, completing the questionnaire does not present anyperceived risks outside your normal daily activities. All data will be de-identified and norespondents or companies will be identified during the research.
What are the benefits associated with participation?While there may not be any direct benefits to you as a result of participating in this study, itis expected that the information from this research will contribute to a better understandingof the development of market-driving innovation by advancing its early performance duringconcept generation and evaluation, and commercial success. Therefore, this research mayhelp to increase the chances of profitable outcomes to your company.
We do recognise that we are asking for your time and your insights and would like to offer asmall token of our appreciation.
Firstly a management report on the findings. This would be returned quickly to youonce the data has been collected and analysed.
A $2 donation to the Children’s Starlight Foundation for every fully completedquestionnaire received. This is funded by both myself and Dr Reid and not part ofany grant or university monies.
What will happen to the information I provide?Your participation in this study will remain anonymous and you will not be personallyidentified in any subsequent reports, publications or presentations arising from the study.All data is analyzed at the aggregate level. All the information that you provide is strictlycontrolled at every stage of the investigation, meaning that it will only be accessible tomyself and Dr Reid; the identified researchers.
If you agree to participate in this survey, the responses you provide to the survey willinitially be stored on a host server that is used by Qualtrics. No personal information will becollected in the survey so none will be stored as data. Once we have completed our datacollection we will import the data we collect to the RMIT server where it will be storedsecurely for a period of five (5) years. The data on the Qualtrics host server will then bedeleted and expunged.
Any paper files will be kept in a locked filing cabinet of the research supervisor within theSchool of Economics, Finance and Marketing at RMIT University. All information will bekept securely for five (5) years before being destroyed. Any information that you providecan be disclosed to other parties only if (1) it is to protect you or others from harm, (2) acourt order is produced, or (3) you provide the researchers with written permission. It isexpected that the results of the research will be disseminated via the PrincipalInvestigator’s doctoral thesis and through publication in peer reviewed academic journals.

398
What are my rights as a participant?Participation in this study is completely voluntary and there is no obligation for you to takepart. You have the right to withdraw your participation at any time, without prejudice.However, please note, once you have returned the questionnaire, it will not be possible toremove it if you decide not to participate. Throughout the study, you have the right to haveany questions answered at any time.
Whom should I contact if I have any questions?If you have any questions or would like more information about this study, please do nothesitate to contact either Onnida Thongpravati or Mike Reid, and discuss your concernsconfidentially.
Thank you so much in advance upon your contribution to this research.
Yours Sincerely
Onnida ThongpravatiBBA(eCom), MBA IT+61 3 9925 [email protected]
Associate Professor Mike Reid(BCom, PhD, Otago)+61 3 9925 [email protected]
If you have any complaints about the conduct of this research project, please contact the Chair, RMIT Business CollegeHuman Ethics Advisory Network, GPO Box 2476V, Melbourne, 3001, telephone +61 3 9925 5596, email
[email protected] Details of the complaints procedures are availableat http://www.rmit.edu.au/browse;ID=2jqrnb7hnpyo

399
ขอความรวมมอในการใหขอมลแกโครงการวจยเอกสารแนะนาโครงการ
(Project Title):Market-driving Innovation: Understanding the Critical Success Factors at the Front End ofDevelopment Processผวจย :
นส. อรณดา ทองประวต, BBA (eCom), MBA ITCandidate for Doctor of Philosophy (Marketing), RMIT UniversityPh: +61 3 9925 5926Email: [email protected]
รศ. Mike Reid, PhD (Otago)RMIT University
Ph: +61 3 9925 1474Email: [email protected]
เรยน ทานผบรหารRMIT (RMIT University, Australia)
(Product innovation)
ไดอธบายถงโครงการการวจยไวอยางตรงไปตรงมาMike Reid.
ผ ทาวจยคอ นส.อรณ ภายใตการดแลของ รศ.Mike Reid. School of Economics, Finance and Marketing มหาวทยาลย RMIT
าผลตภณฑ และการนาออกสตลาดของผลตภณฑใหมRMIT
.

400
เหตผลในการขอความคดเหนของผบรหารผมประสบการณในการพฒนาและนา
ผลตภณฑใหมออกสตลาดในการใหขอมลแกผวจย
นวตกรรมตางๆ
โครงการวจย รอนวตกรรมชนดใหมอยางแทจรง รวมถงใหความสาคญกบกระบวนการ(Front end). การบรหารจดการพฒนาผ อาจเปน
โดยเฉพาะการพฒน การพฒนาแนวคด การทดสอบการผลต จนถงการนาออกสตลาด
คนพบ (Breakthrough Innovations) ยทศนทางการตลาดสมรรถนะดานวสยทศนทางการตลาด ๆ (การประมวลผลขอมลและการจดการความร)
เดนชดออกมาใน การวจยวทยานพนธ.
วตถประสงคหลกของโครงการวจย ม :
1. สารวจความสาคญของการมสมรรถนะดานวสยทศนการตลาด (Market visioning competence)และวสยทศนทางการตลาด (Front end)
(Breakthrough-type products).2. สารวจ คอยๆ (Absorptive Capacity)
ตอประสทธภาพของสมรรถนะหลกดานวสยทศนทางการตลาดและวสยทศนทาง (Breakthrough-type products).
3. การตดสนใจของทมพฒนาผลตภณฑใหมระดบความไมยดหยนของกระบวนการพฒนาผลตภณฑและระดบ ของลกคาในการรวมกระบวนการพฒนาผลตภณฑใหมรวมถงลกษณะของสภาพแวดลอมธรกจภายนอก ความสมพนธ .
บทสรปความสาเรจ

401
ความรวมมอในการใหขอมลกรอกขอมลในแบบสอบถามออนไลน
เพยง - ในการกรอกตอบแบบสอบถาม การกรอกขอมลทาไดโดยกด แนบมา นาทานเขาสเวบหลก
โครงการวจย Qualtrics Survey Software RMITทาใหเราสามารถตดตอกบทานทาง e-mail โดยม URL ง
หมายเหต “Continue” หรอ “Back” ในการกรอกแบบสอบถาม นจะไดรบการบนทกไวโดยอตโนมต หากเปนไปได ผวจยมความประสงคใหทานกรอกแบบสอบถามใหเสรจภาย จาเปน หยดการกรอกขอมล ทาคางไว โดยคลกเขาสลงคแบบสอบถามเดม. กรณาคลกป ม “Submit”
เรยบรอยแลว.
ความวตกกงวลของผตอบแบบสอบถามผตอบแบบสอบถามอาจกงวลวาอาจมผ นาขอมลสวนตวของผตอบแบบสอบถามไปใช
อยางไรกตามผวจยขอรบรองวา ขอมล จะไมมการระบวาเปนขอมลเฉพาะของบคคลใดหรอของบรษทใด
ผตอบแบบสอบถามจะไดรบในการใหความรวมมอในโครงการวจย
ยชนโดยตรงสาหรบผตอบแบบสอบถามแต ชวยทาใหผตอบแบบสอบถามไดรบความเขาใจมาก การของนวตกรรม (Market-driving) ในระยะการเกดแนวคดจนถง การประเมนผลและประสบความสาเรจในเชงพาณชย ใน โอกาสการทาผลกาไรใหแกบรษทของผตอบแบบสอบถาม.
ผวจยตระหนกดวา การตอบแบบสอบถามอาจรบกวนเวลาของทาน ผวจยจงขอนาเสนอ ดง
รายงานสรปของผบรหาร การมจตกศลรวมกน โดยการ
และนกวจยไดรบแบบสอบถามกลบคน เงนบรจาคจะถกสงมอบใหกบมลนธ Children’s Starlight Foundation อรณดาทองประวต รศ. Mike Reidมไดนาเงนบรจาคมาจากกองทนของมหาวทยาลยแตอยางใด.
(หมายเหต :~ ออสเตรเลยดอลลาร = 33 บาท)

402
ถกเปนความลบ ไมเจาะจงวาเปนขอมลของผใด การนาเสนอผลการวจยทาในรปของผลรวม ประมวลผลขอมลและเขาถงขอมลของทานได มแตเพยงผวจยและ
จะถกจดเกบไวบน Host Server ของโปรแกรม Qualtrics การประมวลผลขอมลเสรจ เรยบรอย ขอมลจะถกยายไปจดเกบไวยง Server ของมหาวทยาลย RMIT เปนความลบเปนระยะเวลา ขอมลบน Host Server ของ Qualtrics
ฉบบ (Paper files) จะถกจดเกบไวอยางปลอดภย Schoolof Economics, Finance and Marketing มหาวทยาลย RMIT เปนระยะ จาก เอกสาร หมด จะไดรบการทาลายไป ขอมลใดๆจะไดรบการ (1) 2)
3) นกวจยไดรบอนญาตจากผใหกรอกแบบสอบถามอยางเปนลายลกษณอกษร ผวจยหวงเปนอยาง จะไดรบการเผยแพรในรปแบบของดษฎนพนธ การตพมพเผยแพรในวารสารวชาการ.
สทธของผตอบแบบสอบถามการใหความรวมมอในการกรอกแบบสอบถาม เกด จากความสมครใจ ไมมพนธะผกพน
ใด ผกรอกแบบสอบถามสามารถยตการใหขอมลไดตลอดเวลาคาถาม
หากทานมคาถาม หรอขอสงสยหากทานมขอสงสยใด กรณาตดตอคณ อรณดา ทองประวต หรอ รศ. Mike
Reid
ขอขอบคณลวงหนา สาหรบ
อรณดา ทองประวต รศ. Mike ReidBBA(eCom), MBA IT (BCom, PhD, Otago)+61 3 9925 5926 +61 3 9925 [email protected] [email protected]
the Chair, RMIT Business College Human Ethics AdvisoryNetwork, GPO Box 2476V, Melbourne, 3001. โทรศพท +61 3 9925 5596 Email: [email protected]
http://www/rmit.edu.au/browse;ID=2jqrnb7hnpyo
403
Appendix 2: New Product Development Survey
NEW PRODUCT DEVELOPMENT SURVEY
REVIEW YOUR ORGANIZATIONAL VISIONING CAPABILITIES!
And receive a report on Factors Influencing Breakthrough Innovation Success
Investigating Breakthrough Innovation Success:A National Survey 2012
RMIT UniversitySchool of Economics, Finance and Marketing
College of Business
Supported by:
PDMA AustraliaThe Product Development and Management Association of Australia
Connecting Innovators Worldwide
Researchers:
Onnida ThongpravatiAssociate Prof Mike Reid
(A bilingual instrument in English and Thai languages)

404
Survey Instructions
Survey Instructions
Thank you in advance for taking part in this study.Your contribution and insights will help make this a successful and useful study.
In answering the questions, please think about the breakthrough innovations your company or
Strategic Business Unit (SBU) has developed and commercialized in the last 3 years (whether or not
they were successful), and in which you have actively participated.
Our focus is on the Product innovation or New Product Development program rather thanany one product. In terms of making your judgements, please check the box that best
represents "how things actually are" rather than on "how things ought to be".
What do we mean by "Breakthrough Innovation"?We define a breakthrough innovation as any product that you consider to be something
quite radical or really-new to the market in terms of its technology or the benefits offered tocustomers.
More specifically a breakthrough innovation refers to one or more of the following:
A product that has been developed using very new idea or very new technology that hasnever been used in the industry before, and/ or;
A product that has caused significant changes in the industry or product category (e.g. 5 to 10times improved benefits or 30% cost reduction compared with the previous generation), and/or;
A product that was one of the first of its kind introduced into the market, and/ or;
A product that is considered to be highly innovative by commentators and competitors in themarket.

405
SECTION 1: GENERAL CHARACTERISTICS OF YOUR JOB, COMPANY AND PRODUCT DEVELOPMENT
NEW PRODUCT DEVELOPMENT SURVEY
SECTION 1: General Characteristics of Your Job, Company andProduct Development Activities
Your Role:
Please state your formal job title:
1.1 How would you best describe the organization’s structure of the company you work for?
I work in a company with a single structure and only one NPD program for all products.
I work within a division/ strategic business unit (SBU). Each SBU has its own approach toNPD and strategy formulation.
1.2 Does your job have a Marketing or R&D emphasis?
Totally Marketing focused
More Marketing focused than R&D
Balanced Marketing and R&D
More R&D focused than Marketing
Totally R&D focused
Other (Please specify)
1.3 How long have you held your current job?1 - 3 years 4 - 6 years 7 - 10 years more than 10 years
1.4 How long have you worked for this company?1 - 3 years 4 - 6 years 7 - 10 years more than 10 years
Your Company:(Please answer as either a SBU or Company depending on your answer in question 1.1):
1.5 How many employees are there within your company or SBU?
1 - 20
21 - 40
41 - 60
61 - 100
101 - 200

406
201 - 500
500+
1.6 Please indicate which of the following markets your company or SBU mainly competes in:
Consumer Packaged Goods (e.g. pet foods)
Consumer Durable Goods (e.g. automobiles)
Business to Business Industrial Goods (e.g. manufacturing equipment)
Consumer Services (e.g. retail banking)
Other (Please specify)
1.7 Please indicate what the Annual Turnover (sales $AUD) is for your SBU or company:
Under A$1 million
Between A$1 million – A$2 million
Between A$ 2.01 million – A$3 million
Between A$ 3.01 million – A$4 million
Between A$ 4.01 million – A$5 million
Between A$ 5.01 million – A$15 million
Between A$ 15.01 million – A$25 million
Between A$ 25.01 million – A$50 million
Between A$ 50.01 million – A$100 million
Above A$100 million
1.8 Please indicate what Percentage of Annual Turnover of your company or SBU spent onR&D
05 10 15 20 25 30 35 40 45 50
Annual Turnover Spent on R&D%
Organizing for Product Development:(Please answer as either a SBU or Company depending on your answer in question1.1):
1.9 Which of the following best describes the way the new product effort is structured in yourcompany or SBU?
New product department with permanent staff members.
Distinct division or venture group.

407
A new product committee oversees all development efforts.
Each business unit's general managers direct their own NPD efforts.
A single function is responsible for NPD: (Please specify whether it is R&D, planning,marketing or engineering).
A product development process owner helps deploy our process across the firm.
Other (Please specify)
1.10 Reflecting on your NPD activity over the last 3 years, please indicate how many newproducts of different types were introduced during that period:
Number of Radical Breakthrough Products
Products that are new for both the company and the marketplace--a new line of business. These
products are the first of their kinds, providing entirely new level of functionality to the customers
(either offer 5-10 times improved benefits or 30% cost reduction compared with the previous
generations). An example includes the first consumer microwave oven as a radical breakthrough;
the many subsequent improvements were not.
Number of Technological Breakthrough Products
Products that build on a new or novel idea / technology that has never been used in the industry
before. The products may not be new to the market but the technology application is. An example
includes the Canon LaserJet printer (using new technology to extend the existing product line from
InkJet printer).
Number of Market Breakthrough Products
Products that build on an existing idea or technology and create a new market, becoming the
first of its kind and totally new to your markets, and/ or cause significant changes in the industry or
product category. An example includes the Apple's iPhone3 or iPod (market breakthroughs using
existing technologies within new platforms).
Number of Incremental Innovations
Products that are adapted from the existing products to provide new features, benefits, or
improvements to offer in the existing market. An example includes the Apple's iPhone4 where the
product improved only by incremental technologies of Apple's iPhone3 to introduce new benefits
based on current platform.
0
0
0
0
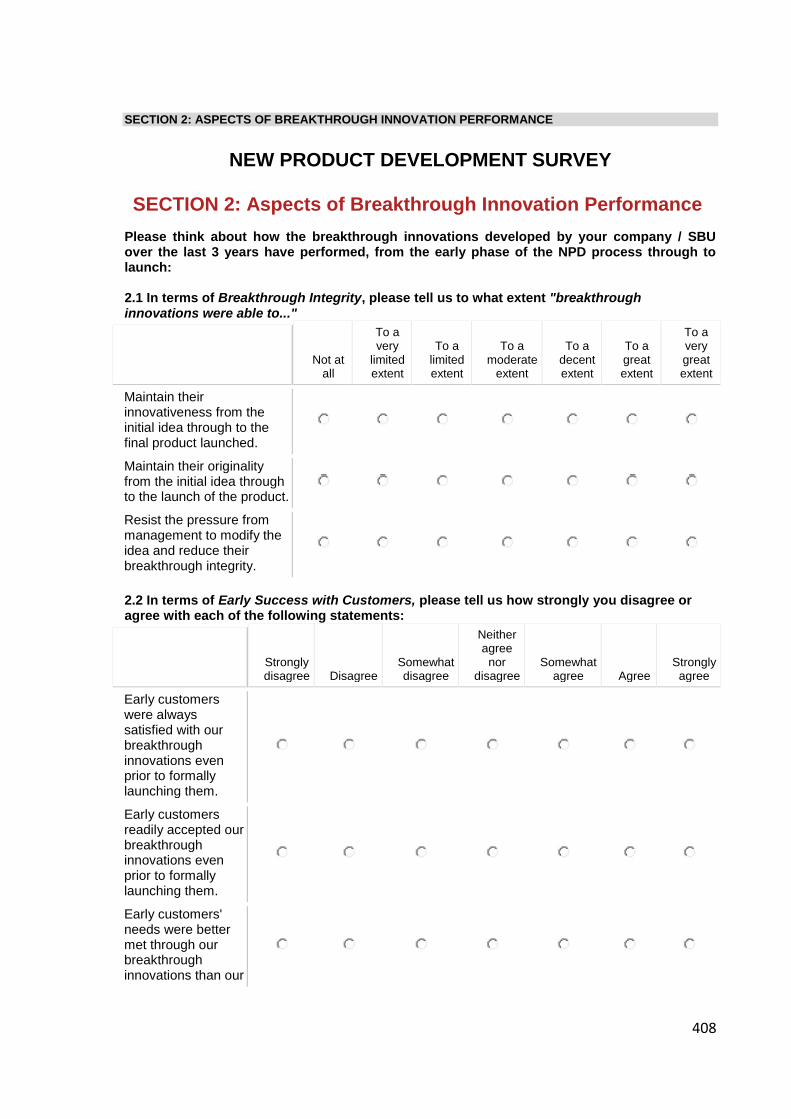
408
SECTION 2: ASPECTS OF BREAKTHROUGH INNOVATION PERFORMANCE
NEW PRODUCT DEVELOPMENT SURVEY
SECTION 2: Aspects of Breakthrough Innovation PerformancePlease think about how the breakthrough innovations developed by your company / SBUover the last 3 years have performed, from the early phase of the NPD process through tolaunch:
2.1 In terms of Breakthrough Integrity, please tell us to what extent "breakthroughinnovations were able to..."
Not atall
To avery
limitedextent
To alimitedextent
To amoderate
extent
To adecentextent
To agreatextent
To averygreatextent
Maintain theirinnovativeness from theinitial idea through to thefinal product launched.
Maintain their originalityfrom the initial idea throughto the launch of the product.
Resist the pressure frommanagement to modify theidea and reduce theirbreakthrough integrity.
2.2 In terms of Early Success with Customers, please tell us how strongly you disagree oragree with each of the following statements:
Stronglydisagree Disagree
Somewhatdisagree
Neitheragree
nordisagree
Somewhatagree Agree
Stronglyagree
Early customerswere alwayssatisfied with ourbreakthroughinnovations evenprior to formallylaunching them.
Early customersreadily accepted ourbreakthroughinnovations evenprior to formallylaunching them.
Early customers'needs were bettermet through ourbreakthroughinnovations than our

409
Stronglydisagree Disagree
Somewhatdisagree
Neitheragree
nordisagree
Somewhatagree Agree
Stronglyagree
existing ones.
2.3 On average, over the last 3 years, in terms of how quickly breakthrough innovations weredeveloped and launched, please tell us how strongly you disagree or agree with each of thefollowing statements:
Stronglydisagree Disagree
Somewhatdisagree
Neitheragree
nordisagree
Somewhatagree Agree
Stronglyagree
Our breakthroughinnovations weredeveloped andlaunched faster thanthe major competitorfor similar products.
Our breakthroughinnovations werecompleted in lesstime than what isconsidered normaland customary forour industry.
Our breakthroughinnovations werelaunched on orahead of the originalschedule developedat initial project go-ahead.
Top managementwas pleased withthe time it took forbreakthroughinnovations to get tofullcommercialization.
2.4 In terms of opening up new opportunities for your company / SBU, please tell us howsuccessful your breakthrough innovations were in:
Not at allsuccessful
Notsuccessful
Somewhatunsuccessful
Neithersuccessful
norunsuccessful
Somewhatsuccessful Successful
Extremelysuccessful
Openingnew marketsto yourcompany /SBU?
Leading yourcompany /
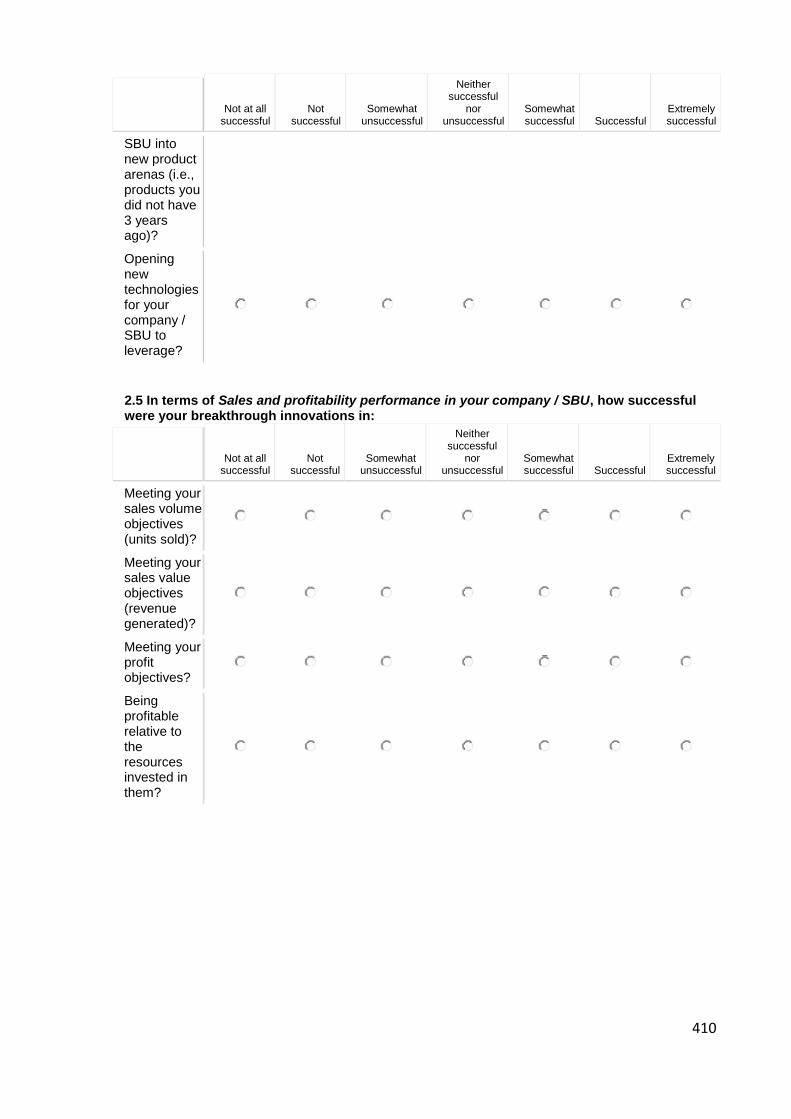
410
Not at allsuccessful
Notsuccessful
Somewhatunsuccessful
Neithersuccessful
norunsuccessful
Somewhatsuccessful Successful
Extremelysuccessful
SBU intonew productarenas (i.e.,products youdid not have3 yearsago)?
Openingnewtechnologiesfor yourcompany /SBU toleverage?
2.5 In terms of Sales and profitability performance in your company / SBU, how successfulwere your breakthrough innovations in:
Not at allsuccessful
Notsuccessful
Somewhatunsuccessful
Neithersuccessful
norunsuccessful
Somewhatsuccessful Successful
Extremelysuccessful
Meeting yoursales volumeobjectives(units sold)?
Meeting yoursales valueobjectives(revenuegenerated)?
Meeting yourprofitobjectives?
Beingprofitablerelative totheresourcesinvested inthem?

411
SECTION 3: INFORMATION PROCESSING AND KNOWLEDGE MANAGEMENT OF YOUR COMPANY
NEW PRODUCT DEVELOPMENT SURVEY
SECTION 3: Information Processing and KnowledgeManagement
(Absorptive Capacity) of Your Company / SBUWe are interested in the general organizational routines and processes in your company / SBUquite apart from innovation related activities.
Please think across all of the departments such as R&D, production, marketing andaccounting within your company / SBU. Please consider how well they communicate with eachother and how well employees connect within and outside the industry and apply new knowledge intheir practical work.
3.1 In terms of how your company / SBU acquires knowledge from external sources, pleasetell us to what extent you agree or disagree with each of the following statements:
Stronglydisagree Disagree
Somewhatdisagree
Neitheragreenor
disagreeSomewhat
agree AgreeStronglyagree
The search for relevantinformation concerning ourindustry is an every-daybusiness in our company /SBU.
Our managementmotivates employees touse multiple informationsources within ourindustry.
Our management expectsthat employees deal withinformation beyond ourindustry.
3.2 In terms of how your company / SBU processes the externally acquiredknowledge, please tell us to what extent you agree or disagree with each of the followingstatements:
Stronglydisagree Disagree
Somewhatdisagree
Neitheragreenor
disagreeSomewhat
agree AgreeStronglyagree
In our company / SBU,ideas and concepts areeffectively communicatedacross departments.
Our managementemphasizes cross-departmental support tosolve problems.

412
Stronglydisagree Disagree
Somewhatdisagree
Neitheragreenor
disagreeSomewhat
agree AgreeStronglyagree
In our company / SBU,there is a quick informationflow e.g. if a business unitobtains importantinformation itcommunicates thisinformation promptly to allother business units ordepartments.
Our managementdemands cross-departmental meetings toexchange information onnew developments,problems, andachievements.
3.3 In terms of how employees within your company / SBU combine their existing knowledgewith new knowledge, please tell us to what extent you agree or disagree with each of thefollowing statements:
Stronglydisagree Disagree
Somewhatdisagree
Neitheragreenor
disagreeSomewhat
agree AgreeStronglyagree
Our employees have anexceptional ability tostructure and to usecollected knowledge.
Our employees are usedto absorbing newknowledge as well aspreparing it for furtherpurposes and to make itavailable.
Our employeessuccessfully link existingknowledge with newinsights.
Our employees are able toapply new knowledge intheir practical work.
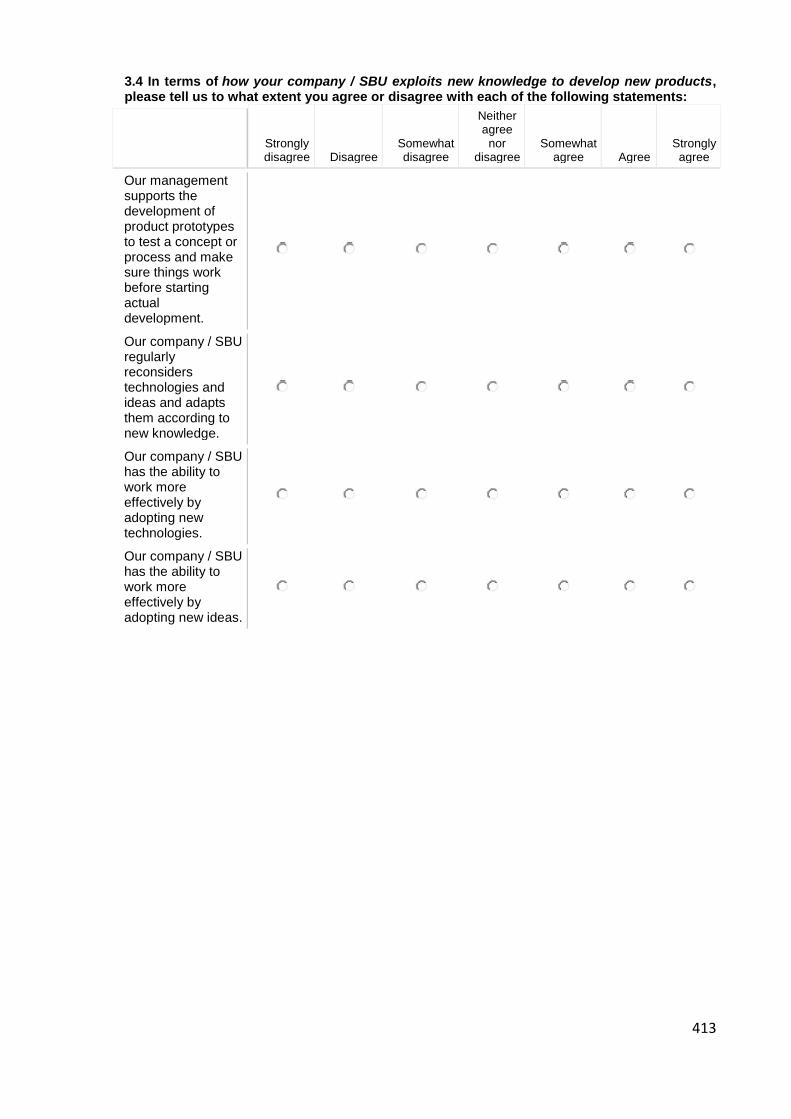
413
3.4 In terms of how your company / SBU exploits new knowledge to develop new products,please tell us to what extent you agree or disagree with each of the following statements:
Stronglydisagree Disagree
Somewhatdisagree
Neitheragree
nordisagree
Somewhatagree Agree
Stronglyagree
Our managementsupports thedevelopment ofproduct prototypesto test a concept orprocess and makesure things workbefore startingactualdevelopment.
Our company / SBUregularlyreconsiderstechnologies andideas and adaptsthem according tonew knowledge.
Our company / SBUhas the ability towork moreeffectively byadopting newtechnologies.
Our company / SBUhas the ability towork moreeffectively byadopting new ideas.

414
SECTION 4: VISIONING CAPABILITIES (Market Visioning Competence/ Market Vision)
NEW PRODUCT DEVELOPMENT SURVEY
SECTION 4: Organizational Visioning CapabilitiesNow thinking about breakthrough innovations again, we are interested in understandingmore about how people undertake product innovation related tasks and thinking within yourcompany / SBU.
4.1 Market Visioning Competence is "the ability of individuals or NPD team in organization tolink new or existing ideas/advanced technologies to future market opportunities".
Please think about the nature of market visioning for breakthrough innovations within yourcompany / SBU and indicate the degree to which you agree or disagree with thesestatements:
Stronglydisagree Disagree
Somewhatdisagree
Neitheragree
nordisagree
Somewhatagree Agree
Stronglyagree
We try to keep ourmarket opportunityoptions open aslong as possible forpotentialbreakthroughproducts.
We try to developseveral potentialproduct andtechnologicalscenarios beforechoosing market(s)to pursue.
We use severalforecasting andmarket estimationtechniques beforemaking a finalmarket selection.
We continuously tryto discoveradditional needs ofour customers ofwhich they areunaware.
We incorporatesolutions tounarticulatedcustomer needs inour new productsand services.
We brainstorm onhow customers useour products andservices.
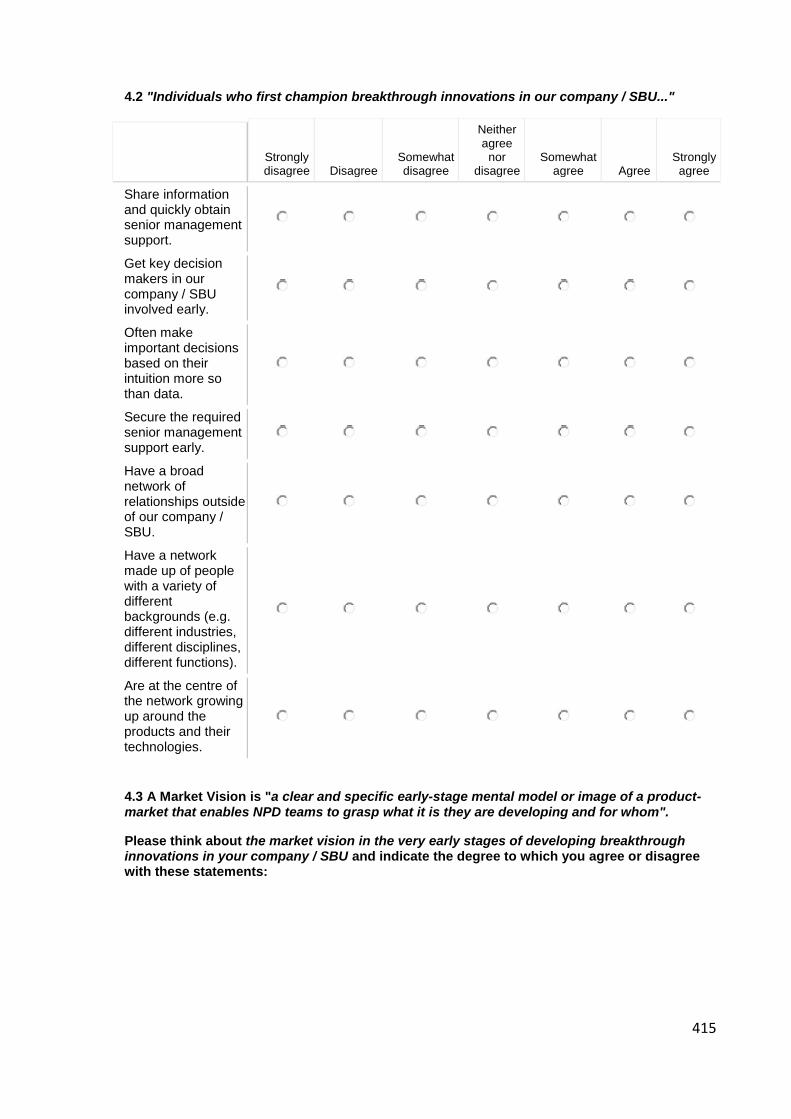
415
4.2 "Individuals who first champion breakthrough innovations in our company / SBU..."
Stronglydisagree Disagree
Somewhatdisagree
Neitheragree
nordisagree
Somewhatagree Agree
Stronglyagree
Share informationand quickly obtainsenior managementsupport.
Get key decisionmakers in ourcompany / SBUinvolved early.
Often makeimportant decisionsbased on theirintuition more sothan data.
Secure the requiredsenior managementsupport early.
Have a broadnetwork ofrelationships outsideof our company /SBU.
Have a networkmade up of peoplewith a variety ofdifferentbackgrounds (e.g.different industries,different disciplines,different functions).
Are at the centre ofthe network growingup around theproducts and theirtechnologies.
4.3 A Market Vision is "a clear and specific early-stage mental model or image of a product-market that enables NPD teams to grasp what it is they are developing and for whom".
Please think about the market vision in the very early stages of developing breakthroughinnovations in your company / SBU and indicate the degree to which you agree or disagreewith these statements:

416
Stronglydisagree Disagree
Somewhatdisagree
Neitheragree
nordisagree
Somewhatagree Agree
Stronglyagree
We have a veryspecific MarketVision statementthat guides eachNPD project.
Our Market Visionprovides cleardirection to others inthe company / SBUregarding what isbeing developedand for whom.
Our Market Visionclearly highlights theattractiveness of themarket opportunity.
Our Market Visionhelps make tangiblewhat is to bedeveloped and forwhom.
Our Market Visiongenerates 'buy-in'from other peopleand groups in thecompany / SBU.
4.4 "When you first start thinking about what specific markets would benefit from yourbreakthrough innovations, you and your NPD team are able to spend an appropriate amountof time thinking and talking about..."
Stronglydisagree Disagree
Somewhatdisagree
Neitheragree
nordisagree
Somewhatagree Agree
Stronglyagree
How end-userswould ultimatelyinteract with and usethe breakthroughinnovations.
How thebreakthroughinnovations would fitinto an overallsystem of use forpotential customers.
How customersmight use thebreakthroughinnovations in theirenvironments.
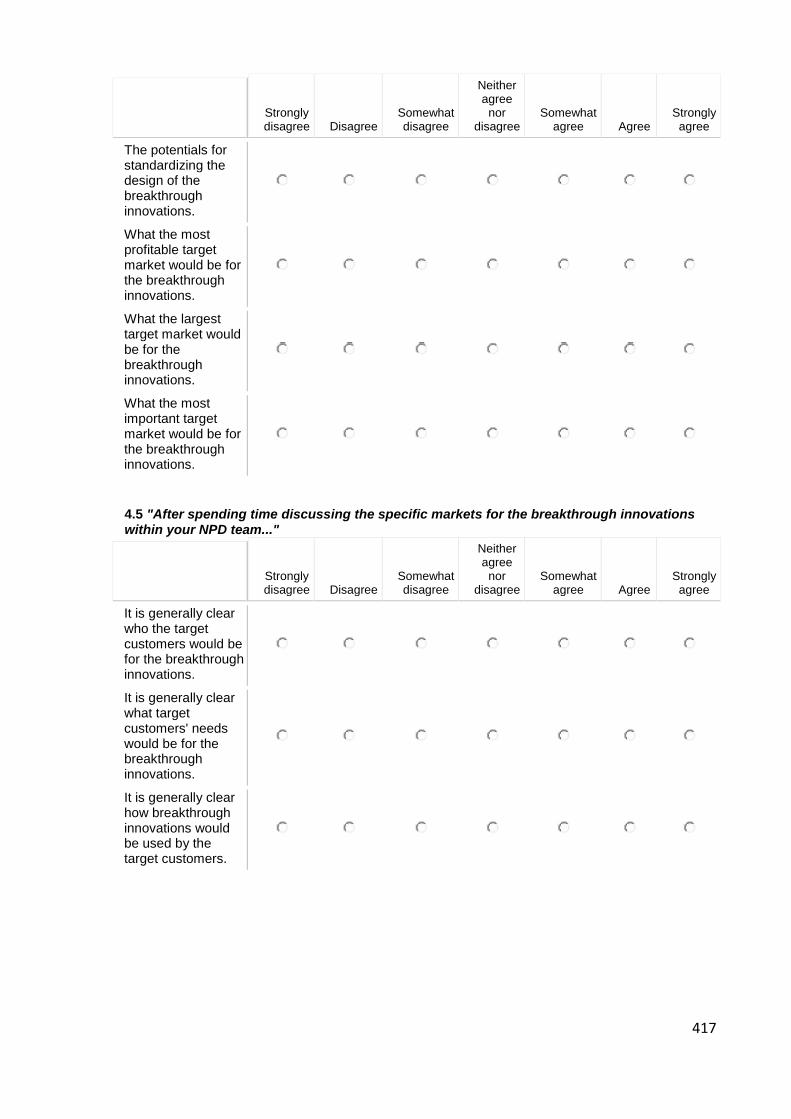
417
Stronglydisagree Disagree
Somewhatdisagree
Neitheragree
nordisagree
Somewhatagree Agree
Stronglyagree
The potentials forstandardizing thedesign of thebreakthroughinnovations.
What the mostprofitable targetmarket would be forthe breakthroughinnovations.
What the largesttarget market wouldbe for thebreakthroughinnovations.
What the mostimportant targetmarket would be forthe breakthroughinnovations.
4.5 "After spending time discussing the specific markets for the breakthrough innovationswithin your NPD team..."
Stronglydisagree Disagree
Somewhatdisagree
Neitheragree
nordisagree
Somewhatagree Agree
Stronglyagree
It is generally clearwho the targetcustomers would befor the breakthroughinnovations.
It is generally clearwhat targetcustomers' needswould be for thebreakthroughinnovations.
It is generally clearhow breakthroughinnovations wouldbe used by thetarget customers.
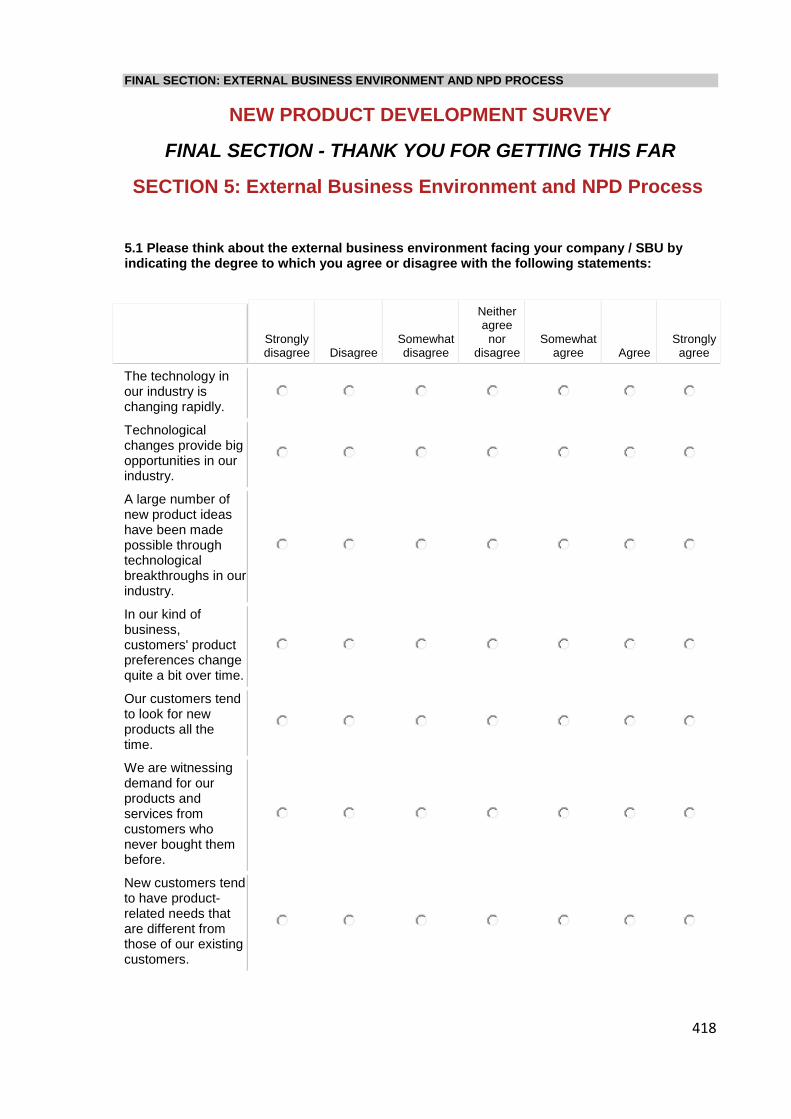
418
FINAL SECTION: EXTERNAL BUSINESS ENVIRONMENT AND NPD PROCESS
NEW PRODUCT DEVELOPMENT SURVEY
FINAL SECTION - THANK YOU FOR GETTING THIS FAR
SECTION 5: External Business Environment and NPD Process
5.1 Please think about the external business environment facing your company / SBU byindicating the degree to which you agree or disagree with the following statements:
Stronglydisagree Disagree
Somewhatdisagree
Neitheragree
nordisagree
Somewhatagree Agree
Stronglyagree
The technology inour industry ischanging rapidly.
Technologicalchanges provide bigopportunities in ourindustry.
A large number ofnew product ideashave been madepossible throughtechnologicalbreakthroughs in ourindustry.
In our kind ofbusiness,customers' productpreferences changequite a bit over time.
Our customers tendto look for newproducts all thetime.
We are witnessingdemand for ourproducts andservices fromcustomers whonever bought thembefore.
New customers tendto have product-related needs thatare different fromthose of our existingcustomers.

419
Stronglydisagree Disagree
Somewhatdisagree
Neitheragree
nordisagree
Somewhatagree Agree
Stronglyagree
Competition in ourindustry is cut-throat.
There are many"promotion wars" inour industry.
Anything that onecompetitor can offer,others can matchreadily.
Price competition isa hallmark of ourindustry.
5.2 Finally, please think about the New Product Development (NPD) Process and stagesassociated with the development of the breakthrough innovations in your company / SBUand indicate the degree to which you agree or disagree with these statements:
Stronglydisagree Disagree
Somewhatdisagree
Neitheragree
nordisagree
Somewhatagree Agree
Stronglyagree
Our company / SBUuses a formal NPDprocess-that is,standardized set ofstages and go/ no-go decisions toguide all newproduct activitiesfrom idea to launch.
Our NPD processhas clearly definedGO / NO-GOdecision points (orgates) for eachstage in theprocess.
Our NPD processhas definedgatekeepers whoreview projects ateach gate and makego / no-go decision.
Our NPD process isquite linear andinflexible; there islittle scope to dothings differently.

420
Stronglydisagree Disagree
Somewhatdisagree
Neitheragree
nordisagree
Somewhatagree Agree
Stronglyagree
Our NPD processreinforces the statusquo by solvingcustomers' existingproblems or statedpreferences incurrent markets.
If there are any comments that you would like to contribute regarding topics underexamination by the researchers please do so below,
we value any insights you can provide us with.
Once you have fully completed the survey, please provide your e-mail address below if you wishto receive a report on "Factors Influencing Breakthrough Innovation Success". We will send youone as soon as we have analysed the data.
IMPORTANT: Your information will be held strictly confidential and kept securely on a host server, supported by RMITUniversity. The e-mail address will be used solely by us for sending you the promised report and will never be used forany other purposes.
Your e-mail address: __________________________________________
END OF SURVEY.
THANK YOU VERY MUCH FOR YOUR PARTICIPATION!