Mapping the Food
Environment in Syracuse,
New York
2017
June 19, 2017
Syracuse Food Environment Report 2017 / Page 1
Table of Contents
1) An Assessment of the Local Food Environment in Syracuse ................................................................................................ 2
2) Syracuse Food Environment with Zip Code Boundaries......................................................................................................... 3
3) Food Environment Profiles ................................................................................................................................................................. 4
i) Syracuse .................................................................................................................................................................................... 5
ii) Zip Code 13202 ...................................................................................................................................................................... 7
iii) Zip Code 13203 ...................................................................................................................................................................... 9
iv) Zip Code 13204 .................................................................................................................................................................... 11
v) Zip Code 13205 .................................................................................................................................................................... 13
vi) Zip Code 13206 .................................................................................................................................................................... 15
vii) Zip Code 13207 .................................................................................................................................................................... 17
viii) Zip Code 13208 .................................................................................................................................................................... 19
ix) Zip Code 13210 .................................................................................................................................................................... 21
x) Zip Code 13224 .................................................................................................................................................................... 23
4) Discussion ............................................................................................................................................................................................... 25
5) Limitations .............................................................................................................................................................................................. 26
6) Conclusions and Next Steps ............................................................................................................................................................ 26
7) Appendix A: Zip Code Charts.......................................................................................................................................................... 27
Prepared by the Onondaga County Health Department with special acknowledgment to Common Ground Health
Syracuse Food Environment Report 2017 / Page 2
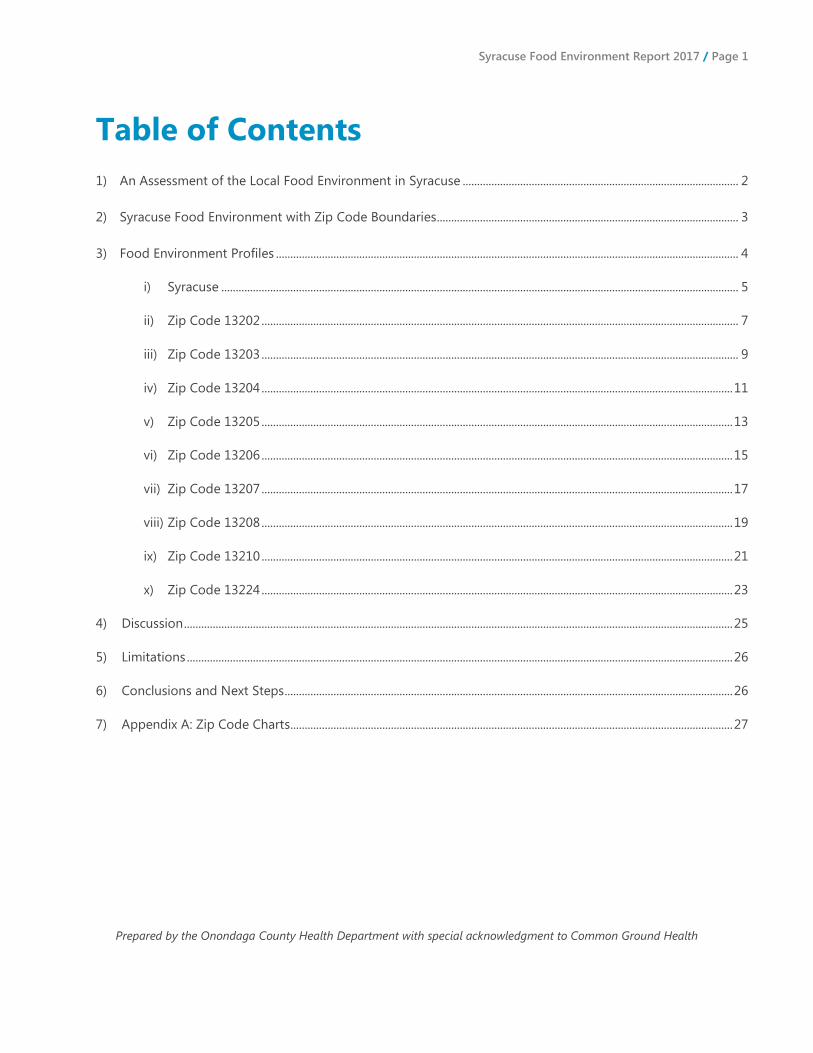
An Assessment of the Local Food Environment in Syracuse, New York
Maintaining healthy eating habits can decrease the incidence of chronic conditions like obesity and diabetes,
which are some of the main health challenges in Onondaga County. While healthy eating is an individual
behavior, choices are influenced by a number of factors, one of which is the local food environment. As
defined by the Centers for Disease Control and Prevention (CDC), the food environment is “the physical
presence of food that affects a person’s diet, a person’s proximity to food store locations, the distribution of
food stores, food service, and any physical entity by which food may be obtained, or a connected system that
allows access to food.”1 This report seeks to examine the food environment for each zip code in the City of
Syracuse (Figure 1) in order to provide a framework to support healthy food initiatives in the community. Zip
codes were included if they fell primarily within the City of Syracuse boundary.
To create the profiles, data were pulled for each zip code
from existing sources, including the American Community
Survey and the New York Statewide Planning and
Research Cooperative System (SPARCS). Indicators were
selected based on availability and relevance to the local
socioeconomic and food environment. The full data table
can be seen in Appendix A. A geospatial analysis
included census tract level data for obesity rates and food
desert status, layered with point data noting the locations
of food sources. Maps also include the location of
Syracuse City School District school buildings, to show the
types of food establishments that are easily accessible to
school aged children. Geocoding and map development
was performed according to standards adhered to by the
Syracuse - Onondaga County Planning Agency.
For the purposes of this report, food deserts are defined
as census tracts where the poverty rate is >20%, and
where 33% or more of residents are more than 0.5 miles
from the nearest supermarket. Other food stores include
convenience stores, dollar stores, food cooperatives, gas
stations, international food stores, small grocery stores,
specialty food stores, and pharmacies. To provide a more
comprehensive look at access to healthy foods in high risk areas, results of several recent surveys were also
reviewed. Over the past year, OCHD has developed and implemented surveys in zip codes 13202, 13205 and
13207 for various projects. A recent community engagement survey sent to residents in all City zip codes also
asked about access to healthy foods. Results are noted below by zip code as appropriate.
1 Centers for Disease Control and Prevention. Healthy Places: General Food Environment Resources. 2014.
https://www.cdc.gov/healthyplaces/healthtopics/healthyfood/general.htm. Accessed 5/18/17.
Figure 1. City of Syracuse Zip Codes

Syracuse Food Environment Report 2017 / Page 3
Syracuse Food Environment with Zip Code Boundaries
13206
13208
13203
13204
13202
13224
13210
13205
13207
Syracuse Food Environment Report 2017 / Page 4
Food Environment
Profiles
Syracuse Food Environment Report 2017 / Page 5
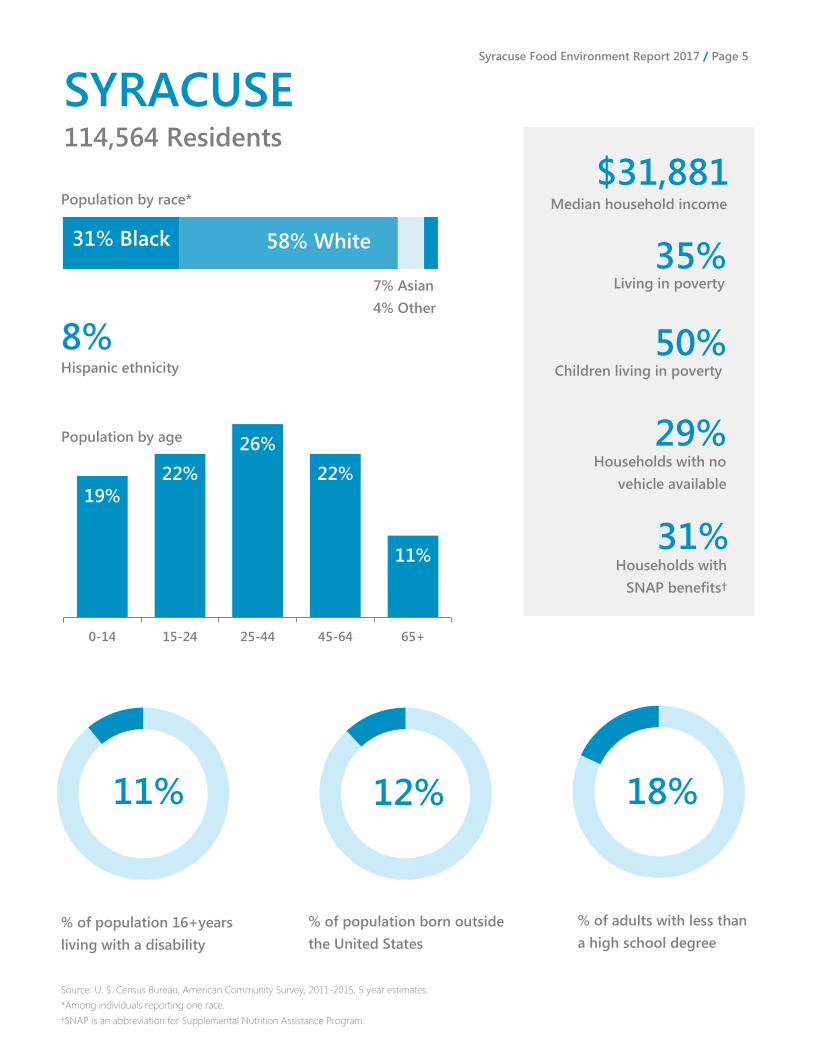
19%
22%
26%
22%
11%
0-14 15-24 25-44 45-64 65+
12% 11% 18%
SYRACUSE
31% Black 58% White
7% Asian
4% Other
Population by race* Median household income
$31,881
35% Living in poverty
50% Children living in poverty
29% Households with no
vehicle available
Source: U. S. Census Bureau, American Community Survey, 2011-2015, 5 year estimates.
*Among individuals reporting one race.
†SNAP is an abbreviation for Supplemental Nutrition Assistance Program.
Population by age
Hispanic ethnicity
8%
114,564 Residents
% of population 16+years
living with a disability
% of population born outside
the United States
% of adults with less than
a high school degree
31% Households with
SNAP benefits†
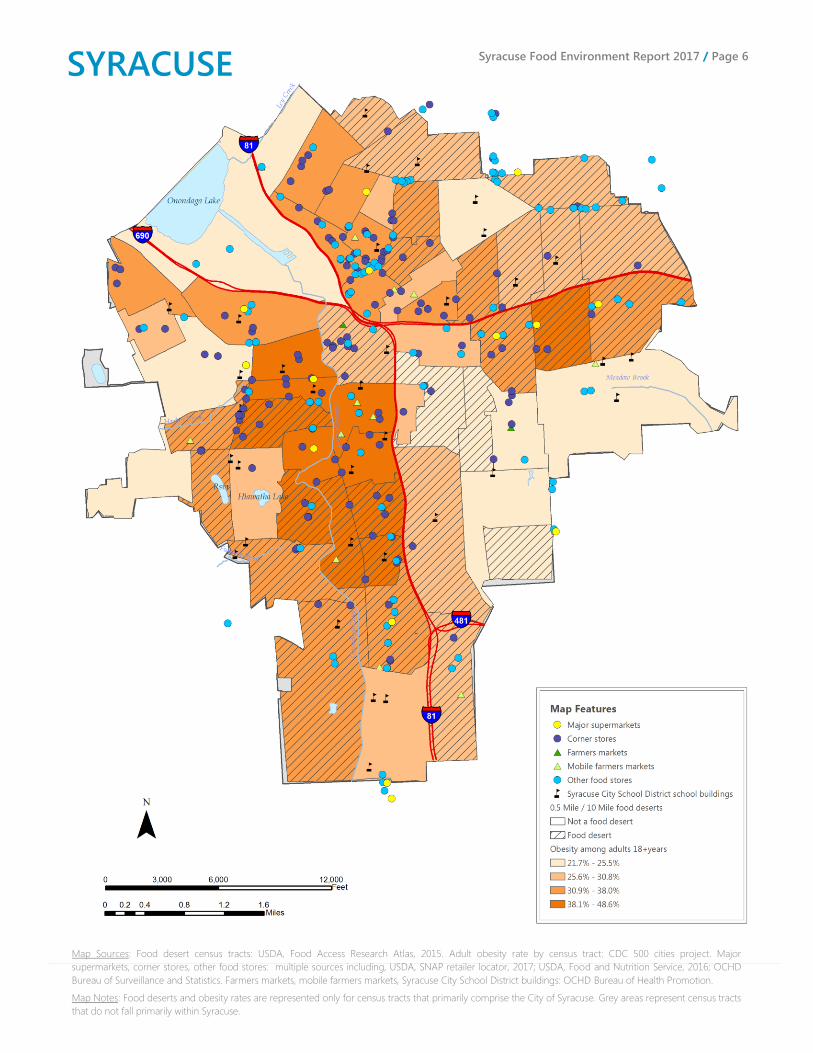
Syracuse Food Environment Report 2017 / Page 6
Map Sources: Food desert census tracts: USDA, Food Access Research Atlas, 2015. Adult obesity rate by census tract: CDC 500 cities project. Major
supermarkets, corner stores, other food stores: multiple sources including, USDA, SNAP retailer locator, 2017; USDA, Food and Nutrition Service, 2016; OCHD
Bureau of Surveillance and Statistics. Farmers markets, mobile farmers markets, Syracuse City School District buildings: OCHD Bureau of Health Promotion.
Map Notes: Food deserts and obesity rates are represented only for census tracts that primarily comprise the City of Syracuse. Grey areas represent census tracts
that do not fall primarily within Syracuse.
SYRACUSE
Syracuse Food Environment Report 2017 / Page 7
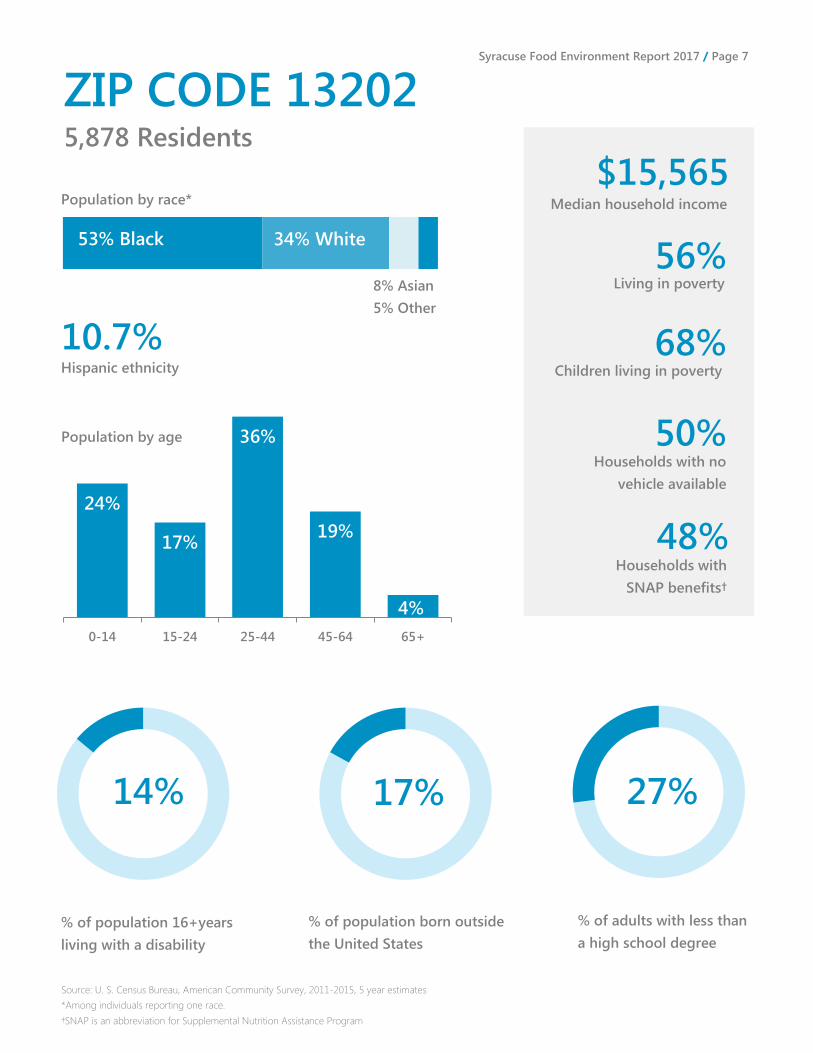
24%
17%
36%
19%
0-14 15-24 25-44 45-64 65+
17% 14% 27%
ZIP CODE 13202
53% Black 34% White
8% Asian
5% Other
Population by race* Median household income
$15,565
56% Living in poverty
68% Children living in poverty
50% Households with no
vehicle available
Source: U. S. Census Bureau, American Community Survey, 2011-2015, 5 year estimates
*Among individuals reporting one race.
†SNAP is an abbreviation for Supplemental Nutrition Assistance Program
Population by age
Hispanic ethnicity
10.7%
5,878 Residents
% of population 16+years
living with a disability
% of population born outside
the United States
% of adults with less than
a high school degree
48% Households with
SNAP benefits†
4%

Syracuse Food Environment Report 2017 / Page 8
13202 Best-performing
zip code
Worst-performing
zip code
Diabetes
hospitalization 48.9
(Ranks 7th)
19.3 (13224)
53.1 (13205)
Hypertension
hospitalization
†
2.4
(13206)
9.8 (13205)
Heart failure
hospitalization 80.1
(Ranks 9th)
26.0 (13206)
80.1 (13202)
14 SNAP retailers
22 Fast food restaurants
38 Full-service restaurants
Rates are per 10,000 population 18+years
†Data not available
Health Outcomes
Sources: SNAP retailers: USDA, SNAP retailer locator, 2017. Fast food restaurants and full-service restaurants: US Census Bureau, County Business Patterns, 2015.
Health Outcomes: New York Statewide Planning and Research Cooperative System, 2012-2014.
Map Sources: Food desert census tracts: USDA, Food Access Research Atlas, 2015. Adult obesity rate by census tract: CDC 500 cities project, 2015. Major
supermarkets, corner stores, other food stores: multiple sources including, USDA, SNAP retailer locator, 2017; USDA, Food and Nutrition Service, 2016; OCHD
Bureau of Surveillance and Statistics. Farmers markets, mobile farmers markets, Syracuse City School District buildings: OCHD Bureau of Health Promotion.
Map Notes: Food deserts and obesity rates are represented only for census tracts that primarily comprise the City of Syracuse. Grey areas represent census tracts
that do not fall primarily within Syracuse but are located within the identified zip code. Census tract boundaries are not delineated for tracts outside of Syracuse.
ZIP CODE 13202
32
42
Syracuse Food Environment Report 2017 / Page 9
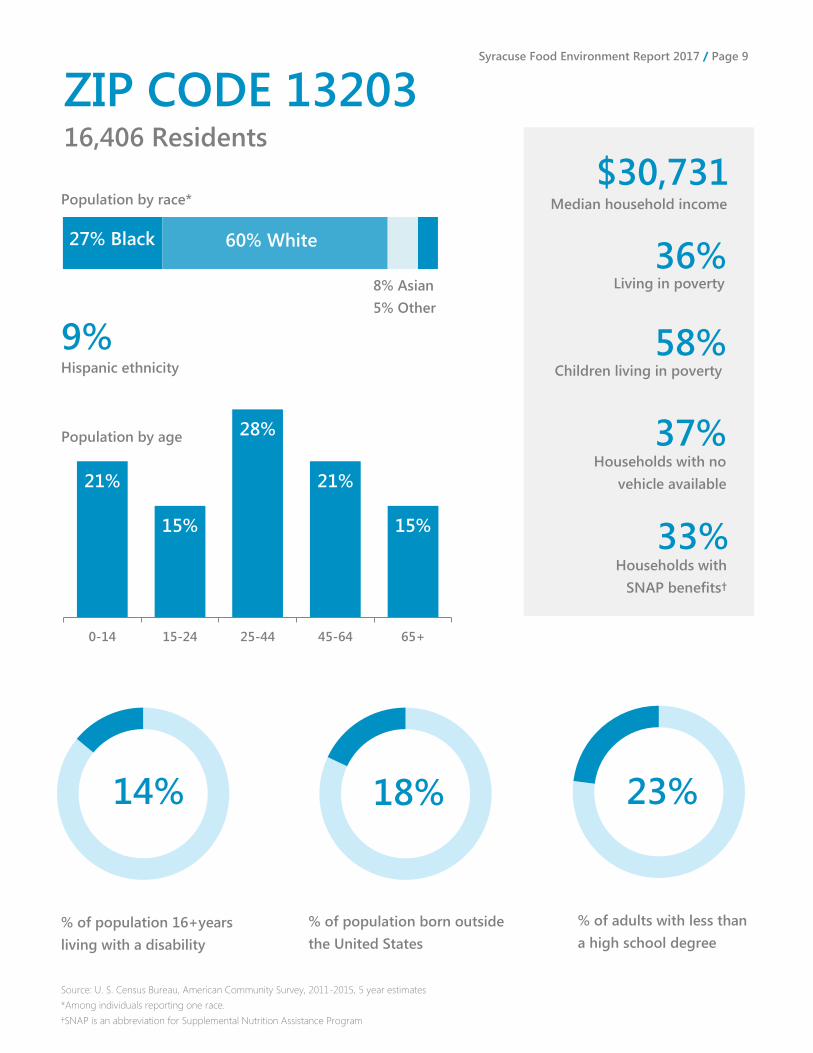
21%
15%
28%
21%
15%
0-14 15-24 25-44 45-64 65+
18% 14% 23%
ZIP CODE 13203
27% Black 60% White
8% Asian
5% Other
Population by race* Median household income
$30,731
36% Living in poverty
58% Children living in poverty
37% Households with no
vehicle available
Source: U. S. Census Bureau, American Community Survey, 2011-2015, 5 year estimates
*Among individuals reporting one race.
†SNAP is an abbreviation for Supplemental Nutrition Assistance Program
Population by age
Hispanic ethnicity
9%
16,406 Residents
% of population 16+years
living with a disability
% of population born outside
the United States
% of adults with less than
a high school degree
33% Households with
SNAP benefits†
Syracuse Food Environment Report 2017 / Page 10
13203 Best-performing
zip code
Worst-performing
zip code
Diabetes
hospitalization 36.4
(Ranks 4th)
19.3 (13224)
53.1 (13205)
Hypertension
hospitalization 7.2
(Ranks 4th)
2.4 (13206)
9.8 (13205)
Heart failure
hospitalization 43.9
(Ranks 4th)
26.0 (13206)
80.1 (13202)
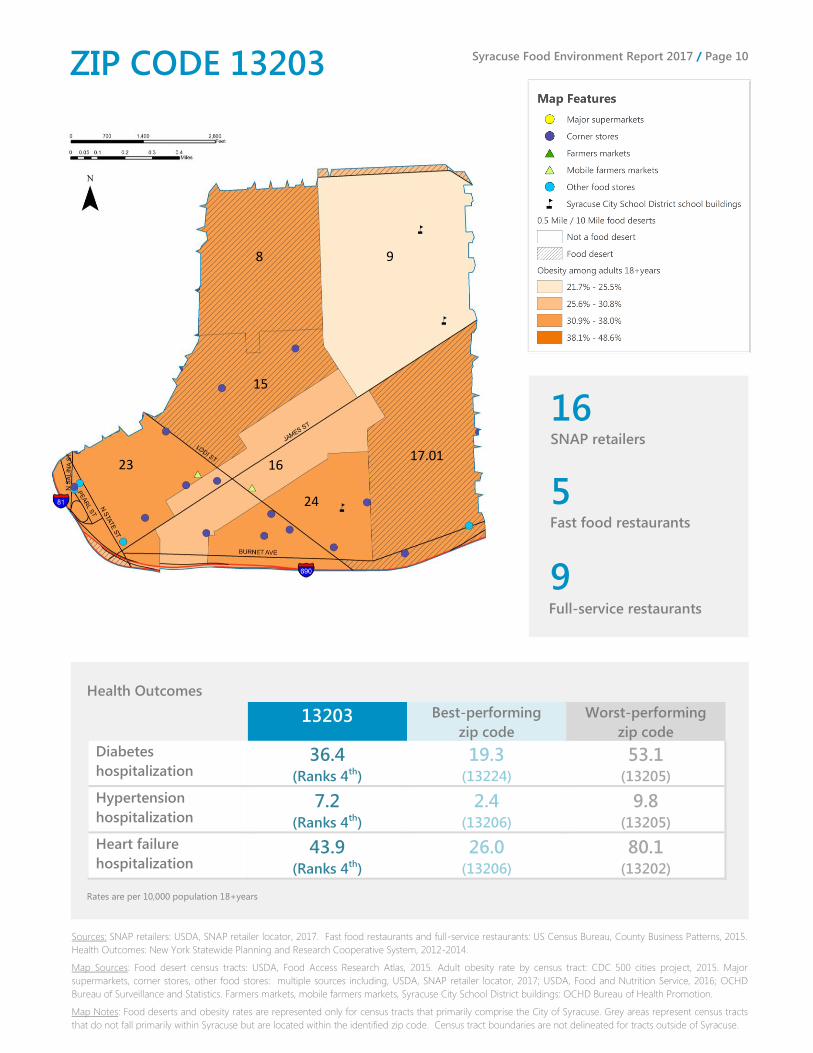
16 SNAP retailers
5 Fast food restaurants
9 Full-service restaurants
Rates are per 10,000 population 18+years
Health Outcomes
Sources: SNAP retailers: USDA, SNAP retailer locator, 2017. Fast food restaurants and full-service restaurants: US Census Bureau, County Business Patterns, 2015.
Health Outcomes: New York Statewide Planning and Research Cooperative System, 2012-2014.
Map Sources: Food desert census tracts: USDA, Food Access Research Atlas, 2015. Adult obesity rate by census tract: CDC 500 cities project, 2015. Major
supermarkets, corner stores, other food stores: multiple sources including, USDA, SNAP retailer locator, 2017; USDA, Food and Nutrition Service, 2016; OCHD
Bureau of Surveillance and Statistics. Farmers markets, mobile farmers markets, Syracuse City School District buildings: OCHD Bureau of Health Promotion.
Map Notes: Food deserts and obesity rates are represented only for census tracts that primarily comprise the City of Syracuse. Grey areas represent census tracts
that do not fall primarily within Syracuse but are located within the identified zip code. Census tract boundaries are not delineated for tracts outside of Syracuse.
ZIP CODE 13203
8 9
17.01
15
23 16
24
Syracuse Food Environment Report 2017 / Page 11
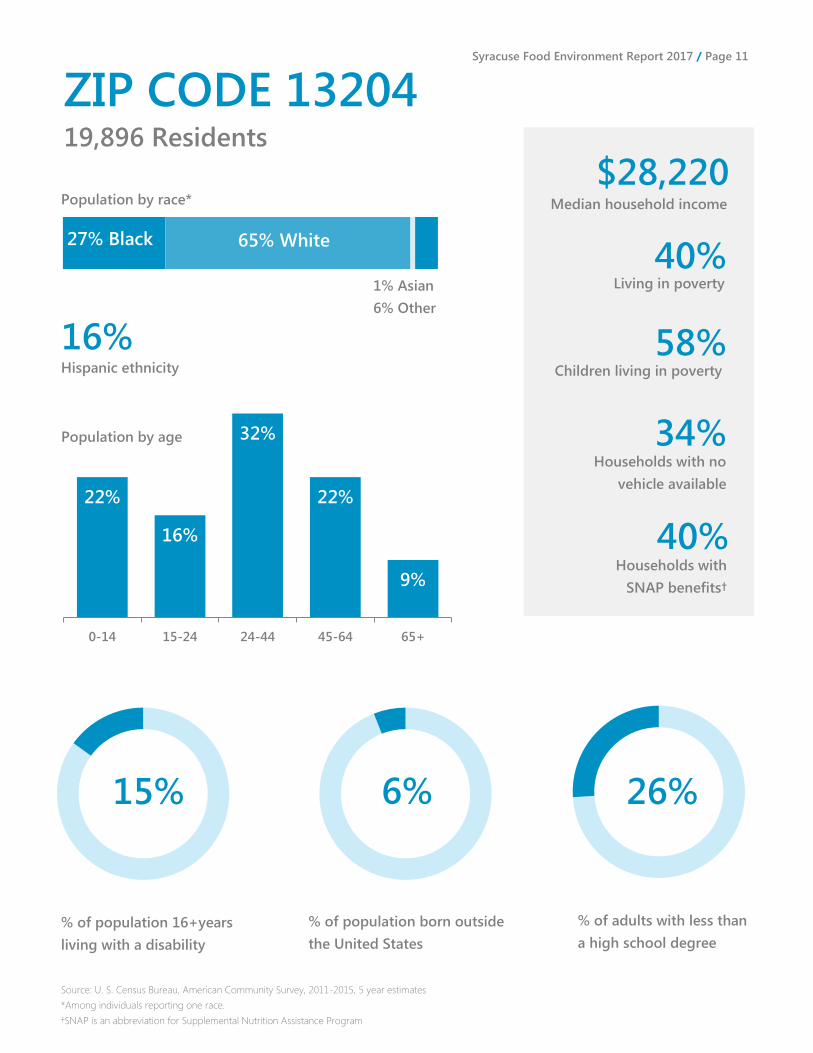
22%
16%
32%
22%
9%
0-14 15-24 24-44 45-64 65+
6% 15% 26%
ZIP CODE 13204
27% Black 65% White
1% Asian
6% Other
Population by race* Median household income
$28,220
40% Living in poverty
58% Children living in poverty
34% Households with no
vehicle available
Source: U. S. Census Bureau, American Community Survey, 2011-2015, 5 year estimates
*Among individuals reporting one race.
†SNAP is an abbreviation for Supplemental Nutrition Assistance Program
Population by age
Hispanic ethnicity
16%
19,896 Residents
% of population 16+years
living with a disability
% of population born outside
the United States
% of adults with less than
a high school degree
40% Households with
SNAP benefits†
Syracuse Food Environment Report 2017 / Page 12
13204 Best-performing
zip code
Worst-performing
zip code
Diabetes
hospitalization 51.1
(Ranks 8th)
19.3 (13224)
53.1 (13205)
Hypertension
hospitalization 8.7
(Ranks 6th)
2.4 (13206)
9.8 (13205)
Heart failure
hospitalization 70.9
(Ranks 8th)
26.0 (13206)
80.1 (13202)
43 SNAP retailers
21 Fast food restaurants
22 Full-service restaurants
Rates are per 10,000 population 18+years
Health Outcomes
Sources: SNAP retailers: USDA, SNAP retailer locator, 2017. Fast food restaurants and full-service restaurants: US Census Bureau, County Business Patterns, 2015.
Health Outcomes: New York Statewide Planning and Research Cooperative System, 2012-2014.
Map Sources: Food desert census tracts: USDA, Food Access Research Atlas, 2015. Adult obesity rate by census tract: CDC 500 cities project, 2015. Major
supermarkets, corner stores, other food stores: multiple sources including, USDA, SNAP retailer locator, 2017; USDA, Food and Nutrition Service, 2016; OCHD
Bureau of Surveillance and Statistics. Farmers markets, mobile farmers markets, Syracuse City School District buildings: OCHD Bureau of Health Promotion.
Map Notes: Food deserts and obesity rates are represented only for census tracts that primarily comprise the City of Syracuse. Grey areas represent census tracts
that do not fall primarily within Syracuse but are located within the identified zip code. Census tract boundaries are not delineated for tracts outside of Syracuse.
ZIP CODE 13204
1
21.01
30
40
39 38
29.01
27
30

Syracuse Food Environment Report 2017 / Page 13
21%
15%
24% 23%
17%
0-14 15-24 25-44 45-64 65+
7% 14% 23%
ZIP CODE 13205
58% Black 36% White
3% Asian
3% Other
Population by race* Median household income
$30,284
34% Living in poverty
50% Children living in poverty
32% Households with no
vehicle available
Source: U. S. Census Bureau, American Community Survey, 2011-2015, 5 year estimates
*Among individuals reporting one race.
†SNAP is an abbreviation for Supplemental Nutrition Assistance Program
Population by age
Hispanic ethnicity
7%
18,729 Residents
% of population 16+years
living with a disability
% of population born outside
the United States
% of adults with less than
a high school degree
36% Households with
SNAP benefits†

Syracuse Food Environment Report 2017 / Page 14
13205 Best-performing
zip code
Worst-performing
zip code
Diabetes
hospitalization 53.1
(Ranks 9th)
19.3 (13224)
53.1 (13205)
Hypertension
hospitalization 9.8
(Ranks 7th)
2.4 (13206)
9.8 (13205)
Heart failure
hospitalization 63.8
(Ranks 7th)
26.0 (13206)
80.1 (13202)
31
2 SNAP retailers
10 Fast food restaurants
0 Full-service restaurants
Rates are per 10,000 population 18+years
Health Outcomes
Sources: SNAP retailers: USDA, SNAP retailer locator, 2017. Fast food restaurants and full-service restaurants: US Census Bureau, County Business Patterns, 2015.
Health Outcomes: New York Statewide Planning and Research Cooperative System, 2012-2014.
Map Sources: Food desert census tracts: USDA, Food Access Research Atlas, 2015. Adult obesity rate by census tract: CDC 500 cities project, 2015. Major
supermarkets, corner stores, other food stores: multiple sources including, USDA, SNAP retailer locator, 2017; USDA, Food and Nutrition Service, 2016; OCHD
Bureau of Surveillance and Statistics. Farmers markets, mobile farmers markets, Syracuse City School District buildings: OCHD Bureau of Health Promotion.
Map Notes: Food deserts and obesity rates are represented only for census tracts that primarily comprise the City of Syracuse. Grey areas represent census tracts
that do not fall primarily within Syracuse but are located within the identified zip code. Census tract boundaries are not delineated for tracts outside of Syracuse.
ZIP CODE 13205
61.03
61.02
61.01
59 58
54
53

Syracuse Food Environment Report 2017 / Page 15
19%
11%
29% 27%
15%
0-14 15-24 25-44 45-64 65+
7% 11% 14%
ZIP CODE 13206
16% 80% White
2% Asian
2% Other
Population by race* Median household income
$38,264
21% Living in poverty
36% Children living in poverty
18% Households with no
vehicle available
Source: U. S. Census Bureau, American Community Survey, 2011-2015, 5 year estimates
*Among individuals reporting one race.
†SNAP is an abbreviation for Supplemental Nutrition Assistance Program
Population by age
Hispanic ethnicity
5%
16,428 Residents
% of population 16+years
living with a disability
% of population born outside
the United States
% of adults with less than
a high school degree
19% Households with
SNAP benefits†
Black

Syracuse Food Environment Report 2017 / Page 16
13206 Best-performing
zip code
Worst-performing
zip code
Diabetes
hospitalization 21.9
(Ranks 2nd)
19.3 (13224)
53.1 (13205)
Hypertension
hospitalization 2.4
(Ranks 1st)
2.4 (13206)
9.8 (13205)
Heart failure
hospitalization 26.0
(Ranks 1st)
26.0 (13206)
80.1 (13202)
26 SNAP retailers
28 Fast food restaurants
13 Full-service restaurants
Rates are per 10,000 population 18+years
Health Outcomes
Sources: SNAP retailers: USDA, SNAP retailer locator, 2017. Fast food restaurants and full-service restaurants: US Census Bureau, County Business Patterns, 2015.
Health Outcomes: New York Statewide Planning and Research Cooperative System, 2012-2014.
Map Sources: Food desert census tracts: USDA, Food Access Research Atlas, 2015. Adult obesity rate by census tract: CDC 500 cities project, 2015. Major
supermarkets, corner stores, other food stores: multiple sources including, USDA, SNAP retailer locator, 2017; USDA, Food and Nutrition Service, 2016; OCHD
Bureau of Surveillance and Statistics. Farmers markets, mobile farmers markets, Syracuse City School District buildings: OCHD Bureau of Health Promotion.
Map Notes: Food deserts and obesity rates are represented only for census tracts that primarily comprise the City of Syracuse. Grey areas represent census tracts
that do not fall primarily within Syracuse but are located within the identified zip code. Census tract boundaries are not delineated for tracts outside of Syracuse.
ZIP CODE 13206
17.02
18 19
10

Syracuse Food Environment Report 2017 / Page 17
23%
13%
27% 27%
11%
0-14 15-24 25-44 45-64 65+
5% 12% 13%
ZIP CODE 13207
41% Black 56% White
1% Asian
2% Other
Population by race* Median household income
$44,741
23% Living in poverty
37% Children living in poverty
17% Households with no
vehicle available
Source: U. S. Census Bureau, American Community Survey, 2011-2015, 5 year estimates
*Among individuals reporting one race.
†SNAP is an abbreviation for Supplemental Nutrition Assistance Program
Population by age
Hispanic ethnicity
7%
13,110 Residents
% of population 16+years
living with a disability
% of population born outside
the United States
% of adults with less than
a high school degree
25% Households with
SNAP benefits†
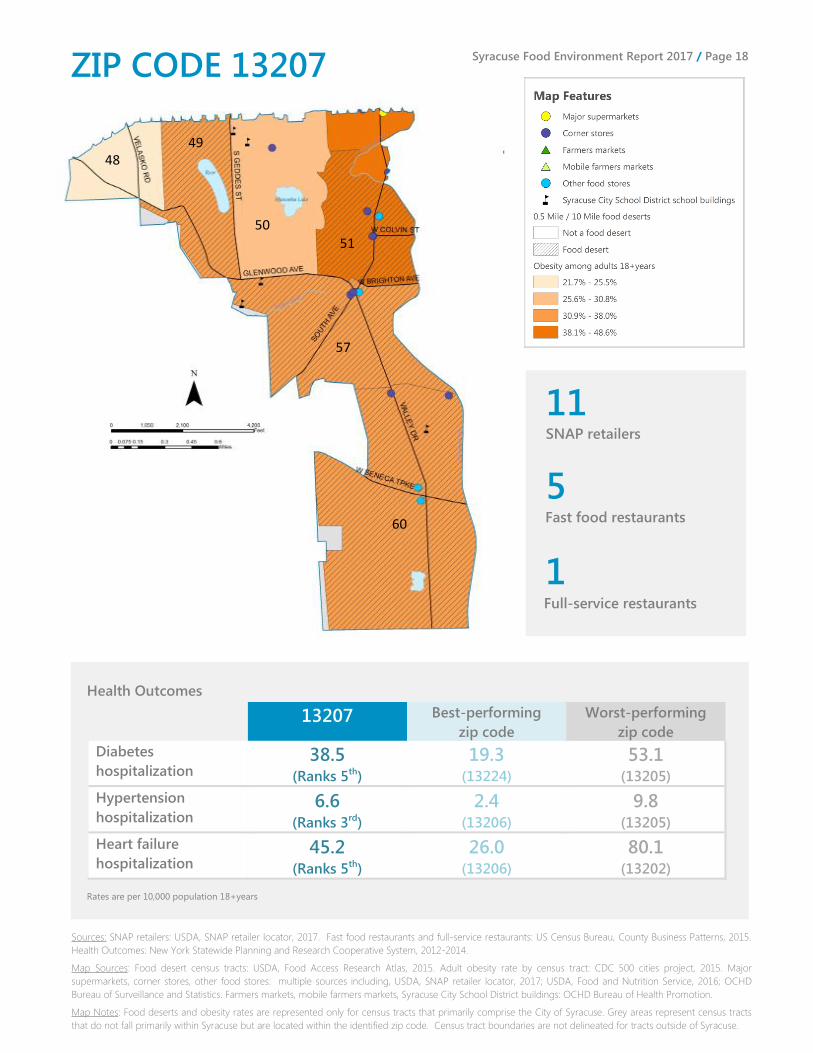
Syracuse Food Environment Report 2017 / Page 18
13207 Best-performing
zip code
Worst-performing
zip code
Diabetes
hospitalization 38.5
(Ranks 5th)
19.3 (13224)
53.1 (13205)
Hypertension
hospitalization 6.6
(Ranks 3rd)
2.4 (13206)
9.8 (13205)
Heart failure
hospitalization 45.2
(Ranks 5th)
26.0 (13206)
80.1 (13202)
11 SNAP retailers
5 Fast food restaurants
1 Full-service restaurants
Rates are per 10,000 population 18+years
Health Outcomes
Sources: SNAP retailers: USDA, SNAP retailer locator, 2017. Fast food restaurants and full-service restaurants: US Census Bureau, County Business Patterns, 2015.
Health Outcomes: New York Statewide Planning and Research Cooperative System, 2012-2014.
Map Sources: Food desert census tracts: USDA, Food Access Research Atlas, 2015. Adult obesity rate by census tract: CDC 500 cities project, 2015. Major
supermarkets, corner stores, other food stores: multiple sources including, USDA, SNAP retailer locator, 2017; USDA, Food and Nutrition Service, 2016; OCHD
Bureau of Surveillance and Statistics. Farmers markets, mobile farmers markets, Syracuse City School District buildings: OCHD Bureau of Health Promotion.
Map Notes: Food deserts and obesity rates are represented only for census tracts that primarily comprise the City of Syracuse. Grey areas represent census tracts
that do not fall primarily within Syracuse but are located within the identified zip code. Census tract boundaries are not delineated for tracts outside of Syracuse.
ZIP CODE 13207
60
57
51 50
49 48

Syracuse Food Environment Report 2017 / Page 19
23%
14%
26% 26%
12%
0-14 15-24 25-44 45-64 65+
22% 13% 26%
ZIP CODE 13208
19% 61% White
17% Asian
3% Other
Population by race* Median household income
$32,526
34% Living in poverty
51% Children living in poverty
31% Households with no
vehicle available
Source: U. S. Census Bureau, American Community Survey, 2011-2015, 5 year estimates
*Among individuals reporting one race.
†SNAP is an abbreviation for Supplemental Nutrition Assistance Program
Population by age
Hispanic ethnicity
8%
22,353 Residents
% of population 16+years
living with a disability
% of population born outside
the United States
% of adults with less than
a high school degree
34% Households with
SNAP benefits†
Black
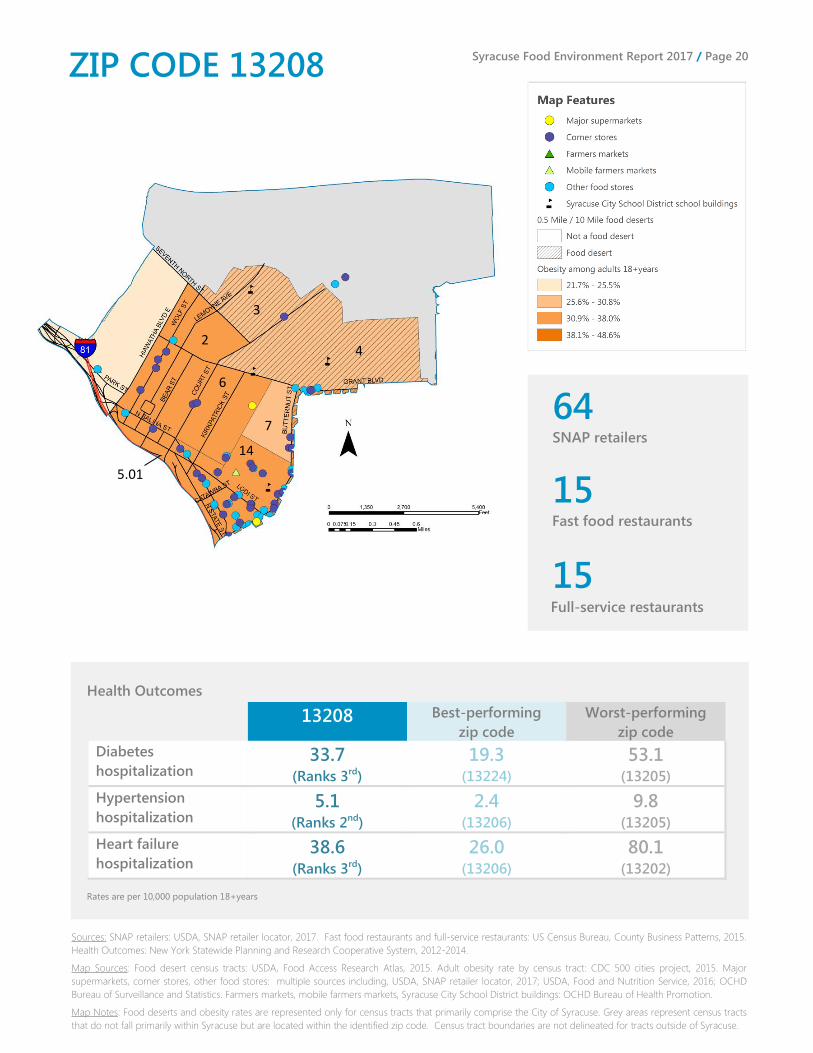
Syracuse Food Environment Report 2017 / Page 20
13208 Best-performing
zip code
Worst-performing
zip code
Diabetes
hospitalization 33.7
(Ranks 3rd)
19.3 (13224)
53.1 (13205)
Hypertension
hospitalization 5.1
(Ranks 2nd)
2.4 (13206)
9.8 (13205)
Heart failure
hospitalization 38.6
(Ranks 3rd)
26.0 (13206)
80.1 (13202)
64 SNAP retailers
15 Fast food restaurants
15 Full-service restaurants
Rates are per 10,000 population 18+years
Health Outcomes
Sources: SNAP retailers: USDA, SNAP retailer locator, 2017. Fast food restaurants and full-service restaurants: US Census Bureau, County Business Patterns, 2015.
Health Outcomes: New York Statewide Planning and Research Cooperative System, 2012-2014.
Map Sources: Food desert census tracts: USDA, Food Access Research Atlas, 2015. Adult obesity rate by census tract: CDC 500 cities project, 2015. Major
supermarkets, corner stores, other food stores: multiple sources including, USDA, SNAP retailer locator, 2017; USDA, Food and Nutrition Service, 2016; OCHD
Bureau of Surveillance and Statistics. Farmers markets, mobile farmers markets, Syracuse City School District buildings: OCHD Bureau of Health Promotion.
Map Notes: Food deserts and obesity rates are represented only for census tracts that primarily comprise the City of Syracuse. Grey areas represent census tracts
that do not fall primarily within Syracuse but are located within the identified zip code. Census tract boundaries are not delineated for tracts outside of Syracuse.
ZIP CODE 13208
3
4
7
14
6
2
5.01
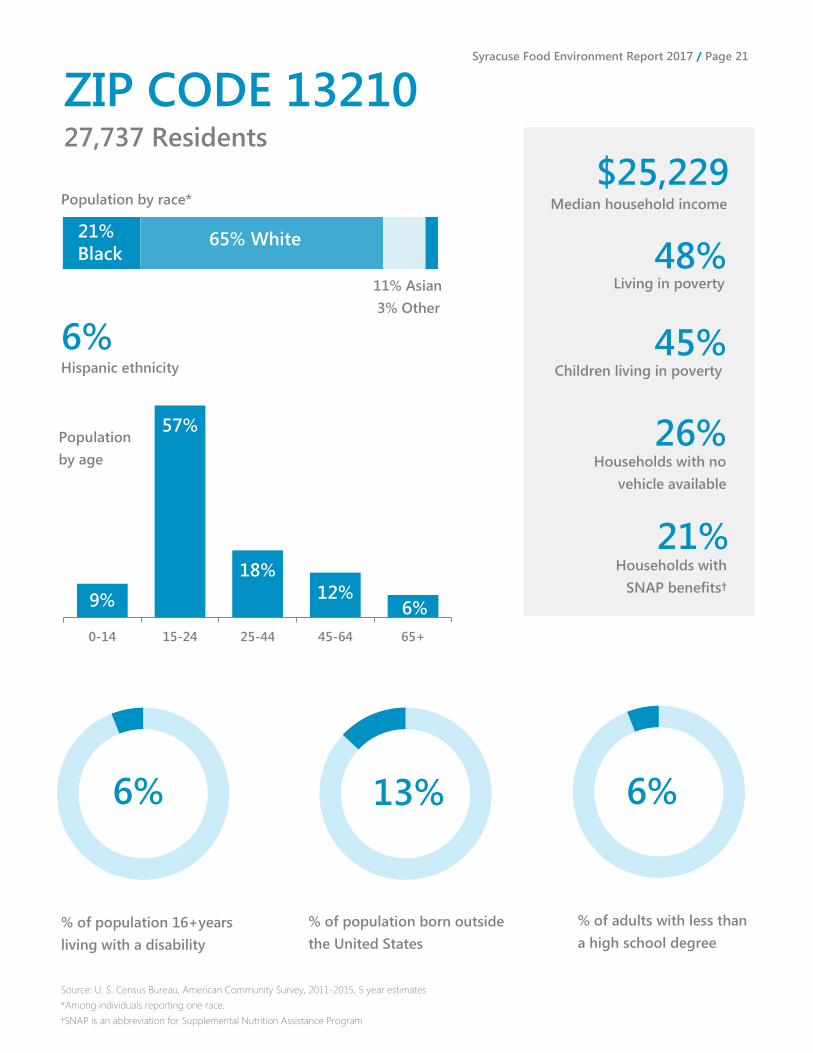
Syracuse Food Environment Report 2017 / Page 21
9%
57%
18%
12%
0-14 15-24 25-44 45-64 65+
13% 6% 6%
ZIP CODE 13210
21% 65% White
11% Asian
3% Other
Population by race* Median household income
$25,229
48% Living in poverty
45% Children living in poverty
26% Households with no
vehicle available
Source: U. S. Census Bureau, American Community Survey, 2011-2015, 5 year estimates
*Among individuals reporting one race.
†SNAP is an abbreviation for Supplemental Nutrition Assistance Program
Population
by age
Hispanic ethnicity
6%
27,737 Residents
% of population 16+years
living with a disability
% of population born outside
the United States
% of adults with less than
a high school degree
21% Households with
SNAP benefits†
Black
6%

Syracuse Food Environment Report 2017 / Page 22
13210 Best-performing
zip code
Worst-performing
zip code
Diabetes
hospitalization 40.6
(Ranks 6th)
19.3 (13224)
53.1 (13205)
Hypertension
hospitalization 8.2
(Ranks 5th)
2.4 (13206)
9.8 (13205)
Heart failure
hospitalization 45.5
(Ranks 6th)
26.0 (13206)
80.1 (13202)
18 SNAP retailers
26 Fast food restaurants
21 Full-service restaurants
Rates are per 10,000 population 18+years
Health Outcomes
Sources: SNAP retailers: USDA, SNAP retailer locator, 2017. Fast food restaurants and full-service restaurants: US Census Bureau, County Business Patterns, 2015.
Health Outcomes: New York Statewide Planning and Research Cooperative System, 2012-2014.
Map Sources: Food desert census tracts: USDA, Food Access Research Atlas, 2015. Adult obesity rate by census tract: CDC 500 cities project, 2015. Major
supermarkets, corner stores, other food stores: multiple sources including, USDA, SNAP retailer locator, 2017; USDA, Food and Nutrition Service, 2016; OCHD
Bureau of Surveillance and Statistics. Farmers markets, mobile farmers markets, Syracuse City School District buildings: OCHD Bureau of Health Promotion.
Map Notes: Food deserts and obesity rates are represented only for census tracts that primarily comprise the City of Syracuse. Grey areas represent census tracts
that do not fall primarily within Syracuse but are located within the identified zip code. Census tract boundaries are not delineated for tracts outside of Syracuse.
ZIP CODE 13210
35
34
45
56.01
44
43.02
43.01
55
56.02
Syracuse Food Environment Report 2017 / Page 23
18% 15%
22%
30%
16%
0-14 15-24 25-44 45-64 65+
10% 10% 12%
ZIP CODE 13224
37% Black 56% White
5% Asian
2% Other
Population by race* Median household income
$51,591
18% Living in poverty
26% Children living in poverty
14% Households with no
vehicle available
Source: U. S. Census Bureau, American Community Survey, 2011-2015, 5 year estimates
*Among individuals reporting one race.
†SNAP is an abbreviation for Supplemental Nutrition Assistance Program
Population by age
Hispanic ethnicity
4%
8,628 Residents
% of population 16+years
living with a disability
% of population born outside
the United States
% of adults with less than
a high school degree
20% Households with
SNAP benefits†
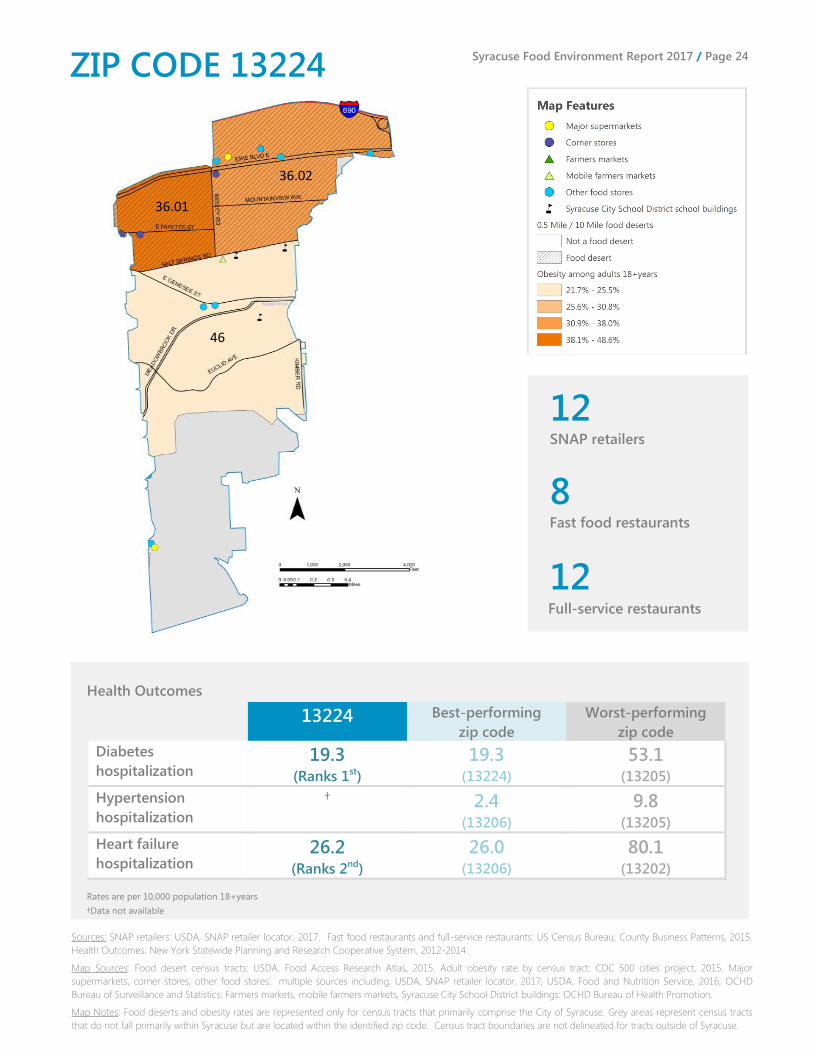
Syracuse Food Environment Report 2017 / Page 24
13224 Best-performing
zip code
Worst-performing
zip code
Diabetes
hospitalization 19.3
(Ranks 1st)
19.3 (13224)
53.1 (13205)
Hypertension
hospitalization
†
2.4
(13206)
9.8 (13205)
Heart failure
hospitalization 26.2
(Ranks 2nd)
26.0 (13206)
80.1 (13202)
12 SNAP retailers
8 Fast food restaurants
12 Full-service restaurants
Rates are per 10,000 population 18+years
†Data not available
Health Outcomes
Sources: SNAP retailers: USDA, SNAP retailer locator, 2017. Fast food restaurants and full-service restaurants: US Census Bureau, County Business Patterns, 2015.
Health Outcomes: New York Statewide Planning and Research Cooperative System, 2012-2014.
Map Sources: Food desert census tracts: USDA, Food Access Research Atlas, 2015. Adult obesity rate by census tract: CDC 500 cities project, 2015. Major
supermarkets, corner stores, other food stores: multiple sources including, USDA, SNAP retailer locator, 2017; USDA, Food and Nutrition Service, 2016; OCHD
Bureau of Surveillance and Statistics. Farmers markets, mobile farmers markets, Syracuse City School District buildings: OCHD Bureau of Health Promotion.
Map Notes: Food deserts and obesity rates are represented only for census tracts that primarily comprise the City of Syracuse. Grey areas represent census tracts
that do not fall primarily within Syracuse but are located within the identified zip code. Census tract boundaries are not delineated for tracts outside of Syracuse.
ZIP CODE 13224
36.02
36.01
46
Syracuse Food Environment Report 2017 / Page 25
Discussion
As seen above and in Appendix A, disparities exist throughout the City with respect to the food environment,
with zip codes 13202 and 13204 encompassing some of the highest risk areas in Syracuse. Known as
downtown and the near west side, these two zip codes have the poorest health outcomes and the highest rates
of poverty among children, and are among the least likely to have a household vehicle available.
Zip code 13202 includes a farmer’s market and three mobile markets, and 13204 includes three full-service
supermarkets, more than are found in some other areas of the City. However, while healthy food offerings are
available, the most vulnerable residents may be unable to regularly access these opportunities. Conversely, in
these two zip codes combined there is a corner store for every 573 residents. This is the highest rate in the City
by far. As corner stores generally offer non-perishable, processed foods, the high density of this type of food
source can have an impact on the nutritional health indicators in these areas. A survey2 conducted in October
2016 of YMCA residents (13202) found that superstores (43%), locally owned grocery stores (40%) and
drugstores (40%) were the three most common locations that respondents shopped for groceries.
Respondents were most likely to get their groceries home by walking (51%), taking the bus (40%), or riding
with another person (37%).
Another high risk area is zip code 13205, which is on the City’s south side. Here, 5 out of 7 (71%) census tracts
are considered food deserts, and 5 out of 7 census tracts have obesity rates of 31% or greater. Health
outcomes are poor, and the rate of poverty is high. While 13205 does contain three mobile markets and three
major supermarkets, two of the supermarkets are outside the City boundary and more than 30% of households
have no vehicle available. There are 17 corner stores in 13205, or one corner store for every 1,100 residents.
Zip code 13207, on the City’s south side, encompasses several diverse neighborhoods. With only one major
supermarket and no mobile farmer’s markets, this area experiences a lower density of healthy food sources per
capita compared to other parts of the City. While overall 13207 has a lower rate of poverty and higher median
household income than some other City zip codes, 71% of census tracts have obesity rates of 31% or higher,
and 57% of census tracts are considered food deserts.
In July 2016, the OCHD Healthy Neighborhood Program added several questions to the routine survey
administered to their clients, to assess access to health care, healthy foods, and opportunities for exercise and
play. Clients in census tracts 51 (13207) and 53 (13205) completed the survey. While only 2% of respondents
felt that it was difficult to get fresh and healthy foods close to where they lived, 39% cited cost and 12% cited
transportation as their biggest problems with getting groceries.
On the north side, residents in zip codes 13203 and 13208 also struggle. As home to much of the City’s
refugee population, residents in these areas are more likely to be foreign born and speak a language other
than English at home. There are high rates of children in poverty, and more than 30% of households do not
have a vehicle available. There are no major supermarkets in 13203, and only one in 13208. In 13208, there is
a corner store for every 657 residents.
2 Invest Health Downtown Food Access Survey. Developed and implemented by the Downtown Committee and other
community partners, including the OCHD in October and November, 2016.
Syracuse Food Environment Report 2017 / Page 26
The remaining zip codes, 13206, 13210 and 13224, are better positioned to address food environment
challenges. For example, nearly the entirety of zip code 13206 that falls within the City boundary is considered
a food desert. However, over 80% of households have access to a vehicle, and health outcomes for these
residents are much better compared to other zip codes.
In August 2016, a community wide survey3 was conducted to obtain feedback on health problems in
Onondaga County. Respondents in every Syracuse zip code cited obesity in adults and/or children as one of
the top five health problems in the community. Every zip code except 13202, 13204 and 13208 identified
unhealthy eating as one of the top five behaviors that impact health. Respondents were also asked to identify
the features of a healthy community, and residents of zip codes 13204, 13205, and 13210 chose access to fresh
and healthy foods as one of the top five features.
Limitations
Sources of food are constantly changing as venues move, open and close. The maps included in this report
were accurate at the time they were published, but it is likely that as time passes discrepancies will be
identified. In addition, people don’t necessarily purchase food from the location closest to their home; though
with nearly 30% of households City-wide having no vehicle available, proximity is likely a major a factor in
where food is accessed. Finally, food environments can be highly localized. By providing a zip code level
assessment, variations between different neighborhoods within a zip code could be missed. The surveys
conducted by Invest Health and the OCHD Healthy Neighborhood program were not representative of the
entire population residing in those census tracts.
Conclusion and Next Steps
This report illustrates that simply bringing healthy food opportunities to high risk areas is not sufficient to
improve health status; the barriers to accessing this food must also be addressed. The indicators reviewed in
this report show that differences in health between zip codes are impacted by social, economic, and
environmental conditions. Supporting healthy food initiatives can enhance health equity in a community. To
achieve health equity, all people must have “full and equal access to opportunities that enable them to lead
healthy lives”, which happens only when all avoidable health inequities and disparities have been eliminated4.
While much remains to be done, important work is underway to improve the food environment in underserved
areas. More information on these efforts can be found in the Onondaga County Community Health
Assessment and Improvement Plan. Future versions of this report may involve repeating the analysis at the
census tract level, and including information on the number of residents living in food deserts. Certain health
indicators may not be available at the census tract level for comparison, but demographic, economic, and food
environment data can still be analyzed. The format of the report may change to allow for improved
interactivity of the maps. Future reports could also broaden food sources to include data points on food
pantries and community gardens, in order to gain a more comprehensive view of food access points.
3 Onondaga County Community Engagement Survey. August 2016.
http://www.ongov.net/health/documents/SurveyExecutiveSummary.pdf 4 Health Equity Institute: Defining Health Equity. https://healthequity.sfsu.edu/content/defining-health-equity. Accessed
5/17/17.
Syracuse Food Environment Report 2017 / Page 27
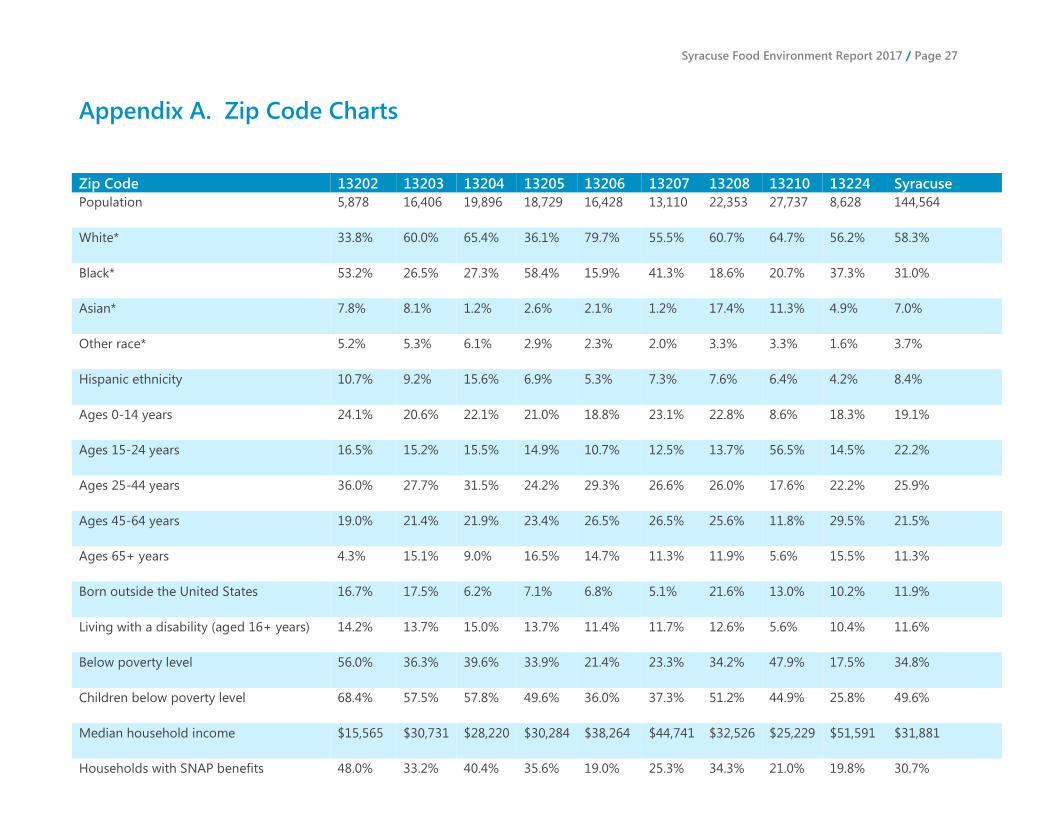
Zip Code 13202 13203 13204 13205 13206 13207 13208 13210 13224 Syracuse
Population
5,878 16,406 19,896 18,729 16,428 13,110 22,353 27,737 8,628 144,564
White*
33.8% 60.0% 65.4% 36.1% 79.7% 55.5% 60.7% 64.7% 56.2% 58.3%
Black*
53.2% 26.5% 27.3% 58.4% 15.9% 41.3% 18.6% 20.7% 37.3% 31.0%
Asian*
7.8% 8.1% 1.2% 2.6% 2.1% 1.2% 17.4% 11.3% 4.9% 7.0%
Other race*
5.2% 5.3% 6.1% 2.9% 2.3% 2.0% 3.3% 3.3% 1.6% 3.7%
Hispanic ethnicity
10.7% 9.2% 15.6% 6.9% 5.3% 7.3% 7.6% 6.4% 4.2% 8.4%
Ages 0-14 years
24.1% 20.6% 22.1% 21.0% 18.8% 23.1% 22.8% 8.6% 18.3% 19.1%
Ages 15-24 years
16.5% 15.2% 15.5% 14.9% 10.7% 12.5% 13.7% 56.5% 14.5% 22.2%
Ages 25-44 years
36.0% 27.7% 31.5% 24.2% 29.3% 26.6% 26.0% 17.6% 22.2% 25.9%
Ages 45-64 years
19.0% 21.4% 21.9% 23.4% 26.5% 26.5% 25.6% 11.8% 29.5% 21.5%
Ages 65+ years
4.3% 15.1% 9.0% 16.5% 14.7% 11.3% 11.9% 5.6% 15.5% 11.3%
Born outside the United States
16.7% 17.5% 6.2% 7.1% 6.8% 5.1% 21.6% 13.0% 10.2% 11.9%
Living with a disability (aged 16+ years)
14.2% 13.7% 15.0% 13.7% 11.4% 11.7% 12.6% 5.6% 10.4% 11.6%
Below poverty level
56.0% 36.3% 39.6% 33.9% 21.4% 23.3% 34.2% 47.9% 17.5% 34.8%
Children below poverty level
68.4% 57.5% 57.8% 49.6% 36.0% 37.3% 51.2% 44.9% 25.8% 49.6%
Median household income
$15,565 $30,731 $28,220 $30,284 $38,264 $44,741 $32,526 $25,229 $51,591 $31,881
Households with SNAP benefits
48.0% 33.2% 40.4% 35.6% 19.0% 25.3% 34.3% 21.0% 19.8% 30.7%
Appendix A. Zip Code Charts

Syracuse Food Environment Report 2017 / Page 28
Source: U. S. Census Bureau, American Community Survey, 2011-2015, 5 year estimates
*Among individuals reporting one race
Zip Code 13202 13203 13204 13205 13206 13207 13208 13210 13224 Syracuse
SNAP retailers
14 16 43 31 26 11 64 18 12 †
Fast food restaurants
22
5 21 10 28 5 15 26 8 †
Full-service restaurants
38
9 22 0 13 1 15 21 12 †
Diabetes Hospitalization*
48.9 36.4 51.1 53.1 21.9 38.3 33.7 40.3 19.3 †
Hypertension Hospitalization*
† 7.2 8.7 9.8 2.4 6.6 5.1 8.2 † †
Heart Failure Hospitalization* 80.1 43.9 70.9 63.8 26.0 45.2 38.6 45.5 26.2 †
Source: New York Statewide Planning and Research Cooperative System, 2012-2014 *Rate per 10,000 population 18+years
†Data are not available for that geography
Zip Code 13202 13203 13204 13205 13206 13207 13208 13210 13224 Syracuse
% of census tracts* defined as food
deserts
50.0% 42.9% 22.2% 71.4% 100.0% 57.1% 28.6% 55.6% 66.7% 50.9%
% of census tracts* with obesity rates of
31% or higher
50.0% 71.4% 66.7% 71.4% 0.0% 71.4% 57.1% 11.1% 66.7% 52.7%
*Census tracts were counted if the majority of the tract fell within the specified zip code
Source: CDC 500 Cities Project, 2015
Households with no vehicle available
49.9% 36.5% 34.2% 31.6% 17.7% 16.7% 30.9% 26.3% 13.6% 28.8%
Adults with less than high school degree
26.7% 23.3% 26.2% 23.2% 13.5% 13.3% 26.1% 5.4% 11.5% 17.8%