MINISTRY OF TOURISM DEPARTMENT OF TOURISM
GOVERNMENT OF INDIA
MANPOWER REQUIREMENT IN HOTEL INDUSTRY, TOUR OPERATORS & TRAVEL SECTOR
MANPOWER TRAINED BY DIFFERENT INSTITUTES & PLACEMENT SCENARIO
A MARKET PULSE Report February 05, 2004
Market Pulse: H-20, 1st Floor, Green Park Extension, New Delhi 110 016
Ph: 2618 7043/45, 2616 5305/10 Fax: 2618 9486, E-mail: [email protected]
TABLE OF CONTENTS Chapters Page Nos.
BACKGROUND 1
TERMS OF REFERENCE 2
1.0 PROJECT METHODOLOGY 03-06
2.1 TOURISM IN INDIA : A SNAPSHOT 07-9
3.0 HOTELS IN INDIA 10-18
4.0 EMPLOYMENT IN HOTELS 19-26
5.0 PROFILE OF HOTEL EMPLOYEES 27-34
6.0 RESTAURANTS IN INDIA 35-41
7.0 EMPLOYMENT IN RESTAURANTS 42-54
8.0 PROFILE OF RESTAURANT EMPLOYEES 55-59
9.0 PROJECTED DEMAND FOR TRAINED MANPOWER 60-68
10.0
11.0
TRAVEL & TOUR OPERATORS
HOTEL MANAGEMENT INSTITUTES
69-73
74-77
12.0 TRAVEL & TOUR INSTITUTES
APPENDIX 1
APPENDIX 2
APPENDIX 3
78-82
EXECUTIVE SUMMARY
Recent tourism statistics reveal that both domestic and foreign tourism are on a
robust growth path. This growth will need to be serviced by a substantial increase in
infrastructure, including air-road, rail connectivity as well as hotels and restaurants.
In this context, Department of Tourism (MR Division), Ministry of Tourism &
Culture, Government of India, commissioned our firm– Market Pulse, to assess the
manpower requirement in the hotels and restaurants sector as well as tour & travel
operation.
This study is based on an extensive primary field survey in 27 important tourist
destinations. More than 900 questionnaire-based face-to-face interviews with
personnel in hotels, restaurants, tour & travel operators, hotel and travel/ tourism
management institutes, tourism offices and municipalities have been carried out by
our field research team.
In addition, physical scanning of cities and sections of highways has been done to
estimate the number of hotels, motels and restaurants in the unorganized sector
(refers to small businesses that are not members of any trade body). Analysis of
secondary data from municipal corporations, trade directories, hotel and restaurant
associations has also been used in this estimation.
Some of the key findings of this study are mentioned subsequently.
Hotels in India
There are an estimated 1.2 million hotel rooms in the country. However, the star
category hotels account for a mere 7% (approximately 80000 rooms).
Our forecast is that there will be a total of 2.9 million and 6.6 million hotel rooms
in 2010 and 2020 respectively.
The larger four & five star hotels (along with the heritage hotels) employ on an
average 162 people per 100 rooms, compared to 122 in the One, Two & Three
Star Hotels and 58 in the unorganized sector.

There are almost 750,000 people working in hotels across India. In addition, there
are more than 1 lakh employees working in motels on state & national highways.
Employment is forecast to increase to 3.5 million by the year 2020.
A bulk of the employees (approximately 60%) are working in F&B service,
Kitchen and housekeeping.
Almost 80% of the employees in key hotel functions such as F&B, front office
and housekeeping are young; they are less than 40 years old.
Most employees in the management/supervisory cadres in the front office, F&B
service, kitchen and housekeeping function of the larger four & five star hotels
have a formal hotel management qualification.
Almost half the managers and supervisors of the one – three star hotels have
either a hotel management degree/diploma or a Food Crafts Institute Certificate.
Hotels in the unorganized sector employ largely untrained manpower.
Restaurants in India
Our estimate is that there are at least 140,000 restaurants in urban India.
Delhi and Mumbai account for nearly 15% of these restaurants.
Conventional restaurants account for the largest population (30%), followed by
sweet shops (16%), fast food outlets (16%) and dhabas (13%).
While the number of conventional restaurants ranges between 10-20 numbers per
lakh of population, the total number of eating places could be as high as 86 per
lakh of population (as in the North).
The total number of restaurants could touch 200,000 in year 2010 and 240,000 in
year 2020.
There are almost 1.85 million people working in restaurants across India.
Employment is forecast to increase to 2.73 million by the year 2020.
In addition, there are more than 1.3 million people employed in small restaurants
and dhabas on the state and national highways.
Almost 70% of the employees in key functions of F& B service and kitchen are
less than 30 years old.
Almost 20% of those employed in F & B of conventional restaurants, cafes and
fast food outlets are diploma holders either from private hotel management
institutions or Food Craft Institutes. Dhabas, largely, employ untrained manpower.
Travel Trade Business in India There are approximately 6000 travel trade companies/ firms in the country.
The population of these agencies could be growing at 7.5 - 10% annually.
On an average, each of these travel trade agencies employ 14 – 15 people.
This sector employs almost 83,500 people. Of them, a significant proportion are
in functions such as ticketing, tour operations and accounts/ administration. Our
forecast is that the employment in this sector will touch 242,000 by year 2020.
Almost 44% of the employees in ticketing have a formal IATA/ UTA certificate
or a diploma in travel & tour management; 17% of those in administration also
have a formal education in travel & tour management. Overall, 17.5% of the
employees have formal training in tour and travel management.
Annual Demand for Trained Manpower: A Forecast
The annual demand for trained manpower in hotels and restaurants is likely to
touch 29,000 by the year 2010; this is likely to increase to approximately 39,000 by
the year 2020.
The demand for trained manpower in hotels and restaurants is likely to be
boosted by aggressive expansion of fast food restaurants/ cafe, an increase in 1 –
3 star budget hotels, golden quadrilateral of national highways as well as the
preference for youth in this sector.
The annual demand for trained manpower in the travel and tour sector is likely to
be 1275 and 2075 in 2010 and 2020, respectively.

Training Institutes in Hotel Management/ Food Craft There are approximately 175 training institutes engaged in hotel management and
food craft; 50 of them are government sponsored/ owned. Of the 125 private
institutes, only 47 are registered with AICTE.
A total of 18000 students are graduating with a degree/ diploma in hotel
management or food craft. Of them, only 20% are obtaining training in
government sponsored institutes.
Only 3800 students (21%) are completing diploma/ certificate courses; a majority
of them are completing 3-year degree courses.
These institutes claim 100% placement for the graduating class. However, 35 –
40% of the graduates are joining other emerging sectors such as call centers
because of the following reasons:
• Better salaries in alternative careers
• Poor perceived image of work in hotels
• Reluctance to take up job in the service function of hotels & restaurants
In this scenario, there is likely to be a shortage of trained manpower in this sector. Training Institutes in Travel & Tourism Management There are 172 training institutes engaged in travel and tour management
education; only 11 of them are government sponsored institutes, 78 are affiliated
to universities while the balance are privately owned ones.
Approximately, 17,500 students are completing IATA/ UFTA certified diploma
courses, graduate and post-graduate degree courses.
Strategic Recommendations The present and new hotel management institutes have to train a substantially
larger number of students to cater to the increasing demand in hotels and
restaurants.
In our opinion, the student throughput of diploma and certificate courses needs
to be increased substantially; this could be done by altering the mix of students in
favour of the short-term courses.
Since trained manpower is scarce in the smaller hotels, a training module in the
form of audio and video CDs can be explored.
The existing training infrastructure for the travel and tour sector appears to be
adequate.
A joint sector campaign has to be undertaken to generate pride in a hotel
management career. This will help attract and retain trained manpower in this
sector.
KEY RESEARCH FINDINGS
HOTELS IN INDIA: Present Infrastructure There is an estimated 1.2 million hotel rooms in the country. However, the star
category hotels account for a mere 7% (approximately 80000 rooms); most of the
rooms are contributed by budget hotels, guesthouses and inns, that cater primarily to
domestic tourism.
The metropolitan cities of Delhi, Mumbai, Chennai, Hyderabad and Kolkata, along
with Goa account for 62% of the rooms in the five & four star category. The other
smaller hotels are more geographically dispersed; this results from a strong
correlation between hotels in the unorganized sector and domestic tourism statistics.
Places of pilgrimage such as Tirupati and Haridwar have significantly lower
availability of rooms – 28 & 150 rooms per lakh of tourists, respectively.
Our forecast is that there will be a total of 2.5 million and 5.8 million hotel rooms in
2010 and 2020 respectively. This assumes that the infrastructure growth will keep
pace with the anticipated growth in tourism. The other assumption is that the mix of
hotels will remain the same; however, this might change in favour of the organized
sector, if government initiatives take shape. Geographical spread might also change
in favour of North-eastern states, J&K, West Bengal, Andhra Pradesh, Madhya
Pradesh & Uttar Pradesh.

HOTELS IN INDIA: Employment Pattern & Forecast Employment intensity increases with the size of hotel. The larger Four & Five star
hotels (along with the heritage hotels) employ on an average 174 people per 100
rooms, compared to 122 in the One, Two & Three Star Hotels and 58 in the
unorganized sector.
Employment
Intensity (Employees per
100 rooms)
Total Employment
2002
Total Employment
2010
Total Employment
2020
5/4 star Hotels 174 57,000 83,000 1,10,400
1-3 star Hotels 122 52,500 63,000 83,000
Smaller hotels 58 638,000 14,05,000 32,61,500
Total NA 7,47,500 15,51,000 34,54,900
In addition, there are more than one lakh employees working in motels on state and
national highways.
A bulk of the employees approximately 60% are working in F&B service, Kitchen
and housekeeping. Front offices of the larger hotels account for nearly 7% of the
employees.
Hotel Employee Profile Five/Four Star Hotels: Most employees in the management/supervisory cadres in
the front office, F&B service and housekeeping have hotel management
backgrounds. Almost 90% of the chefs are having a hotel management
degree/diploma or a certificate from a Food Crafts Institute.
Three, Two & One Star Hotels: Almost half the managers and supervisors have
either a hotel management degree/diploma or a Food Crafts Institute Certificate. A
majority of those at junior levels are just graduates or even SSC pass.
Unorganized Sector: Only a few of the managers have a hotel management
degree/diploma. Most of the employees consist of untrained manpower.
Almost 80% of the employees in key hotel functions such as F&B, front office and
housekeeping are young; they are less than 40 years old. In the smaller hotels, more
than 50% are less than 30 years old.

RESTAURANTS IN INDIA: Infrastructure The burgeoning middle class and evolving lifestyle is driving the demand for quality
restaurants – both conventional ones as well as fast food outlets and cafes. Our
estimate is that there are at least 140,000 restaurants in urban India. Delhi and
Mumbai account for nearly 15% of the restaurants. Conventional restaurants account
for the largest population (30%), followed by sweet shops (16%), fast food outlets
(16%) and dhabas (13%). Northern region already has over 10000 fast food outlets
serving Chinese, Western and Indian food.
While the number of conventional restaurants ranges between 10-20 numbers per
lakh of population, the total number of eating places could be as high as 80 per lakh
of population (as in the North).
Employment Pattern & Forecast: The total number of restaurants could touch
200,000 in year 2010 and 240,000 in year 2020. The mix is likely to remain largely the
same; however, fast food outlets and cafes in the organized sector are likely to grow
much faster than the others if one goes by the stated expansion plan of large chains.
Employment Intens y it
(Employees per 100 chairs)
Total Employment
2002
Total Employment
2010
Total Employment
2020
Conventional
Restaurants
26 926000 1226000 1436000
Cafes/Coffee/ Tea Vendors
31 270000 406700 504500
Fast food Outlets 32 284000 401600 487800
Dhabas/Bhojanalays 26 179000 253900 306300
Total NA 1659000 2288200 2734600

In addition, there are more than 1.3 million people employed in small restaurants and
dhabas on the state and national highways. By 2020, even a 10% share for the
organized sector will generate nearly 130,000 jobs for trained manpower.
More than half the employees are in key functions of F& B service and kitchen and
are less than 30 years old.
Almost 60% of these employed in kitchens of conventional restaurants, cafes and fast
food outlets are diploma holders either from private hotel management institutions or
Food Craft Institutes. Only 20% of people in F&B Service are hotel management
degree/diploma holders. Restaurants, employ largely untrained manpower.

PROJECTED ANNUAL DEMAND FOR TRAINED MANPOWER Year 2010 Year 2020
Hotels 7000 10000
Restaurants 45000 45000
Total 52000 55,000
Key drivers of demand for trained manpower are likely to be the expansion of the
organized sector, golden quadrilateral and preference for youth in the hospitality
sector.
Presently, 16850 students are being trained in hotel management, annually. Only 22%
are graduating from the Government promoted institutes. Nearly 40% of them are
pursuing alternative careers in other emerging service sectors (such as call centres).
These statistics indicate that there could be a severe shortage for trained manpower
by the year 2010.
PROJECT TEAM Chief Technical Advisor: Ejaz Hoda (38 years) A graduate of IIT, Delhi and a post-graduate from IIM, Bangalore, has over 15 years
of experience in the area of market research. Brings to the team a marketing focus as
well as experience of diverse products and services. Specializes in consumer research,
statistics and market entry strategy.
Has pioneered the use of databases in marketing, spearheads the research and
development of new research methodologies and techniques such as
mpEVOLUTION & intelliPROBE, has co-authored iConsumer, a comprehensive
research publication on Indian consumer markets and MACCESS 2002 – a unique
report on Indian Men’s Accessories.
Has been the chief research advisor on important assignments for multinational
corporations such as Frito Lay (a PepsiCo), Hyundai Motor, Nestle India, Pillsbury
India and Spice Telecom.
Has also been on the Young Business Committee of Confederation of Indian
Industry (CII).
Chief of Project: Makarand Chaurey (40 years) A graduate of IIT, Kanpur and a post-graduate from IIM, Ahmedabad, has over 10
years of experience in the areas of industrial research, project appraisals and financial
services. Has established cutting edge quality systems and specializes in demand
forecasting and advanced statistical analysis for the industrial & automotive sectors.
Has co-authored iConsumer, a comprehensive research publication on Indian
consumer markets and worked on important assignments for Honda Cars, DCM
group and PVR.

Head of Data Processing & Analysis: Dominic Sebastian (33 years):
Heads the data processing team and specializes in computer-aided statistical analysis.
Has 8 years of hands-on experience with specialized software (SPSS, XLSTAT &
STATS) that enables statistical analyses such as correspondence analysis, multiple
discriminant analysis, significant testing and database management. He is assisted by a
team of 5 data processing executives.
Program Coordinator: Akhtar Siddiqui (28 years)
Heads the field function and is responsible for field briefing, accurate implementation
of sampling plans and quality control in relation to field research. Has played a key
role in mapping different cities and rural areas in terms of consumer demographics,
on an al-India basis. He is assisted by a team of 12 field officers and research
associates.
Research Executives/Associates: Qammar Naseem Ahmad, Prabhat
Kumar, Deepak Raj, Kaushal Kishore and Rajendra Prasad
Have been instrumental in collection of all primary data as well as compilation of
secondary data.

BACKGROUND
India offers diverse opportunities for tourism, be it for leisure or business. Over 2.5
million foreign tourists (including NRI’s & PIO’s) visit India every year. By
comparison, domestic tourism is significantly greater. Statistics reveal that we are
likely to witness a sharp increase in both domestic and international tourist traffic.
The rapid increase in tourism is being fuelled by a wide range of contributory factors
as outlined in the table below.
Tourism Segment Growth Drivers
Domestic tourism Rapidly increasing purchasing power of the middle class.
Better road connectivity
Evolving lifestyle
International tourism Development of internationally acclaimed destinations
such as Kerala & Rajasthan
Favourable perception of Brand India
Attractive market that motivates foreign business
travelers
The growth in tourism will have to be serviced by a substantial increase in
infrastructure, including air-road-rail connectivity, hotels and restaurants.
It is in this context that Department of Tourism, Ministry of Tourism & Culture,
Government of India, has decided to undertake a study to assess the manpower
requirement in the hotel and restaurant sector as well as the tour and travel operation
business.
Our firm Market Pulse has been commissioned to conduct this study. This document
presents the findings of the study.
1
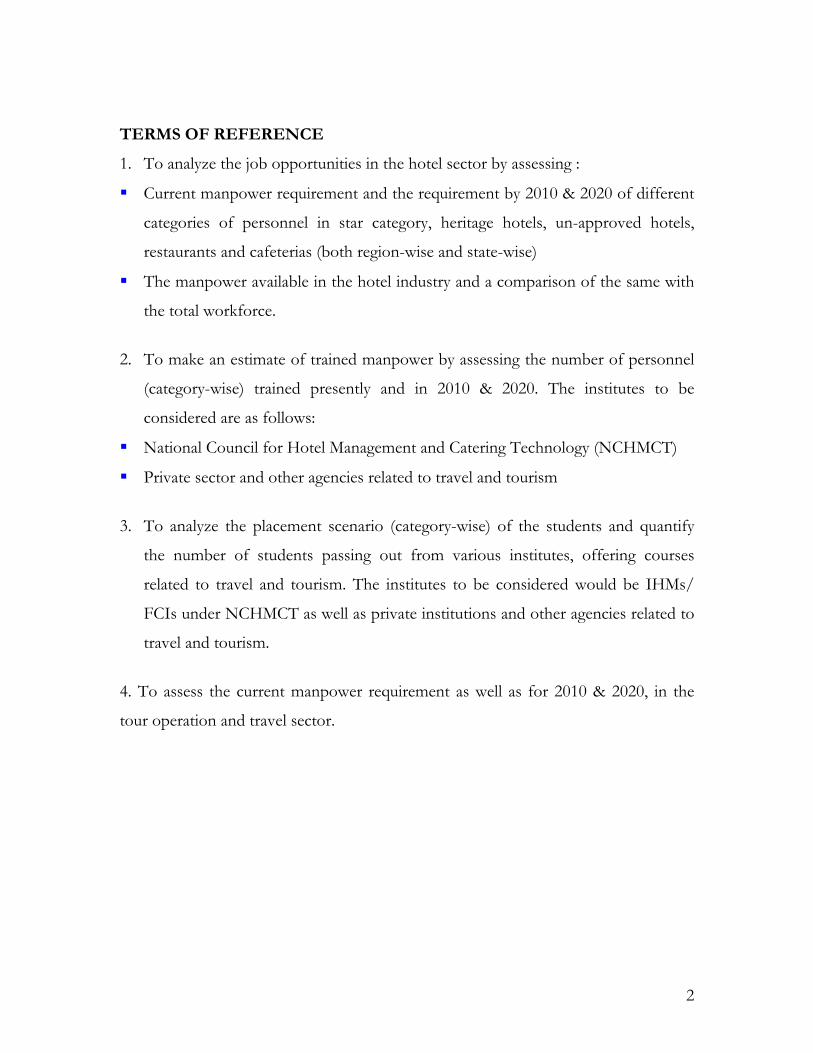
TERMS OF REFERENCE
1. To analyze the job opportunities in the hotel sector by assessing :
Current manpower requirement and the requirement by 2010 & 2020 of different
categories of personnel in star category, heritage hotels, un-approved hotels,
restaurants and cafeterias (both region-wise and state-wise)
The manpower available in the hotel industry and a comparison of the same with
the total workforce.
2. To make an estimate of trained manpower by assessing the number of personnel
(category-wise) trained presently and in 2010 & 2020. The institutes to be
considered are as follows:
National Council for Hotel Management and Catering Technology (NCHMCT)
Private sector and other agencies related to travel and tourism
3. To analyze the placement scenario (category-wise) of the students and quantify
the number of students passing out from various institutes, offering courses
related to travel and tourism. The institutes to be considered would be IHMs/
FCIs under NCHMCT as well as private institutions and other agencies related to
travel and tourism.
4. To assess the current manpower requirement as well as for 2010 & 2020, in the
tour operation and travel sector.
2

CHAPTER 1
PROJECT METHODOLOGY
3
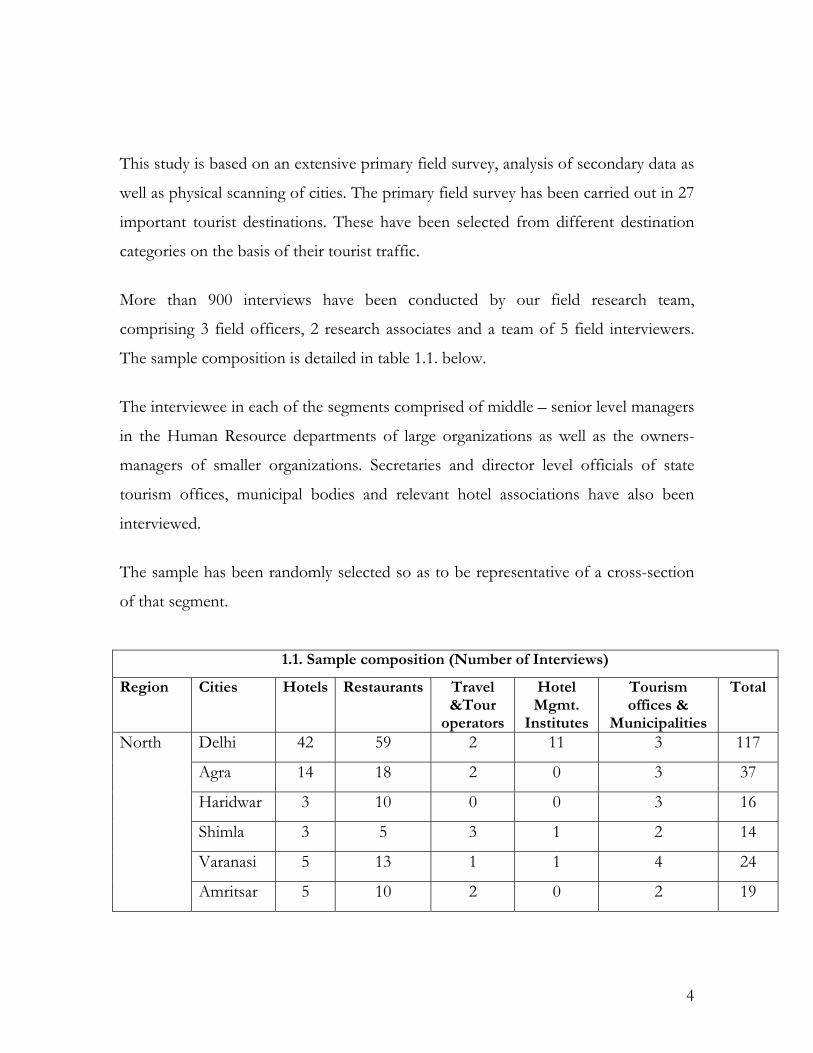
This study is based on an extensive primary field survey, analysis of secondary data as
well as physical scanning of cities. The primary field survey has been carried out in 27
important tourist destinations. These have been selected from different destination
categories on the basis of their tourist traffic.
More than 900 interviews have been conducted by our field research team,
comprising 3 field officers, 2 research associates and a team of 5 field interviewers.
The sample composition is detailed in table 1.1. below.
The interviewee in each of the segments comprised of middle – senior level managers
in the Human Resource departments of large organizations as well as the owners-
managers of smaller organizations. Secretaries and director level officials of state
tourism offices, municipal bodies and relevant hotel associations have also been
interviewed.
The sample has been randomly selected so as to be representative of a cross-section
of that segment.
1.1. Sample composition (Number of Interviews)
Region Cities Hotels Restaurants Travel &Tour
operators
Hotel Mgmt.
Institutes
Tourism offices &
Municipalities
Total
Delhi 42 59 2 11 3 117
Agra 14 18 2 0 3 37
Haridwar 3 10 0 0 3 16
Shimla 3 5 3 1 2 14
Varanasi 5 13 1 1 4 24
North
Amritsar 5 10 2 0 2 19
4

Region Cities Hotels Restaurants Travel
&Tour operators
Hotel Mgmt.
Institutes
Tourism offices &
Municipalities
Total
Trivandrum 11 21 2 1 4 39
Cochin 6 15 2 1 4 28
Ooty 6 14 1 1 0 22
Mysore 3 4 1 1 2 11
Bangalore 8 7 3 3 8 29
Chennai 8 6 1 3 4 22
Tirupati 2 5 2 0 1 10
South
Hyderabad 2 11 2 3 8 26
Kokata 17 33 4 2 7 63
Bhubanesh
war
8 11 2 1 6 28
East
Puri 3 1 1 0 2 7
Guwahati 5 12 1 1 9 28 North
East Shillong 3 9 0 0 2 14
Mumbai 31 77 7 11 7 133
Ahmedabad 10 24 2 2 6 44
Pune 9 20 3 3 3 38
Aurangabad 8 9 1 0 4 22
Goa 15 36 4 2 5 62
Udaipur 10 4 2 1 3 20
Jaipur 7 6 1 2 11 27
West &
Central
Khajuraho 5 6 1 0 2 14
All
India
249 446 53 51 115 914
5

Project Coverage
Hotels All star category & heritage hotels
Others registered with municipal bodies or hotel associations.
Various small hotels/ guest houses/ inns scattered in residential
areas or located in pockets near the railway station, inter-state bus
depots, etc.
Restaurants All conventional restaurants (AC /non AC) registered with
municipal bodies or listed in telephone/trade directories
Fast Food chains
Dhabas/hawkers/ juice corners
Cafeterias, etc.
Travel & Tour
Operators
Organized sector players registered with TAAI
Other small and medium sized travel agencies
Ticketing agents
Hotel
Management
and Travel &
Tour Institutes
Those registered with NCHMCT
Private sector institutes
The states of Jammu & Kashmir and Bihar have not been directly covered in addition
to some union territories such as Andaman & Nicobar, Pondicherry and
Lakshwadeep.
The states covered by our research account for 88% and 94% of domestic and
foreign tourist visits, respectively. Hence, for purposes of estimating national statistics
these contribution ratios have been used.
6

Information Areas
Structured questionnaires (refer Appendix 1) were developed for each of the
segments under study. The information areas addressed by the questionnaires are
briefly mentioned subsequently.
Hotel/ Restaurants/ Travel & Tour Operators
Employment pattern across functions
Age profile of employees
Business particulars
Proportion of temporary employees across functions
Institutes of Hotel Management (both private and NCHMCT)
Batch size, i.e number of students graduating annually
Courses/ Subjects offered
Tenure of the course
Interviews with the officials of municipal bodies and hotel associations were used to
estimate the number of hotels and restaurants in each of the cities under study.
Additionally, comprehensive physical scanning of each of the destinations under
study was carried out to estimate the proportion of hotels (guest houses, inns and
small hotels) and restaurants (including dhabas) in the unorganized sector.
A study of the local telephone and trade directories as well as registered Internet
websites was also used to estimate the number of travel and tour operators as well as
private institutes of hotel management and travel management institutes.
7
CHAPTER 2
TOURISM IN INDIA : A SNAPSHOT
8

Attractiveness of diverse destinations and increased levels of marketing are
transforming India into a thriving tourist centre of the world. Although, India’s shape
of world tourist arrivals is a mere 0.37%, recent statistics indicate a robust growth of
more than 15%.
In addition, growth in the disposable income of more than 200 million people
belonging to the middle class is changing the profile of domestic tourism. Statistics
from Ministry of Tourism and Culture reveal that domestic tourist visits have
increased from 191 million in 1999 to an estimated 272 million in 2002. This
represents a compounded annual growth rate of 17%.
Domestic tourism in both North and North-Eastern regions have registered high
growth rates (20% and 63% CAGR, respectively). While Southern India experienced
a 6% growth, West/ Central and Eastern regions experienced a marginal decline.
The growth rates point towards relative needs for infrastructure development in these
regions.
2.1 Geographic Contribution of Domestic Tourism
39%41%
6% 13%
1%
North South East West & Central North East
2.2 Geographic Contribution of Foreign Tourism
34%23%
8%
35%0%
North South East West & Central North East
9
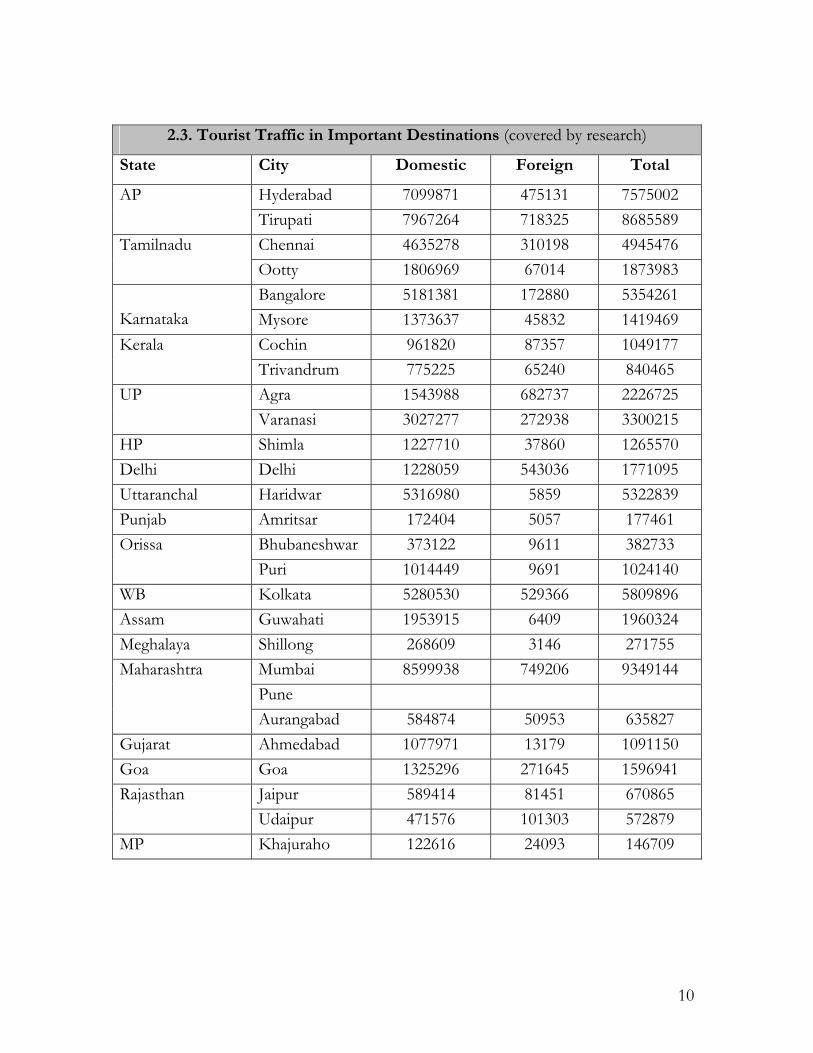
2.3. Tourist Traffic in Important Destinations (covered by research)
State City Domestic Foreign Total
Hyderabad 7099871 475131 7575002 AP Tirupati 7967264 718325 8685589 Chennai 4635278 310198 4945476 Tamilnadu Ootty 1806969 67014 1873983 Bangalore 5181381 172880 5354261
Karnataka Mysore 1373637 45832 1419469 Cochin 961820 87357 1049177 Kerala Trivandrum 775225 65240 840465 Agra 1543988 682737 2226725 UP Varanasi 3027277 272938 3300215
HP Shimla 1227710 37860 1265570 Delhi Delhi 1228059 543036 1771095 Uttaranchal Haridwar 5316980 5859 5322839 Punjab Amritsar 172404 5057 177461
Bhubaneshwar 373122 9611 382733 Orissa Puri 1014449 9691 1024140
WB Kolkata 5280530 529366 5809896 Assam Guwahati 1953915 6409 1960324 Meghalaya Shillong 268609 3146 271755
Mumbai 8599938 749206 9349144 Pune
Maharashtra
Aurangabad 584874 50953 635827 Gujarat Ahmedabad 1077971 13179 1091150 Goa Goa 1325296 271645 1596941
Jaipur 589414 81451 670865 Rajasthan Udaipur 471576 101303 572879
MP Khajuraho 122616 24093 146709
10
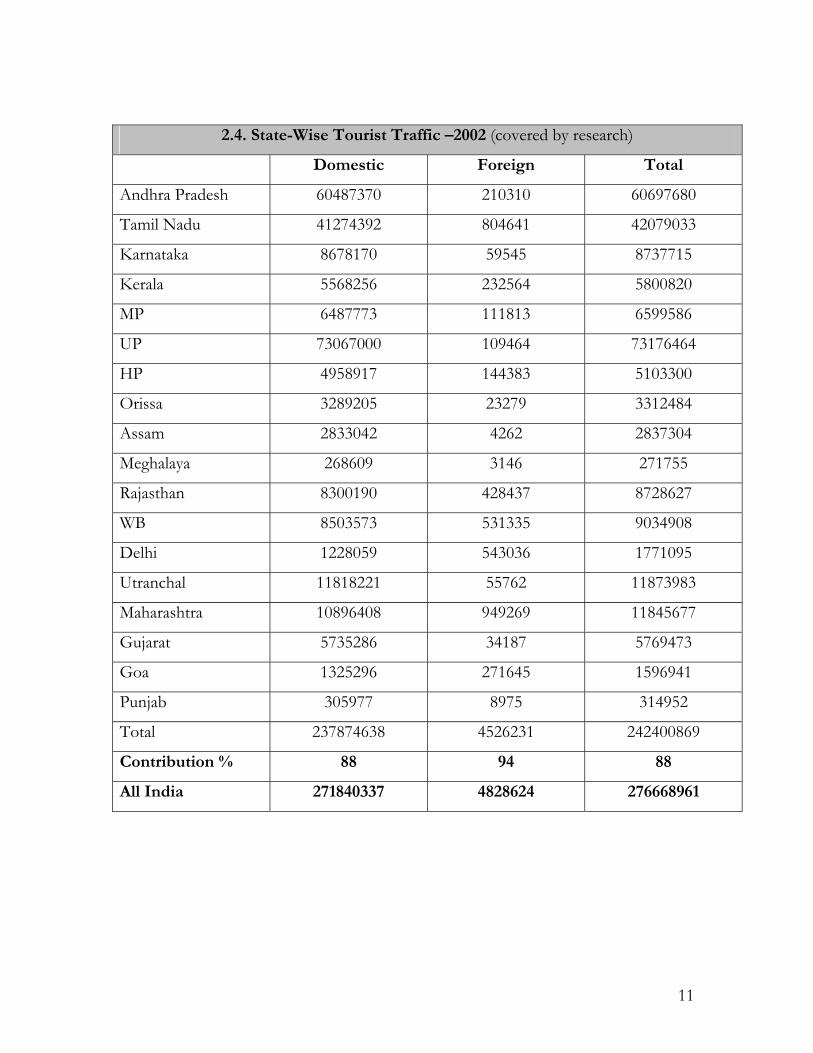
2.4. State-Wise Tourist Traffic –2002 (covered by research)
Domestic Foreign Total
Andhra Pradesh 60487370 210310 60697680
Tamil Nadu 41274392 804641 42079033
Karnataka 8678170 59545 8737715
Kerala 5568256 232564 5800820
MP 6487773 111813 6599586
UP 73067000 109464 73176464
HP 4958917 144383 5103300
Orissa 3289205 23279 3312484
Assam 2833042 4262 2837304
Meghalaya 268609 3146 271755
Rajasthan 8300190 428437 8728627
WB 8503573 531335 9034908
Delhi 1228059 543036 1771095
Utranchal 11818221 55762 11873983
Maharashtra 10896408 949269 11845677
Gujarat 5735286 34187 5769473
Goa 1325296 271645 1596941
Punjab 305977 8975 314952
Total 237874638 4526231 242400869
Contribution % 88 94 88
All India 271840337 4828624 276668961
11

CHAPTER 3
HOTELS IN INDIA
12

One of the pillars of tourism infrastructure is made up of the places of lodging.
Given the disparate socio-economic profile of domestic tourists, hotels exist in both
the organized and the unorganized sector. In addition to the star category hotels,
there are smaller hotels, guesthouses and inns that cater largely to domestic tourists.
The pilgrimage destinations also have a large number of dharmashalas to support the
seasonal increase in the number of tourists.
In this study, we have carried out the required analyses for the following 3 segments:
5star, 4 star and heritage hotels
Three, two & one star hotels
Small budget hotels, guesthouses & inns in the unorganized sector.
3.1. A Hotel Map
There is an estimated 1171000 hotel rooms in the country in both the organized and
unorganized sectors combined. The star category and heritage hotels account for 7%
of the hotel rooms; the balance is contributed by other places of lodging such as
budget hotels, guesthouses and inns.
13

3.1 % Contribution of Hotel Segments to Total Rooms
3%
4%
93%
5star/4star/Heritage Hotels 1-3 star Hotels Others
3.1.1. Five & Four Star/ Heritage Hotels
These hotels have a total of almost 36000 rooms. The metropolitan cities of Delhi
(21%), Mumbai (17%), Chennai (7%), Hyderabad (5%) and Kolkata (5%) account for
55% of the rooms in this category. Goa accounts for 7% of the rooms.
3.1.2. Three, Two & One Star Hotels
These hotels have 43000 rooms and are more extensively spread than their larger
counterparts. They are not concentrated in the metropolitan cities. Both Mumbai and
Goa have a significantly higher presence of these hotels; they together account for
5939 rooms (14%).
The states of Andhra Pradesh (5045 rooms), Tamil Nadu (6213 rooms) and
Maharashtra (6588 rooms) together account for almost 42% of the rooms in this
category.
14

3.1.3. Other Hotels in the Unorganized Sector
These hotels are also well spread throughout India; their presence is correlated with
the number of domestic tourists visiting different tourist destinations. The 3 states of
U.P, Rajasthan and Tamil Nadu account for almost 45% of the total availability in the
country.
3.2. State-wise Rooms Availability 2002
State Total rooms
5 & 4 Star Hotel rooms
1, 2 & 3 Star Hotel
rooms
Other Hotels
Andhra Pradesh 58362 2007 5045 51310
Tamilnadu 89293 2431 6213 80649
Karnataka 71897 1875 1967 68055
Kerala 44049 1464 3694 38891
MP 39181 547 922 37712
UP 295436 2504 1739 291193
HP 53236 262 372 52602
Orissa 46683 389 703 45591
Assam 10900 160 414 10326
Meghalaya 2115 50 115 1950
Rajasthan 128823 3351 2798 122674
WB 17278 1797 1428 14053
Delhi 27272 7677 1507 18088
Uttaranchal 17846 323 1013 16510
Maharashtra 51893 7561 6588 37744
Gujarat 60468 712 1629 58127
Goa 11924 1819 1099 8952
Punjab 8975 499 1508 6968
All India 1171121 35574 42991 1092556
15

3.2. Total Rooms Availability per Lakh Tourists
Places of pilgrimage such as Tirupati and Haridwar have significantly lower
availability of rooms – 28 and 150 rooms per lakh of tourists, respectively. Even
Agra’s availability of rooms is substantially lower (175) than the national average.
However, this could be attributed to the fact that a large number of Agra tourists stay
in Delhi.
By comparison, states such as Delhi, Karnataka, Himachal Pradesh, Orissa, Rajasthan
and Gujarat have substantially higher availability of rooms for tourists.
3.3. State-wise Availability of Rooms
State City Total Rooms Rooms per lakh Tourists
58362 96
Hyderabad 13183 174
Andhra
Pradesh
Tirupati 2452 28
89293 351
Chennai 17577 355
Tamilnadu
Ooty 6334 338
71897 823
Bangalore 51507 962
Karnataka
Mysore 4230 298
44049 759
Cochin 5861 559
Kerala
Trivandrum 8488 1010
39181 594 M.P
Khajuraho 871 594
16

State City Total Rooms Rooms per lakh
Tourists 295436 404
Agra 3891 175
U.P
Varanasi 18423 558 53236 1043 H.P
Shimla 13202 1043 46683 1409
Bhubaneshwar 3467 906 Orissa
Puri 16360 1597 10900 556 Assam
Guwahati 10900 556 2115 778 Meghalaya
Shillong 2115 778 128823 1476
Jaipur 12874 1919 Rajasthan
Udaipur 5482 957 17278 184 W.B
Kolkata 10709 184 Delhi 27272 1540
17846 150 Uttaranchal
Haridwar 8000 150 51893 438
Mumbai 28682 307 Pune 2935 NA
Maharashtra
Aurangabad 15060 2369 60468 1048 Gujarat
Ahmedabad 11436 1048 Goa Goa 11924 747
8975 2850 Punjab
Amritsar 5057 2850 All India 1171121 423
17

3.3. Growth in Tourist Traffic
2003-10 (Projected Growth)
20.0
10.0
5.0
5.0
5.0
10.0
5.0
5.0
5.0
10.0
5.0
10.0
5.0
5.0
5.0
5.0
5.0
20.0
Punjab
Goa
Gujarat
Maharashtra
Uttaranchal
Uttar Pradesh
Delhi
West Bengal
Rajasthan
Meghalaya
Assam
Orissa
Himachal Pradesh
Madhya Pradesh
Kerala
Karnataka
Tamilnadu
Andhra Pradesh
1999-2002
408.0
12.7
6.4
-18.5
4.5
14.7
4.7
6.8
6.4
24.2-14.1
16.3
10.0
11.4-20.7
8.7
9.7
18.9
Growth statistics pertaining to tourist traffic are based on statistics of Ministry of
Tourism. For the period 2003-10, we have assumed that growth in tourist traffic will
follow more or less the same trend as in the past. Thus, some (north-eastern state are
likely to experience very quick annual growth of approximately 20%, others like
Delhi, U.P, Tamul Nadu and Karnataka, where growth has already slowed down, will
experience a 5% growth annually. Still others like W.B, A.P and M.P are likely to
grow at 10% annually, since they have displayed robust statistics in the recent past.
18
3.4. Rooms Availability: A Forecast (2010 – 2020)
In order to arrive at an estimate of hotel rooms in different states, the following bases
have been assumed.
The growth in star category hotels will follow the same trend as in the last 4 years.
This trend has been obtained from the projects approved by the Ministry of
Tourism in the last 4 years. If growth rate in tourism accelerates, this estimate can
be treated as a conservative estimate.
The growth in hotels in the unorganized sector will depend on the growth in
tourism (domestic and foreign combined).
The other assumption is that the 18 important states covered in the primary
research will continue to represent 88% of hotel rooms in the unorganized sector.
In 2010, there will be a total of 2.9 million hotel rooms, more than twice the numbers
in 2002. Star category hotels will have almost 100,000 hotel rooms, while the balance
will be present in the unorganized sector.
The states of Andhra Pradesh, Madhya Pradesh, Uttar Pradesh, Assam/Meghalaya
and West Bengal will register the quickest growth trends. The states of Delhi,
Karnataka and Gujarat might experience a stagnant phase. These are also those states
that already have a high availability of hotel rooms.
In the year 2020, there should be approximately 6.6 million hotel rooms, if the full
potential of tourism is tapped. We feel that the contribution of North-eastern states
as well as J&K, would be substantially higher than the present levels.
19

3.5. Rooms Availability in 2010 (A Forecast)
State Total rooms 4/5 star Hotels
1-3 star Hotels
Other
Andhra Pradesh 141312 1802 5973 133537
Tamilnadu 144250 3609 8327 132314
Karnataka 76034 2875 3159 70000
Kerala 64595 2396 7102 55097
Madhya Pradesh 114919 857 1360 112702
Uttar Pradesh 978216 3340 1779 973097
Himachal Pradesh 76769 342 372 76055
Orissa 78758 589 879 77290
Assam 45068 154 514 44400
Meghalaya 7950 50 115 7785
Rajasthan 209019 3815 3106 202098
West Bengal 83336 2421 1576 79339
Delhi 31528 9807 1721 20000
Uttaranchal 36727 323 1013 35391
Maharashtra 107952 10333 8324 89295
Gujarat 12281 732 2501 9048
Goa 21989 3035 1545 17409
Punjab 17372 975 1822 14575
All India 2877168 46690 54867 2775611
20

3.6. Rooms Availability in 2020 (A Forecast)
State Total rooms 4/5 star Hotels
1-3 star Hotels
Other
Andhra Pradesh 355296 1802 7133 346361
Tamilnadu 231577 5082 10970 215526
Karnataka 122797 4125 4649 114023
Kerala 104671 3561 11362 89748
Madhya Pradesh 295471 1245 1908 292319
Uttar Pradesh 2530177 4385 1829 2523963
Himachal Pradesh 124699 442 372 123885
Orissa 127836 839 1099 125898
Assam 275706 154 639 274913
Meghalaya 48369 50 115 48204
Rajasthan 337082 4395 3491 329196
West Bengal 210746 3201 1761 205784
Delhi 47036 12470 1989 32578
Uttaranchal 58984 323 1013 57648
Maharashtra 169744 13798 10494 145452
Gujarat 19087 757 3591 14739
Goa 35016 4555 2103 28358
Punjab 27526 1570 2215 23741
All India 6554019 49469 57836 6446714
21
CHAPTER 4
EMPLOYMENT IN HOTELS
22
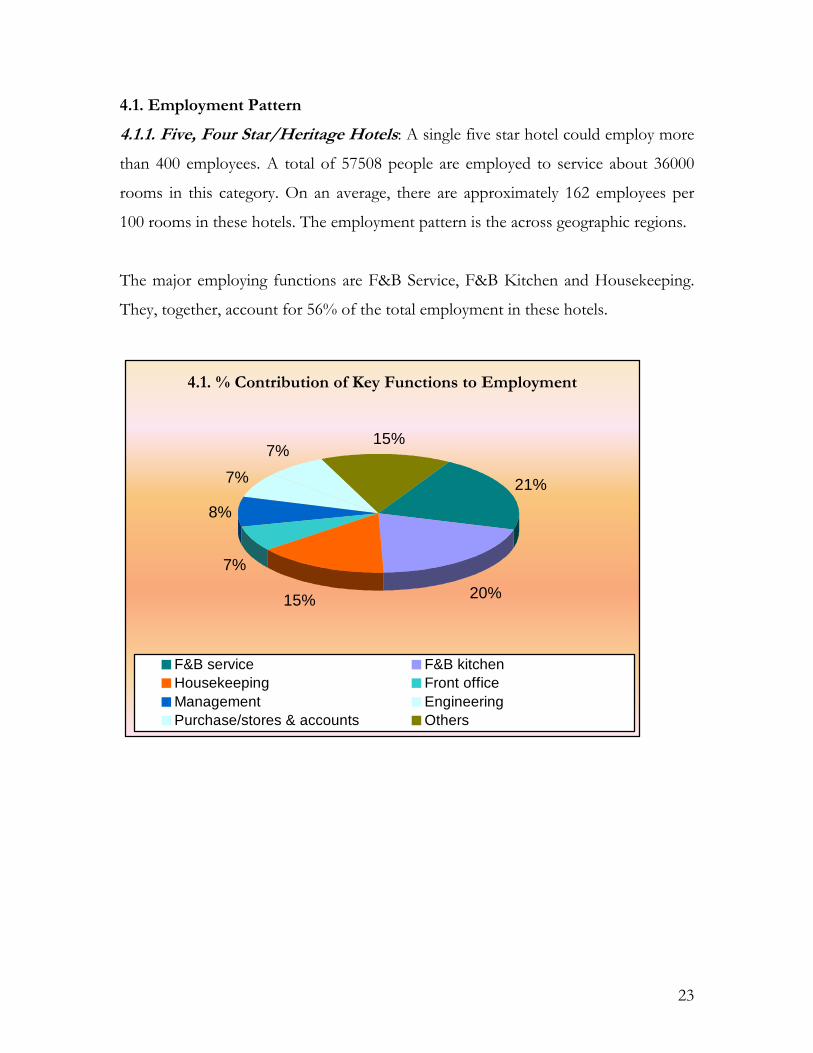
4.1. Employment Pattern
4.1.1. Five, Four Star/Heritage Hotels: A single five star hotel could employ more
than 400 employees. A total of 57508 people are employed to service about 36000
rooms in this category. On an average, there are approximately 162 employees per
100 rooms in these hotels. The employment pattern is the across geographic regions.
The major employing functions are F&B Service, F&B Kitchen and Housekeeping.
They, together, account for 56% of the total employment in these hotels.
4.1. % Contribution of Key Functions to Employment
21%
20%15%
7%
8%
7%7%
15%
F&B service F&B kitchenHousekeeping Front officeManagement EngineeringPurchase/stores & accounts Others
23

4.1.2. Three, Two & One Star Hotels
A total of 52,577 employees are present in these hotels to service almost 42,991 rooms nationally. On an average, there are 122 employees per 100 rooms in this category. The key employing functions are F&B and housekeeping. They together account for 62% of the total employment in these hotels.
4.3. Regional Employment Intensity
To a large extent, the employment across geographic regions depends on the
4.2. % Contribution of Key Functions to Employment
8%
9%
22%22%
20%
7% 12%
Management Front officeF&B service F&B kitchenHousekeeping Purchase & accountsOthers
presence of hotels; however, there are some differences in the employment intensity
across regions.
122
77
170
123
149
Overall
West
East
South
North
24

4.1.3. Other Hotels in the Unorganized Sector : There are approximately 638,000
employees working in hotels in the unorganized sector. These almost 58 employees
for every 100 rooms in this sector, substantially less than in the star category hotels.
4.4. % Contribution of Key Functions to Employment
21%
14%23%
13%
6%23%
F&B service F&B kitchen HousekeepingManagement Purchase & accounts Others
Although employment pattern across geographic regions depends on the presence of
hotels, there are some minor differences in the employment intensity across regions.
25
4.5. Regional Employment Intensity
67
61
48
59
63
North East
West
East
South
North

4.2.1 Employment in Five, Four Star/ Heritage Hotels
State Management team
Front office
F&B service
F&B kitchen
House keeping
Accounts Total
Andhra Pradesh 284 237 727 683 520 259 3493
Tamilnadu 343 287 880 827 630 314 4231
Karnataka 265 221 679 638 486 242 3263
Kerala 206 173 530 498 379 189 2548
M.P 78 64 198 186 142 71 952
U.P 353 295 907 852 648 323 4358
H.P 37 31 95 89 68 34 456
Orissa 55 46 141 132 101 50 677
Assam 22 19 58 54 41 21 278
Meghalaya 6 6 18 17 13 7 87
Rajasthan 473 395 1213 1141 868 432 5832
W.B 254 212 651 612 465 232 3127
Delhi 1083 905 2780 2613 1988 991 13361
Uttaranchal 45 38 117 110 84 42 562
Maharashtra 1067 891 2738 2573 1958 976 13159
Gujarat 99 84 258 242 184 92 1239
Goa 257 214 659 619 471 234 3166
Punjab 70 59 181 170 129 64 868
All India 4661 3896 11965 11247 8557 4267 57508
26

4.2.2 Employment in Three, Two & One Star Hotels
State Management team
Front office
F&B service
F&B kitchen
House keeping
Accounts Total
Andhra Pradesh 252 397 1346 1685 1607 522 6188
Tamilnadu 311 489 1658 2075 1980 644 7620
Karnataka 99 155 525 657 627 204 2413
Kerala 184 291 986 1234 1177 383 4531
M.P 137 91 156 189 134 78 710
U.P 191 251 584 416 399 120 2591
H.P 42 54 125 89 85 25 554
Orissa 35 70 316 328 246 71 1195
Assam 21 41 186 193 145 42 704
Meghalaya 6 12 52 54 40 12 196
Rajasthan 413 275 474 573 405 237 2156
W.B 72 143 643 666 500 143 2428
Delhi 167 217 506 360 345 104 2246
Uttaranchal 112 146 340 242 232 70 1509
Maharashtra 972 648 1116 1350 954 558 5076
Gujarat 240 160 276 334 236 138 1255
Goa 162 108 186 225 159 93 847
Punjab 167 218 507 361 346 105 2247
All India 4114 4616 11776 11776 10533 3728 52577
27
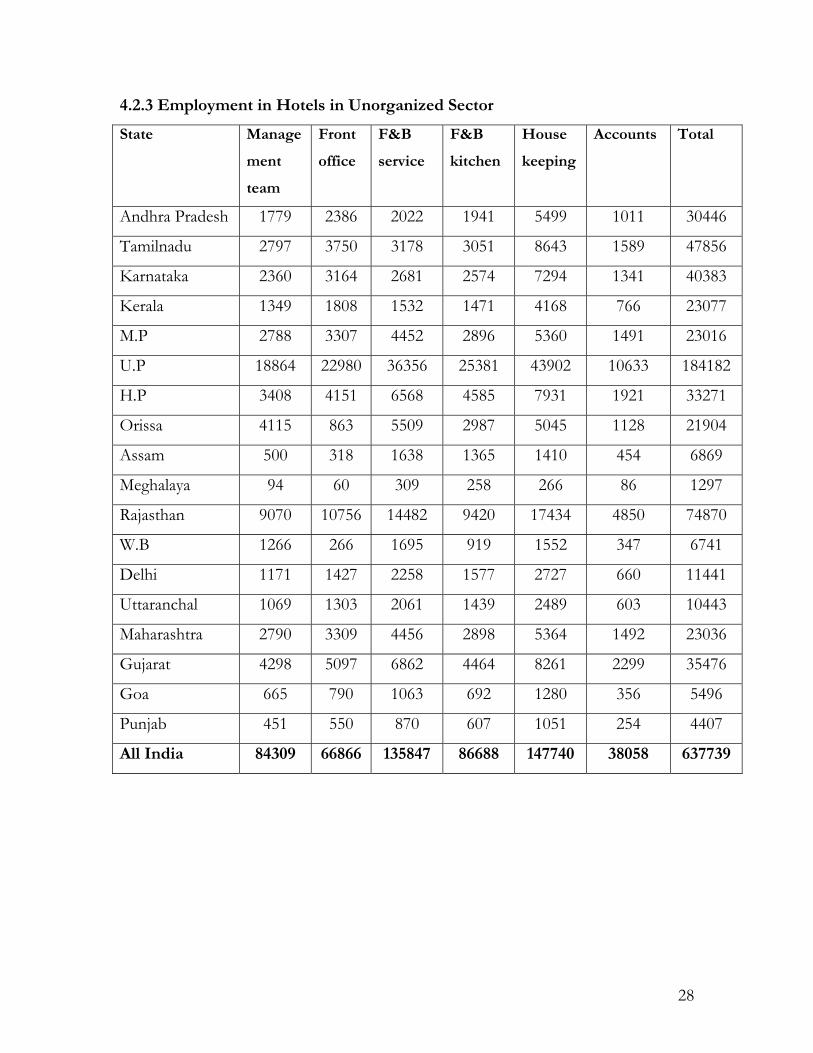
4.2.3 Employment in Hotels in Unorganized Sector
State Manage
ment
team
Front
office
F&B
service
F&B
kitchen
House
keeping
Accounts Total
Andhra Pradesh 1779 2386 2022 1941 5499 1011 30446
Tamilnadu 2797 3750 3178 3051 8643 1589 47856
Karnataka 2360 3164 2681 2574 7294 1341 40383
Kerala 1349 1808 1532 1471 4168 766 23077
M.P 2788 3307 4452 2896 5360 1491 23016
U.P 18864 22980 36356 25381 43902 10633 184182
H.P 3408 4151 6568 4585 7931 1921 33271
Orissa 4115 863 5509 2987 5045 1128 21904
Assam 500 318 1638 1365 1410 454 6869
Meghalaya 94 60 309 258 266 86 1297
Rajasthan 9070 10756 14482 9420 17434 4850 74870
W.B 1266 266 1695 919 1552 347 6741
Delhi 1171 1427 2258 1577 2727 660 11441
Uttaranchal 1069 1303 2061 1439 2489 603 10443
Maharashtra 2790 3309 4456 2898 5364 1492 23036
Gujarat 4298 5097 6862 4464 8261 2299 35476
Goa 665 790 1063 692 1280 356 5496
Punjab 451 550 870 607 1051 254 4407
All India 84309 66866 135847 86688 147740 38058 637739
28

4.3. Employment Forecast (2010 – 2020)
The employment forecast has been computed on the basis of the forecast of hotel
rooms in different categories. Employment intensity per room has been assumed to
be the same as the present level. The employment potential in different states is in
direct proportion to the number of hotel rooms in future.
In the years 2010 and 2020, there will be more than 1.5 million and 3.4 million people
employed in hotels, respectively. However, given the trend in the growth of star
category hotels and the higher employment intensity in these hotels, we expect a
substantially higher numbers of employees in the five & four star/heritage hotels.
29
4.6. Employment Forecast
110434 83044
15513331405080
6317683077
34551443261666
5star/4star/Heritage 1-3 stars Others Total
2010 2020
4.6. Employment Forecast
110434 83044
15513331405080
6317683077
34551443261666
5star/4star/Heritage 1-3 stars Others Total
2010 2020

4.4. Employment in Motels The national and state highways have a substantial number of motels along their
length. In this study, we have estimated the number of motels for every 100 km of
road covered, via physical counting on a sample of highways. The results of this scan
are mentioned in the table below.
National Highway Road Length # Motels # Motel RoomsDelhi-Agra 203 21 315
Delhi-Jaipur 258 58 870
Mumbai-Pune 163 63 945
Agra-Fathepur Sikri 42 3 45
Fathepur-Bharatpur 22 17 255
Cochin-Trivandrum 220 60 900
Total 908 222 3330
State Highway Road Length # Motels # Motel RoomsBangalore-Mysore 139 10 100
Mysore-Ooty 140 2 20
Total 279 12 120
The average number of rooms in the motels on national highways and state highway
have been assumed as 15 and 10, respectively.
Total
Length # Rooms Employment
Intensity per Room
Total Employment
National highway 34508 126644 0.575 72820
State highway 135187 59482 0.575 34202
Total 169695 186126 0.575 107022
The highways have more than 107,000 employees working in motels throughout the country.
30
CHAPTER 5
PROFILE OF HOTEL EMPLOYEES
31

5.1. Educational Background of Personnel in Key Functions 5.1.1. Front Office
Five, Four Star/ Heritage Hotels: Our survey reveals that the pre-requisite for the
managerial and supervisory positions is a hotel management degree; a few of the
office assistants in the front office are graduates from other disciplines.
Three, Two & One Star Hotels: 44% of the positions are occupied by graduates
without training in hotel management. A majority of the office associates (more than
60%) are either graduates from other fields or SSC pass-outs.
Hotels in the Unorganized Sector: Only one in every eight managers is having a
hotel management degree or an MBA. A majority of them are graduates while almost
35% have just completed their SSC level school education. On the other hand, almost
72% of the office assistants have a school level certificate only.
5.1.2. F&B Service
Five, Four Star/ Heritage Hotels: Most managers and captains are having a hotel
management degree. A few captains (30%) are having a certificate in cookery from
the food craft institutes. The stewards and waiters have either a hotel management
degree or a Food Craft Institute Certificate.
Three, Two & One Star Hotels: Almost half the managers and captains have a
hotel management degree/diploma or a Food Craft Institute Certificate. Most
stewards and waiters possess an SSC level school certificate only.
Hotels in the Unorganized Sector: While one-third of the managers are hotel
management students, the rest are either plain graduates or SSC pass. The stewards
and particularly the waiters predominantly have a SSC level school certificate only.
32

5.1.3. F&B Kitchen Five, Four Star/ Heritage Hotels: Almost 90% of the chefs are hotel management
graduates, while 80% of the cooks are either hotel management graduates or food
craft diploma certificate holders. While most helpers in the kitchen possess an SSC
level school education, a few (20%) have a cookery certificate as well.
Three, Two & One Star Hotels: While ¾ of the chefs are hotel management
graduates, 1/6 of them and half of the cooks are merely SSC pass. Most helpers are
school pass and are not expected to have any special qualification.
Hotels in the Unorganized Sector: A majority of those presently employed in the
kitchens are SSC pass; only 1/3 of them are either hotel management graduates or
food craft certificate holders.
5.1.4. Housekeeping Five, Four Star/ Heritage Hotels: Almost 80-90% of the managers and
supervisors are hotel management graduates. Half the room attendants are hotel
management graduates while the balance are mostly SSC pass.
Three, Two & One Star Hotels: While 60% of the managers are hotel management
graduates, the balance are equally either graduates or SSC pass. Approx. ¾ of the
supervisors are either college graduates or SSC pass; 30% of them are hotel
management graduates. Most room attendants are just SSC pass.
Hotels in the Unorganized Sector: A majority of the supervisors and room
attendants are SSC pass; 1/3 of the managers are hotel management graduates.
33

5.1.5. Other Functions Purchase, HRD and Sales & Marketing in both 1-3 star and small hotels have
graduates while the bigger hotels prefer MBAs. The engineering functions have
employees with an engineering degree or an ITI diploma. The proportion of degree
holders increases with the size of the hotel.
Function-wise summary of Educational Qualification
Functions 5/4 star
Hotels/Heritage 1-3 Star Hotels Unorganized sector
Front Office All are Hotel Management Degree
A number of managers & supervisors have a hotel management degree
1/8 managers are post-graduates in hotel management
F&B Service All are Hotel Management Degree/ Food Certificate holders
50% have a Hotel Management Degree or Food Craft certificate
1/3 managers are Hotel Management degree holders
F&B Kitchen Most are Hotel Management degree or Food craft certificate holders
Chefs are Hotel Management degree holders
Largely trained on the job
Housekeeping Most supervisors/ managers are Hotel Management degree holders
Managers & supervisors are Hotel management graduates
A few managers are Hotel Management graduates, largely SSC
Purchase, HR
and Sales &
Marketing
MBAs Graduates Graduates
34
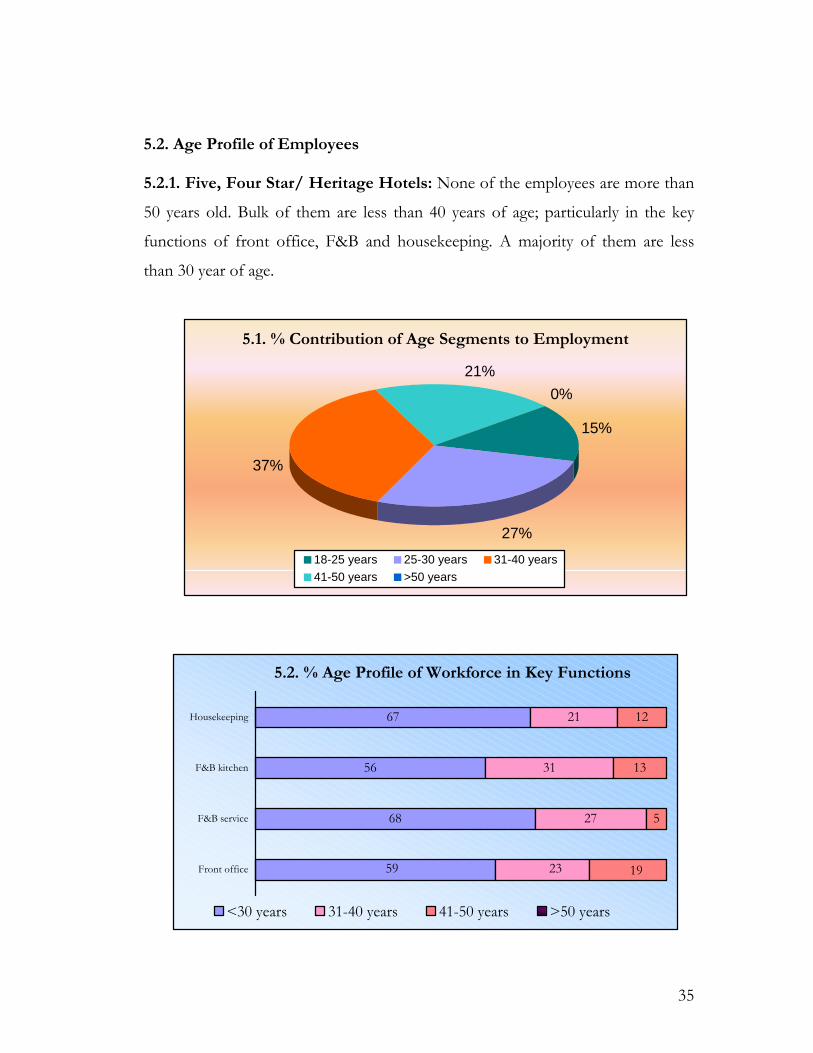
5.2. Age Profile of Employees 5.2.1. Five, Four Star/ Heritage Hotels: None of the employees are more than
50 years old. Bulk of them are less than 40 years of age; particularly in the key
functions of front office, F&B and housekeeping. A majority of them are less
than 30 year of age.
35
5.1. % Contribution of Age Segments to Employment
15%
27%
37%
21%0%
18-25 years 25-30 years 31-40 years41-50 years >50 years
5.2. % Age Profile of Workforce in Key Functions
68
56
67
27
31
21
13
12
59 23
5
19Front office
F&B service
F&B kitchen
Housekeeping
<30 years 31-40 years 41-50 years >50 years

5.2.2. Three, Two & One Star Hotels: A majority of the people (52%)
employed in these hotels are less than 30 years of age. A negligible proportion is
more than 50 years of age. More than 60% of the workforce employed in the
front office, F&B service and housekeeping are less than 30 years of age.
5.3. % Contribution of Age Segments to Employment
26%
26%
31%
15%2%
18-25 years 25-30 years 31-40 years41-50 years >50 years
36

5.2.3. Hotels in the Unorganized Sector: By comparison to hotels in the star
category, a significantly higher proportion (59%) of employees in these hotels are
less than 30 years of age. Only 8% of the workforce is more than 50 years of age.
The age profile of the workforce in these hotels is young. More than 80% of
those employed in the key hotel functions are less than 40 years of age.
5.6. % Age Profile of Workforce in Key Functions
84
71
86
15
24
10
1
6
31
64 16 13 8Front office
F&B service
F&B kitchen
Housekeeping
<30 years 31-40 years 41-50 years >50 years
5.5. % Contribution of Age Segments to Employment
22%
37%
20%
13%8%
18-25 years 25-30 years 31-40 years41-50 years >50 years
37
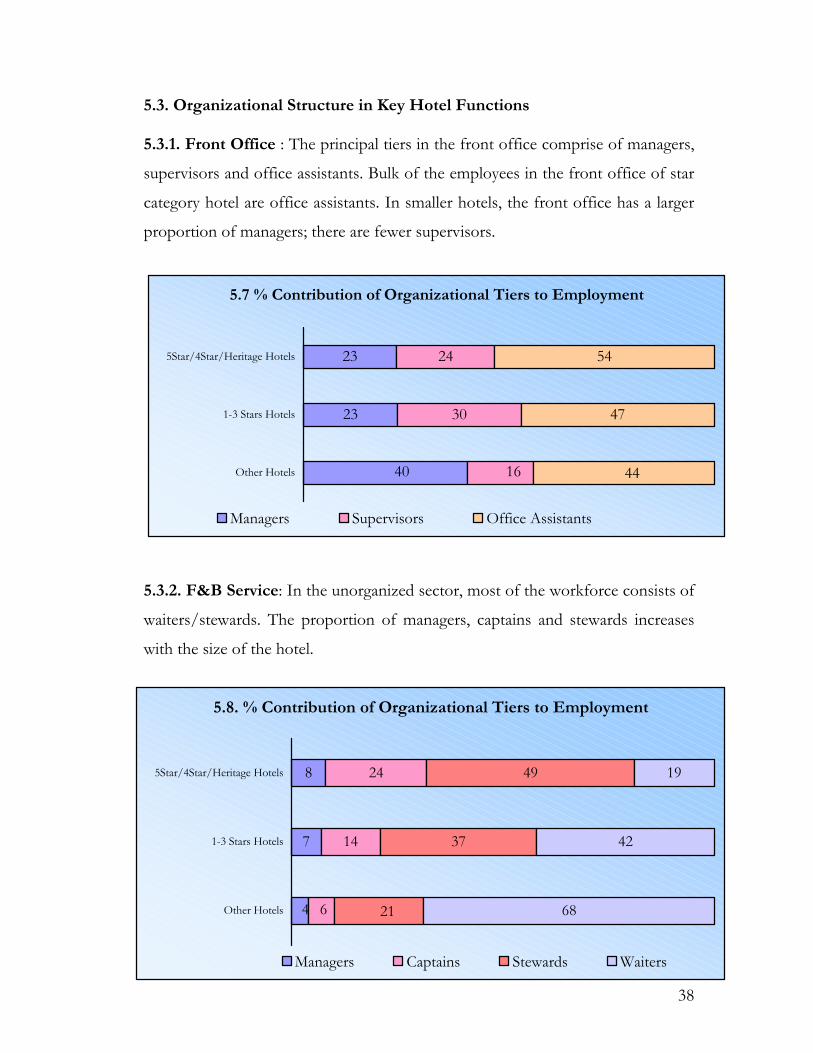
5.3. Organizational Structure in Key Hotel Functions 5.3.1. Front Office : The principal tiers in the front office comprise of managers,
supervisors and office assistants. Bulk of the employees in the front office of star
category hotel are office assistants. In smaller hotels, the front office has a larger
proportion of managers; there are fewer supervisors.
5.7 % Contribution of Organizational Tiers to Employment
23
23
30
24 54
40 16
47
44Other Hotels
1-3 Stars Hotels
5Star/4Star/Heritage Hotels
Managers Supervisors Office Assistants
5.3.2. F&B Service: In the unorganized sector, most of the workforce consists of
waiters/stewards. The proportion of managers, captains and stewards increases
with the size of the hotel.
38
5.8. % Contribution of Organizational Tiers to Employment
7
8
14
24 49
42
19
4 6
37
21 68Other Hotels
1-3 Stars Hotels
5Star/4Star/Heritage Hotels
Managers Captains Stewards Waiters

5.9. % Contribution of Organizational Tiers to Employment
6
15
33
52 33
5 51
60
44Other Hotels
1-3Stars Hotels
5Star/4Star/Heritage Hotels
Chefs Cooks Helpers
5.3.3. F&B Kitchen : In the larger hotels, almost 15% of the workforce
comprises of chefs. However, a bulk of the employees are cooks.
5.3.4. Housekeeping : Managers and supervisors account for 10-20% of the workforce in housekeeping. A bulk of the employees are room attendants.
39
5.10. % Contribution of Organizational Tiers to Employment
5
3
14
11 51
26
35
2 8
54
68 22Other Hotels
1-3Star Hotels
5Star/4Star/Heritage Hotels
Manager Supervisors Room Attendants House-men

CHAPTER 6
RESTAURANTS IN INDIA
40

The burgeoning middle class and evolving lifestyle is driving the demand for quality
restaurants - both conventional ones as well as new ones such as fast food outlets,
cafés and pubs. These restaurants will cater to both the foreign and domestic tourists
travelling to key tourist destinations. The low cost mobile food vans, sweet shops,
dhabas and juice corner cater primarily to the lower and middle-income population
segment.
Since the presence of restaurants is largely dependent on the resident population, the
computations are based on sample statistics and population data obtained form the
Census of India.
6.1. A Map of Restaurants On this basis, our estimate is that there are more than 140, 000 restaurants in urban
India. The 18 states covered by our primary research have 124,000 restaurants. These
states account for 88% of the urban Indian population.
Conventional restaurants account for the largest population (30%) followed by sweet
shops (16%), fast food outlets (16%) and dhabas (13%). Northern region has over
and Indian food.
10,000 fast food outlets, serving Chinese, Western
41
6.1. Estimated Number of Restaurants
42261
21940
8433
14102215446
12329
18162
22451
Total
Others
Juice Corner
Dhaba
Sweet shop
Fast food
Café
Conventional Restaurant

6.2. % Contribution of Restaurant Categories to Total
30%
11%6%16%
16%13% 8%
Restaurant Pubs/Bars CaféFast food Sweet shop DhabaCorner
42

6.2. Geographic Spread The northern region accounts for 34% of the outlets followed by the west (26%).
The metropolitan cities of Delhi & Mumbai account for almost 15% of the
restaurants. Almost 35% of the café/ tea & coffee vendors are in South India;
however sweet shops are fewer.
Mobile food vans are few in numbers and are located in the larger cities of North and
South India only.
6.3. % Contribution of Regions to Total Restaurants
16%
32%
13%
1%
12%
26%
North East North EastWest & Central Others State total
6.3. Restaurant Penetration While the number of conventional restaurants ranges between 10-20 per lakh of
population, the total number of eating places could be as high as 86 per lakh of
population (as in the Northern Region). This is on account of higher penetration of
fast food outlets, sweet shops, dhabas and juice corners.
43

6.4. Restaurants Penetration (Numbers per Lakh Population)
Region Conventional ones
Pubs/Bars
Café Fast food
Sweet shop
Dhaba Corner All Outlets
South 12 1 3 4 2 5 3 31
North 13 8 7 19 15 12 11 86
East 19 6 1 8 15 4 5 59
North
East
15 2 1 3 0 3 1 25
West
&
Central
17 8 0 4 6 5 1 41
44
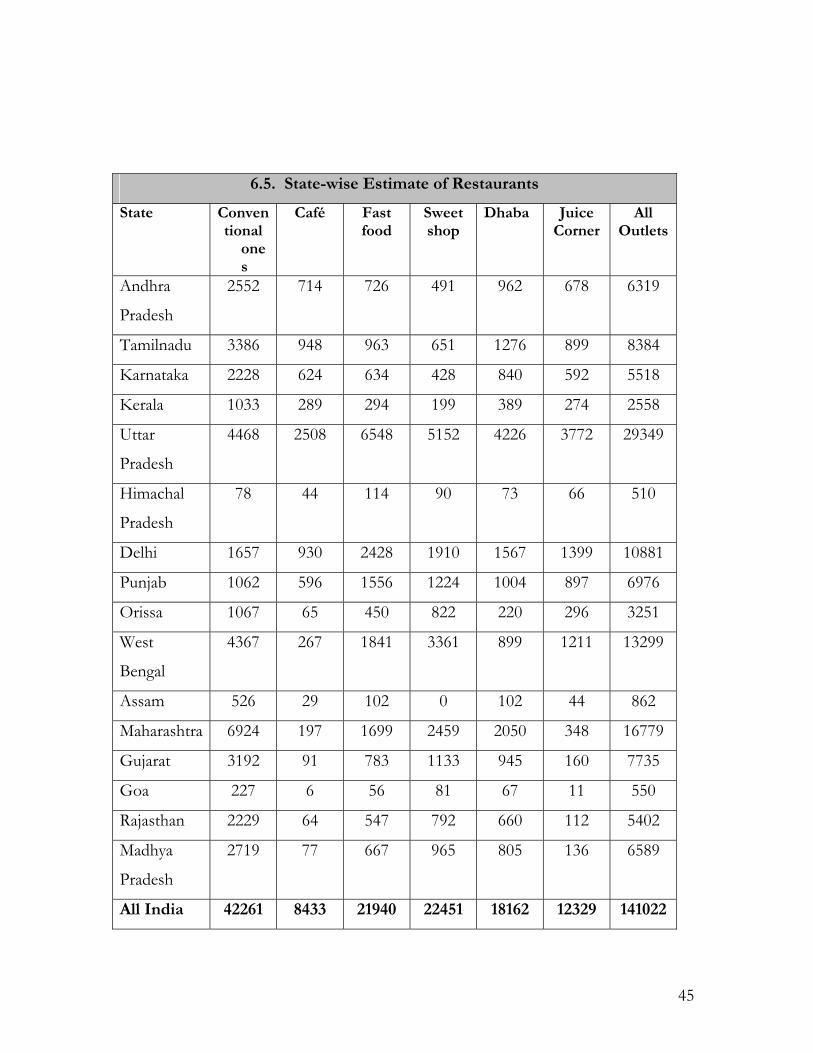
6.5. State-wise Estimate of Restaurants
State Conven tional
Café Fast food
Sweet shop
Dhaba Juice Corner
All Outlets
ones
Andhra
Pradesh
2552 714 726 491 962 678 6319
Tamilnadu 3386 948 963 651 1276 899 8384
Karnataka 2228 624 634 428 840 592 5518
Kerala 1033 289 294 199 389 274 2558
Uttar
Pradesh
4468 2508 6548 5152 4226 3772 29349
Himachal
Pradesh
78 44 114 90 73 66 510
Delhi 1657 930 2428 1910 1567 1399 10881
Punjab 1062 596 1556 1224 1004 897 6976
Orissa 1067 65 450 822 220 296 3251
West
Bengal
4367 267 1841 3361 899 1211 13299
Assam 526 29 102 0 102 44 862
Maharashtra 6924 197 1699 2459 2050 348 16779
Gujarat 3192 91 783 1133 945 160 7735
Goa 227 6 56 81 67 11 550
Rajasthan 2229 64 547 792 660 112 5402
Madhya
Pradesh
2719 77 667 965 805 136 6589
All India 42261 8433 21940 22451 18162 12329 141022
45

6.4. Restaurants Forecast : 2010 - 2020 We estimate that there would be almost 196,000 restaurants in 2010 and then 237,000
in 2020. The increase is based on expected population growth and does not take into
account new developments and evolution of restaurants. The mix of restaurants is
definitely going to change; however, the future mix is difficult to forecast.
The shares of the north and east are likely to increase in future, because of expected
differential in population growth rates. The penetration of restaurants in terms of
numbers per lakh of population has been assumed as the same as the present one.
6.6. Estimated Number of Restaurants (2010)
5678111985
31510
1964562150117621
2551631542
Total
Juice Corner
Sweet shop
Café
46

6.7. Estimated Number of Restaurants (2020)
6766114552
38477
23729726016
21450
3091538226
Total
Others
Juice Corner
Dhaba
Sweet shop
Fast food
Café
Restaurant
47

CHAPTER 7
EMPLOYMENT IN RESTAURANTS
48

7.1.1. Conventional Restaurants There is an average of 26 people employed (both permanent and temporary) for
every 100 chairs in restaurants. Almost 80% are employed in the kitchen and service
functions, while the balance are almost equally distributed between management,
store, security, maintenance and delivery.
There are some geographic differences in the employment intensity of restaurants.
While the restaurants in the east have 31 employees per 100 chairs, in the north east,
there are only 19 per 100 chairs.
49
7.2. Regional Employment Intensity
26
26
28
19
31
22
Overall
West
North east
East
South
North
7.1. % Contribution of Key Functions to Employment
2%
38%
42%
18%
Management Kitchen Service Others
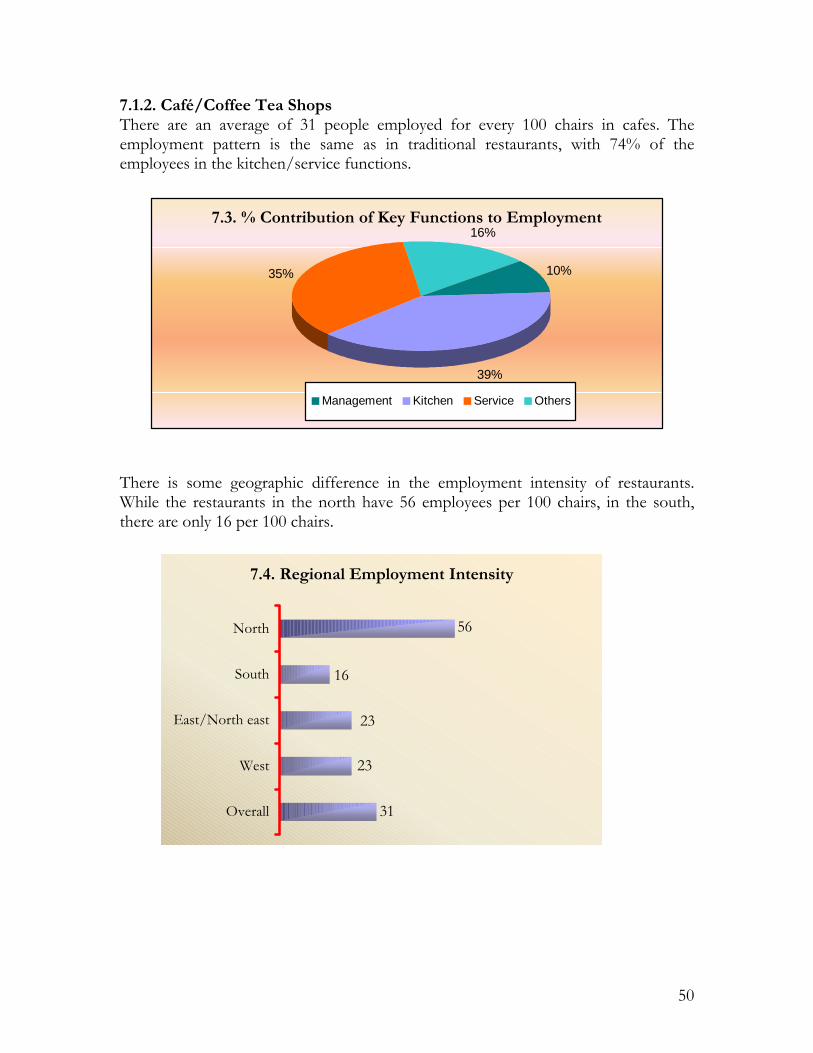
7.1.2. Café/Coffee Tea Shops There are an average of 31 people employed for every 100 chairs in cafes. The employment pattern is the same as in traditional restaurants, with 74% of the employees in the kitchen/service functions.
There is some geographic difference in the employment intensity of restaurants. While the restaurants in the north have 56 employees per 100 chairs, in the south, there are only 16 per 100 chairs.
50
7.4. Regional Employment Intensity
31
23
23
16
56
Overall
West
East/North east
South
North
7.3. % Contribution of Key Functions to Employment
10%
39%
35%
16%
Management Kitchen Service Others

7.1.3. Fast Food restaurants
There are an average of 32 employees for every 100 chairs. This is on account of the
higher number of employees in the delivery function, which is a recent trend. fast
food restaurants have more people for management of outlets.
There is one significant difference across the various geographic regions. While fast food restaurants generally have 24-28 employees per 100 chairs, in the West, there are 36 for every 100 chairs.
51
7.6. Regional Employment Intensity
32
36
24
26
28
Overall
West
East
South
North
7.5. % Contribution of Key Functions to Employment
13%
31%
28%
16% 12%
Management Kitchen ServiceDelivery Others

7.1.4. Dhabas/Bhojanalaya
Even Dhabas employ 26 people for every 100 chairs. However, the functions are
limited to management and predominantly kitchen and service.
There is not much geographical difference in the employment intensity. Only the north east has significantly less number of employees (18 per 100 chairs).
52
7.8. Regional Employment Intensity
29
26
27
18
31
22
Overall
West
North east
East
South
North
7.7. % Contribution of Key Functions to Employment
12%
42%
46%
Management Kitchen Service

7.2. Employment Potential 7.2.1. Employment Potential of Conventional Restaurants There are almost 926,000 people employed in conventional restaurants across the
country. The employment potential of different regions is different from the spread
of restaurants because of the difference in employment intensity.
7.2.2. Employment Potential of Fast Food Outlets There are already more than 280,000 people employed in fast food restaurants across the country. Almost 47% of them are in the North which has the highest member of fast food outlets as well as a high employment intensity. The West accounts for 21% of employees in fast food outlets.
7.9. Employment Potential926073
383663 352543
76957
Total Service Kitchen Management
53
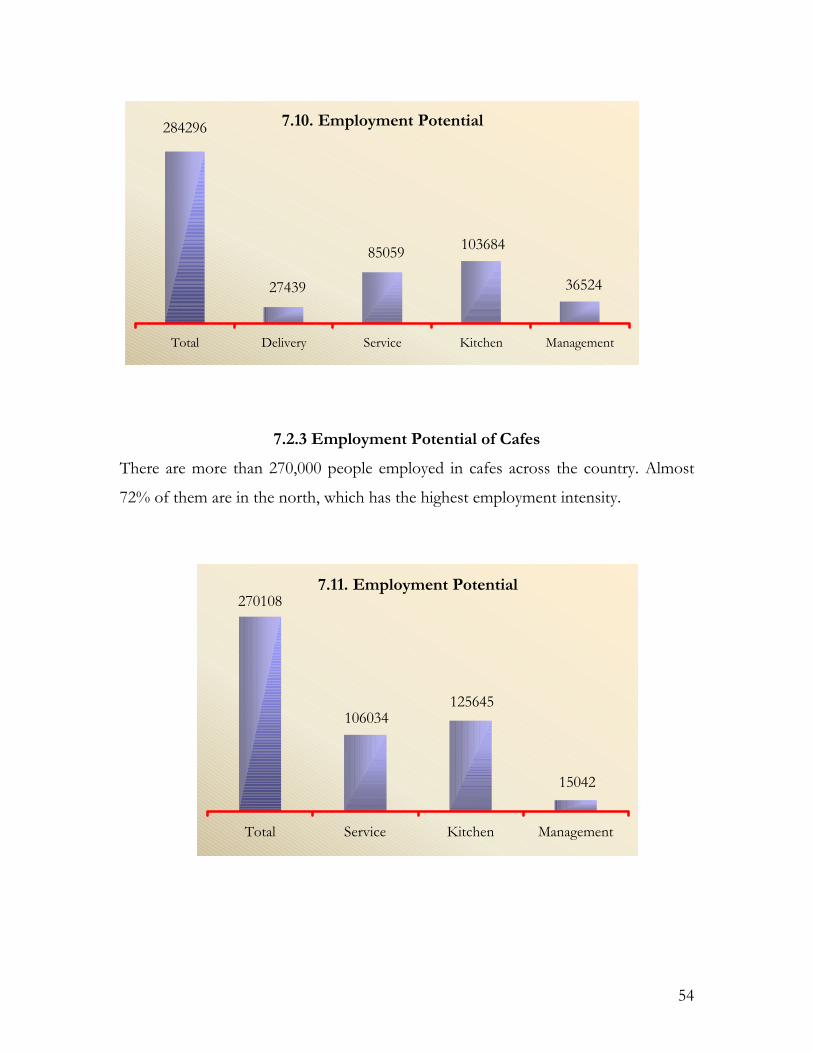
7.10. Employment Potential284296
27439
85059 103684
36524
Total Delivery Service Kitchen Management
7.2.3 Employment Potential of Cafes
There are more than 270,000 people employed in cafes across the country. Almost
72% of them are in the north, which has the highest employment intensity.
54
7.11. Employment Potential270108
106034125645
15042
Total Service Kitchen Management

7.2.4. Employment Potential of Dhabas/Bhojanalayas
There are almost 1.8 lakh people employed in Dhabas and Bhojanalayas.
7.3. Total Employment in Restaurants
55
7.13. Total Employment
926073
284296
1852859
24658 168382 179342270108
Tota
l
Juice
cor
ner
Swee
t sho
ps
Dha
bas
Café
Fast
food
Conv
entio
nal
Rest
aura
nts
7.12. Employment Potential179342
76822 76980
17635
Total Service Kitchen Management

7.4. State-wise Employment in Different Restaurant Categories 7.4.1. Conventional Restaurants
States Management Kitchen Service Total
AP 3757 21972 24774 55980
Tamil Nadu 4985 29152 32870 74275
Karnataka 3280 19182 21629 48873
Kerala 1521 8894 10028 22660
UP 7428 41814 39838 98066
HP 130 730 695 1712
Delhi 2755 15507 14774 36369
Punjab 2253 12681 12081 29740
Orissa 1349 5735 5510 14337
WB 5523 23472 22552 58680
Maharashtra 15448 57771 67706 165733
Rajasthan 4973 18598 21796 53353
MP 6066 22686 26588 65082
Gujarat 7121 26633 31213 76404
Goa 506 1894 2220 5433
Assam 625 3516 3350 8246
All India 76957 352543 383663 926073
56
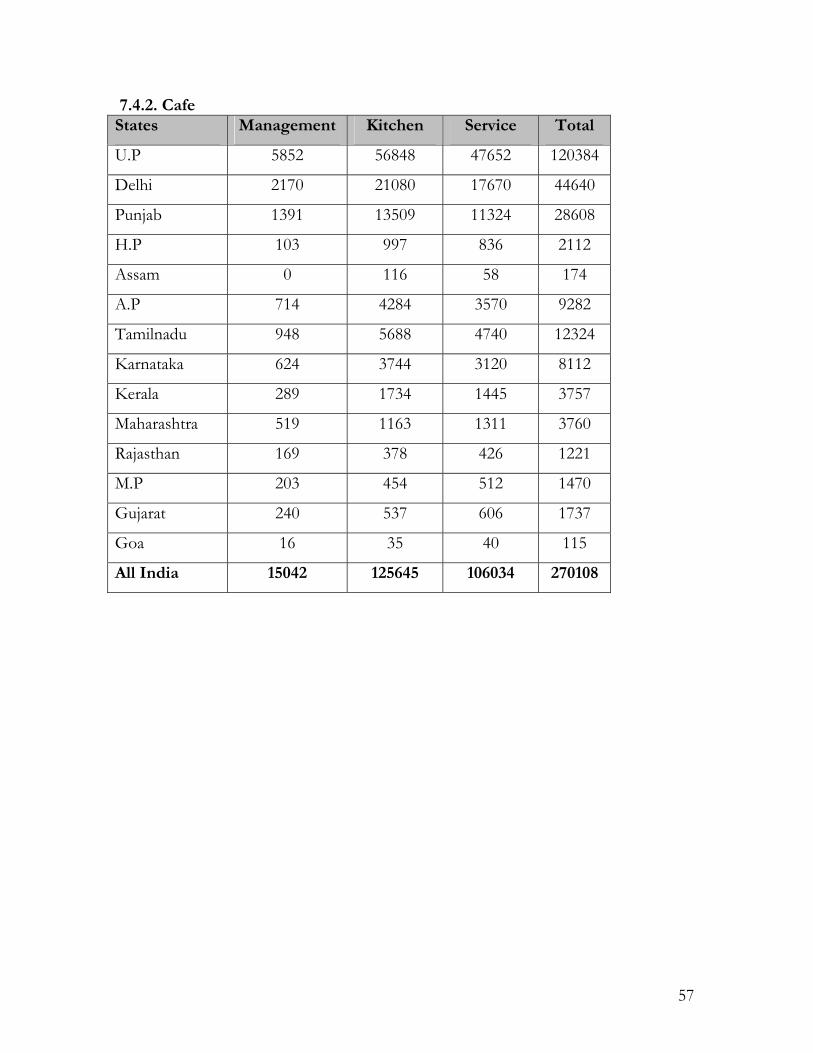
7.4.2. Cafe States Management Kitchen Service Total
U.P 5852 56848 47652 120384
Delhi 2170 21080 17670 44640
Punjab 1391 13509 11324 28608
H.P 103 997 836 2112
Assam 0 116 58 174
A.P 714 4284 3570 9282
Tamilnadu 948 5688 4740 12324
Karnataka 624 3744 3120 8112
Kerala 289 1734 1445 3757
Maharashtra 519 1163 1311 3760
Rajasthan 169 378 426 1221
M.P 203 454 512 1470
Gujarat 240 537 606 1737
Goa 16 35 40 115
All India 15042 125645 106034 270108
57
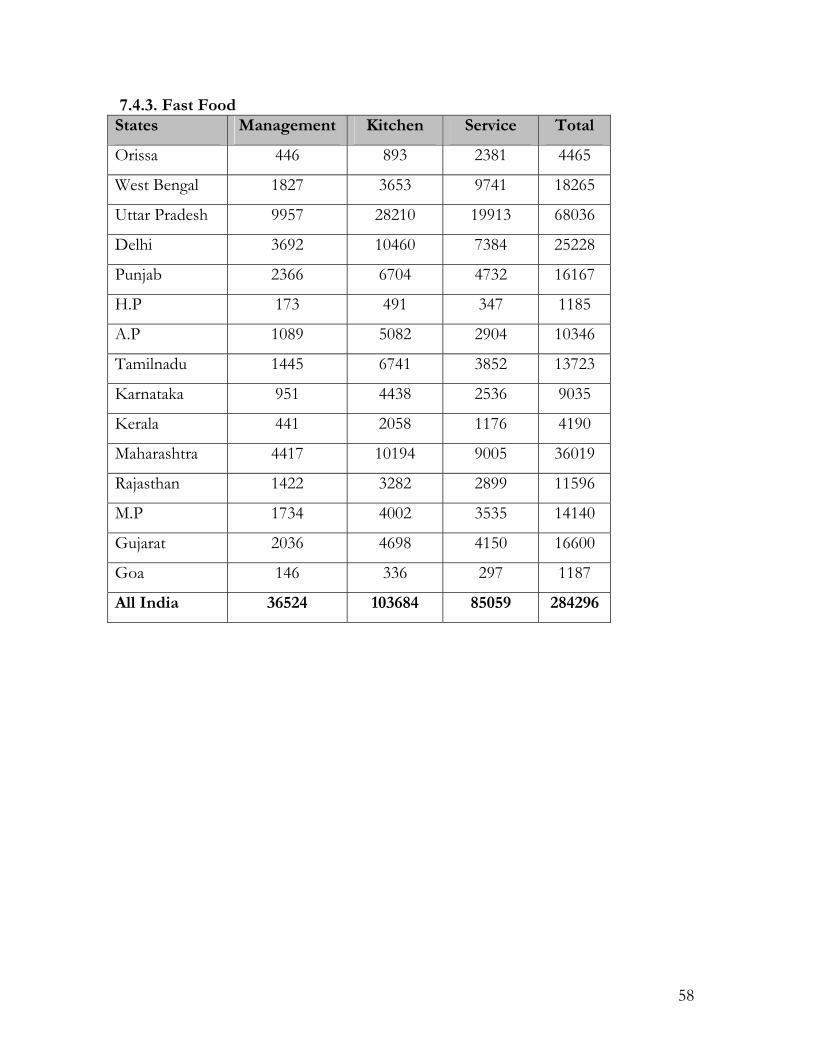
7.4.3. Fast Food States Management Kitchen Service Total
Orissa 446 893 2381 4465
West Bengal 1827 3653 9741 18265
Uttar Pradesh 9957 28210 19913 68036
Delhi 3692 10460 7384 25228
Punjab 2366 6704 4732 16167
H.P 173 491 347 1185
A.P 1089 5082 2904 10346
Tamilnadu 1445 6741 3852 13723
Karnataka 951 4438 2536 9035
Kerala 441 2058 1176 4190
Maharashtra 4417 10194 9005 36019
Rajasthan 1422 3282 2899 11596
M.P 1734 4002 3535 14140
Gujarat 2036 4698 4150 16600
Goa 146 336 297 1187
All India 36524 103684 85059 284296
58

7.4.4. Dhaba/Bhojanalayas States Management Kitchen Service Total
AP 556 3751 3751 8127
Tamilnadu 1025 6917 6917 14986
Karnataka 675 4553 4553 9865
Kerala 312 2109 2109 4569
U.P 3210 15513 14978 36376
Delhi 1190 5752 5554 13488
Punjab 763 3686 3558 8642
HP 55 268 259 628
Orissa 283 585 777 1685
WB 1155 2392 3175 6887
Maharashtra 2828 9899 9742 23412
Rajasthan 911 3187 3136 7538
M.P 1111 3887 3826 9194
Gujarat 1304 4563 4491 10793
Goa 92 324 318 765
Assam 51 357 459 867
All India 17635 76980 76822 179342
59

7.5 All India Employment Forecast
2010 2020
Conventional Restaurants
1226307 1436196
Kitchen 467249 546542
Service 507467 594100
Dhabas 253947 306377
Kitchen 109037 131475
Service 108504 130688
Cafe 406768 504563
Kitchen 189566 235289
Service 159872 198390
Fast Food 401608 487809
Kitchen 147692 179824
Service 119581 144927
7.6. All India Restaurant Employment Forecast for Key Functions
60
2288630
913594 895424 1068105
2734945
1093130
Total Kitchen Service
2010 2020

7.7. Employment in Highway Restaurants
The national and state highways have a substantial number of eating places, to cater
to both the commercial as well as leisure road travelers. These eating-places comprise
mainly of conventional restaurants, fast food outlets, tea/ coffee vendors and dhabas.
Physical scanning of the highways revealed the following penetration of restaurants
and dhabas.
Outlet Type Numbers per 100 km
Highways (NH)
100 # per km on State Highways
(SH)
Restaurants 39 16
Dhabas 80 29
Outlet Type Employment
Intensity per
100 chairs
Employment
on NH
Employment
on SH
Total
Restaurants 26 175,000 280,000 455,000
Dhabas 26 360,000 510,000 870,000
Total 535,000 790,000 1,325,000
There are more than 1.3 million people already employed on the national and state highways. Presently, these restaurants and dhabas employ untrained people in their kitchens and
service functions.
By 2020, progressively higher proportions will belong to the organized sector. Even a 10% share for the organized sector, at present levels of employment intensity, could create almost 130,000 jobs for trained manpower.
61

CHAPTER 8
PROFILE OF RESTAURANT EMPLOYEES
62

8.1. Structure of Different Departments 8.1.1 F&B Kitchen Conventional Restaurants: While 9% of the employees are chefs, the balance are
either cooks or helpers in almost equal proportion.
8.1. % Contribution of Organizational Tiers to Employment
22
1
9
57
48
29
43
43
11
49
44 46Café
Fast food
Dhaba
Conventional Restaurants
Chefs Cooks Helpers
Dhaba: The proportion of helpers is comparatively small (43%); bulk of the employees are cooks (57%). Fast Food Outlets: The fast food restaurants have a sizeable proportion of chefs (22%), thereby indicating a preference for qualified and trained manpower. Café: These outlets have an employment structure similar to that of restaurants.
63

8.1.2. F&B Service A bulk of the people (more than 80%) employed in the service function are either stewards or waiters. The definition of different designations is flexible and varies across outlet category. Both conventional restaurants and cafes have a sizeable proportion of captains (approx. 12%). Dhabas have waiters only.
8.2. % Contribution of Organizational Tiers to Employment
14
1
4 12 2
86
82
99
83
2 12
4
Café
Fast food
Dhaba
ConventionalRestaurants
Hall incharge Captains Butlers Stewards & Waiters
64
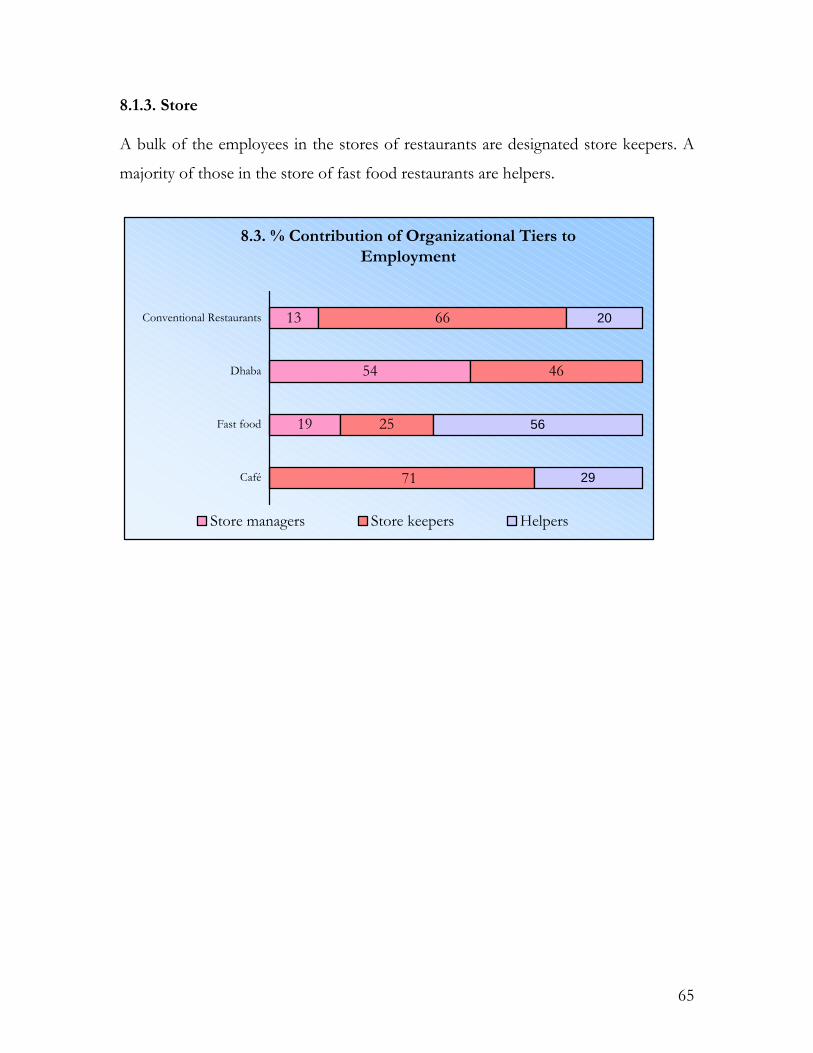
8.1.3. Store A bulk of the employees in the stores of restaurants are designated store keepers. A
majority of those in the store of fast food restaurants are helpers.
8.3. % Contribution of Organizational Tiers to Employment
19
54
13
46
66
56
20
25
71 29Café
Fast food
Dhaba
Conventional Restaurants
Store managers Store keepers Helpers
65
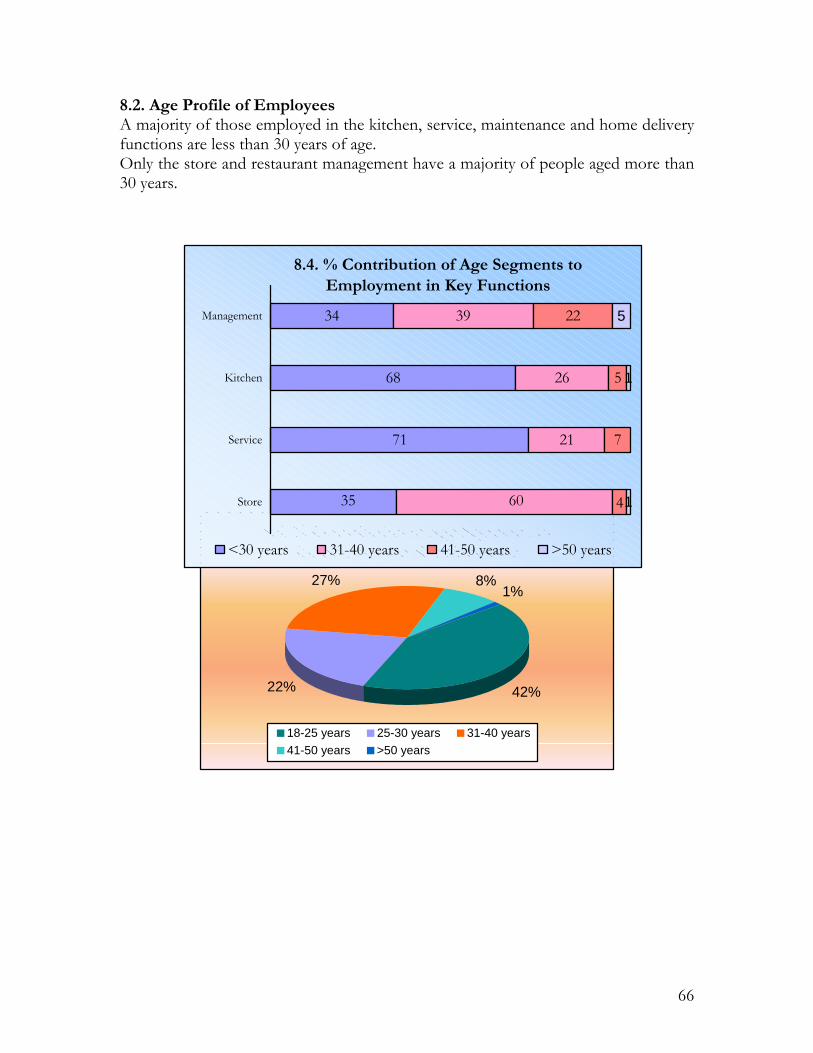
8.2. Age Profile of Employees A majority of those employed in the kitchen, service, maintenance and home delivery functions are less than 30 years of age. Only the store and restaurant management have a majority of people aged more than 30 years.
8.5. % Contribution of Age Segments to Employment in Key Functions
42%22%
27% 8%1%
18-25 years 25-30 years 31-40 years41-50 years >50 years
8.4. % Contribution of Age Segments to Employment in Key Functions
71
68
34
21
26
39
5
22
1
5
35 60
7
41Store
Service
Kitchen
Management
<30 years 31-40 years 41-50 years >50 years
66

8.3. Educational Background of Restaurant Employees
8.3.1. Management
Every fourth person in restaurant management is a graduate of a hotel management institute. However, a bulk of them (44%) are graduates from other courses. A majority (53%) of those involved in the management of fast food restaurants are
hotel management graduates. A number of those running dhabas are graduates.
8.3.2. Kitchen
Almost 60% of those employed in restaurant kitchens are diploma holders,
predominantly from private hotel management institutes. Almost 10% of them have
attended certificate courses at the Food Craft Institutes.
While the cooks in kitchens of fast food restaurants are either hotel management
degree/ diploma holders or SSC pass, the helpers in these kitchens are mostly SSC
pass.
Café kitchens also have predominantly hotel management degree/diploma holders.
Dhaba kitchens have cooks and helpers who are either SSC pass or school drop-outs.
8.3.3. Service Only 20% of those employed in the service function of restaurants, cafes and fast
food outlets are hotel management degree/diploma holders. Approximately 75% of
them are either SSC pass or school dropouts.
All those in Dhabas’ service function are SSC pass or school dropouts.
8.3.4. Other Functions Approx 83% of people employed in other functional areas of restaurants (such as
store, delivery, security and maintenance) are SSC pass or school dropouts.
67

CHAPTER 9
PROJECTED DEMAND FOR TRAINED MANPOWER
68
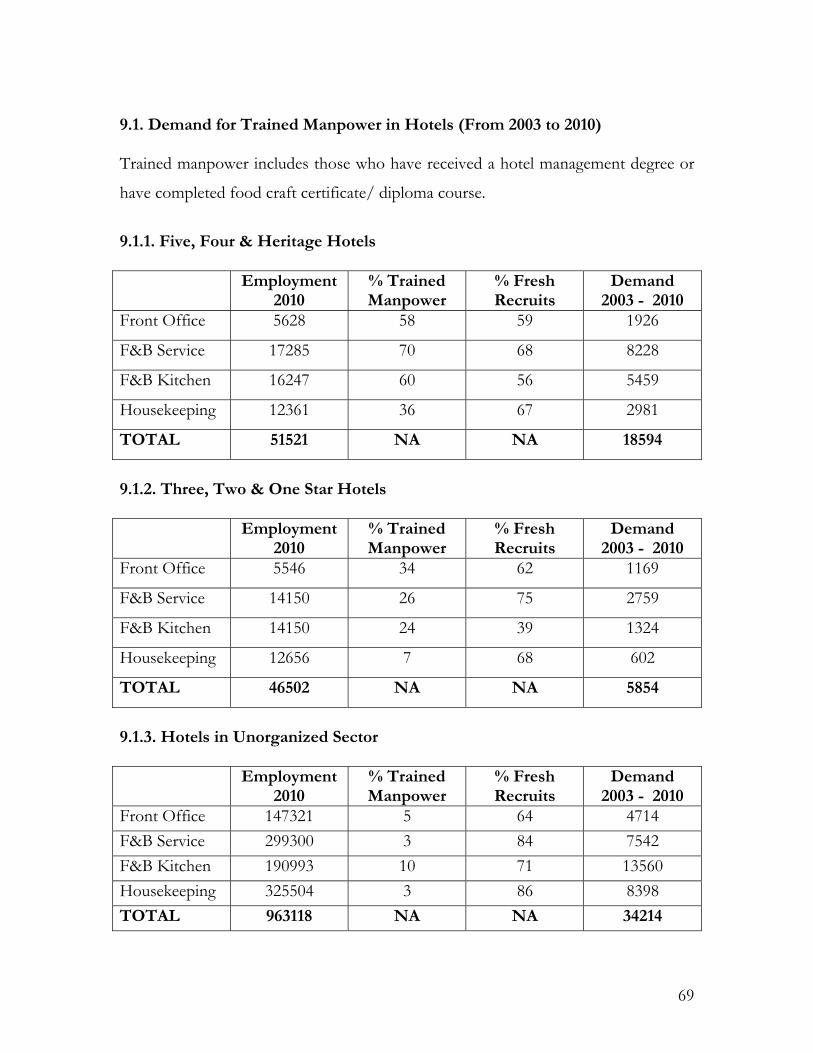
9.1. Demand for Trained Manpower in Hotels (From 2003 to 2010) Trained manpower includes those who have received a hotel management degree or
have completed food craft certificate/ diploma course.
9.1.1. Five, Four & Heritage Hotels
Employment 2010
% Trained Manpower
% Fresh Recruits
Demand 2003 - 2010
Front Office 5628 58 59 1926
F&B Service 17285 70 68 8228
F&B Kitchen 16247 60 56 5459
Housekeeping 12361 36 67 2981
TOTAL 51521 NA NA 18594
9.1.2. Three, Two & One Star Hotels
Employment 2010
% Trained Manpower
% Fresh Recruits
Demand 2003 - 2010
Front Office 5546 34 62 1169
F&B Service 14150 26 75 2759
F&B Kitchen 14150 24 39 1324
Housekeeping 12656 7 68 602
TOTAL 46502 NA NA 5854
9.1.3. Hotels in Unorganized Sector
Employment 2010
% Trained Manpower
% Fresh Recruits
Demand 2003 - 2010
Front Office 147321 5 64 4714 F&B Service 299300 3 84 7542 F&B Kitchen 190993 10 71 13560 Housekeeping 325504 3 86 8398 TOTAL 963118 NA NA 34214
69
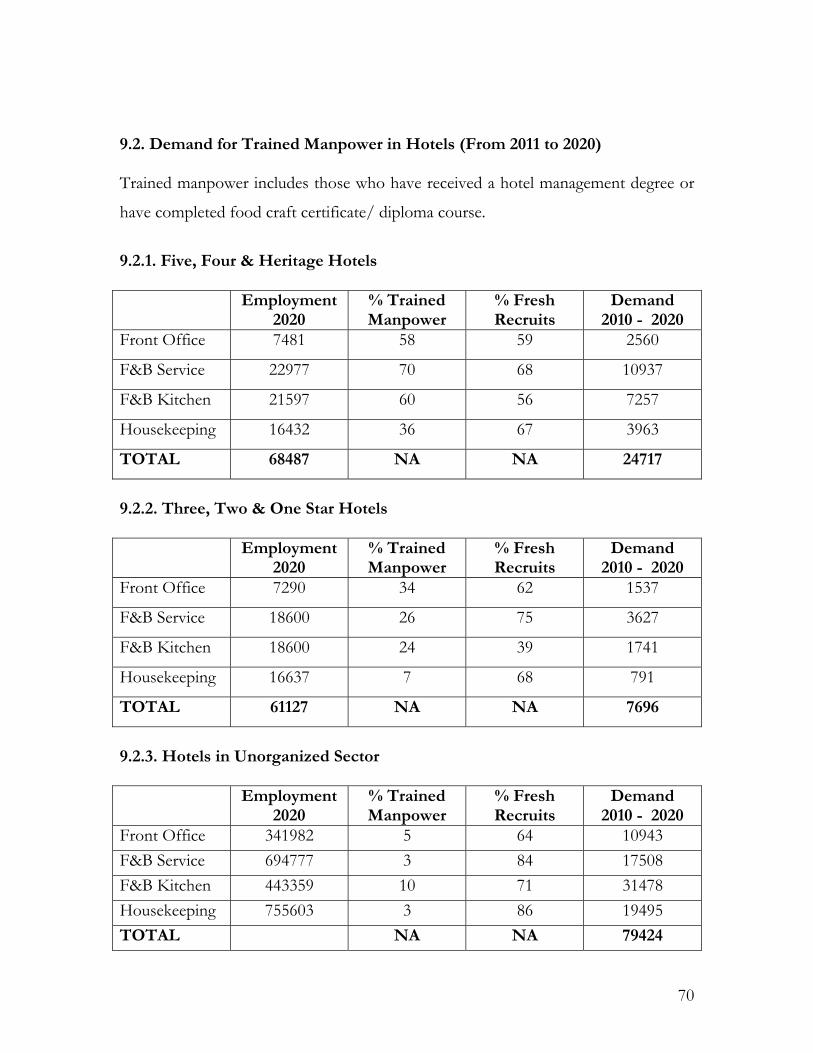
9.2. Demand for Trained Manpower in Hotels (From 2011 to 2020) Trained manpower includes those who have received a hotel management degree or
have completed food craft certificate/ diploma course.
9.2.1. Five, Four & Heritage Hotels
Employment 2020
% Trained Manpower
% Fresh Recruits
Demand 2010 - 2020
Front Office 7481 58 59 2560
F&B Service 22977 70 68 10937
F&B Kitchen 21597 60 56 7257
Housekeeping 16432 36 67 3963
TOTAL 68487 NA NA 24717
9.2.2. Three, Two & One Star Hotels
Employment 2020
% Trained Manpower
% Fresh Recruits
Demand 2010 - 2020
Front Office 7290 34 62 1537
F&B Service 18600 26 75 3627
F&B Kitchen 18600 24 39 1741
Housekeeping 16637 7 68 791
TOTAL 61127 NA NA 7696
9.2.3. Hotels in Unorganized Sector
Employment 2020
% Trained Manpower
% Fresh Recruits
Demand 2010 - 2020
Front Office 341982 5 64 10943 F&B Service 694777 3 84 17508 F&B Kitchen 443359 10 71 31478 Housekeeping 755603 3 86 19495 TOTAL NA NA 79424
70

9.3. Demand for Trained Manpower in Restaurants (From 2003 to 2010) Trained manpower includes those who have received a hotel management degree or
have completed food craft certificate/ diploma course.
9.3.1. Conventional Restaurants
Employment 2010
% Trained Manpower
% Fresh Recruits
Demand 2003 - 2010
F&B Kitchen 467249 19 68 60375
F&B Service 507467 23 71 82869
TOTAL 974716 NA NA 143244
9.3.2. Cafe
Employment 2010
% Trained Manpower
% Fresh Recruits
Demand 2003 - 2010
F&B Kitchen 189566 19 70 25212
F&B Service 159872 22 70 24620
TOTAL 349438 NA NA 49832
9.3.3. Fast Food Restaurants
Employment 2010
% Trained Manpower
% Fresh Recruits
Demand 2003 - 2010
F&B Kitchen 147692 26 70 26879
F&B Service 119581 18 70 15067
TOTAL 267273 NA NA 41946
71
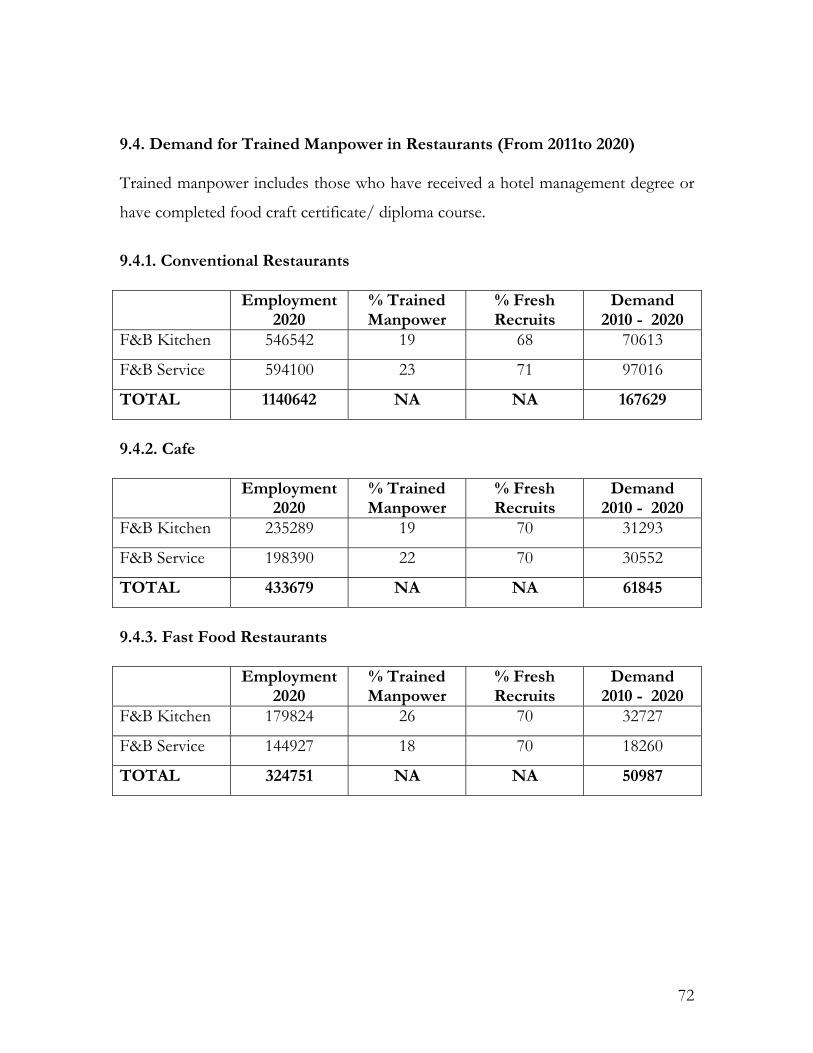
9.4. Demand for Trained Manpower in Restaurants (From 2011to 2020) Trained manpower includes those who have received a hotel management degree or
have completed food craft certificate/ diploma course.
9.4.1. Conventional Restaurants
Employment 2020
% Trained Manpower
% Fresh Recruits
Demand 2010 - 2020
F&B Kitchen 546542 19 68 70613
F&B Service 594100 23 71 97016
TOTAL 1140642 NA NA 167629
9.4.2. Cafe
Employment 2020
% Trained Manpower
% Fresh Recruits
Demand 2010 - 2020
F&B Kitchen 235289 19 70 31293
F&B Service 198390 22 70 30552
TOTAL 433679 NA NA 61845
9.4.3. Fast Food Restaurants
Employment 2020
% Trained Manpower
% Fresh Recruits
Demand 2010 - 2020
F&B Kitchen 179824 26 70 32727
F&B Service 144927 18 70 18260
TOTAL 324751 NA NA 50987
72

9.5.1 Annual Demand for Trained Manpower in Hotels Year Front
Office F&B
Service F&B
Kitchen House-keeping
TOTAL DEMAND
2003 781 1853 2034 1198 5866 2004 781 1853 2034 1198 5866 2005 781 1853 2034 1198 5866 2006 781 1853 2034 1198 5866 2007 781 1853 2034 1198 5866 2008 781 1853 2034 1198 5866 2009 781 1853 2034 1198 5866 2010 781 1853 2034 1198 5866 2011 1504 3207 4048 2425 11184 2012 1504 3207 4048 2425 11184 2013 1504 3207 4048 2425 11184 2014 1504 3207 4048 2425 11184 2015 1504 3207 4048 2425 11184 2016 1504 3207 4048 2425 11184 2017 1504 3207 4048 2425 11184 2018 1504 3207 4048 2425 11184 2019 1504 3207 4048 2425 11184 2020 1504 3207 4048 2425 11184 All the hotels including the star category, heritage and the smaller organized sector
ones have been included in the above forecast.
Contribution of employees with a food craft diploma/ certificate to total demand for
trained manpower is mentioned below.
Function % Employees with Food Craft Diploma/
Certificate
Front Office 16
F & B Service 33
F & B Kitchen 31
Housekeeping 31
73

Overall 30
74

9.5.2 Annual Demand for Trained Manpower in Restaurants
Year F&B
Kitchen F&B
Service TOTAL
DEMAND 2003 11,246 12,256 23,502 2004 11,246 12,256 23,502 2005 11,246 12,256 23,502 2006 11,246 12,256 23,502 2007 11,246 12,256 23,502 2008 11,246 12,256 23,502 2009 11,246 12,256 23,502 2010 11,246 12,256 23,502 2011 13,463 14,583 28,046 2012 13,463 14,583 28,046 2013 13,463 14,583 28,046 2014 13,463 14,583 28,046 2015 13,463 14,583 28,046 2016 13,463 14,583 28,046 2017 13,463 14,583 28,046 2018 13,463 14,583 28,046 2019 13,463 14,583 28,046 2020 13,463 14,583 28,046 Conventional restaurants, fast-food outlets and cafes have been included in the above
forecast.
Function % Employees with Food Craft Diploma/
Certificate
F & B Service 11
F & B Kitchen 6
Overall 7
75
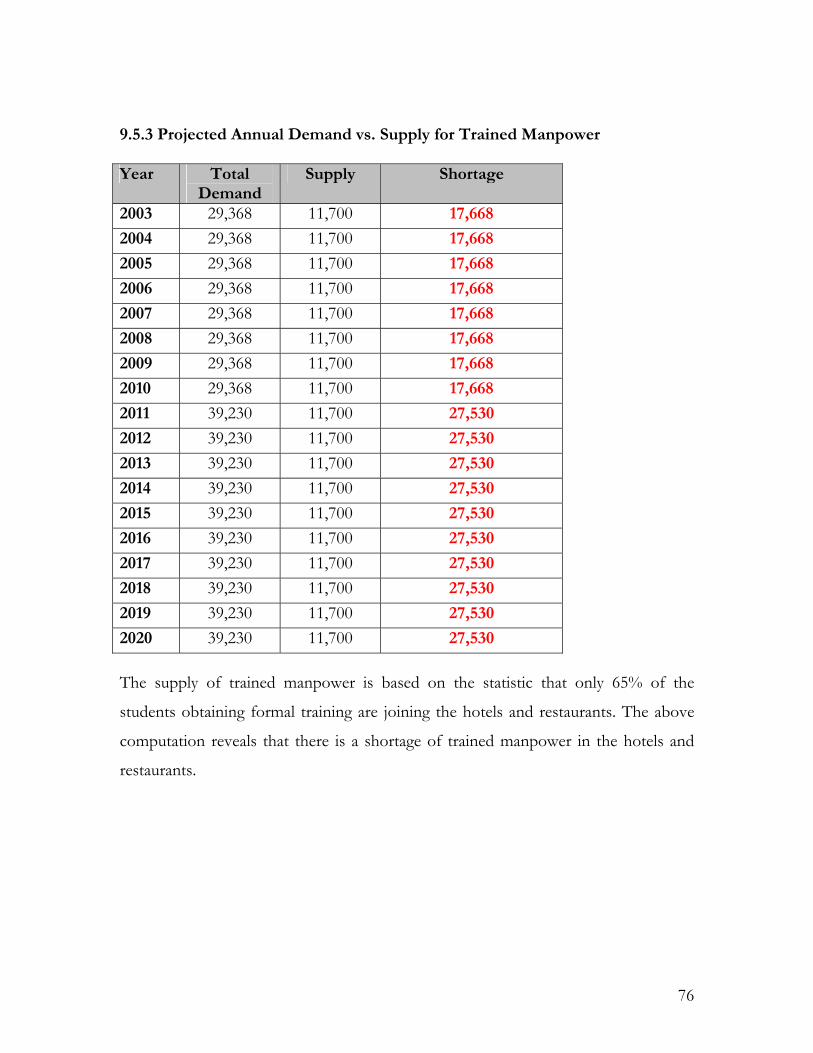
9.5.3 Projected Annual Demand vs. Supply for Trained Manpower Year Total
Demand Supply Shortage
2003 29,368 11,700 17,668
2004 29,368 11,700 17,668
2005 29,368 11,700 17,668
2006 29,368 11,700 17,668
2007 29,368 11,700 17,668
2008 29,368 11,700 17,668
2009 29,368 11,700 17,668
2010 29,368 11,700 17,668
2011 39,230 11,700 27,530
2012 39,230 11,700 27,530
2013 39,230 11,700 27,530
2014 39,230 11,700 27,530
2015 39,230 11,700 27,530
2016 39,230 11,700 27,530
2017 39,230 11,700 27,530
2018 39,230 11,700 27,530
2019 39,230 11,700 27,530
2020 39,230 11,700 27,530
The supply of trained manpower is based on the statistic that only 65% of the
students obtaining formal training are joining the hotels and restaurants. The above
computation reveals that there is a shortage of trained manpower in the hotels and
restaurants.
76
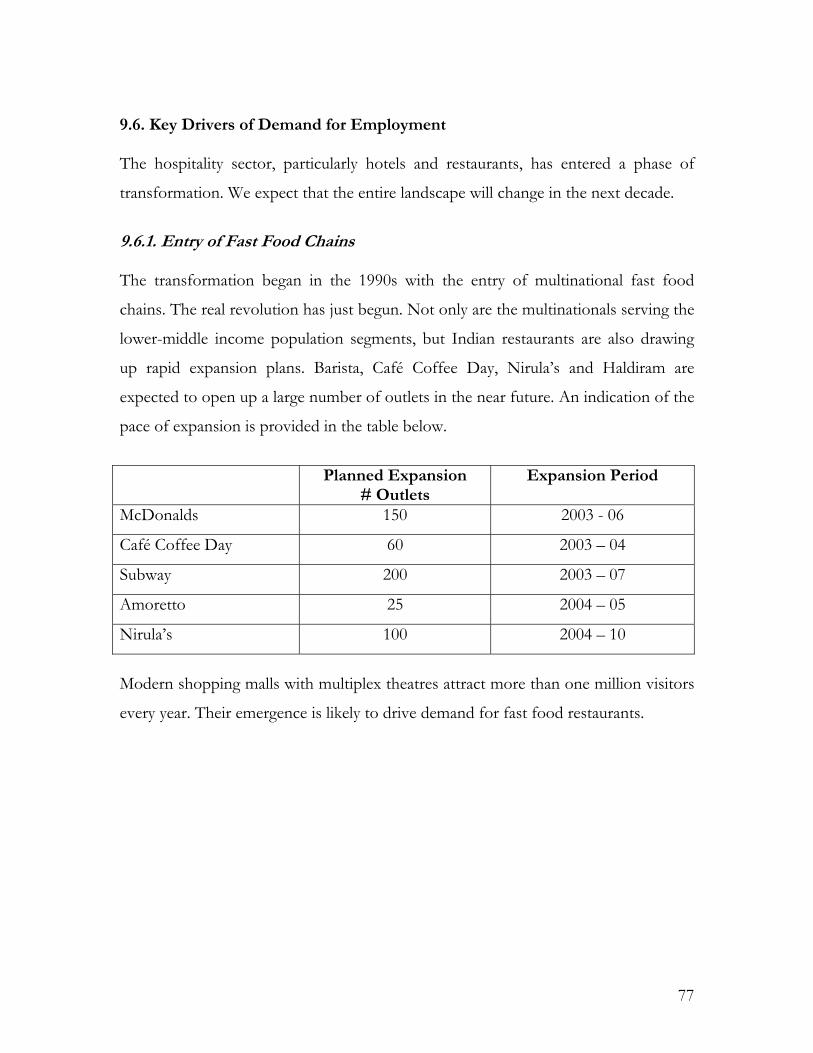
9.6. Key Drivers of Demand for Employment The hospitality sector, particularly hotels and restaurants, has entered a phase of
transformation. We expect that the entire landscape will change in the next decade.
9.6.1. Entry of Fast Food Chains The transformation began in the 1990s with the entry of multinational fast food
chains. The real revolution has just begun. Not only are the multinationals serving the
lower-middle income population segments, but Indian restaurants are also drawing
up rapid expansion plans. Barista, Café Coffee Day, Nirula’s and Haldiram are
expected to open up a large number of outlets in the near future. An indication of the
pace of expansion is provided in the table below.
Planned Expansion
# Outlets Expansion Period
McDonalds 150 2003 - 06
Café Coffee Day 60 2003 – 04
Subway 200 2003 – 07
Amoretto 25 2004 – 05
Nirula’s 100 2004 – 10
Modern shopping malls with multiplex theatres attract more than one million visitors
every year. Their emergence is likely to drive demand for fast food restaurants.
77

9.6.2. Golden Quadrilateral The creation of the golden quadrilateral of highways is likely to change the mix of
motels and restaurants in favour of the organized sector. For example, Reliance
Industries is planning to open up cafetarias with every petrol pump on the highways.
Presently, there are more than 1.4 million untrained people employed in the motels
and dhabas on highways. Even 5% of this workforce translates into a demand for
70,000 trained people.
We expect the golden quadrilateral to open up new avenues for employment in the
hotels and restaurants sector.
9.6.3. Preference for Youth in Hospitality Sector Our research reveals that both hotels and restaurants prefer to employ younger
people, particularly in F&B service. Hence, in future, this age preference will drive
demand for fresh recruits every year.
78

CHAPTER 10
TRAVEL & TOUR OPERATORS
79

Our estimate is that there are nearly 6000 travel trade companies and firms
comprising of tour operators, travel agents and tourist transporters. Approximately,
1500 are members of representative trade bodies, i.e. associations.
Trade Body Number of Members
Travel Agents Association of India TAAI 1000
Indian Association of Tour Operators IATO 855
Adventure Tour Operators Association ATOA 75
Indian Tourist Transporters Association ITTA 100
Our data reveals that the number of travel trade businesses could be increasing at an
average of 7.5% per annum.
The 27 cities covered by our primary research should account for more than 95% of
all travel trade businesses. In fact, all the TAAI members are present in these cities.
80
5840
620
17501470
2000
Total East South West North
Geographical Spread of Travel Trade Businesses
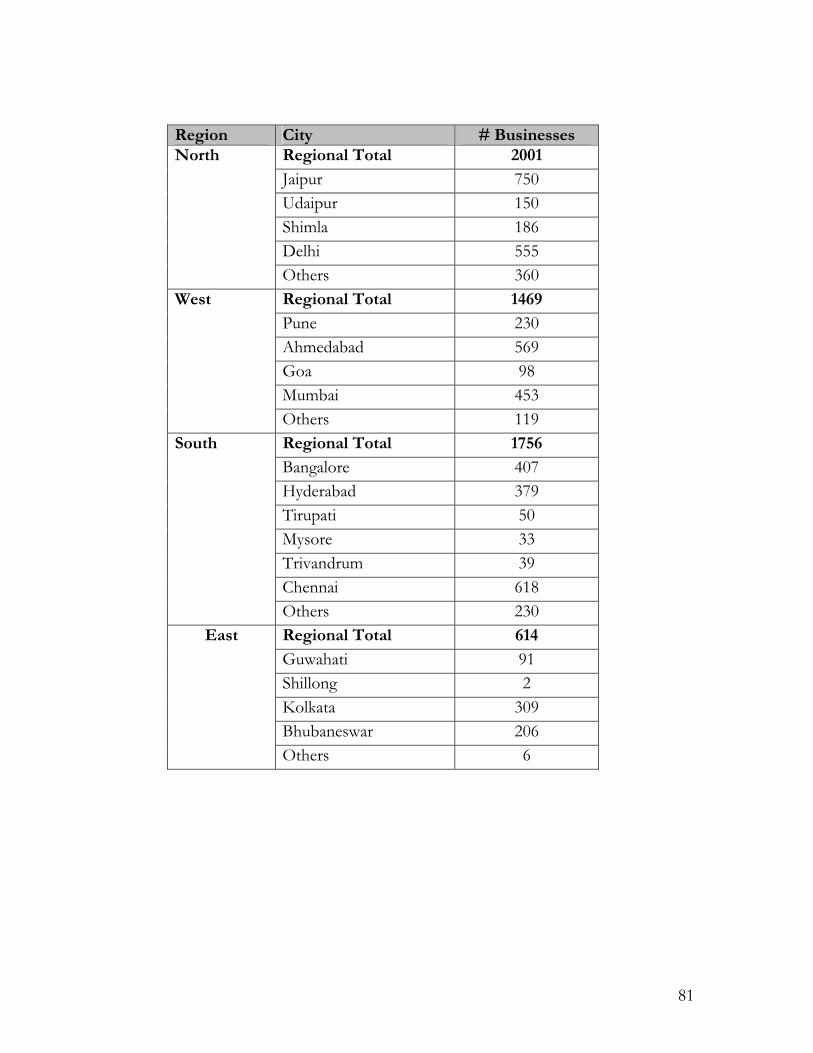
Region City # Businesses Regional Total 2001
Jaipur 750 Udaipur 150 Shimla 186 Delhi 555
North
Others 360 Regional Total 1469
Pune 230 Ahmedabad 569 Goa 98 Mumbai 453
West
Others 119 Regional Total 1756
Bangalore 407 Hyderabad 379 Tirupati 50 Mysore 33 Trivandrum 39 Chennai 618
South
Others 230 Regional Total 614
Guwahati 91 Shillong 2 Kolkata 309 Bhubaneswar 206
East
Others 6
81

10.1. Employment Pattern On an average, a travel trade business employs 14 – 15 people. The key functions
among travel agencies and tour operators are those of group tours, ticketing,
administration and accounts. These account for 55% of all the employees in this
sector. The tour section employees a substantial numbers of causal workers (to the
extent of 20%).
The employment intensity varies across different types of travel trade businesses, as indicated in the table below. Type of Travel Trade Business # Employees per 100 Companies/ Firms Travel agency that provides all services 1660 Travel agency 730 Tourist Transporter 1600 Tour Operator 1180 Overall 1430
357178208
1430
16353 81
220
Total
Operat
ions
Foreign
exch
ange
Sales
& mark
eting
Tour
Accoun
ts
Admini
strati
on
Ticketi
ng
Employment Intensity (# Employees per 100 businesses)
82

10.2. Employment Potential There are close to 83500 people working in travel trade related businesses. As indicated earlier, bulk of them are employed in the functional areas of ticketing, administration accounts, tours and operations.
Functional Area Number of Employees
Ticketing 20,850
Accounts 12,150
Tours 12,850
Administration 10,400
Operations 9,500
Sales & Marketing 4,750
Foreign Exchange 3,100 Others 9,900
Total 83,500
10.3. Employment Forecast
The travel agencies interviewed by our research staff indicated that the number of
customers in 2003 had increased by more than 15% over 2002. This represents a
robust growth in the travel agents’ business.
However, we feel that although this business will increase definitely, employment will not increase proportionately. This is because the Internet and other electronic technologies will reduce the employment intensity. An employment forecast based on a conservative growth estimate is mentioned below. Year Total Employment in Sector
2002 83,500
2010 148,500
2020 242,250
10.4. Educational Background of Key Functional Areas
10.4.1. Ticketing
83

Almost 44% of those employed in this functional area have a formal IATA/UTA
certificate or a tours & travel diploma.
One third of them are graduates while almost 14% are either SSC pass or school
drops.
10.4.2. Administration Almost 17% have an IATA/UTA certificate or a tour& travel diploma. Nearly 61%
are graduates from other disciplines. There are some post-graduates also working in
the larger travel agencies also.
10.4.3. Accounts Nearly 71% are B.Com graduates while 20% are post graduates or chartered accountants and ICWAs.
On an overall basis, 17.5% of the employees are trained travel trade personnel. 10.5. Annual Demand for Trained Manpower Year Annual Demand
2002 7,155
2010 12,735
2020 20,760
The growth in the annual demand for trained manpower can be assumed to follow a
linear trend.
84

CHAPTER 11
HOTEL MANAGEMENT INSTITUTES
85

There are a total of 175 training institutes in the area of hotel management; 50 of them are Government promoted ones (Institutes of Hotel Management and Food Crafts Institutes) while the balance are privately owned/ managed ones. South India has a significantly higher number of private training institutes. Of the 125 private sector institutes, 47 are registered with AICTE. Very few have foreign affiliation. Some of them enjoy an affiliation with the following bodies: South Asia Integrated Tourism Human Resources Development Council
The Federation of Hotel & Restaurant Association of India (FHRAI)
The Hotel & Restaurant Association (HRA)
The Indian Society for Training & Development (ISTD)
Quality circle forum of India (QCFI)
The reputed private institutes include Skyline, Asia-Pacific, Rai University, Hospitality Training Institute, Rizvi College, Empee Institute, Saptagiri college and Graduate School of Hotel Administration.
The institutes under NCHMCT follow standardized courses and curriculum
prescribed by the council for different professional programmes. They offer
certificate courses from 6 months to 3 years duration in varied subjects. These
programmes are scientifically designed and ensure the following:
A solid foundation of knowledge
Personality development
Pursuit of excellence & self discipline
Enhancement of creativity through motivation & drive
86

Region City NCHMCT
Institutes Private Institutes
Govt. approved Food Craft Institutes
9 25 9
Jaipur 1 1 Udaipur 1 Shimla 1 1 Delhi 2 10 1
North
Others 5 14 6 5 27 4
Pune 3 Ahmedabad 1 1 Goa 1 1 Mumbai 1 7 1
West
Others 2 16 2 4 47 7
Bangalore 1 10 1 Hyderabad 1 5 Tirupati 1 Mysore 1 Trivandrum 1 Chennai 1 13 1
South
Others 17 5 6 26 6
Guwahati 2 Shillong 1 Kolkata 1 5 1 Bhubaneswar 1 1 1
East
Others 3 18 4 TOTAL 24 125 26
87

A total of approximately 18000 students are being trained in hotel management and food craft annually. Almost 14000 students are graduating with a degree or a 3 years diploma in hotel management. Only 20% of them are obtaining training in hotel management from Government promoted institutes. Sector Degree/
Diploma
Subjects Studied Graduating
Class Size
3 years degree in hotel management
Hotel A/C, HRM, sales & marketing, book keeping, front office, food safety & hygiene, communication skills, food services
2483 NCHMCT
Diploma/certificate courses in various branches in Food Craft ( 6 – 12 months)
Cookery, bakery, counter services, hotel reception, book keeping, house keeping etc.,
1153
4 years degree/3 years diploma in hotel management
F&B (service & kitchen, front office and housekeeping plus few more papers put in by affiliated universities if it applies
11500
Diploma/certificate courses in various branches (6 – 24 months)
Concerned paper of specialization besides a brief note of tours basic department F&B, housekeeping & front office
2644
Private Institutes
P.G diploma in hospitality management
Front office, F&B, housekeeping, business law, French, computers etc.,
225
Food craft diploma and certificate courses account for 21% of the total supply of
trained manpower in this sector.
88
11.1. Course Content The major subjects covered in the afore-mentioned courses are as follows: Accomodation operation & management
Dietetics & hospital food service
Hotel & Catering management
Food production
F& B service
Front office
House keeping
Bakery & confectionary
11.2. Faculty Profile Faculty in both Government promoted and private sectors institutes are IHM trained with a minimum of 6 years of working experience. The students faculty ratio (as mentioned below) is more favourable in NCHMT institutes, i.e they have lesser students for each faculty member.
NCHMCT institutes – 8:1 Private institutes – 10:1
11.3. Placement Scenario The sample of 49 training institutes that responded to the survey, claimed that the entire batch of graduates was able to find placement. However, they revealed that not all from the graduating class were joining the hotel industry. An estimated 65% of them are joining the star category hotels (predominantly 4star/5star hotels) while the balance were joining the cruise liners and even call centers in the metropolitan cities. This trend has been attributed to better salary levels in the other sectors.
89

CHAPTER 12
TRAVEL & TOUR INSTITUTES
90
There are a total of 172 training institutes in the area of tour & travel management; 11 of them are Government promoted ones and 78 of them are affiliated to Universities while the balance are privately owned/ managed ones. These institutes have been established with the following objectives: To impart knowledge and skills to understand in totality the travel and tourism
and cargo industry, its inter-relationships and impacts. To provide career oriented training
To develop analytical and innovative attitudes to facilitate change and increase
the effectiveness and efficiency of the tourism industry. To impart comprehensive international travel education of the highest
standards Some of the more famous private institutes include YMCA, Trade Wings Institute of Management, Sita Academy, Institute of Tourism and Future Management. Some of the reputed government approved institutes are Indian International Trade center, Indian Institute of Management, Indian Institute of Tourism and Travel. A few universities such as Mumbai University, Delhi University, Banaras Hindu University, Bangalore University, Aligarh Muslim University and Karnataka University also offer travel and tourism courses
91

Region City Institutes
Affiliated to Universities
Other Private Institutes
Govt. Sponsored Institutes
26 20 4
Jaipur -- 2 -- Udaipur -- -- -- Shimla 1 -- -- Delhi 7 10 3
North
Others 18 8 1 23 26 3
Pune 1 1 -- Ahmedabad -- 1 -- Goa 2 2 -- Mumbai 7 7 2
West
Others 13 15 1 20 23 3
Bangalore 3 4 1 Hyderabad -- 2 1 Tirupati 1 -- -- Mysore -- -- -- Trivandrum 1 -- 1 Chennai 4 2 --
South
Others 11 15 -- 9 14 1
Guwahati 1 1 -- Shillong -- -- -- Kolkata 1 3 1 Bhubaneswar 1 1 --
East
Others 6 9 -- TOTAL 78 83 11
92

Government sponsored institutes produce only 3% of the trained manpower in the country while the private institutes account for 29%; institutes affiliated to universities account for the balance 68% of the graduating class. Sector Degree/
Diploma
Subjects Studied Graduating
Class Size
Master of Tourism Management/ Administration (MTM/MTA)
Air Cargo management, Tourism Concepts, Tourism Marketing, Foreign Language, Tourism Products, Geography & International Tourism
3588
Post Graduate Diploma in Travel Management (PGDTM)
Tourism concepts, Tourist Transport system, Travel agency management, Aviation Geography, basic air fares and ticketing, CRS & foreign language
2652
Bachelor of Tourism Administration (BTA)
Fundamentals of Tourism, Tourism geography, Travel agency management, Airline management & Ticketing & Foreign languages
3354
Universities
Tourism & Travel Management (TTM)
Tourism business, Tourism products & marketing, Travel agency management, Information, Communication & Automation
2340
The duration of the PG courses is 1 year whereas the Master courses in Travel & Tourism duration is of 2 years.
93

Sector Degree/
Diploma
Subjects Studied Graduating
Class Size
IATA/UFTAA certified courses
Air Fare & Ticketing, Geography in travel planning, Transport, Customer Service & Business environment of Travel & Tourism Industry
3320
Post Graduate Diploma in Airlines & Travel Business management
Airline & Travel marketing, Principles of Travel & Tourism, Airline & Travel Operations, Tourism Impacts
1245
Private Institutes
BBA (Tourism) Management Tourism Enterprises, Tourism Policy, Planning & Development & Marketing
581
Government approved
Post Graduate Diploma In Tourism Management (PGDTM)
Toursim concepts & Impacts, Geography & International Tourism, Tourism products of India, Transport in Travel & Tourism
550
The job opportunities open for students are in Travel Agencies, State Tourism
Development Corporations, hotels and even BPO companies catering to the travel
sector.
94

12.1. Course Content The courses include topics such as management concepts, travel & tourism marketing
and travel agency management. In addition, a module of IATA/UFTAA foundation
as well as foreign languages have been included. The popular subjects are as follows:
Tourism concept and impacts
Travel agency and tour operations
Geography and International tourism
Transport in Travel & Tourism
Management concepts & organizational behaviour
Quantitative analysis & event management
Marketing for travel & tourism
Computing & information system in tourism
French/ German and Business English
Airfares & ticketing; CRS – Computer Reservation System
Tour package operation management
Tourism policy and planning development
12.2. Faculty Profile
Faculty of these institutes have 5-7 years of experience and are IATA/UFTAA diploma holders. 12.3. Course Fee The fee of these institutes is in the range of Rs 30,000 – 60,000.
95

APPENDIX 1
96
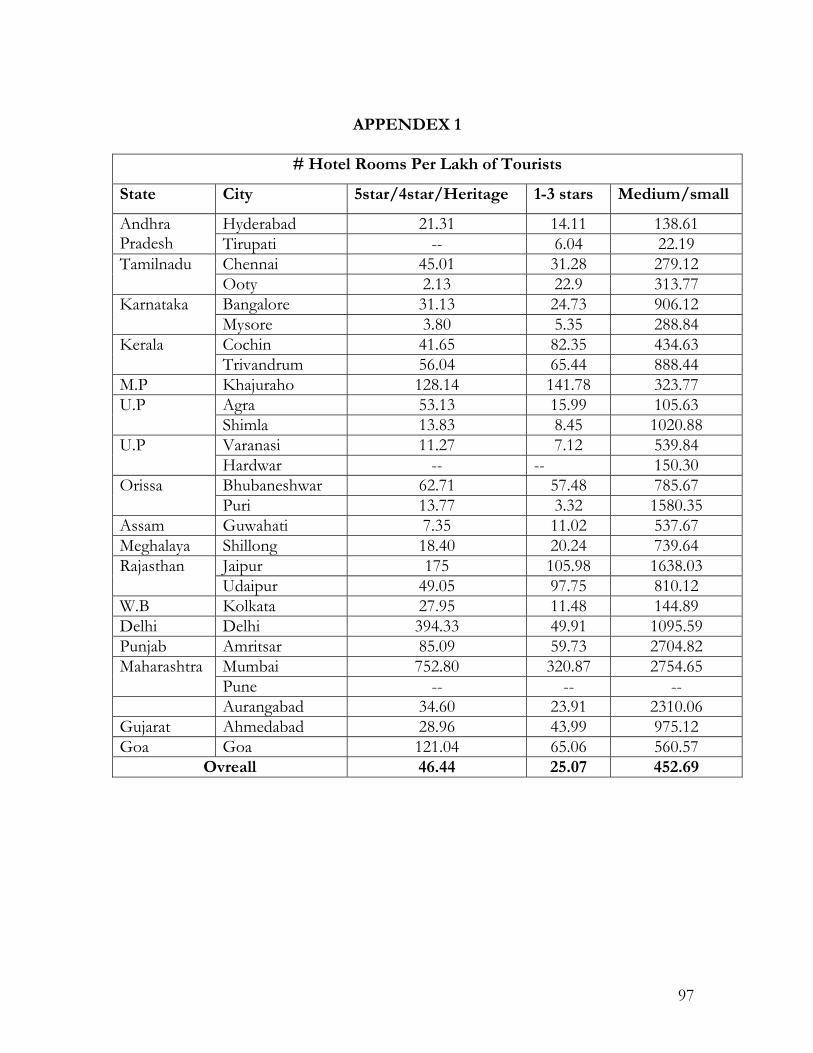
APPENDEX 1
# Hotel Rooms Per Lakh of Tourists
State City 5star/4star/Heritage 1-3 stars Medium/small
Hyderabad 21.31 14.11 138.61 Andhra Pradesh Tirupati -- 6.04 22.19
Chennai 45.01 31.28 279.12 Tamilnadu Ooty 2.13 22.9 313.77 Bangalore 31.13 24.73 906.12 Karnataka Mysore 3.80 5.35 288.84 Cochin 41.65 82.35 434.63 Kerala Trivandrum 56.04 65.44 888.44
M.P Khajuraho 128.14 141.78 323.77 Agra 53.13 15.99 105.63 U.P Shimla 13.83 8.45 1020.88 Varanasi 11.27 7.12 539.84 U.P Hardwar -- -- 150.30 Bhubaneshwar 62.71 57.48 785.67 Orissa Puri 13.77 3.32 1580.35
Assam Guwahati 7.35 11.02 537.67 Meghalaya Shillong 18.40 20.24 739.64
Jaipur 175 105.98 1638.03 Rajasthan Udaipur 49.05 97.75 810.12
W.B Kolkata 27.95 11.48 144.89 Delhi Delhi 394.33 49.91 1095.59 Punjab Amritsar 85.09 59.73 2704.82
Mumbai 752.80 320.87 2754.65 Maharashtra Pune -- -- --
Aurangabad 34.60 23.91 2310.06 Gujarat Ahmedabad 28.96 43.99 975.12 Goa Goa 121.04 65.06 560.57
Ovreall 46.44 25.07 452.69
97

5star/4star/Heritage : Employment Forecasts 2010
State Management team
Front office
F&B service
F&B kitchen
House keeping
Accounts Total
Andhra Pradesh 255 212 653 613 467 233 3136
Tamilnadu 510 425 1307 1228 935 466 6281
Karnataka 406 339 1041 979 744 371 5004
Kerala 338 282 868 815 620 309 4170
M.P 121 101 310 292 222 110 1491
U.P 472 394 1209 1137 865 431 5813
H.P 47 40 124 116 89 44 595
Orissa 83 69 213 200 153 76 1025
Assam 21 18 56 52 40 20 268
Meghalaya 6 6 18 17 13 7 87
Rajasthan 538 450 1381 1298 988 492 6639
W.B 342 285 877 824 627 312 4213
Delhi 1383 1156 3551 3338 2539 1266 17068
Uttaranchal 45 38 117 110 84 42 562
Maharashtra 1458 1218 3742 3517 2676 1334 17983
Gujarat 103 86 265 249 190 95 1274
Goa 427 358 1099 1033 786 392 5282
Punjab 137 115 353 332 252 126 1697
All India 6732 5628 17285 16247 12361 6164 83077
98
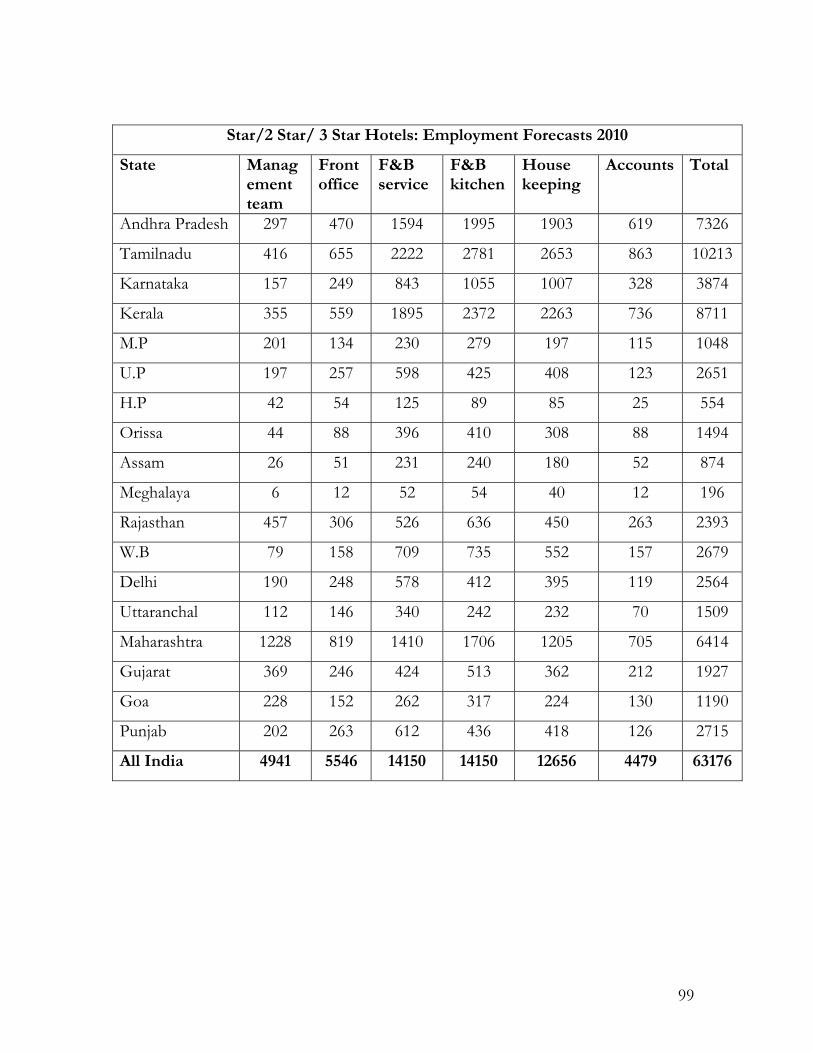
Star/2 Star/ 3 Star Hotels: Employment Forecasts 2010
State Management team
Front office
F&B service
F&B kitchen
House keeping
Accounts Total
Andhra Pradesh 297 470 1594 1995 1903 619 7326
Tamilnadu 416 655 2222 2781 2653 863 10213
Karnataka 157 249 843 1055 1007 328 3874
Kerala 355 559 1895 2372 2263 736 8711
M.P 201 134 230 279 197 115 1048
U.P 197 257 598 425 408 123 2651
H.P 42 54 125 89 85 25 554
Orissa 44 88 396 410 308 88 1494
Assam 26 51 231 240 180 52 874
Meghalaya 6 12 52 54 40 12 196
Rajasthan 457 306 526 636 450 263 2393
W.B 79 158 709 735 552 157 2679
Delhi 190 248 578 412 395 119 2564
Uttaranchal 112 146 340 242 232 70 1509
Maharashtra 1228 819 1410 1706 1205 705 6414
Gujarat 369 246 424 513 362 212 1927
Goa 228 152 262 317 224 130 1190
Punjab 202 263 612 436 418 126 2715
All India 4941 5546 14150 14150 12656 4479 63176
99

Medium & Small Hotels/Guest Houses: Employment Forecasts 2010
State Management team
Front office
F&B service
F&B kitchen
House keeping
Accounts Total
Andhra
Pradesh
4630 6209 5262 5051 14311 2631 79238
Tamilnadu 4587 6152 5213 5005 14180 2606 78513
Karnataka 2427 3255 2758 2648 7502 1379 41537
Kerala 1910 2562 2171 2084 5905 1085 32693
M.P 8332 9882 13305 8654 16017 4457 68784
U.P 63039 76793 121494 84816 146710 35531 615492
H.P 4928 6002 9496 6629 11466 2777 48105
Orissa 6965 1460 9324 5055 8538 1909 37072
Assam 2152 1369 7041 5868 6063 1956 29535
Meghalaya 377 240 1235 1029 1063 343 5179
Rajasthan 14939 17720 23858 15519 28722 7992 123343
W.B 7150 1499 9571 5189 8764 1960 38055
Delhi 1296 1578 2497 1743 3015 730 12650
Uttaranchal 2294 2793 4419 3085 5336 1292 22385
Maharashtra 6602 7829 10541 6857 12691 3531 54498
Gujarat 670 793 1068 695 1286 357 5522
Goa 1288 1526 2055 1337 2474 689 10625
Punjab 944 1150 1820 1270 2197 532 9219
All India 185753 147321 299300 190993 325504 83850 1405080
100
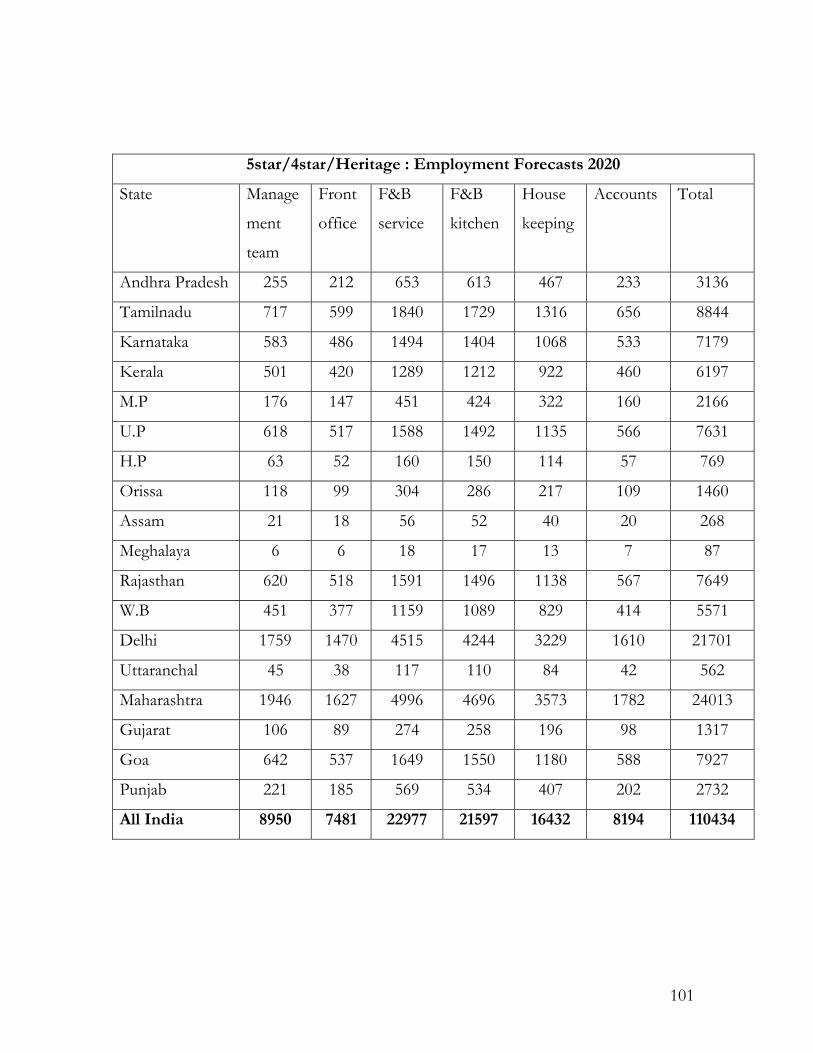
5star/4star/Heritage : Employment Forecasts 2020
State Manage
ment
team
Front
office
F&B
service
F&B
kitchen
House
keeping
Accounts Total
Andhra Pradesh 255 212 653 613 467 233 3136
Tamilnadu 717 599 1840 1729 1316 656 8844
Karnataka 583 486 1494 1404 1068 533 7179
Kerala 501 420 1289 1212 922 460 6197
M.P 176 147 451 424 322 160 2166
U.P 618 517 1588 1492 1135 566 7631
H.P 63 52 160 150 114 57 769
Orissa 118 99 304 286 217 109 1460
Assam 21 18 56 52 40 20 268
Meghalaya 6 6 18 17 13 7 87
Rajasthan 620 518 1591 1496 1138 567 7649
W.B 451 377 1159 1089 829 414 5571
Delhi 1759 1470 4515 4244 3229 1610 21701
Uttaranchal 45 38 117 110 84 42 562
Maharashtra 1946 1627 4996 4696 3573 1782 24013
Gujarat 106 89 274 1317 258 196 98
Goa 642 537 1649 1550 1180 588 7927
Punjab 221 185 569 534 407 202 2732
All India 8950 7481 22977 21597 16432 8194 110434
101

Star/2 Star/ 3 Star Hotels: Employment Forecasts 2020
State Management team
Front office
F&B service
F&B kitchen
House keeping
Accounts Total
Andhra Pradesh 356 561 1903 2382 2273 740 8749
Tamilnadu 547 863 2927 3664 3495 1137 13454
Karnataka 232 366 1240 1553 1481 482 5702
Kerala 567 894 3031 3795 3620 1177 13935
M.P 281 188 323 391 276 161 1470
U.P 203 264 614 437 419 126 2725
H.P 42 54 125 89 85 25 554
Orissa 55 110 495 513 385 110 1868
Assam 32 64 288 298 224 64 1086
Meghalaya 6 40 12 52 54 12 196
Rajasthan 516 343 591 715 506 296 2690
W.B 88 176 792 822 616 176 2994
Delhi 220 287 668 476 456 137 2963
Uttaranchal 112 146 340 242 232 70 1509
Maharashtra 1548 1032 1778 2150 1520 888 8086
Gujarat 530 353 608 736 520 304 2767
Goa 310 207 356 431 304 178 1620
Punjab 245 319 744 530 508 153 3300
All India 6496 83044 7290 18600 18600 16637 5889
102
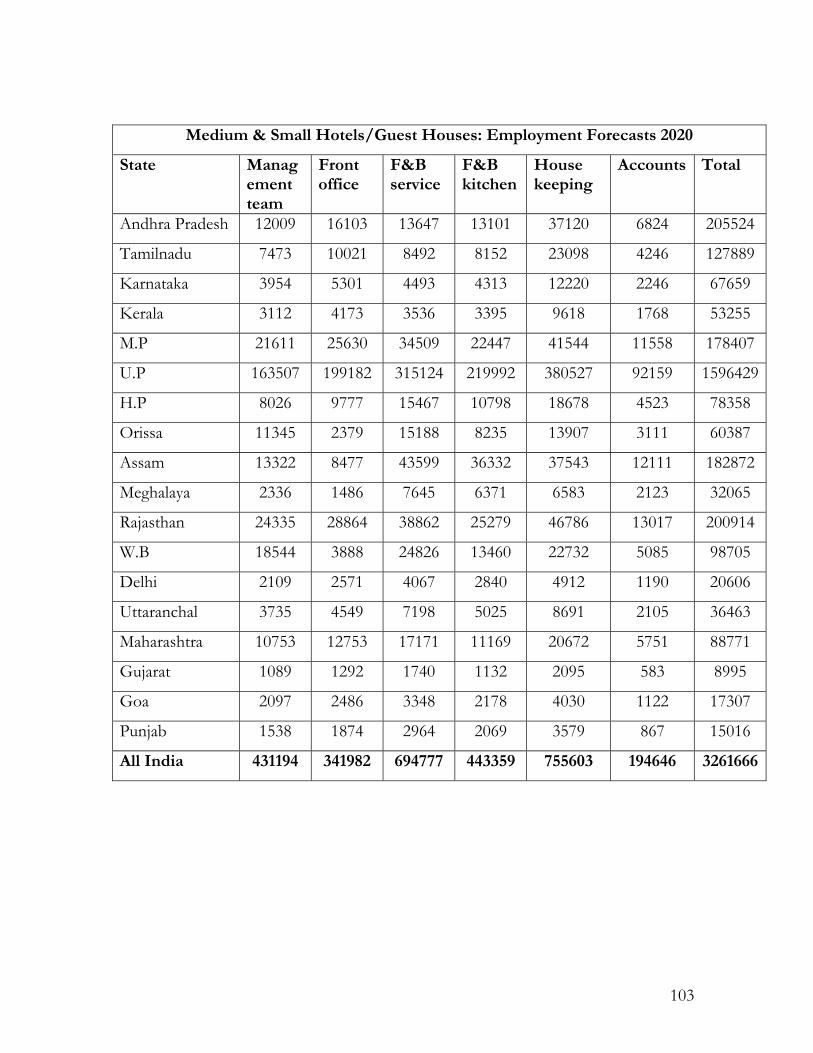
Medium & Small Hotels/Guest Houses: Employment Forecasts 2020
State Management team
Front office
F&B service
F&B kitchen
House keeping
Accounts Total
Andhra Pradesh 12009 16103 13647 13101 37120 6824 205524
Tamilnadu 7473 10021 8492 8152 23098 4246 127889
Karnataka 3954 5301 4493 4313 12220 2246 67659
Kerala 3112 4173 3536 3395 9618 1768 53255
M.P 21611 25630 34509 22447 41544 11558 178407
U.P 163507 199182 315124 219992 380527 92159 1596429
H.P 8026 9777 15467 10798 18678 4523 78358
Orissa 11345 2379 15188 8235 13907 3111 60387
Assam 13322 8477 43599 36332 37543 12111 182872
Meghalaya 2336 1486 7645 6371 6583 2123 32065
Rajasthan 24335 28864 38862 25279 46786 13017 200914
W.B 18544 3888 24826 13460 22732 5085 98705
Delhi 2109 2571 4067 2840 4912 1190 20606
Uttaranchal 3735 4549 7198 5025 8691 2105 36463
Maharashtra 10753 12753 17171 11169 20672 5751 88771
Gujarat 1089 1292 1740 1132 2095 583 8995
Goa 2097 2486 3348 2178 4030 1122 17307
Punjab 1538 1874 2964 2069 3579 867 15016
All India 431194 341982 694777 443359 755603 194646 3261666
103

APPENDIX 2
104
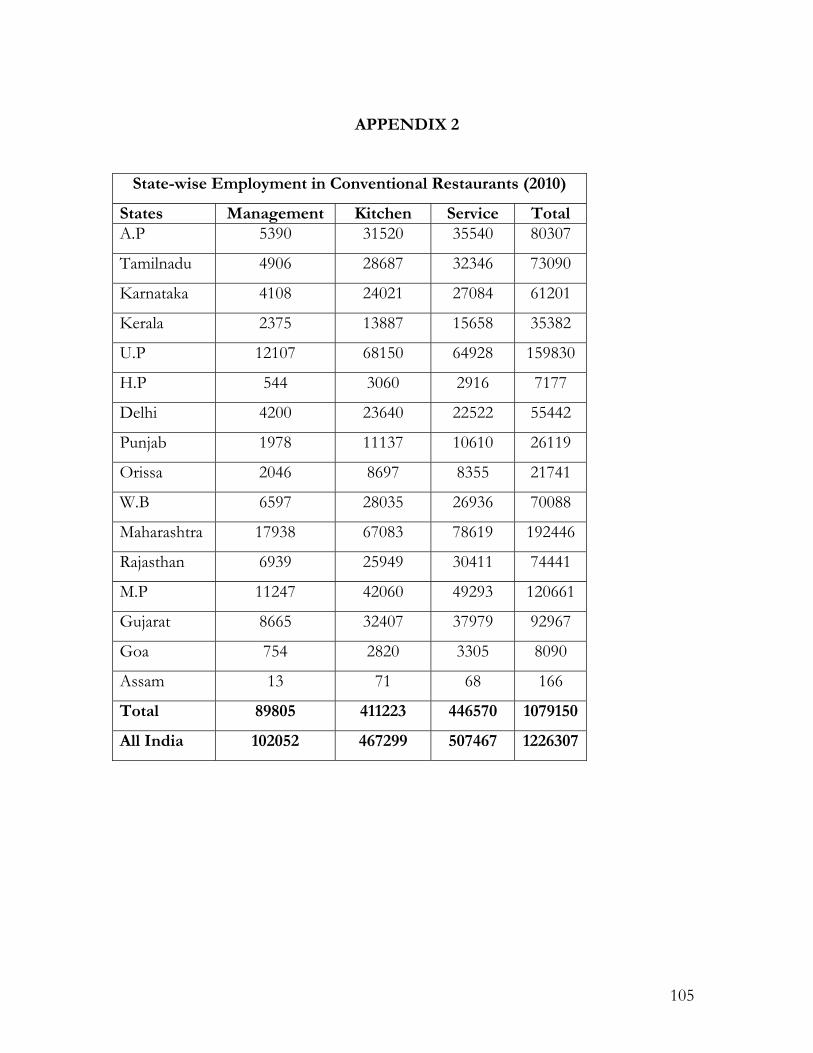
APPENDIX 2
State-wise Employment in Conventional Restaurants (2010)
States Management Kitchen Service Total A.P 5390 31520 35540 80307
Tamilnadu 4906 28687 32346 73090
Karnataka 4108 24021 27084 61201
Kerala 2375 13887 15658 35382
U.P 12107 68150 64928 159830
H.P 544 3060 2916 7177
Delhi 4200 23640 22522 55442
Punjab 1978 11137 10610 26119
Orissa 2046 8697 8355 21741
W.B 6597 28035 26936 70088
Maharashtra 17938 67083 78619 192446
Rajasthan 6939 25949 30411 74441
M.P 11247 42060 49293 120661
Gujarat 8665 32407 37979 92967
Goa 754 2820 3305 8090
Assam 13 71 68 166
Total 89805 411223 446570 1079150
All India 102052 467299 507467 1226307
105

State-wise Employment in Conventional Restaurants (2020)
States Management Kitchen Service Total A.P 6249 36539 41199 93096
Tamilnadu 5439 31804 35860 81031
Karnataka 4754 27800 31346 70831
Kerala 2737 16005 18047 40779
U.P 15969 89890 85640 210816
H.P 574 3229 3076 7572
Delhi 4845 27271 25982 63958
Punjab 407 2293 2184 5377
Orissa 2451 10416 10008 26041
W.B 7531 32007 30752 80018
Maharashtra 20608 77070 90323 221097
Rajasthan 8761 32765 38400 93997
M.P 14192 53074 62201 152257
Gujarat 10055 37605 44071 107880
Goa 830 3104 3638 8904
Assam 15 84 80 198
Total 105417 480957 522808 1263852
All India 119792 546542 594100 1436196
106

State-wise Employment in Cafe (2010)
States Management Kitchen Service Total U.P 9536 92639 77653 196176
Delhi 3309 32141 26942 68064
Punjab 1559 15141 12692 32064
H.P 429 4171 3496 8832
Assam 0 140 70 210
A.P 1025 6150 5125 13325
Tamilnadu 933 5598 4665 12129
Karnataka 781 4686 3905 10153
Kerala 452 2712 2260 5876
Maharashtra 604 1351 1524 4371
Rajasthan 235 525 592 1699
M.P 380 850 958 2748
Gujarat 293 655 739 2118
Goa 26 59 67 191
Total 19561 166818 140688 357956
All India 22229 189566 159872 406768
107
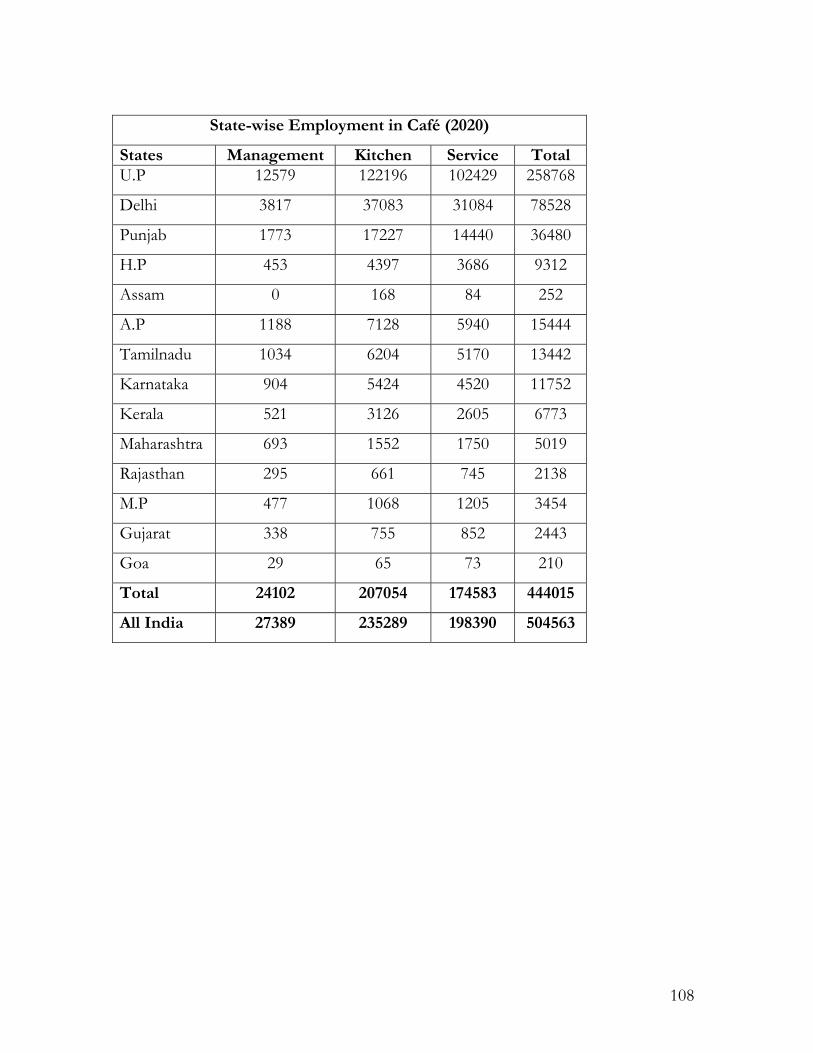
State-wise Employment in Café (2020)
States Management Kitchen Service Total U.P 12579 122196 102429 258768
Delhi 3817 37083 31084 78528
Punjab 1773 17227 14440 36480
H.P 453 4397 3686 9312
Assam 0 168 84 252
A.P 1188 7128 5940 15444
Tamilnadu 1034 6204 5170 13442
Karnataka 904 5424 4520 11752
Kerala 521 3126 2605 6773
Maharashtra 693 1552 1750 5019
Rajasthan 295 661 745 2138
M.P 477 1068 1205 3454
Gujarat 338 755 852 2443
Goa 29 65 73 210
Total 24102 207054 174583 444015
All India 27389 235289 198390 504563
108

State-wise Employment in Fast Food (2010)
States Management Kitchen Service Total Orissa 677 1353 3609 6766
WB 2182 4363 11636 21817
U.P 16229 45982 32458 110897
Delhi 5628 15945 11255 38455
Punjab 2650 7509 5301 18110
H.P 730 2068 1460 4987
A.P 1563 7294 4168 14849
Tamilnadu 1422 6636 3792 13509
Karnataka 1191 5558 3176 11315
Kerala 689 3213 1836 6541
Maharashtra 5127 11832 10452 41806
Rajasthan 1984 4578 4044 16176
M.P 3216 7422 6556 26224
Gujarat 2478 5718 5051 20204
Goa 216 498 440 1760
Total 45980 1299969 105232 353415
All India 52250 147692 119582 401608
109
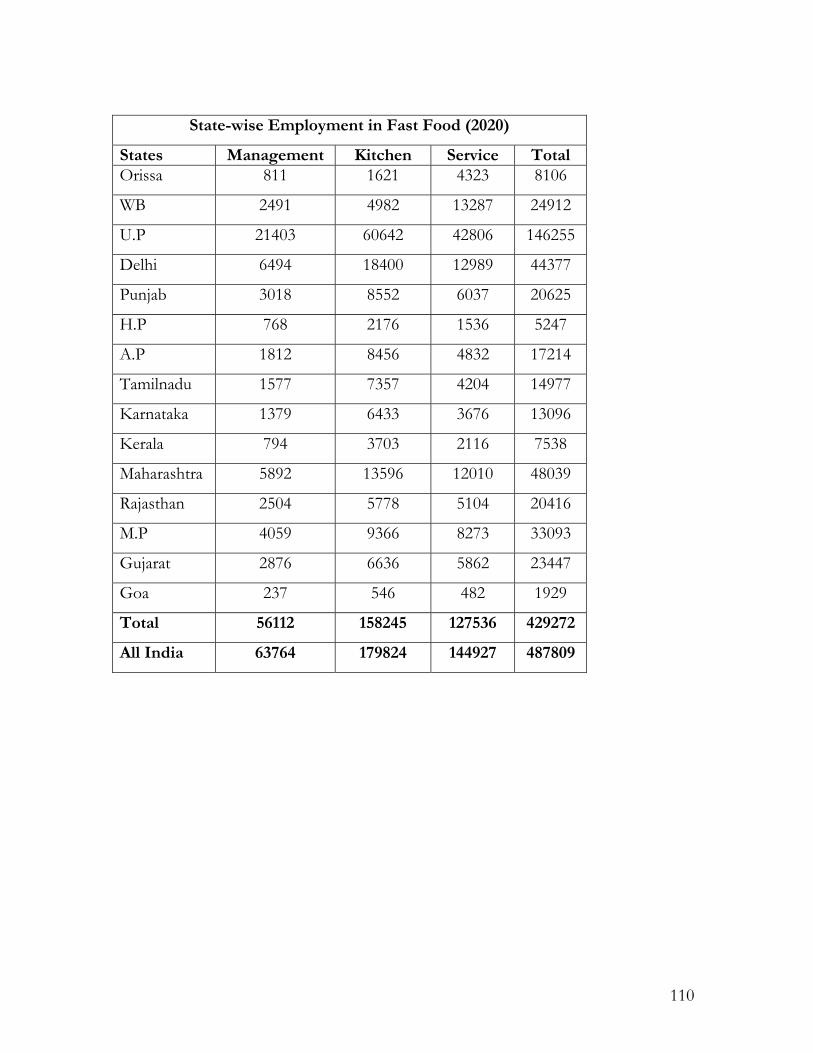
State-wise Employment in Fast Food (2020)
States Management Kitchen Service Total Orissa 811 1621 4323 8106
WB 2491 4982 13287 24912
U.P 21403 60642 42806 146255
Delhi 6494 18400 12989 44377
Punjab 3018 8552 6037 20625
H.P 768 2176 1536 5247
A.P 1812 8456 4832 17214
Tamilnadu 1577 7357 4204 14977
Karnataka 1379 6433 3676 13096
Kerala 794 3703 2116 7538
Maharashtra 5892 13596 12010 48039
Rajasthan 2504 5778 5104 20416
M.P 4059 9366 8273 33093
Gujarat 2876 6636 5862 23447
Goa 237 482 1929 546
Total 56112 127536 158245 429272
All India 63764 179824 144927 487809
110

State-wise Employment in Dhaba (2010)
States Management Kitchen Service Total A.P 1107 7475 7475 16195
Tamilnadu 1009 6808 6808 14751
Karnataka 844 5697 5697 12343
Kerala 488 3296 3296 7141
U.P 5231 25281 24410 59281
Delhi 1814 8770 8467 20564
Punjab 854 4130 3987 9684
H.P 235 1138 1099 2668
Orissa 428 886 1176 2551
W.B 1379 2857 3793 8227
Maharashtra 3284 11493 11310 27181
Rajasthan 1271 4447 4377 10518
M.P 2058 7205 7090 17040
Gujarat 1587 5553 5465 13134
Goa 138 483 475 1142
Assam 1054 62 434 558
Total 21790 95953 95484 223474
All India 24761 109037 108504 253947
111
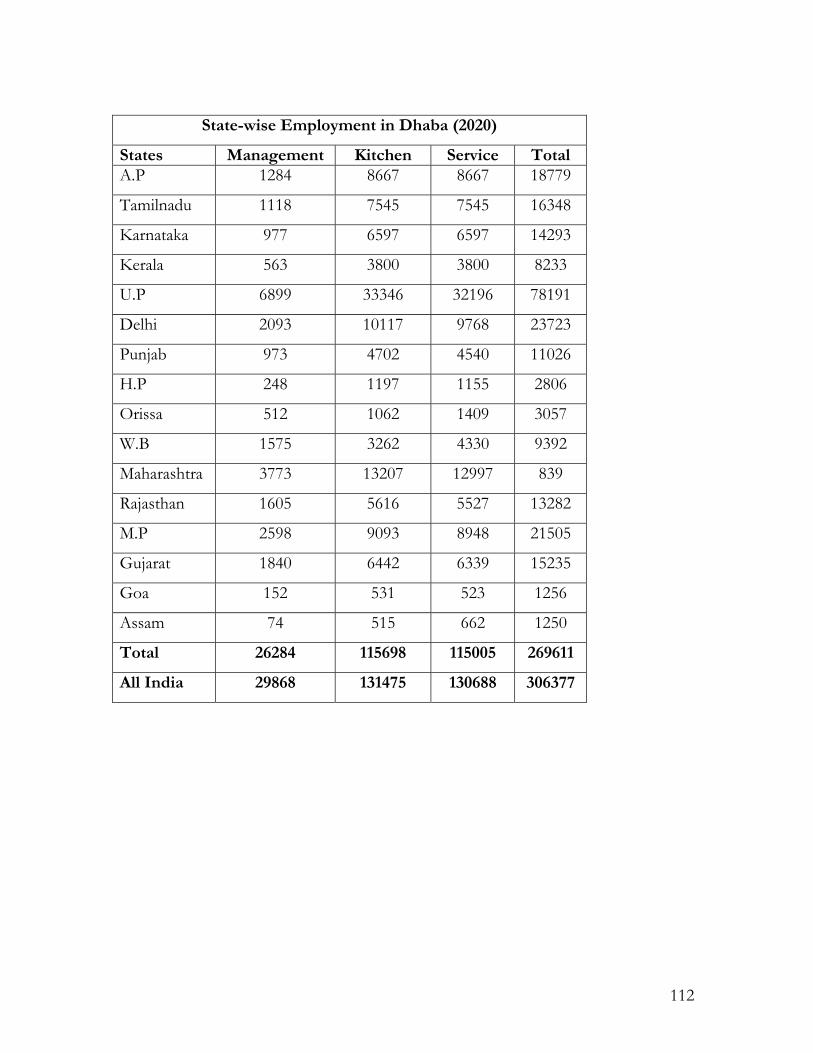
State-wise Employment in Dhaba (2020)
States Management Kitchen Service Total A.P 1284 8667 8667 18779
Tamilnadu 1118 7545 7545 16348
Karnataka 977 6597 6597 14293
Kerala 563 3800 3800 8233
U.P 6899 33346 32196 78191
Delhi 2093 10117 9768 23723
Punjab 973 4702 4540 11026
H.P 248 1197 1155 2806
Orissa 512 1062 1409 3057
W.B 1575 4330 3262 9392
Maharashtra 3773 13207 12997 839
Rajasthan 1605 5616 5527 13282
M.P 2598 9093 8948 21505
Gujarat 1840 6442 6339 15235
Goa 152 531 1256 523
Assam 74 515 1250 662
Total 26284 115698 115005 269611
All India 29868 131475 130688 306377
112

APPENDIX 3
113

HOTELS MR/MOT/31
Good morning/ afternoon. I am ______ from Market Pulse, a reputed marketing research company. We are currently carrying out a study to determine the manpower potential of the hotels and restaurants sector. Our company has been retained by Ministry of Tourism to carry out this study. I would be grateful if you could spend some of your valuable time. This feedback will take 15 – 20 minutes. 1. Number of Employees
1.3. Recruitment of fresh graduates & others with no prior work experience
1.1. We would like to know how many permanent employees are employed in
different departments of your hotel. I am going to read out the departments one by one. Please tell me how many people are employed in… READ OUT DEPARTMENTS ONE BY ONE
1.2. Now, please tell us about the number of casual or temporary employees
whom you hire every year in … READ OUT DEPARTMENTS ONE BY ONE.
1.3. Now tell me how many fresh graduates and others with no prior work experience in … READ OUT DEPARTMENTS ONE BY ONE
1.1. Number of Permanent employees
1.2. Number of casual or temporary employees
Departments
2003 2002 2003 2002 2003 2002 Management
Team
Front Office
F & B (Service)
F & B (Kitchen)
House Keeping
Accounts
EDP
Security
114

Sales &
Marketing
Purchase &
Stores
Human
Resource
Public Relation
Engineering
Telephone
Health Club
Laundry
Total 2. Which is the peak season for tourism in your city? And when you have to
hire casual or temporary employees? 3. DEPARTMENT DETAILS Now I would like to know more about some specific departments such as F&B, front office and housekeeping. 3.1. Of the total workforce in the front office, please tell me how many managers are there. How many supervisors are there? How many front office assistants are there?
Number of Managers:
Number of Supervisors:
Number of Office Assistants:
3.2. Of the total workforce in F&B service, please tell me how many captains are there? How many stewards are there? How many waiters are there?
115

Number of Managers:
Number of Captains:
Number of Stewards:
Number of Waiters:
3.3. Of the total workforce in the kitchen, please tell me how many chefs are there in your hotel’s kitchen and production? How many cooks are there? How many helpers are there?
Number of Chefs:
Number of Cooks:
Number of Helpers:
3.4. Of the total workforce in housekeeping, please tell me how many managers are there? How many room supervisors are there? How many attendants are there? How many house-men are there?
Number of Managers
Number of Supervisors:
Number of Room attendants:
Number of House-men:
3. Required Qualification for Different Departments & Functions We would like to know the qualifications that your hotel looks for, when recruiting for … READ OUT DEPARTMENTS ONE BY ONE
116

Department Academic qualification
Management Team: Managers
Supervisors
Front Office:
Office
Assistants
Managers
Captains
Stewards
F & B (Service)
Waiters
Chefs
Cooks
F & B (Kitchen)
Helpers
Managers
House Keeping:
Supervisors
117

Office Assistants
Department Academic qualification
Accounts:
EDP:
Security:
Sales & Marketing:
Purchase:
Human Resource:
Public Relation:
Engineering:
Telephone:
Health Club:
Laundry:
Any Other
118

HOTELS MR/MOT/31
Good morning/ afternoon. I am ______ from Market Pulse, a reputed marketing research company. We are currently carrying out a study to determine the manpower potential of the hotels and restaurants sector. Our company has been retained by Ministry of Tourism to carry out this study. I would be grateful if you could spend some of your valuable time. This feedback will take 15 – 20 minutes. 1. Number of Employees 3.1. We would like to know how many permanent employees are employed in
different departments of your hotel. I am going to read out the departments one by one. Please tell me how many people are employed in… READ OUT DEPARTMENTS ONE BY ONE
3.2. Now, please tell us how many of these are in the age group of ‘Less than 30
years/ 30 – 40 years/ 41 – 50 years/ Above 50 years’ in … ASK FOR EACH DEAPRTMENT
3.3. Now tell me what the retiring age is in … ASK FOR EACH
DEAPRTMENT.
119

1.2. Number of employees Age-wise (years)
Departments 1.1. Number of employees
<=30 31 – 40
41 – 50
>50
1.3. Retiring Age (years)
Management
Team
Front Office
F & B (Service)
F & B
(Kitchen)
House Keeping
Accounts
EDP
Security
Sales &
Marketing
Purchase &
Stores
Human
Resource
Public Relation
Engineering
Telephone
Health Club
Laundry
Total
120

Name of hotel: Ownership: [1] Partnership [2] Proprietorship [4] Private limited [5] Public limited [6] Government owned Hotel Category: [1] __ Star [2] Heritage [3] Guest house/ inn
[4] Motel [5] Resort [6] Any other ________________
Air-conditioning: [1] Yes [2] Partly [3] No Number of rooms: ___________________ Credit card acceptance: [1] Yes [2] No Hotel Association Membership: ___________ ___________ ___________ _________ _________ # Restaurants: _______ Bar: [1] Yes [2] No Banquet facilities: [1] Yes _____ [2] No
City: State: Type of city: [1] Business Centre [2] Pilgrimage [3] Historical Value [4] Hill Station [5] Beach [6] National Park [8] Any other ___________________ Year of Inception: Name and Designation of the person contacted:
121
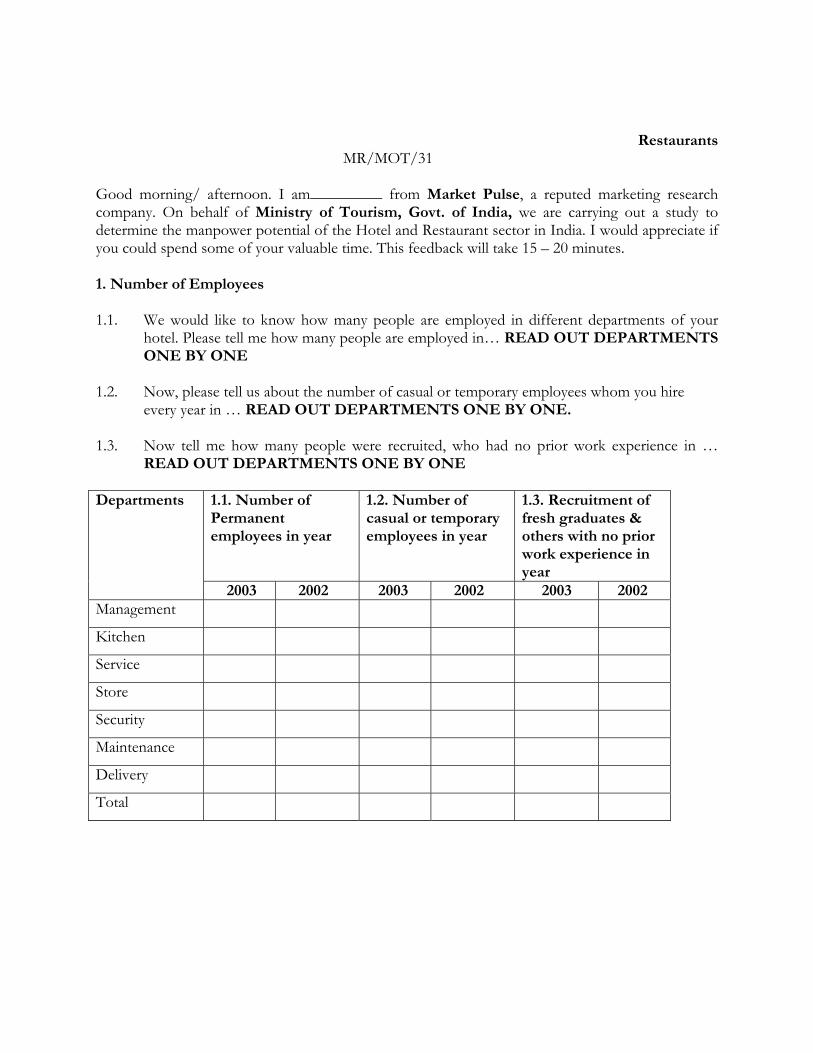
Restaurants MR/MOT/31 Good morning/ afternoon. I am_________ from Market Pulse, a reputed marketing research company. On behalf of Ministry of Tourism, Govt. of India, we are carrying out a study to determine the manpower potential of the Hotel and Restaurant sector in India. I would appreciate if you could spend some of your valuable time. This feedback will take 15 – 20 minutes. 1. Number of Employees 1.1. We would like to know how many people are employed in different departments of your
hotel. Please tell me how many people are employed in… READ OUT DEPARTMENTS ONE BY ONE
1.2. Now, please tell us about the number of casual or temporary employees whom you hire
every year in … READ OUT DEPARTMENTS ONE BY ONE. 1.3. Now tell me how many people were recruited, who had no prior work experience in …
READ OUT DEPARTMENTS ONE BY ONE
1.1. Number of Permanent employees in year
1.2. Number of casual or temporary employees in year
1.3. Recruitment of fresh graduates & others with no prior work experience in year
Departments
2003 2002 2003 2002 2003 2002 Management
Kitchen
Service
Store
Security
Maintenance
Delivery
Total
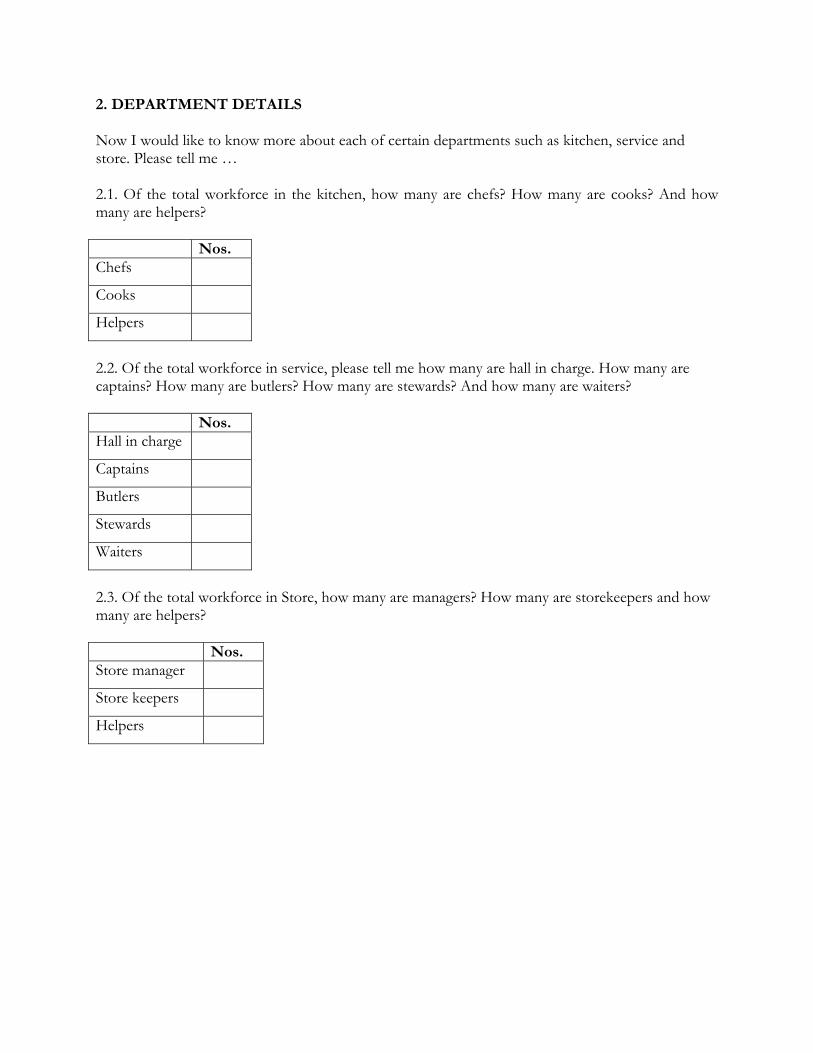
2. DEPARTMENT DETAILS Now I would like to know more about each of certain departments such as kitchen, service and store. Please tell me … 2.1. Of the total workforce in the kitchen, how many are chefs? How many are cooks? And how many are helpers? Nos. Chefs
Cooks
Helpers
2.2. Of the total workforce in service, please tell me how many are hall in charge. How many are captains? How many are butlers? How many are stewards? And how many are waiters? Nos. Hall in charge
Captains
Butlers
Stewards
Waiters
2.3. Of the total workforce in Store, how many are managers? How many are storekeepers and how many are helpers? Nos. Store manager
Store keepers
Helpers

3. Required Qualification for Different Departments & Functions We would like to know the qualifications that your hotel looks for, when recruiting for … READ OUT ONE BY ONE Departments
Academic qualification
Management
Kitchen Chef
Cook
Helper
Service Hall in charge
Captain
Butler
Stewards
Waiters
Store Store manager
Storekeeper
Helper
Security
Maintenance
Delivery
Employees on Contract Basis

Restaurant Name: City: State: Ownership: [1] Partnership [2] Proprietorship [3] Private limited [4] Public limited [5] Government owned Restaurant Category: [1] Oriental [2] Mughlai [3] Fast Food
[4] Multi Cuisine [5] South Indian [6] Specialty [7] Any other ___________________ Air-conditioning: [1] Yes [2] No Seating capacity: ___________________ Credit card acceptance: [1] Yes [2] No Association Membership: ___________ ___________ ___________ _________ Liquor Served: [1] Yes [2] No Banquet facilities: [1] Yes _____ [2] No
Facilities: [1] Free Home Delivery [2] Any Other facility (please specify) Date of inception of the restaurant: Any future expansion plan (please specify): Name and Designation of the person contacted:

Restaurants MR/MOT/31 Good morning/ afternoon. I am_________ from Market Pulse, a reputed marketing research company. On behalf of Ministry of Tourism, Govt. of India, we are carrying out a study to determine the manpower potential of the Hotel and Restaurant sector in India. I would appreciate if you could spend some of your valuable time. This feedback will take 15 – 20 minutes. 1. Number of Employees 1.4. We would like to know how many permanent employees are employed in different
departments of your hotel. I am going to read out the departments one by one. Please tell me how many people are employed in… READ OUT DEPARTMENTS ONE BY ONE
1.5. Now, please tell us how many of these are in the age group of ‘Less than 30 years/ 30 – 40
years/ 41 – 50 years/ Above 50 years’ in … ASK FOR EACH DEAPRTMENT 1.6. Now tell me what the retiring age is in … ASK FOR EACH DEAPRTMENT.
1.2. Number of employees in age group (years)
Departments 1.1. Number of employees
<=30 31 – 40 41 – 50 >50
1.3. Retiring Age (years)
Management
Kitchen
Service
Store
Security
Maintenance
Delivery
Total
Restaurant Name: City: State: Air-conditioning: [1] Yes [2] No Seating capacity:__________ Date of inception of the restaurant: Name and Designation of the person contacted:


TOUR & TRAVEL OPERATORS
MR/MOT/31 Good morning/ afternoon. I am ______ from Market Pulse, a reputed marketing research company. We are currently carrying out a study to determine the manpower potential of the hotels, restaurants and tour & travel sector. Our company has been retained by Ministry of Tourism, Govt. of India to carry out this study. I would be grateful if you could spend some of your valuable time. This feedback session will take 15 – 20 minutes. Please tell us the business areas that your company operates in.
[1] Travel Agency [2] Tour Operator [3] Adventure Tour Operator
[4] Tourist Transport Operator [5] If any other, please specify________ 1. Number of Employees: 1.1. We would like to know how many permanent employees are employed in different
departments of your company. I am going to read out the departments one by one. Please tell me how many people are employed in… READ OUT DEPARTMENTS ONE BY ONE
1.2. Now, please tell us about the number of casual or temporary employees whom you hire
every year in … READ OUT DEPARTMENTS ONE BY ONE. 1.3. Now tell me how many fresh graduates and others with no prior work experience in …
READ OUT DEPARTMENTS ONE BY ONE
1.1. Number of Permanent employees
1.2. Number of casual or temporary employees
1.3. Recruitment of fresh graduates & others with no prior work experience
Departments
2003 2002 2003 2002 2003 2002 Administration
Ticketing
Foreign Exchange
Tours
Sale & Marketing
Accounts
Total
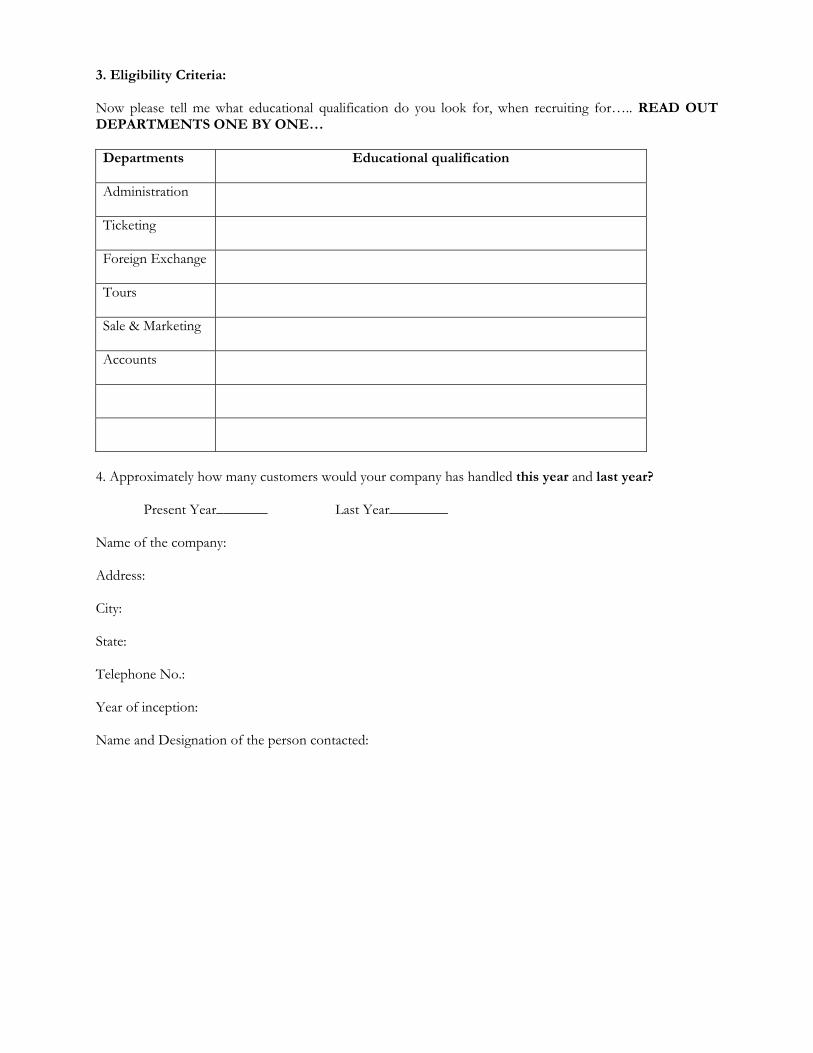
3. Eligibility Criteria: Now please tell me what educational qualification do you look for, when recruiting for….. READ OUT DEPARTMENTS ONE BY ONE… Departments
Educational qualification
Administration
Ticketing
Foreign Exchange
Tours
Sale & Marketing
Accounts
4. Approximately how many customers would your company has handled this year and last year? Present Year_______ Last Year________ Name of the company: Address: City: State: Telephone No.: Year of inception: Name and Designation of the person contacted:
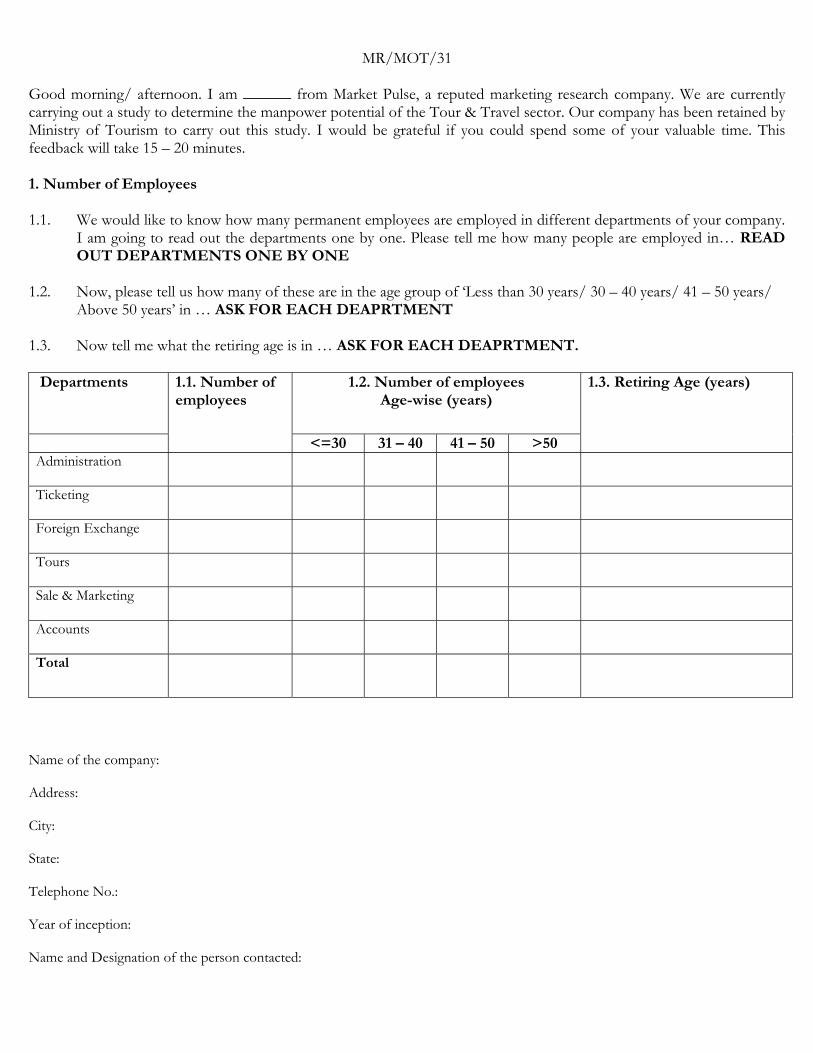
MR/MOT/31
Good morning/ afternoon. I am ______ from Market Pulse, a reputed marketing research company. We are currently carrying out a study to determine the manpower potential of the Tour & Travel sector. Our company has been retained by Ministry of Tourism to carry out this study. I would be grateful if you could spend some of your valuable time. This feedback will take 15 – 20 minutes. 1. Number of Employees 1.1. We would like to know how many permanent employees are employed in different departments of your company.
I am going to read out the departments one by one. Please tell me how many people are employed in… READ OUT DEPARTMENTS ONE BY ONE
1.2. Now, please tell us how many of these are in the age group of ‘Less than 30 years/ 30 – 40 years/ 41 – 50 years/
Above 50 years’ in … ASK FOR EACH DEAPRTMENT 1.3. Now tell me what the retiring age is in … ASK FOR EACH DEAPRTMENT. Departments 1.2. Number of employees
Age-wise (years)
1.1. Number of employees
<=30 31 – 40 41 – 50 >50
1.3. Retiring Age (years)
Administration
Ticketing
Foreign Exchange
Tours
Sale & Marketing
Accounts
Total
Name of the company: Address: City: State: Telephone No.: Year of inception: Name and Designation of the person contacted:

INSTITUTES
MR/MoT/31 Good morning/ afternoon. I am ______ from Market Pulse, a reputed marketing research company. We are currently carrying out a study to determine the manpower potential of the Hotels and Restaurants sector. Our company has been retained by Ministry of Tourism, Govt. of India to carry out this study. I would appreciate if you could spend some of your valuable time. This feedback will take 10 – 15 minutes. Courses: Ser. No. Name of degree/diploma Subjects Studied
New Degree/Diploma/Courses planned in future: - Any future expansion plan (In terms of opening new institutes or increasing the total size of the students): - Total number of faculty: Profile of faculty: Number of students graduating per year (specific number)
Year Course 1 Course 2 Course 3 Course 4 Total 2003 2002 2001 2000 1999
Name of the Institute: Address: City: State: Telephone No.: Name & Designation of the person contacted: -