Managing Port Safety and Security Risk Using Dynamic
Simulation
Jason R. W. MerrickVirginia Commonwealth University
Jack Harrald, J. Rene van DorpThe George Washington University

Merrick, Harrald, van Dorp (GWU) June 25, 2003 2
Thesis Statement
• Risk interventions are the tool for making ports safer.– Historically aimed at oil spills.– Later efforts aimed at passenger safety.– Now we must turn our efforts to security.
• Risk management must be sustainable– Ensuring the ongoing economic viability of a
port or waterway• Port must be considered as a system

Merrick, Harrald, van Dorp (GWU) June 25, 2003 3
Research in a Nutshell
• “One of the ironies of globalization is that, besides being a potential motivation of attacking America, growing global trade may also provide the delivery mechanism for a devastating attack on the U.S.” [USCG Commandant James Loy (retired)]
• Research objectives:– Enable decision-makers to manage security and safety in an
economically sustainable manner– Simulation models show systemic effects of proposed
interventions– In a data-sparse environment, eliciting the knowledge of experts
is critical to meaningful decision making

Merrick, Harrald, van Dorp (GWU) June 25, 2003 4
Previous Work
• Prince William Sound Risk Assessment– Site of the Exxon Valdez
Disaster– Model used system
simulation, data analysis and expert judgment
– Capable of modeling systemic effects of proposed interventions
– Multi-million dollar investments made to reduce risk of further oil spills

Merrick, Harrald, van Dorp (GWU) June 25, 2003 5
Previous Work
• Washington State Ferries Risk Assessment– Largest ferry system in the
United States– Simulation/expert
judgment model improved based on NRC review of PWS study
– Legislature approved funding of Safety Management System, training and emergency preparedness exercises
-20% -15% -10% -5% 0% 5% 10%
ISM Fleet Wide
Implement all Mechanical FailureReduction Measures Fleet Wide
Implement High Speed Ferry Rulesand Procedures
Impliment Visibility Restrictions
Implement Traffic Separation forHigh Speed Ferries
Implement Traffic Control for DeepDraft Traffic
Increase time available forResponse
MRRT>6
MRRT 1-6
MRRT 0-1

Merrick, Harrald, van Dorp (GWU) June 25, 2003 6
Previous Work
• San Francisco Bay Exposure Assessment– California legislature
examining the effects of major expansion of ferry services
– Simulation model tested the impact of proposed expansion on vessel interactions
– Legislature considering implementing proposed expansions

Merrick, Harrald, van Dorp (GWU) June 25, 2003 7
Previous Work
• Ports and Waterways Safety Assessment– Federal decisions require examination of numerous ports– Multi-attribute model created from expert and stakeholder
sessions– Model used in resource allocation for new vessel traffic
management technology
% High RiskDeep-Draft
0.35
% High RiskShallow-Draft
0.65
FleetComposition
0.29
VolumeDeep-Draft
0.24
VolumeShallow-Draft
0.32
VolumeFishing &
Pleasure Vessels0.29
TrafficDensity
0.14
TrafficConditions
0.25
WindConditions
0.26
VisibilityConditions
0.12
Currents/Tides& Rivers
0.27
IceConditions
0.35
EnvironmentalConditions
0.21
VisibilityObstructions
0.26
PassingSituations
0.24
Channels& Bottoms
0.29
WaterwayComplexity
0.21
WaterwayConfiguration
0.25
DecreaseFrequency
of Accidents0.70
Volumeof Passengers
0.38
Volumeof Petroleum
0.38
Volumeof Chemicals
0.24
Short-termConsequences
0.52
EconomicImpacts
0.43
EnvironmentalImpacts
0.34
Health &Safety
Impacts0.23
Long-termConsequences
0.48
DecreaseConsequences
of Accidents0.30
MaximizeSafetyin a Port
or Waterway

Merrick, Harrald, van Dorp (GWU) June 25, 2003 8
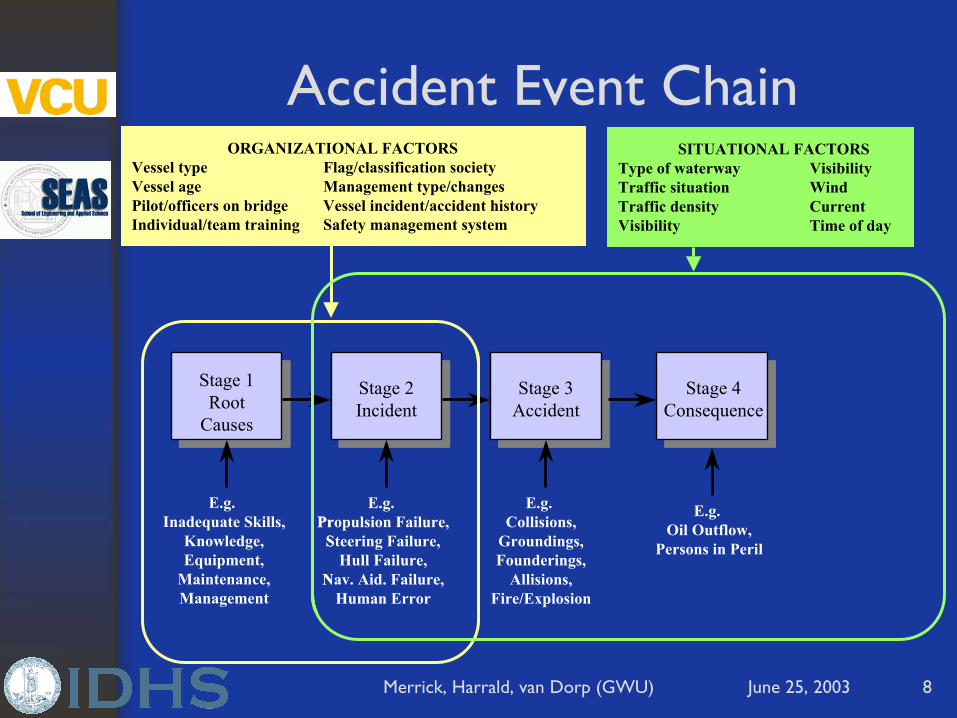
Accident Event Chain
E.g. Collisions,
Groundings,Founderings,
Allisions,Fire/Explosion
Stage 3Accident
ORGANIZATIONAL FACTORSVessel type Flag/classification societyVessel age Management type/changesPilot/officers on bridge Vessel incident/accident historyIndividual/team training Safety management system
SITUATIONAL FACTORSType of waterway VisibilityTraffic situation WindTraffic density CurrentVisibility Time of day

Merrick, Harrald, van Dorp (GWU) June 25, 2003 8
Accident Event Chain
E.g. Collisions,
Groundings,Founderings,
Allisions,Fire/Explosion
Stage 3Accident
ORGANIZATIONAL FACTORSVessel type Flag/classification societyVessel age Management type/changesPilot/officers on bridge Vessel incident/accident historyIndividual/team training Safety management system
SITUATIONAL FACTORSType of waterway VisibilityTraffic situation WindTraffic density CurrentVisibility Time of day
E.g. Propulsion Failure,
Steering Failure,Hull Failure,
Nav. Aid. Failure,Human Error
Stage 2Incident
F
E.g. Inadequate Skills,
Knowledge,Equipment,
Maintenance,Management
Stage 1Root
Causes
PrS
N
E.g. Oil Outflow,
Persons in Peril
Stage 4Consequence
E.g. Environmental
Damage,Loss of Life
Stage 5Impact

Merrick, Harrald, van Dorp (GWU) June 25, 2003 9
Accident Interventions
E.g. Inadequate Skills,
Knowledge,Equipment,
Maintenance,Management
E.g. Propulsion Failure,
Steering Failure,Hull Failure,
Nav. Aid. Failure,Human Error
E.g. Collisions,
Groundings,Founderings,
Allisions,Fire/Explosion
E.g. Oil Outflow,
Persons in Peril
E.g. Environmental
Damage,Loss of Life
Stage 1Root
Causes
Stage 2Incident
Stage 3Accident
Stage 4Consequence
Stage 5Impact
E.g. Emergency Repair or
Assist Tug,Emergency Response
Coordination,VTS Watch
Risk Reduction/Prevention
3. Intervene toPrevent Accident if Incident Occurs
E.g. Double Hull,
Double Bottom
Risk Reduction/Prevention
4. Reduce Consequence(Oil Outflow)
if Accident Occurs
E.g. Pollution
Response Vessel,Oil Boom,Pollution Response
Coordination
Risk Reduction/Prevention
5. Reduce Impact if Oil Outflow Occurs
E.g. ISM,
Training,Better
Maintenance
Risk Reduction/Prevention
1. Decrease Frequency of Root/Basic
Causes
E.g. Traffic Sep. Scheme,
Nav. Aids for Poor Visibility, Work Hour
Limits, Drug/Alcohol Tests
Risk Reduction/Prevention
2. Decrease Hazardous Exposure

Merrick, Harrald, van Dorp (GWU) June 25, 2003 10
Attack Event Chain
E.g. Terrorist Planning
combined withHazardous CargoVessels, Terminals
Hazmat Storage Areas,Critical Infrastructure
such as Bridges
Stage 1Threat Factors
E.g.Internal to Vessel (Crew Member?), External to Vessel(Recreational?),
on Facility or Infrastructure
(Vessel is weapon)
Stage 2Attack
Attempt
E.g. Hazmat Cargo Explosion near Populated Area,Cargo Explosion
To Disable Infrastructure(E.g. Bridges)
Stage 3Attack
E.g. Persons in Peril,
Fatalities,Vessel Damage,Port Damage,
Other InfrastructureDamage
Stage 4Consequence
E.g. Terror,
Loss of Life,Environmental
Damage,Economic Downturn
Stage 5Impact
ORGANIZATIONAL SUB SYSTEM FACTORSTwo Markets, Industrial Trade of Vessels, Owned Chartered by Oil Companies, spot market trade vessels, Tankers often escorted, Maritime RoutesNot Designed with Security in Mind
SITUATIONAL FACTORSCloseness of Explosion to Population Area,Chemical Facilities or Infrastructure (e.g. Port Assets, Bridges). Traffic Density, Time of Day, Weather Conditions

Merrick, Harrald, van Dorp (GWU) June 25, 2003 11
Attack Interventions1. Reduce Threat
Factors
2. Reduce Likelihood of
Attack Attempt
3. Reduce Likelihood of
Attack Success
4. Reduce Immediate
Consequences
5.Reduce Delayed
Consequences
• Disrupt TerroristActivities
• Identify Owner and Crew List,
• Locate Chem. Plants away frompopulation areas,
• Trusted VesselsProgram.
• Arm Vessels,• Board Vessels atPort of Entry,
• Improved Intelligenceand Detection,
• Escort Vessels
• Escort Vessels,• Ship Riders, • Improve TerminalSecurity
e.g. e.g. e.g.• On Board Fire Suppression,
• Escort Vessel Fire,Rescue Response.
• Facility Fire,Rescue andPollution Resp.
• Resp. Exercises
e.g.•Pollution Response,
• Mass CasualtyResponse.
• Port ContingencyPlans & Experience.
e.g.
EXAMPLES OF ORGANIZATIONAL RESPONSIBILITY FOR INTERVENTIONS
U.S. Coast GuardOil Companies
TSAFBICIA
EPAFEMA
MARAD Pilots
Acute Medical Care
VTS/VTISDODState/Local Law Enf.
Local Fire/Rescue
PETROCHEMICAL SUBSYSTEM: Interventions and Organizational Responsibilities

Merrick, Harrald, van Dorp (GWU) June 25, 2003 12
Modeling Approach
• Port Simulation• Definition of Critical Infrastructure at Risk• Exposure Counting Model• Multi-attribute Security Vessel Risk Model
– Owner/Operator, Type of charter, Cargo Broker, Officers/crew id, Nationality, Background, Crew agent, Flag State, Agent, Last Port, Voyage Route, Unique voyage or routine route, Loading Facility.
Merrick, Harrald, van Dorp (GWU) June 25, 2003 13
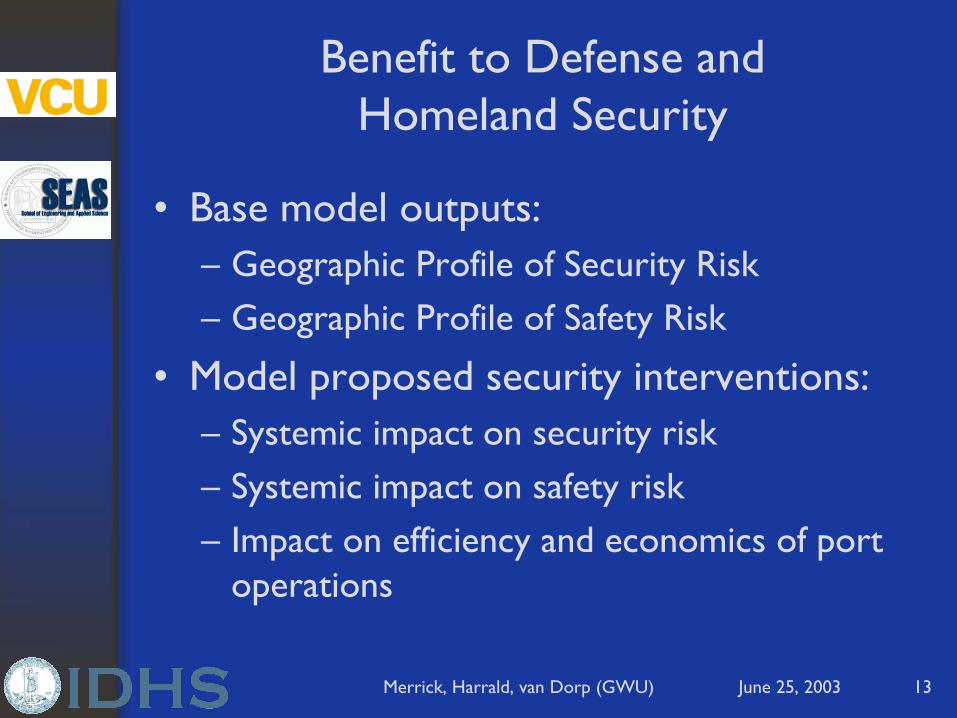
Benefit to Defense and Homeland Security
• Base model outputs:– Geographic Profile of Security Risk– Geographic Profile of Safety Risk
• Model proposed security interventions:– Systemic impact on security risk– Systemic impact on safety risk– Impact on efficiency and economics of port
operations

Merrick, Harrald, van Dorp (GWU) June 25, 2003 14
Research Sponsors
• Prince William Sound Shipping Companies.• Prince William Sound Regional Citizens’ Advisory
Council• United States Coast Guard• Washington State Ferries• Washington State Transportation Commission• San Francisco Bay Water Transit Authority• National Science Foundation
See NSF Project Web-Site for Journal Papers, Technical Reports and Simulation Movies:http://www.seas.gwu.edu/~dorpjr/tab3/NSFProject_GWU_VCU/NSFMain.html

Merrick, Harrald, van Dorp (GWU) June 25, 2003 15
Contact Information
Jason R. W. MerrickVirginia Commonwealth University(804) 828 1301 ext. [email protected]
Jack Harrald, J. Rene van DorpThe George Washington University(202) 994 [email protected], [email protected]


![[020-0612] Managing ERP, Interoperability Strategy and Dynamic ...](https://static.cupdf.com/doc/110x72/586b7cf91a28ab08198b9a2c/020-0612-managing-erp-interoperability-strategy-and-dynamic-.jpg)