1
Author version: Marine Ecology 31 (2010) 148–166
Macrofaunal community structure in the Western Indian Continental Margin including oxygen minimum zone
Ingole* B.S, Sautya S., Sivadas S., Singh R., Nanajkar M
National Institute of Oceanography (Council of Scientific & Industrial Research), Dona Paula, Goa, 403004, INDIA
*Corresponding author: [email protected];
Tel: +91 832 2450242; Fax: +91 832 2450606
Abstract
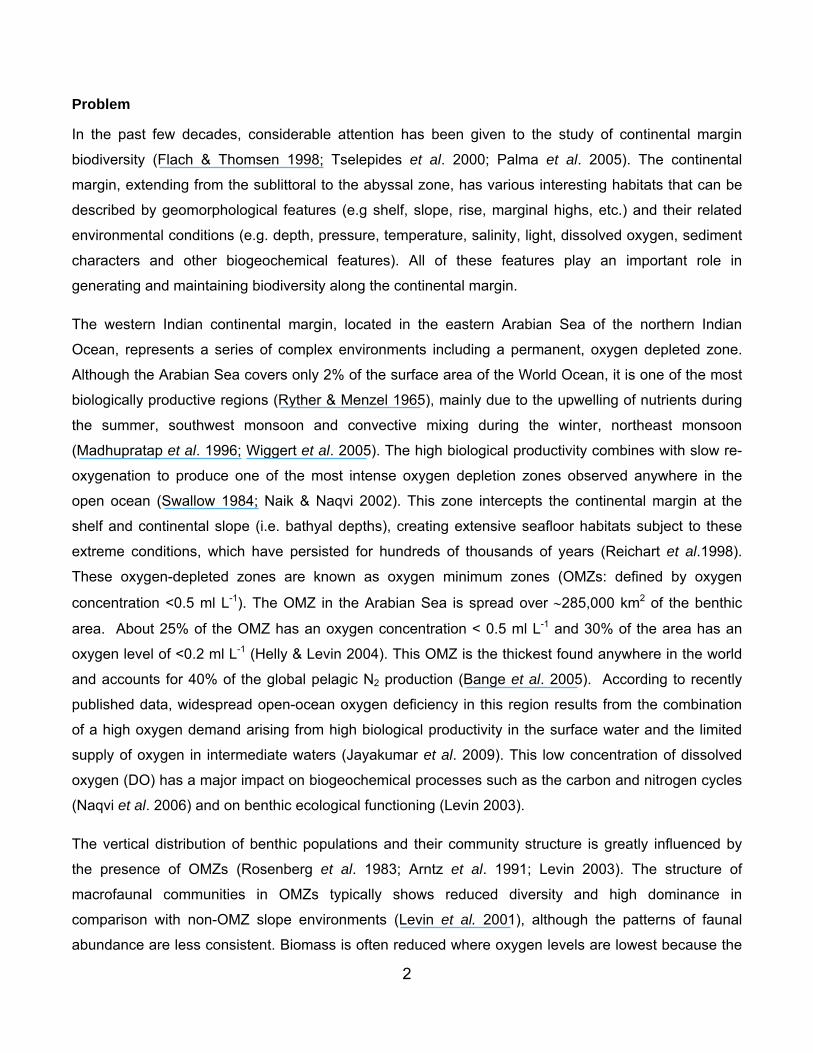
Patterns of macrofaunal distribution were studied along the western Indian continental margin to distinguish the role of habitat heterogeneity in generating and maintaining community structure. A transect perpendicular to the coast at 140 N latitude was selected for seabed sampling. Eight stations were sampled in the depth range 34 m to 2546 m and characterized with respect to macrofaunal composition, abundance, biomass, diversity and feeding type. The sediments in the shelf region (34, 48, 100 m) and upper slope (525 m) were characterized by silty and sandy facies, whereas the mid slope (1001 m), lower slope (1524 m) and basin (2001, 2546 m) consisted of clayey silts. The highest value of sediment chlorophyll-a (Chl-a) and total organic carbon (Corg) were recorded from the mid slope areas. Faunal abundance and biomass increased from the shallow to deeper depths in the shelf region, and decreased in the slope region (525-1001 m) due to the reduced bottom-water oxygen. The community parameters showed an overall increase in both the lower slope and basin areas. A total of 81 macro-invertebrate species belonging to 5 major groups represented the macrofauna of the area. Polychaeta was the major group at all depths. Among polychaete families, species of the Spionidae, particularly Prionospio pinnata, predominated at the oxygen minimum zone (OMZ) core and Cossuridae dominated in the lower part of the OMZ in sediments of the mid slope region (1001 m depth).
Species diversity was higher in the basin than in the slope region. Fluctuations in diversity appear to be partly due to the bottom-water dissolved oxygen (DO) gradient which includes values that are below the oxygen tolerance of many benthic species. Further, Margalef’s index (d) and Shannon-Wiener index (H´) showed a significant negative (p<0.01) relationship between sediment Chl-a and Corg, suggesting food availability as a critical factor in species dominance. Results of multivariate analyses suggest that for continental margin fauna, different physiographic provinces and an oxygen gradient have a higher influence on the species composition and diversity than other oceanographic conditions.
Key words: Deep-sea; Macrofauna; Habitat heterogeneity; Continental margin; Oxygen minimum zone; Arabian Sea.
An edited version of this paper was published by Blackwell Verlag GmbH. Copyright [2010]
2
Problem
In the past few decades, considerable attention has been given to the study of continental margin
biodiversity (Flach & Thomsen 1998; Tselepides et al. 2000; Palma et al. 2005). The continental
margin, extending from the sublittoral to the abyssal zone, has various interesting habitats that can be
described by geomorphological features (e.g shelf, slope, rise, marginal highs, etc.) and their related
environmental conditions (e.g. depth, pressure, temperature, salinity, light, dissolved oxygen, sediment
characters and other biogeochemical features). All of these features play an important role in
generating and maintaining biodiversity along the continental margin.
The western Indian continental margin, located in the eastern Arabian Sea of the northern Indian
Ocean, represents a series of complex environments including a permanent, oxygen depleted zone.
Although the Arabian Sea covers only 2% of the surface area of the World Ocean, it is one of the most
biologically productive regions (Ryther & Menzel 1965), mainly due to the upwelling of nutrients during
the summer, southwest monsoon and convective mixing during the winter, northeast monsoon
(Madhupratap et al. 1996; Wiggert et al. 2005). The high biological productivity combines with slow re-
oxygenation to produce one of the most intense oxygen depletion zones observed anywhere in the
open ocean (Swallow 1984; Naik & Naqvi 2002). This zone intercepts the continental margin at the
shelf and continental slope (i.e. bathyal depths), creating extensive seafloor habitats subject to these
extreme conditions, which have persisted for hundreds of thousands of years (Reichart et al.1998).
These oxygen-depleted zones are known as oxygen minimum zones (OMZs: defined by oxygen
concentration <0.5 ml L-1). The OMZ in the Arabian Sea is spread over ∼285,000 km2 of the benthic
area. About 25% of the OMZ has an oxygen concentration < 0.5 ml L-1 and 30% of the area has an
oxygen level of <0.2 ml L-1 (Helly & Levin 2004). This OMZ is the thickest found anywhere in the world
and accounts for 40% of the global pelagic N2 production (Bange et al. 2005). According to recently
published data, widespread open-ocean oxygen deficiency in this region results from the combination
of a high oxygen demand arising from high biological productivity in the surface water and the limited
supply of oxygen in intermediate waters (Jayakumar et al. 2009). This low concentration of dissolved
oxygen (DO) has a major impact on biogeochemical processes such as the carbon and nitrogen cycles
(Naqvi et al. 2006) and on benthic ecological functioning (Levin 2003).
The vertical distribution of benthic populations and their community structure is greatly influenced by
the presence of OMZs (Rosenberg et al. 1983; Arntz et al. 1991; Levin 2003). The structure of
macrofaunal communities in OMZs typically shows reduced diversity and high dominance in
comparison with non-OMZ slope environments (Levin et al. 2001), although the patterns of faunal
abundance are less consistent. Biomass is often reduced where oxygen levels are lowest because the
3
macrofauna of the OMZs are generally dominated by small-bodied polychaetes, features likely
associated with the low DO, the high availability of food and the reduction in predation pressure (Levin
et al. 2002). Previous studies of open-ocean OMZ benthos have suggested a strong lower-boundary
effect, with high densities of hypoxic-tolerant faunas aggregating in the lower part of the OMZ
(Thompson et al. 1985; Levin 2003; Hughes et al. 2009).
Various geomorphological features occur on the western Indian continental margin. The shelf break in
this region occurs between 80 m and 110 m, is wider in the northern shelf and narrows progressively
towards the south. Various physical, chemical and geological processes control the sedimentation in
this region. The sedimentary input is primarily from rivers that drain from the Western Ghats mountain
range. Information on the benthos of the deep eastern Arabian Sea, especially from the Indian margin,
however, is not available for global comparison. Neyman (1969) studied the benthos of the eastern
Arabian Sea and suggested that bottom fauna is poor between 80 m and 150 m depth due to an inflow
of subsurface water with low oxygen content. Earlier studies on the Indian shelf showed a definite
correlation between macrofaunal standing stocks and organic carbon as well as the nature of the
substrata (Parulekar & Wagh 1975; Harkantra et al. 1980). The community structure and abundance of
nearshore and shallow-water macrofauna is reasonably well known (Jayaraj et al. 2007, 2008 a, b;
Ingole et al. 2009; Joydas & Damodaran 2009). Most of these reports highlight the influence of
environmental factors on the structure of the macrobenthic community. However, most studies were
based on sampling at shallow (<200 m) depths in the shelf region. As a result, information on the
benthos of the western Indian slope including the OMZ and abyssal zone is not available. Recently,
benthic biological and biogeochemical process within the OMZ were investigated on the Pakistan
Margin of the northern Arabian Sea (Levin et al. 2009; Hughes et al. 2009; Cowie & Levin 2009; Murty
et al. 2009; Gooday et al. 2009).
The aims of this paper are: 1) to generate regional biodiversity data that can be globally compared to
other continental margins, 2) to study the sources of habitat heterogeneity from shallow- to deep-water
regions, and 3) to identify the environmental factors responsible for changing the macrofaunal
community structure on the western Indian margin.
It has been recognized that the environmental conditions of the eastern side are different from those
acting on the western region of the Arabian Sea (Qasim 1982). Furthermore, the macrofaunal data
show a striking contrast (especially through the OMZ core) between the western Oman margin and the
eastern Pakistan margin of the northern Arabian Sea (Hughes et al. 2009). In recent studies, increased
4
productivity has been reported from the Arabian Sea as well as the west coast of India (Madhupratap et
al. 1996; Prasanna Kumar et al. 2000).
Thus, on the basis of previous studies, we hypothesize that:
1. Increased productivity of the Indian margin will be reflect in standing stocks that are higher than
those on the Pakistan margin.
2. Macrofaunal abundance and biomass will be high and diversity will be relatively low in the OMZ
region and low DO concentration will be responsible for changing the community structure at
some depths.
Oceanographic settings of the study area
The surface area of the Arabian Sea, between latitudes 0° and 25° N and longitudes 50° and 80° E, is
about 6.225 x l06 km2. It is bound on the northern, eastern and western sides by the land masses of
Asia and Africa. It is an area of negative water balance, where evaporation exceeds precipitation and
runoff. The excess of evaporation over precipitation is highest (100 - 150 cm) off the Arabian coast and
decreases steadily towards the southeast. A slight excess of precipitation over evaporation (<20 cm)
occurs annually off the southwest coast of India (Venkateswaran 1956).
Surface circulation in the Arabian Sea is controlled by the seasonal variation in winds. Two types of
winds blow from different directions and form two different monsoon seasons: the SW monsoon during
summer (which leads to precipitation over the entire Indian peninsula) and the NE monsoon during
winter. During the SW monsoon, biological productivity in the Arabian Sea lies mainly around the
centers of seasonal upwelling off Arabian Peninsula, Somalia and southwest India (Qasim 1977).
During this time, the upwelled waters on the southwestern margin of India are restricted by a thin (5 -
10 m) lens of low-salinity water, which originates from local precipitation and runoff from the narrow
coastal plain that receives heavy rainfall (Stramma et al.1996).
Study area
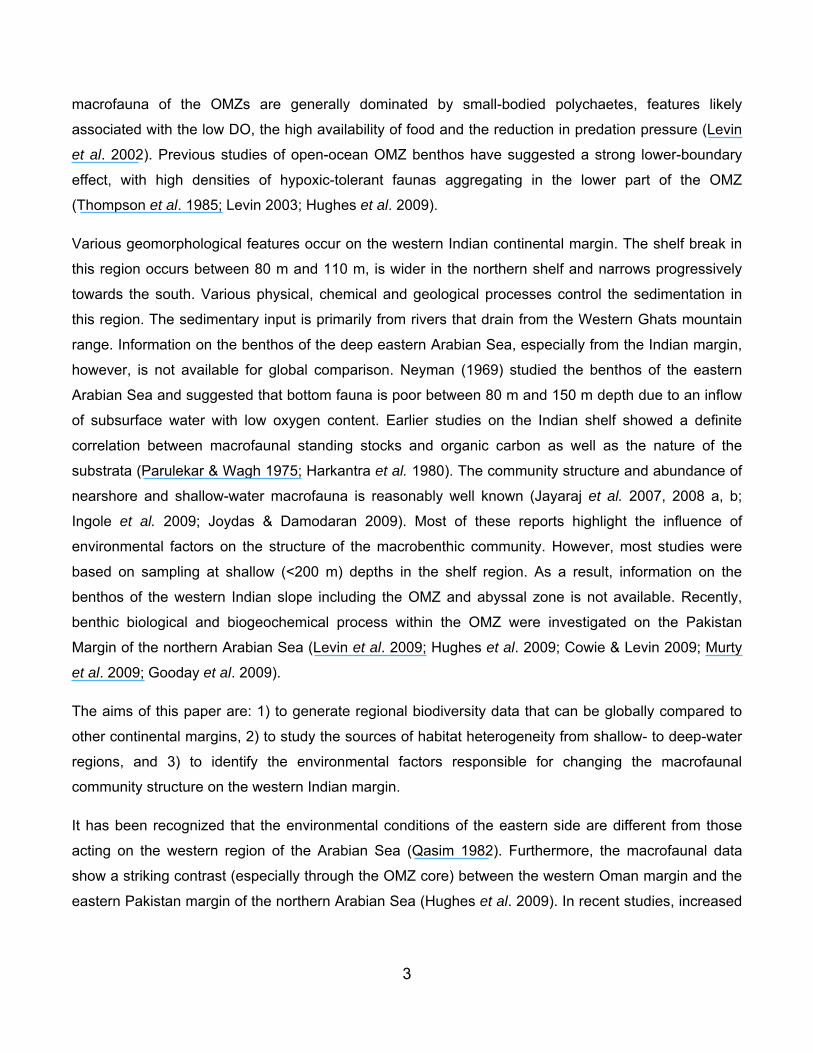
A detailed benthic sampling programme was performed on board ORV Sagar Kanya during August
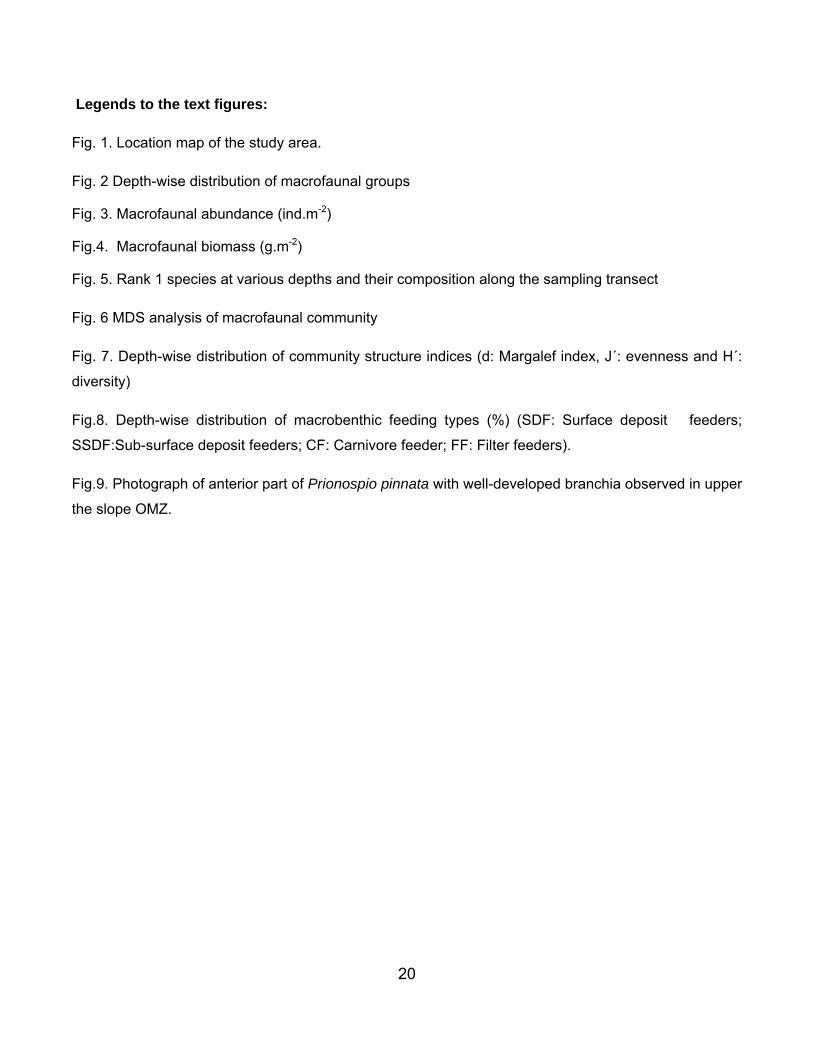
2007 (cruise no. SK 237) in order to generate local-scale benthic data. A single transect was selected
perpendicular to the coast at 140 N latitude (Fig. 1). In this region, the shelf break is located about 105
km from the coast (≈ 120 m depth), followed by a 116 km wide shelf margin basin. A mid-shelf
basement ridge, the dominant visible feature, divides the basin into eastern and western sections. The
5
bottom topography in the mid-lower slope region is strewn with prominent flat-topped marginal highs
(Rao & Veerayya 2000; Chakraborty et al. 2006).
Materials and methods
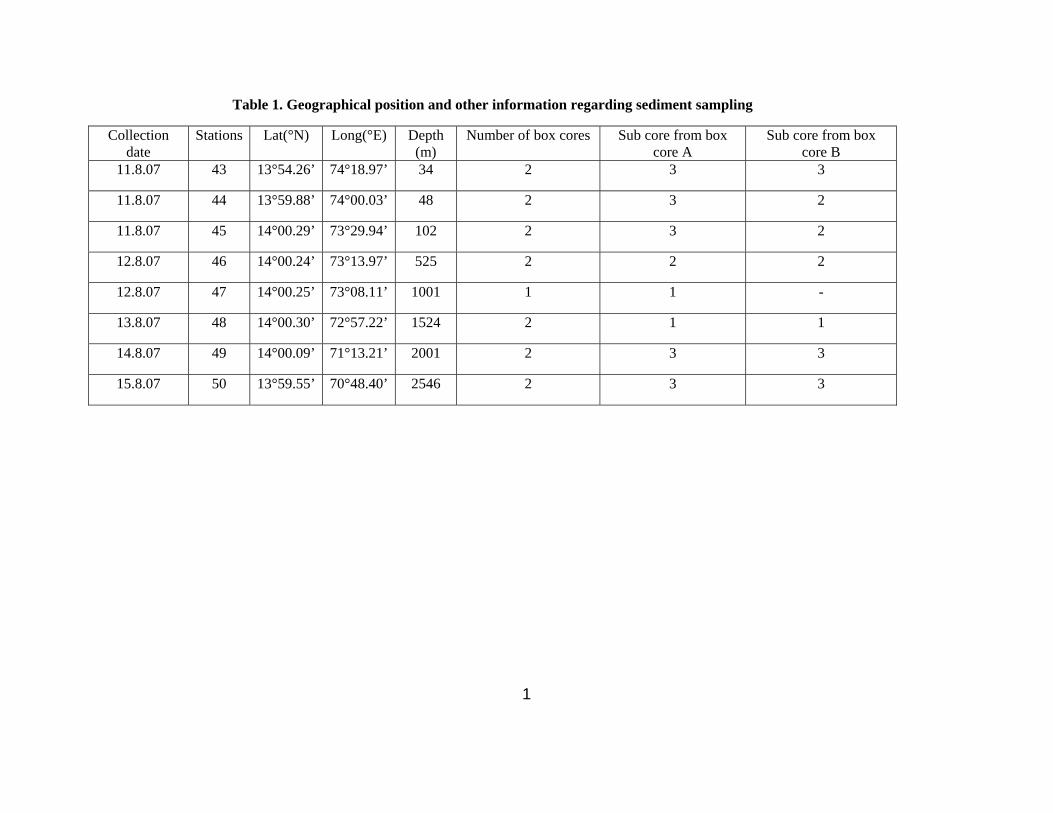
Sampling depth and sub-sampling
Eight stations (Table 1) were sampled at water depths of 34 m, 48 m, 102 m, 525 m, 1001 m, 1524 m,
2001 m and 2546 m using a spade box corer (50 x 50 x 50 cm size). Two box cores were used to
collect sediment samples at each depth, except at station 47 where only one box core was obtained.
According to Rao & Veerayya (2000) the transect can be divided into five regions – shelf region ( 34 m,
48 m and 102 m), upper slope (525 m), mid slope (1001 m), lower slope (1524 m) and basin (2001 m
and 2546 m). In the present study, all three slope depths were considered as a single region and
therefore the study area was divided into three depth zones – shelf, slope and basin. Sub-sampling was
done with a PVC core (15 cm dia) and 1-3 subcores were taken from each box core. Separate sub-
cores were collected for organic carbon (Corg), sediment chlorophyll-a (Chl-a) measurements and
texture (grain sizes) analysis and frozen at -20°C. The water overlying the box core and sub-core
sediment samples was sieved through a 300-µm mesh screen and then fixed and preserved using
buffered 10% formalin to which rose Bengal was added. Bottom-water salinity and temperature data
were collected using a CTD deployed down to 1524 m. CTD data from deeper depths could not be
obtained due to technical problems. Bottom-water DO measurements were taken using a DO sensor
attached to the CTD for depths down to 1524 m. Below this depth, water was collected using Niskin
bottles and was used for DO and Chl-a analysis.
Laboratory analysis and data processing
DO was analyzed by Winkler’s method (Strickland & Parsons 1968). Chl-a was estimated using an
acetone extraction method (Holm-Hansen 1978). Total carbon analyses were carried out on the upper
2 cm of freeze-dried sediments using a NCS 2500 (Model- EA/NA1110) CNS analyzer. Inorganic
carbon was analyzed by a CO2 Culometer analyzer and the percentage of CaCO3 was calculated.
Percentage of Corg was calculated by subtracting inorganic from total carbon. In the top 2 cm, sediment
texture was determined by Malvern Laser Analyzer (Model – Hydro 2000MU).
In the laboratory, the faunal samples were washed on a 300 µm sieve, sorted, identified and counted.
Specimens were identified to the lowest possible taxon. Biomass was determined by using the wet
6
weight method after blotting. At each site, the faunal counts from individual subcores (1 to 6 subcores
from 1, usually 2, box cores) were averaged and the mean value converted to individuals m-2. The
faunal counts from the water overlying the box core were divided by the number of subcores taken. The
biomass (shell on) was estimated similarly and converted to g m-2 (wet weight).
The data were subjected to univariate analyses to study the benthic community structure using
Margalef’s index (Margalef 1968) for species richness (d), Pielou’s index (Pielou 1966) for species
evenness (J’), and the Shannon-Wiener index (Shannon & Weaver 1963) for species diversity (H' by
using loge). The significance of the regions outlined a priori was tested with multivariate analysis (Non-
metric Multi-Dimensional Scaling (MDS)) and the organisms that contributed most to the observed
differences among groups were found by means of SIMPER (similarity percentage) using PRIMER 6
(Clarke & Warwick 1994). Linear regression between macrofaunal diversity indices and environmental
variables was tested using STATISTICA 6. Feeding types were assigned to Annelida based on
information in Fauchald & Jumars (1979).
Results
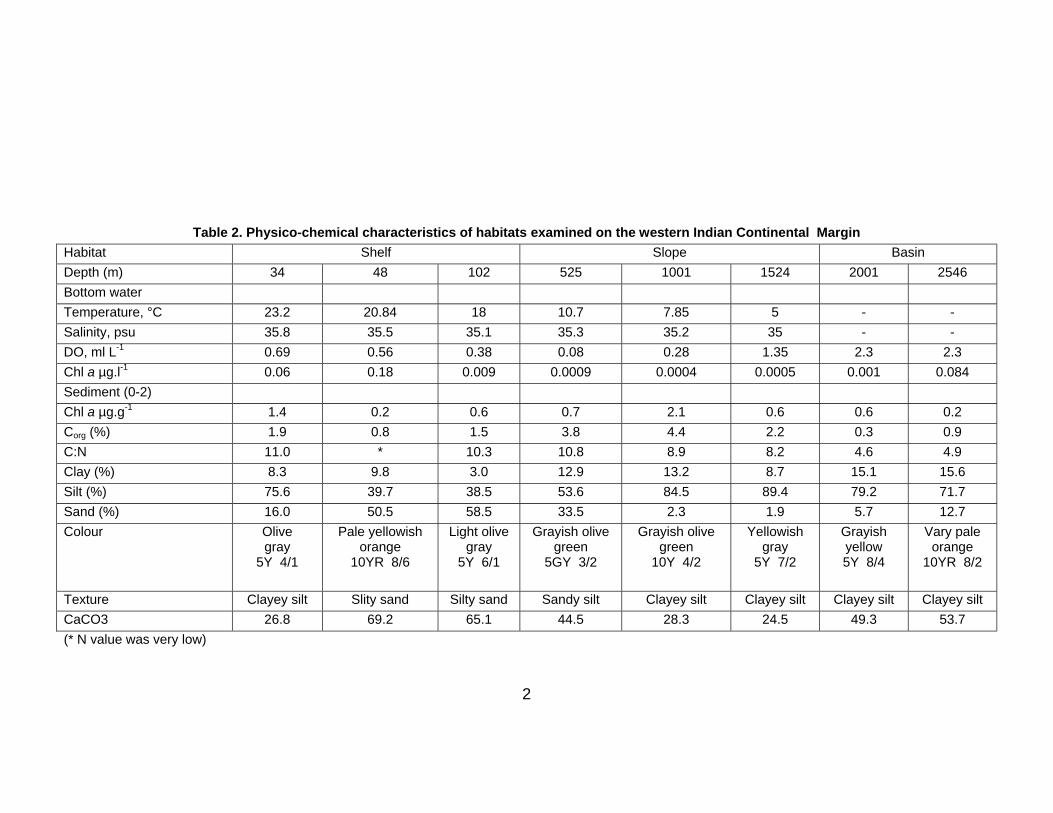
Environmental variables
The physico-chemical characteristics of the study area are summarized in Table 2.
Bottom water
The salinity of the bottom water did not vary at different depths, whereas temperature showed
variations between the bathymetric gradients. The bottom-water DO ranged from 0.08 to 2.3 ml l-1 at
different sampling stations. The lowest DO value was on the upper slope and increased from the lower
slope reaching a peak in the basin area (Table 2). The highest bottom-water Chl-a was in the shelf
region (48 m) and the lowest value was observed on the upper slope. In general, the Chl-a was low at
most of the stations (Table 2).
Sediment
Four types of sediment textures were observed in the study area. The shelf region and upper slopes
were characterized by silty and sandy facies, whereas the mid slope, lower slope and Arabian basin
were characterized by clayey silts. Sediment Chl-a ranged from 0.2 – 2.1 μg g-1 and showed significant
7
spatial variation. The middle slope showed the highest Chl-a, and the lowest values were recorded in
the shelf (48 m depth) and basin (2546 m) region. Sediment Corg was high on the mid slope (4.4%) and
a low value of 0.3% was observed at the basin station (2001 m). Organic carbon was high at stations
with high silt content, which was the dominant sediment type in the study area.
Macrofaunal population abundance and biomass
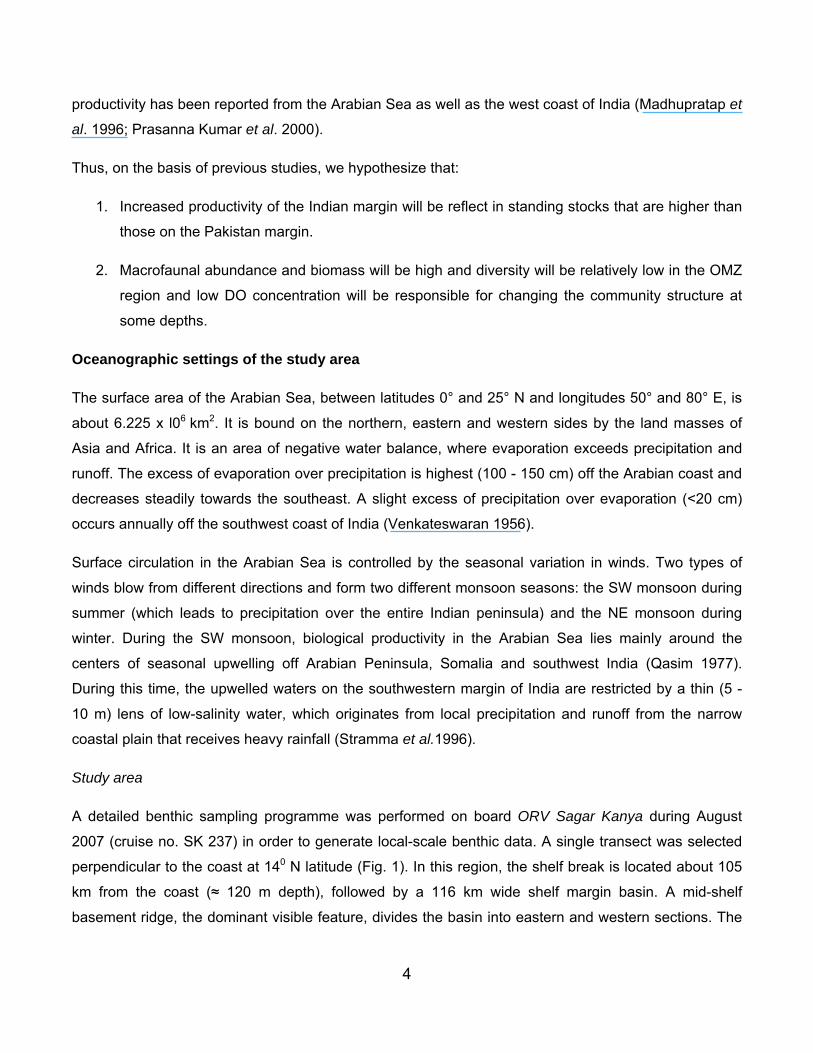
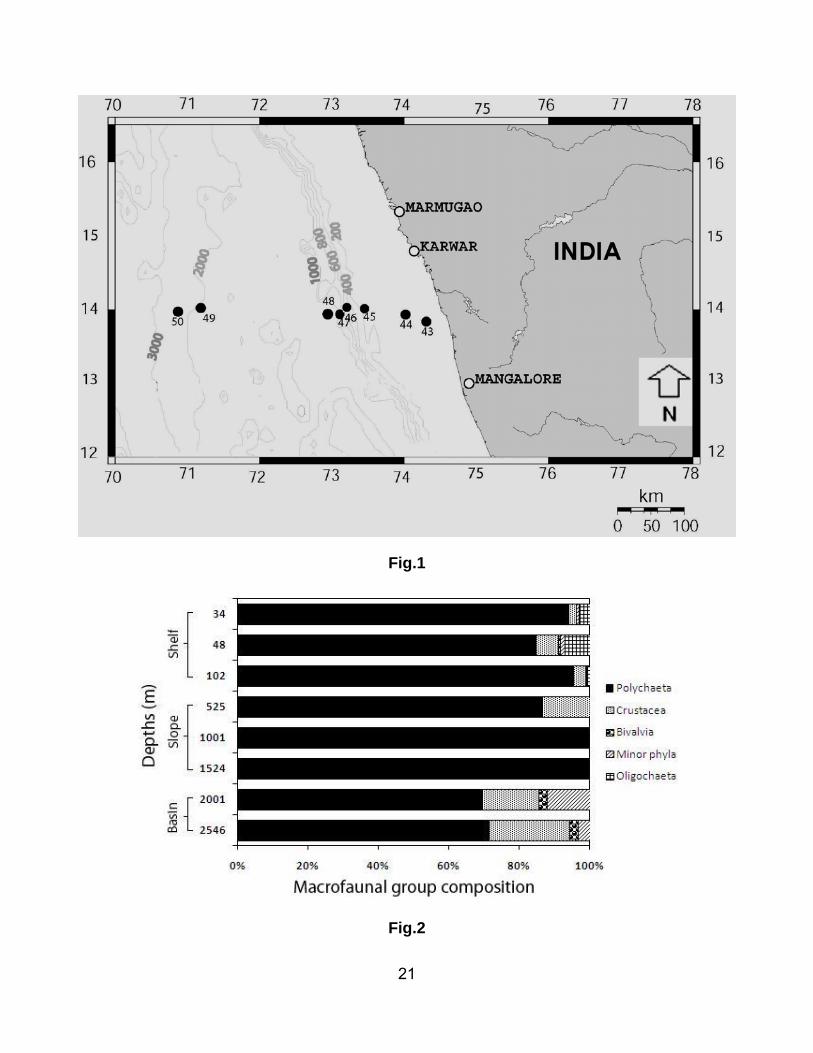
A total of 81 macro-invertebrate species from 5 major groups represented the macrofauna of the
western Indian margin. Of the identified taxa, 67 (82.7%) were polychaetes, 4 (4.9%) crustaceans, 7
(8.6%) minor phyla and 3 (3.8%) others (e.g. Bivalvia, Arachnida and Oligochaeta). Polychaeta was by
far the dominant macrofaunal group at all the water depths (Fig. 2). The maximum proportion (100%) of
polychaetes was observed on the slope (1001 and 1524 m) and minimum (71.4%) in the basin (2546
m). The next most abundant group was Crustacea with maximum relative abundance (23%) at 2546 m
and minimum (3.3%) at 102 m depth.
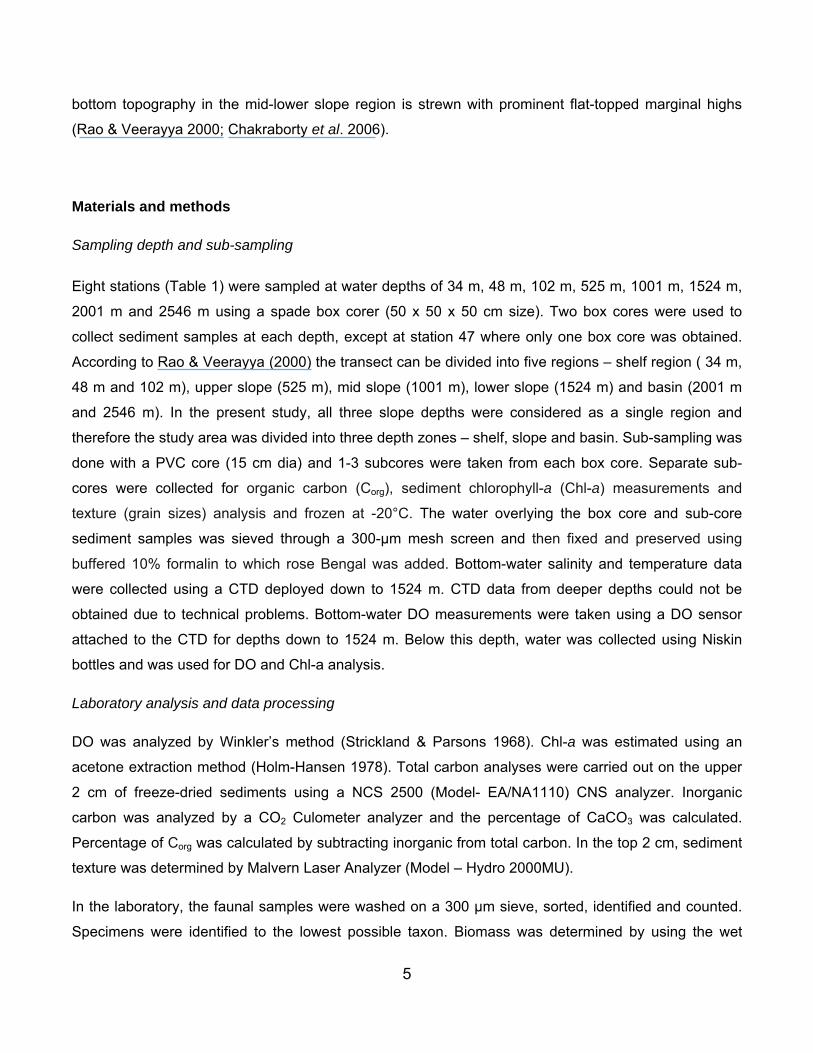
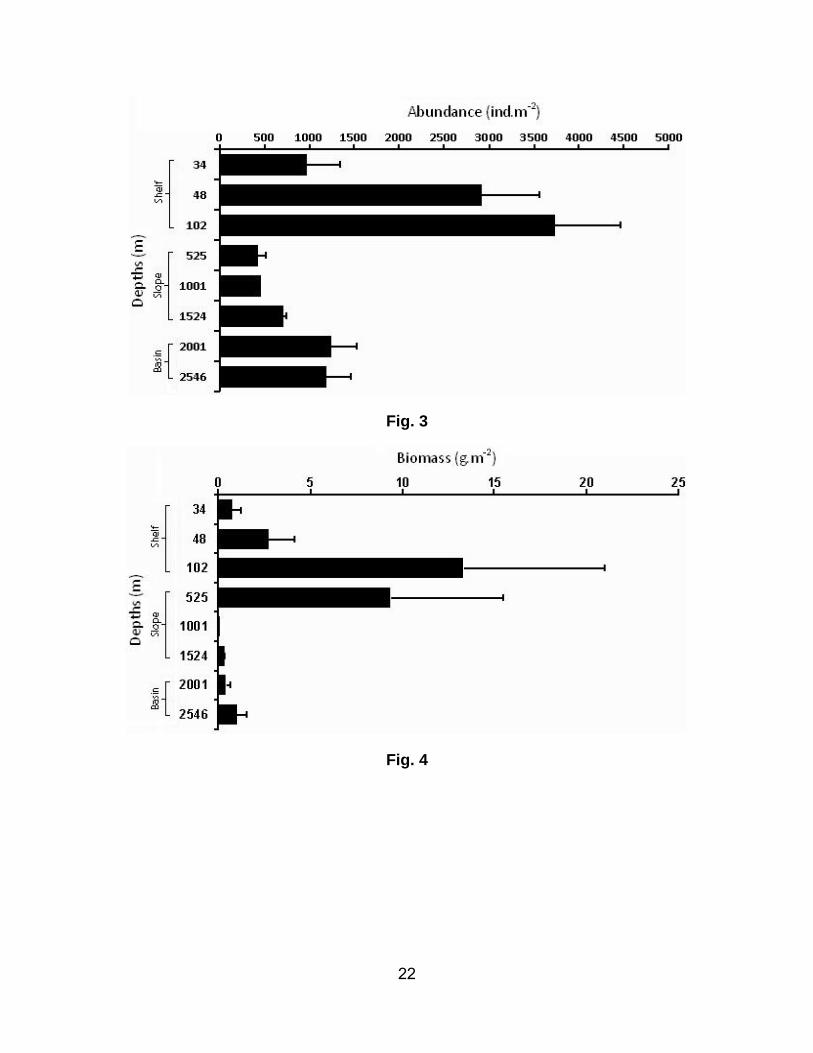
The average macrofaunal abundance increased from depths of 48 to 102 m depth, then decreased
precipitously to a minimum value at the 525-m site, before increasing gradually down to basin depths
(2001- 2546 m) (Fig. 3). The macrofaunal abundance was much higher at the deeper stations on the
shelf (mean values ~ 2900 – 3722 ind m-2) than at the shallower site (mean value 971 ind m-2). The
slope fauna was extremely sparse, with the mean (±SD) abundance of 528 ± 156 ind m-2. The highest
value was recorded on the lower slope and the lowest in the mid-slope region. Mean abundance within
the basin varied from 1188 – 1244 ind m-2.
The average macrofaunal biomass showed a similar trend. The highest biomass value (13.3 g.m-2) was
found at a water depth of 102 m while the lowest value (0.08 g m-2) was found at 1001 m. Biomass was
higher on the upper slope than at other stations (Fig. 4).
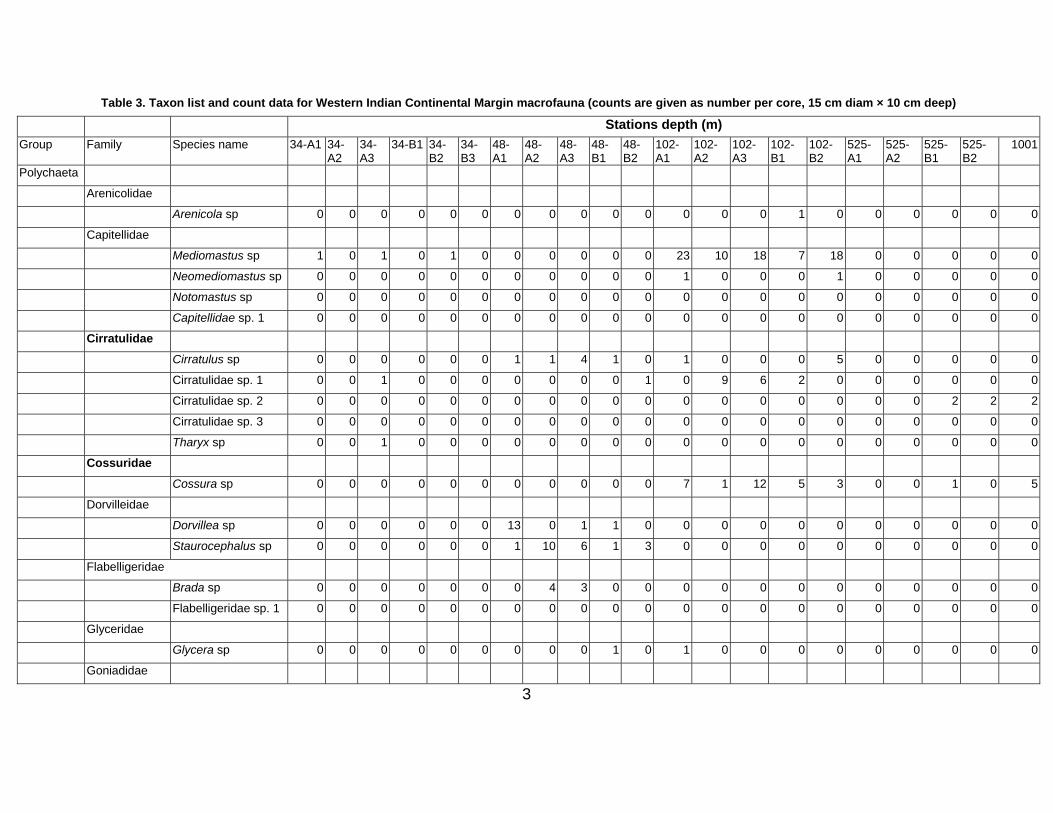
Macrofaunal composition
The values for macrofaunal composition in different physiographical provinces are described below and
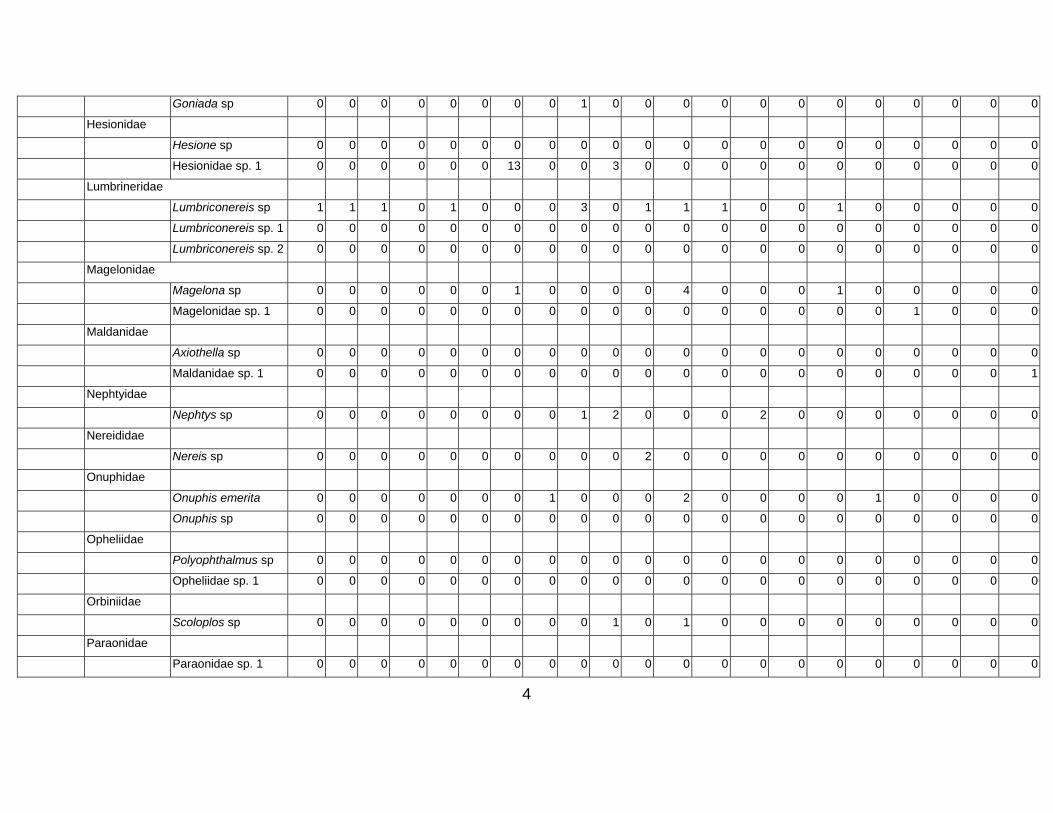
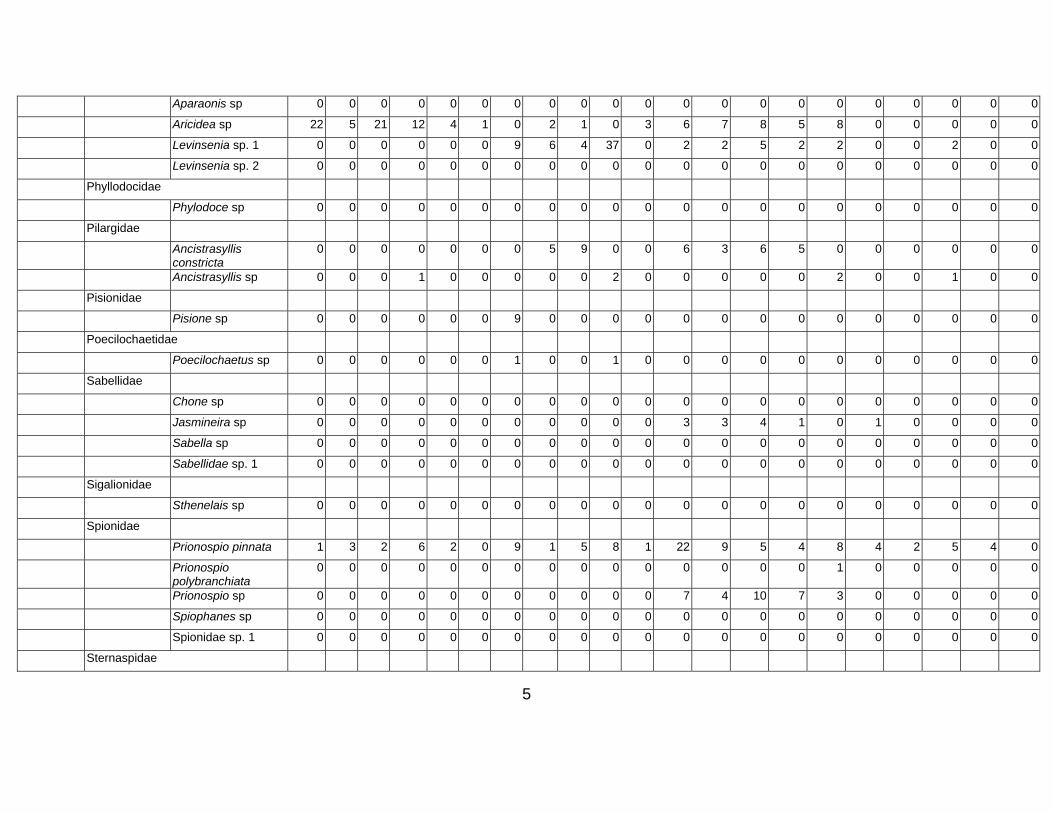
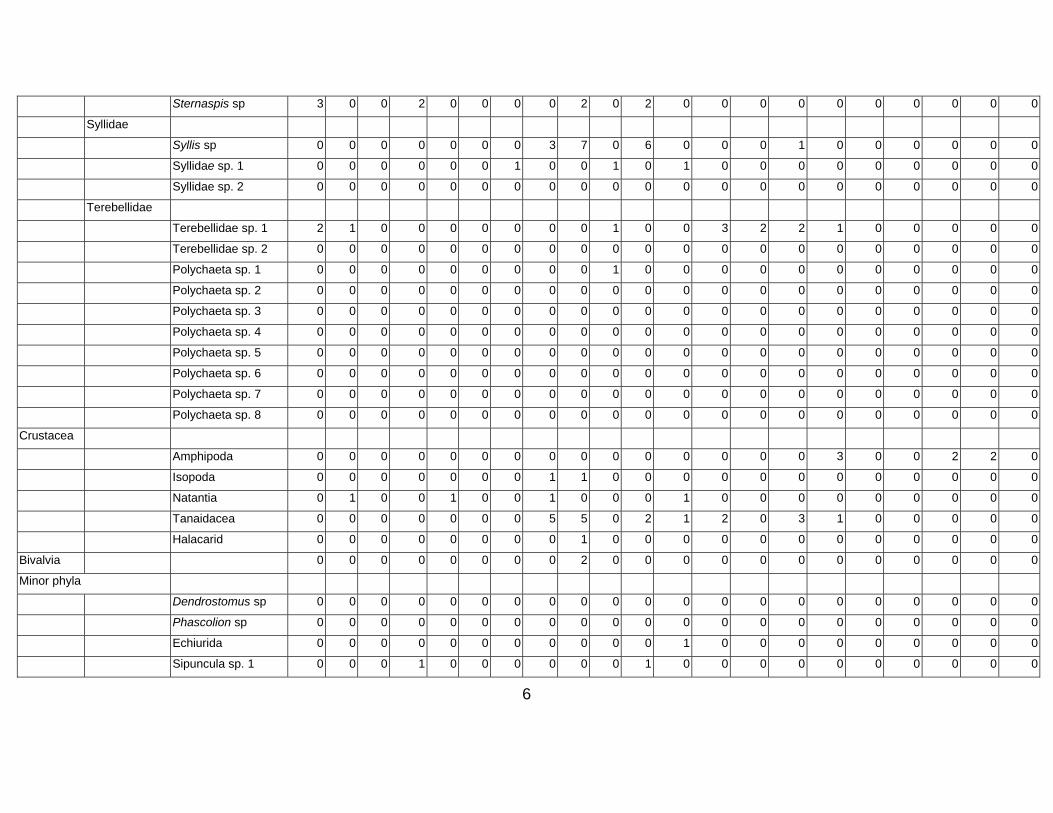
are shown in Table 3.
Shelf (34, 48 and 102 m)
A total of 43 taxa were identified and Polychaeta was the dominant group, contributing 85% - 95% to
the faunal abundance. Of the 28 polychaete families identified in the entire area, 24 were observed on
the shelf. The family Paraonidae made the highest contribution (36.8%) followed by Spionidae (16.9%)
8
and Capitellidae (9.3%). Natantia and Oligochaeta were present but species of Amphipoda were not
recorded. Other groups such as Bivalvia and minor phyla were found in low numbers.
Slope (525, 1001 and 1524 m)
Only two groups, Polychaeta and Crustacea were present in this depth range. The majority 80 - 100%
of the macrofaunal animals were polychaetes, which were represented by 14 families. The contribution
of Cossuridae was maximal (62.5%) at the mid slope area. Spionidae were predominant on the upper
slope. The maximum number of families (10) was observed in the lower slope area. The only
crustacean taxon present in this physiographic region was the Amphipoda.
Basin (2001 and 2546 m)
The highest number of taxa (52) was present in the basinal region. This area was marked by a lower
proportion (69 - 71%) of Polychaeta than the other two regions. A total of 21 polychaete families was
observed, with the Spionidae and Paraonidae being dominant (24.5% and 14% respectively). The
highest contribution of Crustacea (23% at 2546 m) and minor phyla (12.1% at 2001 m) were also
observed in this region. The Tanaidacea was the most abundant group among the crustaceans,
contributing ~12% to the total macrofaunal community.
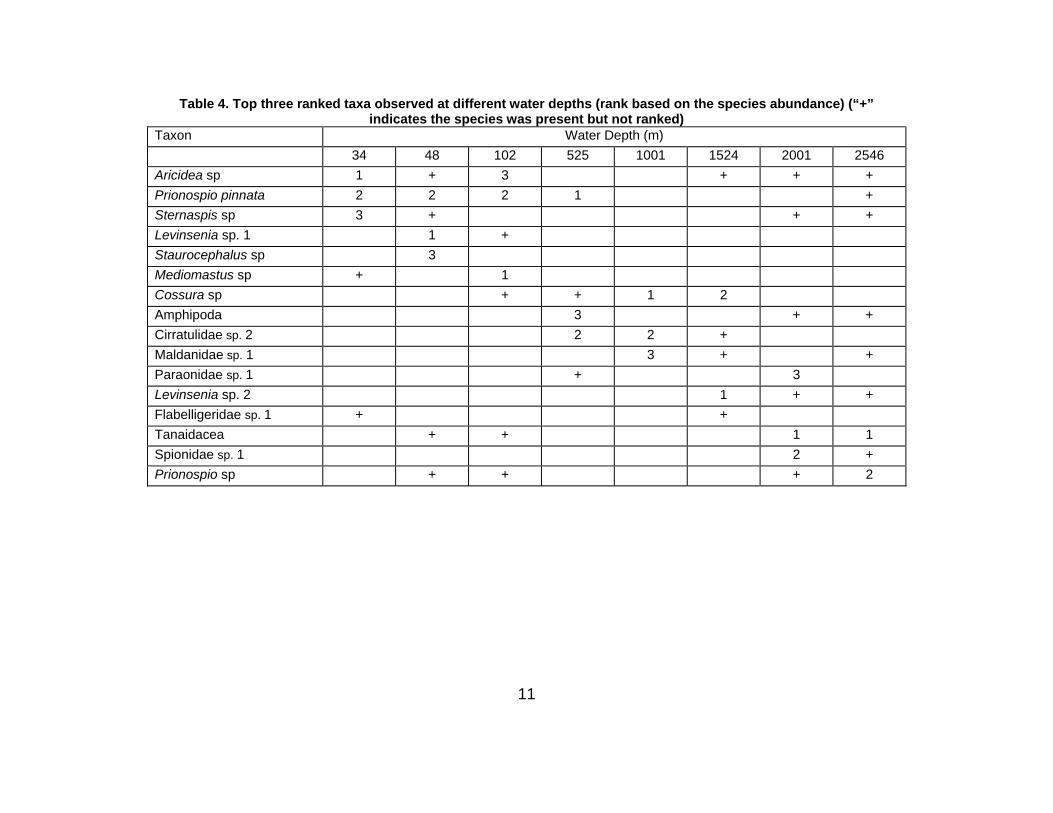
Dominant taxa
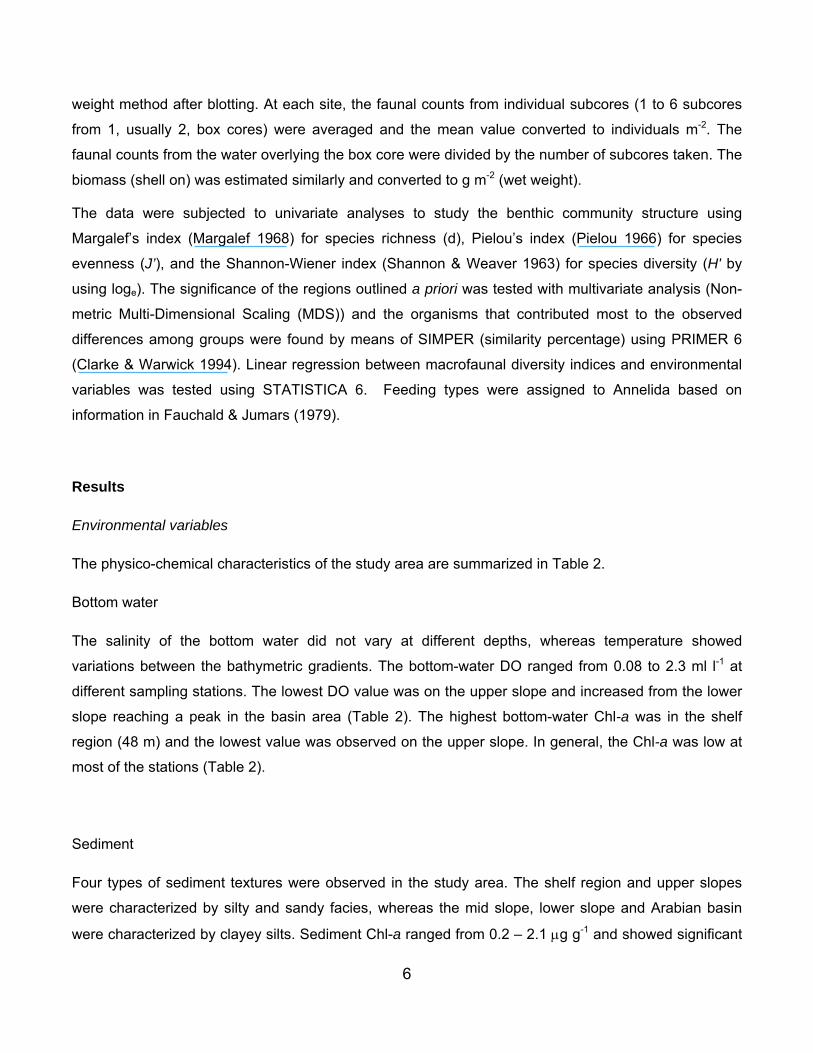
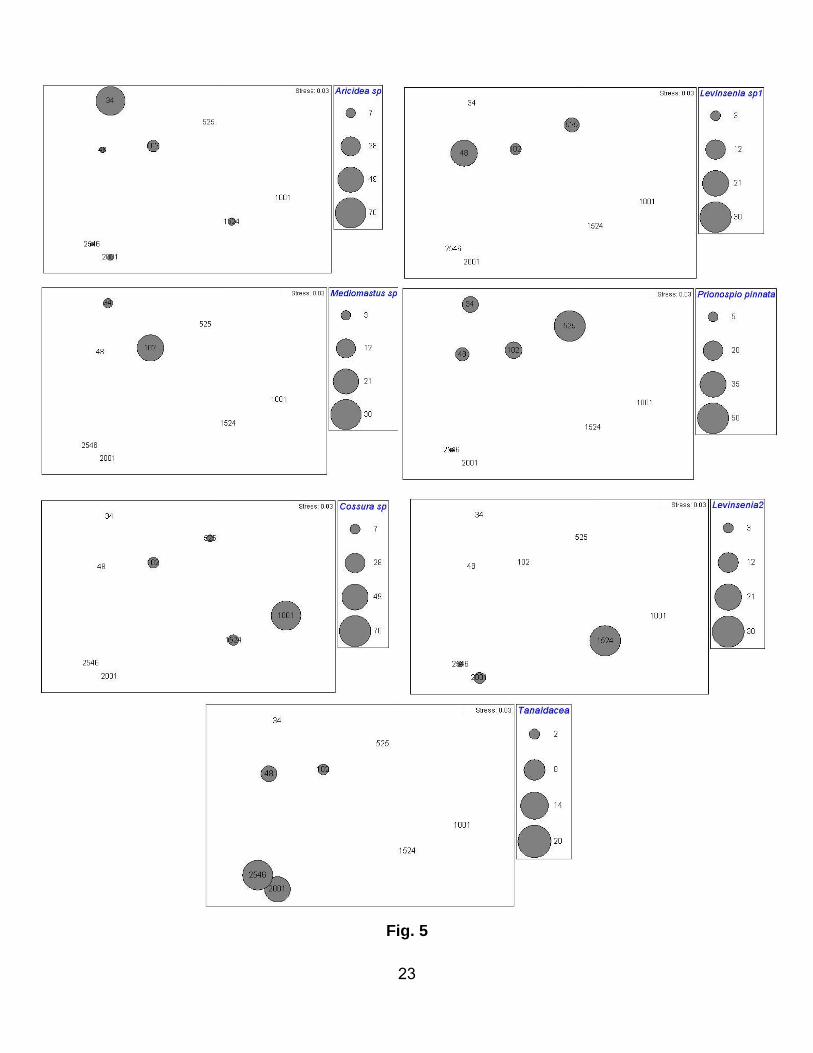
The three dominant species (representing 22 – 100% of the macrofaunal community) at their respective
depths, together with their rank, are summarised in Table 4 and Figure 5.
Among these species, the polychaetes Aricidea sp., Prionospio pinnata and Sternaspis sp. were
dominant at a depth of 34 m. However, their faunal contribution decreased sharply as water depth
increased. At a depth of 48 m, the three top-ranked species were the polychaetes Levinsenia sp. 1, P.
pinnata and Staurocephalus sp.; again their abundances declined with increasing water depth.
Mediomastus sp. was dominant at 102 m, but was not observed at any other depth except for at the
shallowest site (34 m), where Prionospio pinnata was ranked second dominant.
Prionospio pinnata, Cirratulidae sp. 2 and an unidentified Amphipoda species dominated in the upper
slope area. Only three species were observed in the mid slope region, with Cossura sp. dominating.
Levinsenia sp. 2 was present on the lower slope. The polychaete Cirratulidae sp. 2 was the only taxon
restricted to the slope region.
The highest taxonomic diversity was observed in the basin. Here, Tanaidaceans were dominant at both
depths (2001 and 2546 m). Tanaidaceans were also present on the shelf, but with low abundance and
9
were absent on the slope. At 2001 m, Spionidae sp. 1 and Paraonidae sp. 1 appeared as second and
third ranked respectively. The polychaete Prionospio sp. occupied second rank at the 2546 m depth.
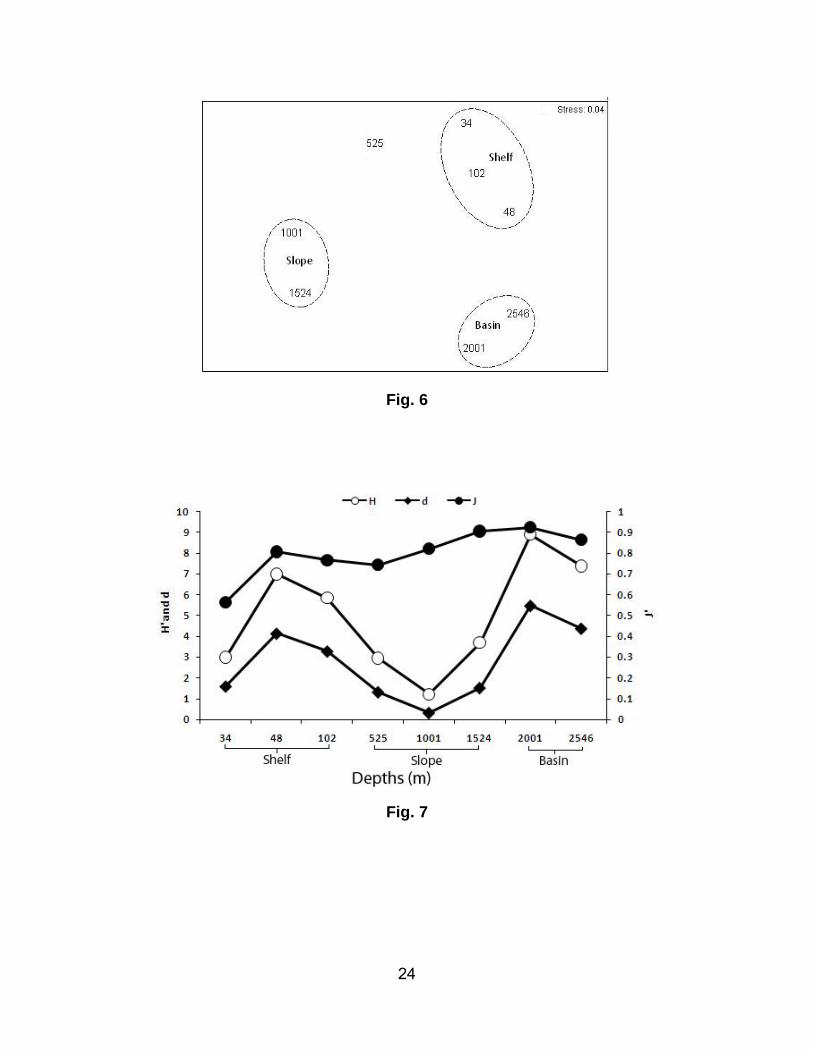
Multivariate (MDS) analysis of community structure
An MDS plot based on the average abundance of macrofauna revealed three distinct groups at 20%
similarity, reflecting the three different physiographic regions (Fig. 6) in the study area. Group 1 was
restricted to the shelf region and was characterized by the dominance of P. pinnata, A. constricta and
Aricidea sp. Group 2 covered the slope region (mid and lower) and was dominated by Cossura sp. and
Cirratulidae sp. 2. Group 3 consisted of the two deeper stations located in the Arabian basin with
polychaetes Levinsenia sp.2, Cirratulidae sp. 3, along with and Tanaidacea, as the dominant taxa. The
upper slope remained separate as it did not cluster with any of the above groups.
Diversity indices
Margalef’s index (d) varied from 0.3 to 5.5 over the study area (Fig. 7). A higher d value was recorded
from the basin (2001 m) than in the mid slope. Species evenness varied from 0.6 to 0.9, with the higher
value recorded at a depth of 2001 m, rather than at a shallower depth (34 m) on the shelf. Values of H´
varied from 0.9 to 3.4. The highest H´ value was also observed in the basin (2001 m).
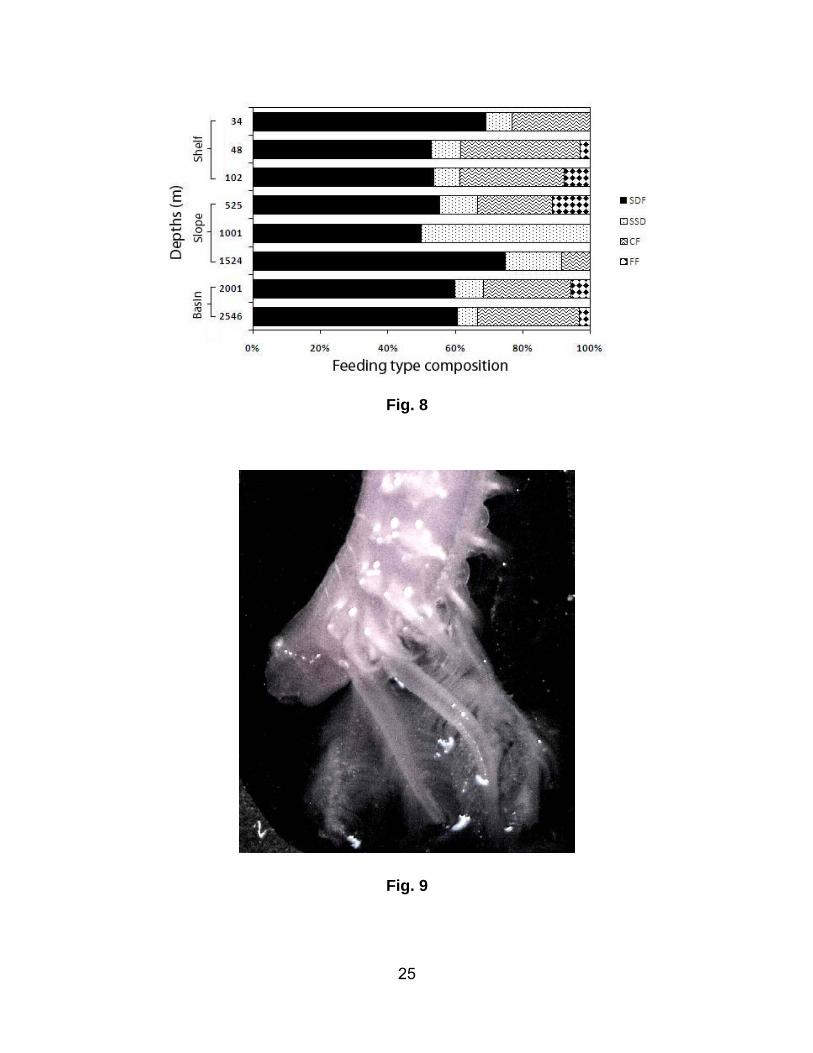
Distribution of polychaete feeding types
Surface deposit-feeders (SDF) were the dominant feeding type at all the sampling depths (Fig. 8). The
highest contribution of SDF was on the slope. The frequency of SDF was also high (50 – 75%) within
the slope area. The mid slope showed the highest contribution (50%) of sub-surface deposit feeders
(SSDF). The highest representation of carnivores was on the shelf region (particularly at 48 m).
Moreover, a moderately high contribution of carnivores was observed at the two basin sites. Carnivores
were not present in the in the mid slope area and filter feeders were rare across the study area.
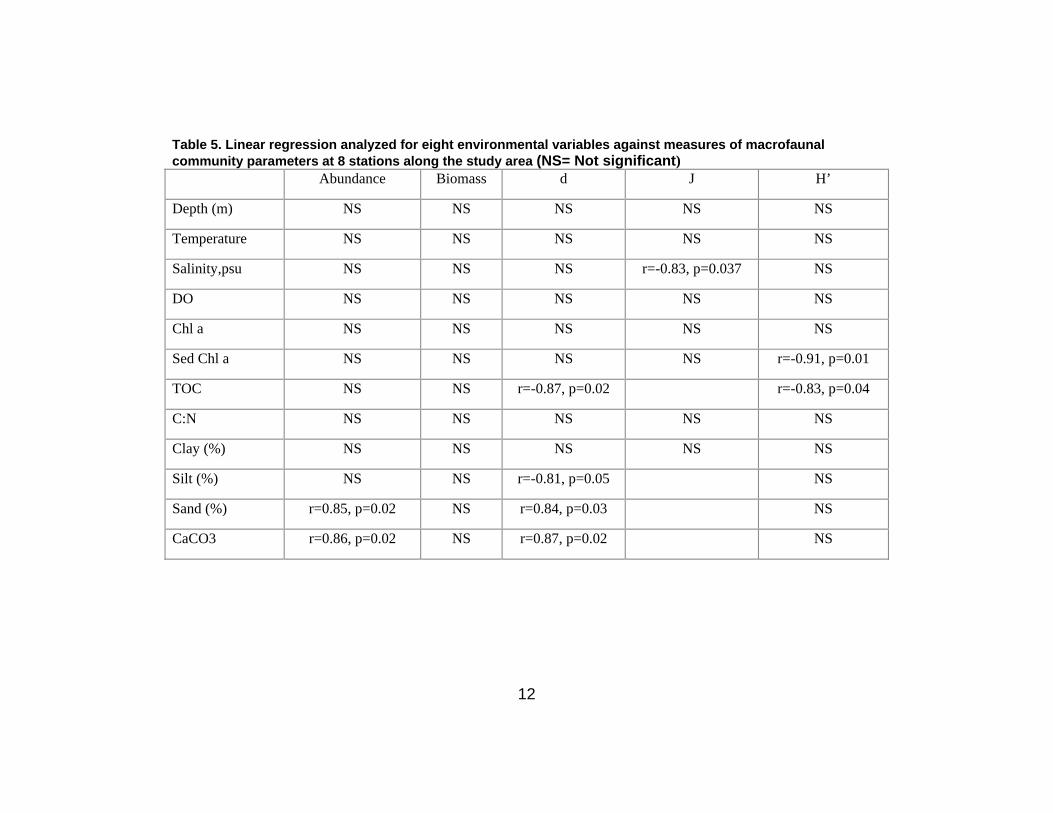
Correlation of environmental and community parameters
The correlation between macrobenthic parameters and environmental variables were based on
Pearson’s correlation analyses (Table 5). Macrofaunal abundance was positively correlated with sand
and CaCO3 (p<0.05). The H´ values were negatively correlated with sediment Chl-a and Corg (p<0.05).
Margalef’s index showed a significant negative relationship between Corg and silt content (p<0.05) and a
positive relationship with sand and CaCO3 (p<0.05). Only species evenness showed a significant
negative relationship with bottom water salinity (p<0.05). Other environmental variables, including DO,
did not show significant correlations with macrofaunal community parameters.
10
Discussion
The observed high values of sediment Corg on the slope, and low values in the basin region, were in
agreement with previous studies of the western Indian margin. According to Rao & Veerayya (2000)
diverse topographic features on the slope and the associated hydrodynamic processes play an
important role in the enrichment of Corg. DO values ranged from 0.08 to 2.3 ml l-1. The lowest DO value
was measured at the upper slope station. Based on DO concentrations, the OMZ was found to extend
from a water depth of 102 m to 1001 m in the study area, with the core of the OMZ located at 525 m
where the lowest DO value was recorded.
Macrofaunal biomass
Macrofaunal biomass increased from 34 m to 102 m, then showed an abrupt decline with the lowest
value measured at 1001 m, before increasing again from 1001 m to 2546 m. Previous studies from the
shelf region (Harkantra et al. 1980; Parulekar et al. 1982; Harkantra 2004) report higher biomass values
at the shelf stations. The differences noted may be due to the varied sampling methods including
different types of gear, water depth and the sampling season. Moreover, all the previous studies
sampled at shallower depths (<200m). Although the biomass in the present study was low, the values
increased on the shelf from the shallower to the deeper regions, a pattern not reported in earlier studies
(Kurian 1971; Parulekar & Dwivedi 1974; Ansari et al. 1977; Jayaraj et al. 2007, 2008b).
The high benthic biomass at shallower depths in the shelf region may reflect higher food availability in
the form of Corg and Chl-a. The supply of food to the sub-tidal benthic environment depends on the
proximity to the shore and water depth (Levinton 1982). Sediment Chl-a at 34 m and 102 m was
moderately high. Furthermore, biomass was higher at 102 m compared to shallower regions, due to the
presence of Natantia and Arenicola sp. Although the highest Corg was recorded in the lower part (1001
m) of the OMZ, biomass was lower at this depth and was related to faunal abundance. Comparatively
high biomass was observed at 525 m, which was not reflected in abundance. This was due to the
presence of the large-sized species P.pinnata. There was an increase in biomass thereafter to the
lower boundary of the OMZ towards the deeper region.
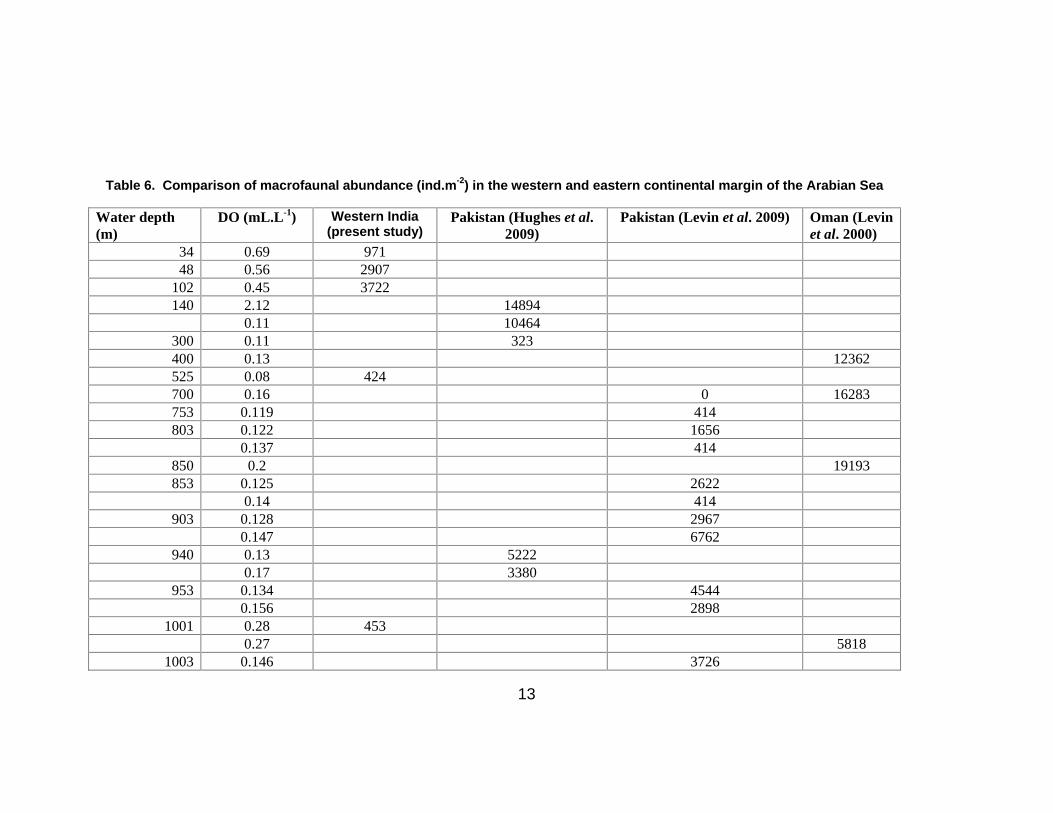
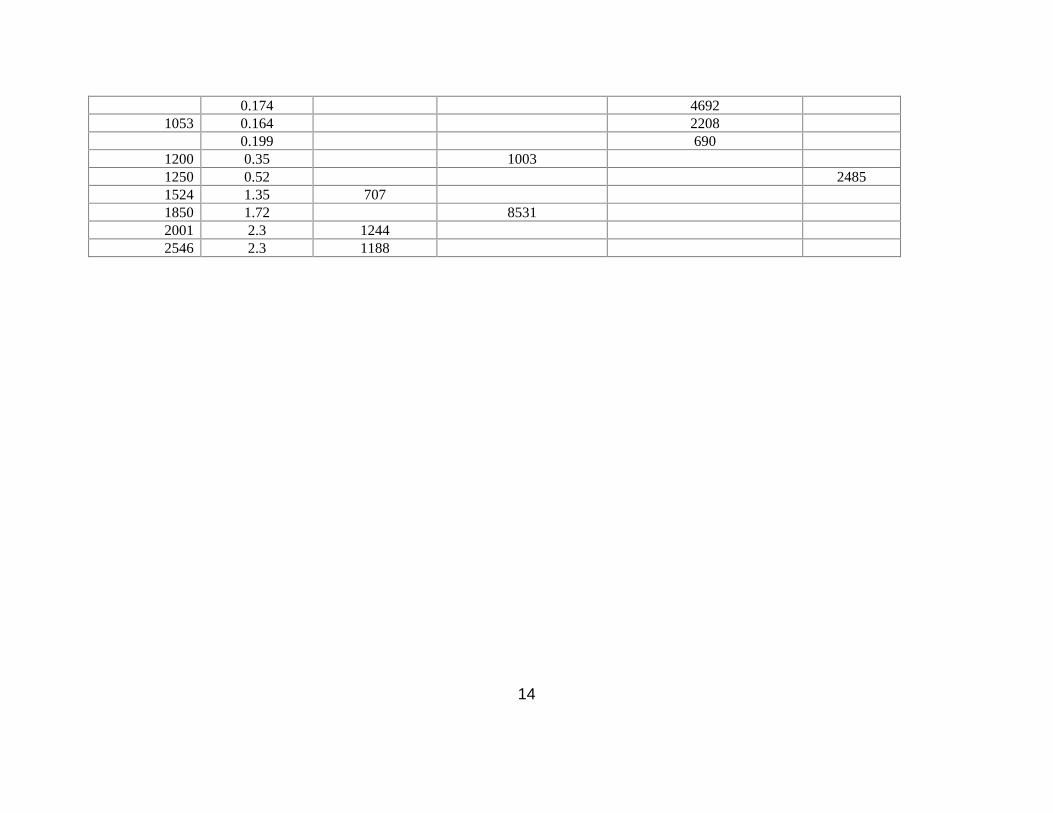
Macrofaunal abundance and composition
Macrofaunal abundance increased from the shallow to the deeper region of the shelf, decreased to its
lowest value in the lower part of OMZ and then increased towards the deeper region. Macrofaunal
abundance in the western Indian OMZ core (525 m) and the lower part of the OMZ were extremely low
compared to all other OMZ margins studied to date, except for the Pakistan margin located on the

11
northeastern side of the Arabian Sea (Table 6). In the present study, low faunal abundance was
observed on the slope at depths where DO concentrations were 0.08 and 0.28 ml L-1 although
measurements of Chl-a and Corg were high. Levin et al. (2009) suggested that oxygen thresholds for
macrofaunal abundance at ~0.11 – 0.13 mL-1 when the other conditions are favorable. It is possible that
oxygen thresholds in our study area are higher than on the Pakistan margin.
Among the polychaetes, spionids were highly dominant within the OMZ core whereas cirratulids were
the predominant taxon in other regions. Spionids and cirratulids were also the dominant families within
the OMZ on the upper slope (400 – 700m) off Oman (Levin et al. 2000) and a shallow shelf station (140
m), the lower OMZ boundary (1200 m) and below the OMZ (1850 m) on the Pakistan margin (Hughes
et al. 2009). In the present study, cossurids were mainly restricted to the lower part of the OMZ (1001),
although they were also present on the lower slope which is located just beneath the OMZ. This
polychaete group was abundant in the OMZ core (100 – 200 m) off Central Chile (Gallardo et al. 2004).
Because these polychaetes are deposit-feeders (both surface and sub-surface), their predominance
may reflect food availability (e.g. sediment Corg and Chl-a) within the OMZ region. Paraonids were
abundant at sites above and below the OMZ regions as well as the upper shelf and the basin. Similarly,
paranoids were abundant at 1850 m on the Pakistan margin (Hughes et al. 2009).
The Cossuridae and Spionidae were important taxa where oxygen concentrations were lowest.
Cossurids are common in many bathyal OMZs, including the Pakistan margin where they are present at
depths of 940 m and 1200 m, both areas of high Corg. Furthermore, the global bathyal data on benthic
faunal abundance and biomass indicate a reduction in density at the OMZ core (Rosenberg et al. 1983;
Mullins et al. 1985; Wishner et al. 1995) and an increase at the OMZ boundaries (Levin et al. 2003).
Influence of habitat heterogeneity on macrofaunal community structure
The MDS ordination based on the macrofaunal community clustered the sites into 3 groups
representing three different bathymetric provinces. Group 1 comprised in stations of the shelf region,
where opportunistic species such as Aricidea sp., Prionospio pinnata, Mediomastus sp. and
Ancistrasyllis constricta were dominant. These polychaete species were most abundant at a depth of
102 m, where the DO concentration was low (<0.5 ml l-1). For most of these species, this tolerance of
stressful conditions such as the low DO (<0.5 ml l-1) has been observed in the OMZs of the Oman
margin and off central Chile (Levin et al. 2000; Gallardo et al. 2004).
Group 2 was restricted to the slope region (1001 m and 1524 m) where the SSDF species Cossura sp.
and Cirratulidae sp. 2 predominated within the macrofaunal community. Although 1524 m was outside
12
the OMZ, it was close to the OMZ boundary and the measured DO was not as high, nor as stable as
the values measured at deeper stations.
Group 3, the most diverse group, was dominated by different taxa, including Tanaidacea, Levinsenia
sp. 2 and Cirratulidae sp. 2. This group was confined to the two deepest (basin) sites, of which the
2546 m region had a higher value of Corg (excluding those measured at the OMZ stations). The nature
and variability of the organic matter supplied to the deep-sea floor influence the structure and function
of the communities (Grassle & Morse-Porteous 1987). Tanaidacea are not very diverse in shallow
waters but are well represented in the deep sea (Dojiri & Sieg 1997; Pavithran et al. 2007) where they
are one of the most abundant taxa. Among the crustaceans, Isopoda and Amphipoda are also
particularly abundant and diverse in the deep sea, where they are among the most typical members of
the deep-sea benthic communities (Sanders et al. 1965; Brandt et al. 2007). The diversity of the Group
3 assemblage in the present study was comparable to that of ‘normal’ deep-sea habitats.
The OMZ core fauna did not cluster with any group. This was due to the higher abundance of P.
pinnata (Fig.5), which is known to tolerate low oxygen concentration (Gallardo et al. 2004). The
dominance of P. pinnata has also been reported within the OMZ off Concepecion (Palma et al. 2005).
In addition, one particular morphological adaptation of this species, an expanded branchial structure
has been observed only in the OMZ settings, specifically at the lowest level of oxygen concentration on
the upper slope (Fig. 9) and not in any other habitat included in the present study. Some other species
were restricted to specific areas. Mediomastus sp., Arenicola sp., Levinsenia sp.1, Ancistrasyllis
constricta were confined to the shelf, Cirratulidae sp. 2 to the slope and Lumbriconereis sp.2,
Polyopthalmus sp., Cirratulidae sp. 3 to the basin sites (Table 3). Of the non-polychaete taxa,
oligochaetes were found only on the shelf and thus were also restricted to the upper portion of the
OMZ. Oligochaetes have been reported from the low-oxygen zone in a basin off Peru with partially
laminated sediments (Levin et al. 2002). During the present study, macrofaunal diversity was generally
higher at shelf and basin sites than on the slope reflecting the lower concentration of oxygen in the
slope region.
The bathymetric distribution of polychaete feeding types is directly related to the amount of organic
matter available in the sediments, with SDF strongly dominating the slope regions. Moreover, the
proportion of carnivores in the shelf and basin regions increased with depth, proportional to the decline
in the deposit-feeding component. The positive relationship between Corg and deposit feeders, and the
increase of carnivores where deposit feeders were less abundant has been observed at the Oman and
Crete margins (Levin et al. 2000; Tselepides et al. 2000).
13
The result of the present study suggests that macrobenthic community structure on the western Indian
margin is not determined by a single factor, but instead is influenced by a combination of environmental
factors. Discussing animal-sediment relationships, Snelgrove & Butman (1994) concluded that the
complexity of soft-sediment communities may defy any simple paradigm with regard to any single factor
controlling their settlement and colonization. The distribution of annelids within OMZs worldwide has
been reviewed by Levin (2003), who has suggested the different patterns of community structure are
due to changes of hydrodynamic, bathymetric or geochemical factors rather than dissolved oxygen
alone. Among the biological parameters, abundance and biomass positively correlated with sand and
correlated negatively with silt. This is because the sand percentage was higher in shallow water, where
higher faunal abundance and biomass were also higher. Similarly, P. pinnata, Cossura sp. and
Ancistrasyllis sp. were also observed in sandy sediment at low oxygen concentrations on the western
Indian shelf (Jayaraj et al. 2008b). The increase of Chl-a, in both water and sediment, was related to
the enhanced phytoplankton production in the study area.
Summary and Conclusions
This study reveals several novel characteristics of macrofaunal communities and their response to
habitat heterogeneity on the western Indian margin. The physiographic provinces and their related
environmental characteristics in the study area generated habitat heterogeneity, which is summarized
below together with the corresponding community characteristics.
a) The shelf (34, 48, 102 m) was dominated by sandy sediment with low DO. It included part of the
OMZ at 102 m, and had moderately high sediment Corg content. The shelf contained the highest
abundance and biomass with moderately high diversity, species richness and SDF feeding
types.
b) The slope (525, 1001, 1524 m) was characterized by silty sediment and included the OMZ
above the lower slope with higher Corg. Diversity and species richness were lowest and the
percentage of SDF feeding types was highest here.
c) The basin (2001, 2546 m) appears to be a normoxic region with silty texture and lower Corg
content. This region displayed the highest diversity, species richness and presence of fauna
with the maximum numbers of feeding types.
14
Dominant taxa and faunal composition differed along the gradient of habitat heterogeneity. In general,
results from the Pakistan margin were weak predictors for macrofaunal community structure along the
Indian margin. The reason for low abundance and biomass in the core and lower boundary parts of the
OMZ in the western Indian margin compared to other areas is not clear. Furthermore, the results of the
present study did not support our second hypothesis, as macrofaunal abundance and biomass were
lower in the OMZ region, except for the in the shallowest part (48, 102 m) where abundance and
biomass were high. We believe that further investigation based on seasonal sampling in the shelf
region and high-resolution sampling in the OMZ region is required to understand the community
interaction with seasonal, environmental changes on the western Indian continental margin.
Acknowledgements
The authors are thankful to Dr S. R. Shetye, Director, NIO for his encouragement. We also express our
gratitude to the scientific team and crew members of ORV Sagar Kanya for their help during sampling.
We wish to acknowledge the support received from Dr. M. Sudhakar of MoES for ship time.
Comments and suggestions from three anonymous reviewers and Prof. Lisa Levin helped in improving
the manuscript. Our special thanks to Ms. Jennifer Gonzalez, Scripps Institution of Oceanography, La
Jolla, California and Andy Gooday, National Oceanography Centre, UK for meticulously going through
the manuscript and suggesting language corrections. This is the contribution no.………of NIO (CSIR)
Goa.
15
References
Ansari Z.A., Parulekar S.N., Harkantra S.N., Ayyappan,Nair. (1977) Shallow water macrobenthos of the central west coast of India. Mahasagar – Bulleten of National Insitute of Oceanography, 10, 123–127.
Arntz W.E., Tarazona J., Gallardo V., Flores L., Salzwedel H. (1991) Benthos communities in oxygen deficient shelf and upper slope areas of the Peruvian and Chilean Pacific coast, and changes caused by El Nino. In: R.V. Tyson & T.H. Pearson (Eds). Modern and Ancient Continental Shelf Anoxia. Geological Society Special Publication No. 58, London, 131-154.
Bange H.W., Naqvi S.W.A., Codispoti L.A. (2005) The nitrogen cycle in the Arabian Sea. Progress in Oceanography, 65, 145-158.
Brandt A., Gooday A.J., Brandão S.N., Brix S., Brökeland W., Cedhagen T., Choudhury M., Cornelius N., Danis B., De Mesel I., Diaz R.J., Gillan D.C., Ebbe B., Howe J.A., Janussen D., Kaiser S., Linse K., Malyutina M., Pawlowski J., Raupach M., Vanreusel A. (2007) First insights into the biodiversity and biogeography of the Southern Ocean deep sea. Nature, 447, 307-11.
Chakraborty B.R., Mukhopadhyay P., Jauhari V., Mahale K., Shashikumar., Rajesh M. (2006) Fine-scale analysis of the shelf-slope physiographic across the western continental margin of India. Geological Marine Letters, 26, 114-119.
Clarke K.R., Warwick R.M. (1994) Change in Marine Communities: an Approach to Statistical Analysis and Interpretation. Plymouth Marine Laboratory, 144.
Cowie G.L., Levin L.A. (2009) Benthic biological and biogeochemical patterns and process across an oxygen minimum zone (Pakistan margin, NE Arabian Sea). Deep-Sea Research, 56, 261-270.
Dojiri M., Sieg J. (1997) The Tanaidacea. In: J.A. Blake., P.H. Scott (Eds). Taxonomic Atlas of the Benthic Fauna of the Santa Maria Basin and western Santa Barbara Channel, Santa Barbara Museum of Natural History, Santa Barbara,181–278 Chapter 11: The Crustacea, Part 2 The Isopoda, Cumacea and Tanaidacea I-V.
Fauchald K., Jumars P. (1979) The diet of worms: a study of polychaete feeding guilds. Oceanography and Marine Biology: an Annual Review, 17, 194-284.
Flach E., Thomsen L. (1998) Do physical and chemical factors structure the macrobenthic community at a continental slope in the NE Atlantic? Hydrobiologia, 375/376, 265-285.
Gallardo V.A., Palma M., Carrasco F.D., Gutiérrez D., Levin L.A., Cañete J.I. (2004) Macrobenthic zonation caused by the oxygen minimum zone on the shelf and slope off central Chile. Deep-Sea Res II 51, 2475–2490.
Gooday A.J., Levin L.A., Aranda da Silva A., Bett B.J., Cowie G.L., Dissard D., Gage J.D., Hughes D.J., Jeffreys R., Lamont P.A., Larkin K.E., Murty S.J., Schumacher S., Whitcraft C., Woulds C. (2009)
16
Faunal responses to oxygen gradients on the Pakistan margin: A comparison of foraminiferans, macrofauna and megafauna. Deep-Sea Research, 56, 488-502.
Grassle J.F., Morse-Porteous L.S. (1987) Macrofaunal colonization of disturbed deep-sea environments and the structure of deep-sea benthic communities. Deep-Sea Research, A 34, 1911–1950.
Harkantra S.N. (2004) Benthos and demersal fishery resources assessment in the shelf region of Indian coast. In: V. S. Somvanshi (Eds). Large marine ecosystems: Exploration and exploitation for sustainable development and conservation on fish stocks, Fishery survey of India: 54–58.
Harkantra S.N., Ayyappan N., Ansari Z.A., Parulekar A.H. (1980) Benthos of shelf region along the west coast of India. Indian Journal of Marine Science, 9, 106–110.
Helly J.J., Levin L.A. (2004) Global distribution of naturally occurring marine hypoxia on continental margins. Deep-Sea Research I, 51, 1159-1168.
Holm-Hansen O. (1978) Chlorophyll a determination: Improvements in methodology. Oikos, 30, 438–447.
Hughes D.J., Levin L.A., Lamont P.A., Packer M., Feeley K., Gage J.D. (2009) Macrofaunal communities and sediment structure across the Pakistan margin Oxygen Minimum Zone, North-East Arabian Sea. Deep-Sea Research II, 56, 434-448.
Ingole B., Sivadas S., Nanajkar M., Sautya S., Nag A. (2009) A comperative study of macrobenthic community from harbours along the central west coast of India. Environmental Monitoring and Assessment, 154, 135-146.
Jayakumar A., O’Mullan G.D., Naqvi S.W.A., Ward B.B. (2009) Denitrifying bacterial community composition changes associated with stages of denitrification in oxygen minimum zones. Microbial Ecology, 58, 350-362.
Jayaraj K. A., Jayalakshmi K. V., Saraladevi K. (2007) Influence of environmental properties on macrobenthos in the northwest Indian shelf. Environmental Monitoring and Assessment, 127, 459- 475.
Jayaraj K.A., Josia J., Dinesh Kumar P.K. (2008a) Infaunal macrobenthic community of soft bottom sediment in a tropical shelf. Journal of Coastal Research, 24, 708-718.
Jayaraj K.A., Sheeba P., Josia Jacob., Revichandran C., Arun P.K., Praseeda K.S., Nisha P.A., Rasheed K.A. (2008b) Response of infaunal macrobenthos to the sediment granulometry in a tropical continental margin–southwest coast of India. Estuarine, Coastal and Shelf Science, 77, 743-754.
Joydas T.V., Damodaran R. (2009) Infaunal macrobenthos along the shelf waters of the west coast of India, Arabian Sea. Indian Journal of Marine Science, 38, 191-204.
Kurian C.V. (1971) Distribution of benthos on the southwest coast of India. In: J.D., Costlow Jr. (Eds). Fertility of the sea. New York: 225-239.
17
Levin L.A., Etter R.J., Rex M.A., Gooday A.J., Smith C.R., Pineda J., Stuart C.T., Hessler R.R., Pawson D. (2001) Environmental influences on regional deep sea species diversity. Annual Review of Ecology and Systematics, 32, 51-93.
Levin L.A., Gutiérrez D., Rathburn A., Neira C., Sellanes J., Muñoz P., Gallardo V., Salamanca M. (2002) Benthic process on the Peru margin: a transect across the oxygen minimum zone during the 1997-98 El Niño. Progress in oceanography, 53, 1-27.
Levin L.A. (2003) Oxygen minimum zone benthos: adaptation and community response to hypoxia. Oceanography and Marine Biology: an Annual Review, 41, 1–45.
Levin L.A., Gage J.D., Martin C., Lamont P.A. (2000) Macrobenthic community structure within and beneath the oxygen minimum zone, NW Arabian Sea. Deep-Sea Research II, 47, 189 - 226.
Levin L.A., Whicraft C.R., Mendoza G.F., Gonzalez J.P., Cowie G. (2009) Oxygen and organic matter thresholds for benthic activity on the Pakistan margin minimum zone (700-1100 m), Deep-Sea Research II, 56, 449-471.
Levinton J.S. (1982) Marine ecology. Prentice-Hall Publ. Co. New Jersey: Englewood Cliffs: 526 pp.
Madhupratap M., Prasanna Kumar S., Bhattathri P.M.A., Dileep Kumar M., Raghukumar S., Nair K.K.C., Ramaiah N. (1996) Mechanism of the biological response to winter cooling in the northeastern Arabian Sea. Nature, 384, 549-552.
Margalef R. (1968) Perspectives in Ecological Theory. University of Chicago Press, Chicago: 111 pp.
Mullins H.T., Thompson J.B., McDougall K., Vercoutere T.L. (1985) Oxygen minimum zone edges effects: evidence from the central California coastal upwelling system. Geology, 13, 491–494.
Murty S.J., Bett B.J., Gooday A.J. (2009) Megafaunal responses to strong oxygen gradients on the Pakistan margin of the Arabian Sea. Deep-Sea Research, 56, 472-487.
Naik H., Naqvi S. W.A. (2002Naik H., Naqvi S.W.A. (2002) Sedimentary nitrogen cycling over the western continental shelf of India, EOS-Transactions of the American Geophysical Union: 83 (4) OSM Supplement, Abstract, OS: 121-05.
Naqvi S.W.A., Narvekar P.V., Desa E. (2006) Coastal biogeochemical processes in the north Indian Ocean (14, S-W). In: The Sea: Ideas and observations on progress in the study of the seas. (Eds) Robinson A.R., Brink K.H. Interdisciplinary regional studies and syntheses. Part A, Harvard University Press; Cambridge, MA; USA, Vol. 14, pp. 723-781.
Neyman A. A. (1969) Some data on the benthos of the shelves in the northern part of the Indian Ocean. (Paper presented at the scientific conference on the tropical zone of the oceans, All Union Scientific Research Institute of Marine Fisheries and Oceanography, U.S.S.R.).
Plama M., Quiroga E., Gallardo V.A., Arntz W., Gerdes D., Schneider W., Hebbeln D. (2005) Macrobenthic animal assemblages of the continental margin off Chile (22° to 42°S) Journal of Marine Biological Association U.K., 85, 233-245.
18
Parulekar A.H., Harkantra S.N., Ansari Z.A. (1982) Benthic production and assessment of demersal fishery resources of the Indian seas. Indian Journal of Marine Science, 11, 107–114.
Parulekar A. H., Wagh A. B. (1975) Quantitative studies on benthic macrofauna of northeastern Arabian Sea shelf. Indian Journal of Marine Science, 4, 174-176.
Parulekar A.H., Dwivedi S.N. (1974). Benthic studies in Mormugao estuaries, Part-I Standing crop and faunal composition in relation to bottom salinity distribution and substratum characteristics in the estuary of Mandovi River. Indian Journal of Marine Science, 3, 41–45.
Pavithran S., Ingole B.S., Nanajkar M., Nath B.N. (2007) Macrofaunal diversity in the Central Indian Ocean Basin. Biodiversity, 8, 11-16.
Pielou E.C. (1966) Species diversity and pattern diversity in the study of ecological succession. Journal of Theoretical Biology, 10, 372- 383.
Prasanna Kumar S., Madhupratap M., Dileep Kumar M., Gauns M., Muraleedharan P.M., Sarma V.V.S.S., De Souza S.n. (2000) Physical control of primary productivity on a seasonal scale in central and eastern Arabian Sea. Journal of Earth System Science, 103, 433-441.
Qasim S.Z. (1977) Biological productivity of the Indian Ocean. Indian Journal of Marine Science, 6, 122–137.
Qasim S.Z. (1982) Oceanography of the northern Arabian Sea. Deep-Sea Research A, 29,1041-1068.
Rao B.R., Veerayya M. (2000) Influence of marginal highs on the accumulation of organic carbon along the continental slope off western India. Deep-Sea Reseah II, 47, 303-327.
Reichart G.L., Lourens L.J., Zachariasse W.J. (1998) temporal variability in the northern Arabian Sea oxygen minimum zone (OMZ) during last 225,000 years. Paleoceanography, 13, 607-621.
Rosenberg R., Arntz W.E., Chuma´n de Flores E., Flores L.A., Carbajal G., Finger I. &
Tarazona J. (1983) Benthos biomass and oxygen deficiency in the upwelling system off Peru. Journal of Marine Research, 41, 263–279.
Ryther J. H., Menzel D. W. (1965) On the production, composition, and distribution of organic matter in the Western Arabian Sea. Deep-Sea Research, 12, 199–209.
Sanders H.L., Hessler R.R., Hampson G.R. (1965) An introduction to the study of deep-sea benthic faunal assemblages along the Gay Head-Bermuda transect. Deep-Sea Research, 12, 845-867.
Shannon C.E., Weaver W. (1963) The Mathematical Theory of Communication. University of Illinois Press, Urbana, Illinois, 144 pp.
19
Snelgrove P.V.R., Butman C.A. (1994) Animal-sediment relationships revisited: cause versus effect, Oceanography and Marine Biology: an Annual Review 32 , 111–177.
Stramma L.,Fischer J., Schott F. (1996) The flow field off southwest India at 8°N during the southwest monsoon of August 1993. Journal of Marine Research, 54, 55-72.
Strickland J.D.H., Parsons T.R. (1968) Determination of dissolve oxygen. In: A manual of seawater analysis. Fisheries Research Board of Canada, Bulletin, 16, 1-75.
Swallow J.C. (1984) Some aspects of the physical oceanography of the Indian Ocean. Deep-Sea Research, 31, 639–650.
Thompson J.B., Mullins H.T., Newton C.R., Vercoutere T. (1985) Alternative biofacies model for dysaerobic communities. Lethaia, 18, 167–179.
Tselepides A., Papadopoulou K., Podaras D., Plaiti W., Koutsoubas D. (2000) Macrobenthic community structure over the continental margin of Crete (South Aegean Sea, NE Mediterranean. Progress in Oceanography, 46, 401-428.
Venkateswaran S.V. (1956) On evaporation from the Indian Ocean. Indian Journal Meteorology Geophysics, 7, 265–284.
Wiggert J.D., Hood R.R., Banse K., Kindle J.C. (2005) Monsoon-driven biogeochemical process in the Arabian Sea. Progress in Oceanography, 65, 176-213.
Wishner K.L., Ashijan C.J., Gelfman C., Gowing M.M., Kann L., Levin L.A., Mullineaux L.S., Saltzman J. (1995) Pelagic and benthic ecologyof the lower interface of the Eastern Tropical Pacific oxygen-minimum zone. Deep-Sea Research II, 42, 93–115.
20
Legends to the text figures:
Fig. 1. Location map of the study area.
Fig. 2 Depth-wise distribution of macrofaunal groups
Fig. 3. Macrofaunal abundance (ind.m-2)
Fig.4. Macrofaunal biomass (g.m-2)
Fig. 5. Rank 1 species at various depths and their composition along the sampling transect
Fig. 6 MDS analysis of macrofaunal community
Fig. 7. Depth-wise distribution of community structure indices (d: Margalef index, J´: evenness and H´:
diversity)
Fig.8. Depth-wise distribution of macrobenthic feeding types (%) (SDF: Surface deposit feeders;
SSDF:Sub-surface deposit feeders; CF: Carnivore feeder; FF: Filter feeders).
Fig.9. Photograph of anterior part of Prionospio pinnata with well-developed branchia observed in upper
the slope OMZ.
21
Fig.1
Fig.2
22
Fig. 3
Fig. 4
23
Fig. 5
24
Fig. 6
Fig. 7
25
Fig. 8
Fig. 9
1
Table 1. Geographical position and other information regarding sediment sampling
Collection date
Stations Lat(°N) Long(°E) Depth (m)
Number of box cores Sub core from box core A
Sub core from box core B
11.8.07 43 13°54.26’ 74°18.97’ 34 2 3 3
11.8.07 44 13°59.88’ 74°00.03’ 48 2 3 2
11.8.07 45 14°00.29’ 73°29.94’ 102 2 3 2
12.8.07 46 14°00.24’ 73°13.97’ 525 2 2 2
12.8.07 47 14°00.25’ 73°08.11’ 1001 1 1 -
13.8.07 48 14°00.30’ 72°57.22’ 1524 2 1 1
14.8.07 49 14°00.09’ 71°13.21’ 2001 2 3 3
15.8.07 50 13°59.55’ 70°48.40’ 2546 2 3 3
2
Table 2. Physico-chemical characteristics of habitats examined on the western Indian Continental Margin Habitat Shelf Slope Basin Depth (m) 34 48 102 525 1001 1524 2001 2546 Bottom water Temperature, °C 23.2 20.84 18 10.7 7.85 5 - - Salinity, psu 35.8 35.5 35.1 35.3 35.2 35 - - DO, ml L-1 0.69 0.56 0.38 0.08 0.28 1.35 2.3 2.3 Chl a µg.l-1 0.06 0.18 0.009 0.0009 0.0004 0.0005 0.001 0.084 Sediment (0-2) Chl a µg.g-1 1.4 0.2 0.6 0.7 2.1 0.6 0.6 0.2 Corg (%) 1.9 0.8 1.5 3.8 4.4 2.2 0.3 0.9 C:N 11.0 * 10.3 10.8 8.9 8.2 4.6 4.9 Clay (%) 8.3 9.8 3.0 12.9 13.2 8.7 15.1 15.6 Silt (%) 75.6 39.7 38.5 53.6 84.5 89.4 79.2 71.7 Sand (%) 16.0 50.5 58.5 33.5 2.3 1.9 5.7 12.7 Colour Olive
gray 5Y 4/1
Pale yellowish orange
10YR 8/6
Light olive gray
5Y 6/1
Grayish olive green
5GY 3/2
Grayish olive green
10Y 4/2
Yellowish gray
5Y 7/2
Grayish yellow 5Y 8/4
Vary pale orange
10YR 8/2
Texture Clayey silt Slity sand Silty sand Sandy silt Clayey silt Clayey silt Clayey silt Clayey silt CaCO3 26.8 69.2 65.1 44.5 28.3 24.5 49.3 53.7 (* N value was very low)
3
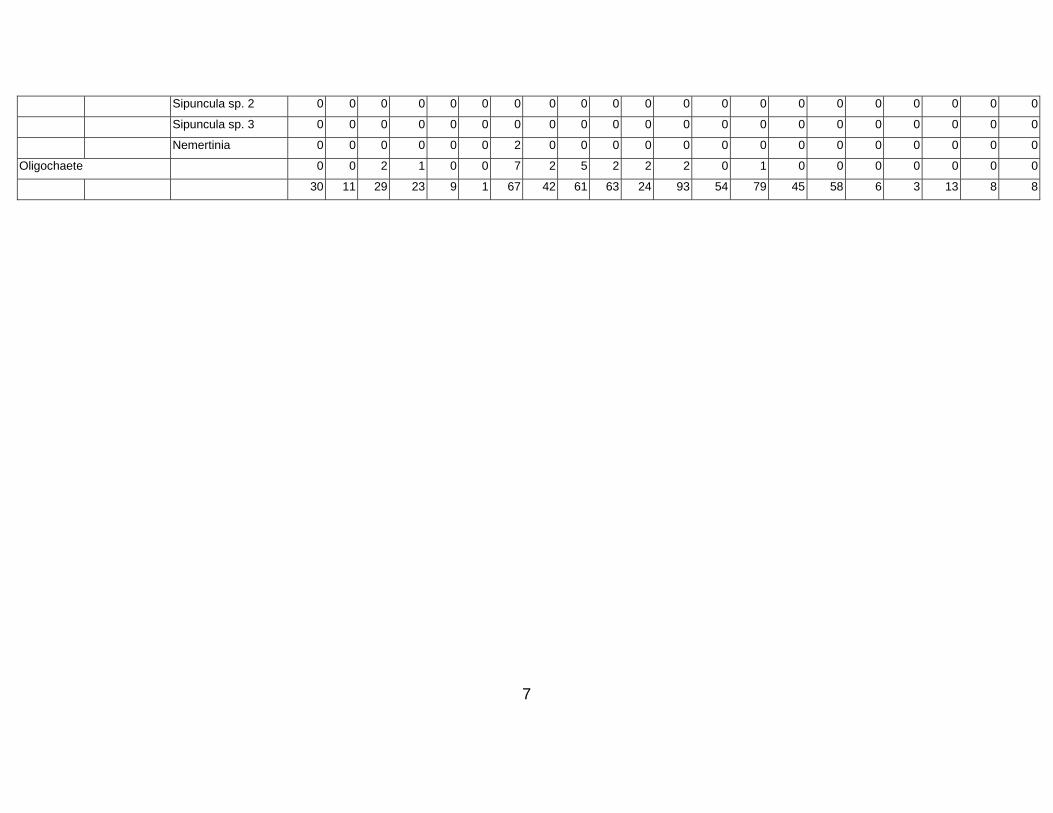
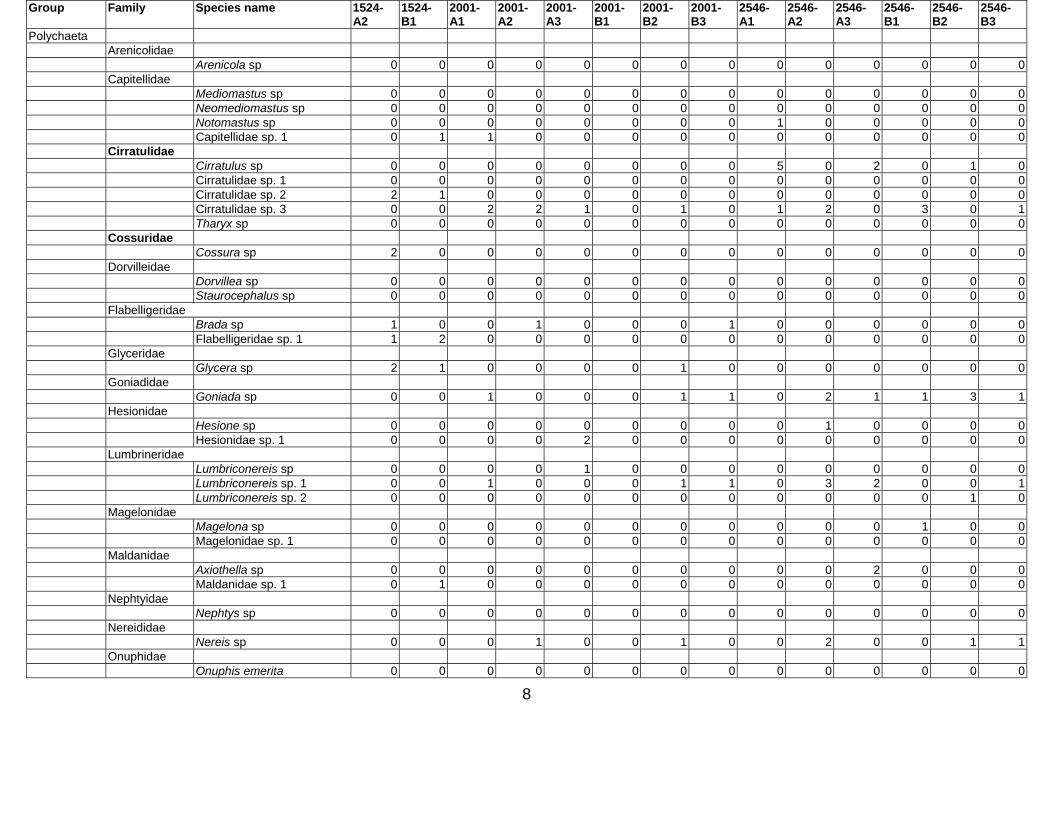
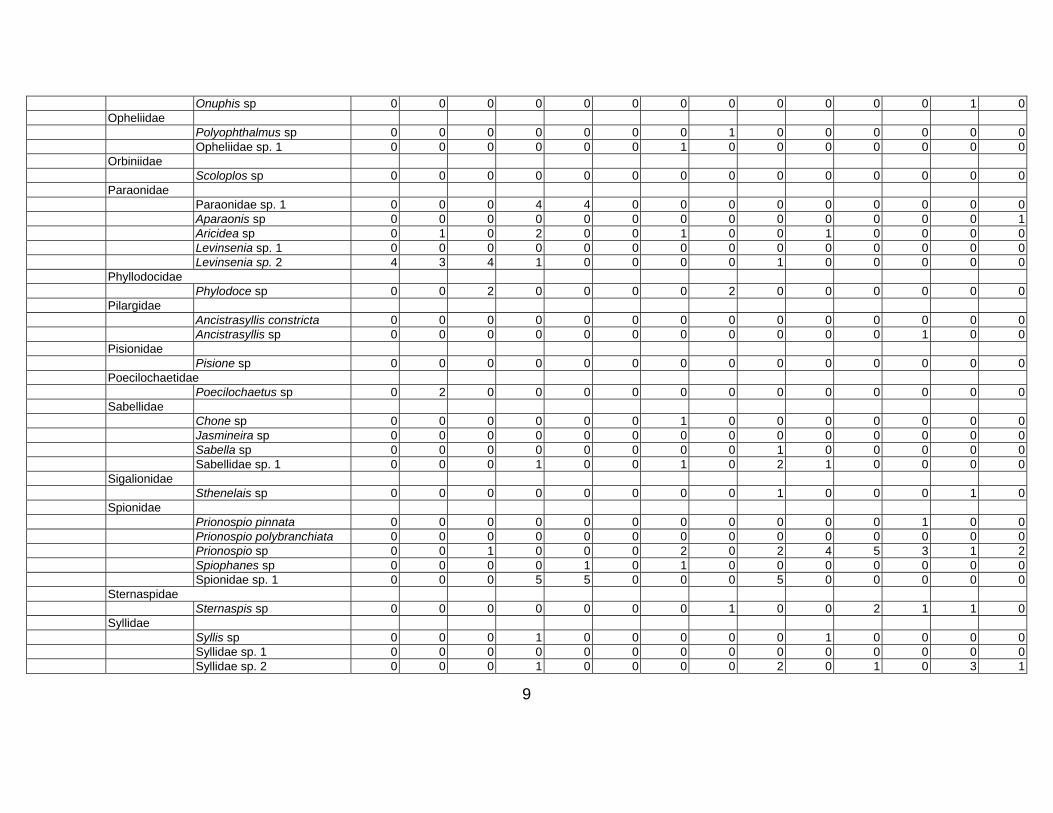
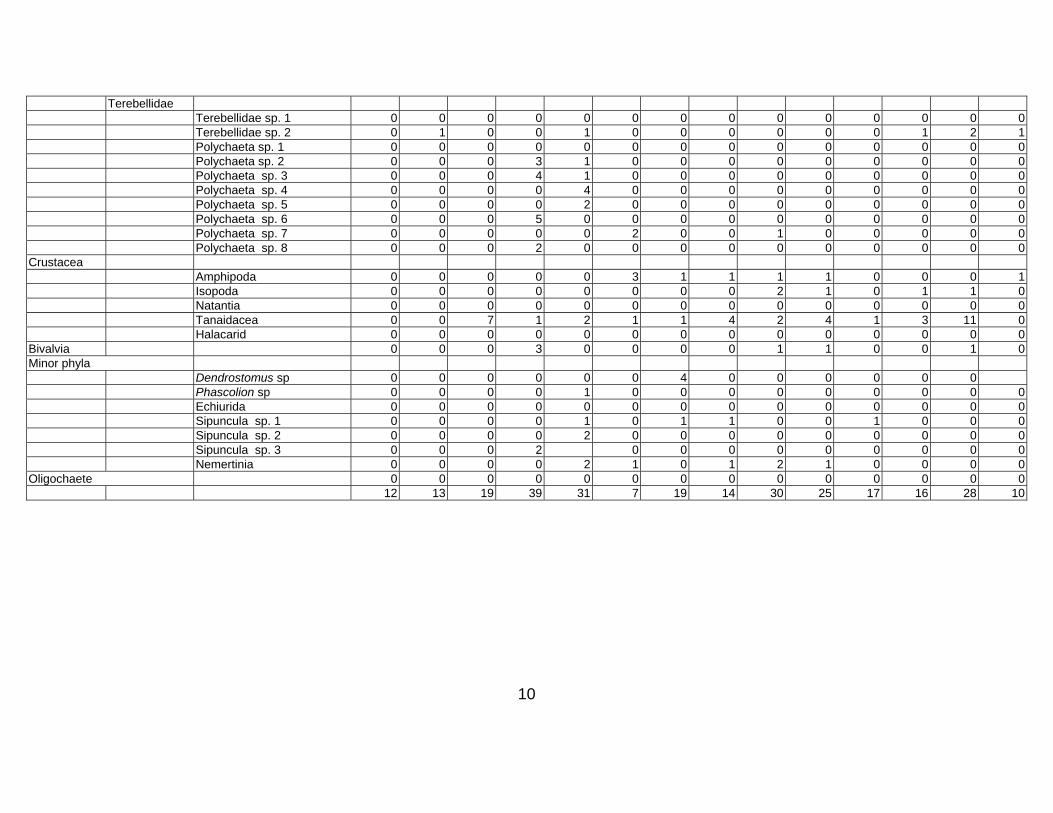
Table 3. Taxon list and count data for Western Indian Continental Margin macrofauna (counts are given as number per core, 15 cm diam × 10 cm deep)
Stations depth (m) Group Family Species name 34-A1 34-
A2 34-A3
34-B1 34-B2
34-B3
48-A1
48-A2
48-A3
48-B1
48-B2
102-A1
102-A2
102-A3
102-B1
102-B2
525-A1
525-A2
525-B1
525-B2
1001
Polychaeta
Arenicolidae
Arenicola sp 0 0 0 0 0 0 0 0 0 0 0 0 0 0 1 0 0 0 0 0 0
Capitellidae
Mediomastus sp 1 0 1 0 1 0 0 0 0 0 0 23 10 18 7 18 0 0 0 0 0
Neomediomastus sp 0 0 0 0 0 0 0 0 0 0 0 1 0 0 0 1 0 0 0 0 0
Notomastus sp 0 0 0 0 0 0 0 0 0 0 0 0 0 0 0 0 0 0 0 0 0
Capitellidae sp. 1 0 0 0 0 0 0 0 0 0 0 0 0 0 0 0 0 0 0 0 0 0
Cirratulidae
Cirratulus sp 0 0 0 0 0 0 1 1 4 1 0 1 0 0 0 5 0 0 0 0 0
Cirratulidae sp. 1 0 0 1 0 0 0 0 0 0 0 1 0 9 6 2 0 0 0 0 0 0
Cirratulidae sp. 2 0 0 0 0 0 0 0 0 0 0 0 0 0 0 0 0 0 0 2 2 2
Cirratulidae sp. 3 0 0 0 0 0 0 0 0 0 0 0 0 0 0 0 0 0 0 0 0 0
Tharyx sp 0 0 1 0 0 0 0 0 0 0 0 0 0 0 0 0 0 0 0 0 0
Cossuridae
Cossura sp 0 0 0 0 0 0 0 0 0 0 0 7 1 12 5 3 0 0 1 0 5
Dorvilleidae
Dorvillea sp 0 0 0 0 0 0 13 0 1 1 0 0 0 0 0 0 0 0 0 0 0
Staurocephalus sp 0 0 0 0 0 0 1 10 6 1 3 0 0 0 0 0 0 0 0 0 0
Flabelligeridae
Brada sp 0 0 0 0 0 0 0 4 3 0 0 0 0 0 0 0 0 0 0 0 0
Flabelligeridae sp. 1 0 0 0 0 0 0 0 0 0 0 0 0 0 0 0 0 0 0 0 0 0
Glyceridae
Glycera sp 0 0 0 0 0 0 0 0 0 1 0 1 0 0 0 0 0 0 0 0 0
Goniadidae
4
Goniada sp 0 0 0 0 0 0 0 0 1 0 0 0 0 0 0 0 0 0 0 0 0
Hesionidae
Hesione sp 0 0 0 0 0 0 0 0 0 0 0 0 0 0 0 0 0 0 0 0 0
Hesionidae sp. 1 0 0 0 0 0 0 13 0 0 3 0 0 0 0 0 0 0 0 0 0 0
Lumbrineridae
Lumbriconereis sp 1 1 1 0 1 0 0 0 3 0 1 1 1 0 0 1 0 0 0 0 0
Lumbriconereis sp. 1 0 0 0 0 0 0 0 0 0 0 0 0 0 0 0 0 0 0 0 0 0
Lumbriconereis sp. 2 0 0 0 0 0 0 0 0 0 0 0 0 0 0 0 0 0 0 0 0 0
Magelonidae
Magelona sp 0 0 0 0 0 0 1 0 0 0 0 4 0 0 0 1 0 0 0 0 0
Magelonidae sp. 1 0 0 0 0 0 0 0 0 0 0 0 0 0 0 0 0 0 1 0 0 0
Maldanidae
Axiothella sp 0 0 0 0 0 0 0 0 0 0 0 0 0 0 0 0 0 0 0 0 0
Maldanidae sp. 1 0 0 0 0 0 0 0 0 0 0 0 0 0 0 0 0 0 0 0 0 1
Nephtyidae
Nephtys sp 0 0 0 0 0 0 0 0 1 2 0 0 0 2 0 0 0 0 0 0 0
Nereididae
Nereis sp 0 0 0 0 0 0 0 0 0 0 2 0 0 0 0 0 0 0 0 0 0
Onuphidae
Onuphis emerita 0 0 0 0 0 0 0 1 0 0 0 2 0 0 0 0 1 0 0 0 0
Onuphis sp 0 0 0 0 0 0 0 0 0 0 0 0 0 0 0 0 0 0 0 0 0
Opheliidae
Polyophthalmus sp 0 0 0 0 0 0 0 0 0 0 0 0 0 0 0 0 0 0 0 0 0
Opheliidae sp. 1 0 0 0 0 0 0 0 0 0 0 0 0 0 0 0 0 0 0 0 0 0
Orbiniidae
Scoloplos sp 0 0 0 0 0 0 0 0 0 1 0 1 0 0 0 0 0 0 0 0 0
Paraonidae
Paraonidae sp. 1 0 0 0 0 0 0 0 0 0 0 0 0 0 0 0 0 0 0 0 0 0
5
Aparaonis sp 0 0 0 0 0 0 0 0 0 0 0 0 0 0 0 0 0 0 0 0 0
Aricidea sp 22 5 21 12 4 1 0 2 1 0 3 6 7 8 5 8 0 0 0 0 0
Levinsenia sp. 1 0 0 0 0 0 0 9 6 4 37 0 2 2 5 2 2 0 0 2 0 0
Levinsenia sp. 2 0 0 0 0 0 0 0 0 0 0 0 0 0 0 0 0 0 0 0 0 0
Phyllodocidae
Phylodoce sp 0 0 0 0 0 0 0 0 0 0 0 0 0 0 0 0 0 0 0 0 0
Pilargidae
Ancistrasyllis constricta
0 0 0 0 0 0 0 5 9 0 0 6 3 6 5 0 0 0 0 0 0
Ancistrasyllis sp 0 0 0 1 0 0 0 0 0 2 0 0 0 0 0 2 0 0 1 0 0
Pisionidae
Pisione sp 0 0 0 0 0 0 9 0 0 0 0 0 0 0 0 0 0 0 0 0 0
Poecilochaetidae
Poecilochaetus sp 0 0 0 0 0 0 1 0 0 1 0 0 0 0 0 0 0 0 0 0 0
Sabellidae
Chone sp 0 0 0 0 0 0 0 0 0 0 0 0 0 0 0 0 0 0 0 0 0
Jasmineira sp 0 0 0 0 0 0 0 0 0 0 0 3 3 4 1 0 1 0 0 0 0
Sabella sp 0 0 0 0 0 0 0 0 0 0 0 0 0 0 0 0 0 0 0 0 0
Sabellidae sp. 1 0 0 0 0 0 0 0 0 0 0 0 0 0 0 0 0 0 0 0 0 0
Sigalionidae
Sthenelais sp 0 0 0 0 0 0 0 0 0 0 0 0 0 0 0 0 0 0 0 0 0
Spionidae
Prionospio pinnata 1 3 2 6 2 0 9 1 5 8 1 22 9 5 4 8 4 2 5 4 0
Prionospio polybranchiata
0 0 0 0 0 0 0 0 0 0 0 0 0 0 0 1 0 0 0 0 0
Prionospio sp 0 0 0 0 0 0 0 0 0 0 0 7 4 10 7 3 0 0 0 0 0
Spiophanes sp 0 0 0 0 0 0 0 0 0 0 0 0 0 0 0 0 0 0 0 0 0
Spionidae sp. 1 0 0 0 0 0 0 0 0 0 0 0 0 0 0 0 0 0 0 0 0 0
Sternaspidae
6
Sternaspis sp 3 0 0 2 0 0 0 0 2 0 2 0 0 0 0 0 0 0 0 0 0
Syllidae
Syllis sp 0 0 0 0 0 0 0 3 7 0 6 0 0 0 1 0 0 0 0 0 0
Syllidae sp. 1 0 0 0 0 0 0 1 0 0 1 0 1 0 0 0 0 0 0 0 0 0
Syllidae sp. 2 0 0 0 0 0 0 0 0 0 0 0 0 0 0 0 0 0 0 0 0 0
Terebellidae
Terebellidae sp. 1 2 1 0 0 0 0 0 0 0 1 0 0 3 2 2 1 0 0 0 0 0
Terebellidae sp. 2 0 0 0 0 0 0 0 0 0 0 0 0 0 0 0 0 0 0 0 0 0
Polychaeta sp. 1 0 0 0 0 0 0 0 0 0 1 0 0 0 0 0 0 0 0 0 0 0
Polychaeta sp. 2 0 0 0 0 0 0 0 0 0 0 0 0 0 0 0 0 0 0 0 0 0
Polychaeta sp. 3 0 0 0 0 0 0 0 0 0 0 0 0 0 0 0 0 0 0 0 0 0
Polychaeta sp. 4 0 0 0 0 0 0 0 0 0 0 0 0 0 0 0 0 0 0 0 0 0
Polychaeta sp. 5 0 0 0 0 0 0 0 0 0 0 0 0 0 0 0 0 0 0 0 0 0
Polychaeta sp. 6 0 0 0 0 0 0 0 0 0 0 0 0 0 0 0 0 0 0 0 0 0
Polychaeta sp. 7 0 0 0 0 0 0 0 0 0 0 0 0 0 0 0 0 0 0 0 0 0
Polychaeta sp. 8 0 0 0 0 0 0 0 0 0 0 0 0 0 0 0 0 0 0 0 0 0
Crustacea
Amphipoda 0 0 0 0 0 0 0 0 0 0 0 0 0 0 0 3 0 0 2 2 0
Isopoda 0 0 0 0 0 0 0 1 1 0 0 0 0 0 0 0 0 0 0 0 0
Natantia 0 1 0 0 1 0 0 1 0 0 0 1 0 0 0 0 0 0 0 0 0
Tanaidacea 0 0 0 0 0 0 0 5 5 0 2 1 2 0 3 1 0 0 0 0 0
Halacarid 0 0 0 0 0 0 0 0 1 0 0 0 0 0 0 0 0 0 0 0 0
Bivalvia 0 0 0 0 0 0 0 0 2 0 0 0 0 0 0 0 0 0 0 0 0
Minor phyla
Dendrostomus sp 0 0 0 0 0 0 0 0 0 0 0 0 0 0 0 0 0 0 0 0 0
Phascolion sp 0 0 0 0 0 0 0 0 0 0 0 0 0 0 0 0 0 0 0 0 0
Echiurida 0 0 0 0 0 0 0 0 0 0 0 1 0 0 0 0 0 0 0 0 0
Sipuncula sp. 1 0 0 0 1 0 0 0 0 0 0 1 0 0 0 0 0 0 0 0 0 0
7
Sipuncula sp. 2 0 0 0 0 0 0 0 0 0 0 0 0 0 0 0 0 0 0 0 0 0
Sipuncula sp. 3 0 0 0 0 0 0 0 0 0 0 0 0 0 0 0 0 0 0 0 0 0
Nemertinia 0 0 0 0 0 0 2 0 0 0 0 0 0 0 0 0 0 0 0 0 0
Oligochaete 0 0 2 1 0 0 7 2 5 2 2 2 0 1 0 0 0 0 0 0 0
30 11 29 23 9 1 67 42 61 63 24 93 54 79 45 58 6 3 13 8 8
8
Group Family Species name 1524-A2
1524-B1
2001-A1
2001-A2
2001-A3
2001-B1
2001-B2
2001-B3
2546-A1
2546-A2
2546-A3
2546-B1
2546-B2
2546-B3
Polychaeta Arenicolidae Arenicola sp 0 0 0 0 0 0 0 0 0 0 0 0 0 0 Capitellidae Mediomastus sp 0 0 0 0 0 0 0 0 0 0 0 0 0 0 Neomediomastus sp 0 0 0 0 0 0 0 0 0 0 0 0 0 0 Notomastus sp 0 0 0 0 0 0 0 0 1 0 0 0 0 0 Capitellidae sp. 1 0 1 1 0 0 0 0 0 0 0 0 0 0 0 Cirratulidae Cirratulus sp 0 0 0 0 0 0 0 0 5 0 2 0 1 0 Cirratulidae sp. 1 0 0 0 0 0 0 0 0 0 0 0 0 0 0 Cirratulidae sp. 2 2 1 0 0 0 0 0 0 0 0 0 0 0 0 Cirratulidae sp. 3 0 0 2 2 1 0 1 0 1 2 0 3 0 1 Tharyx sp 0 0 0 0 0 0 0 0 0 0 0 0 0 0 Cossuridae Cossura sp 2 0 0 0 0 0 0 0 0 0 0 0 0 0 Dorvilleidae Dorvillea sp 0 0 0 0 0 0 0 0 0 0 0 0 0 0 Staurocephalus sp 0 0 0 0 0 0 0 0 0 0 0 0 0 0 Flabelligeridae Brada sp 1 0 0 1 0 0 0 1 0 0 0 0 0 0 Flabelligeridae sp. 1 1 2 0 0 0 0 0 0 0 0 0 0 0 0 Glyceridae Glycera sp 2 1 0 0 0 0 1 0 0 0 0 0 0 0 Goniadidae Goniada sp 0 0 1 0 0 0 1 1 0 2 1 1 3 1 Hesionidae Hesione sp 0 0 0 0 0 0 0 0 0 1 0 0 0 0 Hesionidae sp. 1 0 0 0 0 2 0 0 0 0 0 0 0 0 0 Lumbrineridae Lumbriconereis sp 0 0 0 0 1 0 0 0 0 0 0 0 0 0 Lumbriconereis sp. 1 0 0 1 0 0 0 1 1 0 3 2 0 0 1 Lumbriconereis sp. 2 0 0 0 0 0 0 0 0 0 0 0 0 1 0 Magelonidae Magelona sp 0 0 0 0 0 0 0 0 0 0 0 1 0 0 Magelonidae sp. 1 0 0 0 0 0 0 0 0 0 0 0 0 0 0 Maldanidae Axiothella sp 0 0 0 0 0 0 0 0 0 0 2 0 0 0 Maldanidae sp. 1 0 1 0 0 0 0 0 0 0 0 0 0 0 0 Nephtyidae Nephtys sp 0 0 0 0 0 0 0 0 0 0 0 0 0 0 Nereididae Nereis sp 0 0 0 1 0 0 1 0 0 2 0 0 1 1 Onuphidae Onuphis emerita 0 0 0 0 0 0 0 0 0 0 0 0 0 0
9
Onuphis sp 0 0 0 0 0 0 0 0 0 0 0 0 1 0 Opheliidae Polyophthalmus sp 0 0 0 0 0 0 0 1 0 0 0 0 0 0 Opheliidae sp. 1 0 0 0 0 0 0 1 0 0 0 0 0 0 0 Orbiniidae Scoloplos sp 0 0 0 0 0 0 0 0 0 0 0 0 0 0 Paraonidae Paraonidae sp. 1 0 0 0 4 4 0 0 0 0 0 0 0 0 0 Aparaonis sp 0 0 0 0 0 0 0 0 0 0 0 0 0 1 Aricidea sp 0 1 0 2 0 0 1 0 0 1 0 0 0 0 Levinsenia sp. 1 0 0 0 0 0 0 0 0 0 0 0 0 0 0 Levinsenia sp. 2 4 3 4 1 0 0 0 0 1 0 0 0 0 0 Phyllodocidae Phylodoce sp 0 0 2 0 0 0 0 2 0 0 0 0 0 0 Pilargidae Ancistrasyllis constricta 0 0 0 0 0 0 0 0 0 0 0 0 0 0 Ancistrasyllis sp 0 0 0 0 0 0 0 0 0 0 0 1 0 0 Pisionidae Pisione sp 0 0 0 0 0 0 0 0 0 0 0 0 0 0 Poecilochaetidae Poecilochaetus sp 0 2 0 0 0 0 0 0 0 0 0 0 0 0 Sabellidae Chone sp 0 0 0 0 0 0 1 0 0 0 0 0 0 0 Jasmineira sp 0 0 0 0 0 0 0 0 0 0 0 0 0 0 Sabella sp 0 0 0 0 0 0 0 0 1 0 0 0 0 0 Sabellidae sp. 1 0 0 0 1 0 0 1 0 2 1 0 0 0 0 Sigalionidae Sthenelais sp 0 0 0 0 0 0 0 0 1 0 0 0 1 0 Spionidae Prionospio pinnata 0 0 0 0 0 0 0 0 0 0 0 1 0 0 Prionospio polybranchiata 0 0 0 0 0 0 0 0 0 0 0 0 0 0 Prionospio sp 0 0 1 0 0 0 2 0 2 4 5 3 1 2 Spiophanes sp 0 0 0 0 1 0 1 0 0 0 0 0 0 0 Spionidae sp. 1 0 0 0 5 5 0 0 0 5 0 0 0 0 0 Sternaspidae Sternaspis sp 0 0 0 0 0 0 0 1 0 0 2 1 1 0 Syllidae Syllis sp 0 0 0 1 0 0 0 0 0 1 0 0 0 0 Syllidae sp. 1 0 0 0 0 0 0 0 0 0 0 0 0 0 0 Syllidae sp. 2 0 0 0 1 0 0 0 0 2 0 1 0 3 1
10
Terebellidae Terebellidae sp. 1 0 0 0 0 0 0 0 0 0 0 0 0 0 0 Terebellidae sp. 2 0 1 0 0 1 0 0 0 0 0 0 1 2 1 Polychaeta sp. 1 0 0 0 0 0 0 0 0 0 0 0 0 0 0 Polychaeta sp. 2 0 0 0 3 1 0 0 0 0 0 0 0 0 0 Polychaeta sp. 3 0 0 0 4 1 0 0 0 0 0 0 0 0 0 Polychaeta sp. 4 0 0 0 0 4 0 0 0 0 0 0 0 0 0 Polychaeta sp. 5 0 0 0 0 2 0 0 0 0 0 0 0 0 0 Polychaeta sp. 6 0 0 0 5 0 0 0 0 0 0 0 0 0 0 Polychaeta sp. 7 0 0 0 0 0 2 0 0 1 0 0 0 0 0 Polychaeta sp. 8 0 0 0 2 0 0 0 0 0 0 0 0 0 0 Crustacea Amphipoda 0 0 0 0 0 3 1 1 1 1 0 0 0 1 Isopoda 0 0 0 0 0 0 0 0 2 1 0 1 1 0 Natantia 0 0 0 0 0 0 0 0 0 0 0 0 0 0 Tanaidacea 0 0 7 1 2 1 1 4 2 4 1 3 11 0 Halacarid 0 0 0 0 0 0 0 0 0 0 0 0 0 0 Bivalvia 0 0 0 3 0 0 0 0 1 1 0 0 1 0 Minor phyla Dendrostomus sp 0 0 0 0 0 0 4 0 0 0 0 0 0 Phascolion sp 0 0 0 0 1 0 0 0 0 0 0 0 0 0 Echiurida 0 0 0 0 0 0 0 0 0 0 0 0 0 0 Sipuncula sp. 1 0 0 0 0 1 0 1 1 0 0 1 0 0 0 Sipuncula sp. 2 0 0 0 0 2 0 0 0 0 0 0 0 0 0 Sipuncula sp. 3 0 0 0 2 0 0 0 0 0 0 0 0 0 Nemertinia 0 0 0 0 2 1 0 1 2 1 0 0 0 0 Oligochaete 0 0 0 0 0 0 0 0 0 0 0 0 0 0 12 13 19 39 31 7 19 14 30 25 17 16 28 10
11
Table 4. Top three ranked taxa observed at different water depths (rank based on the species abundance) (“+” indicates the species was present but not ranked)
Taxon Water Depth (m) 34 48 102 525 1001 1524 2001 2546 Aricidea sp 1 + 3 + + + Prionospio pinnata 2 2 2 1 + Sternaspis sp 3 + + + Levinsenia sp. 1 1 + Staurocephalus sp 3 Mediomastus sp + 1 Cossura sp + + 1 2 Amphipoda 3 + + Cirratulidae sp. 2 2 2 + Maldanidae sp. 1 3 + + Paraonidae sp. 1 + 3 Levinsenia sp. 2 1 + + Flabelligeridae sp. 1 + + Tanaidacea + + 1 1 Spionidae sp. 1 2 + Prionospio sp + + + 2
12
Table 5. Linear regression analyzed for eight environmental variables against measures of macrofaunal community parameters at 8 stations along the study area (NS= Not significant) Abundance Biomass d J H’
Depth (m) NS NS NS NS NS
Temperature NS NS NS NS NS
Salinity,psu NS NS NS r=-0.83, p=0.037 NS
DO NS NS NS NS NS
Chl a NS NS NS NS NS
Sed Chl a NS NS NS NS r=-0.91, p=0.01
TOC NS NS r=-0.87, p=0.02 r=-0.83, p=0.04
C:N NS NS NS NS NS
Clay (%) NS NS NS NS NS
Silt (%) NS NS r=-0.81, p=0.05 NS
Sand (%) r=0.85, p=0.02 NS r=0.84, p=0.03 NS
CaCO3 r=0.86, p=0.02 NS r=0.87, p=0.02 NS
13
Table 6. Comparison of macrofaunal abundance (ind.m-2) in the western and eastern continental margin of the Arabian Sea
Water depth (m)
DO (mL.L-1) Western India (present study)
Pakistan (Hughes et al. 2009)
Pakistan (Levin et al. 2009) Oman (Levin et al. 2000)
34 0.69 971 48 0.56 2907
102 0.45 3722 140 2.12 14894
0.11 10464 300 0.11 323 400 0.13 12362 525 0.08 424 700 0.16 0 16283 753 0.119 414 803 0.122 1656
0.137 414 850 0.2 19193 853 0.125 2622
0.14 414 903 0.128 2967
0.147 6762 940 0.13 5222
0.17 3380 953 0.134 4544
0.156 2898 1001 0.28 453
0.27 5818 1003 0.146 3726
14
0.174 4692 1053 0.164 2208
0.199 690 1200 0.35 1003 1250 0.52 2485 1524 1.35 707 1850 1.72 8531 2001 2.3 1244 2546 2.3 1188