Luminescent Properties of Anthracene-based Metal-Organic Frameworks
Jennifer Maria Rowe
Thesis submitted to the faculty of the Virginia Polytechnic Institute and State University in partial fulfillment of the requirements for the degree of
Master of Science
In
Chemistry
Amanda J. Morris, Chair
Brian M. Tissue
John Morris
May 6, 2016
Blacksburg, VA
Key words: Metal-Organic Frameworks, luminescence, photophysics, anthracene
Luminescent Properties of Anthracene-based Metal-Organic Frameworks
Jennifer Maria Rowe
Abstract: Metal-organic frameworks (MOFs) are crystalline materials composed of metal clusters
and organic ligands. MOFs that exhibit photoluminescence are promising materials for a broad
range of applications. Due to their structural tunability and crystalline nature, luminescent MOFs
also provide an excellent platform for studying structure–property relationships of materials.
The photophysical properties of three anthracene-dicarboxylic acids – 1,4-anthracene
dicarboxylic acid (1,4-ADCA), 2,6-anthracene dicarboxylic acid (2,6-ADCA) and 9,10-
anthracene dicarboxylic acid (9,10-ADCA) – were studied in a series of polar aprotic solvents
using steady-state absorption, steady-state emission spectroscopy and time-correlated single
photon counting (TCSPC) emission lifetime spectroscopy. The addition of carboxylic acid
functional groups on the anthracene ring alters photophysical properties to varying degrees
depending on the location and protonation state. Density functional theory (DFT) calculations
reveal that the lowest-energy ground-state structures of both 2,6-ADCA and 1,4-ADCA have
dihedral angles between the carboxylic acids and aromatic planes of θ = 0°, while the same
dihedral angle increases to θ = 56.6° for 9,10-ADCA. Time-dependent DFT calculations suggest
that the carboxyl groups of 1,4-ADCA and 2,6-ADCA remain coplanar with the anthracene ring
system in the excited state. In contrast, the calculations reveal significant changes between the
ground and excited geometries for 9,10-ADCA and puckering of the anthracene moiety of is
observed.
The three anthracene dicarboxylic acids were then incorporated into zirconium-based
MOFs. The MOF structures were characterized using powder X-ray diffraction (PXRD) and
scanning electron microscopy (SEM). The steady-state absorption and emission spectra as well as

iii
the fluorescence lifetimes of the MOFs were compared to that of the corresponding ligand
in solution. The MOFs comprising 9,10-ADCA and 2,6-ADCA formed highly crystalline
octahedral shaped crystals and were found to be isostructural with the well-known UiO-66 and
UiO-67 frameworks. However, incorporation of the 1,4-ADCA ligand resulted in large rod-shaped
crystals. The absorption spectra of the MOFs are broadened and redshifted compared with that of
the corresponding free ligands. The emission spectra of the MOFs constructed from 9,10-ADCA
and 1,4-ADCA display emission bands that resemble that of the free ligand in acidic solutions, but
are slightly broadened and redshifted in the MOF. Little difference is observed between that of
2,6-ADCA within the MOF and in acidic solution. The broadening and redshift observed in the
absorption and emission is indicative of intermolecular interactions between anthracene units
and/or with the Zr4+ clusters. The fluorescence lifetimes measured for the anthracene-based MOFs
show a long component, comparable to the lifetime of the free ligand, along with shorter
component. This may also suggest intermolecular interactions between chromophores in the
MOFs.
Altogether, derivatization of anthracene was shown to have specific effects on the
photophysical properties of the parent anthracene molecule. These properties are further altered
when the ligand is incorporated into a metal organic framework. Such systematic studies can
provide a guide in designing luminescent MOFs with the excited-state properties desired for a
given application.

iv
Acknowledgements
First, I would like to thank my advisor, Dr. Amanda Morris. Thank you for not only pushing
me to work hard and to do my best, but providing guidance and encouragement along the way.
Thank you for believing in me and taking me in as a third-year graduate student. I am very
appreciative of all that you have taught me. I also want to thank Dr. Brian Tissue, who co-advised
me along with Dr. Karen Brewer during my first years of graduate school. Thank you for your
guidance and your patience with me as a new graduate student as well as your continued support
for me. I would like to express my gratitude to Dr. John Morris. I appreciate your feedback and
the helpful discussions you have provided as my committee member. I also want to thank Dr.
David Kingston. I am very grateful for your input as a member of my committee in my first three
years as well as the spiritual guidance and encouragement you have offered.
I owe a tremendous amount of gratitude to Dr. William Maza. Thank you for your
guidance, your willingness to help and all that you taught me when I was starting out in the Morris
group. Thank you as well for your contributions to this project. Also to Jennifer Hay, thank you so
much for your help with the organic synthesis as well as your feedback and contributions to the
project. I am so grateful for your encouragement and our friendship. I also wish to extend my
gratitude to the members of the Morris group and previous Brewer group members; I have gained
so much from your helpful discussion, feedback, and support over these past years. To Dr. Elise
Naughton, I am extremely thankful for your friendship and support and for always helping me to
laugh through some of the tough times in graduate school. To Nathan Carter, I owe an enormous
amount of gratitude to you for your constant love and support you have given me over the past few
years.

v
Finally, I wish to express my immense gratitude to my parents, Ronald and Jannell Rowe.
I am tremendously grateful for the support and encouragement you’ve provided me during
graduate school. I would not have accomplished so much if not for the constant love and guidance
you have provided me throughout my life.

vi
In memory of Dr. Karen Brewer

vii
Table of Contents Abstract ......................................................................................................................................... iiiAcknowledgements ...................................................................................................................... ivTable of Contents ........................................................................................................................ viiAttributions .................................................................................................................................. ix1. Introduction ............................................................................................................................... 1
1.1. Anthracene Photophysics ..................................................................................................... 11.1.1. Photophysical Processes ............................................................................................... 11.1.2. Singlet Fission ............................................................................................................... 51.1.3. Triplet-Triplet Annihilation (TTA) ............................................................................... 71.1.4. Crystalline Anthracene .................................................................................................. 9
1.2. Photophysics of Anthracene Derivatives ........................................................................... 101.2.1. Aggregate Induced Emission (AIE) ............................................................................ 11
1.3. Anthracene-based Luminescent Metal-Organic Frameworks ........................................... 131.3.1. Tuning the Topology and Functionality ..................................................................... 141.3.2. Host-Guest Interactions .............................................................................................. 161.3.3. Core-Shell MOFs ........................................................................................................ 191.3.4. Photocatalysis ............................................................................................................. 221.3.5. Conductivity and Electroluminescence ....................................................................... 251.3.6. Scintillating MOFs ...................................................................................................... 261.3.7. Multiphoton Harvesting and Upconversion ................................................................ 271.3.8. Triplet-Triplet Annihilation-Based Upconversion ...................................................... 28
1.4. Conclusions ........................................................................................................................ 301.5. Project Description ............................................................................................................. 301.6. References .......................................................................................................................... 31
2. Systematic Investigation of the Excited-State Properties of Anthracene-Dicarboxylic Acids ............................................................................................................................................. 36
2.1. Introduction ........................................................................................................................ 362.2. Results ................................................................................................................................ 372.3. Discussion .......................................................................................................................... 452.4. Conclusions ........................................................................................................................ 522.5. Acknowledgements ............................................................................................................ 532.6. Supplemental Information ................................................................................................. 53
2.6.1. Materials ..................................................................................................................... 532.6.2. Steady-state absorption spectroscopy ......................................................................... 54

viii
2.6.3. Steady-state emission spectroscopy and time-resolved emission lifetimes ................ 542.6.4. Theoretical calculations .............................................................................................. 552.6.5. Determination of acid association constants ............................................................... 562.6.6. Supplemental Figures and Tables ............................................................................... 57
2.7. References .......................................................................................................................... 613. Photophysical Properties of Zr-based Anthracenic Metal–Organic Frameworks ........... 64
3.1. Introduction ........................................................................................................................ 643.2. Results ................................................................................................................................ 653.3. Discussion .......................................................................................................................... 703.4. Conclusions ........................................................................................................................ 733.5. Supplemental Information ................................................................................................. 74
3.5.1. Experimental Procedures ............................................................................................ 743.5.1.1. Materials .................................................................................................................. 743.5.2. Powder X-ray diffraction and Scanning electron microscopy .................................... 743.5.3. Steady-state absorption spectroscopy ......................................................................... 743.5.4. Steady-state emission spectroscopy and time-resolved emission lifetimes ................ 753.5.5. Supplemental Figures .................................................................................................. 76
3.6. References .......................................................................................................................... 76
ix
Attributions
Chapter 1 of this thesis was adapted from a manuscript recently submitted to The Journal
of Photochemistry C. Jennifer Hay, a former M.S. student of Dr. Amanda Morris, synthesized the
anthracene-based ligands and performed many initial spectroscopic measurements of the
compounds. She, along with Dr. William Maza, a previous post-doctoral researcher in the Morris
group, contributed to the experimental design, analysis of data and manuscript writing.
Dr. Diego Troya performed the excited state TDDFT calculations of the anthracene
derivatives and contributed to writing this section of the manuscript. His graduate student, Robert
Chapleski performed ground state DFT calculations of the molecules.
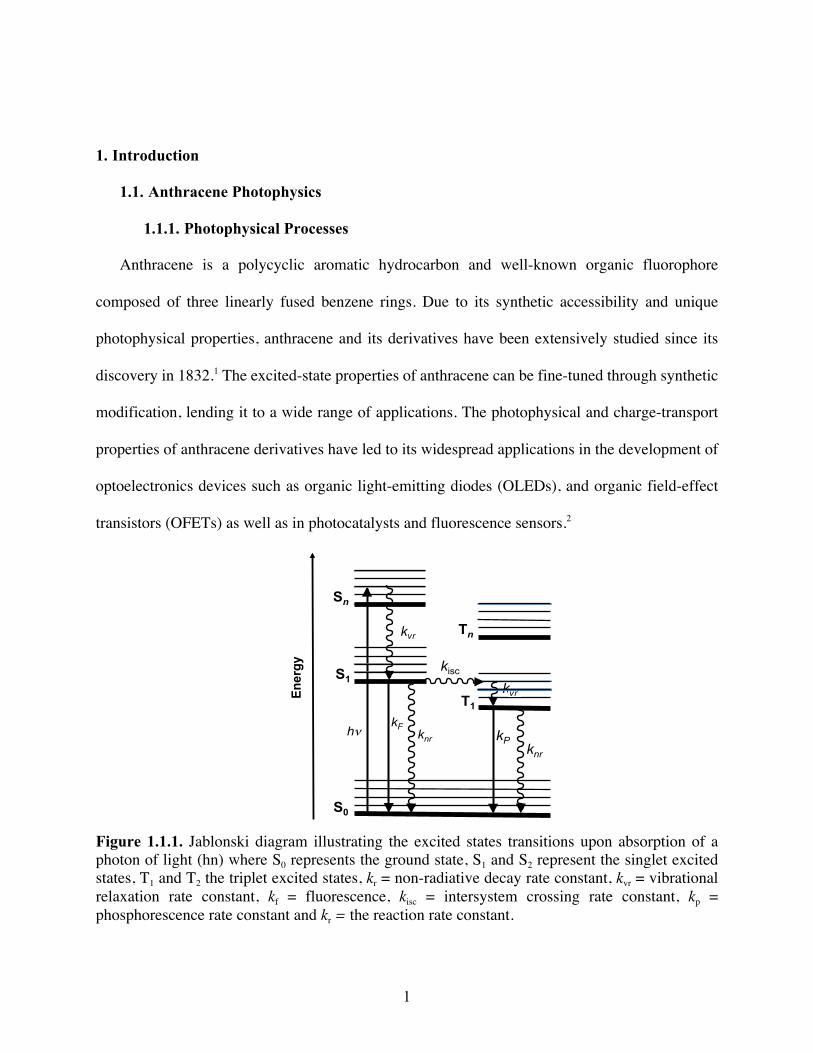
1
1. Introduction
1.1. Anthracene Photophysics
1.1.1. Photophysical Processes
Anthracene is a polycyclic aromatic hydrocarbon and well-known organic fluorophore
composed of three linearly fused benzene rings. Due to its synthetic accessibility and unique
photophysical properties, anthracene and its derivatives have been extensively studied since its
discovery in 1832.1 The excited-state properties of anthracene can be fine-tuned through synthetic
modification, lending it to a wide range of applications. The photophysical and charge-transport
properties of anthracene derivatives have led to its widespread applications in the development of
optoelectronics devices such as organic light-emitting diodes (OLEDs), and organic field-effect
transistors (OFETs) as well as in photocatalysts and fluorescence sensors.2
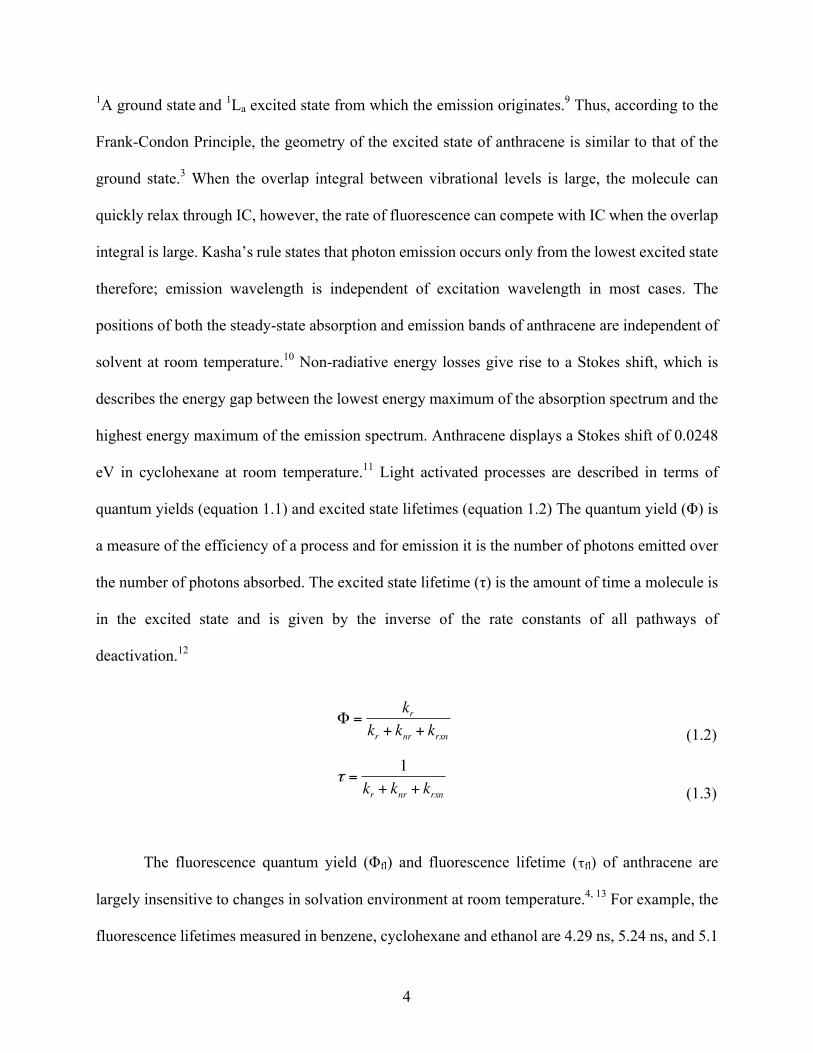
Figure 1.1.1. Jablonski diagram illustrating the excited states transitions upon absorption of a photon of light (hn) where S0 represents the ground state, S1 and S2 represent the singlet excited states, T1 and T2 the triplet excited states, kr = non-radiative decay rate constant, kvr = vibrational relaxation rate constant, kf = fluorescence, kisc = intersystem crossing rate constant, kp = phosphorescence rate constant and kr = the reaction rate constant.
Ener
gy
S0
S1
T1
hν
Sn
Tn
kisc
kIC
kIC
kF kP knr
knr
vr
kvr
Ener
gy
S0
S1
T1
hν
Sn
Tn
kisc
kIC
kIC
kF kP knr
knr
vr

2
Upon absorption of a photon of the appropriate energy, a molecule is promoted from its singlet
ground state, to a singlet excited state. The excited state of the molecule is metastable and can
undergo deactivation through several different mechanisms (Figure 1.1.1). This occurs most
frequently through intramolecular radiative and non-radiative deactivations and can also occur
through intermolecular chemical reactions. The three competing processes of intramolecular
excited-state deactivation are non-radiative decay to the ground state (internal conversion, IC);
radiative decay to the ground state (fluorescence); and intersystem crossing (ISC) to the triplet
state, which involves a change in spin multiplicity. After ISC, T1 can be deactivated through non-
radiative (internal conversion) or radiative (phosphorescence) decay to the ground state.3
The probability of an electronic transition is expressed by the magnitude of the oscillator
strength of the transition (f), which is proportional to the integral of the transition dipole moment.
given by equation 1.1, where µ is the transition moment dipole operator and ΨGS and ΨES are the
wavefunctions of the ground state and excited state, respectively.
∫Ψ#$𝜇Ψ&$d𝜐 (1.1)
Electronic transitions are governed by the spin and the symmetry selection rules. The spin selection
rule states that electron spin multiplicity is maintained during a transition. Thus, S à T transitions
are formally forbidden, however, they can become partially allowed due to spin-orbit coupling.
The symmetry selection rule dictates that the integral of the transition moment must be non-zero
and must contain the totally symmetric representation of the group, i.e. a change in dipole must
occur. However, such transitions are observed due to vibrations, which distort the molecular
symmetry, allowing the wavefunctions to mix. Transitions that are both symmetry and spin
allowed will give rise to intense bands in the absorption spectrum with high molar absorptivities
3
while transitions that are only partially allowed will appear as bands with much lower molar
absorptivities.4
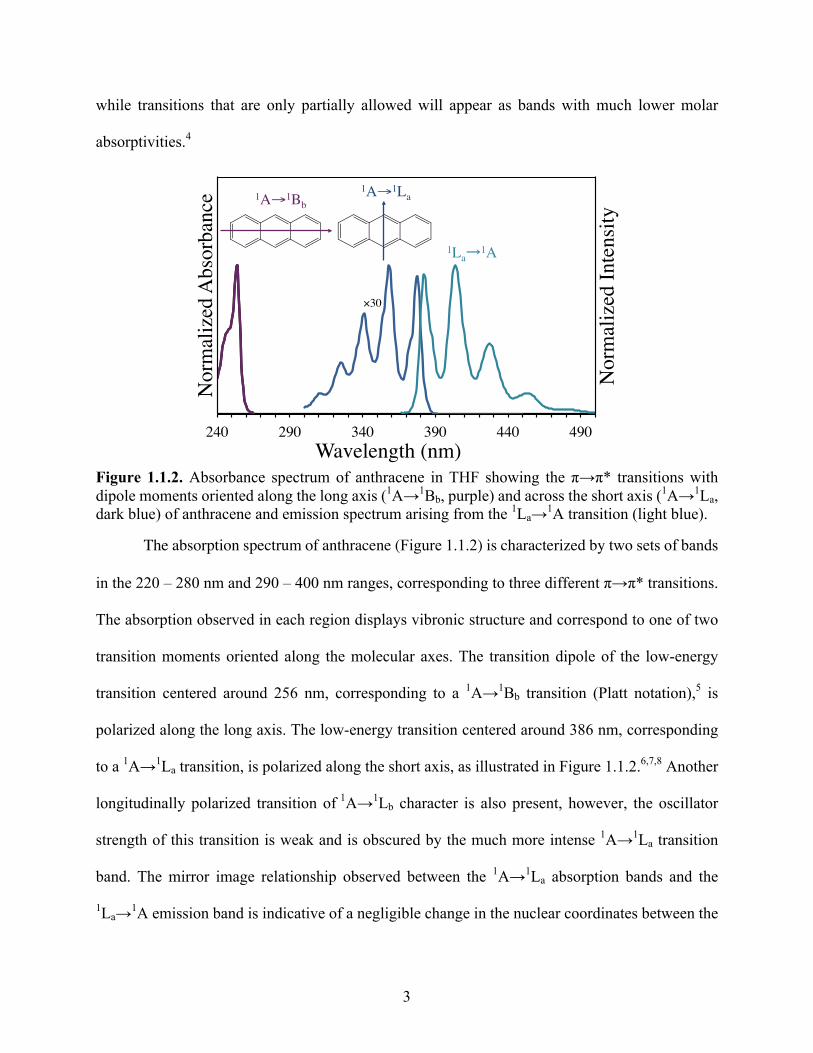
Figure 1.1.2. Absorbance spectrum of anthracene in THF showing the π→π* transitions with dipole moments oriented along the long axis (1A→1Bb, purple) and across the short axis (1A→1La, dark blue) of anthracene and emission spectrum arising from the 1La→1A transition (light blue).
The absorption spectrum of anthracene (Figure 1.1.2) is characterized by two sets of bands
in the 220 – 280 nm and 290 – 400 nm ranges, corresponding to three different π→π* transitions.
The absorption observed in each region displays vibronic structure and correspond to one of two
transition moments oriented along the molecular axes. The transition dipole of the low-energy
transition centered around 256 nm, corresponding to a 1A→1Bb transition (Platt notation),5 is
polarized along the long axis. The low-energy transition centered around 386 nm, corresponding
to a 1A→1La transition, is polarized along the short axis, as illustrated in Figure 1.1.2.6,7,8 Another
longitudinally polarized transition of 1A→1Lb character is also present, however, the oscillator
strength of this transition is weak and is obscured by the much more intense 1A→1La transition
band. The mirror image relationship observed between the 1A→1La absorption bands and the
1La→1A emission band is indicative of a negligible change in the nuclear coordinates between the
240 290 340 390 440 490
Nor
mal
ized
Inte
nsity
Nor
mal
ized
Abs
orba
nce
Wavelength (nm)
1A→1Bb 1A→1La
1La�1A
×30
4
1A ground state and 1La excited state from which the emission originates.9 Thus, according to the
Frank-Condon Principle, the geometry of the excited state of anthracene is similar to that of the
ground state.3 When the overlap integral between vibrational levels is large, the molecule can
quickly relax through IC, however, the rate of fluorescence can compete with IC when the overlap
integral is large. Kasha’s rule states that photon emission occurs only from the lowest excited state
therefore; emission wavelength is independent of excitation wavelength in most cases. The
positions of both the steady-state absorption and emission bands of anthracene are independent of
solvent at room temperature.10 Non-radiative energy losses give rise to a Stokes shift, which is
describes the energy gap between the lowest energy maximum of the absorption spectrum and the
highest energy maximum of the emission spectrum. Anthracene displays a Stokes shift of 0.0248
eV in cyclohexane at room temperature.11 Light activated processes are described in terms of
quantum yields (equation 1.1) and excited state lifetimes (equation 1.2) The quantum yield (Φ) is
a measure of the efficiency of a process and for emission it is the number of photons emitted over
the number of photons absorbed. The excited state lifetime (τ) is the amount of time a molecule is
in the excited state and is given by the inverse of the rate constants of all pathways of
deactivation.12
(1.2)
(1.3)
The fluorescence quantum yield (Φfl) and fluorescence lifetime (τfl) of anthracene are
largely insensitive to changes in solvation environment at room temperature.4, 13 For example, the
fluorescence lifetimes measured in benzene, cyclohexane and ethanol are 4.29 ns, 5.24 ns, and 5.1
€
Φ =kr
kr + knr + krxn
€
τ =1
kr + knr + krxn

5
ns, respectively and the quantum yield of fluorescence is between 0.27 and 0.36 in the same
solvents 4.29.14 The fluorescence and phosphorescence quantum yields of anthracene were studied
in polymethylmethacrylate at temperatures ranging from 77 K to 298 K. A decrease in the
fluorescence quantum yields was observed as temperature decreased, which was attributed to an
increase in the rate of the competing process of intersystem crossing, kISC, as the rate of
fluorescence, kf, showed only negligible temperature dependence.15
The singlet excited state of anthracene undergoes ISC to the triplet excited state with a
quantum efficiency of ~ 0.7 and a rate of ~ 6 × 10⁷ s-1. The quantum yield of fluorescence is ~ 0.3
and the rate of fluorescence decay is ~ 1 × 10⁸ s-1.16 Thus, the amount of energy lost through
internal conversion (kic ~ 1 × 10⁶ s-1) in the singlet excited state is negligible. The rate of radiative
decay from the triplet state is much slower (kr,p = 1.46 × 10⁸ s-1) than that of internal conversion
(kic = 1.2 × 10⁶ s-1).16-17 Thus, non-radiative decay processes, such as intramolecular vibrations and
solvent collisions outcompete radiative emission from the triplet excited state and
phosphorescence is not observed in room temperature solutions. Phosphorescence from organic
fluorophores is usually measured at cryogenic temperatures to reduce non-radiative decay rates.
Recently, a method of measuring the room-temperature phosphorescence from anthracene was
reported. The chromophore was embedded in a solid matrix of poly(4-bromostyrene), allowing for
control of the modes of ISC, and the triplet excited-state lifetime was found to be 8 ms.18
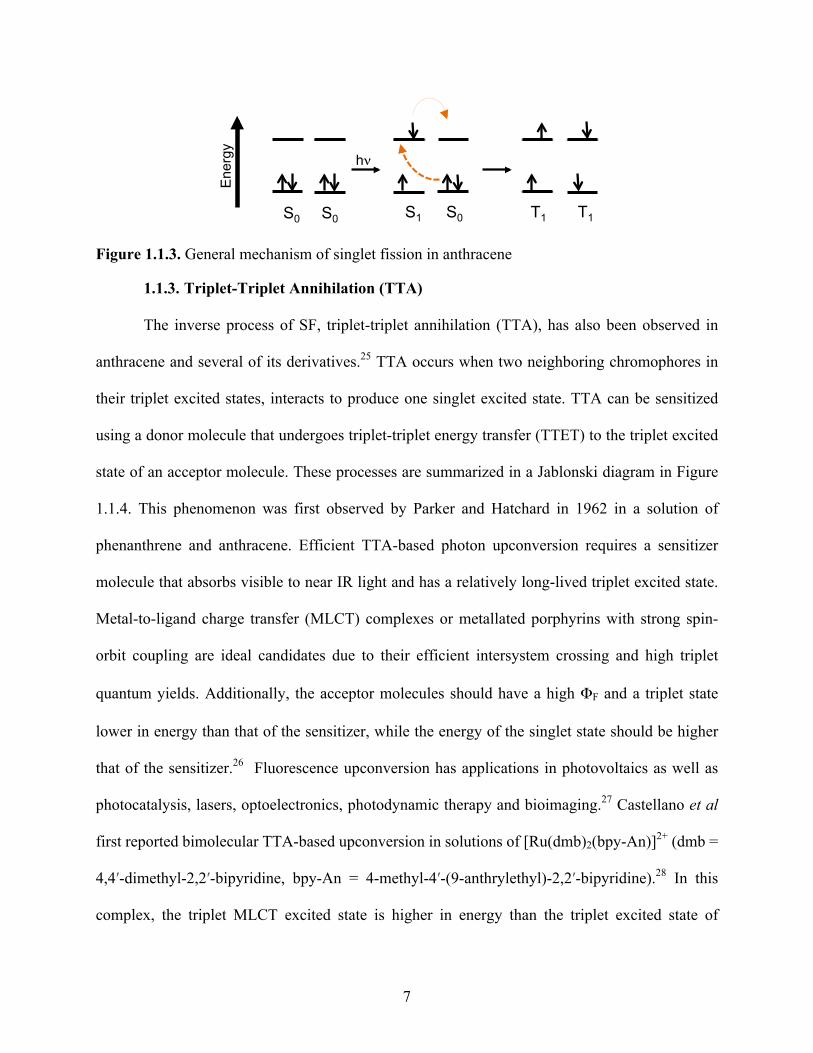
1.1.2. Singlet Fission
Anthracene can be promoted directly into the triplet state through singlet fission (SF). SF
is a process in which a chromophore in the singlet excited state energetically couples with a nearby
chromophore in the ground state and produces two triplet excited states. Although first reported
by Schnider et al in 1965, this process has captured the interest of researchers in recent years as a

6
means to overcome the Shockley-Quisser limit of single junction solar cell from, of ~ 31% to
44.2%.19,20 Because multiple excitons are generated from the absorption of one photon, SF systems
with quantum yield greater than 100% have been reported.21 Additionally, direct promotion to the
triplet state avoids the energy losses that result from relaxation of the singlet excited state. Singlet
fission between two anthracene molecules is believed to occur via an electron exchange
mechanism between an anthracene molecule in its singlet excited state and a neighboring
anthracene in the ground state, resulting in two triplet excited state molecules, as illustrated in
Figure 1.1.3. Specific conditions must be met in order for the appropriate interchromophore
interaction leading to singlet-fission to occur. Although some aspects of the SF mechanism have
yet to be elucidated, several of the energetic requirements have been identified. First, the process
of SF must outcompete other S1 deactivation pathways, including IC, ISC, fluorescence or other
intermolecular interactions. Additionally, the S1 – S0 energy must be at least two times that of the
S0 – T1 transition (for anthracene 1E(S1) = 3.13 eV and 2E(T1) = 3.66 eV).22 An appropriate
strength of coupling is also important, and more efficient SF has been observed in crystals
compared with covalently linked chromophores.23 Furthermore, crystal packing plays an essential
role in SF and topology has a significant impact on the SF rate. Recent studies of SF in polyacenene
thin films have shown that defect sites in more amorphous films led to increased rates of SF relative
to the crystalline films.24 Currently, research efforts involving SF in polyacenes systems are
focused on understanding the differences between the SF mechanisms in molecular crystals and
single molecules, optimization of morphology and achieving appropriate chromophore coupling
for sufficient charge separation.22
7
Figure 1.1.3. General mechanism of singlet fission in anthracene
1.1.3. Triplet-Triplet Annihilation (TTA)
The inverse process of SF, triplet-triplet annihilation (TTA), has also been observed in
anthracene and several of its derivatives.25 TTA occurs when two neighboring chromophores in
their triplet excited states, interacts to produce one singlet excited state. TTA can be sensitized
using a donor molecule that undergoes triplet-triplet energy transfer (TTET) to the triplet excited
state of an acceptor molecule. These processes are summarized in a Jablonski diagram in Figure
1.1.4. This phenomenon was first observed by Parker and Hatchard in 1962 in a solution of
phenanthrene and anthracene. Efficient TTA-based photon upconversion requires a sensitizer
molecule that absorbs visible to near IR light and has a relatively long-lived triplet excited state.
Metal-to-ligand charge transfer (MLCT) complexes or metallated porphyrins with strong spin-
orbit coupling are ideal candidates due to their efficient intersystem crossing and high triplet
quantum yields. Additionally, the acceptor molecules should have a high ΦF and a triplet state
lower in energy than that of the sensitizer, while the energy of the singlet state should be higher
that of the sensitizer.26 Fluorescence upconversion has applications in photovoltaics as well as
photocatalysis, lasers, optoelectronics, photodynamic therapy and bioimaging.27 Castellano et al
first reported bimolecular TTA-based upconversion in solutions of [Ru(dmb)2(bpy-An)]2+ (dmb =
4,4′-dimethyl-2,2′-bipyridine, bpy-An = 4-methyl-4′-(9-anthrylethyl)-2,2′-bipyridine).28 In this
complex, the triplet MLCT excited state is higher in energy than the triplet excited state of
hν
S0 S1 T1 E
nerg
y S0 S0 T1

8
anthracene and can undergo TTET to anthracene. In this system, intramolecular quenching of the
anthracene singlet excited state by the MLCT ground state was observed. Higher upconversion
efficiency was observed in solutions of [Ru(dmb)3]2+ and anthracene, in which the donor and
acceptor were non-covalently linked. When anthracene was replaced with the derivative, 9,10-
diphenyl anthracene (9,10-DPA) further improvement of upconversion efficiency was observed.
This was attributed to the higher fluorescence quantum yield of 9,10-DPA (0.95) relative to
anthracene (0.27).
Figure 1.1.4. General energy diagram of fluorescence upconversion via triplet-triplet annihilation (TTA). (TTA). S0 is the ground state, S1 and T1 are the lowest energy, singlet and triplet excited states, respectively, hvA is absorption, hvE′ is phosphorescence from the sensitizer, hv′′ is fluorescence from the acceptor, ISC is intersystem crossing, TTET is triplet-triplet energy transfer, TTA is triplet-triplet annihilation.
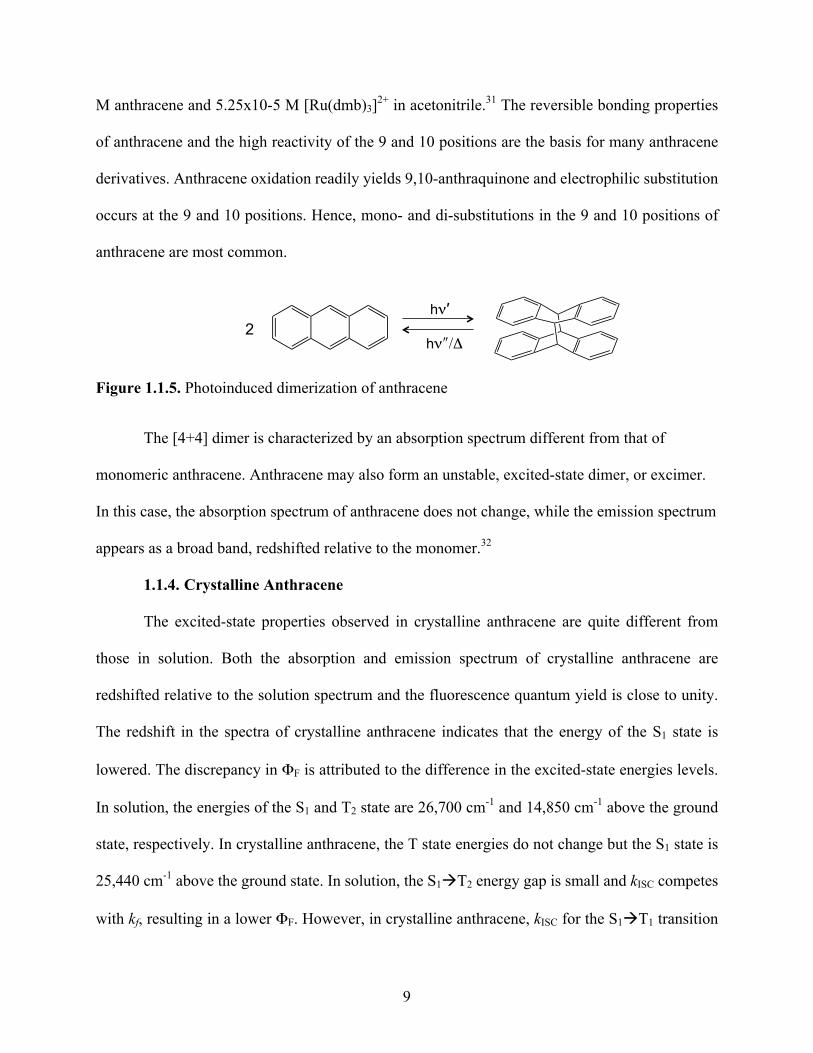
In fairly concentrated solutions (~ 0.01 M), anthracene is known to photodimerize upon
irradiation with UV light (Figure 1.1.5).29 The [4+4] dimer forms clear crystals that thermally
revert back to anthracene at room temperature or when exposed to > 300 nm light.29 The process
of photodimerization occurs through the singlet excited state. This is illustrated by the quenching
of photodimerization of anthracene in heavy atom solvents, where ISC to T1 is enhanced. Since
dimerization decreases as T1 increases it must not be a triplet process. Earlier studies showed that
anthracene photodimerization proceeds via TTA.30 Later, Castellano et al demonstrated anthracene
photodimerization through TTA upconversion with 514.5 nm irradiation of solutions ~1.4x10⁻²
Ene
rgy
2 S0
2 S1
2 T1
2 T1
T1
T1
S1
2 hνA hνEʺ
Sensitizer Acceptor
TTA
TTET
ISC
ISC
hνEʹ
9
M anthracene and 5.25x10⁻⁵ M [Ru(dmb)3]2+ in acetonitrile.31 The reversible bonding properties
of anthracene and the high reactivity of the 9 and 10 positions are the basis for many anthracene
derivatives. Anthracene oxidation readily yields 9,10-anthraquinone and electrophilic substitution
occurs at the 9 and 10 positions. Hence, mono- and di-substitutions in the 9 and 10 positions of
anthracene are most common.
Figure 1.1.5. Photoinduced dimerization of anthracene
The [4+4] dimer is characterized by an absorption spectrum different from that of
monomeric anthracene. Anthracene may also form an unstable, excited-state dimer, or excimer.
In this case, the absorption spectrum of anthracene does not change, while the emission spectrum
appears as a broad band, redshifted relative to the monomer.32
1.1.4. Crystalline Anthracene
The excited-state properties observed in crystalline anthracene are quite different from
those in solution. Both the absorption and emission spectrum of crystalline anthracene are
redshifted relative to the solution spectrum and the fluorescence quantum yield is close to unity.
The redshift in the spectra of crystalline anthracene indicates that the energy of the S1 state is
lowered. The discrepancy in ΦF is attributed to the difference in the excited-state energies levels.
In solution, the energies of the S1 and T2 state are 26,700 cm-1 and 14,850 cm-1 above the ground
state, respectively. In crystalline anthracene, the T state energies do not change but the S1 state is
25,440 cm-1 above the ground state. In solution, the S1àT2 energy gap is small and kISC competes
with kf, resulting in a lower ΦF. However, in crystalline anthracene, kISC for the S1àT1 transition
2 hν′
hνʺ/Δ
10
is large and does not compete with kf, thus, S1àT2 is energetically unfavorable, and the ΦF is
high.16
1.2. Photophysics of Anthracene Derivatives
Numerous anthracene derivatives have been synthesized for a wide range of applications,
which include organic light emitting diodes (OLEDs), photosensitizers and biological sensors.33
Derivatization alters the excited-state properties of anthracene to varying degrees and is often used
as a means to tune the optical properties for specific applications. Functionalization can shift the
relative energies of the π-π* transitions, resulting in an increase in kf and kISC. For example, the
addition of methyl groups at the 9 and 10 positions of the center ring delocalizes electron density,
shifting the energies of the singlet and triplet excited-state transitions. The energy of the lowest-
lying singlet excited state (S1) decreases and the energy of the triplet state (T) increases above that
of S1. Thus, ISC is no longer a competitive deactivation process and the fluorescence quantum
yield is higher. When the methyl groups are replaced with phenyl groups, the energy of S1
decreases even further while the T energy increases. As a result, the fluorescence quantum yield
of 9,10-diphenylanthracene (9,10-DPA) is 0.95 and the quantum yield of the T state only ~ 0.04.34
Because of its high quantum yield of blue fluorescence, 9,10-DPA is often used as the TTA
acceptor in upconversion systems. When coupled with [Ru(dmb)3]2+, 9,10-DPA green-to-blue
conversion was observed with upconversion efficiency approximately 24 times greater than that
of anthracene under the same conditions.31 The upconversion efficiency was further enhanced
when the [Ru(dmb)3]2+ donor was replaced with Pd(II)Octaethylporphyrin (PdOEP). 9,10-DPA
and PdOEP (68:1) were embedded in a copolymer matrix and the resulting film was irradiated
with 544 nm light to selectively excite PdOEP, and 9,10-DPA emission was observed. The UC
emission was recorded under ambient conditions and showed a quartic (x4) dependence on the

11
incident light intensity. Furthermore, time-resolved experiments showed that PdOEP emission
decay occurred with the same rate as growth in 9,10-DPA emission is generated.35 This UC
chromophore pair has also been employed in the assembly of soft material upconverting polymers
using a polyurethane precursor. This polymerization method allows for precise control over the
chromophore concentration and allowed the UC emission to be tuned to display blue, purple or
red luminescence by varying the concentration of 9,10-DPA. These materials exhibited UC
efficiencies >20%.35
9,10-DPA has also been studied for its use in organic light emitting diodes (OLEDs). Its
wide-bandgap, high florescence quantum yield and bright blue emission make it a good candidate
for OLEDs, however, 9,10-DPA can easily crystallize in the solid state, resulting in a
nonhomogeneous films and increased resistance of the film, which limit performance of the device.
The structure of 9,10-DPA selectively modifying to inhibit crystallization, the performance can be
significantly enhanced, while maintaining the advantages of an anthracene-based materials. Shu
et al developed OLEDs containing the anthracene derivatives 2-tert-butyl-9,10-bis[4′-(9-p-
tolylfluoren-9-yl)biphenyl-4-yl]anthracene (BFAn) as the emitter and 2-tert-butyl-9,10-bis[4′-(1-
phenylbenzoimidazyl)biphenyl-4-yl] (BIAn) as the electron transporter.1b The tert-butyl group
disrupts the symmetry and inhibits crystallization while addition of the 9,9-fluorenyl substituents
yields a deeper blue emission and affords steric hindrance that improve the overall structural
stability.36
1.2.1. Aggregate Induced Emission (AIE)
Tian and coworkers reported a series of four 9,10-distyrylanthracene (DSA) derivatives
that exhibited aggregate-induced emission (AIE).37 These DSA derivatives exhibited weak, broad
orange emission in solution, but in the crystalline state, display a bright green emission with a high

12
fluorescence quantum yield. The low quantum yields observed in solution are attributed to fast
nonradiative decay pathways through intramolecular torsion between 9,10-anthylene and the
vinylene moiety. In the crystalline state, each DSA derivative is tightly packed into a nonplanar
conformation due to intermolecular CH–π hydrogen bonding. Thus, torsional motions are
restricted by the intermolecular interactions in the crystal, resulting in considerably increased
fluorescence.37 Similarly, 9,10-bis((E)-2-(pyrid-2-yl)vinyl)anthracene BP2VA also exhibits a
weak orange emission (~ 583 nm) in dilute solution, while that of crystalline BP2VA is bright
green (~ 528 nm). Additionally, piezoluminescence is observed in aggregates of BP2VA.38
Grinding of the crystalline BP2VA powders results in a redshift of 33 nm in the emission spectrum.
The emission at 528 nm can be gradually redshifted up to 561 nm with increasing external pressure.
Furthermore, this process can be fully reversed by heating the powders to 160 ºC. To investigate
the nature of this change in fluorescence, three crystal polymorphs of BP2VA were prepared with
increasing π-π* interactions. As π-π* interactions in the crystal polymorphs increased, a redshift
in the BP2VA emission spectrum was observed. Therefore, as external pressure increases, π-π*
interactions are enhanced, resulting in the observed piezochromic effects. Thus, the redshift in the
emission spectrum of BP2VA observed upon grinding the powders is attributed to increased
exciton coupling and orbital overlap between chromophores in the crystal.38 Reversible
piezoluminescence has also been shown in solvated crystals of 9,10-Di(pyridin-4-yl)anthracene
derivatives where the interchromophore distances were tuned by variation of the solvent, resulting
in redshifted emission. Additionally, desolvated crystals displayed vapoluminescent behavior
upon exposure to solvent vapors.39
Because of the unique photophysical properties of anthracene and its derivatives have been
used as a building block in many supramolecular systems. Specifically, anthracene derivative that

13
contain multiple carboxylic acid groups have been integrated into metal-organic frameworks
(MOFs). The photophysics of anthracene derivatives can be fine-tuned through variation of the
MOF structure in order to exploit the desired properties of anthracene within these materials. The
following section will review the current research concerning anthracene-based MOFs and their
photophysical properties.
1.3. Anthracene-based Luminescent Metal-Organic Frameworks
MOFs are crystalline materials composed of metal ions or metal clusters (nodes) connected
by multi-dentate organic ligands (linkers) to form extended coordination networks. MOFs often
have significant porosity and can also have relatively high chemical and thermal stability.
Furthermore, their chemical and physical properties can be tuned by variation of the metal nodes
or organic linkers. Often, the metal linkers contain conjugated aromatic ring systems that can
produce luminescence. Luminescent MOFs (LMOFs) have been studied for their application in
optoelectronics, dye-sensitized solar cells, photocatalysis, chemical sensing, bioimaging and drug
delivery.40,41 A number of anthracene derivatives have been incorporated into metal-organic
frameworks (Figure 1.3.1). Early on, the majority of these MOFs were studied primarily for gas
adsorption.42,43,44 More recently, a number of anthracene-based MOFs have been synthesized and
studied for their unique luminescent properties. Anthracene-based ligands contain multiple
carboxylic acid groups, which coordinate to the metal ions to form M–O–C clusters, known as
secondary building units (SBUs).45 The SBUs provide the rigid joints of the framework, thus
allowing for control of the MOF topology. Anthracene-based linkers have most commonly been
incorporated into Zn2+ and Cd2+–based MOFs, which can form square, tetrahedral or octahedral
SBUs. Incorporation into MOFs with clusters of Zr4+ as the nodes affords greater stability, as the
carboxylate groups bond more strongly since the Zr4+ ions are hard acids while the carboxylates
14
are soft bases. Additionally, Zr4+ can form highly connected M–O–C clusters, which also increase
the stability of the framework. For example, the recently reported Zr-MOF NNU-28 comprises
Zr6O4(OH)4(CO2)12 SBUs, which are coordinated to 12 anthracene-based ligands.46 Anthracenic
MOFs with Fe3+ and Ba2+ metal nodes have also been reported.47,48
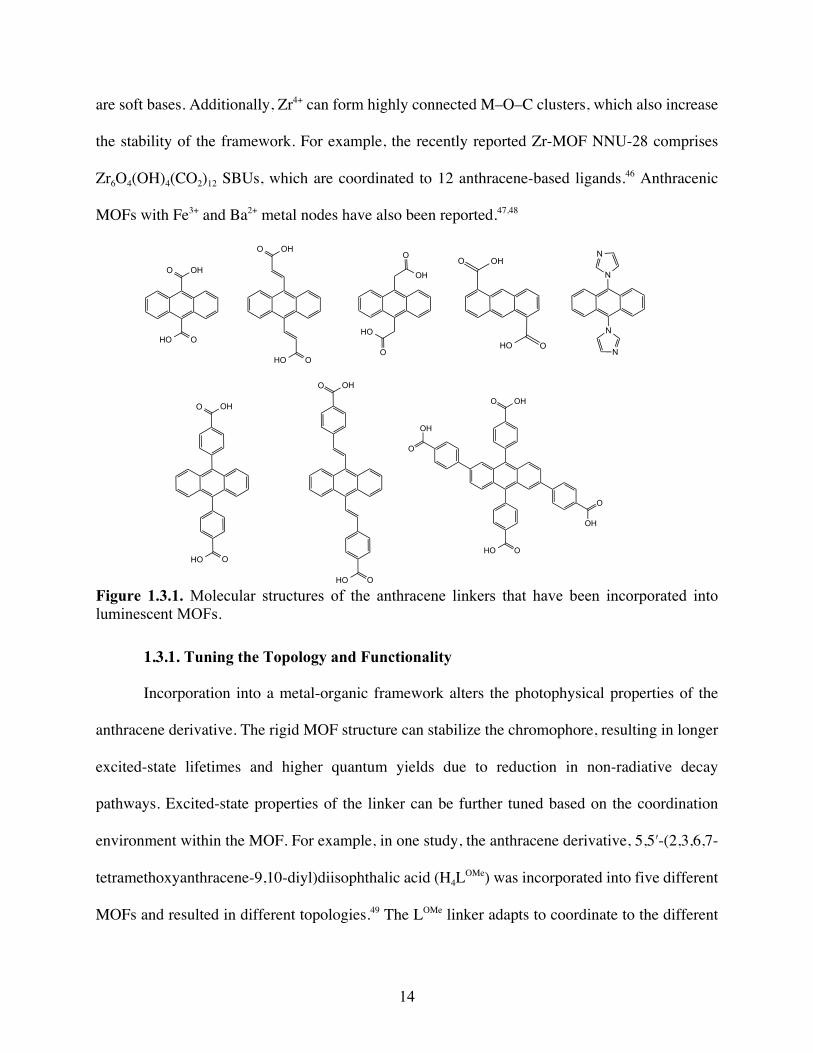
Figure 1.3.1. Molecular structures of the anthracene linkers that have been incorporated into luminescent MOFs.
1.3.1. Tuning the Topology and Functionality
Incorporation into a metal-organic framework alters the photophysical properties of the
anthracene derivative. The rigid MOF structure can stabilize the chromophore, resulting in longer
excited-state lifetimes and higher quantum yields due to reduction in non-radiative decay
pathways. Excited-state properties of the linker can be further tuned based on the coordination
environment within the MOF. For example, in one study, the anthracene derivative, 5,5′-(2,3,6,7-
tetramethoxyanthracene-9,10-diyl)diisophthalic acid (H4LOMe) was incorporated into five different
MOFs and resulted in different topologies.49 The LOMe linker adapts to coordinate to the different
OHO
O OH
O OH
OHO
OHO
O OH
N
N
N
N
OHO
O OHO
OH
O
HO
O
OH
O OH
O
OH
OHO
O OH
OHO
15
metals with various coordination geometries. By varying the metal ions and synthesis conditions,
[Mn4(LOMe)(OAc)2(μ3-OH)2(NMP)4(H2O)2]·2H2O, [Ni2(LOMe)0.5(H2LOMe)0.5(μ3-OH)(H2O)3]·6H2O,
[Cd2(LOMe)(H2O)2(NMP)]·2DMF·NMP·H2O, [Co2(LOMe)(H2O)3]·2NMP·DMA· H2O, and
[Zn2(LOMe)(H2O)2]·2NMP·2H2O·DOE were obtained. The manganese and nickel-based MOFs
have planar tetranuclear secondary building units (SBUs) that form 2D sheets that form a 3D
structure through π–π stacking. The cadmium metal ions form a 3D network and have a dinuclear
SBU with the anthracene linker bridging two Cd metal ions. Both the cobalt and zinc MOFs
crystallize into 3D networks and have analogous structures with three different types of
coordination at the metal nodes. The solid-state luminescence of the Mn Cd and Zn-based based
MOFs were measured and compared with that of the free ligand. “H4LOMe displays emission with
a maximum at 467 nm (λex = 270 nm), ascribed to the π*–π transitions of the parent anthracene
ring system. All three MOFs display linker-based luminescence that is blueshifted relative to the
free linker, with maxima at 444 nm (λex = 270 nm), 442 nm (λex = 290 nm) and 443 nm (λex = 300
nm), for the Mn, Cd and Zn-based MOFs, respectively. The blueshift in the emission spectrum is
attributed to stabilization of the excited state of the chromophore upon coordination in the MOF,
which lowers the energy of the electronic transition.49
In some cases, the linker can be varied while still maintaining the crystal structure of the
MOF. UiO-66 is a well-known isoreticular MOF (IRMOF) with a Zr6O4(OH)4 SBU and 1,4-
benzenedicarboxylate (BDC) linkers that form an octahedral cage geometry.50–51 When BDC is
replaced with 9,10-anthracenedicarboxylic acid (9,10-ADCA), the resulting framework is
isostructural with UiO-66 but displays a redshift in the absorption spectrum from ~ 350 nm – 440,
nm to ~ 350 nm – 540 nm. With a band gap of 2.47 eV, the UiO-type anthracene-based MOF is a
strong oxidant and proved to be a decent photocatalyst for the degradation of methyl orange.52

16
1.3.2. Host-Guest Interactions
Variation of the organic linker is also an effective way to vary the pore-size and to control
intermolecular interactions between linkers by tuning the interchromophore distances.53,41 Larger
pores can allow for adsorption of small molecules or “guest species” that may interact with the
anthracene units and alter the florescence of the MOF.40 Anthracene can interact with other
aromatic molecules to form charge transfer (CT) complexes that exhibit different emission spectra.
Tanka et al prepared nanoscale luminescent MOFs containing ADCA ligands that demonstrate
host-guest charge transfer interactions between ADCA and adsorbed species, N,N-methylanaline
(MA), N,N-dimethylanaline (DMA) and N,N-dimethyl-p-toludine (DMPT).54 The as-synthesized
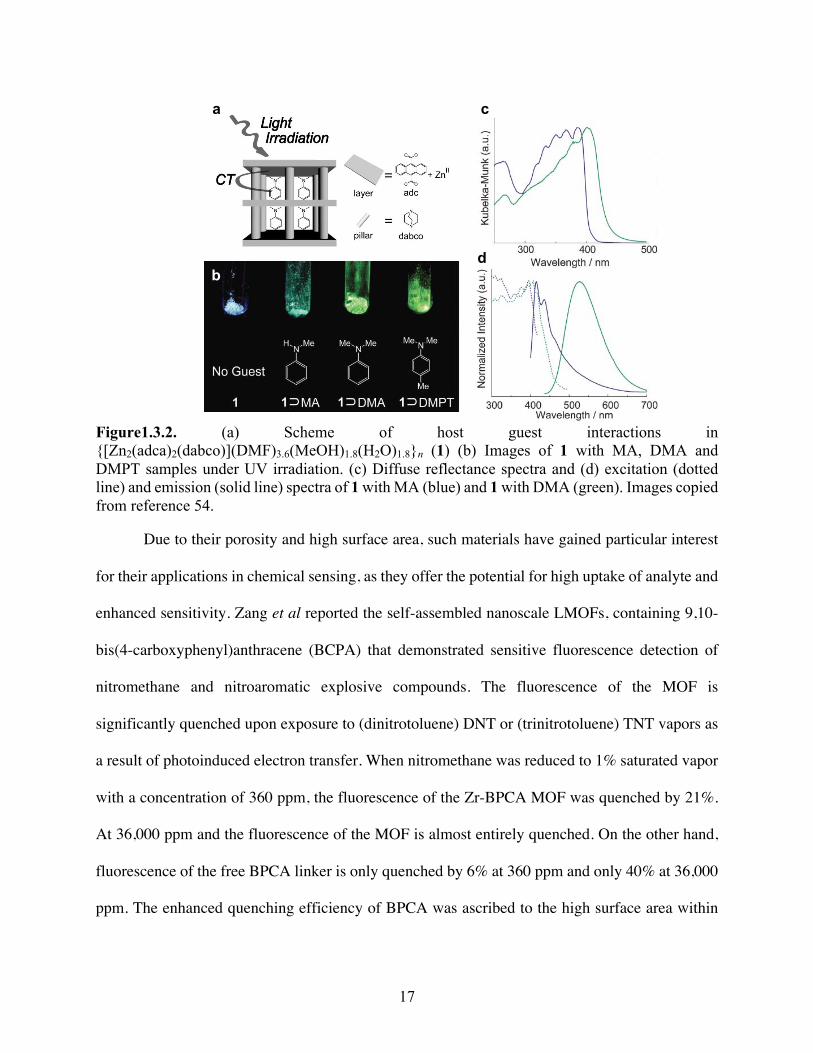
MOF has the chemical structure {[Zn2(adca)2(dabco)](DMF)3.6(MeOH)1.8(H2O)1.8}n, in which the
ADCA ligands form 2D {[ZnII(adca)]}n linear sheets that are connected by the dabco ligands in a
manner analogous to pillars (Figure1.3.2 a). After solvent is removed from the pores, the cross
section of the channels of the framework are 5.6 Å × 5.8 Å with an intermolecular distance of 3.75
Å between the 2D sheets. Adsorption of the guest molecules, MA, DMA or DMPT, resulted in a
redshift in the emission spectrum of the MOF by approximately 80 nm, 110 nm and 120 nm,
respectively, which appeared as a broad, structureless band (Figure1.3.2 b, d). These spectral
changes are characteristic of exiplex formation between anthracene and DMA, which follows CT
interactions between excited state anthracene and the acceptor molecule. The authors reported a
ΦF of < 0.01 for the desolvated MOF, which is extremely low in comparison to that of the free
ligand (vide infra).
17
Figure1.3.2. (a) Scheme of host guest interactions in {[Zn2(adca)2(dabco)](DMF)3.6(MeOH)1.8(H2O)1.8}n (1) (b) Images of 1 with MA, DMA and DMPT samples under UV irradiation. (c) Diffuse reflectance spectra and (d) excitation (dotted line) and emission (solid line) spectra of 1 with MA (blue) and 1 with DMA (green). Images copied from reference 54.
Due to their porosity and high surface area, such materials have gained particular interest
for their applications in chemical sensing, as they offer the potential for high uptake of analyte and
enhanced sensitivity. Zang et al reported the self-assembled nanoscale LMOFs, containing 9,10-
bis(4-carboxyphenyl)anthracene (BCPA) that demonstrated sensitive fluorescence detection of
nitromethane and nitroaromatic explosive compounds. The fluorescence of the MOF is
significantly quenched upon exposure to (dinitrotoluene) DNT or (trinitrotoluene) TNT vapors as
a result of photoinduced electron transfer. When nitromethane was reduced to 1% saturated vapor
with a concentration of 360 ppm, the fluorescence of the Zr-BPCA MOF was quenched by 21%.
At 36,000 ppm and the fluorescence of the MOF is almost entirely quenched. On the other hand,
fluorescence of the free BPCA linker is only quenched by 6% at 360 ppm and only 40% at 36,000
ppm. The enhanced quenching efficiency of BPCA was ascribed to the high surface area within
a
b
c
d
18
the MOF and possibly, enhanced reducing ability of the nitro-compounds in the presence of Zn2+
ions.55
A MOF containing (2E,2′E)-3,3′-(anthracene-9,10-diyl)diacrylic acid connected to Cd2+
metal clusters was also explored for fluorescence detection of nitroaromatic compounds.56 The
MOF fluorescence was quenched in the presence of electron-deficient nitroaromatic molecules. In
the presence of electron-rich aromatics the MOF exhibits a dual-response dependent upon the
excitation wavelength; at 368 nm excitation, fluorescence quenching was observed, however,
when excited at 200 nm, the fluorescence intensity increased by 20%. The nature of this dual-
response was further investigated using density functional theory (DFT) calculations of the highest
occupied molecular orbital (HOMO) and the lowest unoccupied molecular orbital (LUMO). These
calculations revealed that the LUMO of the MOF is higher in energy than that of the electron-
deficient nitroaromatics and lower than that of the electron-rich compounds. The different
fluorescence responses were attributed to different charge transfer pathways. This anthracene-
based MOF also exhibited chemiluminescence at 530 nm in the presence of peroxide.
Fluorescence detection of 4-nitrophenol (4-NP) as well as Al3+ and Fe3+ ions by a barium-
MOF, {Ba5(ADDA)5(EtOH)2(H2O)3·5DMF}n (UPC-17; where DMF = N,N-dimethylformamide
and ADDA = 3,3′-(anthracene-9,10-diyl)diacrylic acid), has also been demonstrated.48 Upon
incorporation into the framework, the ADDA emission spectrum was blueshifted 14 nm, from 560
nm to 546 nm. UPC-17 exhibited a solvent-dependent emission spectrum, which shifted from 495
nm in methanol to 535 nm in acetone and 552 nm in THF. When aliquots of a 4-NP solution were
added to suspensions of 2 grams of UPC-17 in 3 mL of solvent, a steady decrease in the emission
intensity was observed. Additionally, UPC-17 showed selective detection of 4-NP over other
benzene derivatives. The addition of 233 μM 4-NP to UPC-17 suspended in acetone resulted in ~
19
80% quenching of the initial fluorescence intensity, 75% in THF and 60% in MeOH at the same
4-NP concentration. Fluorescence quenching was attributed to photoinduced electron-transfer
from the ADDA ligand of UPC-17 to the analyte. UPC-17 also showed selective emission
sensitivity to Fe3+ and Al3+ ions. In MeOH, the bright yellow-green fluorescence intensity
decreased gradually with the addition of Fe3+. At 70 μL (233 μM), ~ 90% of the initial fluorescence
intensity was quenched, However, in acetone, when 233 μM Fe3+ was added, the initial intensity
of UPC-17 only decreased by 23%. Interestingly, in THF, the fluorescence intensity of UPC-17
increased with Fe3+ ion concentration and was ~ 4.5 times greater than the initial intensity and at
233 μM Fe3+. Furthermore, the UPC-17 fluorescence shifted from bright yellow (~ 490 nm) to
yellow-green (~ 510 nm) with the addition of Fe3+ ions. Similarly, the addition of an Al3+ solution
resulted in enhanced fluorescence intensity up to ~8 times the initial intensity at 233 μM Al3+.
However, in contrast to Fe3+, the addition of Al3+ to a UPC-17/MeOH suspension did not
significantly alter the fluorescence. Fluorescence quenching by the metal ions was ascribed to
interference of the metal ions with intraligand or ligand-to-ligand energy transfer processes with
in the MOF.
1.3.3. Core-Shell MOFs
Core-shell MOFs (CS-MOFs) have been developed as a means of improving selectivity of
MOFs designed for fluorescent sensing. Kitagawa et al prepared a CS-MOF with a
[Zn2(bdc)2(dabco)]n (bdc = 1,4-benzene dicarboxylate , dabco = 1,4-diazabicyclo[2.2.2]octane)
core and {Zn2(adca)2(dabco)}n shell.57 Microscopic laser Raman spectroscopy (MLRS) was used
to characterize the CS-MOF crystals, which were mechanically sliced at the middle of the crystal.
A shell thickness of several tenths of a micrometer was determined by MLRS mapping and growth
of the core and shell frameworks into one crystal confirmed by synchrotron X-ray diffraction
20
measurements. 1H NMR spectrum obtained after digestion of the CS-MOF crystals in HCl
revealed a core-to-shell ratio of 8:2. The adsorption of petroleum molecules was explored using
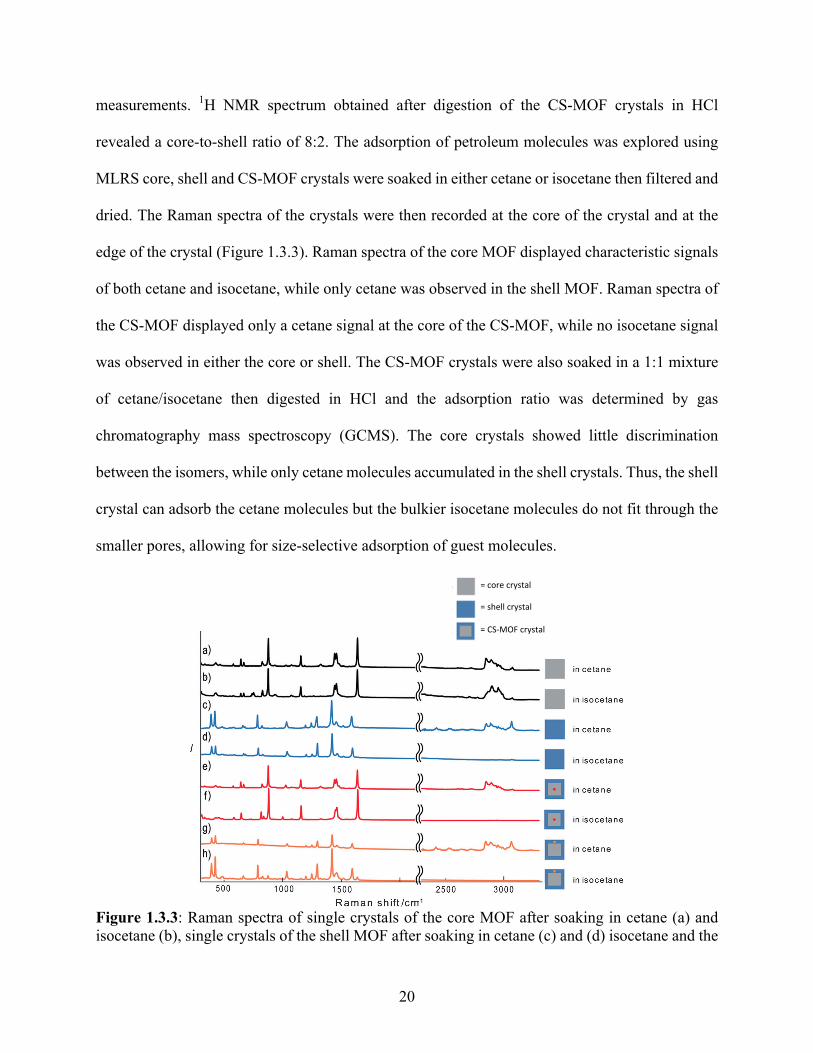
MLRS core, shell and CS-MOF crystals were soaked in either cetane or isocetane then filtered and
dried. The Raman spectra of the crystals were then recorded at the core of the crystal and at the
edge of the crystal (Figure 1.3.3). Raman spectra of the core MOF displayed characteristic signals
of both cetane and isocetane, while only cetane was observed in the shell MOF. Raman spectra of
the CS-MOF displayed only a cetane signal at the core of the CS-MOF, while no isocetane signal
was observed in either the core or shell. The CS-MOF crystals were also soaked in a 1:1 mixture
of cetane/isocetane then digested in HCl and the adsorption ratio was determined by gas
chromatography mass spectroscopy (GCMS). The core crystals showed little discrimination
between the isomers, while only cetane molecules accumulated in the shell crystals. Thus, the shell
crystal can adsorb the cetane molecules but the bulkier isocetane molecules do not fit through the
smaller pores, allowing for size-selective adsorption of guest molecules.
Figure 1.3.3: Raman spectra of single crystals of the core MOF after soaking in cetane (a) and isocetane (b), single crystals of the shell MOF after soaking in cetane (c) and (d) isocetane and the
=corecrystal=shellcrystal=CS-MOFcrystal

21
core portion of the CS-MOF after soaking in cetane (e) and isocetane (f) and from the shell portion of the CS-MOF in cetane (g) and isocetane (h), the red and orange points in the CS-MOF crystal indicate the points where the Raman laser was focused. Figure modified from reference 57.
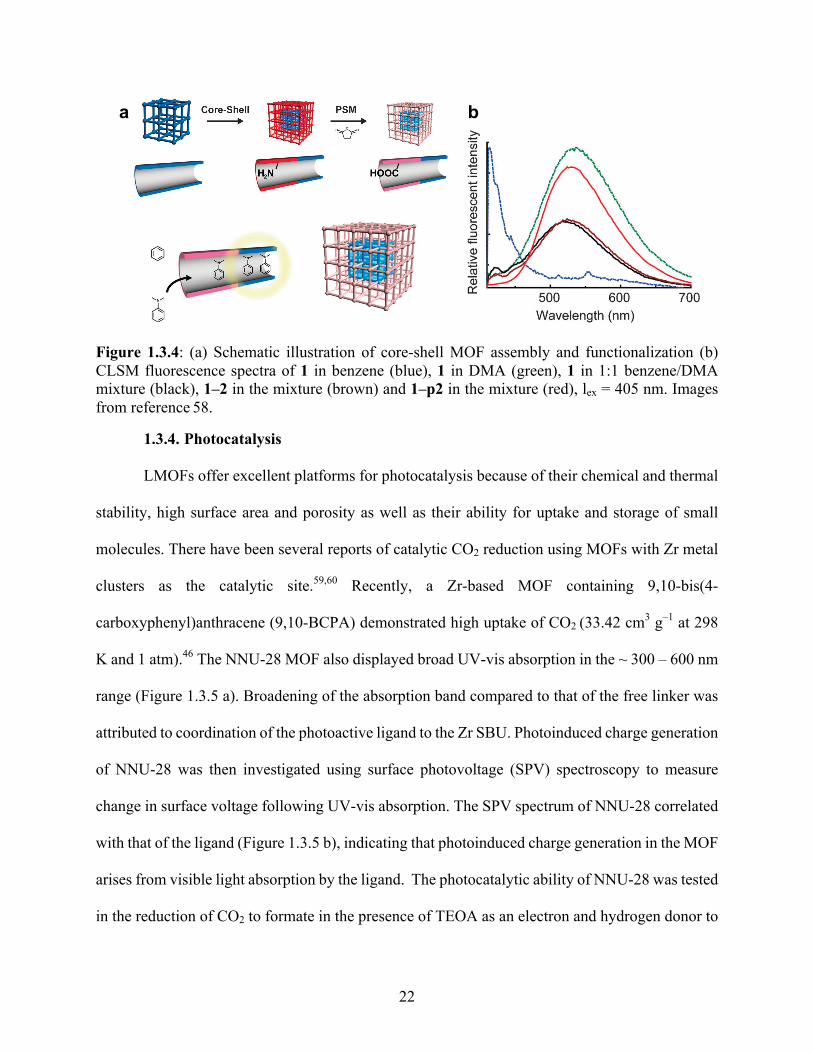
Kitagawa et al also reported CS-MOFs with the luminescent framework,
[Zn2(adca)2(dabco)]n (1) as the core and [Zn2(bdc)2(dabco)]n (2) as the shell.58 An amino group
was introduced into the core of the CS-MOF (1–2) through post-synthetic modification (PSM) and
replaced by a carboxyl group to increase the affinity for DMA over benzene, resulting in a CS-
MOF with [Zn2(NH2-bdc)2(dabco)]n as the core (1–p2, Figure 1.3.4 a). MOF 1 has shown
fluorescence sensitivity to small aromatic molecules due to exciplex formation between the
anthracene unit, which acts as an electron acceptor and DMA, the electron donor. Confocal light
scanning microscopy (CLSM) was used to examine the fluorescence properties of 1, 1–2 and 1–
p2. To test the selectivity of the CS-MOFs, fluorescence spectra were recorded in N,N-
dimethylaniline (DMA), benzene and a 1:1 mixture of the two (Figure 1.3.4 b). The anthracene-
based fluorescence of 1 and 1–2 at 420 nm was significantly quenched in DMA and a new broad
emission band appeared in the 400 – 700 nm range. The broad emission is attributed to a
photoinduced CT complex formation of an exciplex between the host anthracene unit and guest
DMA molecules. The emission spectrum of 1 and 1–2 in the 1:1 mixture showed both the broad
exciplex emission (400 – 700 nm) and monomeric anthracene emission at 420 nm. In contrast, the
fluorescence spectrum of the 1–p2 in the solvent mixture showed predominantly exciplex
fluorescence. Additionally, the maximum intensity of the exciplex emission of the core crystal is
~1.9 times stronger than that of 1 and 1–2. Thus, the PSM CS-MOF improves detection of guest
molecules shell through selective uptake of guest species, resulting in enhanced fluorescence-
response from the core MOF.
22
Figure 1.3.4: (a) Schematic illustration of core-shell MOF assembly and functionalization (b) CLSM fluorescence spectra of 1 in benzene (blue), 1 in DMA (green), 1 in 1:1 benzene/DMA mixture (black), 1–2 in the mixture (brown) and 1–p2 in the mixture (red), lex = 405 nm. Images from reference 58.
1.3.4. Photocatalysis
LMOFs offer excellent platforms for photocatalysis because of their chemical and thermal
stability, high surface area and porosity as well as their ability for uptake and storage of small
molecules. There have been several reports of catalytic CO2 reduction using MOFs with Zr metal
clusters as the catalytic site.59,60 Recently, a Zr-based MOF containing 9,10-bis(4-
carboxyphenyl)anthracene (9,10-BCPA) demonstrated high uptake of CO2 (33.42 cm3 g–1 at 298
K and 1 atm).46 The NNU-28 MOF also displayed broad UV-vis absorption in the ~ 300 – 600 nm
range (Figure 1.3.5 a). Broadening of the absorption band compared to that of the free linker was
attributed to coordination of the photoactive ligand to the Zr SBU. Photoinduced charge generation
of NNU-28 was then investigated using surface photovoltage (SPV) spectroscopy to measure
change in surface voltage following UV-vis absorption. The SPV spectrum of NNU-28 correlated
with that of the ligand (Figure 1.3.5 b), indicating that photoinduced charge generation in the MOF
arises from visible light absorption by the ligand. The photocatalytic ability of NNU-28 was tested
in the reduction of CO2 to formate in the presence of TEOA as an electron and hydrogen donor to
b a
23
recycle the catalyst. Ion chromatography showed an increase in of HCOO– formate anion
concentration over time under continuous visible-light illumination. The average formation rate of
HCOO– was estimated to be 183.3 mmol h–1 mmolMOF–1. Control experiments performed in the
dark or in the absence of NNU-28 showed no formate production. PXRD patterns of the NNU-28
MOFs indicated that crystal structure of the MOF was retained. Furthermore, NNU-28 could be
reused up to three cycles with little decrease in photocatalytic activity. Control experiments using
an equimolar amount of the free anthracene-based ligand in place of NNU-28 resulted in
generation of 7.2 mmol formate anions within 10 hours under the same conditions. Thus, the
anthracene-based ligand accounts for ~ 27% of CO2 conversion in NNU-28. Additional control
experiments, in which the reaction solution was pre-degassed by N2 instead of CO2, verified that
the formate anion was a produced by CO2 reduction only and not by ligand decomposition. To
further investigate the mechanism of NNU-28 photocatalysis, electron paramagnetic resonance
(EPR) studies were performed in the dark and light for both the free ligand and NNU-28 (Figure
1.3.5 c,d). An enhanced signal at g = 2.003 was observed in the light compared to the dark,
indicating light-induced radical formation, which is responsible for CO2 reduction by the free
ligand. NNU-28 showed no EPR signal in the dark, while in the light, the signal at g = 2.003 was
observed. Time-resolved experiments showed the signal intensities increased under continuous
irradiation and reached the maximum at about 4 min and two additional signals appeared that were
not observed in the ligand at g = 2.009 and 2.030. These two EPR signals were previously observed
in the zirconium-based MOF, UiO-66 and were ascribed to sensitization of the Zr6-oxo cluster
through the LMCT process. All together, these experiments demonstrate that both the anthracene-
based ligand and Zr6-oxo cluster contribute to photocatalytic CO2 reduction by NNU-28.

24
Figure 1.3.5. (a) UV-vis absorption spectrum of NNU-28 (b) SPV spectrum of NNU-28 (black) and the ligand (blue) (c) EPR signals of the ligand in the dark (black) and light (red) and NNU-28 in the dark (green) and light (blue) (d) time-evolution EPR signal of NNU-28 under continuous visible light illumination. Figures from reference 46.
LMOFs have also been employed in photoinduced polymerizations. Recently, the Zn-
based MOF, NNU-35 with a pillar-layer structure comprising [9,10-bis(4′-pyridylethynyl)-
anthracene] (BPEA) “layers” and BDC “pillars”, was used as the photosensitizer in the copper
catalyzed atom transfer radical polymerization (ATRP) of methacrylates. Photoinduced ATPR
involves electron transfer from a photosensitizer to a Cu(II) catalyst, generating the Cu(I) catalyst,
which activates alkyl halides by halogen transfer to form radicals. These radicals drive the
polymerization until deactivated by the Cu (II) catalyst. NNU-35 has extremely broad UV-vis
absorption spanning the 330 – 800 nm. The broadened absorption of NNU-35 was attributed to
energy-transfer and charge-transfer interactions in the MOF. EPR studies reveal long-lived
photoinduced charge separation in NNU-35, attributed to the free radical formation from the BPEA
ligand. The ability of NNU-35 to mediate ATRP reactions was demonstrated in the polymerization
a
c
b
d

25
of methacrylate monomers. NNU-35 photoinduced reaction polymerized 48% monomer after 8 h
irradiation with a molecular weight distribution (Mw/Mn) of 1.12. Control experiments showed no
polymerization occurred in the absence of NNU-35. The ability of NNU-35 to control
photopolymerization by light switching was also shown. The proposed mechanism of NNU-35
mediated ATRP is shown in Figure 1.3.6, where the Cu(II) complex is reduced by NNU-35 by a
1 electron transfer, the resulting Cu(I) complex reacts alkyl halide (R–X) to form radicals (R•),
which initiate the ATRP. The ligand radical of NNU-35 gains an electron from the reductive
amine, returning to its original state, and the reaction intermediate (amine+X−) returns the chain-
end halogen.
Figure 1.3.6: Proposed mechanism for NNU-35 photoinitiated ATRP.
1.3.5. Conductivity and Electroluminescence
The ability to tune the structure of MOF allows for control of interaction between
anthracene units. A microporous Zn-MOF, NNU-27, was constructed from the anthracene-based,
BPEA ligands, which formed zigzag chains with face-to-face distances of 3.420 Å through π-
stacking between ligands. As a result of the distinct spatial arrangement of anthracene units in the
MOF, NNU-27 exhibited both conductivity as well as electroluminescence. Current-voltage (I-V)
measurements NNU-27 single crystals and the resulting I–V curves showed linear dependence at
ambient temperature, revealing charge transport in the NNU-27 crystals. The conductivity of the

26
MOF was determined by measuring the effective contact area and was found to be 1.3 (±0.5) ×
10–3 Scm–1. NNU-27 also displayed orange-red electroluminescence emission, centered at 575 nm,
under an applied voltage of ~ 27 V. The electroluminescence of NNU-27 arises from to the
formation of electromers induced by the electric field.61
1.3.6. Scintillating MOFs
Scintillating materials display luminescence upon absorption of charged particles or high-
energy radiation. Anthracene can be excited into higher singlet states upon absorption of ionizing
radiation and subsequently undergo fast internal conversion to the lowest singlet excited state,
from which fluorescence occurs. Crystalline anthracene displays the highest scintillation of (light
output per unit energy) of any organic scintillator and is often used as a standard. However, the
usefulness of anthracene crystals is limited by a number of drawbacks as they are fragile, quickly
photo-oxidized in air and scintillation efficiency strongly depends on the temperature, degree of
perfection and crystal thickness while large crystals are not easily obtained.62
Alledorf et al have explored a series of scintillating MOFs and have found that the stability
of the scintillators to radiation damage is improved when incorporated into a MOF structure.63
5,5′-(anthracene-9,10-diyl)diisophthalic acid (DPATC) was incorporated into the Zn-based MOF,
PCN-14-Zn and to study the effects of linker conjugation.64 The MOF exhibited a similar emission
spectrum to that of the free DPATC linker, however, the absorption spectrum was significantly
blueshifted, indicating that there is a higher energy barrier for excitation in the MOF. DFT
calculations revealed that rotation of the phenyl groups of DPATC occurs upon excitation from
dihedral angles of 67.9º in the ground state to 56.8º and 54.9º in the singlet and triplet excited
states, respectively. Furthermore, the torsional rotation of the phenyl groups relative to the
anthracene moiety was reduced due to the rigidity of the multidentate ligand upon coordination
27
within the MOF, where a dihedral angle of 70º was observed in the crystal structure of the MOF.
This also resulted in a shorter fluorescence lifetime in the MOF (τ1 ~ 1ns, τ2 ~ 5ns) compared to
solution (τ1 ~ 7 ns, τ2 ~ 8ns, τ3 ~ 9 ns) due to increased efficiency of non-radiative deactivation
pathways. PCN-14-Zn exhibited a prompted scintillation of 3 ns, between the τ1 and τ2 of
fluorescence and with lower efficiency relative to other scintillation MOFs studied.64
In another study, Lin et al reported two X-ray scintillating MOFs with 9,10-bis(4-
carboxyphenyl)anthracene (BCPA) as the linker and Hf or Zr as the metal node and X-ray
absorber.65 Typically, organic scintillators do not interaction with X-rays to produce luminescence
thus; Hf4+ and Zr4+ were introduced as X-ray antenna. Hf4+ and Zr4+ metal ions eject outer-shell
electrons upon the absorption of X-rays from 20 − 200 keV. These electrons can then interact with
the anthracene-based linkers to generate luminescence. Accordingly, when the Hf-MOF and Zr-
MOF were subjected to X-ray excitation, bright radioluminescence was observed.
1.3.7. Multiphoton Harvesting and Upconversion
LMOFs are promising candidates for light-harvesting materials owing to properties such
as structural diversity, tunability of absorption and emission wavelengths, high surface area and
energy transport abilities.66,67 Multiple phonon harvesting was recently realized in an anthracene-
based MOF.68 Multiphoton harvesting is a process of photon upconversion in which two or more
photons are absorbed simultaneously, promoting a molecule into an excited state. The subsequent
relaxation of the excited-state results in the emission of a photon with frequency greater than that
of the absorbed photons. The multiphoton harvesting MOF was constructed from the anthracene
derivatives, trans,trans-9,10-bis(4-pyridylethenyl)anthracene (An2Py), and trans,trans-4,4′-
stilbenedicarboxylic acid (H2SDC) connecting zinc-oxide metal nodes. The resulting MOFs
consisted of 4-fold interpenetrating networks, where the H2SDC ligands form linear sheets, joined

28
together by the An2Py pillar ligands. Both anthracene and peryline were introduced into the
frameworks as Förster resonance energy transfer (FRET) acceptors to enhance the luminescence
of the MOFs. The fluorescence quantum yield of An2Py increased when integrated into the MOF
due to the structural rigidity and the emission spectrum resembled that of the anthracene derivative.
The doped MOFs exhibited higher quantum yields than the undoped MOF. π–π stacking
interactions between the guest anthracene or perylene molecules with the An2Py along with FRET
from the guest species to the organic-linkers resulted in quenching of guest fluorescence
concurrent with increased emission from the MOF. The MOFs have an absorption maximum at
400 nm, and displayed UC luminescence due to 2, 3 and 4 photon absorption upon excitation at
800 nm, 1200 nm and 1500 nm, respectively. Additionally, the UC luminescence showed a
dependence upon excitation intensity. The development of materials for multiphoton upconversion
is of interest in a variety of fields including biological imaging, photodynamic therapy, optical data
storage and lasing.68
1.3.8. Triplet-Triplet Annihilation-Based Upconversion
Fluorescence upconversion through triplet-triplet annihilation (TTA) was also recently
demonstrated in anthracene-based MOFs. TTA-based upconversion offers particular advantages
in the field of solar energy harvesting where, in contrast to multi-photon absorption processes,
TTA can be achieved using low-power, non-coherent excitation sources.25 Three zinc-based MOFs
containing the anthracene derivative, adb were explored, [Zn2(adb)2(dabco)]n (1) MOF and
[Zn2(adb)2(bpy)]n (2) MOFs (where adb = 4,4′-(anthracene-9,10-diyl)dibenzoate and bpy = 5,5′-
bipyridine) and [Zn(adb)(DEF)2]n (3). The intermolecular distances between anthracene units
(center-to-center) were 7.6 Å, 4.8 Å and 3.2 Å, for 1, 2 and 3, respectively. All three MOFs
displayed upconverted emission when suspended in deaerated solutions of the TTA sensitizer,
29
PdOEP, in benzene. Irradiation of the system with 532 nm light resulted in upconverted emission
~ 440 nm with TTET efficiencies of 12%, 8% and 59% for 1, 2 and 3, respectively. The emission
showed a quartic dependence upon excitation intensity at lower intensities, indicative of TTA.
PdOEP was modified with carboxyl groups and covalently attached to the surface of the nano-
sized [Zn(adb)(DEF)2]n MOFs. Under anaerobic conditions, these MOFs displayed upconverted
blue fluorescence when excited with 532 nm light. To avoid overheating of the MOFs and
photobleaching of PdOEP, the MOFs were encapsulated in PMMA. The TTET efficiency of the
MOFs in these encapsulated PdOEP-modified MOFs was 61%. Additionally, the triplet lifetime
of the MOF increased from 1 ms in benzene to 4 ms in PMMA, which was ascribed to further
chromophore stabilization in the polymer matrix.69
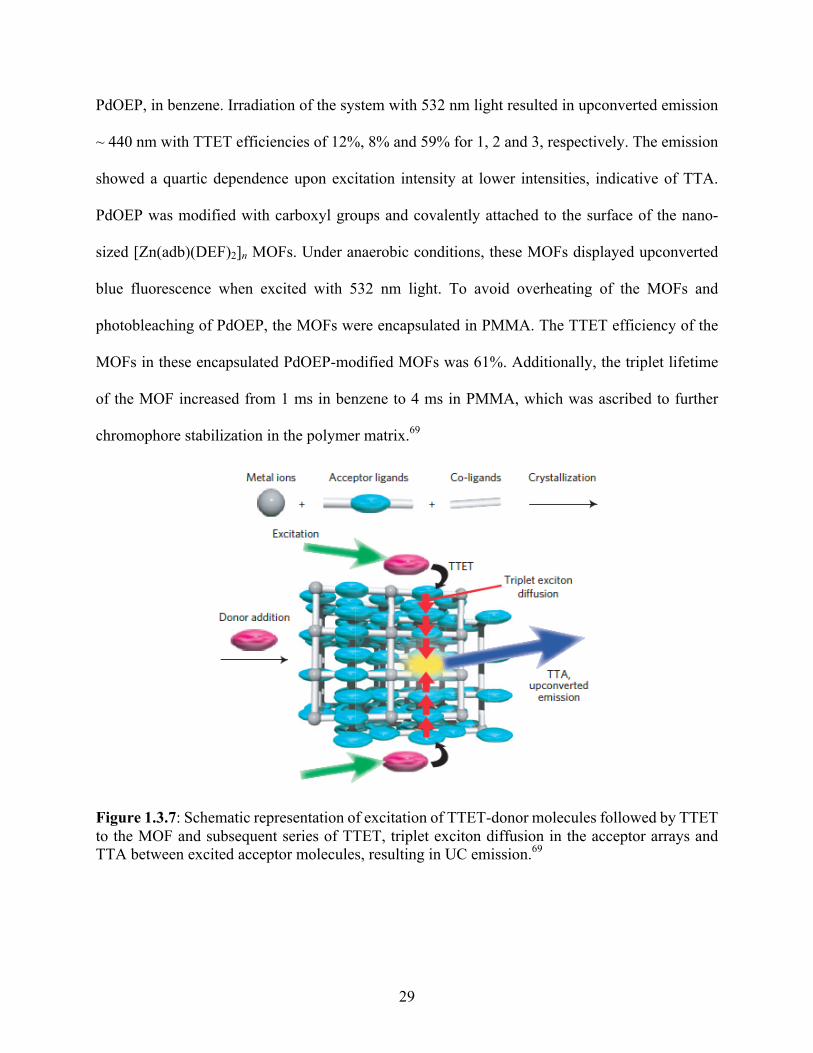
Figure 1.3.7: Schematic representation of excitation of TTET-donor molecules followed by TTET to the MOF and subsequent series of TTET, triplet exciton diffusion in the acceptor arrays and TTA between excited acceptor molecules, resulting in UC emission.69
30
1.4. Conclusions
The unique photophysical properties of anthracene have led to its widespread application
in many fields. The excited-state properties of anthracene, such as the wavelength of emission,
fluorescence lifetime and quantum yield, can be fine-tunes affording its broad versatility. Due to
their distinct crystallinity, MOFs can afford an ideal material for studying specific interactions
between anthracene ligands and/or interactions with guest species. A number of anthracene
derivatives have been incorporated into MOFs for a variety of applications. The photophysical
properties of the anthracene-based MOFs are generally related to that of the free anthracene-based
ligand, however interactions can also be further modified when introduced into the crystalline
framework through such as aggregate-induced emission, metal-to-ligand charge transfer,
interactions with guest molecules that result in quenching or enhancement of fluorescence as well
as interchromophore interactions such as π–π stacking.
1.5. Project Description
Anthracene-based MOFs have proved to be highly promising candidates in the
development of photoactive materials with many avenues yet to be explored. In order to rationally
design luminescent MOFs tailored for specific applications, a thorough understanding of the
photophysical processes of the individual building blocks is essential. The goal of this project is
to gain an understanding of the excited-state properties of the free organic linkers, including the
effects of both derivatization and local environment and to then investigate how these properties
are further altered upon incorporation into MOFs. To this end, three anthracene dicarboxylic acids
(ADCAs) – 1,4-ADCA, 2,6-ADCA and 9,10-ADCA – were synthesized and their photophysical
properties in solution were systematically studied. The organic linkers were then incorporated into
zirconium-based MOFs and the excited state properties of the resulting MOFs were investigated.
31
1.6. References
1. (a) Becker, H. D., Unimolecular Photochemistry of Anthracenes. Chem. Rev. 1993, 93, 145–172; (b) Tao, S.; Xu, S.; Zhang, X., Efficient Blue Organic Light-Emitting Devices Based on Novel Anthracence Derivatives with Pronounced Thermal Stability and Excellent Film-Forming Property. Chem. Phys. Lett. 2006, 429, 622–627. 2. Zhu, M.; Yang, C., Blue Fluorescent Emitters: Design Tactics and Applications in Organic Light-Emitting Diodes. Chem. Soc. Rev. 2013, 42, 4963–4976. 3. Lackowicz, J. R., Princeples of Fluorescence Spectroscopy 3rd Ed. Springer Science+Business Media, LLC: 2010. 4. Valeur, B.; Berberan-Santos, M. N., Molecular Fluorescence: Principles and Applications. Wiley-VCH: 2012. 5. Platt, J. R., The Box Model and Electron Densities in Conjugated Systems. The Journal of Chemical Physics 1954, 22 (8), 1448-1455. 6. Klevens, H. B.; Platt, J. R., Spectral Resemblances of Cata-Condensed Hydrocarbons. The Journal of Chemical Physics 1949, 17 (5), 470-483. 7. Sidman, J. W., Electronic and Vibrational States of Anthracene. J. Chem. Phys. 1956, 25, 115-121. 8. Platt, J. R., Classification of Spectra of Cata-Condensed Hydrocarbons. J. Chem Phys. 1949, 17, 484-495. 9. Klevens, H. B.; Platt, J. R., Spectral Resemblances of Cata-Condensed Hydrocarbons. The Journal of Chemical Physics 1949, 17 (5), 470-481. 10. Tigoianu, I. R.; Dorohoi, D. O.; Airinei, A., Solvent Influence on the Electronic Absorption Spectra of Anthracene. Rev. Chim. (Bucharest, Rom.) 2009, 60 (1), 42-44. 11. Arnaut, L. G.; Formosinho, S. J., Chemical Kinetics: From Molecular Structure to Chemical Reactivity. Elsevier: Amsterdam, Boston, 2007. 12. Lakowicz, J. R., Principles of Flourescence Spectroscopy. Springer US: 2006. 13. Berlman, I. B., Handbook of fluorescence spectra of aromatic molecules. 2d ed.; Academic Press: New York,, 1971; p xiv, 473 p. 14. (a) Melhuish, W. H., Quantum Efficiencies of Fluorescence of Organic Substances: Effect of Solvent and Concentration of the Fluorescent Solute. The Journal of Physical Chemistry 1961, 65 (2), 229-235; (b) Ware, W. R.; Baldwin, B. A., Absorption Intensity and Fluorescence Lifetimes of Molecules. The Journal of Chemical Physics 1964, 40 (6), 1703-1705; (c) Dawson, W. R.; Windsor, M. W., Fluorescence yields of aromatic compounds. The Journal of Physical Chemistry 1968, 72 (9), 3251-3260; (d) Lampert, R. A.; Chewter, L. A.; Phillips, D.; O'Connor, D. V.; Roberts, A. J.; Meech, S. R., Standards for Nanosecond Fluorescence Decay Time Measurements. Analytical Chemistry 1983, 55 (1), 68-73. 15. Melhuish, W. H.; Hardwick, R., Lifetime of the Triplet State of Anthracene in Lucite. J. Chem. Soc. Faraday Trans. 1962, 58, 1908–1911. 16. Berlman, I. B., Handbook of Fluorescence Spectra of Aromatic Molecules. Academic Press: New York, 1971. 17. Pedash, Y. F.; Prezhdo, O. V.; Kotelevshiy, S. I.; Prezhdo, V. V., Spin–Orbit Coupling and Lumincescence Characteristics of Conjugated Organic Molecules. I. Polyacenes. Journal of Molecular Structure (Theochem) 2002, 585, 49-59. 18. Reineke, S.; Baldo, M. A., Room Temperature Triplet State Spectroscopy of Organic Semiconductors. Scientific Reports 2014, 4, 3797.

32
19. Shockley, W.; Queisser, H. J., Detailed Balance Limit of Efficiency of p-n Junction Solar Cells. Journal of Applied Physics 1961, 32, 510-519. 20. Nichols, V. M.; Rodriguez, M. T.; Piland, G. B.; Tham, F.; Nesterov, V. N.; Youngblood, W. J.; Bardeen, C. J., Assessing the Potential of Peropyrene as a Singlet Fission Material: Photophysical Properties in Solution and the Solid State. The Journal of Physical Chemistry C 2013, (117), 16802-16810. 21. Congreve, D. N.; Lee, J.; Thompson, N. J.; Hontz, E.; Yost, S. R.; Reusswig, P. D.; Bahlke, M. E.; Reineke, S.; Voorhis, T. V.; Baldo, M. A., External Quantum Efficiency Above 100% in a Singlet-Exciton-Fission–Based Organic Photovoltaic Cell. Science 2013, 340, 334-337. 22. Smith, M. B.; Michl, J., Singlet fission. Chem. Rev. 2010, 110, 6891–6936. 23. Burdett, J. J.; Bardeen, C. J., The Dynamics of Singlet Fission in Crystalline Tetracene and Covalent Analogs. Accounts of Chemical Research 2012, 46 (6), 1312-1320. 24. Piland, G. B.; Bardeen, C. J., How Morphology Affects Singlet Fission in Crystalline Tetracene. . J. Phys. Chem. Lett. 2015, 6, 1841− 1846. 25. Zhou, J.; Liu, Q.; Feng, W.; Sun, Y.; Li, F., Upconversion Luminescent Materials: Advances and Applications. Chem. Rev. 2015, 115, 395–465. 26. Islangulov, R. R.; Kozlov, D. V.; Castellano, F. N., Low power Upconversion Using MLCT Sensitizers. Chem. Commun. 2005, 3776–3778. 27. Singh-Rachford, T. N.; Castellano, F. N., Photon Upconversion Based on Sensitized Triplet–Triplet Annihilation. Coordination Chemistry Reviews 2010, 254, 2560-2573. 28. Kozlov, D. V.; Castellano, F. N., Anti-Stokes Delayed Fluorescence from Metal–Organic Bichromophores. Chem. Commun. 2004, 2860 (24), 2860–2861. 29. Barber, R. A.; Mayo, P. d.; Okada, K.; Wong, S. K., Photosensitized [4 + 4'] Cycloreversion of Anthracene Dimer Via an Electron-Transfer Mechanism. J. Am. Chem. Soc. 1982, 104 (18), 4995–4997. 30. Charlton, J. L.; Dabestani, R.; Saltiel, J., Adsorption of Bifunctional Organic Disulfides on Gold Surfaces. J. Am. Chem. Soc. 1983, 105 (13), 4481–4483. 31. Islangulov, R. R.; Castellano, F. N., Photochemical Upconversion: Anthracene Dimerization Sensitized to Visible Light by a Ru(II) Chromophore. Angew. Chem. Int. Ed. 2006, 45, 5957–5959. 32. Birks, J. B.; Aldekomo, J. B., The Photodimerization and Excimer Fluorescence of 9-methyl Anthracene. Photochem Photobiol 1963, 2, 415–418. 33. (a) Shah, B. K.; Neckers, D. C.; Shi, J.; Forsythe, E. W.; Morton, D., Photophysical properties of anthanthrene-based tunable blue emitters. J. Phys. Chem. A 2005, 109, 7677–7681; (b) Moorthy, J. N.; Venkatakrishnan, P.; Natarajan, P.; Huang, D. F.; Chow, T. J., De Novo Design for Functional Amorphous Materials: Synthesis and Thermal and Light-Emitting Properties of Twisted Anthracene-Functionalized Bimesitylenes. J. Am. Chem. Soc. 2008, 130 (51), 17320–17333; (c) Swager, T. M.; Gil, C. J.; Wrighton, M. S., Fluorescence Studies of Poly(p-phenyleneethynylene)s: The Effect of Anthracene Substitution. J. Phys. Chem. 1995, 99 (14), 4886–4893. 34. Malkin, J., Photophysical and Photochemical Properties of Aromatic Compounds. CRC: Boca Raton, 1992. 35. Islangulov, R. R.; Lott, J.; Weder, C.; Castellano, F. N., Noncoherent Low-Power Upconversion in Solid Polymer Films. J. Am. Chem. Soc. 2007, 129, 12652–12653. 36. Raghunath, P.; Reddy, M. A.; Gouri, C.; Bhanuprakash, K.; Rao, V. J., Electronic Properties of Anthracene Derivatives for Blue Light Emitting Electroluminescent Layers in
33
Organic Light Emitting Diodes: A Density Functional Theory Study. J. Phys. Chem. A 2006, 110 (3), 1152–1162. 37. He, J.; Xu, B.; Chen, F.; Xia, H.; Li, K.; Ye, L.; Tian, W., Aggregation-Induced Emission in the Crystals of 9,10-distyrylanthracened Derivatives: The Essential Role of Restricted Intramolecular Torsion. J. Phys. Chem. C 2009, 113, 9892–9899. 38. Dong, Y.; Xu, B.; Zhang, J.; Tan, X.; Wang, L.; Chen, J.; Lv, H.; Wen, S.; Li, B.; Ye, L.; Zou, B.; Tian, W., Piezochromic Luminescence Based on the Molecular Aggregation of 9,10-Bis((E)-2-(pyrid-2-yl)vinyl)Anthracene. Angew. Chem. 2012, 124, 10940–10943. 39. Kohmoto, S.; Chuko, R.; Hisamatsu, S.; Okuda, Y.; Masu, H.; Takahashi, M.; Kishikawa, K., Piezoluminescence and Liquid Crystallinity of 4,4′-(9,10-anthracenediyl)bispyridinium Salts. Cryst. Growth Des. 2015, 15, 2723–2731. 40. Allendorf, M. D.; Bauer, C. A.; Bhaktaa, R. K.; Houka, R. J. T., Luminescent Metal–Organic Frameworks. Chem. Soc. Rev. 2009, 38, 1330–1352. 41. Hu, Z.; Deibert, B. J.; Li, J., Luminescent Metal–Organic Frameworks for Chemical Sensing and Explosive Detection. Chem. Soc. Rev. 2014, 43, 5815–5840. 42. Ma, S.; Wang, X.-S.; Collier, C. D.; Manis, E. S.; Zhou, H.-C., Ultramicroporous Metal-Organic Framework Based on 9,10-Anthracenedicarboxylate for Selective Gas Adsorption. Inorg. Chem. 2007, 46 (21), 8499–8501. 43. Ma, S.; Simmons, J. M.; Sun, D.; Yuan, D.; Zhou, H.-C., Porous Metal-Organic Frameworks Based on an Anthracene Derivative: Syntheses, Structure Analysis, and Hydrogen Sorption Studies. Inorg. Chem. 2009, 48, 5263–5268. 44. Ma, S.; Sun, D.; Forster, P. M.; Yuan, D.; Zhuang, W.; Chen, Y.-S.; Parise, J. B.; Zhou, H.-C., A Three-Dimensional Porous Metal-Organic Framework Constructed from Two-Dimensional Sheets via Interdigitation Exhibiting Dynamic Features. Inorg. Chem. 2009, 48 (11), 4616–4618. 45. Kim, J.; Chen, B.; Reineke, T. M.; Li, H.; Eddaoudi, M.; Moler, D. B.; O′Keeffe, M.; Yaghi, O. M., Assembly of Metal-Organic Frameworks from Large Organic and Inorganic Secondary Building Units: New Examples and Simplifying Principles for Complex Ctructures. J. Am. Chem. Soc. 2001, 123 (34), 8239–8247. 46. Chen, D.; Xing, H.; Wang, C.; Su, Z., Highly Efficient Visible-Light-Driven CO2 Reduction to Formate by a New Anthracene-Based Zirconium MOF via Dual Catalytic Routes. J. Mater. Chem. A 2016, 4, 2657–2662. 47. Vinogradov, A. V.; Milichko, V. A.; Zaake-Hertling, H.; Aleksovska, A.; Gruschinski, S.; Schmorl, S.; Kersting, B.; Zolnhofer, E. M.; Sutter, J.; Meyer, K.; Lönnecke, P.; Hey-Hawkins, E., Unique Anisotropic Optical Properties of a Highly Stable Metal–Organic Framework Based on Trinuclear Iron(III) Secondary Building Units Linked by Tetracarboxylic Linkers with an Anthracene Core. Dalton Trans. 2016, (Advanced Article). 48. Wang, R.; Liu, X.; Huang, A.; Wang, W.; Xiao, Z.; Zhang, L.; Dai, F.; Sun, D., Unprecedented Solvent-Dependent Sensitivities in Highly Efficient Detection of Metal Ions and Nitroaromatic Compounds by a Fluorescent Barium Metal-Organic Framework. Inorg. Chem. 2016, 55 (4), 1782−1787. 49. Liu, F.; Zhang, L.; Wang, R.; Sun, J.; Yang, J.; Chen, Z.; Wang, X.; Sun, D., Five MOFs with different topologies based onanthracene functionalized tetracarboxylic acid: syntheses, structures, and properties. Cryst. Eng. Comm. 2013, 16, 2917–2928.

34
50. Cavka, J. H.; Jakobsen, S.; Olsbye, U.; Guillou, N.; Lamberti, C.; Bordiga, S.; Lillerud, K. P., A New Zirconium Inorganic Building Brick Forming Metal-Organic Frameworks with Exceptional Stability. J. Am. Chem. Soc. 2008, 130 (42), 13850–13851. 51. Katz, M. J.; Brown, Z. J.; Y. J. Colón, b.; Siu, P. W.; Scheidt, K. A.; Snurr, R. Q.; Huppa, J. T.; Farhaa, O. K., A Facile Synthesis of UiO-66, UiO-67 and Their Derivatives. Chem. Commun. 2013, 49, 9449–9451. 52. Pu, S.; Xu, L.; Sun, L.; Du, H., Tuning the Optical Properties of the Zirconium–UiO-66 Metal–Organic Framework for Photocatalytic Degradation of Methyl Orange. Inorg. Chem. Comm. 2015, 52, 50–52. 53. Banerjee, R.; Furukawa, H.; Britt, D.; Knobler, C.; O’Keeffe, M.; Yaghi, O. M., Control of Pore Size and Functionality in Isoreticular Seolitic Imidazolate Frameworks and Their Carbon Dioxide Selective Capture Properties. J. Am. Chem. Soc. 2009, 131 (11), 3875–3877. 54. Tanaka, D.; Horike, S.; Kitagawa, S.; Ohba, M.; Hasegawa, M.; Ozawac, Y.; Toriumi, K., Anthracene Array-Type Porous Coordination Polymer with Host–Guest Charge Transfer Interactions in Excited States. Chem. Commun. 2007, 3142–3144. 55. Zhang, C.; Che, Y.; Zhang, Z.; Yang, X.; Zang, L., Fluorescent nanoscale zinc(II)-carboxylate coordination polymers for explosive sensing. Chem. Commun. 2011, 47, 2336–2338. 56. Yang, X.-L.; Chen, X.; Hou, G.-H.; Guan, R.-F.; Shao, R.; Xie, M.-H., A Multiresponsive Metal-Organic Framework: Direct Chemiluminescence, Photoluminescence, and Dual Tunable Sensing Applications. Adv. Funct. Mater. 2016, 26, 393–398. 57. Hirai, K.; Furukawa, S.; Kondo, M.; Uehara, H.; Sakata, O.; Kitagawa, S., Sequential Functionalization of Porous Coordination Polymer Crystals. Angew. Chem. Int. Ed. 2011, 50, 8057–8061. 58. Hirai, K.; Furukawa, S.; Kondo, M.; Meilikhov, M.; Sakata, Y.; Sakata, O.; Kitagawa, S., Targeted functionalisation of a hierarchically-structured Porous Coordination Polymer Crystal Enhances its Entire Function. Chem Commun (Camb) 2012, 48 (52), 6472-4. 59. Xu, H. Q.; Hu, J.; Wang, D.; Li, Z.; Zhang, Q.; Luo, Y.; Yu, S. H.; Jiang, H. L., Visible-Light Photoreduction of CO2 in a Metal-Organic Framework: Boosting Electron-Hole Separation via Electron Trap States. J Am Chem Soc 2015, 137 (42), 13440-3. 60. Wang, G.; Sun, Q.; Liu, Y.; Huang, B.; Dai, Y.; Zhang, X.; Qin, X., A Bismuth-Based Metal-Organic Framework as an Efficient Visible-Light-Driven Photocatalyst. Chemistry 2015, 21 (6), 2364-7. 61. Borges, D. D.; Devautour-Vinot, S.; Jobic, H.; Ollivier, J.; Nouar, F.; Semino, R.; Devic, T.; Serre, C.; Paesani, F.; Maurin, G., Proton Transport in a Highly Conductive Porous Zirconium-Based Metal-Organic Framework: Molecular Insight. Angew Chem Int Ed Engl 2016, 55 (12), 3919-24. 62. Knoll, G. F., Radiation detection and measurement. 2nd ed.; Wiley: New York, 1989; p xix, 754 p. 63. Doty, F. P.; Bauer, C. A.; Skulan, A. J.; Grant, P. G.; Allendorf, M. D., Scintillating Metal-Organic Frameworks: A New Class of Radiation Detection Materials. Adv. Mater 2009, 21, 95–101. 64. Perry, J. J.; Feng, P. L.; Meek, S. T.; Leong, K.; Doty, F. P.; Allendorf, M. D., Connecting Structure with Function in Metal–Organic Frameworks to Design Novel Photo- and Radioluminescent materials. J. Mater. Chem. 2012, 22, 10235–10248.
35
65. Wang, C.; Volotskova, O.; Lu, K.; Ahmad, M.; Sun, C.; Xing, L.; Lin, W., Synergistic Assembly of Heavy Metal Clusters and Luminescent Organic Bridging Ligands in Metal−Organic Frameworks for Highly Efficient X‑ray Scintillation. J. Am. Chem. Soc. 2014, 136, 6171–6174. 66. So, M. C.; Wiederrecht, G. P.; Mondloch, J. E.; Hupp, J. T.; Farha, O. K., Metal-Organic Framework Materials for Light-Harvesting and Energy Transfer. Chem Commun (Camb) 2015, 51 (17), 3501-10. 67. Kent, C. A.; Mehl, B. P.; Ma, L.; Papanikolas, J. M.; Meyer, T. J.; Lin, W., Energy Transfer Dynamics in Metal-Organic Frameworks. J Am Chem Soc 2010, 132 (37), 12767-9. 68. Quah, H. S.; Chen, W.; Schreyer, M. K.; Yang, H.; Wong, M. W.; Ji, W.; Vittal, J. J., Multiphoton harvesting metal–organic frameworks. Nature Comm. 2015, 6, 7954. 69. Mahato, P.; Monguzzi, A.; Yanai, N.; Yamada, T.; Kimizuka, N., Fast and Long-Range Triplet Exciton Diffusion in Metal–Organic Frameworks for Photon Upconversion at Ultralow Excitation Power. Nat. Mater. 2015, 14, 924–930.
36
2. Systematic Investigation of the Excited-State Properties of Anthracene-Dicarboxylic
Acids
2.1. Introduction
Organic photoactive molecules are of interest due to the tunability and environmental
susceptibility of their excited-state properties, which affords a range of optoelectronic
applications including organic light-emitting diodes (OLEDs), photovoltaic cells, organic field
effect transistors, and fluorescent sensing elements.1,2,3,4 Anthracene is a polyaromatic
hydrocarbon whose excited-state properties have been extensively studied.5 Due to its unique
ground and excited-state properties, anthracene and its derivatives are often incorporated into
devices such as OLEDs and organic semiconductor materials for numerous applications.6-9
However, in order to rationally tailor anthracene derivatives for a given application, an
understanding of the effects of microenvironment and functionalization on the photophysical
properties is essential.
The excited-state behavior of a carboxylic acid functionalized anthracene, 9-
anthracenecarboxylic acid (9-ACA) has been the topic of a number of reports.21-27 Changes in
the emission spectra of 9-ACA have been argued to arise from acid-base equilibrium, solvent
and concentration dependent dimerization and formation of higher order aggregates,22,24 as well
as structural reorganization26 of the carboxylic acid relative to the anthracene ring in the excited
state. In order to contribute to this discussion, we prepared a series of anthracene derivatives
functionalized symmetrically with carboxylic acids; namely 2,6-anthracenedicarboxylic acid
(2,6-ADCA), 1,4-anthracenedicarboxylic acid (1,4-ADCA), and 9,10-anthracenedicarboxylic
acid (9,10-ADCA). We characterize the effect of functionalization on the energetics of the

37
ground and excited states of anthracene using steady-state absorption and emission
spectroscopies, emission lifetime measurements, density functional theory (DFT) and time-
dependent DFT (TDDFT) calculations. The results are interpreted in light of
structural/conformational differences between the ground and excited states of each anthracene
derivative.
2.2. Results
The steady-state absorption and emission spectra of 2,6-ADCA (a,b), 1,4-ADCA (c,d)
and 9,10-ADCA (e,f) measured in THF are shown in Figure 2.2.2. 2,6-ADCA displays
vibronically structured absorption and emission bands. Although the structure of the emission
spectrum closely resembles that of anthracene, the absorption spectrum differs from anthracene
in both the number of lower-energy (~320 nm – 420 nm for 2,6-ADCA and 285 nm – 385 nm
for anthracene) absorption bands and their intensities. The absorption spectrum of 1,4-ADCA
appears broad with subtle structural features at 360 nm and 370 nm and the emission spectrum
is broad and structureless. 9,10-ADCA exhibits vibronically structured absorption band, similar
in shape to anthracene, while the emission spectrum is broad and diffuse. Both the absorption
and emission spectra of each derivative are bathochromically shifted relative to anthracene.
Additionally, the 1A→1Bb absorption peak of 1,4-ADCA at 240 nm is significantly broadened
and relative to anthracene and is split into two peaks. 2,6-ADCA exhibits a Stokes shift (584
cm-1 in THF) that is slightly larger than that of anthracene (277 cm-1 in THF). 1,4-ADCA and
9,10-ADCA display large Stokes shifts (4,803 cm-1 and 3,796 cm-1 in THF) compared to
anthracene. The observed lifetimes of each isomer in THF are considerably longer than the 4.9
± 0.1 ns fluorescence lifetime of anthracene in the same solvent (Table 2.2).
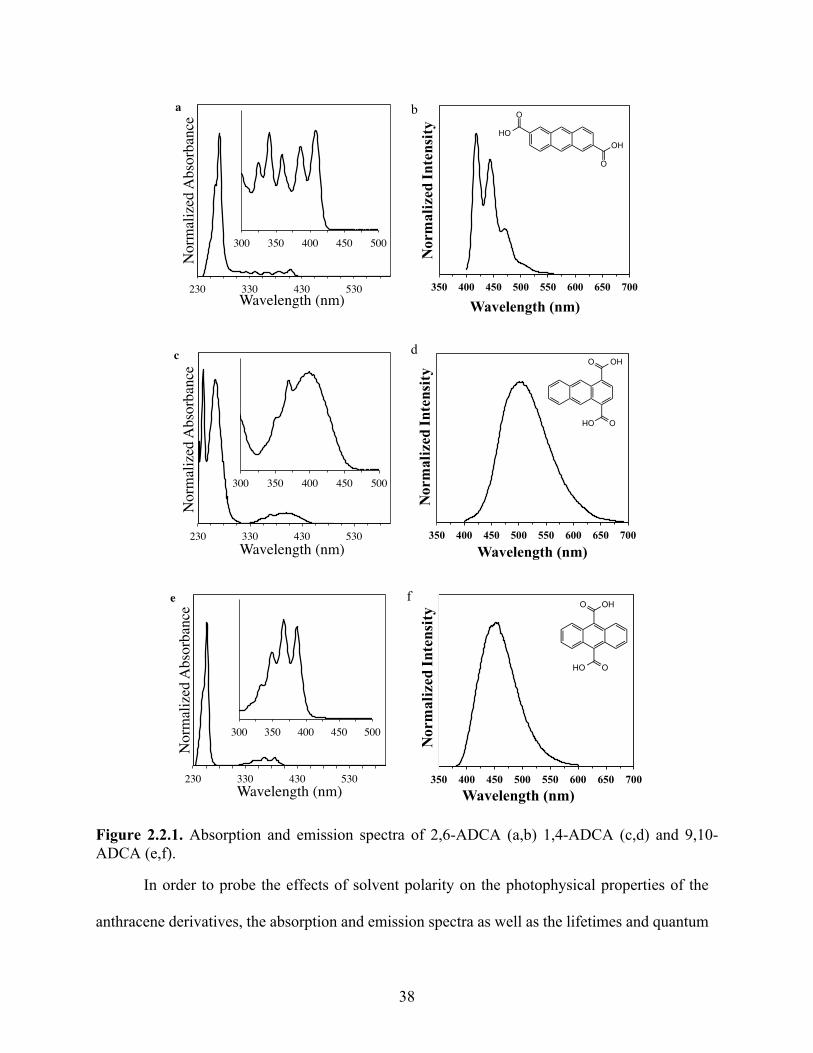
38
Figure 2.2.1. Absorption and emission spectra of 2,6-ADCA (a,b) 1,4-ADCA (c,d) and 9,10-ADCA (e,f).
In order to probe the effects of solvent polarity on the photophysical properties of the
anthracene derivatives, the absorption and emission spectra as well as the lifetimes and quantum
230 330 430 530
Nor
mal
ized
Abs
orba
nce
Wavelength (nm)
300 350 400 450 500
a
0
0.2
0.4
0.6
0.8
1
1.2
350 400 450 500 550 600 650 700
Nor
mal
ized
Int
ensi
ty
Wavelength (nm)
HO
O
O
OH
Nor
mal
ized
Inte
nsit
y
b
230 330 430 530
Nor
mal
ized
Abs
orba
nce
Wavelength (nm)
300 350 400 450 500
c
0
0.2
0.4
0.6
0.8
1
1.2
350 400 450 500 550 600 650 700
Nor
mal
ized
Int
ensi
ty
Wavelength (nm)
O
OH O
HO
Nor
mal
ized
Inte
nsit
y
d
230 330 430 530
Nor
mal
ized
Abs
orba
nce
Wavelength (nm)
300 350 400 450 500
e
0
0.2
0.4
0.6
0.8
1
1.2
350 400 450 500 550 600 650 700
Nor
mal
ized
Int
ensi
ty
Wavelength (nm)
O
OHO
HO
Nor
mal
ized
Inte
nsit
y
f

39
yields were measured in a series of polar aprotic solvents. Neither the absorption nor emission
spectra of 9,10-ADCA are affected by solvent polarity. The absorption spectrum of 9,10-ADCA
displays anthracene-like vibrational structure in all neat solvents tested. The emission spectrum
is broad and diffuse with a 𝜆+,-.+ around 455 nm in neat solvents, with the exception of 1,2-DCE,
in which 𝜆+,-.+ is bathochromically shifted by 14 nm (Figure S2.1, Table S2.1). The observed
Stokes shift is 3,796 cm-1 ± 114 in THF, ethyl acetate, butanone, acetone and DMA, but larger
in 1,2-DCE (4,521 cm-1, Table S2.1). Similarly, solvent polarity has no significant effect on the
absorption or emission spectra 2,6-ADCA, as the maxima do not shift significantly between THF
(ε = 7, 𝜆+,-,/0 = 409 nm, 𝜆+,-.+ = 419 nm), and DMA (ε = 38, 𝜆+,-,/0
= 408 nm, 𝜆+,-.+ = 421 nm,
Figure S2.2, Table S2.1). In contrast to the other two isomers, the absorption band of 1,4-ADCA
is hypsochromically shifted by 10 nm, from 396 nm in THF (ε = 7) to 386 nm for DMA (ε = 38,
Figure S2.3, Table S2.1), and the emission maximum is bathochromically shifted by 8 nm from
489 nm in THF to 497 nm in DMA. The absorption and emission spectra of 1,4-ADCA remain
broad and diffuse in all of the neat solvents explored.
The fluorescence quantum yields (Φfl) and fluorescence lifetimes (τfl) along with the
experimental radiative (kr,exp) and non-radiative (knr) rate constants and calculated (kr,calc) rate
constant obtained from the Strickler-Berg equation for the three ADCA derivatives in the various
solvents are listed in Table 2.2 and Table S2.2. No trends are observed between solvent polarity
and fluorescence quantum yields over the solvent series (Table S2.2). In general, the fluorescence
lifetimes are largely independent of solvent polarity but are considerably shorter in basic
conditions.17-20
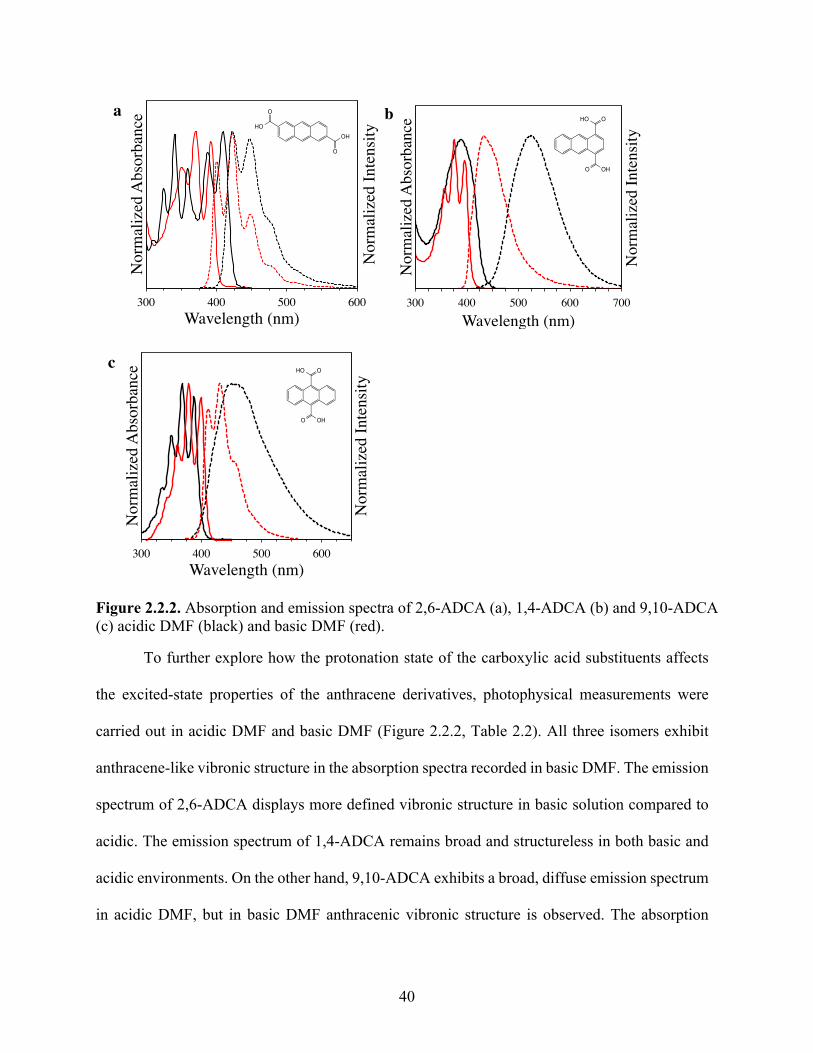
40
Figure 2.2.2. Absorption and emission spectra of 2,6-ADCA (a), 1,4-ADCA (b) and 9,10-ADCA (c) acidic DMF (black) and basic DMF (red).
To further explore how the protonation state of the carboxylic acid substituents affects
the excited-state properties of the anthracene derivatives, photophysical measurements were
carried out in acidic DMF and basic DMF (Figure 2.2.2, Table 2.2). All three isomers exhibit
anthracene-like vibronic structure in the absorption spectra recorded in basic DMF. The emission
spectrum of 2,6-ADCA displays more defined vibronic structure in basic solution compared to
acidic. The emission spectrum of 1,4-ADCA remains broad and structureless in both basic and
acidic environments. On the other hand, 9,10-ADCA exhibits a broad, diffuse emission spectrum
in acidic DMF, but in basic DMF anthracenic vibronic structure is observed. The absorption
300 400 500 600
Nor
mal
ized
Inte
nsity
Nor
mal
ized
Abs
orba
nce
Wavelength (nm)
OHHO
O
O
a
300 400 500 600 700
Nor
mal
ized
Inte
nsity
Nor
mal
ized
Abs
orba
nce
Wavelength (nm)
HO
OHO
Ob
300 400 500 600
Nor
mal
ized
Inte
nsity
Nor
mal
ized
Abs
orba
nce
Wavelength (nm)
HO
OH
O
O
c

41
spectra of 1,4-ADCA and 9,10-ADCA are hypsochromically shifted in basic DMF relative to
acidic, while that of 2,6-ADCA is bathochromically shifted in basic solution. Additionally, the
emission spectrum of each of the derivatives is hypsochromically shifted under basic conditions
compared to acidic. The Stokes shifts decrease considerably with solvent pH, going from 948
cm-1 to 510 cm-1 for 2,6-ADCA, 6,484 cm-1 to 1,997 cm-1 for 1,4-ADCA, and from 3,667 cm-1
to 610 cm-1 for 9,10-ADCA (Table 2.1). The quantum yields of 2,6-ADCA and 1,4-ADCA
decrease more than an order of magnitude under basic conditions compared to acidic solution,
while that of 9,10-ADCA decreases only by about half (Table 2.2).
Table 2.1. Summary of absorption and emission data for the ADCAs
aε is the dielectric constant, 𝜆123,/0
is the lowest energy maximum in the absorbance spectrum, and 𝜆123.+
is the highest energy maximum in the fluorescence spectrum.
To quantify the degree of protonation in both the ground and excited states as a function of pH,
the ground-state acid association constants (K) of the ADCAs were determined by absorption
spectroscopy (equation S2.1) and pK values of 17.6, 17.9 and 19.4, for 2,6-ADCA, 1,4-ADCA and
9,10-ADCA, respectively, were obtained in the ground state. The excited-state acid association
constants (pK*) were then calculated in DMF from the Förster cycle (equation 2.2), and found to
Solvent εa (nm) (nm) Stokes (cm-1) E0,0 (eV)2,6-ADCA THF 7 409 419 584 3.0
acidic DMF 409 423 948 3.0basic DMF 392 400 510 3.1
1,4-ADCA THF 7 396 489 4803 2.8acidic DMF 390 522 6484 2.8basic DMF 396 430 1997 2.9
9,10-ADCA THF 7 387 451 3667 3.1acidic DMF 389 451 3534 3.1basic DMF 400 410 610 3.1
Anthracene THF 7 378 381 208 3.3
λmaxabs λmax
em
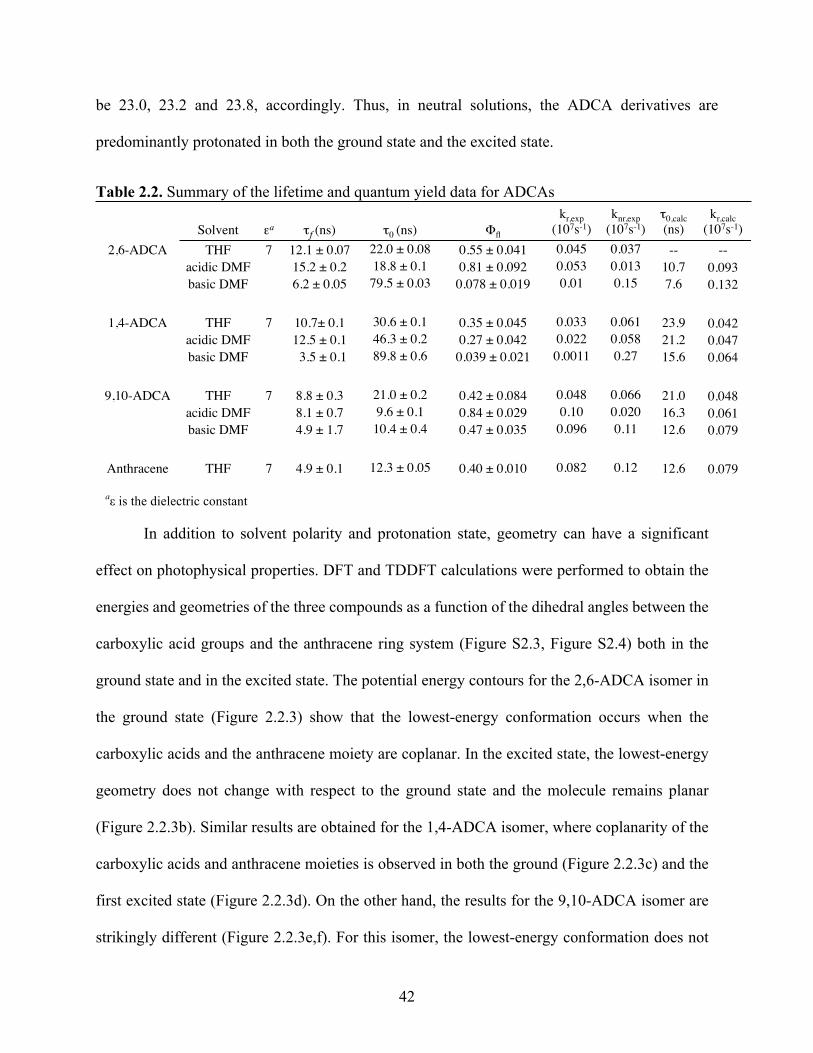
42
be 23.0, 23.2 and 23.8, accordingly. Thus, in neutral solutions, the ADCA derivatives are
predominantly protonated in both the ground state and the excited state.
Table 2.2. Summary of the lifetime and quantum yield data for ADCAs
aε is the dielectric constant
In addition to solvent polarity and protonation state, geometry can have a significant
effect on photophysical properties. DFT and TDDFT calculations were performed to obtain the
energies and geometries of the three compounds as a function of the dihedral angles between the
carboxylic acid groups and the anthracene ring system (Figure S2.3, Figure S2.4) both in the
ground state and in the excited state. The potential energy contours for the 2,6-ADCA isomer in
the ground state (Figure 2.2.3) show that the lowest-energy conformation occurs when the
carboxylic acids and the anthracene moiety are coplanar. In the excited state, the lowest-energy
geometry does not change with respect to the ground state and the molecule remains planar
(Figure 2.2.3b). Similar results are obtained for the 1,4-ADCA isomer, where coplanarity of the
carboxylic acids and anthracene moieties is observed in both the ground (Figure 2.2.3c) and the
first excited state (Figure 2.2.3d). On the other hand, the results for the 9,10-ADCA isomer are
strikingly different (Figure 2.2.3e,f). For this isomer, the lowest-energy conformation does not
Solvent εa τf (ns) τ0 (ns) Φfl
kr,exp(107s-1)
knr,exp(107s-1)
τ0,calc(ns)
kr,calc(107s-1)
2,6-ADCA THF 7 12.1 ± 0.07 22.0 ± 0.08 0.55 ± 0.041 0.045 0.037 -- --acidic DMF 15.2 ± 0.2 18.8 ± 0.1 0.81 ± 0.092 0.053 0.013 10.7 0.093basic DMF 6.2 ± 0.05 79.5 ± 0.03 0.078 ± 0.019 0.01 0.15 7.6 0.132
1,4-ADCA THF 7 10.7± 0.1 30.6 ± 0.1 0.35 ± 0.045 0.033 0.061 23.9 0.042acidic DMF 12.5 ± 0.1 46.3 ± 0.2 0.27 ± 0.042 0.022 0.058 21.2 0.047basic DMF 3.5 ± 0.1 89.8 ± 0.6 0.039 ± 0.021 0.0011 0.27 15.6 0.064
9,10-ADCA THF 7 8.8 ± 0.3 21.0 ± 0.2 0.42 ± 0.084 0.048 0.066 21.0 0.048acidic DMF 8.1 ± 0.7 9.6 ± 0.1 0.84 ± 0.029 0.10 0.020 16.3 0.061basic DMF 4.9 ± 1.7 10.4 ± 0.4 0.47 ± 0.035 0.096 0.11 12.6 0.079
Anthracene THF 7 4.9 ± 0.1 12.3 ± 0.05 0.40 ± 0.010 0.082 0.12 12.6 0.079
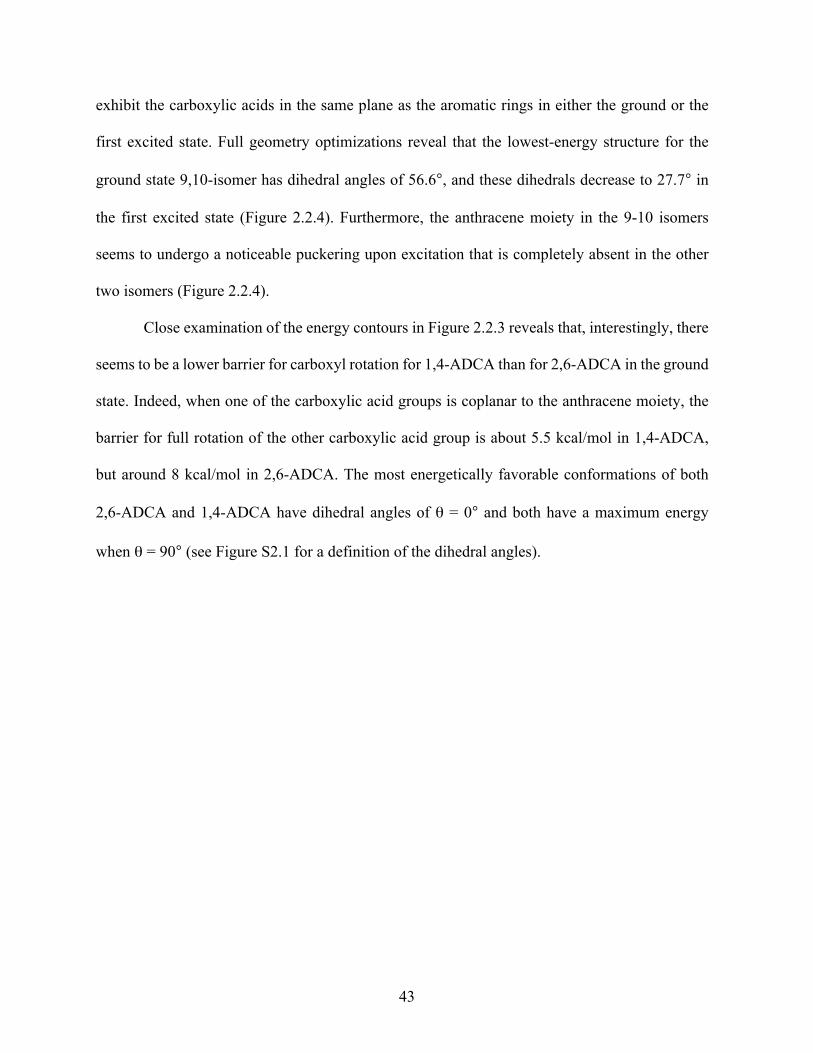
43
exhibit the carboxylic acids in the same plane as the aromatic rings in either the ground or the
first excited state. Full geometry optimizations reveal that the lowest-energy structure for the
ground state 9,10-isomer has dihedral angles of 56.6°, and these dihedrals decrease to 27.7° in
the first excited state (Figure 2.2.4). Furthermore, the anthracene moiety in the 9-10 isomers
seems to undergo a noticeable puckering upon excitation that is completely absent in the other
two isomers (Figure 2.2.4).
Close examination of the energy contours in Figure 2.2.3 reveals that, interestingly, there
seems to be a lower barrier for carboxyl rotation for 1,4-ADCA than for 2,6-ADCA in the ground
state. Indeed, when one of the carboxylic acid groups is coplanar to the anthracene moiety, the
barrier for full rotation of the other carboxylic acid group is about 5.5 kcal/mol in 1,4-ADCA,
but around 8 kcal/mol in 2,6-ADCA. The most energetically favorable conformations of both
2,6-ADCA and 1,4-ADCA have dihedral angles of θ = 0° and both have a maximum energy
when θ = 90° (see Figure S2.1 for a definition of the dihedral angles).
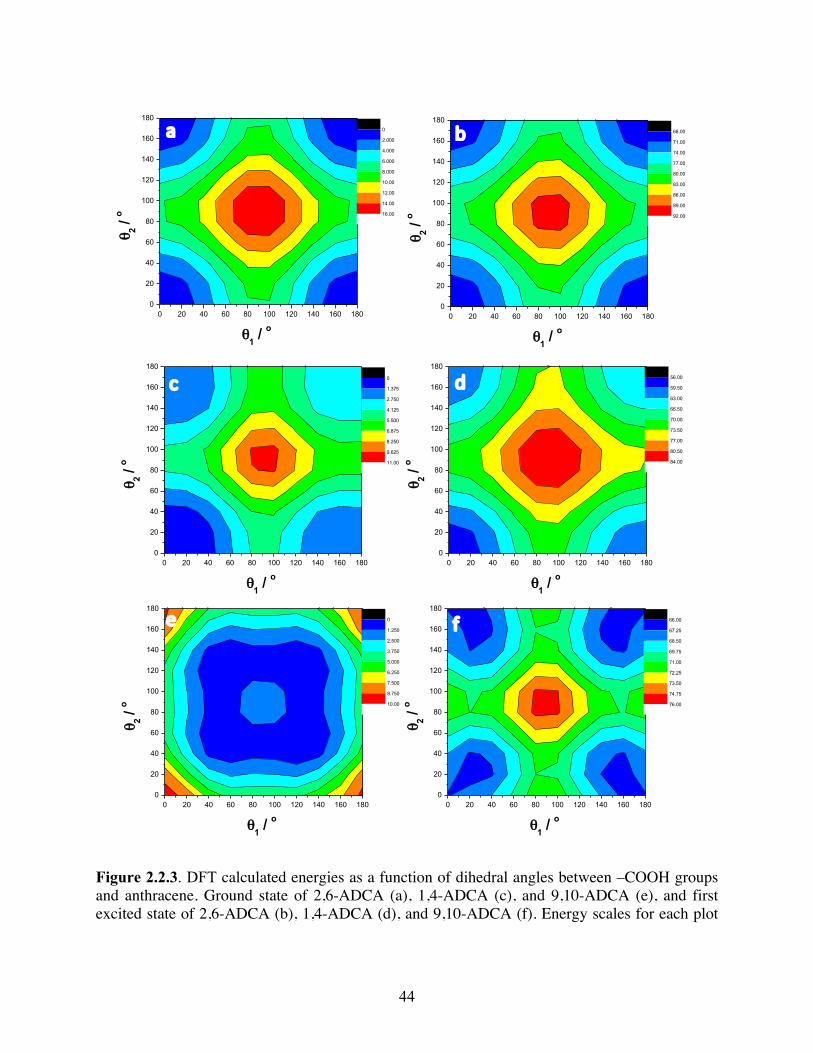
44
Figure 2.2.3. DFT calculated energies as a function of dihedral angles between –COOH groups and anthracene. Ground state of 2,6-ADCA (a), 1,4-ADCA (c), and 9,10-ADCA (e), and first excited state of 2,6-ADCA (b), 1,4-ADCA (d), and 9,10-ADCA (f). Energy scales for each plot
0 20 40 60 80 100 120 140 160 1800
20
40
60
80
100
120
140
160
180
θ1 / o
θ 2 / o
0
2.000
4.000
6.000
8.000
10.00
12.00
14.00
16.00
0 20 40 60 80 100 120 140 160 1800
20
40
60
80
100
120
140
160
180
θ1 / o
θ 2 / o
68.00
71.00
74.00
77.00
80.00
83.00
86.00
89.00
92.00
0 20 40 60 80 100 120 140 160 1800
20
40
60
80
100
120
140
160
180
θ1 / o
θ 2 / o
0
1.375
2.750
4.125
5.500
6.875
8.250
9.625
11.00
0 20 40 60 80 100 120 140 160 1800
20
40
60
80
100
120
140
160
180
θ1 / o
θ 2 / o
56.00
59.50
63.00
66.50
70.00
73.50
77.00
80.50
84.00
0 20 40 60 80 100 120 140 160 1800
20
40
60
80
100
120
140
160
180
θ1 / o
θ 2 / o
0
1.250
2.500
3.750
5.000
6.250
7.500
8.750
10.00
0 20 40 60 80 100 120 140 160 1800
20
40
60
80
100
120
140
160
180
θ1 / o
θ 2 / o
66.00
67.25
68.50
69.75
71.00
72.25
73.50
74.75
76.00
a b
c d
e f

45
are shown in kcal/mol relative to the minimum energy of the ground state. (See Figure S2.4 for a definition of the dihedral angles.)
Figure 2.2.4. DFT calculated lowest-energy structures of the 9,10-ADCA molecule in the ground state (left) and the first excited state (right).
2.3. Discussion
As expected, the photophysical characteristics of anthracene are sensitive to the position
of the carboxylic acid functionalities on the ring system. Additionally, the protonation state of
the acid groups further alters the excited-state properties of each anthracene derivative. The
question then becomes, what is the main process that governs the photophysics of each isomer;
acid-base equilibrium, solvent, formation of higher order aggregates, or excited-state structural
reorganization? Experimentally determined rates of radiative decay can be compared with rates
calculated by the Strickler-Berg equation to give insight into the intramolecular and
intermolecular interactions that may impact the photophysical properties of the fluorophore.
The Strickler-Berg equation (Equation 2.1)5 extends Einstein’s formalism for transition
θ1=θ2=56.6(deg.( θ1=θ2=27.7(deg.(
Ground(state( Excited(state(

46
probabilities of atomic absorption and emission to polyatomic molecules. From this equation,
the intrinsic lifetime of a molecule, i.e. the radiative lifetime in the absence of intermolecular
forces, can be estimated. The Stickler-Berg relation has accurately predicted the lifetimes of a
number of molecules; however, it makes a few assumptions that limit its application in certain
cases.
𝑘5,7,87 =1𝜏<=8𝜋×2303𝑐<𝑛E
𝑁,𝐹H 𝑣J 𝑑𝑣J𝑣JL 𝐹H 𝑣J 𝑑𝑣J
𝜀 𝑣N 𝑑𝑣N𝑣N
= 2.88×10⁻⁹𝑛2𝐹𝑣 𝑣𝐴 𝑑𝑣𝐴𝑣𝑓3𝐹𝑣(𝑣𝑓)𝑑𝑣𝐴
𝜀 𝑣𝐴 𝑑𝑣𝐴𝑣𝐴
(2.1)
The relationship is based on the Born-Oppenheimer approximation, which assumes that the
electronic transition dipole-moment operator does not depend on nuclear coordinates.
Furthermore, it assumes that emission occurs only from the lowest-energy excited state. The
predictive power of the Strickler-Berg relationship is, therefore, limited by large changes in the
nuclear configuration upon generating the excited state, as well as intermolecular interactions
between the chromophore and its environment.34 These latter assumptions are the origin of the
discrepancy in this work between the calculated kr,calc obtained from the Strickler-Berg and the
experimental kr,exp obtained from the measured fluorescence lifetime and quantum yields of 1,4-
ADCA and 9,10-ADCA, while other phenomena are likely responsible for the contradictions for
2,6-ADCA (Table 2.2, Table S2.2).
Neither solvent polarity nor hydrogen bonding character alters the photophysics of 2,6-
ADCA. Thus, it is unlikely that intermolecular interactions play a significant role in altering the
excited-state properties of the anthracene moiety of this isomer. The absorption spectra of 2,6-
ADCA recorded in acidic and neat solvents display distinct vibronic structure, different from that
observed in basic solution, which closely resembles the structure of the unsubstituted anthracene

47
molecule. Similar observations have been reported in the absorption spectrum of 2-napthalene
carboxylic acid (2-NCA) and 2-anthracenecarboxylic acid (2-ACA).35 In general, electronic
transitions polarized along a given axis are more strongly affected by derivatization of the
molecule in the same direction. For example, the dissimilarity of the vibronic bands in the
absorption spectrum of 2-ACA compared with anthracene was attributed to stabilization of the
1A→1Lb longitudinally polarized low-energy transition. The 1A→1Lb transition is weak in
unsubstituted anthracene and the corresponding absorption bands are obscured by the more
intense 1A→1La absorption bands. Addition of a second carboxylic acid group, which further
extends the length of the molecule, would likely result in greater stabilization of the 1A→1Lb
transition. Accordingly, the bands assigned to 1A→1Lb appear with greater intensity in the
absorbance spectrum of 2,6-ADCA. DFT calculations of the lowest energy ground-state
configuration of 2,6-ADCA suggest a coplanar arrangement between the carboxylic acids and
the anthracene macrocycle (Figure 2.2.3a). This is in agreement with that observed in crystal
structures of 2-ACA.36 The coplanar arrangement allows for resonance interactions between the
acid groups and the aromatic ring system to occur. These resonance interactions increase the
dipole moment, and thus, the oscillator strength of the 1A→1Lb transition, resulting in the
appearance of the 1A→1Lb bands.35 The appearance of these strong 1A→1Lb transition bands may
contribute to the inconsistency between the kr,calc values and the kr,exp values, since the integral
of the area under the non-emissive 1A→1Lb absorption bands is a component of the Strickler-
Berg equation.
The emission spectrum of 2,6-ADCA in neutral and basic solutions is not a mirror image
of the absorbance spectrum. Although it displays anthracenic vibronic structure in all solvent
conditions, the number of vibronic transitions in the emission is reduced compared to the
48
absorption spectrum. This is not entirely unexpected, as 1La is the only emissive state, and the
additional vibronic structure is assumed to be due to absorption into the 1Lb state.35 The vibronic
structure is indicative of little intermolecular reorganization in the excited state. The slight
bathochromic shift in the absorption spectrum relative to anthracene is attributed to inductive
effects imposed by the presence of the electron withdrawing functional groups on the
polyaromatic ring.
At higher pH values, the carboxylate groups of 2,6-ADCA are less likely to participate in
resonance interactions, leading to further decoupling from the aromatic ring system and giving
rise to anthracenic vibronic structure in the absorption spectrum.37 Indeed, the vibronic structure
in the absorbance spectrum of deprotonated 2,6-ADCA2– more closely resembles that of
anthracene, but is bathochromically shifted ~19 nm relative to anthracene. Thus, the carboxylic
acid groups affect the aromatic system through inductive effects but do not participate in
resonance interactions when deprotonated.
Contrary to 2,6-ADCA, both the absorption and emission spectra of 1,4-ADCA in neutral
solvents lack vibronic structure and are diffuse.35 Similar observations have been reported for 1-
anthracenecarboxylic acid (1-ACA).35 DFT calculations predict a lowest energy ground state
geometry in which the carboxylic acid groups are coplanar with anthracene (Figure 2.2.3c). This
conformation increases resonance interactions between the overlapping orbitals of the π-system
and carboxyl groups, introducing charge-transfer (CT) character into the 1A→1La transition
(polarized along the short axis) and electron density shifts toward the functionalized ring. The
resulting shift of electron density results in loss of vibronic structure in both the absorption and
emission spectra. The magnitude of the Stokes shift of 1,4-ADCA increases with the polarity of
the solvent, i.e. THF < DMF ≈ DMA. Closer inspection of the spectroscopic data reveals that, as
49
solvent polarity increases, an overall bathochromic shift of ~19 nm is observed in the emission
spectrum. Because the carboxyl groups of 1,4-ADCA introduce CT character into the 1A→1La
transition, the absorption spectrum is sensitive to solvent interactions with the functional groups.
As solvent polarity increases, the excited state is stabilized due to solvent-solute induced dipolar
interactions, giving rise to the bathochromic shift observed in the emission spectrum.35,38
Therefore, solvent relaxation about the weaker excited-state dipole likely contributes to the large
Stokes shifts. The coplanar arrangement of the carboxylic acids in the ground state, along with
the lack of vibronic structure in the emission spectrum, suggests that the resonance interactions
between the carboxylic acids and aromatic ring system in the ground state are conserved in the
excited state, which is corroborated by the coplanar lowest-energy structure found in the first
excited state (Figure 2.2.3d).
In basic solution, the absorbance spectrum of 1,4-ADCA2– is vibronically structured,
while the emission spectrum is still broad and diffuse. Similar observations were reported for 1-
ACA–.35 In both molecules, the deprotonated carboxyl groups do not contribute to resonance
forms of the anion in the ground state and consequently, the absorbance spectra are vibronically
structured. There are several factors that may contribute to the loss of structure in the emission
spectrum. For 1-ACA–, the authors proposed that a shift in electron density upon promotion to
the 1La excited state in the direction of the carboxylate group introduces some CT character
between the functional group and anthracene moiety, resulting in broadening of the emission
spectrum.35 It is plausible that such phenomena also contribute to the loss of structure observed
in the emission spectrum of 1,4-ADCA2–. The Stokes shift of 1,4-ADCA2– (1997 cm–1) is large
in comparison with the deprotonated 2,6-ADCA2– (510 cm–1) and 9,10-ADCA2– (610 cm–1). A
relatively large change in molecular dipole moment upon excitation would result in such a

50
substantial Stokes shift. Solvent relaxation may also have a significant effect on the fluorescence
spectrum. Because the energy of the relaxed excited state is lower than that of the initial Frank-
Condon excited state, thermodynamic equilibration with the surrounding solvent would
contribute to the loss of structure and bathochromic shift in the emission spectrum of 1,4-
ADCA2–. Lastly, it may be possible that the carboxylate groups can easily rotate, which would
also give rise to a large Stokes shift (relative to both 2,6-ADCA2– and 9,10-ADCA2–) and broad
emission spectrum due to nuclear reorganization. Unfortunately, the excited state geometry of
1,4-ADCA2– could not be predicted computationally, as energy calculations for the deprotonated
molecule encountered severe convergence problems.
In neat solvents, the absorption spectrum of 9,10-ADCA displays anthracenic vibronic
structure, while the emission spectrum is characterized by a broad, structureless band. Similar
observations have been reported for 9-anthracenecarboxylic acid (9-ACA).41,26,27 The
structureless emission of 9-ACA was ascribed to enhanced resonance interactions between the
carboxylic acid group and the aromatic moiety, due to rotation of the functional group into the
plane of the ring system following excitation.23
DFT calculations of the lowest energy configuration ground-state geometry of 9,10-
ADCA reveal a dihedral angle of 57º between the carboxylic acid groups and anthracene plane.
Comparably, 9-ACA was found to have a dihedral angle of 57º and 88º for the conjugate base,
9-ACA–.27 This ground-state configuration of 9-ACA is supported by crystallographic data.42
The non-planar geometry has been attributed to steric interactions between the acid group and
the peri-hydrogens on the carbons in the 1 and 8 positions of the anthracene ring.23 The non-
planar orientation prevents resonance interactions between the carboxylate groups and aromatic
ring system, and gives rise to anthracene-like vibronic structure in the absorption spectrum. The

51
inductive effects of the electron withdrawing, carboxylic acid groups result in the slight
bathochromic shift observed in the absorption spectrum of 9,10-ADCA relative to anthracene.
Deprotonation of the carboxylic acids reduces the strength of the inductive effects and
consequently, the bathochromic shift in the absorption spectrum of 9,10-ADCA2– is smaller.
TDDFT calculations show that the dihedral angle, θ, decreases to ~28º in the excited state
of 9,10-ADCA (Figure 2.2.3f). Interestingly, as the carboxyl groups twist toward a more coplanar
orientation, the anthracene ring also puckers. Previously, a θ of ~33º was calculated by TDDFT
for 9-ACA in the excited state, but no ring distortion was reported.27 The distortion of the
anthracene plane observed in 9,10-ADCA but not 9-ACA may be due to greater steric strain on
the molecule imposed by the additional carboxylic acid. Puckering of the anthracene ring system
upon rotation of the carboxyl groups disrupts the transition dipole moment across the short-axis.
The large reconfiguration energies associated with this rotation and nuclear reorganization lower
the energy of the excited-state, as evidenced by the large Stokes shift observed in the spectra of
9,10-ADCA. The more coplanar orientation allows for overlapping of the p-orbital of the acid
group with the π-aromatic system of anthracene, introducing resonance interactions through
delocalization of electron density from anthracene into the carboxyl substituents. This
significantly perturbs the 1A→1La transition dipole moment oriented along the short axis of
anthracene, giving rise to a broad, structureless emission band. With increased resonance
interactions, solvent-solute interactions have a greater contribution to the Stokes shift depending
on the rate of rotation of the carboxyl groups relative to the rate of solvent reorganization as
intramolecular nuclear reorganization occurs in the excited state. This may be the origin of the
large discrepancy in the emission spectrum of 9,10-ADCA in neat DCE compared to that
recorded in the other neat solvents (Figure S2.1). The mirror image relationship between the
52
absorption and emission spectra of the fully deprotonated 9,10-ACA2– measured in basic solution
indicates that the geometries of the ground and excited states of 9,10-ACA2– are almost identical.
Thus, the carboxylate groups remain decoupled from the aromatic system, resulting in
vibronically structured emission. This is also supported by DFT/TDDFT calculations, which
show little changes between the dihedral angles of 9,10-ADCA2– in the ground (θ = ~50º, Figure
S2.4c) and excited (θ = ∼60º, Figure S2.4d) states.
2.4. Conclusions
Functionalization of anthracene with carboxylic acid groups results in perturbation of the
photophysical properties depending on both the location of the groups and extent of their
interaction with the aromatic ring system. In general, functionalization that extends the molecule
along the molecular axes containing optical transitions of the same polarization affect the
properties of that transition more significantly. For example, derivatization at the 2 and 6
positions extends the molecule along the longitudinal axis and enhances the longitudinally
polarized 1A→1Lb transition, giving rise to intense 1A→1Lb absorption bands. In the 2,6- isomer,
electron density remains evenly distributed in the molecule and vibronically structured
absorption bands are observed. On the other hand, functionalization at the 1 and 4 positions,
which lengthens the molecule along the short axis, gives rise to an uneven distribution of electron
density along the polyaromatic ring system and results in broad, diffuse bands in both the
absorption and emission spectra. The extent of interaction between the carboxylic acids and the
anthracene ring is dictated by how the functional groups are orientated with respect to the
anthracene plane. In 1,4-ADCA, the carboxyl groups lie coplanar with the parent anthracene, but
in 9,10-ADCA, steric hindrances prevent coplanarity. As a result, there is greater overlap
between the p orbitals of the acid groups in the 1 and 4 positions with the π orbitals of anthracene,

53
introducing a greater amount of charge transfer character in 1,4-ADCA compared to 9,10-ADCA.
Accordingly, the photophysical properties of 1,4-ADCA are also sensitive to solvent-solute
interactions and exhibit a dependence upon solvent polarity. The solvent pH also has a significant
influence on the extent to which the functional groups interact with the ring system. In very basic
solutions, where the carboxyl groups are completely deprotonated and cannot participate in
resonance interactions, vibronically structured bands are observed in the absorbance spectra of
all of the ADCA derivatives.
This work provides insight into the structure-property relationship of dicarboxylic
anthracene derivatives and their fluorescent properties. An understanding of the effects of
substitutions and local environment on the excited-state properties of anthracene can be used to
further tune derivatives to obtain desired functionality. Such knowledge will aid in the design of
next-generation optoelectronic materials.
2.5. Acknowledgements
This material is based upon work supported by the U.S. Department of Energy, Office of
Science, Office of Basic Energy Sciences under Award Number DE-SC0012446. The authors
also acknowledge Advanced Research Computing at Virginia Tech for providing computational
resources and technical support that have contributed to the results reported within this paper.
URL: http://www.arc.vt.edu
2.6. Supplemental Information
2.6.1. Materials
2,6-anthracenedicarboxylic acid (2,6-ADCA), 1,4-anthracenedicarboxylic acid (1,4-ADCA),
and 9,10-anthracenedicarboxylic acid (9,10-ADCA) were synthesized following previously reported
procedures with minimal modifications and characterized by 1H NMR spectroscopy (-S3).28,29,30,31,32
54
All other chemicals and solvents including anthracene (> 99 %), KOH (85 %), NH4OH (25-30%),
acetic acid (reagent grade > 99%), dimethylformamide (HPLC grade > 99%), dimethylacetamide
(spectrophotometric grade > 99%), tetrahydrofuran (ACS grade > 99 %), ethyl acetate (HPLC grade
> 99.9%), 1,2-dichloroethane (99.8%), acetone (HPLC grade > 99.5%), and butanone (ACS grade >
99%) were used as received without further purification from Alfa Aesar, Fisher Scientific, or Sigma-
Aldrich.
2.6.2. Steady-state absorption spectroscopy
The steady-state absorption spectra of the ADCA derivatives were obtained using an
Agilent Technologies 8453 UV-Vis diode array spectrophotometer (1 nm resolution) where the
spectra were recorded with samples prepared in a 1 cm quartz cuvette. To determine the
extinction coefficients of each compound, three solutions of known concentration were prepared
separately, then each was diluted three times. The UV-vis absorbance of each solution was
measured and the absorbance at a fixed wavelength was plotted vs. concentration. The extinction
coefficient was determined by averaging the slopes of the lines-of-best-fit obtained from each of
the three plots.
2.6.3. Steady-state emission spectroscopy and time-resolved emission lifetimes
All samples were prepared at concentrations below 10 µM to reduce aggregation effects.
Time-resolved fluorescence lifetimes were obtained via the time-correlated single photon
counting technique (TCSPC) with a modified QuantaMaster Model QM-200-4E emission
spectrophotometer from Photon Technology, Inc. (PTI) equipped with a 350 nm LED and a
Becker & Hickl GmbH PMH-100 PMT detector with time resolution of < 220 ps FWHM.33
Florescence lifetime decays were deconvoluted from the time-dependent florescence signal and

55
the instrument response function using the fluorescence decay analysis software, DecayFit,
available online (Fluortools, www.fluortools.com).
Quantum yields of fluorescence and steady-state emission spectra of the ADCA
compounds were measured in ethyl acetate, tetrahydrofuran (THF), 1,2-dichloroethane (1,2-
DCE), butanone, acetone, dimethylacetamide (DMA), dimethylformamide (DMF), acidic (acetic
acid) DMF and basic (NaOH) DMF. The steady-state emission spectra were obtained using the
same QuantaMaster Model QM-200-4E where the sample compartment was replaced with an
integrating sphere (PTI). The excitation light source was a 75 W Xe arc lamp (Newport). The
detector was a thermoelectrically cooled Hamamatsu 1527 photomultiplier tube (PMT). All
measurements were performed in triplicate using three separately prepared solutions of ADCA
in each solvent with absorbance values of ~ 0.08-0.09 at the excitation wavelength.
2.6.4. Theoretical calculations
Radiative decay rates were calculated by applying the Strickler-Berg method using the
PhotochemCAD 2.1 software. All electronic structure calculations were carried out with the
Gaussian 09 suite of programs.43 The DFT calculations presented in this work were carried out
at the B3LYP/6-31G* level. Sample calculations using the M06 density functional, and the larger
6-311G* basis set were used to corroborate key results at the B3LYP/6-31G* level. Ground-state
potential-energy contours correspond to relaxed scans in which the relevant dihedral angles
between the carboxylic acid groups and the anthracene moiety are allowed to vary at 15° steps
while the rest of the coordinates are optimized. Potential-energy contours for the carboxylic acids
in the first excited state were obtained using time-dependent B3LYP/6-31G* calculations,
directly using the geometries obtained from ground-state dihedral scans.

56
2.6.5. Determination of acid association constants
Ground-state acid association constants (K) of the ADCA derivatives were determined via
absorption spectroscopy by monitoring the change in absorption (corrected for dilution) as a
function of added acid concentration. Samples of the three acids were prepared in solutions of
water with 0, 10 and 30 mol% DMF and were titrated using NaOH and HCl. The absorption
value near the isosbestic point at each addition of acid was plotted as a function of acid
concentration and the data was fit to Equation 1,
𝐴V =NWXY[[\]^_NW`^a
a_[[\]^ (S2.1)
where Ai is the absorbance at a given concentration of acetic acid, Amax and Amin are the
absorbance values for the fully protonated and deprotonated species, respectively, n is the number
of protons associated with a given acid association constant, K. Ai values were fit to Equation 1
with K as a variable parameter. Fixing n to 2 yielded the most reasonable fit of the data. The pK
values were plotted versus mol% DMF and the pK value of each compound in pure DMF was
determined by extrapolating to 100 mol% DMF. Excited-state acid association constants (pK*)
were predicted using the Förster cycle, (Equation 2),
𝑝𝐾∗ − 𝑝𝐾 = 2.1×10eL(𝑣Nf − 𝑣N[) (S2.2)
𝑣<–< =HWXYXhi eHWXY
jW
E (S2.3)
where 𝑣Nf and 𝑣N[ correspond to the wavenumber of the 0–0 transitions of A– and AH,
respectively. The wavenumber corresponding to the 0–0 transition was estimated by averaging
the wavenumbers at the absorption and emission maxima (Equation 3).4
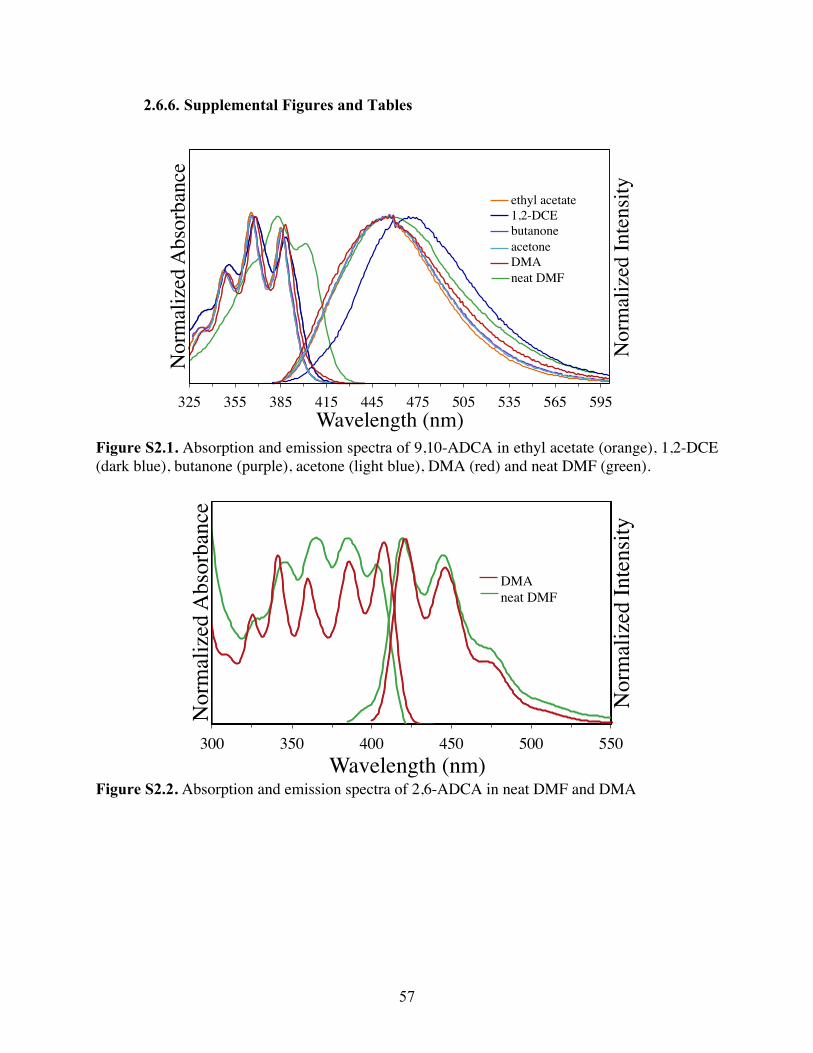
57
2.6.6. Supplemental Figures and Tables
Figure S2.1. Absorption and emission spectra of 9,10-ADCA in ethyl acetate (orange), 1,2-DCE (dark blue), butanone (purple), acetone (light blue), DMA (red) and neat DMF (green).
Figure S2.2. Absorption and emission spectra of 2,6-ADCA in neat DMF and DMA
325 355 385 415 445 475 505 535 565 595
ethyl acetate1,2-DCEbutanoneacetoneDMAneat DMF
Nor
mal
ized
Abs
orba
nce
Nor
mal
ized
Inte
nsity
Wavelength (nm)
300 350 400 450 500 550
Nor
mal
ized
Abs
orba
nce
Nor
mal
ized
Inte
nsity
Wavelength (nm)
DMAneat DMF
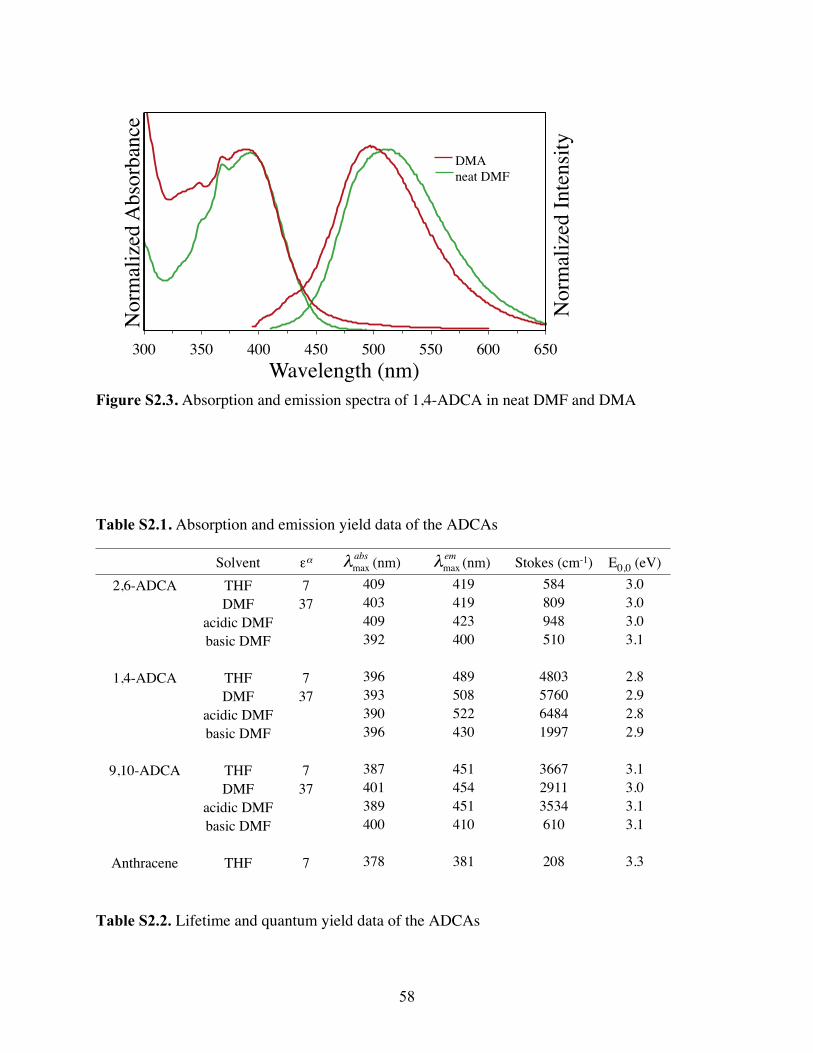
58
Figure S2.3. Absorption and emission spectra of 1,4-ADCA in neat DMF and DMA
Table S2.1. Absorption and emission yield data of the ADCAs
Table S2.2. Lifetime and quantum yield data of the ADCAs
300 350 400 450 500 550 600 650
Nor
mal
ized
Abs
orba
nce
Nor
mal
ized
Inte
nsity
Wavelength (nm)
DMAneat DMF
Solvent εα (nm) (nm) Stokes (cm-1) E0,0 (eV)2,6-ADCA THF 7 409 419 584 3.0
DMF 37 403 419 809 3.0acidic DMF 409 423 948 3.0basic DMF 392 400 510 3.1
1,4-ADCA THF 7 396 489 4803 2.8DMF 37 393 508 5760 2.9
acidic DMF 390 522 6484 2.8basic DMF 396 430 1997 2.9
9,10-ADCA THF 7 387 451 3667 3.1DMF 37 401 454 2911 3.0
acidic DMF 389 451 3534 3.1basic DMF 400 410 610 3.1
Anthracene THF 7 378 381 208 3.3
λmaxabs λmax
em
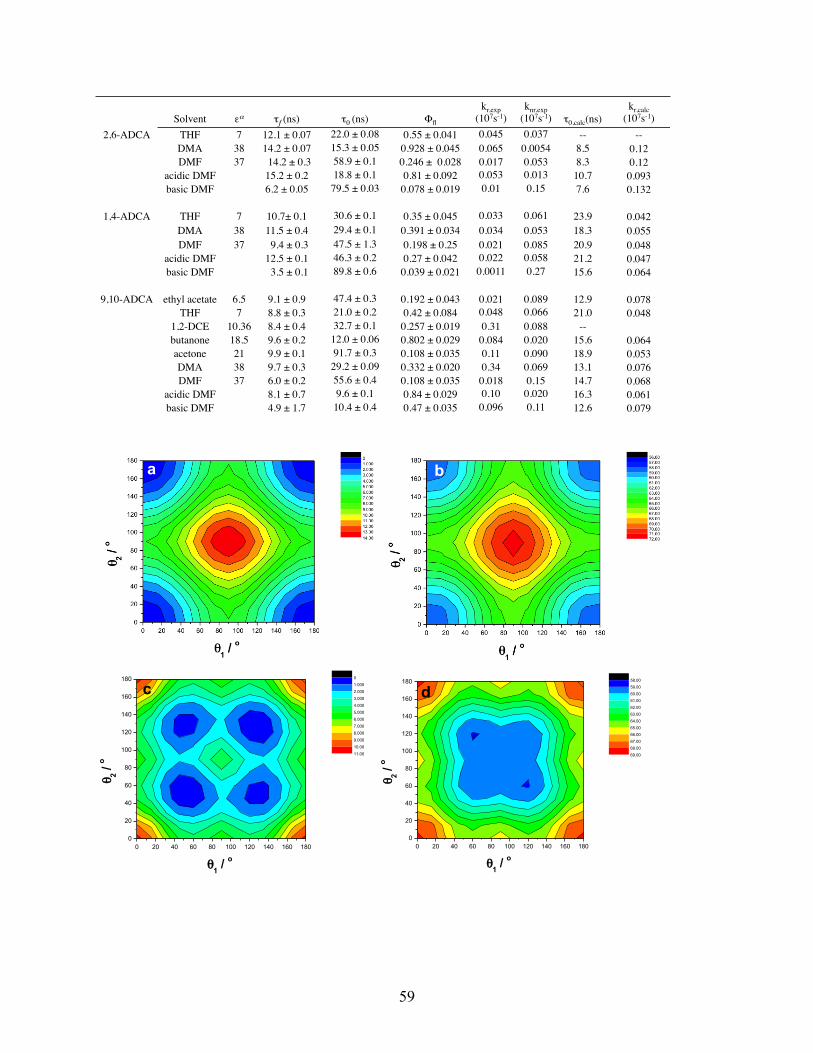
59
Solvent εα τf (ns) τ0 (ns) Φfl
kr,exp(107s-1)
knr,exp(107s-1) τ0,calc(ns)
kr,calc(107s-1)
2,6-ADCA THF 7 12.1 ± 0.07 22.0 ± 0.08 0.55 ± 0.041 0.045 0.037 -- --DMA 38 14.2 ± 0.07 15.3 ± 0.05 0.928 ± 0.045 0.065 0.0054 8.5 0.12DMF 37 14.2 ± 0.3 58.9 ± 0.1 0.246 ± 0.028 0.017 0.053 8.3 0.12
acidic DMF 15.2 ± 0.2 18.8 ± 0.1 0.81 ± 0.092 0.053 0.013 10.7 0.093basic DMF 6.2 ± 0.05 79.5 ± 0.03 0.078 ± 0.019 0.01 0.15 7.6 0.132
1,4-ADCA THF 7 10.7± 0.1 30.6 ± 0.1 0.35 ± 0.045 0.033 0.061 23.9 0.042DMA 38 11.5 ± 0.4 29.4 ± 0.1 0.391 ± 0.034 0.034 0.053 18.3 0.055DMF 37 9.4 ± 0.3 47.5 ± 1.3 0.198 ± 0.25 0.021 0.085 20.9 0.048
acidic DMF 12.5 ± 0.1 46.3 ± 0.2 0.27 ± 0.042 0.022 0.058 21.2 0.047basic DMF 3.5 ± 0.1 89.8 ± 0.6 0.039 ± 0.021 0.0011 0.27 15.6 0.064
9,10-ADCA ethyl acetate 6.5 9.1 ± 0.9 47.4 ± 0.3 0.192 ± 0.043 0.021 0.089 12.9 0.078THF 7 8.8 ± 0.3 21.0 ± 0.2 0.42 ± 0.084 0.048 0.066 21.0 0.048
1,2-DCE 10.36 8.4 ± 0.4 32.7 ± 0.1 0.257 ± 0.019 0.31 0.088 -- butanone 18.5 9.6 ± 0.2 12.0 ± 0.06 0.802 ± 0.029 0.084 0.020 15.6 0.064acetone 21 9.9 ± 0.1 91.7 ± 0.3 0.108 ± 0.035 0.11 0.090 18.9 0.053DMA 38 9.7 ± 0.3 29.2 ± 0.09 0.332 ± 0.020 0.34 0.069 13.1 0.076DMF 37 6.0 ± 0.2 55.6 ± 0.4 0.108 ± 0.035 0.018 0.15 14.7 0.068
acidic DMF 8.1 ± 0.7 9.6 ± 0.1 0.84 ± 0.029 0.10 0.020 16.3 0.061basic DMF 4.9 ± 1.7 10.4 ± 0.4 0.47 ± 0.035 0.096 0.11 12.6 0.079
0 20 40 60 80 100 120 140 160 1800
20
40
60
80
100
120
140
160
180
θ1 / o
θ 2 / o
01.0002.0003.0004.0005.0006.0007.0008.0009.00010.0011.00
0 20 40 60 80 100 120 140 160 1800
20
40
60
80
100
120
140
160
180
θ1 / o
θ 2 / o
58.0059.0060.0061.0062.0063.0064.0065.0066.0067.0068.0069.00
a
b
c
d
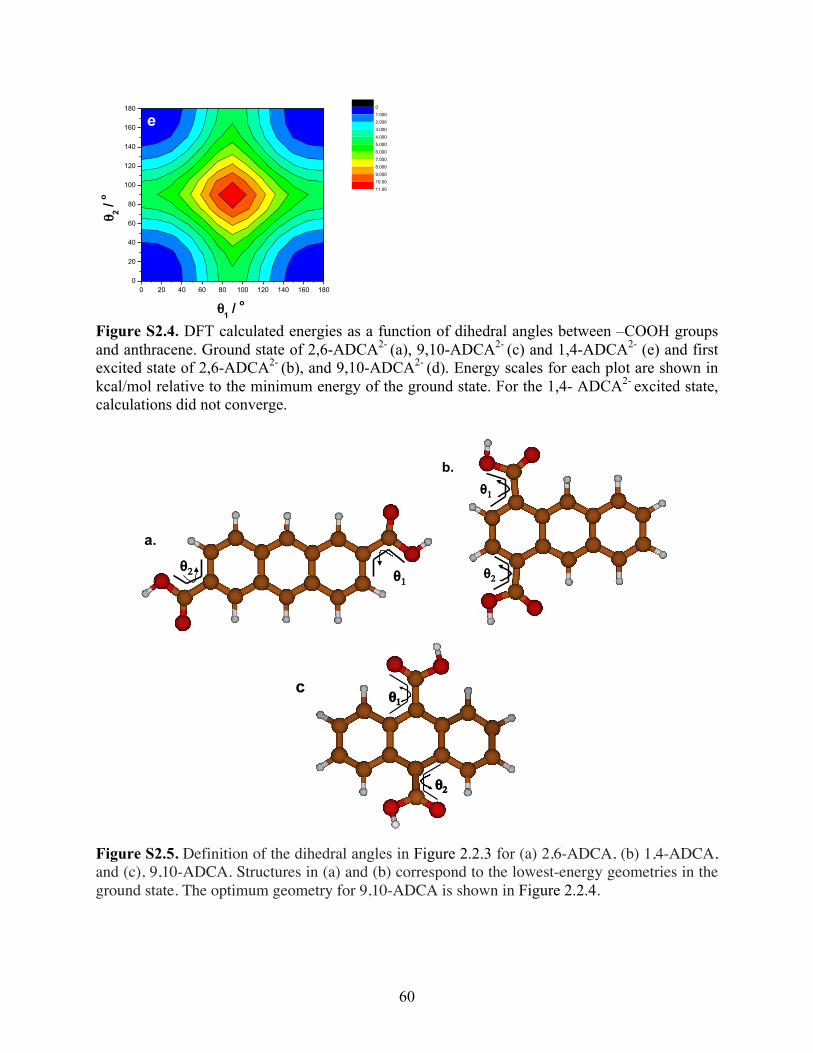
60
Figure S2.4. DFT calculated energies as a function of dihedral angles between –COOH groups and anthracene. Ground state of 2,6-ADCA2-
(a), 9,10-ADCA2- (c) and 1,4-ADCA2- (e) and first
excited state of 2,6-ADCA2- (b), and 9,10-ADCA2-
(d). Energy scales for each plot are shown in kcal/mol relative to the minimum energy of the ground state. For the 1,4- ADCA2-
excited state, calculations did not converge.
Figure S2.5. Definition of the dihedral angles in Figure 2.2.3 for (a) 2,6-ADCA, (b) 1,4-ADCA, and (c), 9,10-ADCA. Structures in (a) and (b) correspond to the lowest-energy geometries in the ground state. The optimum geometry for 9,10-ADCA is shown in Figure 2.2.4.
0 20 40 60 80 100 120 140 160 1800
20
40
60
80
100
120
140
160
180
θ1 / o
θ 2 / o
01.0002.0003.0004.0005.0006.0007.0008.0009.00010.0011.00
θ1θ2
a.
θ1
θ2
b.
θ1
θ2
c
e
61
2.7. References
1. Zhu, M. Y., C. Blue Fluorescent Emitters: Design Tactics and Applications in Organic Light-Emitting Diodes. Chem. Soc. Rev. 2013, 42, 4963-4976. 2. Kaur, N. S., M.; Pathakc, D.; Wagner, T; Nunzi, J. M. Organic Materials for Photovoltaic Applications: Review and Mechanism. Synth. Met. 2014, 190, 20-26. 3. Wakayama, Y. H., R.; Seo, H. S. Recent Progress in Photoactive Field-Effect Transistors. Sci. Technol. Adv. Mater. 2014, 15, 1019. 4. van de Linde, S. A., S.; Franke, C.; Holm, T.; Klein, T.; Löschberger, A.; Proppert, S.; Wolter, S.; Sauer, M. Investigating Cellular Structures at the Nanoscale with Organic Fluorophores. Chem. Biol. 2013, 20, 8. 5. Sidman, J. W. Electronic and Vibrational States of Anthracene. J. Chem. Phys. 1956, 25, 115-121. 6. Shah, B. K. N., D. C.; Shi, J.; Forsythe, E. W.; Morton, D. Photophysical Properties of Anthanthrene-Based Tunable Blue Emitters. J. Phys. Chem. A. 2005, 109, 7677. 7. Moorthy, J. N.; Venkatakrishnan, P.; Natarajan, P.; Huang, D.-F.; Chow, T. J. De Novo Design for Functional Amorphous Materials: Synthesis and Thermal and Light-Emitting Properties of Twisted Anthracene-Functionalized Bimesitylenes. J. Am. Chem. Soc. 2008, 130, 17320. 8. Tao, S. X., S.; Zhang, X. Efficient Blue Organic Light-Emitting Devices Based on Novel Anthracene Derivatives with Pronounced Thermal Stability and Excellent Film-Forming Property. Chem. Phys. Lett. 2006, 429, 622-627. 9. Swager, T. M.; Gil, C. J.; Wrighton, M. S. Fluorescence Studies of Poly(p-phenyleneethynylene)s: The Effect of Anthracene Substitution. The J. Phys. Chem. 1995, 99, 4886. 10. Platt, J. R. The Box Model and Electron Densities in Conjugated Systems. J. Chem. Phys. 1954, 22, 4886-4893. 11. Klevens, H. B.; Platt, J. R. Spectral Resemblances of Cata‐Condensed Hydrocarbons. J. Chem. Phys. 1949, 17, 470-483. 12. Platt, J. R. Classification of Spectra of Cata‐Condensed Hydrocarbons.. J. Chem. Phys. 1949, 17, 484-495. 13. Lackowicz, J. R. Principles of Fluorescence Spectroscopy 3rd Ed.; Springer Science+Business Media, LLC, 2010; pp 32. 14. Tigoianu, I. R.; Airinei, A.; Dorohoi, D. O. Solvent Influence on the Electronic Fluorescence Spectra of Anthracene. Rev. Chim. (Bucharest, Rom.) 2010, 61, 491-494. 15. Valeur, B.; Berberan-Santos, M. N. Molecular Fluorescence: Principles and Applications; Wiley-VCH, 2012; pp 77.
(16. Berlman, I. B. Handbook of Fluorescence Spectra of Aromatic Molecules; 2d ed.; Academic Press: New York, 1971; pp 57-59. 17. Melhuish, W. H. Quantum Efficiencies of Fluorescence of Organic Substances: Effect of Solvent and Concentration of the Fluorescent Solute. J. Phys. Chem. 1961, 65, 229-235. 18. Ware, W. R.; Baldwin, B. A. Absorption Intensity and Fluorescence Lifetimes of Molecules. J. Chem. Phys. 1964, 40, 1703. 19. Dawson, W. R.; Windsor, M. W. Fluorescence Yields of Aromatic Compounds. J. Phys. Chem. 1968, 72, 3251.

62
20. Lampert, R. A.; Chewter, L. A.; Phillips, D.; O'Connor, D. V.; Roberts, A. J.; Meech, S. R. Standards for Nanosecond Fluorescence Decay Time Measurements. Anal. Chem. 1983, 55, 68-73. 21. Momiji, I.; Yoza, C.; Matsui, K. Fluorescence Spectra of 9-Anthracenecarboxylic Acid in Heterogeneous Environments. J. Phys. Chem. B. 2000, 104, 1552-1555. 22. Abdel-Mottaleb, M. S. A.; Galal, H. R.; Dessouky, A. F. M.; El-Naggar, M.; Mekkawi, D.; Ali, S. S.; Attya, G. M. Fluorescence and Photostability Studies of Anthracene-9-carboxylic Acid in Different Media. Int. J. Photoenergy. 2000, 2, 48-53. 23. Werner, T. C.; Hercules, D. M. Fluorescence of 9-Anthroic Acid and Its Esters. Environmental Effects on Excited-State Behavior. J. Phys. Chem. 1969, 73, 2005-2011. 24. Suzuki, S.; Fujii, T.; Yoshiike, N.; Komatsu, S.; Iida, T. Absorption and Fluorescence Spectra of Anthracenecarboxylic Acids. I. 9-Anthroic Acid and Formation of Excimer. Bull. Chem. Soc. Jpn. 1978, 51, 2460-2466. 25. Bazilevskaya, N.; Cherkasov, A. Two Fluorescence Bands of Mesoanthracenecarboxylic Acids and Excimers. Appl. Spectrosc. 1965, 3, 412-416. 26. Ghoneim, N. Scherrer, D.; Suppan, P. Dual Luminescence, Structure and Eximers of 9-Anthracene Carboxylic Acid. J. Lumin. 1993, 55, 271-275. 27. Rodriguez-Cordoba, W. N.-M., R.; Navarro, P.; Peon, J. Ultrafast Fluorescence Study of the Effect of Carboxylic and Carboxylate Substituents on the Excited State Properties of Anthracene. J. Lumin. 2014, 145, 697-707. 28. Cabellero, A. G. C., A. K.; Nalli, S. M. Remote Aromatic Stabilization in Radical Reactions. Tetrahedron Lett. 2008, 49, 3613-3615. 29. Fontenot, S. A. C., V. M.; Pitt, M. A. W.; Sather, A. C.; Zakharov, L. N.; Berryman, O. B.; Johnson, D. W. Design, Synthesis and Characterization of Self-Assembled As2L3 and Sb2L3 Cyptands. Dalton Trans. 2011, 40, 12125-12131. 30. Garay, R. O. N., H.; Muellen, K. Synthesis and Characterization of Poly(1,4-anthrylenevinylene). Macromolecules. 1994, 27, 1922. 31. Jones, N. Dimethyl 9,10-Anthracenedicarboxylate: A Aentrosymmetric Transoid Molecule. 1945, 67, 1922-1927. 32. Arient, J. P. Collect. Czech. Chem. Commun. Nitration and Oxidation of Anthraquinone Dimethyl Derivatives. 1973, 39, 3117. 33. O’ Connor, D. V. Phillips, D. Time–Correlated Single Photon Counting; Academic Press: London, 1984; pp 36-54. 34. Strickler, S. J.; Berg, R. A. Relationship Between Absorption Intensity and Fluorescence Lifetime of Molecules. J. Chem Phys. 1962, 37, 814-882. 35. Werner, T. C.; Hercules, D. M. J. Phys. Chem. Charge-transfer Effects on the Absorption and Fluorescence Spectra of Anthroic Acids. 1970, 74, 1030. 36. Imai, Y.; Murata, K.; Asano, N.; Nakano, Y.; Kawaguchi, K.; Harada, T.; Sato, T.; Fujiki, M.; Kuroda, R.; Matsubara, Y. Selective Formation and Optical Property of a 21-Helical Columnar Fluorophore Composed of Achiral 2-Anthracenecarboxylic Acid and Benzylamine. Cryst. Growth Des. 2008, 8, 3376-3379. 37. DiCesare, N.; Lakowicz, J. R. Spectral Properties of Fluorophores Combining the Boronic Acid Group with Electron Donor or Withdrawing Groups. Implication in the Development of Fluorescence Probes for Saccharides. J. Phys. Chem. A. 2001, 105, 6834-6840. 38. Becker, R. S. Theory and Interpretation of Fluorescence and Phosphorescence; Wiley Interscience: New York, 1969; pp 175-177.

63
39. Fitzgerald, L. J.; Gerkin, R. E. Anthracene-1,8-dicarboxylic Acid. Acta Crystallogr. C. 1996, 52, 1838. 40. Fitzgerald, L. J.; Gerkin, R. E. Anthracene-1-carboxylic Acid. Acta Crystallogr. C. 1997, 53, 1080. 41. Werner, T. C.; Fisch, R.; Goodman, G. Spectral Studies on Aromatic Esters of 9-Anthroic Acid. Spectroscopy Lett. 2006, 7, 385. 42. Fitzgerald, L. J.; Gerkin, R. E. Anthracene-9-carboxylic Acid. Acta Crystallogr. C. 1997, 53, 71. 43. Gaussian 09, Revision A.02, Frisch, M. J.; Trucks, G. W.; Schlegel, H. B.; Scuseria, G. E.; Robb, M. A.; Cheeseman, J. R.; Scalmani, G.; Barone, V.; Mennucci, B.; Petersson, G. A.; Nakatsuji, H.; Caricato, M.; Li, X.; Hratchian, H. P.; Izmaylov, A. F.; Bloino, J.; Zheng, G.; Sonnenberg, J. L.; Hada, M.; Ehara, M.; Toyota, K.; Fukuda, R.; Hasegawa, J.; Ishida, M.; Nakajima, T.; Honda, Y.; Kitao, O.; Nakai, H.; Vreven, T.; Montgomery, J. A., Jr.; Peralta, J. E.; Ogliaro, F.; Bearpark, M.; Heyd, J. J.; Brothers, E.; Kudin, K. N.; Staroverov, V. N.; Kobayashi, R.; Normand, J.; Raghavachari, K.; Rendell, A.; Burant, J. C.; Iyengar, S. S.; Tomasi, J.; Cossi, M.; Rega, N.; Millam, J. M.; Klene, M.; Knox, J. E.; Cross, J. B.; Bakken, V.; Adamo, C.; Jaramillo, J.; Gomperts, R.; Stratmann, R. E.; Yazyev, O.; Austin, A. J.; Cammi, R.; Pomelli, C.; Ochterski, J. W.; Martin, R. L.; Morokuma, K.; Zakrzewski, V. G.; Voth, G. A.; Salvador, P.; Dannenberg, J. J.; Dapprich, S.; Daniels, A. D.; Farkas, Ö.; Foresman, J. B.; Ortiz, J. V.; Cioslowski, J.; Fox, D. J. Gaussian, Inc., Wallingford CT, 2009.

64
3. Photophysical Properties of Zr-based Anthracenic Metal–Organic Frameworks
3.1. Introduction
Metal-organic frameworks (MOFs) are crystalline materials constructed from metal ions
or clusters, connected by multidentate organic ligands. In recent years, luminescent MOFs have
been investigated for their applications in sensing of small molecule and vapors, light-emitting
devices, photocatalysts as well as bioimaging and drug delivery.1,2 Luminescence in MOFs can
arise from lanthanide metal nodes, aromatic organic ligands, metal-to-ligand charge transfer
(MLCT) or ligand-to-metal charge transfer (LMCT) interactions or from guest species.2 MOFs
with ligand-based luminescence are advantageous because their optical properties may be fine-
tuned by functionalization of the ligand or post synthetic modification.3 Furthermore, the well-
defined crystalline nature of MOFs affords an excellent platform for studying structure-function
relationships.4
MOFs constructed from luminescent organic ligands often exhibit similar optical
properties to that of the free ligand. However, these properties are altered to varying degrees due
to coordination to the metal, π–π interactions and/or MLCT or LMCT interactions.5 A thorough
understanding of the excited state properties and how these properties are affected upon
incorporation into a MOF is necessary in order to rationally design luminescent MOFs for specific
applications. Here in, three anthracene dicarboxylic acid derivatives, 9,10-anthracenedicarboxylic
acid (9,10-ADCA), 2,6-anthracenedicarboxylic acid (2,6-ADCA) and 1,4-anthracenedicarboxylic
acid (1,4-ADCA) were used to construct the Zr-based MOFs, 9,10-ADC Zr-MOF, 2,6-ADC Zr-
MOF and 1,4-ADC Zr-MOF, respectively. Zirconium clusters are known to form highly stable

65
MOFs due to the strong bonding interactions between Zr4+ and the oxygen atoms of the carboxylate
linkers.6,7
A detailed study of the photophysical properties of these ligands is described in chapter 1
(vide supra). Addition of two carboxylic acid groups onto the aromatic ring system distinctively
affects the photophysics of the parent anthracene moiety depending on their location and
protonation state. Here in, the excited state properties of the three ADC-Zr-MOFs were
investigated using stead-state diffuse reflectance and steady-state emission spectroscopies, time-
correlated single photon counting (TCSPC) spectroscopy in the solid state and in a solvent
suspension and compared to that of the free ligand.
3.2. Results
The 9,10-ADC Zr-MOF was synthesized according to a previously reported procedure
modified from UiO-66.8,9 ZrCl4 (23.3 mg, 0.1 mmol) and 9,10-ADCA (26.6 mg, 0.1 mmol) were
added to a 3-dram vial along with DMF (3 mL) and acetic acid (0.6 mL, 120 equivalents). The vial
was capped and sealed with Teflon tape and the mixture was ultrasonicated for 15 minutes. The
vial was then placed in an oven and heated at 120 ºC for 24 hours. The reaction solution was
filtered immediately and a light-yellow powder was collected via vacuum filtration then washed
with DMF and ethanol and dried in air.
The 2,6-ADC and 1,4-ADC Zr-MOFs were synthesized using a similar procedure,
optimized by changing the concentration of reactants, reaction time, temperature, modulator and
amount of modulator used.10 To prepare the 2,6-ADC Zr-MOF, ZrCl4 (23.3 mg, 0.1 mmol) and
2,6-ADCA (26.6 mg, 0.1 mmol) were added to a 1-dram vial along with DMF (5 mL) and formic
acid (60 equivalents). The vial was sealed and the mixture was ultrasonicated for 15 minutes then
heated in an oven at 120 ºC for 24 hours. The reaction solution was centrifuged immediately and
66
the solvent was decanted off. The solid was washed with DMF and centrifuged again until the
solution was clear. The DMF was decanted off and the solid was dried under vacuum for 3 days.
The 1,4-ADC Zr-MOF was prepared by first adding ZrCl4 (23.3 mg, 0.1 mmol), acetic acid (80
equivalents) and DMF (3 mL) in a vial and sonicating for 15 minutes. 1,4-ADCA (26.6 mg, 0.1
mmol) was then added and the solution sonicated again for 15 minutes. The mixture was heated
at 100 ºC for 12 hours. The MOFs were obtained by centrifugation, washed with DMF and dried
under vacuum.
Figure 3.1.D shows the powder X-ray diffraction (PXRD) patterns of the 9,10-ADC Zr-
MOF and the 1,4-ADC Zr-MOF compared to the simulated pattern of UiO-66 obtained from the
single-crystal XRD as well as the PXRD pattern of the 2,6-ADC Zr-MOF compared to the
simulated pattern of UiO-67. The PXRD patterns were fit to the simulated patterns of UiO-66 and
UiO-67 using Le Bail analysis (Figure S3.1, Figure S3.2). As shown in the SEM images (Figure
3.1.A), the 9,10-ADC Zr-MOF forms octahedral crystals of with an average size of ~700 nm. The
2,6-ADC Zr-MOFs also form octahedral crystals ~200 nm in size (Figure 3.1.B). On the other
hand, the 1,4-ADC Zr-MOF forms rod-shaped crystals several microns in size (Figure 3.1.C).
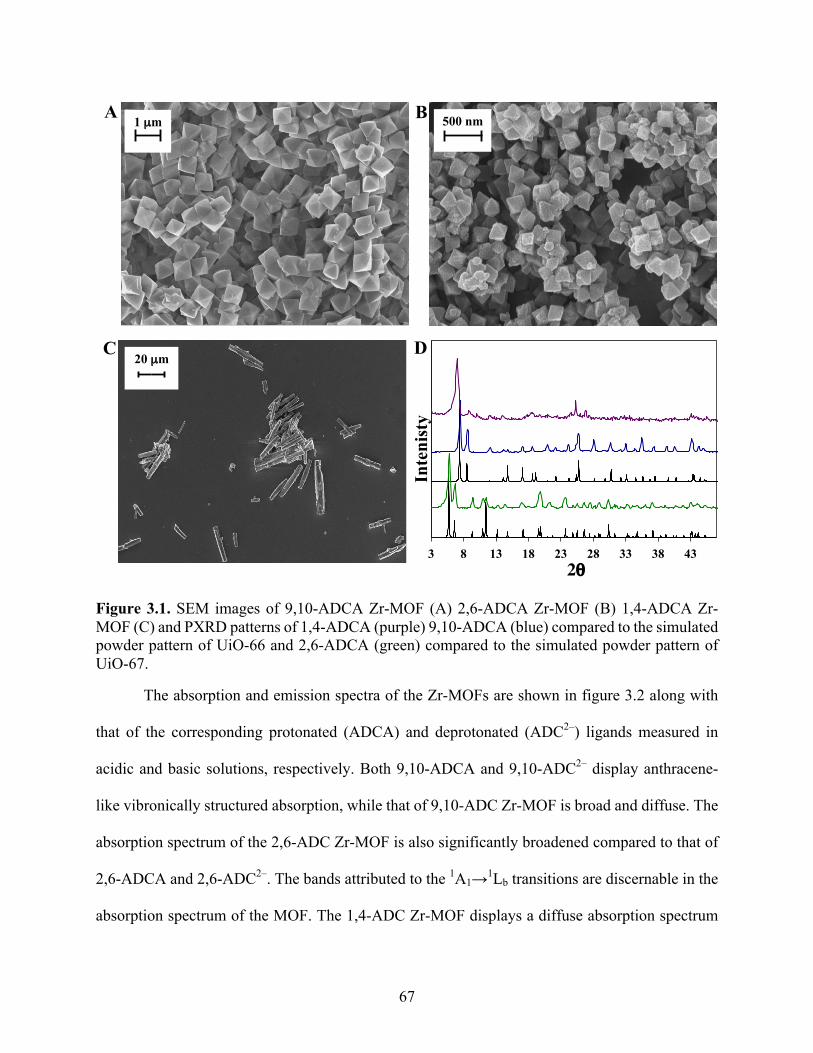
67
Figure 3.1. SEM images of 9,10-ADCA Zr-MOF (A) 2,6-ADCA Zr-MOF (B) 1,4-ADCA Zr-MOF (C) and PXRD patterns of 1,4-ADCA (purple) 9,10-ADCA (blue) compared to the simulated powder pattern of UiO-66 and 2,6-ADCA (green) compared to the simulated powder pattern of UiO-67.
The absorption and emission spectra of the Zr-MOFs are shown in figure 3.2 along with
that of the corresponding protonated (ADCA) and deprotonated (ADC2–) ligands measured in
acidic and basic solutions, respectively. Both 9,10-ADCA and 9,10-ADC2– display anthracene-
like vibronically structured absorption, while that of 9,10-ADC Zr-MOF is broad and diffuse. The
absorption spectrum of the 2,6-ADC Zr-MOF is also significantly broadened compared to that of
2,6-ADCA and 2,6-ADC2–. The bands attributed to the 1A1→1Lb transitions are discernable in the
absorption spectrum of the MOF. The 1,4-ADC Zr-MOF displays a diffuse absorption spectrum
3 8 13 18 23 28 33 38 43
Inte
nist
y
2θ
3 8 13 18 23 28 33 38 43
Inte
nist
y
2θ
1 µm
500 nm
20 µm
A
C D
B
68
similar to that of 1,4-ADCA, but is completely unstructured. The absorption spectrum of each of
the Zr-MOF is redshifted relative to its free ligand in solution. The absorption spectra of the Zr-
MOFs are redshifted 51 nm, 4 nm and 7 nm for 9,10-ADCA, 2,6-ADCA and 1,4-ADCA,
respectively, and 41 nm, 21 nm and 27 nm for the deprotonated forms.
The emission spectra of all three Zr-MOFs most closely resemble that of the corresponding
protonated linker. The emission spectrum of the 9,10-ADC Zr-MOF is slightly broadened and the
emission maximum (λmax) is redshifted by only a few nanometers. The 2,6-ADC Zr-MOF displays
vibronically structured emission, analogous to 2,6-ADCA, but is blueshifted by ~ 1 nm. The
emission spectrum of the 1,4-ADC Zr-MOF is broad and diffuse, with some slight vibronic
features at ~ 405 nm and ~ 425 nm. The λmax, centered at 457 nm, is redshifted 15 nm from that of
1,4-ADCA.
The fluorescence lifetimes of the ADCA Zr-MOFs and ADCA ligands in acidic and basic
solution are listed in Table 3.1. The fluorescence decays of the Zr-MOFs were measured in
suspensions of the MOF in DMF and were best fit to a biexponential decay function. So far,
reasonable, repeatable quantum yield values have not been obtained.

69
Figure 3.2. Absorption and Emission spectra of 9,10-ADCA (a,b), 2,6-ADCA (c,d) and 1,4-ADCA(e,f) in acidic solution (ADCA, red), basic solution (ADC2–, blue) and in a Zr-MOF (black).
300 400 500
Nor
mal
ized
Abs
orba
nce
Wavelength (nm)
a
380 480 580 680
Nor
mal
ized
Abs
orba
nce
Wavelength (nm)
Zr-MOF basic DMF acidic DMF
b
Nor
mal
ized
Int
ensi
ty
300 400 500
Nor
mal
ized
Abs
orba
nce
Wavelength (nm)
c
375 475 575
Nor
mal
ized
Abs
orba
nce
Wavelength (nm)
Zr-MOF basic DMF acidic DMF
d
Nor
mal
ized
Int
ensi
ty
300 400 500 600
Nor
mal
ized
Abs
orba
nce
Wavelength (nm)
e
390 490 590 690
Nor
mal
ized
Abs
orba
nce
Wavelength (nm)
Zr-MOF basic DMF acidic DMF
f
Nor
mal
ized
Int
ensi
ty
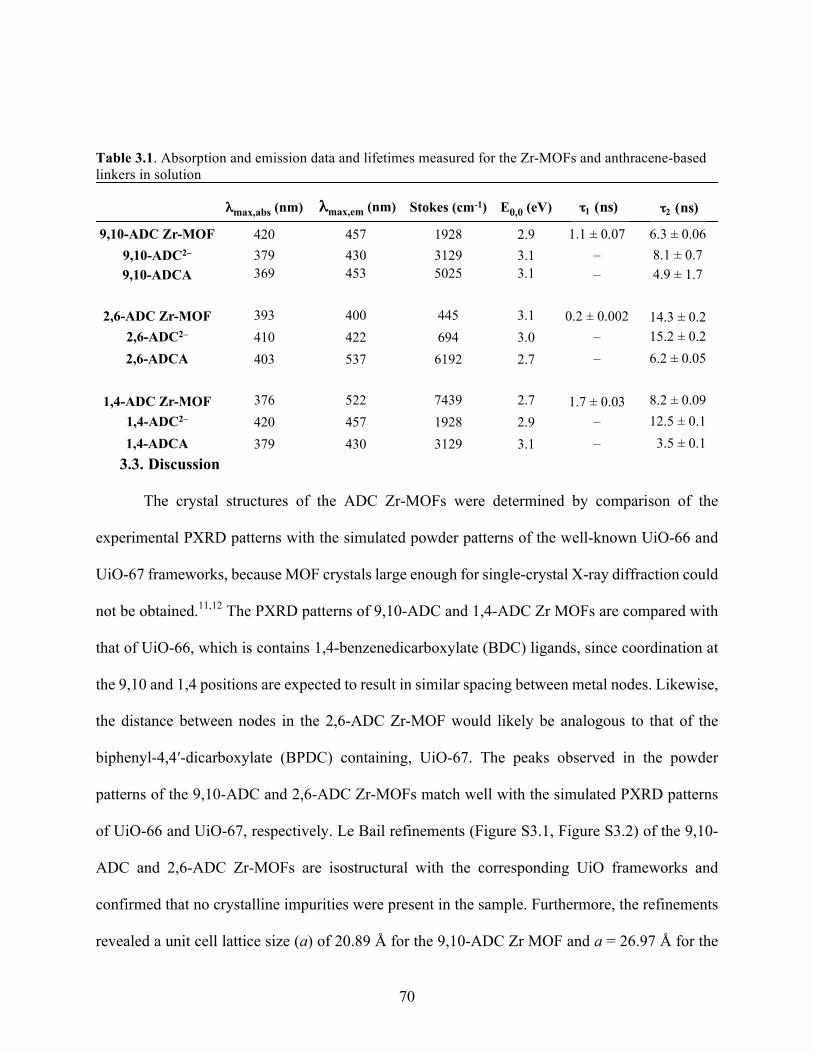
70
Table 3.1. Absorption and emission data and lifetimes measured for the Zr-MOFs and anthracene-based linkers in solution
3.3. Discussion
The crystal structures of the ADC Zr-MOFs were determined by comparison of the
experimental PXRD patterns with the simulated powder patterns of the well-known UiO-66 and
UiO-67 frameworks, because MOF crystals large enough for single-crystal X-ray diffraction could
not be obtained.11,12 The PXRD patterns of 9,10-ADC and 1,4-ADC Zr MOFs are compared with
that of UiO-66, which is contains 1,4-benzenedicarboxylate (BDC) ligands, since coordination at
the 9,10 and 1,4 positions are expected to result in similar spacing between metal nodes. Likewise,
the distance between nodes in the 2,6-ADC Zr-MOF would likely be analogous to that of the
biphenyl-4,4′-dicarboxylate (BPDC) containing, UiO-67. The peaks observed in the powder
patterns of the 9,10-ADC and 2,6-ADC Zr-MOFs match well with the simulated PXRD patterns
of UiO-66 and UiO-67, respectively. Le Bail refinements (Figure S3.1, Figure S3.2) of the 9,10-
ADC and 2,6-ADC Zr-MOFs are isostructural with the corresponding UiO frameworks and
confirmed that no crystalline impurities were present in the sample. Furthermore, the refinements
revealed a unit cell lattice size (a) of 20.89 Å for the 9,10-ADC Zr MOF and a = 26.97 Å for the
λmax,abs (nm) λmax,em (nm) Stokes (cm-1) E0,0 (eV) t′ (ns) t″ (ns)
9,10-ADC Zr-MOF 420 457 1928 2.9 1.1 ± 0.07 6.3 ± 0.06 9,10-ADC2– 379 430 3129 3.1 – 8.1 ± 0.7 9,10-ADCA 369 453 5025 3.1 – 4.9 ± 1.7
2,6-ADC Zr-MOF 393 400 445 3.1 0.2 ± 0.002 14.3 ± 0.2 2,6-ADC2– 410 422 694 3.0 – 15.2 ± 0.2 2,6-ADCA 403 537 6192 2.7 – 6.2 ± 0.05
1,4-ADC Zr-MOF 376 522 7439 2.7 1.7 ± 0.03 8.2 ± 0.09 1,4-ADC2– 420 457 1928 2.9 – 12.5 ± 0.1 1,4-ADCA 379 430 3129 3.1 – 3.5 ± 0.1
τ1 (ns) τ2 (ns)
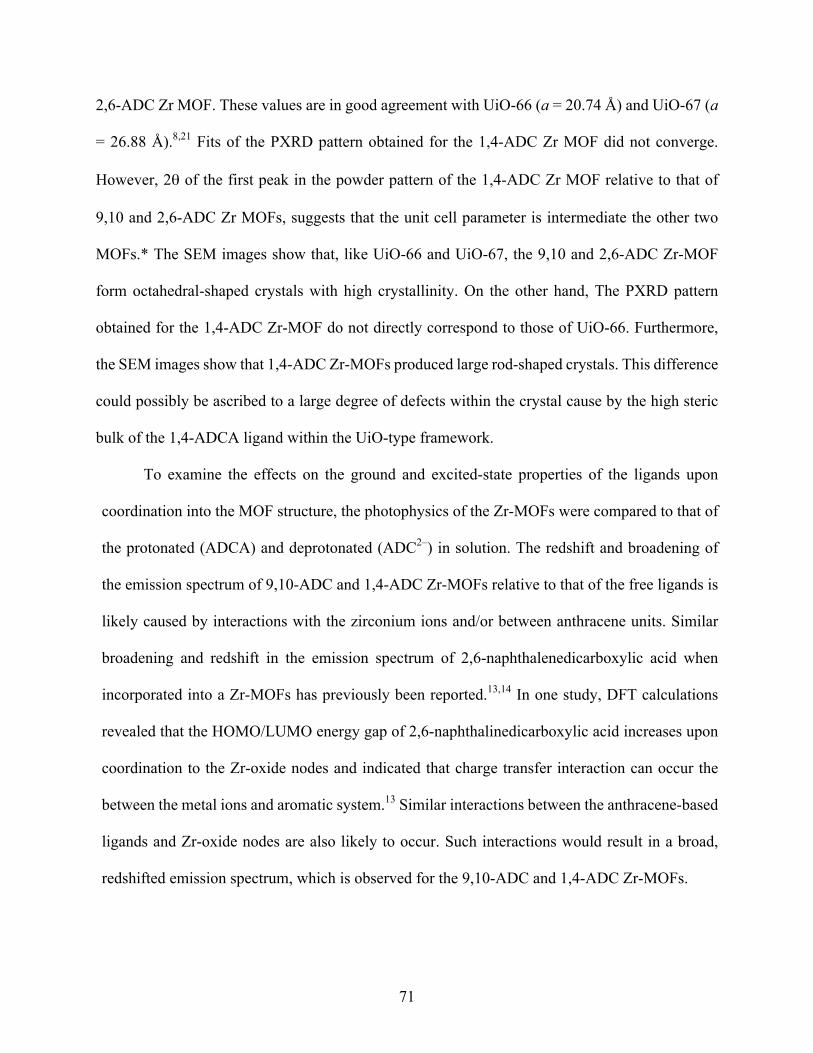
71
2,6-ADC Zr MOF. These values are in good agreement with UiO-66 (a = 20.74 Å) and UiO-67 (a
= 26.88 Å).8,21 Fits of the PXRD pattern obtained for the 1,4-ADC Zr MOF did not converge.
However, 2θ of the first peak in the powder pattern of the 1,4-ADC Zr MOF relative to that of
9,10 and 2,6-ADC Zr MOFs, suggests that the unit cell parameter is intermediate the other two
MOFs.* The SEM images show that, like UiO-66 and UiO-67, the 9,10 and 2,6-ADC Zr-MOF
form octahedral-shaped crystals with high crystallinity. On the other hand, The PXRD pattern
obtained for the 1,4-ADC Zr-MOF do not directly correspond to those of UiO-66. Furthermore,
the SEM images show that 1,4-ADC Zr-MOFs produced large rod-shaped crystals. This difference
could possibly be ascribed to a large degree of defects within the crystal cause by the high steric
bulk of the 1,4-ADCA ligand within the UiO-type framework.
To examine the effects on the ground and excited-state properties of the ligands upon
coordination into the MOF structure, the photophysics of the Zr-MOFs were compared to that of
the protonated (ADCA) and deprotonated (ADC2–) in solution. The redshift and broadening of
the emission spectrum of 9,10-ADC and 1,4-ADC Zr-MOFs relative to that of the free ligands is
likely caused by interactions with the zirconium ions and/or between anthracene units. Similar
broadening and redshift in the emission spectrum of 2,6-naphthalenedicarboxylic acid when
incorporated into a Zr-MOFs has previously been reported.13,14 In one study, DFT calculations
revealed that the HOMO/LUMO energy gap of 2,6-naphthalinedicarboxylic acid increases upon
coordination to the Zr-oxide nodes and indicated that charge transfer interaction can occur the
between the metal ions and aromatic system.13 Similar interactions between the anthracene-based
ligands and Zr-oxide nodes are also likely to occur. Such interactions would result in a broad,
redshifted emission spectrum, which is observed for the 9,10-ADC and 1,4-ADC Zr-MOFs.
72
The substantial degree of broadening and the significant redshift observed in the absorption
spectrum may be attributed to intermolecular interactions between the anthracene-based ligands.
Such effects are observed in the formation of ground-state anthracene dimers.15 Additionally,
anthracene excimer emission is characterized by a broad emission band in the 400 nm – 700 nm
region.15,16 The magnitude of the effects of π-interactions on the photophysical properties is
dependent upon distance between chromophores as well as their orientation. Based on the C–C
distance between BDC linkers in UiO-66 of ~ 5.8 Å along with an estimated size of 11.8 Å × 7.8
Å for an anthracene molecule, it is possible for some amount of π-overlap to occur between
anthracene moieties of the 9,10-ADC and 1,4-ADC Zr-MOFs.17,18 Furthermore, the extent of π-
overlap should be stronger in the 1,4-ADC Zr-MOF since more of the aromatic anthracene unit
is available to interact with neighboring chromophores. Accordingly, a λmax of 457 nm is observed
for the 9,10-ADC Zr-MOF and 522 nm for the 1,4-ADC Zr-MOF. It is also likely that a small
amount of free ligand may be encapsulated in the pores of the MOF, which would facilitate π-π
stacking interactions.
TDDFT calculations of the 9,10-ADCA in the excited-state indicated that the molecule
undergoes puckering of the anthracene plane in the excited state due to a decrease in the dihedral
angle between the acid groups and the ring system (vide supra). The similarity between the
emission spectrum of 9,10-ADCA recorded in acidic DMF and in the MOF suggests that the
ligand may still undergo such geometry changes within in the MOF.
The 2,6-ADC Zr MOF also displays a broad, redshifted absorption spectrum; however, the
emission spectrum appears almost unchanged relative to 2,6-ADCA in solution. The similarity
between the vibronic bands in the absorption spectrum of 2,6-ADCA and the 2,6-ADC Zr-MOF
indicates that the 1A1→1Lb transitions polarized along the longitudinal axis are also stabilized in
73
the MOF. In addition, the MOF exhibits emission band with distinct vibronic structure that closely
resembles emission of 2,6-ADCA in solution. Therefore, coordination of the 2,6-ADC derivative
into the MOF has negligible effects on the 1A1→1La transition, which is responsible for the
observed anthracene-based emission (vide supra).
The biexponential fluorescence decays measured for all three Zr-MOFs showed a
biexponential decay consisting of a longer lifetime component, intermediate of that observed for
the corresponding ADCA/ADC2– in solution, as well as a shorter component. There are a few
factors that may be responsible for the biexponential decay. First, ground-state interchromophore
interactions could result in excimer emission with fluorescence at the same wavelength, resulting
in fluorescence from two different species. Alternatively, excited state interaction between
chromophore pairs, such as resonance energy transfer, could result in quenched fluorescence from
the donor and monomeric emission from the acceptor.15,19 Because the longest lifetime is very
close to that of the free ligand in solution, it is most likely assigned to monomeric emission, as
excimer emission generally exceeds that of the monomer. The shorter lifetime is then ascribed to
dynamic quenching of ligand-based emission, possibly due to resonance energy transfer from one
anthracene unit to another close by.15,20
3.4. Conclusions
The photophysics of each of the three anthracene dicarboxylic acids are altered upon
coordination to the zirconium-based nodes of the MOFs. Interactions between anthracene units of
the linkers further affect their ground and excited-state properties. Moreover, the distances
between anthracene units and their orientation within the framework dictate the extent of these
intermolecular interactions. In order to better understand chromophores interactions in the MOF,
future work will involve obtaining fluorescence quantum yields of the Zr-MOFs as well as

74
transient absorption and emission measurements, unit cell calculations and modifying synthetic
parameters in attempt to obtain single-crystals for X-ray diffraction analysis.
3.5. Supplemental Information
3.5.1. Experimental Procedures
3.5.1.1. Materials
2,6-anthracenedicarboxylic acid (2,6-ADCA), 1,4-anthracenedicarboxylic acid (1,4-
ADCA), and 9,10-anthracenedicarboxylic acid (9,10-ADCA) were synthesized as described in
the previous chapter, and characterized by 1H NMR spectroscopy. All other chemicals and
solvents including, ZrCl4, dimethylformamide (HPLC grade > 99%), acetic acid (reagent grade
> 99%), and formic acid (reagent grade > 99%) were used as received without further purification
from Alfa Aesar, Fisher Scientific, or Sigma-Aldrich.
3.5.2. Powder X-ray diffraction and Scanning electron microscopy
X-ray powder diffraction patterns (PXRD) of MOF powder samples were obtained with
a Rigaku Miniflex. SEM images were collected with a Leo/Zeiss 1550 Schottky field emission
scanning electron microscope equipped with an in-lens detector.
3.5.3. Steady-state absorption spectroscopy
The steady-state absorption spectra of the ligands were obtained using an Agilent
Technologies 8453 UV-Vis diode array spectrophotometer (1 nm resolution) where the spectra
were recorded with samples prepared in a 1 cm quartz cuvette. Diffuse reflectance measurements
were performed on the same instrument, where the sample compartment was replaced with an
integration sphere.

75
3.5.4. Steady-state emission spectroscopy and time-resolved emission lifetimes
Approximately 3 mg of MOF powder were suspended in 3 mL DMF and the sample was
continuously stirred during the emission measurements. All ligand samples were prepared at
concentrations below 10 µM to reduce aggregation effects. Time-resolved fluorescence lifetimes
were obtained via the time-correlated single photon counting technique (TCSPC) with a modified
QuantaMaster Model QM-200-4E emission spectrophotometer from Photon Technology, Inc.
(PTI) equipped with a 350 nm LED and a Becker & Hickl GmbH PMH-100 PMT detector with
time resolution of < 220 ps FWHM. Florescence lifetime decays were deconvoluted from the
time-dependent florescence signal and the instrument response function using the fluorescence
decay analysis software, DecayFit, available online (Fluortools, www.fluortools.com).
Quantum yields of fluorescence and steady-state emission spectra of the ADCA
compounds were measured in DMF. The steady-state emission spectra were obtained using the
same QuantaMaster Model QM-200-4E where the sample compartment was replaced with an
integrating sphere (PTI). The excitation light source was a 75 W Xe arc lamp (Newport). The
detector was a thermoelectrically cooled Hamamatsu 1527 photomultiplier tube (PMT). All
measurements were performed in triplicate using three separately prepared solutions.
To ensure stability of the MOF and the absence of free linker, the solutions were syringe
filtered and emission was monitored at the maximum wavelength of emission for each ligand
after the emission experiments were completed.

76
3.5.5. Supplemental Figures
Figure S3.1. Le Bail refinement of the PXRD pattern of the 9,10-ADC Zr-MOF
Figure S3.2. Le Bail refinement of the PXRD pattern of the 2,6-ADC Zr-MOF
3.6. References
1. Hu, Z.; Deibert, B. J.; Li, J., Luminescent metal–Organic Frameworks for Chemical Sensing and Explosive Detection. Chem. Soc. Rev. 2014, 43, 5815–5840.
5 10 15 20 25 30 35-1000
-500
0
500
1000
1500
2000
2500
3000
Intensity
2θ
Experimental Refinement Difference
ExperimentalRefinementDifference
-1000
-500
0
500
1000
1500
2000
2500
3000
5 10 15 20 25 30 35
Inte
nsity
2θ
-1500-1000-5000
50010001500200025003000
10 20 30 40 50-1500
-1000
-500
0
500
1000
1500
2000
2500
3000
Intensity
2θ
Experimental Refinement Difference
10 20 30 40 50
ExperimentalRefinementDifference
Intensity
2θ
77
2. Allendorf, M. D.; Bauer, C. A.; Bhakta, R. K.; Houk, R. J., Luminescent Metal-Organic Frameworks. Chem Soc Rev 2009, 38 (5), 1330-52. 3. Lu, W.; Wei, Z.; Gu, Z. Y.; Liu, T. F.; Park, J.; Park, J.; Tian, J.; Zhang, M.; Zhang, Q.; Gentle, T., 3rd; Bosch, M.; Zhou, H. C., Tuning the Structure and Function of Metal-Organic Frameworks via Linker Design. Chem Soc Rev 2014, 43 (16), 5561-93. 4. Inokuma, Y.; Yoshioka, S.; Ariyoshi, J.; Arai, T.; Hitora, Y.; Takada, K.; Matsunaga, S.; Rissanen, K.; Fujita, M., X-ray Analysis on the Nanogram to Microgram Scale Using Porous Complexes. Nature 2013, 495, 461-469. 5. Meek, S. T.; Greathouse, J. A.; Allendorf, M. D., Metal-Organic Frameworks: a Rapidly Growing Class of Versatile Nanoporous Materials. Adv Mater 2011, 23 (2), 249-67. 6. Cavka, J. H.; Jakobsen, S.; Olsbye, U.; Guillou, N.; Lamberti, C.; Bordiga, S.; Lillerud, K. P., A New Zirconium Inorganic Building Brick Forming Metal-Organic Frameworks with Exceptional Stability. J. Am. Chem. Soc. 2008, 130 (42), 13850–13851. 7. Bai, Y.; Dou, Y.; Xie, L. H.; Rutledge, W.; Li, J. R.; Zhou, H. C., Zr-Based Metal-Organic Frameworks: Design, Synthesis, Structure, and Applications. Chem Soc Rev 2016. 8. Katz, M. J.; Brown, Z. J.; Colon, Y. J.; Siu, P. W.; Scheidt, K. A.; Snurr, R. Q.; Hupp, J. T.; Farha, O. K., A Facile Synthesis of UiO-66, UiO-67 and Their Derivatives. Chem Commun (Camb) 2013, 49 (82), 9449-51. 9. Pu, S.; Xu, L.; Sun, L.; Du, H., Tuning the Optical Properties of the Zirconium–UiO-66 Metal–Organic Framework for Photocatalytic Degradation of Methyl Orange. Inorg. Chem. Comm. 2015, 52, 50–52. 10. Schaate, A.; Roy, P.; Godt, A.; Lippke, J.; Waltz, F.; Wiebcke, M.; Behrens, P., Modulated synthesis of Zr-based Metal-Organic Frameworks: From Nano to Single Crystals. Chemistry 2011, 17 (24), 6643-51. 11. Valenzano, L.; Civalleri, B.; Chavan, S.; Bordiga, S.; Nilsen, M. H.; Jakobsen, S.; Lillerud, K. P.; Lamberti, C., Disclosing the Complex Structure of UiO-66 Metal Organic Framework: A Synergic Combination of Experiment and Theory. Chem Mate. 2011, 23 (7), 1700–1718. 12. Chavan, S.; Vitillo, J. G.; Gianolio, D.; Zavorotynska, O.; Civalleri, B.; Jakobsen, S.; Nilsen, M. H.; Valenzano, L.; Lamberti, C.; Lillerud, K. P.; Bordiga, S., H2 Storage in Isostructural UiO-67 and UiO-66 MOFs. Phys Chem Chem Phys 2012, 14 (5), 1614-26. 13. Zhang, W.; Huang, H.; Liu, D.; Yang, Q.; Xiao, Y.; Ma, Q.; Zhong, C., A New Metal–Organic Framework with High Stability Based on Zirconium for Sensing Small Molecules. Micropor. Mesopor. Mat. 2013, 171, 118–124. 14. Klimov, V. I., Spectral and Dynamical Properties of Multiexcitons in Semiconductor Nanocrystals. Annu Rev Phys Chem 2007, 58, 635-73. 15. Melo, J. S. S.; Costa, T.; Castroa, C. S.; Macanita, A. L., Photochemistry. In Photophysics of Fluorescently Labeled Pligomers and Polymers [Online] 2013. 16. Valeur, B.; Berberan-Santos, M. N., Molecular Fluorescence: Principles and Applications. Wiley-VCH: 2012. 17. Hong, D. H.; Suh, M. P., Enhancing CO2 Separation Ability of a Metal-Organic Framework by Post-Synthetic Ligand Exchange with Flexible Aliphatic Carboxylates. Chemistry 2014, 20 (2), 426-34. 18. Jas, G. S.; Wang, Y.; Pauls, S. W.; Johnson, C. K.; Kuczera, K., Influence of Temperature and Viscosity on Anthracene Rotational Diffusion in Organic Solvents: Molecular Dynamics Simulations and Fluorescence Anisotropy Study. J. Chem. Phys. 1997, 107 (21), 8800–8812.
78
19. Tohnai, N., Luminescence Modulation of Organic Crystals by a Supramolecular Approach. In Advances in Organic Crystal Chemistry: Comprehensive Reviews 2015, Tamura, R.; Miyata, M., Eds. Springer Japan: Tokyo, 2015; pp 569-586. 20. Hinoue, T.; Shigenoi, Y.; Sugino, M.; Mizobe, Y.; Hisaki, I.; Miyata, M.; Tohnai, N., Regulation of pi-Stacked Anthracene Arrangement for Fluorescence Modulation of Organic Solid from Monomer to Excited Oligomer Emission. Chemistry 2012, 18 (15), 4634-43. 21. Qingyuan, Y.; Vincent, G.; Florence, R.; Andrew, D. W.; Philip, L. L.; Chongli, Z.; Thomas, D.; Christian, S.; Guillaume, M., CH4 Storage and CO2 Capture in Highly Porous Zirconium Oxide Based Metal–Organic Frameworks. Chem. Commun 2012, 48, 9831–983.


![7,12 Dimethylbenz[a]Anthracene](https://static.cupdf.com/doc/110x72/55cf857d550346484b8e9668/712-dimethylbenzaanthracene.jpg)