VOLNAME TICKER LAST CHG %CHG (1000s)
PrUltShT REW 19.70 +.89 +280.1KLX EnS KLXE 8.86 -1.27 +185.8Nuvectis n NVCT 9.10 +.83 +180.0BP Pru BPT 10.27 -1.20 +161.3MarPet MARPS 11.19 +.30 +160.2Resonant RESN 4.43 +.01 +159.1NxTierOil NEX 8.64 -.30 +143.4RPC RES 10.54 -.92 +132.2VoyagerT VYGR 6.20 +.61 +128.8SOC Telmd TLMD 2.92 +.01 +128.1VoltInfoSci VOLT 5.88 +2.86 +102.1US Eng USEG 6.55 -.15 +100.3Exterran EXTN 5.89 -.32 +97.7Tidwtr TDW 21.16 +.59 +97.6PeabodyE BTU 19.86 -3.16 +97.2IntegMed IMTE 8.77 +.45 +96.2Dril-Quip DRQ 37.82 -2.48 +92.2OcciPet OXY 55.59 -2.36 +91.8AgriFrce n AGRI 3.96 +.81 +90.4AlphMetal AMR 113.35 -19.38 +85.7
YTDNAME TICKER LAST CHG %CHG
AT&T Inc T 22.89 -.30 -1.3 49,565Alphabet C GOOG 2534.82 -74.69 -2.9 1,510Amazon AMZN 2837.06 -73.43 -2.5 3,696Apple Inc s AAPL 150.62 -4.11 -2.7 108,392BkofAm BAC 41.20 +.87 +2.2 54,235BestBuy BBY 94.64 +.05 +.1 2,350CalifWtr CWT 57.04 +.36 +.6 173Chevron CVX 166.72 -4.18 -2.4 25,149Cisco CSCO 54.30 -.39 -.7 17,964CocaCola KO 58.54 +1.06 +1.8 17,798ConAgra CAG 31.57 +1.47 +4.9 9,879ConstellA STZ 219.69 +7.30 +3.4 919Costco COST 525.95 -1.47 -.3 1,946DanaInc DAN 16.72 -.22 -1.3 2,407Dillards DDS 259.98 -9.75 -3.6 274FordM F 15.74 -.30 -1.9 66,147Gannett GCI 4.26 -.01 -.2 1,368GenMills GIS 62.57 +.30 +.5 3,156GenMotors GM 40.83 -.68 -1.6 18,904GraniteC GVA 31.75 -.04 -.1 365HomeDp HD 318.36 +1.57 +.5 3,604IntPap IP 42.54 +.11 +.3 3,530JohnJn JNJ 171.69 +2.34 +1.4 7,729Lowes LOW 226.51 +4.30 +1.9 3,607McDnlds MCD 226.18 -.69 -.3 4,436MetLife MET 64.69 +.49 +.8 5,042Microsoft MSFT 276.44 -3.63 -1.3 30,592Netflix NFLX 331.01 -9.31 -2.7 5,899ODP Cp ODP 43.61 +1.11 +2.6 340Oracle ORCL 77.07 -.75 -1.0 13,306PG&E Cp PCG 11.19 +.41 +3.8 32,661PepsiCo PEP 155.89 +2.16 +1.4 6,074RiteAid RAD 8.58 -.52 -5.7 2,487SimpsnM SSD 116.09 +.54 +.5 154TenetHlth THC 86.27 -2.77 -3.1 1,338Tesla Inc TSLA 766.37 -28.98 -3.6 23,515UnionPac UNP 257.66 -3.86 -1.5 3,839US Bancrp USB 53.95 +1.30 +2.5 9,175VerizonCm VZ 52.50 -.54 -1.0 23,118WalMart WMT 144.05 +1.98 +1.4 7,547WellsFargo WFC 49.86 +1.39 +2.9 28,154
ASE Tch ASX 6.98 -.03 -.4 7,502AbbottLab ABT 115.52 +1.50 +1.3 5,527AbbVie ABBV 152.10 +3.04 +2.0 8,646Aegon AEG 4.54 +.26 +6.1 8,322Altria MO 50.54 +.06 +.1 11,266AmMovl A AMOV 18.53 -.30 -1.6 18AstraZen AZN 60.39 +.09 +.1 9,338BarrickGld GOLD 23.64 -.71 -2.9 23,119BrMySq BMY 69.24 +.37 +.5 15,595BrkfdAs g BAM 52.13 -1.37 -2.6 1,426CSX s CSX 34.23 -.46 -1.3 14,321CenovusE CVE 15.04 -1.01 -6.3 18,080Citigroup C 54.23 +.07 +.1 25,018Comcast CMCSA 44.97 -.05 -.1 17,562Coupang CPNG 16.12 -1.30 -7.5 17,605DeutschBk DB 11.13 +.88 +8.6 12,140DiDi Glb n DIDI 1.76 -.13 -6.9 87,024Disney DIS 129.03 -2.72 -2.1 9,962Enbridge ENB 43.92 -.54 -1.2 5,296EgyTrnsfr ET 9.82 -.28 -2.8 26,328EntProdPt EPD 24.58 -.64 -2.5 8,406Equinor EQNR 32.06 -.23 -.7 5,425ExxonMbl XOM 81.88 -3.04 -3.6 37,443Globalstar GSAT 1.05 -.08 -7.1 6,281GrabHl A n GRAB 3.02 -.12 -3.8 24,148Intel INTC 44.40 -1.43 -3.1 35,960JPMorgCh JPM 130.17 +1.28 +1.0 15,780KindMorg KMI 17.54 -.56 -3.1 17,415LucidGrp n LCID 21.55 -1.37 -6.0 21,292Manulife g MFC 19.82 -.01 -.1 4,750Merck MRK 77.78 -.48 -.6 10,084Meta Plt FB 186.63 -.98 -.5 30,971MorgStan MS 84.72 -.46 -.5 8,279NatWestGp NWG 5.65 +.27 +5.0 2,421NextEraEn NEE 79.28 -.02 7,131NikeB NKE 117.57 -5.06 -4.1 13,879Nu Hldg n NU 5.93 -.61 -9.3 20,745Nvidia s NVDA 213.30 -7.70 -3.5 38,412Palantir PLTR 10.50 -.89 -7.8 49,624Pfizer PFE 52.25 +1.98 +3.9 42,292ProcpsGr n PROC 8.67 -.30 -3.3 25ProctGam PG 145.05 +1.83 +1.3 7,965Schwab SCHW 83.26 +3.02 +3.8 9,527SiriusXM SIRI 6.16 -.03 -.5 16,613Sundial h SNDL .47 -.01 -1.3 48,814TakedaPh TAK 14.43 2,271TorDBk TD 77.19 +.23 +.3 3,083UBS Grp UBS 17.00 +.39 +2.3 9,394Uber Tch UBER 29.27 -1.49 -4.8 41,858Visa V 200.33 +3.62 +1.8 7,993
VOLNAME TICKER LAST CHG %CHG (1000s)
Ranked by shares outstanding; excludes area stocks listed above
STOCK SPOTLIGHT
TOP 50
Stocks of area interest requested by our readers
LOCAL STOCKS
Source: FactSet Damian J. Troise; Alex Nieves • AP
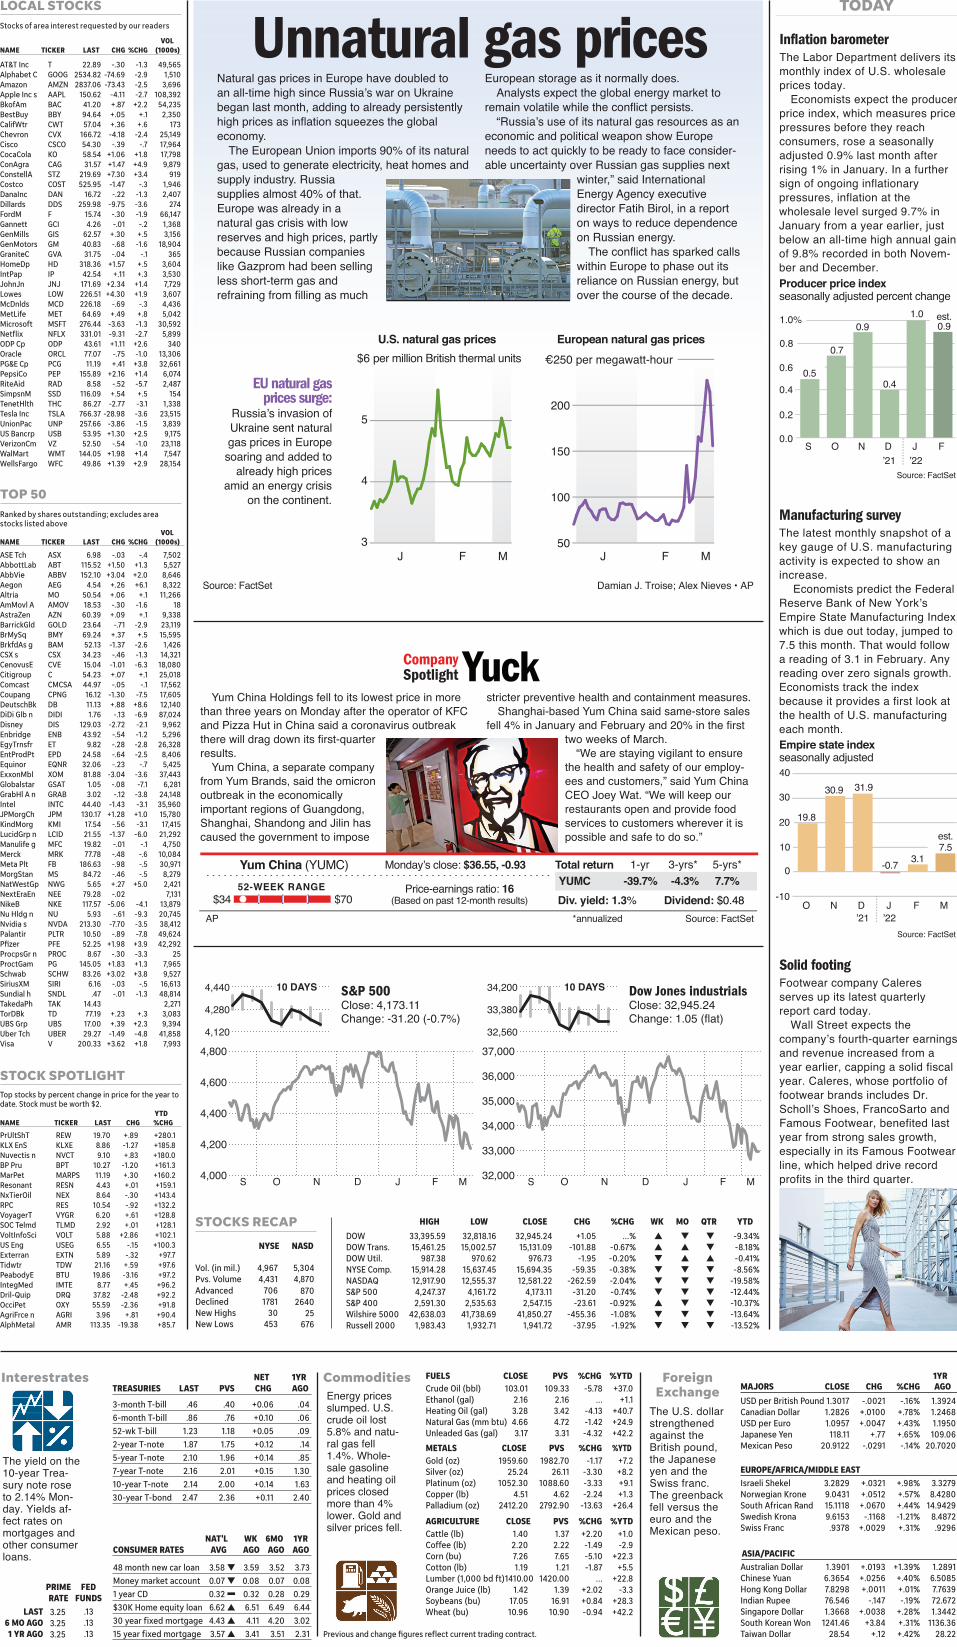
Natural gas prices in Europe have doubled to an all-time high since Russia’s war on Ukraine began last month, adding to already persistently high prices as inflation squeezes the global economy.
The European Union imports 90% of its natural gas, used to generate electricity, heat homes and supply industry. Russia supplies almost 40% of that. Europe was already in a natural gas crisis with low reserves and high prices, partly because Russian companies like Gazprom had been selling less short-term gas and refraining from filling as much
European storage as it normally does. Analysts expect the global energy market to
remain volatile while the conflict persists.“Russia’s use of its natural gas resources as an
economic and political weapon show Europe needs to act quickly to be ready to face consider-able uncertainty over Russian gas supplies next
winter,” said International Energy Agency executive director Fatih Birol, in a report on ways to reduce dependence on Russian energy.
The conflict has sparked calls within Europe to phase out its reliance on Russian energy, but over the course of the decade.
Unnatural gas prices
EU natural gas prices surge:
Russia’s invasion of Ukraine sent natural gas prices in Europe
soaring and added to already high prices
amid an energy crisis on the continent.
3
4
5
$6 per million British thermal units
50
100
150
200
€250 per megawatt-hour
European natural gas pricesU.S. natural gas prices
J F MJ F M
AP
Yum China (YUMC)
$34 $7052-WEEK RANGE
Total return 1-yr 3-yrs* 5-yrs*
Div. yield: 1.3% Dividend: $0.48 *annualized Source: FactSet
Price-earnings ratio: 16(Based on past 12-month results)
Monday’s close: $36.55, -0.93
Yum China Holdings fell to its lowest price in more than three years on Monday after the operator of KFC and Pizza Hut in China said a coronavirus outbreak there will drag down its first-quarter results.
Yum China, a separate company from Yum Brands, said the omicron outbreak in the economically important regions of Guangdong, Shanghai, Shandong and Jilin has caused the government to impose
stricter preventive health and containment measures. Shanghai-based Yum China said same-store sales
fell 4% in January and February and 20% in the first two weeks of March.
“We are staying vigilant to ensure the health and safety of our employ-ees and customers,” said Yum China CEO Joey Wat. “We will keep our restaurants open and provide food services to customers wherever it is possible and safe to do so.”
Yuck
YUMC -39.7% -4.3% 7.7%
CompanySpotlight
Advanced 706Declined 1781New Highs 30New Lows 453
Vol. (in mil.) 4,967Pvs. Volume 4,431
5,3044,870
8702640
25676
NYSE NASDDOW 33,395.59 32,818.16 32,945.24 +1.05 ...% s t t -9.34%DOW Trans. 15,461.25 15,002.57 15,131.09 -101.88 -0.67% s s t -8.18%DOW Util. 987.38 970.62 976.73 -1.95 -0.20% t s s -0.41%NYSE Comp. 15,914.28 15,637.45 15,694.35 -59.35 -0.38% t t t -8.56%NASDAQ 12,917.90 12,555.37 12,581.22 -262.59 -2.04% t t t -19.58%S&P 500 4,247.37 4,161.72 4,173.11 -31.20 -0.74% t t t -12.44%S&P 400 2,591.30 2,535.63 2,547.15 -23.61 -0.92% s t t -10.37%Wilshire 5000 42,638.03 41,738.69 41,850.27 -455.36 -1.08% t t t -13.64%Russell 2000 1,983.43 1,932.71 1,941.72 -37.95 -1.92% t t t -13.52%
HIGH LOW CLOSE CHG %CHG WK MO QTR YTDSTOCKS RECAP
4,000
4,200
4,400
4,600
4,800
S MO N D J F
4,120
4,280
4,440 S&P 500Close: 4,173.11Change: -31.20 (-0.7%)
10 DAYS
32,000
33,000
34,000
35,000
36,000
37,000
S MO N D J F
32,560
33,380
34,200 Dow Jones industrialsClose: 32,945.24Change: 1.05 (flat)
10 DAYS
Today
AP
Inflation barometerThe Labor Department delivers its monthly index of U.S. wholesale prices today.
Economists expect the producer price index, which measures price pressures before they reach consumers, rose a seasonally adjusted 0.9% last month after rising 1% in January. In a further sign of ongoing inflationary pressures, inflation at the wholesale level surged 9.7% in January from a year earlier, just below an all-time high annual gain of 9.8% recorded in both Novem-ber and December.
Manufacturing surveyThe latest monthly snapshot of a key gauge of U.S. manufacturing activity is expected to show an increase.
Economists predict the Federal Reserve Bank of New York’s Empire State Manufacturing Index, which is due out today, jumped to 7.5 this month. That would follow a reading of 3.1 in February. Any reading over zero signals growth. Economists track the index because it provides a first look at the health of U.S. manufacturing each month.
Solid footingFootwear company Caleres serves up its latest quarterly report card today.
Wall Street expects the company’s fourth-quarter earnings and revenue increased from a year earlier, capping a solid fiscal year. Caleres, whose portfolio of footwear brands includes Dr. Scholl’s Shoes, FrancoSarto and Famous Footwear, benefited last year from strong sales growth, especially in its Famous Footwear line, which helped drive record profits in the third quarter.
Producer price indexseasonally adjusted percent change
0.0
0.2
0.4
0.6
0.8
1.0%
FJDNOS
est. 0.9
Source: FactSet
1.0
0.5
’21 ’22
0.4
Source: FactSet
Empire state indexseasonally adjusted
-10
0
10
20
30
40
MFJDNO
est.7.5
3.1
19.8
30.9
0.7
0.9
31.9
-0.7
’21 ’22
NET 1YRTREASURIES LAST PVS CHG AGO
3.253.253.25
.13
.13
.13
PRIMERATE
FEDFUNDS
LAST6 MO AGO1 YR AGO
3-month T-bill .46 .40 +0.06 .04
6-month T-bill .86 .76 +0.10 .06
52-wk T-bill 1.23 1.18 +0.05 .09
2-year T-note 1.87 1.75 +0.12 .14
5-year T-note 2.10 1.96 +0.14 .85
7-year T-note 2.16 2.01 +0.15 1.30
10-year T-note 2.14 2.00 +0.14 1.63
30-year T-bond 2.47 2.36 +0.11 2.40
Interestrates
The yield on the 10-year Trea-sury note rose to 2.14% Mon-day. Yields af-fect rates on mortgages and other consumer loans.
Crude Oil (bbl) 103.01 109.33 -5.78 +37.0Ethanol (gal) 2.16 2.16 ... +1.1Heating Oil (gal) 3.28 3.42 -4.13 +40.7Natural Gas (mm btu) 4.66 4.72 -1.42 +24.9Unleaded Gas (gal) 3.17 3.31 -4.32 +42.2
FUELS CLOSE PVS %CHG %YTD
Gold (oz) 1959.60 1982.70 -1.17 +7.2Silver (oz) 25.24 26.11 -3.30 +8.2Platinum (oz) 1052.30 1088.60 -3.33 +9.1Copper (lb) 4.51 4.62 -2.24 +1.3Palladium (oz) 2412.20 2792.90 -13.63 +26.4
METALS CLOSE PVS %CHG %YTD
Cattle (lb) 1.40 1.37 +2.20 +1.0Coffee (lb) 2.20 2.22 -1.49 -2.9Corn (bu) 7.26 7.65 -5.10 +22.3Cotton (lb) 1.19 1.21 -1.87 +5.5Lumber (1,000 bd ft) 1410.00 1420.00 ... +22.8Orange Juice (lb) 1.42 1.39 +2.02 -3.3Soybeans (bu) 17.05 16.91 +0.84 +28.3Wheat (bu) 10.96 10.90 -0.94 +42.2
AGRICULTURE CLOSE PVS %CHG %YTD
CommoditiesEnergy prices slumped. U.S. crude oil lost 5.8% and natu-ral gas fell 1.4%. Whole-sale gasoline and heating oil prices closed more than 4% lower. Gold and silver prices fell.
ForeignExchange
The U.S. dollar strengthened against the British pound, the Japanese yen and the Swiss franc. The greenback fell versus the euro and the Mexican peso.
USD per British Pound 1.3017 -.0021 -.16% 1.3924Canadian Dollar 1.2826 +.0100 +.78% 1.2468USD per Euro 1.0957 +.0047 +.43% 1.1950Japanese Yen 118.11 +.77 +.65% 109.06Mexican Peso 20.9122 -.0291 -.14% 20.7020
1YRMAJORS CLOSE CHG %CHG AGO
Israeli Shekel 3.2829 +.0321 +.98% 3.3279Norwegian Krone 9.0431 +.0512 +.57% 8.4280South African Rand 15.1118 +.0670 +.44% 14.9429Swedish Krona 9.6153 -.1168 -1.21% 8.4872Swiss Franc .9378 +.0029 +.31% .9296
EUROPE/AFRICA/MIDDLE EAST
Australian Dollar 1.3901 +.0193 +1.39% 1.2891Chinese Yuan 6.3654 +.0256 +.40% 6.5085Hong Kong Dollar 7.8298 +.0011 +.01% 7.7639Indian Rupee 76.546 -.147 -.19% 72.672Singapore Dollar 1.3668 +.0038 +.28% 1.3442South Korean Won 1241.46 +3.84 +.31% 1136.36Taiwan Dollar 28.54 +.12 +.42% 28.22
ASIA/PACIFIC
Previous and change figures reflect current trading contract.
Interestrates Commodities ForeignExchange
TODAY
Top stocks by percent change in price for the year to date. Stock must be worth $2.
NAT'L WK 6MO 1YRCONSUMER RATES AVG AGO AGO AGO
48 month new car loan 3.58 t 3.59 3.52 3.73
Money market account 0.07 t 0.08 0.07 0.08
1 year CD 0.32 r 0.32 0.28 0.29
$30K Home equity loan 6.62 s 6.51 6.49 6.44
30 year fixed mortgage 4.43 s 4.11 4.20 3.02
15 year fixed mortgage 3.57 s 3.41 3.51 2.31


![AY n/a 22.23 23.20 28.55 24.51 22.90 3.0% Euronext [NL] 16.7x … · 2018. 5. 9. · BVB inclusa in indicii: BET, BET-TR, BET-XT, BET-XT-TR, BET-BK, BETPlus. Descriere Detalii de](https://static.cupdf.com/doc/110x72/6111a7919939904f723a29c9/ay-na-2223-2320-2855-2451-2290-30-euronext-nl-167x-2018-5-9-bvb.jpg)