Wright State University Wright State University
CORE Scholar CORE Scholar
Browse all Theses and Dissertations Theses and Dissertations
2019
Leveraging Schema Information For Improved Knowledge Graph Leveraging Schema Information For Improved Knowledge Graph
Navigation Navigation
Rama Someswar Chittella Wright State University
Follow this and additional works at: https://corescholar.libraries.wright.edu/etd_all
Part of the Computer Engineering Commons, and the Computer Sciences Commons
Repository Citation Repository Citation Chittella, Rama Someswar, "Leveraging Schema Information For Improved Knowledge Graph Navigation" (2019). Browse all Theses and Dissertations. 2120. https://corescholar.libraries.wright.edu/etd_all/2120
This Thesis is brought to you for free and open access by the Theses and Dissertations at CORE Scholar. It has been accepted for inclusion in Browse all Theses and Dissertations by an authorized administrator of CORE Scholar. For more information, please contact [email protected].
LEVERAGING SCHEMA INFORMATION FORIMPROVED KNOWLEDGE GRAPH
NAVIGATION
A Thesis submitted in partial fulfillmentof the requirements for the degree of
Master of Science
by
Rama Someswar ChittellaB.Tech., GITAM UNIVERSITY, India, 2017
2019Wright State University
Wright State UniversityGRADUATE SCHOOL
July 11, 2019
I HEREBY RECOMMEND THAT THE THESIS PREPARED UNDER MY SUPER-VISION BY Rama Someswar Chittella ENTITLED LEVERAGING SCHEMA INFORMATIONFOR IMPROVED KNOWLEDGE GRAPH NAVIGATION BE ACCEPTED IN PARTIALFULFILLMENT OF THE REQUIREMENTS FOR THE DEGREE OF Master of Science.
Pascal Hitzler, Ph.D.Thesis Director
Mateen M. Rizki, Ph.D.Chair, Department of
Computer Science and Engineering
Committee onFinal Examination
Pascal Hitzler, Ph.D.
Mateen M. Rizki, Ph.D.
Yong Pei, Ph.D.
Barry Milligan, Ph.D.Interim Dean of the Graduate School

ABSTRACT
Chittella, Rama Someswar. M.S., Department of Computer Science and Engineering, Wright StateUniversity, 2019. LEVERAGING SCHEMA INFORMATION FOR IMPROVED KNOWLEDGEGRAPH NAVIGATION .
Over the years, the semantic web has emerged as a new generation of the world wide
web featuring advanced technologies and research contributions. It has revolutionized the
usage of information by allowing users to capture and publish machine-understandable data
and expedite methods such as ontologies to perform the same. These ontologies help in the
formal representation of a specified domain and foster comprehensive machine understand-
ing. Although, the engineering of ontologies and usage of logic have been an integral part
of the web semantics, new areas of research such as the semantic web search, linking and
usage of open data on the web, and the subsequent use of these technologies in building
semantic web applications have also become significant in recent times. One such research
contribution that we are going to focus on is the browsing of linked RDF data. Semantic
web advocates the methodology of linked data to publish structured data on the web. Most
of the linked data is available as browsable RDF data which is built using triples that define
statements in the form of subject-predicate-object. These triples can be tabulated by sorting
the three parts into separate columns. To browse the linked data of semantic web, several
web browsers such as CubicWeb, VisiNav and Pubby were designed. These browsers pro-
vide the users with a tabular browsing experience displaying the data in nested tables. Also,
they help users navigate through various subjects and their respective objects with the help
of links associated with them. Several other browsers such as Tabulator were developed
which enable real-time editing of semantic web resources[9] However, with the tabulated
interface, users may sometimes find it difficult to realize the relationships between the var-
ious documents. Also navigating using the links between subjects and its predicates inside
the documents is more time consuming which makes the overall user experience tedious.
To improve this, a linked data browser called Lodmilla is designed. Loadmilla provides a
iii

graph-based navigation where users can search and extract data associations that are hid-
den inside the linked data with the help of nodes. Although this method includes a better
user interface, it does not display the data that is underlying in the distinct documents. In
this paper, we illustrate the development of an interactive browser called the INKBrowser
that navigates linked data using the schema diagram of a distinct ontology. We have tried
to combine the features of both the tabular and graph-based browsers to offer a schema to
data navigation where users can find the relationships between various nodes in the graph
along with the data contained in each node. We have evaluated our tool by comparing it
with a similar browser that navigates without a schema view. In the end, we present the
adequacy of both renderings.
iv

Contents
1 Introduction 1
2 Preliminaries 52.1 Resource Description Framework(RDF) . . . . . . . . . . . . . . . . . . . 5
2.1.1 RDFS . . . . . . . . . . . . . . . . . . . . . . . . . . . . . . . . . 62.2 SPARQL . . . . . . . . . . . . . . . . . . . . . . . . . . . . . . . . . . . 132.3 Apache Jena Fuseki . . . . . . . . . . . . . . . . . . . . . . . . . . . . . . 182.4 Flask . . . . . . . . . . . . . . . . . . . . . . . . . . . . . . . . . . . . . . 192.5 The mxGraph Library . . . . . . . . . . . . . . . . . . . . . . . . . . . . . 19
3 Related Work 243.1 Browsers with Tabulated View of Linked Data . . . . . . . . . . . . . . . . 24
3.1.1 Pubby . . . . . . . . . . . . . . . . . . . . . . . . . . . . . . . . . 253.1.2 CubicWeb . . . . . . . . . . . . . . . . . . . . . . . . . . . . . . . 263.1.3 VisiNav . . . . . . . . . . . . . . . . . . . . . . . . . . . . . . . . 283.1.4 Tabulator . . . . . . . . . . . . . . . . . . . . . . . . . . . . . . . 30
3.2 Browsers with Graph-based View of Linked Data . . . . . . . . . . . . . . 313.2.1 LodMilla . . . . . . . . . . . . . . . . . . . . . . . . . . . . . . . 32
4 Research Contributions 354.1 Querying RDF Data . . . . . . . . . . . . . . . . . . . . . . . . . . . . . 354.2 Setting up a web server . . . . . . . . . . . . . . . . . . . . . . . . . . . . 364.3 Displaying the Tabulated Data on the browser . . . . . . . . . . . . . . . . 374.4 Displaying the Graph Data on the browser . . . . . . . . . . . . . . . . . . 38
5 Evaluation 415.1 Evaluation Design: . . . . . . . . . . . . . . . . . . . . . . . . . . . . . . 415.2 Results: . . . . . . . . . . . . . . . . . . . . . . . . . . . . . . . . . . . . 44
5.2.1 Time used for navigation . . . . . . . . . . . . . . . . . . . . . . . 445.2.2 The Correctness of tool . . . . . . . . . . . . . . . . . . . . . . . . 45
6 Conclusion 47
v

Bibliography 49
vi

List of Figures
2.1 Example of RDF Graph . . . . . . . . . . . . . . . . . . . . . . . . . . . . 62.2 RDFS vocabulary for ”Programmes Ontology” . . . . . . . . . . . . . . . 82.3 Graph for RDF/XML example . . . . . . . . . . . . . . . . . . . . . . . . 112.4 The RDF/XML description of the graph . . . . . . . . . . . . . . . . . . . 122.5 Sample HTML code of Alice’s contact information . . . . . . . . . . . . . 132.6 RDFa rendering of Alice’s contact information . . . . . . . . . . . . . . . 132.7 Sample Turtle Syntax. . . . . . . . . . . . . . . . . . . . . . . . . . . . . . 142.8 Sample N-Triples Syntax . . . . . . . . . . . . . . . . . . . . . . . . . . . 142.9 Sample RDF/JSON Syntax . . . . . . . . . . . . . . . . . . . . . . . . . . 152.10 Sample SELECT Query. . . . . . . . . . . . . . . . . . . . . . . . . . . . 152.11 Sample CONSTRUCT Query. . . . . . . . . . . . . . . . . . . . . . . . . 152.12 Sample ASK Query. . . . . . . . . . . . . . . . . . . . . . . . . . . . . . . 162.13 Sample DESCRIBE Query. . . . . . . . . . . . . . . . . . . . . . . . . . . 162.14 Sample INSERT Query. . . . . . . . . . . . . . . . . . . . . . . . . . . . . 162.15 Sample CREATE Query. . . . . . . . . . . . . . . . . . . . . . . . . . . . 172.16 Sample COPY Query. . . . . . . . . . . . . . . . . . . . . . . . . . . . . . 172.17 Sample Move Query. . . . . . . . . . . . . . . . . . . . . . . . . . . . . . 182.18 Sample DELETE Query. . . . . . . . . . . . . . . . . . . . . . . . . . . . 182.19 Sample CLEAR Query. . . . . . . . . . . . . . . . . . . . . . . . . . . . . 192.20 Sample DROP Query. . . . . . . . . . . . . . . . . . . . . . . . . . . . . . 192.21 The Jena Text Query of Fuseki Server. . . . . . . . . . . . . . . . . . . . . 202.22 Simple Hello World Program in Flask. . . . . . . . . . . . . . . . . . . . . 212.23 The mxGraph Architecture . . . . . . . . . . . . . . . . . . . . . . . . . . 212.24 Simple ”Hello World” program using mxGraph Library. . . . . . . . . . . . 222.25 Simple ”Hello World” program using mxGraph Library. . . . . . . . . . . . 222.26 Output of the ”Hello World” program. . . . . . . . . . . . . . . . . . . . . 23
3.1 The Architecture of Pubby. . . . . . . . . . . . . . . . . . . . . . . . . . . 253.2 Sample dataset containing information about Alice. . . . . . . . . . . . . . 263.3 Configuration of Pubby. . . . . . . . . . . . . . . . . . . . . . . . . . . . . 263.4 Result of a query on pubby server. . . . . . . . . . . . . . . . . . . . . . . 273.5 Navigation in pubby after a link temperature result is selected . . . . . . . . 273.6 View of ”Semantic Web Programs” dataset in CubicWeb Browser . . . . . 28
vii

3.7 Data viewed after we click on a link in ”semantic web program” dataset . . 283.8 Performing Keyword Search on VisiNav Browser . . . . . . . . . . . . . . 293.9 Object focus on VisiNav Browser . . . . . . . . . . . . . . . . . . . . . . . 303.10 Performing Facet Specification on VisiNav Browser . . . . . . . . . . . . 313.11 Performing Path Traversal on VisiNav Browser . . . . . . . . . . . . . . . 323.12 Tabulator extension . . . . . . . . . . . . . . . . . . . . . . . . . . . . . . 333.13 LodMilla Browser . . . . . . . . . . . . . . . . . . . . . . . . . . . . . . . 343.14 Associated links of the selected node on LodMilla Browser . . . . . . . . . 34
4.1 SPARQL query in Fuseki. . . . . . . . . . . . . . . . . . . . . . . . . . . 364.2 Sample SPARQL query in Flask. . . . . . . . . . . . . . . . . . . . . . . . 374.3 The format of a CSV file. . . . . . . . . . . . . . . . . . . . . . . . . . . . 394.4 The tabular and graph based views on INKBrowser. . . . . . . . . . . . . . 40
5.1 The Architecture of Pubby. . . . . . . . . . . . . . . . . . . . . . . . . . . 42
viii

List of Tables
5.1 Questions for Evaluation . . . . . . . . . . . . . . . . . . . . . . . . . . . 435.2 Average and standard deviation of time(in seconds), number of clicks(mouse),
and correctness score per each category of questions. . . . . . . . . . . . . 44
ix

AcknowledgmentTo Dr. Pascal Hitzler and my peers at DASE lab. Thank you for all your support and en-
couragement. I could not have accomplished this without your help.
To Cogan Shimizu, Jitendra Satpathy, and Bharagava Charan for always believing in me
and giving me the right push.
To my parents,my sister and my brother-in-law, I could not have asked for anything better.
Whatever Iam today is only because of you. Thank you for your love and support.
x

Dedicated to my paternal grandparents, Mr CHITTELLA SOMESWARA RAO and Mrs
CHITTELLA SUBBALAKSHMI for always being with me and giving me the right kind of
encouragement to reach my goals and succeed. Thank you.
xi
1
Introduction
The World wide web as illustrated by many scientists is a universal paradigm for sharing
information. Initially, it was conceptualized to provide a space for sharing information,
but as time advanced the web had to undergo many transitions. In the initial stages, the
web was just a human-human interaction tool that would display only static documents.
Later, a dynamic read-write version of the web called the web 2.0 has evolved facilitating
a standardized communication between the user and the web. Web 2.0 marked a major
transference in the development and usage of web pages. One of the most important char-
acteristics of the web is its universality[22] . When Tim-Berners-Lee created the world
wide web, he stated that ”The web has to be accessible to everyone regardless of disabil-
ity”. A more ”smarter web” which would make the meaning and understanding of web
resources explicit so that machines can process and integrate web resources intelligently
is called Semantic Web is known as the Web 3.0 The main goal of the semantic web is
to provide a platform for computers where they can manipulate information just like how
humans do to make the web more ”machine-processable”. To create a space that could
simplify the usage of machine-readable content researchers have come up with certain ap-
proaches which include Meta-data tags, Taxonomies, Ontologies, and Controlled Vocab-
ularies. Depending on the pros and cons of all these approaches, ontologies are widely
1

used as it supports much more logical flexibility compared to others. An ontology specifies
relevant domain concepts, properties, and possible relationships thus providing support for
the processing of resources based on the meaningful interpretation of content rather than
the physical structure of a resource[21]. An ontology simplifies the concepts and enhances
them with metadata making it easy for machines to understand. Briefly, ontology is a
medium of knowledge representation which can extend over several domains in web data.
To build ontologies, there are several machine-readable formalisms, that are defined ac-
cording to some semantic web specifications and these formalisms are called the ontology
languages or knowledge representation languages. The World Wide Web Consortium has
defined several of these languages some of which are widely such as Resource Description
Framework(RDF), Rule Interchange Format(RIF) and the Web Ontology Language(OWL).
The process of using the ontology languages to study and represent the conceptual-
izations of various domains and their relationships is called ontology engineering. This
consists of a set of activities that concern the ontology development process, the ontology
lifecycle, the construction of a schema diagram for an ontology and other methodologies
for building ontologies[13]. In this thesis, we are more concerned with the schema diagram
and the RDF language that is used to build the ontologies.
As we have already discussed, the world wide web is a global information space con-
taining many linked documents. There is a lot of raw data on the web that is secured within
the hypertext documents. This data in HTML is merged with the surrounding text making
it difficult for software applications to extract structured data. To publish and connect struc-
tured data on the web, the idea of linked data came into existence. Linked data provides a
way of interlinking structured data on the web making the large-scale integration of data
on the web feasible. To achieve this, linked data requires a mechanism that is rendered by
the Resource Description Framework(RDF). RDF connects all the things in the world such
as people, locations etcetera using several links. These links do not just connect the data
but they also describe the entities in the data.
2

Using this principle of RDF linked data, many linked data browsers are already devel-
oped. These browsers enable users to navigate between different data sources by following
the RDF links. These browsers navigate using RDF links through a certain endpoint. These
browsers are mostly based on providing a tabulated view of the data while navigation. One
such browser is CubicWeb[1] which navigates from one link to a specified link and returns
the data available at that particular link. There are tools such as pubby which provide a
linked data interface to a SPARQL protocol server[11] and also act as a web browser to
navigate linked data. Apart from these, there is a browser called LodMilla which inte-
grates the usage of a graph to navigate linked data. In this browser, the data is represented
as nodes. Users can search and extricate the various relationships between data using the
nodes. Lodmilla also enables users to edit and add new information inside each node.
However, these browsers offer either a tabulated view of the data or the graph-based
navigation of the data. So, to explore a different way to extract knowledge, we aspired
to find a methodology of extracting data, and browsing of the web by using the schema
diagram of an ontology. With this method, we are enabling our system to offer navigation
of data using both the views. Before we advance further, this is the research hypothesis for
the thesis that we tried to prove:
Hypothesis:
• Including a schema diagram of an ontology allows a user to navi-
gate large datasets more efficiently and quickly.
In this paper, our main concern is to optimize schema information for enhanced nav-
igation of large datasets. To achieve this, we deployed the use of a schema diagram of an
ontology that is in the form of a graph with nodes and edges. We have tried to use the data
avaialable from different files by uploading them on a SPARQL endpoint called Apache
Jena Fuseki and display these files with the help of a flask server. As of now, our tool can
be accessed only through the github[3]. However, in the future, we are trying to integrate
3

it as an extension to the currently available browsers.
Chapter Overview
The rest of the thesis is organized as follows.
Chapter 2: Preliminaries Contains fundamental definitions to provide a brief Overview
of RDF, SPARQL, Apache Jena Fuseki, Flask, and Mxgraph Libraries.
Chapter 3: Related Work Elaborates earlier and contemporary attempts to browse linked
data. In this chapter we talk about the pros and cons of these tools and our motivation be-
hind designing an updated browser.
Chapter 4: Research Contributions Explains the design principle behind how the tool
operates in order to navigate using a schema diagram.
Chapter 5: Evaluation Presents the methodologies followed for the evaluation of the
tool. Show a comparative study
Chapter 6: Conclusion: We talk about future improvements in the browser and conclude
the paper.
4

2
Preliminaries
In this section, we are going to elaborate on some of the relevant concepts related to our
thesis.
2.1 Resource Description Framework(RDF)
Resource Description Framework(RDF) is a semantic data modeling language which pro-
vides methodologies for describing a resource and representing information in the web.
RDF connects one data resource with another based on properties and values. RDF ensures
the connections to be described explicitly by the user thereby making other RDF applica-
tions to discover more data[15]. This makes data more reusable. The connections between
these data resources are generally referred to as RDF links. These RDF links can be set
up between data obtained from different sources. The relationship between any of the two
RDF links or resources is often referred to as triples. So the description of a resource is
represented as a number of triples. A triple has a subject-predicate-object structure. A
triple reflects the fundamental structure of a simple sentence such as : Elon Musk owns
Tesla Subject predicate object The subject of the triple refers to the URI identifying the
resource. The object is another URI resource that is related to the subject in some way. The
5

predicate shows the kind of relation that exists between the subject and the object. These
triples can be modeled into a graph comprising of two nodes connected by a direct edge.
These graphs are called the RDF graphs and are also known as Knowledge graphs. The
two nodes represent the subject and the object and the edge represents the predicate.
Figure 2.1: Example of RDF Graph
Over the web, the users can look up any URI in an RDF graph to retrieve additional
information. By using the URIs as global identifiers, the RDF data model enables users to
refer to anything at a global scale.
2.1.1 RDFS
As we have already mentioned, RDF is a semantic web standard which provides an abstract
data model that is used to describe resources in the form of triples. It somehow does not
provide any domain-specific terms, to describe things in the real world as classes or the
relation between them. This function is served by the RDF Schema is also known as RDFS.
The RDFS provides the semantic information necessary for a computer system or agent to
understand the schema. It allows developers to define a distinct vocabulary for RDF data
and specify the kind of objects to which these attributes can be applied[12].
6

Classes and Properties in RDFS
The two basic classes defined by the RDFS language are rdfs:Class which is the class of
resources and rdfs:Property which is the class of all RDF properties. The sample RDF
classes are as follows:
• rdfs:Resource- the class resource, that describes everything.
• rdfs:Literal- the class of literal values, e.g. strings and integers.
• rdfs:Class- the class of resources of RDF classes
• rdfs:Datatype- the class of RDF datatypes
• rdfs:Container- the class of RDF containers
The sample RDFS properties are as follows:
• rdfs:subClassOf the subject is a subclass of a class
• rdfs:subPropertyOf the subject is a subproperty of a property
• rdfs:domain a domain of the subject property
• rdfs:range a range of the subject property
• rdfs:label a human-readable name for the subject
• rdfs:comment a description of the subject resource
• rdfs:member a member of the subject resource
• rdfs:seeAlso further information about the subject resource
The code in figure 2.2 shows the sample RDFS vocabulary for describing TV productions[15]
which duplicates the ”Programmes Ontology” developed at the BBC.
The primitives of RDFS languages are given in two separate namespaces:
7

Figure 2.2: RDFS vocabulary for ”Programmes Ontology”
• The http://www.w3.org/2000/01/rdf-schema namespace is associated with the rdfs:
namespace prefix.
• The http://www.w3.org/1999/02/22-rdf-syntax-ns namespace is associated with the
rdf: namespace prefix.
Annotations is RDFS
For annotating resources in RDFS, two main properties are defined which are as follows:
• rdfs:label: It is used to give a human-readable name for a resource.
8

• rdfs:comment: It is used to give a human-readable description for a resource.
Usage of these properties is recommended as many Linked Data Applications these while
displaying data.
Relationship between Classes and Properties
RDFS also helps in describing the relationship between classes and properties by providing
certain primitives which are as follows[15]
• rdfs:subClassOf is used to imply that all the instances of one class are also instances
of another.
• rdfs:subPropertyOf is used to state that resources that are related by one property are
also related by another.
• rdfs:domain is used to state that any resource with a given property can be an instance
of one or more classes.
• rdfs:range is used to state that all values of one property can be instances of one or
more classes.
With the help of these primitives, the author of an RDFS vocabulary can define rules
which allow information to be extracted from the RDF graphs. This can elucidate the
management of data in linked data applications respectively.
Serialization formats in RDFS
Since RDF is a data model and not a data format, the RDF graph which consists of the
subject-predicate and object triples needs to be serialized first, before it is published on the
web. This means that the triples are taken from the RDF graph and written to a particu-
lar file using a particular syntax. W3C has standardized two RDF serialization formats-
9

RDF/XML and RDFa which are widely used. Apart from these several other serialization
formats are also used which are discussed below, with a sample code.
RDF/XML
RDF/XML is a standard W3C format which expresses an RDF graph in the form of an
XML document. The RD F graph is a set of RDF triples where each triple contains a
subject node, predicate and object node. Each node has an IRI or literal and blank nodes
are given a blank node identifier. Predicates are directed arcs which are labeled with a
specific IRI depending on the relationship between the two nodes. In order to encode these
RDF graphs in XML, the nodes and the predicates are represented in XML terms which are
element names, attribute names, element contents, and attribute values[7]. IRIs identifying
the subject and object nodes are stored as XML attribute values. As we are aware, a graph
has a certain path which starts from a form node, a predicate arc, node. The RDF/XML
syntax converts these into a series of alternative elements inside elements between nodes
and their predicate arcs. The figure 2.3 shows a graph for RDF/ XML example.
In the graph shown in figure 2.3, the nodes represented as ovals contain their IRIs
inside them, the predicate arcs are labeled with their IRIs and the rectangles represent the
string literal nodes. After we add all the elements and attributes, the complete RDF/XML
description of this graph is shown in figure 2.4:
Although RDF/XML format is widely used for serialization of graphs, this syntax is
observed to be difficult for humans to read and write and therefore, several other serializa-
tions are also considered.
RDFa
RDFa is also recognized by W3C as a standard serialization format. RDFa makes use of
XHTML attributes to mark up human-readable data with machine-readable indicators for
10

Figure 2.3: Graph for RDF/XML example
browsers and other programs to interpret[6]consequently making the web exposed to the
structured data. The RDF data is interlinked within the Document Object Model(DOM)
of the HTML. The sample HTML code about a person called Alice displaying contact
information on her blog is shown in figure 2.5
The RDFa rendering of the code in figure 2.5 is represented in figure 2.6
Turtle
The turtle syntax allows writing down an RDF graph in a compact textual form[8]. It is one
of the most popular RDF serialization formats for reading RDF triples. The syntax of the
turtle is similar to that of SPARQL. Usually, in RDF, the subject, predicate and the object
are represented as URIs. Turtle helps to abbreviate the URIs by taking out the common
portions of these URIs. For example, the graph that is represented in figure 2.3 can be
11

Figure 2.4: The RDF/XML description of the graph
translated into Turtle syntax as shown in figure 2.7
N-Triples
N-triples is a simpler text serialization format for RDF graphs which is a subset of the Turtle
format. N-Triples triples are a sequence of RDF terms representing the subject-predicate
and object of an RDF Triple[8]. N-Triple files are parsed one line at a time thus, making
the loading of large data files easy. The N-triples translation of the graph in figure 2.3 is
shown in figure 2.8
RDF/JSON
RDF/JSON serializes a set of RDF triples in a JSON (Javascript Object Notation) format.
Each RDF/JSON document consists of a single JSON object called the root object[4]. The
subjects in the set of triples are represented as a key in these root objects. The sample
RDF/JSON code of two triples that have the same subject and predicate but a different
12

Figure 2.5: Sample HTML code of Alice’s contact information
Figure 2.6: RDFa rendering of Alice’s contact information
object is shown is figure 2.9
2.2 SPARQL
There are several RDF graph datasets that are available to draw information and we need
a language which would support the querying of these large number of datasets just like
how SQL is used to obtain information from relational databases. SPARQL, short for
”SPARQL Protocol and RDF Query Language” is a W3C standard semantic query lan-
guage that is used to manipulate and retrieve the data stored in RDF format[19]. SPARQL
helps us extract structured and semi-structured data by querying unknown relationships and
dissimilar databases with a simple query. The main principle behind design the SPARQL
13

Figure 2.7: Sample Turtle Syntax.
Figure 2.8: Sample N-Triples Syntax
language is to let the develops extract the data they require irrespective of the organization
of a database. Also, the combination of different SPARQL queries can be used to access
multiple endpoints.
The SPARQL query is executed against a set of serialized RDF datasets. These queries
are executed in a SPARQL endpoint. An endpoint can query specific datasets and the web-
accessible RDF data as well. These endpoints return results through HTTP. The results of
the queries are rendered in XML, JSON, RDF, and HTML. The SPARQL query is written
in the form of a triple pattern, which is, a separated list of the subject, predicate, and an
object. The solution to a query can be found by matching the patterns in it, to the triples in
the dataset that it queries against. SPARQL has four standard types of queries which are as
follows:
SELECT- It is used to return a set of variables inside a dataset. SELECT * is used to
return all the variables inside a query.
14

Figure 2.9: Sample RDF/JSON Syntax
Figure 2.10: Sample SELECT Query.
CONSTRUCT- It is used to return an RDF graph that is formed by replacing the values
of the variables in the graph with values mentioned in the query.
Figure 2.11: Sample CONSTRUCT Query.
ASK- It is used to ask to check whether there is a match to the query pattern in the
datasets.
DESCRIBE- It is used to get the information about any resource inside the RDF
15

Figure 2.12: Sample ASK Query.
Figure 2.13: Sample DESCRIBE Query.
dataset. Example:
Apart from these, there are other query types that are defined as follows:
INSERT- It used to add information to the dataset that is queried upon either explicitly
or with predefined conditions.
Figure 2.14: Sample INSERT Query.
CREATE- It is used to create a new empty graph.
COPY- It is used to copy the sentences and variables from one RDF graph datasets to
another.
MOVE- It is used to move the sentences in RDF from one dataset to another. The
source dataset and its sentences are permanently removed after they are moved to the target
dataset.
16

Figure 2.15: Sample CREATE Query.
Figure 2.16: Sample COPY Query.
DELETE- It is used to remove specific sentences from the target RDF graph datasets.
CLEAR- It is used to remove all the sentences in a specified named dataset which will
eventually return an empty dataset.
DROP- It is used to remove a dataset entirely from the DBMS or triplestore.
SPARQL can be used to match a wide range of graph datasets, thus extracting infor-
mation from data stored in various formats. Also, there are several extensions of SPARQL
such as the GeoSPARQL which can be used to query geospatial data on the semantic
web[18]. SPARUL is another extension to SPARQL language which can insert, delete and
update the RDF data contained in a triple store[?]. Apart from these, there is also an online
SPARQL endpoint known as the Virtuoso SPARQL endpoint[?] which provides SPARQL
query processing for the RDF data that is available on the open internet.It provides sev-
eral HTTP request methods and parameters with the corresponding Response codes and
formats. A Virtuoso SPARQL endpoint is used by many developers to test the SPARQL
queries and its results.
17

Figure 2.17: Sample Move Query.
Figure 2.18: Sample DELETE Query.
2.3 Apache Jena Fuseki
Apache Jena Fueski[17] is an open source framework which is used for querying RDF data
model using SPARQL and also build semantic web applications. Just like how a Virtuoso
SPARQL editor creates an endpoint for SPARQL querying on the open web, Fuseki is a
standalone SPARQL server that can be run from a command line. Fuseki server can be
used to run SPARQL queries using HTTP requests and the response is rendered in various
formats such as JSON, XML, and CSV. Different types of RDF graph datasets can be
loaded into the fuseki by uploading the files in each dataset. Fuseki server provides an
online SPARQL editor called Jena text query which can be used to query the particular
datasets that exist on the server.
We can find more information about the installation of Apache Jena Fueski in the
documentation available online.
18

Figure 2.19: Sample CLEAR Query.
Figure 2.20: Sample DROP Query.
2.4 Flask
FLASK[20] is a free and open source framework for Python that is used to develop web
applications. Since it does not require a specific set of tools or libraries, it is classified as a
microframework. Flask provides extensions such as Admin, Bcrypt, Dashed to enhance the
features that the users desire. Flask is based on Pocoo projects Werkzeug and Jinja2. While
werkzueg is utility library for the Python programming language, Jinja2 is a templating
engine.
The code in figure 2.22 when saved on a file called app.py and run with the command
python app.py command, shows Hello World! on a localhost port 5000 in a web browser.
2.5 The mxGraph Library
The mxGRAPH[2] is a diagramming library that is based on javascript which enables users
to develop interactive graph applications. The mxGraph package contains software on
client side written in javascript, with a backend that supports various programming lan-
guages. This client software which is a graph component is integrated into a web applica-
tion and run on a web server. The backends can also be embedded into the existing server
in any one of the programming languages supported by it.
19

Figure 2.21: The Jena Text Query of Fuseki Server.
A simple hello world program using the mxGraph library with comments is as follows:
The output of the code is as follows:
20
Figure 2.22: Simple Hello World Program in Flask.
Figure 2.23: The mxGraph Architecture
21

Figure 2.24: Simple ”Hello World” program using mxGraph Library.
Figure 2.25: Simple ”Hello World” program using mxGraph Library.
22

Figure 2.26: Output of the ”Hello World” program.
23

3
Related Work
Linked data has extended the current web as a global data space connecting data from di-
verse areas like include books, people, scientific data, music and numerous other domains.
This web of data has enabled the developers to come up with advanced applications such
as the linked data browsers which allow users to navigate following the links represented
as RDF triples. These links connect one data source to its other related data sources[10].
Taking the current state of the art into consideration, these linked data browsers are catego-
rized into two main types depending on the way they represent linked data while navigating
through the RDF links.
• Browsers with Tabulated View of Linked Data.
• Browsers with Graph-based View of Linked Data.
3.1 Browsers with Tabulated View of Linked Data
In this type of browsers, the three parts of a triple are sorted and grouped into separate
columns. Some of these browsers use a Linked Data client library which supports traversal
of linked data and others use a SPARQL Client library which accesses SPARQL endpoints
with the help of an API[?]. Some of the examples are as follows:
24

3.1.1 Pubby
Pubby[11] is a java web application which is used to map the URIs that identify RDF
resources to a dereferenceable URIs in a SPARQL dataset. The pubby server which is set
up for a SPARQL endpoint essentially creates a Linked Data interface to the RDF data
sources.The Figure 3.1 shows the architecture of pubby.
Figure 3.1: The Architecture of Pubby.
When the pubby server is run on a SPARQL endpoint, its loads an RDF file from
the given dataset, it takes the original URI and requests for mapped URI, passing back the
results to the client. Also, pubby can access data from multiple datasets. Usually, Apache
Jena Fuseki is commonly used as SPARQL endpoint to upload the datasets.
Apart from being a linked data server, one of the major functionalities of pubby is that
it also an RDF browser. Pubby imparts a user interface which allows browsing of an RDF
dataset by following the links between resources. For example, if we have a dataset with
IRIs which contains information about a person called Alice working for an organization,
called ”Inc”, is shown in Figure 3.2
25

Figure 3.2: Sample dataset containing information about Alice.
If we want to browse linked data out from the dataset, Pubby is run as a web appli-
cation on a local tomcat server with a base ¡http://localhost:8080/¿. The configuration for
pubby is shown in Figure 3.3
Figure 3.3: Configuration of Pubby.
We tried to run a Pubby server with a dataset called temperature result that we have.
The result of a query can be viewed on the server as shown in Figure 3.4:
When the first link temperature result is selected, we are navigated to its page as shown
in Figure 3.5:
3.1.2 CubicWeb
CubicWeb[1]is a web application framework that is written in Python. It features a web
engine and a data server.The data server is used to publish data generated from different
26

Figure 3.4: Result of a query on pubby server.
Figure 3.5: Navigation in pubby after a link temperature result is selected
sources like the RQL databases, VCS repositories or other servers of the CubicWeb. Its web
browser is used to allow the user to navigate, select, modify the content of the data sources
and display the results with the appropriate rendering. In this way, cubicweb ensures the
display of both the documents and data. Cubicweb provides a configuration to display data
in a browser that is obtained from a web server. CubicWeb can be added as an extension
in both Chrome and Firefox browsers respectively. Several tabulated views are offered to
display data in HTML. The sample HTML view of the data from the server-rendered in
HTML for a ”Semantic Web Programs” dataset is shown in Figure 3.6
27

Figure 3.6: View of ”Semantic Web Programs” dataset in CubicWeb Browser
If we click on the link mentioned in figure 3.6 we get all the talks in the ”semantic
web program” as shown in Figure 3.7
Figure 3.7: Data viewed after we click on a link in ”semantic web program” dataset
3.1.3 VisiNav
Visinav[14] is a web browser that is based on visual search and navigation over linked
datasets. One of the main principles that VisiNav follows is it operates over data rather than
28

documents which result in more detailed visualizations. Initially, the process of searching
in the VisiNav browser starts with the keyword search to locate objects. In the following
steps, the query can be improved or changed by the users according to the basis of naviga-
tion. As the system of the browser can answer queries depending on the available datasets,
the user can only search for those questions to which the system can respond. One of the
important features of the VisiNav browser is that it allows users to build queries based on
several atomic operations over the datasets which are keyword search, object focus, path
traversal and facet specification. The system offers detail, list and table views to render the
results of the queries.A VisiNav system performing the atomic operations on queries is as
follows:
Keyword Search When a person called Angela Markel is searched on the browser, the
result is shown in Figure 3.8
Figure 3.8: Performing Keyword Search on VisiNav Browser
Object Focus When ”Angela Markel” link is clicked, it displays the information re-
lated to ”Angela Markel”. If we click on an object called Germany, the country to which
29

she belongs to, the output is shown in Figure 3.9
Figure 3.9: Object focus on VisiNav Browser
Facet Specification If a particular feature of the Angela Markel such as the type:Person
is dragged and queried, the result is shown in Figure 3.10
Path Traversal If a specific predicate such as ”knows” from Tim Berners-Lee knows
Dan Brickley is selected and queried as shown in Figure 3.11
3.1.4 Tabulator
The tabulator project[5] is a data browser and editor which enables a way to browse RDF
data on the web. The tabulator project is based on javascript. The tabulator tries to select
things that the document describes and display the properties of those things in a table. The
links in the table can be followed to know more about the other things they are connected
to in the documents.It is available as a tabular extension on firefox which can be added on
the browser. It is also available as a web application which can be run on a Firefox web
30

Figure 3.10: Performing Facet Specification on VisiNav Browser
page for data browsing. When a sample document with a URI is loaded on the tabulator
extension, it is served in an outline view as shown in Figure 3.12
The things on the left side such as the ”developer” are the predicates and the things on
the right side such as ”Timothy Berners-Lee” represent the objects which have properties.
These things which are objects can be clicked with the arrow next to their label. When we
click on the arrow it will expand and give information about that particular thing.
3.2 Browsers with Graph-based View of Linked Data
A graph in a semantic web is a representation of linked data with directed, typed relation-
ships between the things described by the documents. Developers are trying to build web
browsers which navigate the linked data with a graph-based approach. However, there are
not too many tools which are built using this principle are in operation right now. There
are several prototypes such as LodLive and oobian which are not fully functional. A linked
31

Figure 3.11: Performing Path Traversal on VisiNav Browser
data browser called LodMilla was developed based on this principle which is in use right
now.
3.2.1 LodMilla
LodMilla is a graph-based linked data browser developed by MTA SZTAKI which is writ-
ten using Javascript. It supports graph views and searching over linked data. Lodmilla
represents the triples in the form of nodes and the associations with other nodes are dis-
played when a particular node is selected. Lodmilla also supports simple editing of data
inside the nodes. Lodmilla can be configured on a SPARQL endpoint to get better func-
tionality. We can search for the nodes that we want to add and query on the browser. This
search operation can be performed on different endpoints such as Dbpedia, hnm etcetera.
When we select a node called American football from Dbpedia the result will be as shown
in Figure 3.13:
The properties of the node and its associated links can be seen on the right side when
32

Figure 3.12: Tabulator extension
we click on the details of the node on the top. We can browse the associated links for this
node and add them as shown in Figure 3.14
33

Figure 3.13: LodMilla Browser
Figure 3.14: Associated links of the selected node on LodMilla Browser
34

4
Research Contributions
In order to develop a browser which could utilize the schematic data related to an ontology,
and perform efficient navigation of linked data, we have considered reviewing the following
components:
• Querying RDF Data
• Setting up a web server
• Displaying the Tabulated Data on the browser
• Displaying the Graph Data on the browser
4.1 Querying RDF Data
SPARQL is a standard querying language that is used to query large RDF datasets. In order
to run the SPARQL queries, we need to have a SPARQL endpoint. A SPARQL endpoint is a
service which exists on an HTTP network which allows us to pass queries over the network
send the result back over then network. We have used the Apache Jena Fuseki server to
create a SPARQL endpoint. After running the fuseki server we have loaded distinct RDF
datasets on the server. This now allows us to query the dataset over the network.
35

Figure 4.1: SPARQL query in Fuseki.
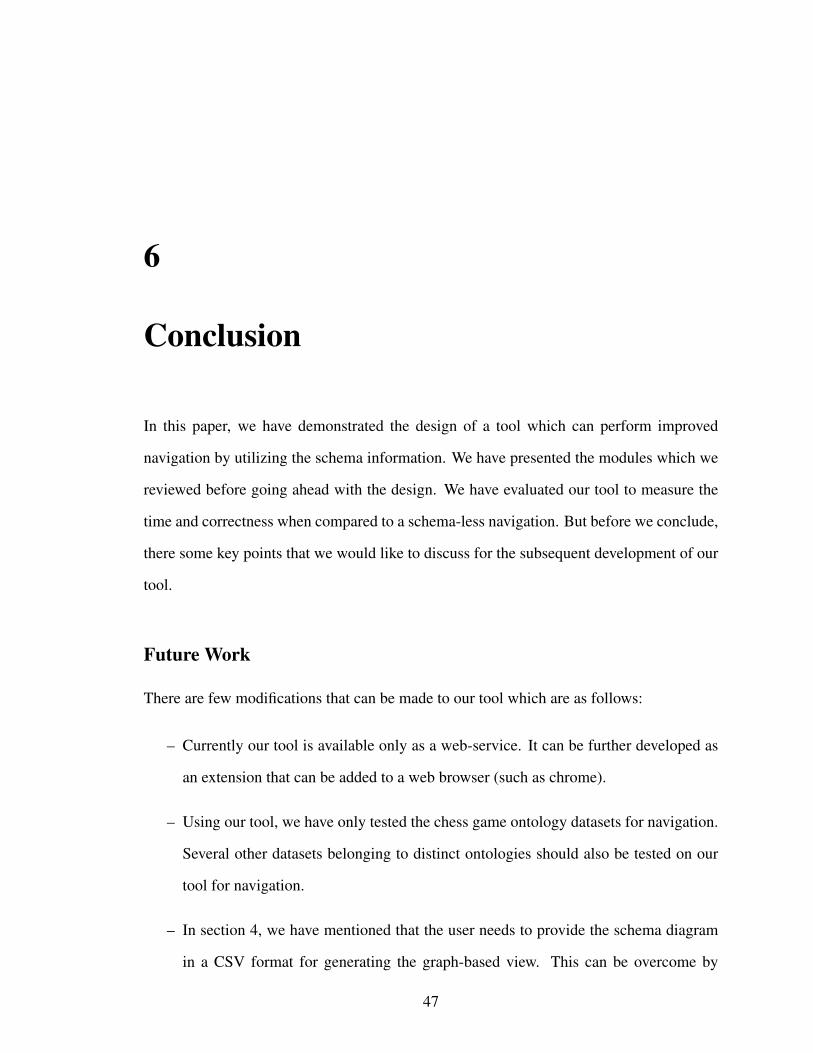
4.2 Setting up a web server
Once the SPARQL endpoint was up and running, the next challenge was to set up a web
server. In order to transfer data between the UI and the SPARQL endpoint, we need a web
server. Flask is a compact yet powerful web server that is shipped with python. While
rendering the result of a SPARQL query on a browser, we use the sparqlwrapper class in
python which can convert the result of a query to a readable data format (such as JSON).
This SPARQL query is run against the datasets we have in the fueski server. We have
configured the flask server to redirect the queries to a SPARQL endpoint. The result of this
query is returned as JSON on a webpage. JSON is parsed using a Jinja2 template. Flask
includes a technique called ”routing” which can be used to access the required page. This
helps the user to navigate to the desired page without going back to the home page every
time. In order to make the RDF data more browsable, we have created several routes to
manage different SPARQL queries.
36
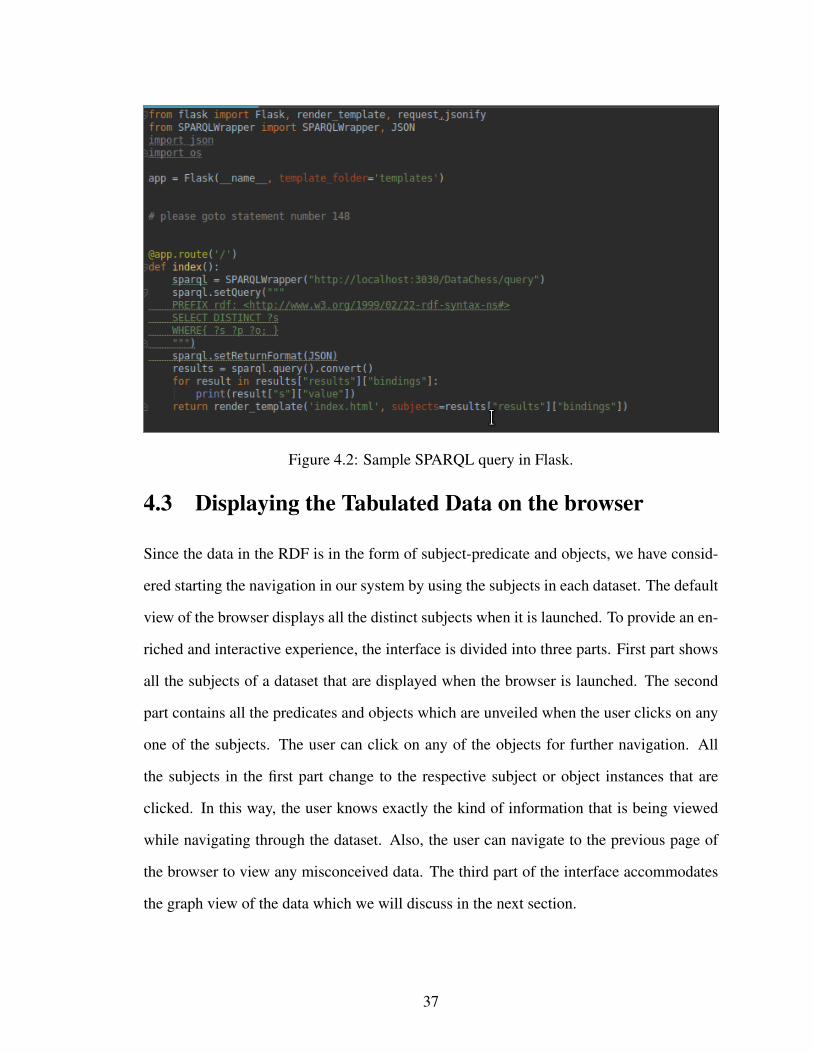
Figure 4.2: Sample SPARQL query in Flask.
4.3 Displaying the Tabulated Data on the browser
Since the data in the RDF is in the form of subject-predicate and objects, we have consid-
ered starting the navigation in our system by using the subjects in each dataset. The default
view of the browser displays all the distinct subjects when it is launched. To provide an en-
riched and interactive experience, the interface is divided into three parts. First part shows
all the subjects of a dataset that are displayed when the browser is launched. The second
part contains all the predicates and objects which are unveiled when the user clicks on any
one of the subjects. The user can click on any of the objects for further navigation. All
the subjects in the first part change to the respective subject or object instances that are
clicked. In this way, the user knows exactly the kind of information that is being viewed
while navigating through the dataset. Also, the user can navigate to the previous page of
the browser to view any misconceived data. The third part of the interface accommodates
the graph view of the data which we will discuss in the next section.
37

4.4 Displaying the Graph Data on the browser
The graph view models the RDF schema in the form of a node-edge-node composition
where a node is used to represent the subjects and the objects, and an edge represents
the predicates. This graph view of an ontology is also referred to as a schema diagram.
The schema diagram contains all the classes and properties related to the ontology. These
classes and their properties are in the form of nodes and edges. In order to model the
graph-based view for the browser, we require the schema diagram of the ontology. The
user should provide a schema file in CSV format to design and model the graph-based
view for the browser. To begin with our process, we have analyzed the different classes and
their respective properties in the ontology to format the CSV file. Then, we have studied
how the datasets contain information which belongs to a specified class on the ontology.
Till now we have only dealt with the static viewing of data. But since the graph-based
approach involves dynamic modeling, we have used mxGraph libraries which are based on
javascript. These libraries are used to model a graph based on the given input. Taking a cue
from this approach, we have developed the graph in such a way that it takes the input from
a CSV file and generates the output accordingly. The CSV file contains information related
to the schema of the dataset as shown in the figure. Our program takes the information
from this CSV file and designs an interactive graph with the nodes and edges as mentioned
in the CSV file. In this way, we get the graph model.
Following the generation of a graph, the next step we had to perform is the navigation
of data on the table view, based on the nodes that are clicked on the graph view. To achieve
this, the javascript file that was used to develop the graph is inserted into the jinja2 packag-
ing template that we employed earlier to run SPARQL queries. This functionality deploys
a graph view with all the nodes and edges. When any of the nodes is clicked, navigation
is performed with the display of the respective instances. The user can perform navigation
based on the graph with the inclusion of the tabulated data.
38

Figure 4.3: The format of a CSV file.
The code and modules for our tool can be downloaded from github
39

Figure 4.4: The tabular and graph based views on INKBrowser.
40

5
Evaluation
As we have mentioned in our hypothesis in section 1, we are trying to develop a tool
called INKBrowser which would make the navigation through large datasets quicker by
the inclusion of a schema diagram. In this section, we cover the design principles and
the method that we followed to evaluate our system. We also present the results of our
evaluation.
5.1 Evaluation Design:
In this section, we are going to discuss the method we have adopted to evaluate our tool
and the principle behind it. Our aim behind designing this method is to ensure that our tool
can perform navigation within less time when compared to the other tool without schema
diagram. With respect to this, we adopted a method where we first evaluate a tool which
does not include a schema diagram and offers a tabulated view. We note down the results
and compare it with our tool which does navigation with the schema diagram. The reason
for adopting this method is to address the following questions:
• Is navigation of large datasets using a schema diagram quicker than navigation with-
out a schema diagram?
41

• Is navigation of large datasets using a schema diagram less error-prone than naviga-
tion without a schema diagram?
To begin with the process of evaluation, we are first going to discuss the ontology that
we have taken in order to query and navigate using our tool. We have taken the datasets
which belong to the chess game ontology that is designed by the Dase Lab. The schema
diagram of this ontology is as follows:
Figure 5.1: The Architecture of Pubby.
As seen in the schema diagram above, we have several classes such as Chess Game
which is a subclass of an Event and each Chess Game class consists of other subclasses
such as Opening, Game Result, Game Report and the tournament at which the game is
played[16]. The ontology also models several classes which contain information about the
different players who participate in the game as agents performing an acting player role,
half moves performed, the place and time at which the game is played.
There are several datasets which belong to this ontology which contain information
about the games played. Based on these datasets we have designed a few questions for the
42

Difficulty QuestionsEasy 1. Who won the game played at New York in 1956?
2. How many games were played at Ziatoust in 1961?Medium 1. How many first moves did Victor Pupols play?
2. Did Anatoly Karpov play against Budakov in Madrid?Hard 1. How many players did Robert James Fisher compete against?
2. Did William Steinitz win in 1859 at Vienna?
Table 5.1: Questions for Evaluation
evaluation. The participants should answer these questions by navigating through the data
presented with the tool that does not use a schema diagram and our tool, INKBrowser. We
have listed the time and number of clicks (on the mouse), the user has taken to answer each
question using both the tools. We have also recorded the correctness of each answer given
by the user.
To carry out the evaluation, a set of 10 volunteers from the graduate students at Wright State
University who had the basic knowledge of semantic web and linked data were selected.
Before they started to answer the questions, the participants were given a brief introduction
about the browsing of linked data, the interfaces used for browsing, and the chess game
ontology.
Each participant is given the same 6 questions shown in table 1 to navigate and answer
using the tool. As listed in the table, the questions are categorized into easy, medium and
hard. Each participant is asked to answer all the 6 questions using the browser without
the schema diagram and with the INKBrowser. The participants picked out the questions
randomly to answer from the group. The process of choosing which tool to answer the
questions, whether the INKBrowser or without the schema diagram is also randomized for
the participants. The participants were informed that they cannot go back to the previous
questions during the process of evaluation.
43

DifficultyTime(in secs) Number of Clicks Correctness
Without SC With SC Without SC With SC Without SC With SC
(avg/std) (avg/std) (avg/std) (avg/std) (avg/std) (avg/std)Easy 195/44 117/11 35/9 23/5 1.75/0.25 1.9/0.1Medium 438/64 278/49 122/20 86/13 1.41/0.34 1.8/0.25Hard 501/76 342/66 141/36 106/23 1.0/0.48 1.5/0.34
Table 5.2: Average and standard deviation of time(in seconds), number of clicks(mouse),and correctness score per each category of questions.
We have divided the questions into easy, medium and hard based on the time taken
to answer each question, the number of relations the participants have to navigate through,
the data found inside the relation and the logic involved in answering each question. We
have also informed the participants about the categorization of these questions. We have
also given some basic information that is required to answer the questions. For example,
What is a half move, How to search for the person who played the first half move inside a
chess game, Person who played the last move in a game is the winner.
5.2 Results:
We have calculated the average time and the number of clicks taken by all the participants.
We have also recorded the correctness at which each participant answered all the questions
using both the tools. The results will help us in estimating the productivity of our tool.
5.2.1 Time used for navigation
As we have mentioned in our hypothesis, we are trying to prove that the participants would
be able to navigate quickly with the help of a schema diagram than without using it. With
respect to this, we have listed the results of our evaluation in table 2.
If we take into consideration the statistical analysis of the data, let us first consider
our null hypothesis to be there is no considerable difference between the time taken to
44

navigate using the tool without schema diagram versus INKBrowser. Since each participant
has answered all the questions from each difficulty class, we have performed a paired t-
test(two-tailed) against the data listed. This t-test is performed in order to prove if the
means of two sets of data are significantly different from each other. For the easy questions,
our t-test has given the result of p=0.0016¡0.05 For the medium questions, our t-test has
given p=0.004¡0.05, so we can reject the null hypothesis. For the hard questions, we can
reject our null hypothesis as our t-test has produced the value of p=0.02¡0.05. Since the
results have p¡0.05 proving to be statistically significant, we can confirm our hypothesis.
Along with the time, we have also recorded the number of clicks (on the mouse) that
each participant took to answer the questions. We have presented the data in table 2. If
we use the t-test on the number of clicks like before, our null hypothesis being that there is
no difference between the two interfaces, the p-values are 0.002(easy), 0.006(medium) and
0.01(hard), where p¡0.05. This again confirms our hypothesis.
5.2.2 The Correctness of tool
As stated in our hypothesis, we are trying to prove that participants would answer the
questions more correctly using the INKBrowser than without it. In order to confirm this,
we have verified the correctness of the answers given by the participants while they were
performing navigation for each question using both the tools. The results are tabulated in
table 2. We have assigned a score of 0,1,2 based on the answer given by each participant as
follows: 2 if the participant has given the correct answer using the tool 1 if the participant
has given the wrong answer using the tool 0 if the participant has given no answer using
the tool
Just like before, we have performed a two-tailed t-test, with the null hypothesis being
that there is no difference in using the INKBrowser or not. The values are found to be
0.03(easy), 0.02(medium), 0.004(hard) The null hypothesis could be easily rejected for all
the questions thus proving our results to be statistically significant with p¡0.05. Hence, we
45

can confirm our hypothesis by stating that users can navigate and answer questions with
more correctness and fewer errors while using the INKBrowser.
46
6
Conclusion
In this paper, we have demonstrated the design of a tool which can perform improved
navigation by utilizing the schema information. We have presented the modules which we
reviewed before going ahead with the design. We have evaluated our tool to measure the
time and correctness when compared to a schema-less navigation. But before we conclude,
there some key points that we would like to discuss for the subsequent development of our
tool.
Future Work
There are few modifications that can be made to our tool which are as follows:
– Currently our tool is available only as a web-service. It can be further developed as
an extension that can be added to a web browser (such as chrome).
– Using our tool, we have only tested the chess game ontology datasets for navigation.
Several other datasets belonging to distinct ontologies should also be tested on our
tool for navigation.
– In section 4, we have mentioned that the user needs to provide the schema diagram
in a CSV format for generating the graph-based view. This can be overcome by
47

including a plugin in our tool. The plugin can be used to generate a schema diagram
from the given ontology files.
48

Bibliography
[1] Introduction to cubicweb cubicweb 3.26.8. https://cubicweb.
readthedocs.io/en/3.26/book/intro/. (Accessed on 06/28/2019).
[2] mxgraph tutorial. https://jgraph.github.io/mxgraph/docs/
tutorial.html. (Accessed on 06/29/2019).
[3] ramaschittella/ink-browser. https://github.com/ramaschittella/
INK-Browser. (Accessed on 07/02/2019).
[4] Rdf 1.1 json alternate serialization (rdf/json). https://www.w3.org/TR/
rdf-json/. (Accessed on 06/28/2019).
[5] Using the firefox tabulator extension. http://dig.csail.mit.edu/2007/
tab/tabtutorial.html. (Accessed on 06/29/2019).
[6] Ben Adida, Ivan Herman, Manu Sporny, and Mark Birbeck. Rdfa 1.1 primer. Rich
Structured Data Markup for Web Documents. Online verfugbar unter http://www. w3.
org/TR/xhtml-rdfa-primer/, zuletzt gepruft am, 9:2016, 2012.
[7] Dave Beckett and Brian McBride. Rdf/xml syntax specification (revised). W3C rec-
ommendation, 10(2.3), 2004.
49

[8] David Beckett, Tim Berners-Lee, Eric Prudhommeaux, and Gavin Carothers. Rdf 1.1
turtle. World Wide Web Consortium, 2014.
[9] Tim Berners-Lee, James Hollenbach, Kanghao Lu, Joe Presbrey, and MC Schraefel.
Tabulator redux: Browsing and writing linked data. 2008.
[10] Christian Bizer, Tom Heath, and Tim Berners-Lee. Linked data: The story so far. In
Semantic services, interoperability and web applications: emerging concepts, pages
205–227. IGI Global, 2011.
[11] Richard Cyganiak and Chris Bizer. Pubby-a linked data frontend for sparql end-
points. Url: http://wifo5-03. informatik. uni-mannheim. de/pubby/.(Acesso: 19-11-
2014), 2008.
[12] Stefan Decker, Sergey Melnik, Frank Van Harmelen, Dieter Fensel, Michel Klein,
Jeen Broekstra, Michael Erdmann, and Ian Horrocks. The semantic web: The roles
of xml and rdf. IEEE Internet computing, 4(5):63–73, 2000.
[13] Asuncion Gomez-Perez, Mariano Fernandez-Lopez, and Oscar Corcho. Ontological
Engineering: with examples from the areas of Knowledge Management, e-Commerce
and the Semantic Web. Springer Science & Business Media, 2006.
[14] Andreas Harth. Visinav: A system for visual search and navigation on web data.
Web Semantics: Science, Services and Agents on the World Wide Web, 8(4):348–354,
2010.
[15] Tom Heath and Christian Bizer. Linked data: Evolving the web into a global data
space. Synthesis lectures on the semantic web: theory and technology, 1(1):1–136,
2011.
50

[16] P Hitzler et al. Modeling with ontology design patterns: Chess games as a worked
example. Ontology Engineering with Ontology Design Patterns: Foundations and
Applications, 25:3, 2016.
[17] Apache Jena. Apache jena fuseki. The Apache Software Foundation, 2014.
[18] M Perry and J Herring. Geosparql-a geographic query language for rdf data— ogc,
2011.
[19] Eric Prud, Andy Seaborne, et al. Sparql query language for rdf. 2006.
[20] Armin Ronacher. Welcome to flask. Welcome to FlaskFlask Documentation (0.12).
Flask, nd Web, 9, 2017.
[21] Marcin Synak, Maciej Dabrowski, and Sebastian Ryszard Kruk. Semantic web and
ontologies. In Semantic digital libraries, pages 41–54. Springer, 2009.
[22] Jacco van Ossenbruggen, Lynda Hardman, and Lloyd Rutledge. Hypermedia and the
semantic web: A research agenda. Journal of Digital information, 3(1), 2001.
51


![The Knowledge Graph Track at OAEI€¦ · the Knowledge Graph track, ... on the instance and schema level becomes a crucial task in combining such knowledge graphs [25]. ... The result](https://static.cupdf.com/doc/110x72/5fdc2c4f9a5df41fc86d06f7/the-knowledge-graph-track-at-oaei-the-knowledge-graph-track-on-the-instance.jpg)