890 copy IWA Publishing 2012 Hydrology Research | 436 | 2012
Long-term temperature and precipitation trends at the
Coweeta Hydrologic Laboratory Otto North Carolina USA
Stephanie H Laseter Chelcy R Ford James M Vose and Lloyd W Swift Jr
ABSTRACT
Coweeta Hydrologic Laboratory located in western North Carolina USA is a 2185 ha basin wherein
forest climate monitoring and watershed experimentation began in the early 1930s An extensive
climate and hydrologic network has facilitated research for over 75 years Our objectives in this paper
were to describe the monitoring network present long-term air temperature and precipitation data
and analyze the temporal variation in the long-term temperature and precipitation record We found
that over the period of record (1) air temperatures have been increasing significantly since the late
1970s (2) drought severity and frequency have increased with time and (3) the precipitation
distribution has become more extreme over time We discuss the implications of these trends within
the context of regional and global climate change and forest health
doi 102166nh2012067
Stephanie H Laseter (corresponding author)Chelcy R FordJames M VoseLloyd W Swift JrUSDA Forest ServiceSouthern Research StationCoweeta Hydrologic Lab3160 Coweeta Lab RoadOtto North CarolinaUSAE-mail slaseterfsfedus
Key words | climate long-term precipitation quantile regression temperature time series
INTRODUCTION
The Coweeta Hydrologic Laboratory is among the oldest
continuously operating environmental study sites in North
America and is located in the eastern deciduous forest of
the southern Appalachian Mountains in North Carolina
USA (Figure 1) The laboratory was established in 1934 to
determine the fundamental effects of forest management
on soil and water resources and to serve as a testing
ground for theories in forest hydrology (Swank amp Crossley
) To facilitate this a network of climate and precipi-
tation stations was established across the site (Figure 1
Tables 1 and 2) The research program has since expanded
its focus to encompass watershed ecosystem science The
original climate and precipitation network continues to
facilitate these studies and serves as the foundation of the
long-term data record
Forested ecosystems are inherently complex and
require a long-term perspective to evaluate responses to
natural disturbances and management Long-term climate
data can be an especially important part of this perspective
particularly when evaluating watershed responses to pulse
and press climatic events Without long-term datasets that
encompass a wide range of conditions quantifying
hydrologic and ecologic thresholds can be challenging
and identifying cyclical trends or changes in key climate
variables can be impossible (Moran et al ) A compre-
hensive description and analysis of the first 50 years of the
climate data recorded at Coweeta was published in 1988
(Swift et al ) In that study few climate trends were
evident For example no significant trends in maximum
or minimum annual temperatures or changes in the distri-
bution of precipitation were detected Since then in the
southeastern USA the last 25 years have been character-
ized by marked changes in key climate variables
including increases in precipitation (Karl amp Knight
Groisman et al ) leading to greater streamflow (Grois-
man et al ) increased minimum temperatures
(Portmann et al ) especially minimum temperatures
in the summer months (Groisman et al ) and increased
cloud cover (Dai et al ) In addition the variability of
precipitation has also changed in the southeastern USA
with increases in extreme precipitation events (Groisman
et al ) including high intensity rainfall as well as extreme
droughts (Karl amp Knight ) The ability to separate actual
changes or significant trends in climatic variables from
Figure 1 | Elevation gradients and main and sub-watersheds (bold and non-bold white lines respectively) at Coweeta Hydrologic Lab Numbers denote reference (bold) and experimental
(non-bold) watersheds Climate stations are identified by white text Inset location of Coweeta Basin with respect to southeast USA
891 S H Laseter et al | Long-term temperature and precipitation trends Hydrology Research | 436 | 2012
natural variability requires long-term records Hence these
long-term records are critical for detecting historical
changes in climate and they can serve as benchmarks for
detecting future change Our objectives were to provide
an update of the climate and precipitation network in the
Coweeta Basin summarize the long-term temperature and
precipitation data in the Coweeta Basin and analyze the
temporal variation in these two data series
Table 1 | Location elevation and description of climate station network
Climate station
CS01 CS17 CS21 CS28 CS77
Location (latlong) 35W0303748 35W0204333 35W0305963 35W0204760 35W010492783W2504836 83W2601463 83W2600912 83W2705405 83W2703760
Elevation (m) 685 887 817 1189 1398
Aspect Valley floor N-facing S-facing E-facing NE-facing
SRGa 19 96 17 06 77
RRGa 06 96
Date of first recordb 81934 101969 71974 51985 41992
Sensorsc (units)
Barometric air pressure (kPa)
Atmospheric CO2 concentration (ppm)
Air temperature (WC) and humidity ( kPakPa)d
Photosynthetically active radiation (μmol m2 s1)
Pan evaporation (mm)
Solar radiation (Ly)
Soil and litter temperaturee (WC)
Wind speed (m s1) and direction (W)
aSRG denotes Standard Rain Gage RRG denotes Recording Rain Gage (See Table 2) Climate stations 21 28 and 77 have only standard rain gagesbBarometer photosynthetically active radiation and digital air relative humidity and temperature sensors added at a later datecSee text for make and model numbers and vendor information of sensorsdHumidity and temperature are recorded with both a hygrothermograph instrument and an HMP45c sensor Both are located adjacent to National Weather Service maximum minimum and
standard thermometers Air temperature and humidity readings taken in open field setting as well as within forested cover at all climate stations except CS01eOnly in forest setting
Table 2 | Location elevation and date of first record of all paired recording and standard rain gages (RRG and SRG respectively)
Gage or Station SRG Location (latlong) Elevation (m) Date of first record Aspect
RRG06 19 35W030374883W2504836 687 641936 Valley bottom
RRG05 02 35W030377783W2705398 1144 641936 SE-facing
RRG20 20 35W030533783W2602918 740 1151962 Stream bottom
RRG31 31 35W010578983W2800524 1366 1111958 High elevation gap
RRG40 13 35W030447783W2702218 961 11101942 S-facing
RRG41 41 35W030191183W2504332 776 511958 N-facing
RRG45 12 35W020501983W2703111 1001 611942 Low elevation gap
RRG55 55 35W020235983W2701932 1035 1151990 N-facing
RRG96 96 35W020433383W2601463 894 1111943 N-facing
892 S H Laseter et al | Long-term temperature and precipitation trends Hydrology Research | 436 | 2012
SITE DESCRIPTION
The Coweeta Hydrologic Laboratory is located within the
Nantahala Mountain Range of western North Carolina
USA latitude 35W030 N longitude 85W250 W (Figure 1) The
Coweeta Hydrologic Lab is 2185 ha in area and comprised
of two adjacent east-facing basins The larger of the two
basins (1626 ha) Coweeta Basin has been the primary
893 S H Laseter et al | Long-term temperature and precipitation trends Hydrology Research | 436 | 2012
focus of watershed experimentation Within the basin
elevations range from 675 to 1592 m Climate is classified
as maritime humid temperate (Trewartha Critchfield
)
Historic vegetation patterns in the basin have been influ-
enced by human activity primarily through small
homestead agriculture both clear-cut and selective logging
the introduction of chestnut blight (Cryphonectria parasi-
tica) (Elliott amp Hewitt ) and hemlock woolly adelgid
(Adelges tsugae) (Nuckolls et al ) and fire management
(Hertzler Douglass amp Hoover ) The resulting
unmanaged forests are relatively mature (sim85 years old)
oak-hickory (at lower elevations) and northern hardwood
forests (at higher elevations) with an increasing component
of fire-intolerant species (Elliott amp Swank ) Bedrock is
comprised of granite-gneiss and mica-schist Soils are imma-
ture Inceptisols and older Ultisols and are relatively high in
organic matter and moderately acid with both low cation
exchange capacity and base saturation
METHODS
Climate network
Daily temperature and precipitation data have been
recorded at the main climate station (CS01) continuously
since 1934 (Table 1) In addition to CS01 there are four cli-
mate stations across the basin (Table 1) In the 1980s
measurements at each of these stations were expanded in
scope and temporal resolution Each of these stations now
continually measures and records (CR10X Campbell Scien-
tific Inc Logan UT USA The following variables every
5 min temperature and relative humidity in both an open
field and forested setting (HMP45c Campbell Scientific
Logan UT USA) photosynthetically active radiation (LI-
190-SB Campbell Scientific) soil and litter temperature
under forest cover (107-L Campbell Scientific) and wind
speed and wind direction at canopy height (014A and
024A MetOne Instruments Grants Pass OR USA) Baro-
metric air pressure (Vaisala CS106 Campbell Scientific)
solar radiation (model 8ndash48 Eppley Lab Inc Newport
RI USA) atmospheric CO2 concentration (Licor LI-820
Licor Lincoln NE USA) and pan evaporation are
measured only at CS01 Data retrieval from the climate net-
work is via wireless remote access All data recorded to the
CR10X datalogger are transmitted via radio frequency (Free-
wave Technologies Inc FGR-115RC Boulder CO) from
each of the four climate stations to a computer server in
the data processing office
Temperature is recorded at CS01 at 0800 EST daily
using a National Weather Service (NWS) maximum mini-
mum and standard thermometer Daily minimum and
maximum temperatures are recorded and then averaged to
determine the average minimum or maximum temperature
for the month In addition air temperature is digitally
recorded on a 5 min increment (CR10X Campbell Scienti-
fic) These values are averaged and hourly maximum
minimum and average temperatures are stored Weekly
absolute maximum and minimum temperatures are
recorded at all other climate stations with NWS maximum
and minimum thermometers
Total daily precipitation is collected by an 8 in Standard
Rain Gage (NWS) Rainfall volume and intensity are
recorded by Recording Rain Gage (Belfort Universal
Recording Rain Gage Belfort Instrument Co Baltimore
MD USA) A network of nine Recording Rain Gages and
12 Standard Rain Gages are located throughout the basin
(Table 2) (The use of trade or firm names in this publication
is for reader information and does not imply endorsement
by the US Department of Agriculture of any product or
service)
Statistical models
To describe the climate data we present means extremes
deviations from long-term means and simple Pearsonrsquos
correlation coefficients (R) among climate variables and
time To test the hypotheses that mean maximum and
minimum annual air temperature (T WC) has been increas-
ing in the recent part of the record by fitting a time series
intervention models to T data method is described in
detail in Ford et al () Candidate models were a
simple level or a mean level plus a linear increase starting
at time t Each potential starting time in the 1975ndash1988
range which was the visual range of the temperature
increase was evaluated sequentially (PROC ARIMA
SAS v91 SAS Institute Inc) We computed Akaikersquos
Figure 2 | Monthly mean air temperature at CS01 (see Table 1) Boxes show 75th 50th
and 25th percentiles Whiskers show 90th and 10th percentiles Each outlier
(observations outside the 90th and 10th percentiles) is shown
894 S H Laseter et al | Long-term temperature and precipitation trends Hydrology Research | 436 | 2012
information criterion (AIC) for each model which is a
statistic used to evaluate the goodness of fit and parsi-
mony of a candidate model with smaller AIC values
indicating a better fitting and more parsimonious model
than larger values ( Johnson amp Omland ) We used
the differences in the AIC values among candidate
models with all starting times (Δi frac14AICi ndashAICmin) to com-
pute a relative weight (wi) for each model relative to all
models fit
wi frac14 e05Δi
PRrfrac141 e05iΔr
(1)
with the sum of all wi equal to 1 The final model selected
was the model with the highest wi (Burnham amp Anderson
Johnson amp Omland )
We explored whether the high and low ends of the pre-
cipitation distribution were changing over time with
quantile regression (Cade amp Noon ) We analyzed
linear trends in all quantiles of precipitation (P mm) to
quantify changes to the distribution of annual and monthly
precipitation We used data from the high- and low-
elevation standard rain gages (SRG 19 and 31 Table 2)
for the entire period of record Our model predicted the
precipitation amount as a function of year with elevation
as a covariate All models were fit using PROC
QUANTREG in SAS (v91 SAS Institute Inc) If the boot-
strapped 95 confidence interval around the estimated
coefficient for the quantile overlapped zero we interpreted
this as no significant time trend To check whether annual
precipitation totals from the two gages were consistent
over time we fit a linear model predicting precipitation
from SRG 19 as a function of precipitation from SRG 31
year and the interaction of year and SRG 31 (PROC
GLM)
Figure 3 | Long-term average annual maximum and minimum air temperatures at
Coweeta Hydrologic Lab CS01 (see Table 1) Solid black lines correspond to
the modeled mean with a time series intervention model containing a ramp
function at 1981 1988 and 1976 for average maximum and minimum data
Dashed lines are the upper and lower 95 confidence intervals about the
modeled mean
RESULTS
Temperature
Daily and seasonal temperatures do not fluctuate widely
(Figure 2) Temperatures are most variable in the winter
months The warmest year on record occurred in 1999
(average maximum temperature of 215 WC) The coldest
year on record was 1940 with a minimum of 41 WC
Average annual maximum and minimum air tempera-
tures at the site have increased significantly relative to the
long-term mean (Figure 3) The warming trend is apparent
895 S H Laseter et al | Long-term temperature and precipitation trends Hydrology Research | 436 | 2012
in all temperature series (for growing season temperature
analysis see Ford et al ()) and appeared to begin in
the late 1970s to late 1980s The most parsimonious stat-
istical models indicate a significant increase in average
minimum temperatures beginning in 1976 (wifrac14 016)
with a rate of increase away from the 54 WC long-term
mean of 05 WC per decade This same rate of increase
occurred in the average annual data series in 1981
(wifrac14 013) and in the annual maximum temperature
series in 1988 (wifrac14 017) Average dormant and growing
season temperatures also show this trend (data not
shown)
Precipitation
Annual precipitation at Coweeta is among the highest in the
eastern USA averaging 1794 mm (CS01 station Figure 4
(a)) The basin receives frequent small low-intensity
storms in all seasons with the wetter months in late
winter and early spring Fall months are drier (Figure 4
(b)) but generally have larger more intense tropical storm
activity Elevation has a strong influence on precipitation
amount (Figure 4(b)) For example precipitation at
1398 m in elevation is 32 (plusmn6 SD) higher than that at
685 m Although P increases with elevation at the site
P amounts among the rain gages are highly correlated
(096ltR2lt 099) and this relationship is consistent
over time (P vs time Rfrac14 002 no P by year interaction
Prfrac14 073 F173frac14 012)
Figure 4 | Total annual precipitation (a) recorded at CS01 and average monthly precipitation
Annual precipitation totals are also becoming more vari-
able over time with wetter wet years and drier dry years
(Figure 5(a) and (b)) Coweeta experienced the wettest
year on record in 2009 with a total of 2375 mm Only 2
years prior in 2007 the driest year on record occurred
with 1212 mm Low quantiles sim10ndash20 had a significant
negative slope over time Higher quantiles 65ndash75 had a
significant positive slope over time This indicates that the
low and high ends of the annual precipitation distribution
in the basin changed during the period of record During
the wettest years not all months were wetter and similarly
during the driest years not all months were drier
Our results show that the summer months became
drier over time while the fall months became more wet
(Figure 5(c)ndash(f)) In general most quantiles describing July
precipitation declined over time In September only the
most extreme part (gt85) of the distribution increased
over time due to an increase in high intensity shorter dur-
ation storm events such as tropical storms as opposed to
an increase in the number of storms per month For
example the number of storms occurring in September
did not increase over time (Rfrac14 ndash001 Figure 6(a)) but the
percentage of September storms that fell above the 75th per-
centile (165 mm) appears to increase substantially in the
latter part of the record (Figure 6(b)) Other fall months
became wetter over time mainly due to increases in the
lower percentile storms (data not shown)
In addition to more intense precipitation recent climate
patterns trend toward more frequent periods of prolonged
(b) at low- and high-elevation stations (see Table 1)
Figure 5 | Annual (a) July (c) and September (e) total precipitation from CS01 (see Table 1) Lines show the modeled qth quantile as a function of time Slopes of all lines shown are
significantly different than zero Panels on right show the modeled estimates (symbols) of the quantile slope conditional on year for annual (b) July (d) and September (f)
precipitation totals Bootstrapped upper and lower 95 confidence intervals also shown for parameter estimates (grey area)
896 S H Laseter et al | Long-term temperature and precipitation trends Hydrology Research | 436 | 2012
drought (Figure 7) as inferred by comparing annual totals
against the long-term mean In addition drought severity
(accumulated deficit in precipitation over time) is increasing
with time (Rfrac14 ndash035 t00537frac14 ndash229 Prfrac14 001) Beginning
with a severe drought in 1985 a 1600 mm deficit in rainfall
accumulated through 2008
Figure 6 | (a) Number of precipitation events in September for each year in the long-term
record and (b) the percentage of those events that fall above the 75th per-
centile (165 mm) Solid line in (b) is a 10 yr moving average
Figure 7 | Deviation of annual precipitation amounts from the long-term mean recorded
at CS01 (see Table 1)
897 S H Laseter et al | Long-term temperature and precipitation trends Hydrology Research | 436 | 2012
DISCUSSION
Climate change
The increased mean annual air temperature (ie 05 WC per
decade) observed since the early 1980s at Coweeta is con-
sistent with other global and regional observations In the
observed climate records globally the 20 warmest years
have all occurred since 1981 (Peterson amp Baringer )
Across the USA a significant warming trend in air tempera-
ture also began in the late 1970s to early 1980s (Groisman
et al Peterson amp Baringer ) This warming
trend is predicted to continue ensemble atmosphere-ocean
general circulation models (AOGCMs) predict that by the
early 21st century (2030) southeastern US air temperatures
will increase at a rate of 05 WC per decade (IPCC )
Causes for the increases in air temperature include both
natural (ie surface solar radiation) and anthropogenic
(eg ozone and CO2 concentrations) sources and potential
interactions of sources (IPCC ) For example as aero-
sols increase surface solar radiation is reduced (ie global
dimming) which decreases surface temperatures (Wild
) One explanation of the lack of significant warming
in the 1950ndash1980 period followed by the rapid
warming in the last 25 years is that the lower surface
solar radiation in the former period masked the warming
trend while the higher surface solar radiation in the latter
period apparently accelerated warming (Wild )
Although cause and effect is difficult to establish the
timing of increased surface solar radiation is coincident
with the passage and implementation of the 1977 Clean
Air Act (CAA) and the 1990 CAA Amendments in the
USA which have been quite effective at reducing anthropo-
genic aerosols (Streets et al ) Similar to our hypothesis
here over Europe a 60 reduction in aerosols has been
linked to the 1 WC increase in surface temperature since
the 1980s due to impacts on shortwave and long-wave for-
cing (Philipona et al )
Precipitation is increasing in the southeast similar to
what we observed in the Coweeta Basin (Karl amp Knight
Groisman et al ) These increases in precipitation
have translated to increases in streamflow according to long-
term US Geological Survey streamflow data (Karl amp Knight
898 S H Laseter et al | Long-term temperature and precipitation trends Hydrology Research | 436 | 2012
Lins amp Slack IPCC ) Recent trends in east-
ern US precipitation and specifically those in the Coweeta
Basin have been linked to regular patterns in the North
Atlantic Oscillation (Riedel a b) A trend in drier sum-
mers since the 1980s has occurred for the southeast
(Groisman et al Angert et al ) Simultaneously
a trend in wetter fall months has also occurred (Groisman
et al ) Our findings in the Coweeta Basin are consist-
ent with both of these larger-scale regional patterns
Whether the trend of increasing precipitation will continue
for the region in a warmer higher-CO2 scenario is uncertain
Most AOGCMs do not agree on the predicted change in
direction of future precipitation for the southern Appala-
chians and southeast USA eg wetter vs drier (IPCC )
Many regions of the USA have experienced an increased
frequency of precipitation extremes droughts and floods
over the last 50 years (Easterling et al Groisman
et al Huntington IPCC ) As the climate
warms in most AOGCMs the frequency of extreme precipi-
tation events increases across the globe resulting in an
intensification of the hydrologic cycle (Huntington )
For example the upper 99th percentile of the precipitation
distribution is predicted to increase by 25 with a doubling
of CO2 concentration (Allen amp Ingram ) The lower end
of the precipitation distribution is also predicted to change
Forecasts of the drought extent over the next 75 years show
that the proportion of land mass experiencing drought will
double from 15 to 30 (Burke et al ) For example
with a doubling in the peak CO2 concentration dry season
precipitation is expected to decline irreversibly on average
by 15 on most land masses (Solomon et al ) The
timing and spatial distribution of extreme precipitation
events are among the most uncertain aspects of future cli-
mate scenarios however (Karl et al Allen amp Ingram
) Our results show that the extremes of the annual pre-
cipitation distribution are increasing in magnitude with
recent increases in the frequency of drought and wetter
wet years and drier dry years We have observed the most
extreme precipitation changes in the fall months with
increases in intense rainfall in September in particular
This is partly associated with precipitation generated from
tropical storm events However a wetter fall season is also
being observed due to an increase in the low percentile
rain events in November (Ford et al )
Effects on forest function and health
Observed changes in temperature and precipitation distri-
butions that have occurred both locally and regionally
have significantly affected forest function and health The
eastern USA has experienced an earlier onset in spring
due to rising temperatures (Czikowsky amp Fitzjarrald
) which has increased spring forest evapotranspiration
(Czikowsky amp Fitzjarrald ) and growth (Nemani et al
McMahon et al ) However the increase in
spring growth has been largely offset by drier summers in
the southeast (Angert et al ) and areas with observed
sustained increases in forest growth over time have been
those in the northeast (McMahon et al ) and at the
highest elevations (Salzer et al ) where temperatures
are more limiting than water and the tropics
(Nemani et al ) where radiation is the primary limit-
ing factor
Whether forest productivity is experiencing recent
increases concomitant with temperature increase in the
Coweeta Basin has not yet been reported The effects of
extreme events most notably drought have had a more dra-
matic effect on forest health and forest species composition
than the trends in temperature Native insect outbreaks eg
southern pine beetle (Dendroctonus frontalis) are triggered
by drought The successive droughts in the 1980s and late
1990s caused widespread southern pine beetle infestations
in Coweeta watersheds and throughout the southern Appa-
lachians As a result of these outbreaks a decrease in pitch
pine (Pinus rigida) stands and increased canopy gap area
due to dead or dying snags (Clinton et al Vose amp
Swank Kloeppel et al ) occurred The growth of
eastern white pine (Pinus strobus) has also been signifi-
cantly reduced by drought (Vose amp Swank McNulty
amp Swank )
Deciduous hardwood ecosystems have also been
impacted by droughts For example accelerated mortality
of oaks in the red oak group (especially Quercus coccinea)
occurred during the successive droughts in the 1980s and
late 1990s and interestingly larger trees were more vulner-
able than smaller trees (Clinton et al ) The earliest
reports of drought in the area in the 1920s also noted
that oak mortality was higher than other deciduous tree
species (Hursh amp Haasis ) Growth rate data for oaks
899 S H Laseter et al | Long-term temperature and precipitation trends Hydrology Research | 436 | 2012
in the 1980ndash1990 period showed comparable growth rates
during wet and dry periods suggesting either deep rooting
and access to stored water in the deep soils at Coweeta
(Kloeppel et al ) or highly conservative gas exchange
in both wet and dry periods (Bush et al Ford et al
)
SUMMARY AND CONCLUSIONS
Analysis of 75 years of climate data at the Coweeta Hydro-
logic Laboratory has revealed a significant increase in air
temperatures since the late 1970s an increase in drought
severity and frequency and a more extreme precipitation
distribution Cause and effect are difficult to establish but
these patterns are consistent with observations throughout
the southeastern USA that suggest linkages between
reduced aerosols and temperature patterns and linkages
between the North Atlantic Oscillation and increased pre-
cipitation variability Similar patterns are predicted with
AOGCMs under climate change and this recent variability
in the observed record may be providing a glimpse of
future climatic conditions in the southern Appalachian
Based on observed ecosystem responses to climate variabil-
ity over the past 20 years we anticipate significant impacts
on ecosystem structure and function
Climate change during the 21st century is predicted to
include novel climates ndash combinations of seasonal tempera-
ture and precipitation that have no historical or modern
counterpart (Williams et al ) In the USA the southeast-
ern region is predicted to be the most susceptible to novel
climates (Williams amp Jackson Williams et al )
Detecting ecosystem change including ecological lsquosurprisesrsquo
will require long-term data from monitoring networks and
studies (Lindenmayer et al ) such as those presented
here from the Coweeta Hydrologic Laboratory
ACKNOWLEDGEMENTS
This study was supported by the United States Department of
Agriculture Forest Service Southern Research Station and
by NSF grants DEB0218001 and DEB0823293 to the
Coweeta LTER program at the University of Georgia Any
opinions findings conclusions or recommendations
expressed in the material are those of the authors and do
not necessarily reflect the views of the National Science
Foundation or the University of Georgia We acknowledge
the support of many individuals past and present including
Wayne Swank Charlie L Shope Charles Swafford Neville
Buchanan lsquoZerorsquo Shope Bryant Cunningham Bruce
McCoy Chuck Marshall Mark Crawford and Julia Moore
as well as the long-term climate and hydrologic data
network at the Coweeta Hydrologic Lab
REFERENCES
Allen M R amp Ingram W J Constraints on future changes inclimate and the hydrologic cycle Nature 419 224ndash232
Angert A Biraud S Bonfils C Henning C C Buermann WPinzon J Tucker C J amp Fung I Drier summers cancelout the CO2 uptake enhancement induced by warmersprings Proc Natl Acad Sci 102 10823ndash10827
Burke E J Brown S J amp Christidis N Modeling the recentevolution of global drought and projections for thetwenty-first century with the Hadley Centre Climate ModelJ Hydrometeorol 7 1113ndash1125
Burnham K P amp Anderson D R Model Selection andMultimodel Inference A Practical Information-TheoreticApproach Springer-Verlag New York
Bush S E Pataki D E Hultine K R West A G Sperry J Samp Ehleringer J Wood anatomy constrains stomatalresponses to atmospheric vapor pressure deficit in irrigatedurban trees Oecologia 156 13ndash20
Cade B S amp Noon B R A gentle introduction to quantileregression for ecologists Front Ecol Environ 1 412ndash420
Clinton B D Boring L R amp Swank W T Canopy gapcharacteristics and drought influences in oak forests of theCoweeta Basin Ecology 74 1551ndash1558
Critchfield H J General Climatology Prentice HallEnglewood Cliffs New Jersey USA
Czikowsky M J amp Fitzjarrald D R Evidence of seasonalchanges in evapotranspiration in eastern US hydrologicalrecords J Hydrometeorol 5 974ndash988
Dai A Karl T R Sun B amp Trenberth K E Recent trendsin cloudiness over the United States a tale of monitoringinadequacies Bull Am Meteorol Soc 87 597ndash606
Douglass J E amp Hoover M D Introduction and sitedescription In Ecological Studies Vol 66 Forest Hydrologyand Ecology at Coweeta (W T Swank amp D A Crossley eds)Springer-Verlag New York pp 17ndash31
Easterling D R Meehl G A Parmesan C Changnon S A KarlT R amp Mearns L O Climate extremes observationsmodeling and impacts Science 289 2068ndash2074
900 S H Laseter et al | Long-term temperature and precipitation trends Hydrology Research | 436 | 2012
Elliott K J amp Hewitt D Forest species diversity in upperelevation hardwood forests in the southern AppalachianMountains Castanea 62 32ndash42
Elliott K J amp Swank W T Long-term changes in forestcomposition and diversity following early logging(1919ndash1923) and the decline of American chestnut (Castaneadentata) Plant Ecol 197 155ndash172
Ford C R Goranson C E Mitchell R J Will R E amp TeskeyR O Modeling canopy transpiration using time seriesanalysis a case study illustrating the effect of soil moisturedeficit on Pinus taeda Agric Forest Meteorol 130 163ndash175
Ford C R Hubbard R M amp Vose J M Quantifyingstructural and physiological controls on canopy transpirationof planted pine and hardwood stand species in the southernAppalachians Ecohydrology 4 183ndash195
Ford C R Laseter S H SwankW TampVose JM Can forestmanagement be used to sustainwater-based ecosystem servicesin the face of climate change Ecol Appl 21 2049ndash2067
Groisman P Y Knight R W Karl T R Easterling D R SunB amp Lawrimore J H Contemporary changes of thehydrological cycle over the contiguous United States trendsderived from in situ observations J Hydrometeorol 5 64ndash85
Hertzler R A History of the Coweeta Experimental ForestUnpublished report onfile at CoweetaHydrologic Laboratory
Huntington T G Evidence for intensification of the globalwater cycle review and synthesis J Hydrol 319 83ndash95
Hursh C R amp Haasis F W Effects of 1925 summer droughton southern Appalachian hardwoods Ecology 12 380ndash386
IPCC Contribution of working groups I II and III to thefourth assessment report of the Intergovernmental panel onclimate change In Climate Change 2007 Synthesis ReportCore Writing Team (R K Pachuari amp A Reisinger eds)Geneva Switzerland pp 104
Johnson J B amp Omland K S Model selection in ecologyand evolution Trends Ecol Evol 19 101ndash108
Karl T R amp Knight R W Secular trends of precipitationamount frequency and intensity in the USA Bull AmMeteorol Soc 79 231ndash241
Karl T R Knight R W amp Plummer N Trends inhigh-frequency climate variability in the twentieth centuryNature 377 217ndash220
Kloeppel B D Clinton B D Vose J M amp Cooper A R Drought impacts on tree growth and mortality of southernAppalachian forests In Climate Variability and EcosystemResponse at Long-term Ecological Research Sites (DGreenland D G Goodin amp R C Smith eds) OxfordUniversity Press New York NY pp 43ndash55
Lindenmayer D B Likens G E Krebs C J amp Hobbs R J Improved probability of detection of ecological lsquosurprisesrsquoProc Natl Acad Sci 107 21957ndash21962
Lins H amp Slack J R Streamflow trends in the United StatesGeophys Res Lett 26 227ndash230
McMahon S M Parker G G ampMiller D R Evidence for arecent increase in forest growth Proc Natl Acad Sci 1073611ndash3615
McNulty S G amp Swank W T Wood δ13C as a measure ofannual basal area growth and soil water stress in a Pinusstrobus forest Ecology 76 1581ndash1586
Moran M S Peters D P C McClaran M P Nichols M H ampAdams M B Long-term data collection at USDAexperimental sites for studies of ecohydrology Ecohydrology1 377ndash393
Nemani R R Keeling C D Hashimoto H Jolly W MPiper S C Tucker C J Myneni R B amp Running S W Climate-driven increases in global terrestrial netprimary production from 1982 to 1999 Science 3001560ndash1563
Nuckolls A Wurzburger N Ford C R Hendrick R L VoseJ M amp Kloeppel B D Hemlock declines rapidly withhemlock woolly adelgid infestation impacts on the carboncycle of Southern Appalachian forests Ecosystems 12179ndash190
Peterson T C amp Baringer M O State of the climate in2008 Bull Am Meteorol Soc 90 S1ndashS196
Philipona R Behrens K amp Ruckstuhl C How decliningaerosols and rising greenhouse gases forced rapidwarming in Europe since the 1980s Geophys Res Lett36 L02806
Portmann R W Solomon S amp Hegerl G C Spatial andseasonal patterns in climate change temperatures andprecipitation across the United States Proc Natl Acad Sci106 7324ndash7329
Riedel MS a North Atlantic oscillation influences onclimate variability in the Southern Appalachians 8thInterdisciplinary Solutions for Watershed SustainabilityJoint Federal Interagency Reno NV
Riedel MS b Atmosphericoceanic influence on climate inthe Southern Appalachians In Proceedings of the SecondaryInteragency Conference on Research in the WatershedsUSDA SRS Otto NC pp 7
Salzer M W Hughes M K Bunn A G amp Kipfmueller K F Recent unprecedented tree-ring growth in bristleconepine at the highest elevations and possible causes Proc NatlAcad Sci 106 20348ndash20353
Solomon S Plattner G Knutti R amp Friedlingstein P Irreversible climate change due to carbon dioxide emissionsProc Natl Acad Sci 106 1704ndash1709
Streets D G Wu Y amp Chin M Two-decadal aerosol trendsas a likely explanation of the global dimmingbrighteningtransition Geophys Res Lett 33 L15806
Swank W T amp Crossley D A Introduction and sitedescription In Ecological Studies Vol 66 Forest Hydrologyand Ecology at Coweeta (W T Swank amp D A Crossley eds)Springer-Verlag New York pp 3ndash16
Swift L W Cunningham G B amp Douglass J E Climateand hydrology In Ecological Studies Vol 66 ForestHydrology and Ecology at Coweeta (W T Swank amp D ACrossley eds) Springer-Verlag New York pp 35ndash55
Trewartha G T An Introduction to Climate Mc-Graw HillNew York USA
901 S H Laseter et al | Long-term temperature and precipitation trends Hydrology Research | 436 | 2012
Vose J M amp Swank WT Effects of long-term droughton the hydrology and growth of a white-pine plantationin the southern Appalachians For Ecol Manage 6425ndash39
Wild M Global dimming and brightening a reviewJ Geophys Res 114 D00D16
Williams J W amp Jackson S T Novel climates no-analogcommunities and ecological surprises Front Ecol Environ5 475ndash482
Williams J W Jackson S T amp Kutzbach J E Projecteddistributions of novel and disappearing climates by 2100 ADProc Natl Acad Sci 104 5738ndash5742
First received 18 April 2011 accepted in revised form 18 August 2011 Available online 22 February 2012
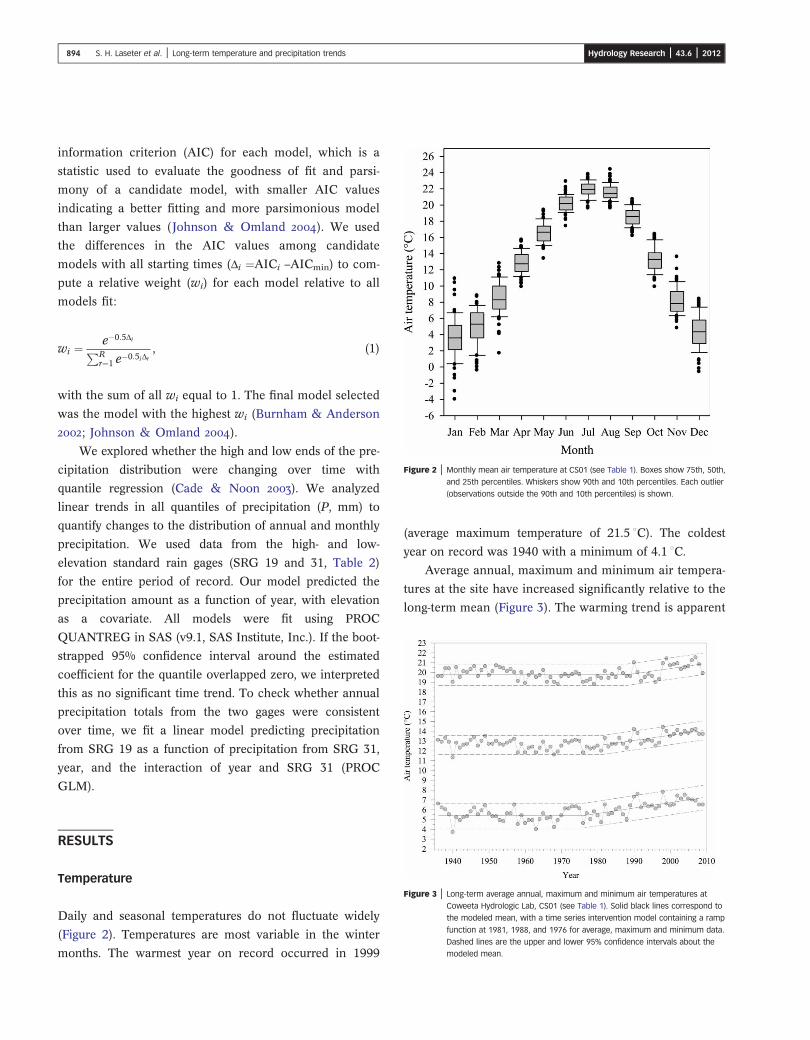
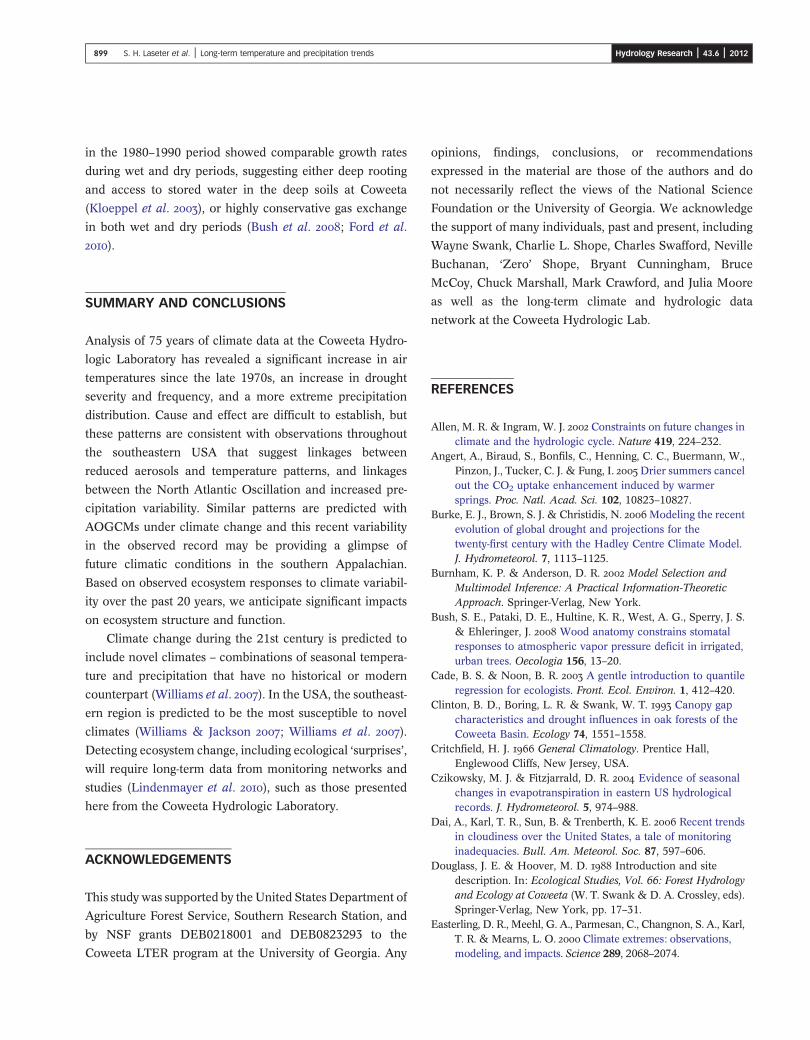