8/19/2019 Lab3E6_Series and Parallel Pump.pdf
http://slidepdf.com/reader/full/lab3e6series-and-parallel-pumppdf 1/13
LabManual
FACULTY OF ENGINEERING & BUILT ENVIRONMENT
SUBJECT: EME3421 LABORATORY INVESTIGATIONS 3
EXPERIMENT 8: SERIES AND PARALLEL PUMP
1.0 OBJECTIVE
i. To demonstrate the basic operation and characteristic of centrifugal pumps.
ii. To differentiate the flow rate and pressure head of a single pump and of two
identical pumps that is run in series or parallel. 2.0 THEORY/INTRODUCTION
Pumps are used in almost all aspects of industry and engineering from feeds to reactors or
distillation columns in chemical engineering to pumping storm water in civil and environmental.
They are an integral part of engineering and an understanding of how they work is important for
any type of engineer.
Centrifugal pump is one of the most widely used pumps for transferring liquids. This is for a
number of reasons. Centrifugal pumps are very quiet in comparison to other pumps. They have a
relatively low operating and maintenance costs. Centrifugal pumps take up little floor space and
create a uniform, non-pulsating flow. This equipment illustrates the basic operation and
characteristics of centrifugal pumps. The equipment will explore flow rates and pressure head of
a single pump and of two identical pumps that are run in series or in parallel. In this equipment,
there are two pumps connected through a pipe work that allows for them to be operated
individually, in series or in parallel. When identical pumps are in series the pressure head is
doubled but the flow rate remains the same. This is useful when a high pressure is needed but
the same flow rate as of a single pump is sufficient. When pumps are run in parallel the flow is
increased and the pressure head produced is around the same as a single pump.
Pumps are devices that transfer mechanical energy from a prime mover into fluid energy to
produce the flow of liquids. There are two broad classifications of pumps: positive displacement
and dynamic. In the experiments, students are able to operate Horizontal Single Stage
Centrifugal Pump (PI) and (P2) in different arrangement-single, parallel and serial.
2.1 Dynamic Pumps
Dynamic pumps add energy to the fluid by the action of rotating blade, which increases the
velocity of the fluid. Figure 1 shows the construction features of a centrifugal pump, the most

8/19/2019 Lab3E6_Series and Parallel Pump.pdf
http://slidepdf.com/reader/full/lab3e6series-and-parallel-pumppdf 2/13
commonly used type of dynamic pump.
Figure 1 Construction features of a centrifugal pump
2.2 Horizontal Single Stage Centrifugal Pump
Centrifugal pumps have two major components:
1. The impeller consists of a number of curved blades (also called vanes) attached in a regular
pattern to one side of a circular hub plate that is connected to the rotating driveshaft.
2. The .housing (also called casing) is a stationary shell that enclosed the impeller and supportsthe rotating drive shaft via a bearing.
A centrifugal pump operates as follows. The prime mover rotates the driveshaft and hence
the impeller fluid is drawn in axially through the centre opening (called the eye) of the housing.
The fluid then makes a 90° turn and flows radially outward. As energy is added to the fluid by
the rotating blades (centrifugal action and actual blade force), the pressure and velocity increase
until the fluid reaches the outer tip of the impeller. The fluid then enters the volute-shaped
housing whose increased flow area causes the velocity to decrease. This action results in
decrease kinetic energy and an accompanying increase in pressure.
The volute-shaped housing also provides a continuous increase in flow area in the direction
of flow to produce a uniform velocity as the fluid travels around the outer portion of housing
and discharge opening.
Although centrifugal pumps provide smooth, continuous flow, their flow rate output (also
called discharge) is reducing as the external resistance is increase. In fact, by closing a system
valve (thereby creating theoretically infinite external system resistance) even while the pump is
running at design speed, it is possible to stop pump output flow completely. In such a case, no
harm occurs to the pump unless this no-flow condition occurs over extended period with
resulting excessive fluid temperature build up. Thus pressure relief valves are not needed. Thetips of the impeller blade merely shear to through the liquid, and the rotational speed maintains
a fluid pressure corresponding to the centrifugal force established. Figure 2 shows the cutaway
of a centrifugal pump
8/19/2019 Lab3E6_Series and Parallel Pump.pdf
http://slidepdf.com/reader/full/lab3e6series-and-parallel-pumppdf 3/13
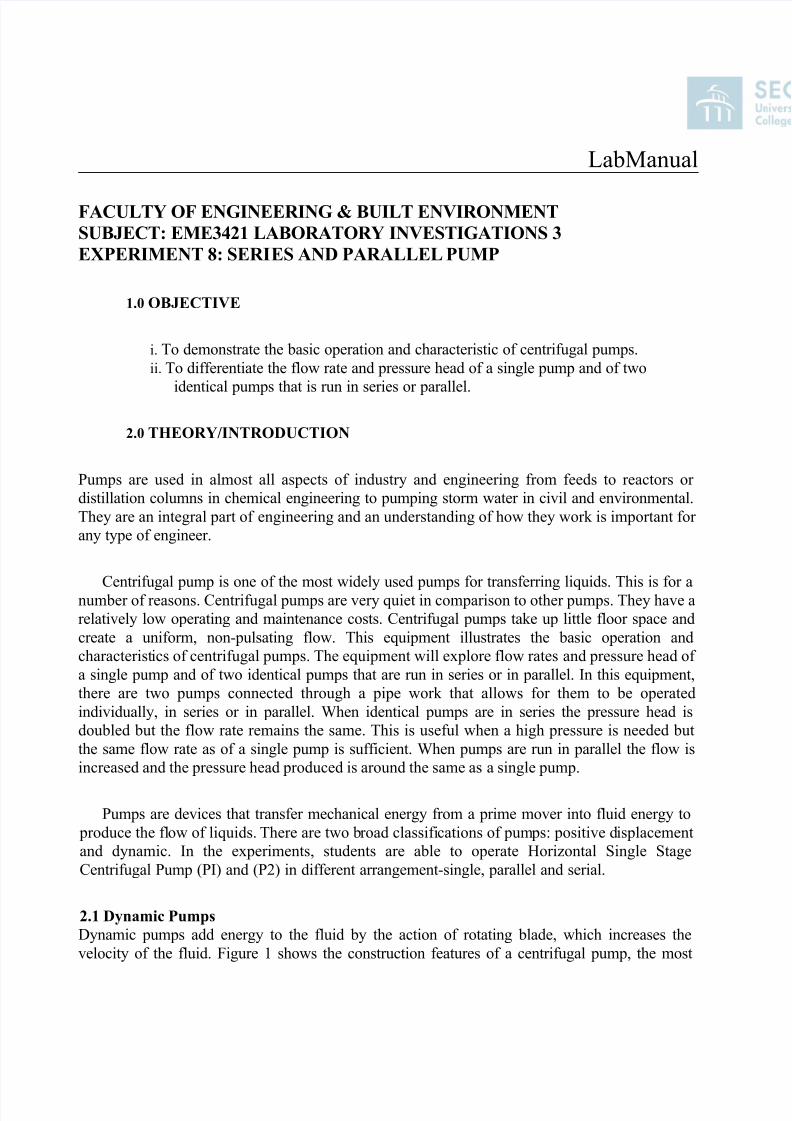
Figure 2 The Cutaway of a Centrifugal Pump
2.2.1 Pump Head versus Flow rate Curves for Centrifugal Pumps
Figure 3 shows pump head versus flow rate curves for a centrifugal pump. The solid curve
shows the rate for water, whereas the dashed curve is for a more viscous fluid such as oil. Most
published performance curves for centrifugal pumps are for pumping water. Notice from Figure
3 that using a fluid having a higher viscosity than water results in a smaller flow rate at a given
pump head. If the fluid has a viscosity greater than 300 times that of water, the performance of a
centrifugal pump deteriorates enough that a positive displacement pump is usually
recommended.
Figure 3 Pump Head versus Flow rate Curves for Centrifugal Pump for water and for a more
viscous liquid
The maximum head produced by a centrifugal pump is called pump shutoff head because an
external system valve is closed and there is no flow. Notice from Figure 4 that as the external
system resistance decrease (which occurs when a system valve is opened more fully), the flow
rate increases at the expense of reduced pump head. Because the output
Flow rate changes significantly with external system resistance, centrifugal pumps are rarely
used in fluid power systems. Zero pump head exists if the pump discharge port were opened to
the atmosphere, such as whenfillingnearby open tank with water. The open tank represents
essentially zero resistance to flow for the pump. Figure 4 shows why centrifugal pumps are
desirable for pumping stations used for delivery water to homes and factories. The demand for
water may go to near zero during the evening and reach a peak during the daytime, but a
centrifugal pump can readily handle these large changes in water demand. Since there is a great
deal of clearance between the impeller and housing, centrifugal pumps are not self-priming,
unlike positive displacement pumps. Thus if a liquid being pumped from a reservoir located
below a centrifugal pump, priming is required. Priming is the prefilling of the pump housing and
8/19/2019 Lab3E6_Series and Parallel Pump.pdf
http://slidepdf.com/reader/full/lab3e6series-and-parallel-pumppdf 4/13
inlet pipe with the liquid so that the pump can initially draw the liquid and pump efficiency.
Priming is required because there is too much clearance between the pump inlet and outlet ports
to seal against atmospheric pressure. Thus the displacement of a centrifugal Pump is not positive
where the same volume of liquid would be delivered per revolution of the driveshaft.
The lack of positive internal seal against leakage means that the centrifugal pump is not
forced to produce flow when there is a very large system resistance to flow. As system
resistance decrease, less of the fluid at the discharge port slips back into the clearance spaces
between the impeller and housing, resulting in an increase in flow. Slippage occurs because the
fluid follows the path of least resistance.
2.2.2 Performance Characteristic Curves for Centrifugal Pumps
When Centrifugal Pump manufacturers test their pumps, they typically produce (for a given
geometry and speed) performance curves of head, overall efficiency, and input shaft power
versus flow rate of the specified fluid. Figure 5 shows these three curves plotted on the same
graph. Note that as the flow rate increases from zero, the efficiency increases from zero until it
reaches maximum, and then it decreases as the maximum flow rate is approached. The pointwhere the maximum efficiency occurs is the best efficiency point (BEP), and the corresponding
flow rate is the design flow rate. When selecting a pump for a given application, it is usually
desirable to use a pump that will operate near its efficient point. Maximum efficiency values for
centrifugal pumps typically range from 60% to 80%.
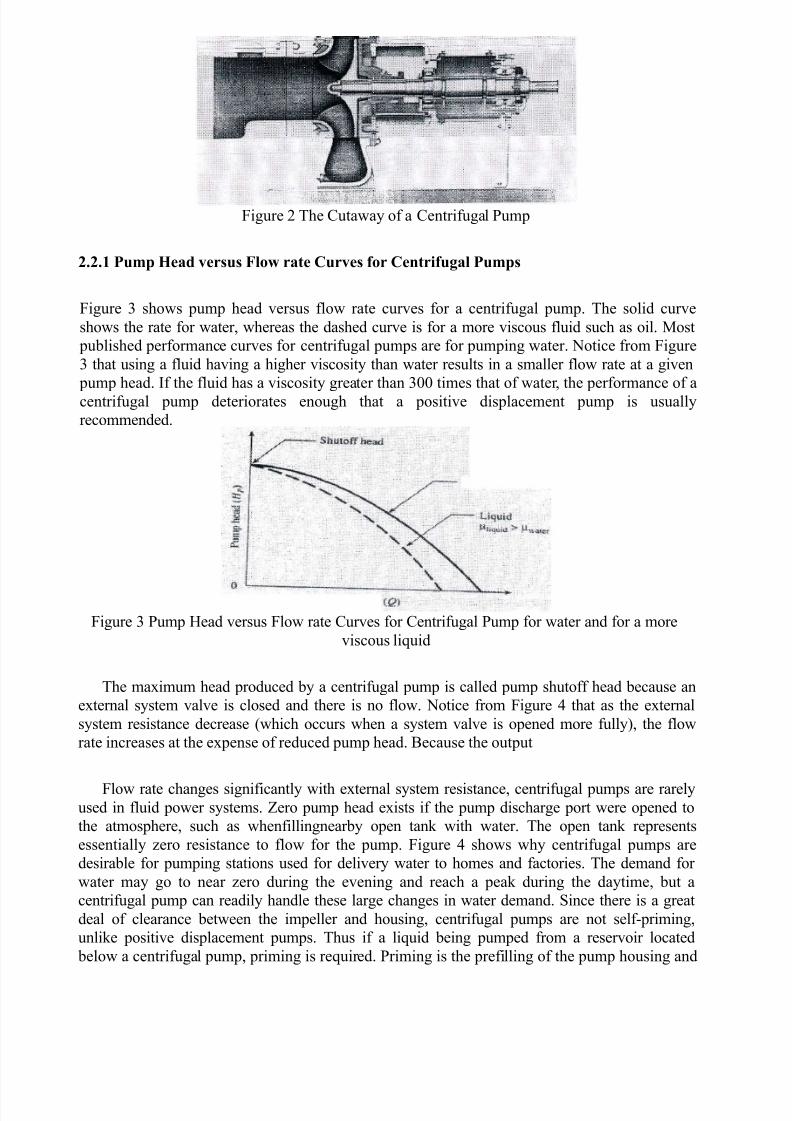
2.3 Centrifugal pump connected in Parallel
If a single pump does not provide enough flow rate for a given application, connecting two
pumps in parallel as shown in Figure 4, can rectify the problem. The effective two-pump
performance curve is obtained by adding the flow rates of each pump at the same head. As
shown, when two pumps are connected in parallel, the operating points shift from A to B,
providing not only increased flow rate as required but also greater head. Figure 6 shows
identical pumps, but the pumps do not have to be the same.
8/19/2019 Lab3E6_Series and Parallel Pump.pdf
http://slidepdf.com/reader/full/lab3e6series-and-parallel-pumppdf 5/13
Figure 4 Two centrifugal pumps connected in parallel
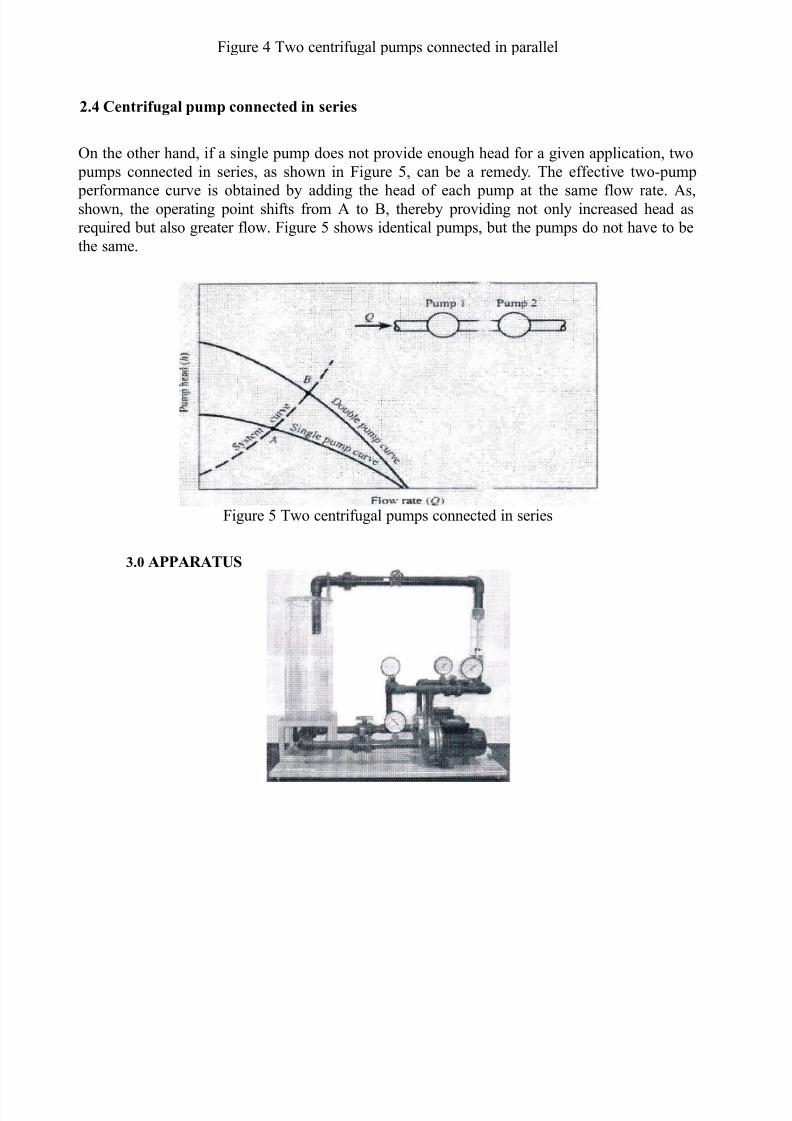
2.4 Centrifugal pump connected in series
On the other hand, if a single pump does not provide enough head for a given application, two
pumps connected in series, as shown in Figure 5, can be a remedy. The effective two-pump
performance curve is obtained by adding the head of each pump at the same flow rate. As,shown, the operating point shifts from A to B, thereby providing not only increased head as
required but also greater flow. Figure 5 shows identical pumps, but the pumps do not have to be
the same.
Figure 5 Two centrifugal pumps connected in series
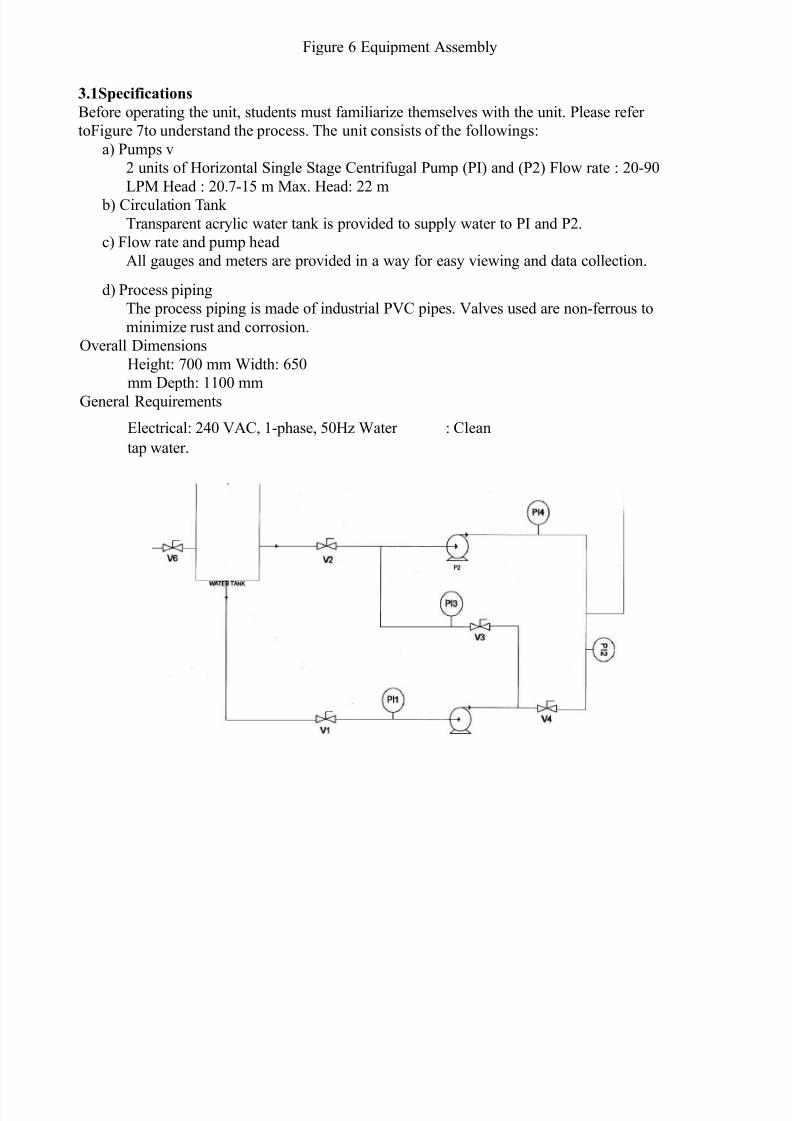
3.0 APPARATUS
8/19/2019 Lab3E6_Series and Parallel Pump.pdf
http://slidepdf.com/reader/full/lab3e6series-and-parallel-pumppdf 6/13
Figure 6 Equipment Assembly
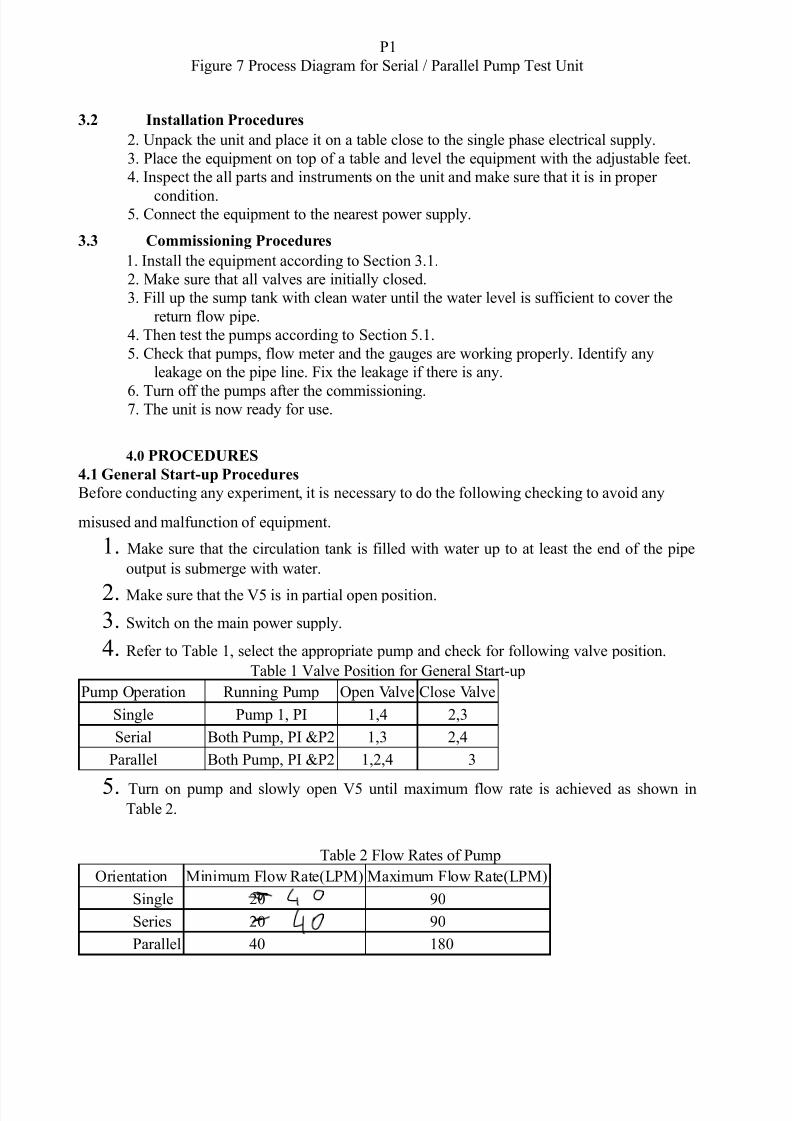
3.1Specifications
Before operating the unit, students must familiarize themselves with the unit. Please refer
toFigure 7to understand the process. The unit consists of the followings:
a) Pumps v
2 units of Horizontal Single Stage Centrifugal Pump (PI) and (P2) Flow rate : 20-90
LPM Head : 20.7-15 m Max. Head: 22 m
b) Circulation Tank
Transparent acrylic water tank is provided to supply water to PI and P2.
c) Flow rate and pump head
All gauges and meters are provided in a way for easy viewing and data collection.
d) Process piping
The process piping is made of industrial PVC pipes. Valves used are non-ferrous to
minimize rust and corrosion.
Overall Dimensions
Height: 700 mm Width: 650
mm Depth: 1100 mm
General Requirements
Electrical: 240 VAC, 1-phase, 50Hz Water : Clean
tap water.
8/19/2019 Lab3E6_Series and Parallel Pump.pdf
http://slidepdf.com/reader/full/lab3e6series-and-parallel-pumppdf 7/13
P1
Figure 7 Process Diagram for Serial / Parallel Pump Test Unit
3.2 Installation Procedures
2. Unpack the unit and place it on a table close to the single phase electrical supply.
3. Place the equipment on top of a table and level the equipment with the adjustable feet.
4. Inspect the all parts and instruments on the unit and make sure that it is in proper
condition.5. Connect the equipment to the nearest power supply.
3.3 Commissioning Procedures
1. Install the equipment according to Section 3.1.
2. Make sure that all valves are initially closed.
3. Fill up the sump tank with clean water until the water level is sufficient to cover the
return flow pipe.
4. Then test the pumps according to Section 5.1.
5. Check that pumps, flow meter and the gauges are working properly. Identify any
leakage on the pipe line. Fix the leakage if there is any.
6. Turn off the pumps after the commissioning.7. The unit is now ready for use.
4.0 PROCEDURES
4.1 General Start-up Procedures
Before conducting any experiment, it is necessary to do the following checking to avoid any
misused and malfunction of equipment.
1. Make sure that the circulation tank is filled with water up to at least the end of the pipe
output is submerge with water.
2. Make sure that the V5 is in partial open position.
3. Switch on the main power supply.
4. Refer to Table 1, select the appropriate pump and check for following valve position.
Table 1 Valve Position for General Start-up
Pump Operation Running Pump Open Valve Close Valve
Single Pump 1, PI 1,4 2,3
Serial Both Pump, PI &P2 1,3 2,4
Parallel Both Pump, PI &P2 1,2,4 3
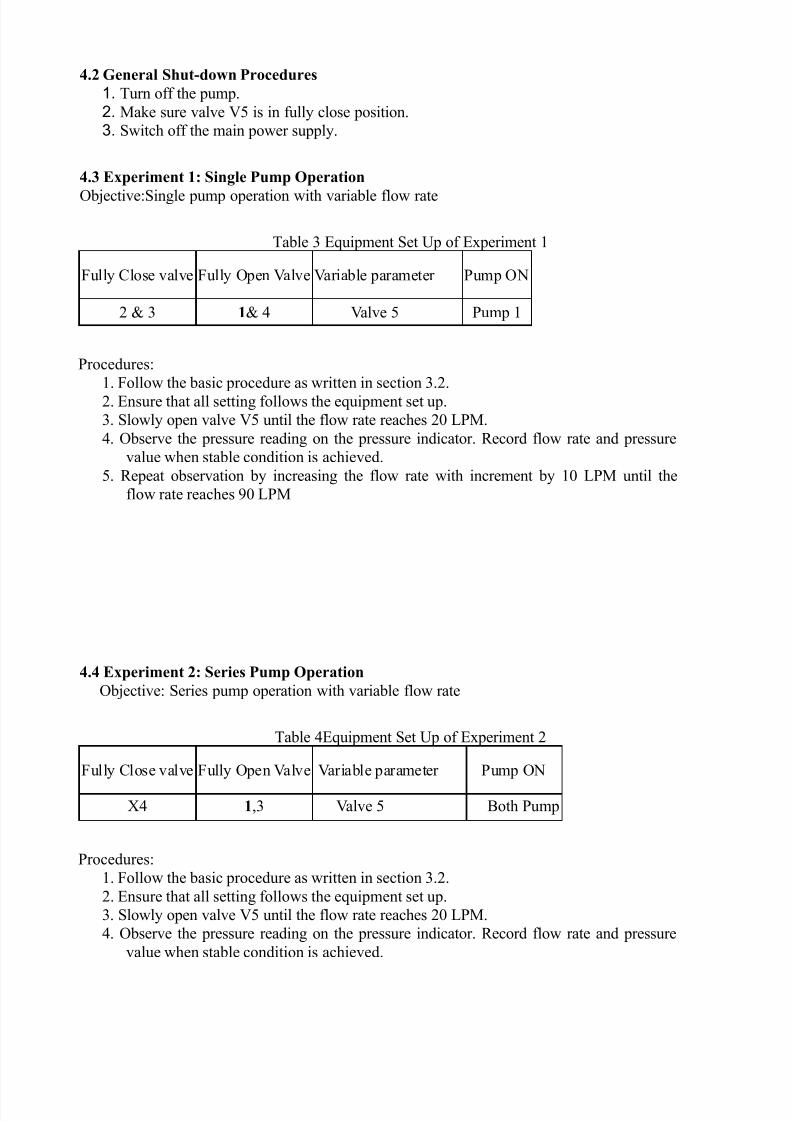
5. Turn on pump and slowly open V5 until maximum flow rate is achieved as shown inTable 2.
Table 2 Flow Rates of Pump
Orientation Minimum Flow Rate(LPM) Maximum Flow Rate(LPM)
Single 20 90
Series 20 90
Parallel 40 180
Eto
8/19/2019 Lab3E6_Series and Parallel Pump.pdf
http://slidepdf.com/reader/full/lab3e6series-and-parallel-pumppdf 8/13
8/19/2019 Lab3E6_Series and Parallel Pump.pdf
http://slidepdf.com/reader/full/lab3e6series-and-parallel-pumppdf 9/13
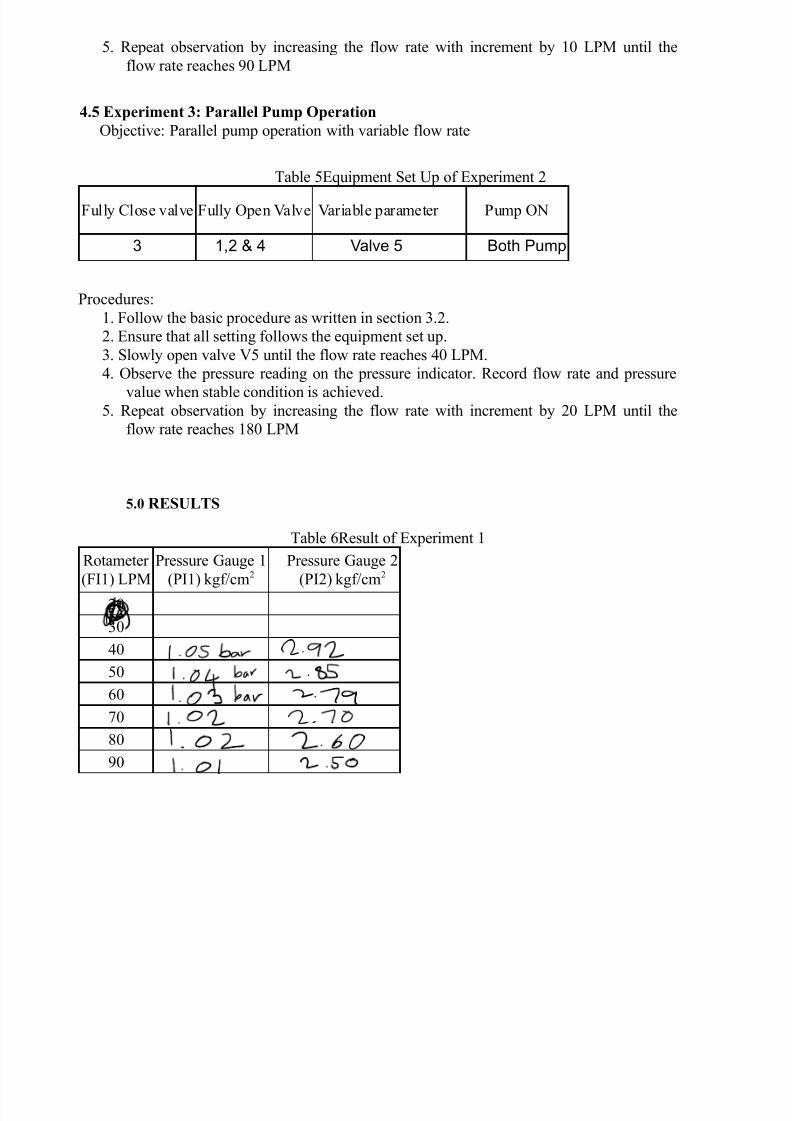
5. Repeat observation by increasing the flow rate with increment by 10 LPM until the
flow rate reaches 90 LPM
4.5 Experiment 3: Parallel Pump Operation
Objective: Parallel pump operation with variable flow rate
Table 5Equipment Set Up of Experiment 2
Fully Close valve Fully Open Valve Variable parameter Pump ON
3 1,2 & 4 Valve 5 Both Pump
Procedures:
1. Follow the basic procedure as written in section 3.2.
2. Ensure that all setting follows the equipment set up.
3. Slowly open valve V5 until the flow rate reaches 40 LPM.
4. Observe the pressure reading on the pressure indicator. Record flow rate and pressure
value when stable condition is achieved.5. Repeat observation by increasing the flow rate with increment by 20 LPM until the
flow rate reaches 180 LPM
5.0 RESULTS
Table 6Result of Experiment 1
Rotameter
(FI1) LPM
Pressure Gauge 1
(PI1) kgf/cm2
Pressure Gauge 2
(PI2) kgf/cm2
20
30
40
50
60
70
80
90
•
1.05bar
2.92
1.04
bar
2.85
1.03
bar
2.79
1.02
2.70
1
.
02
2 60
.
01
2.50

8/19/2019 Lab3E6_Series and Parallel Pump.pdf
http://slidepdf.com/reader/full/lab3e6series-and-parallel-pumppdf 10/13
sppgh
mm
LPM
M3 g
P
.
-
h
flow
rate
line
of
best
fit
graph
8/19/2019 Lab3E6_Series and Parallel Pump.pdf
http://slidepdf.com/reader/full/lab3e6series-and-parallel-pumppdf 11/13
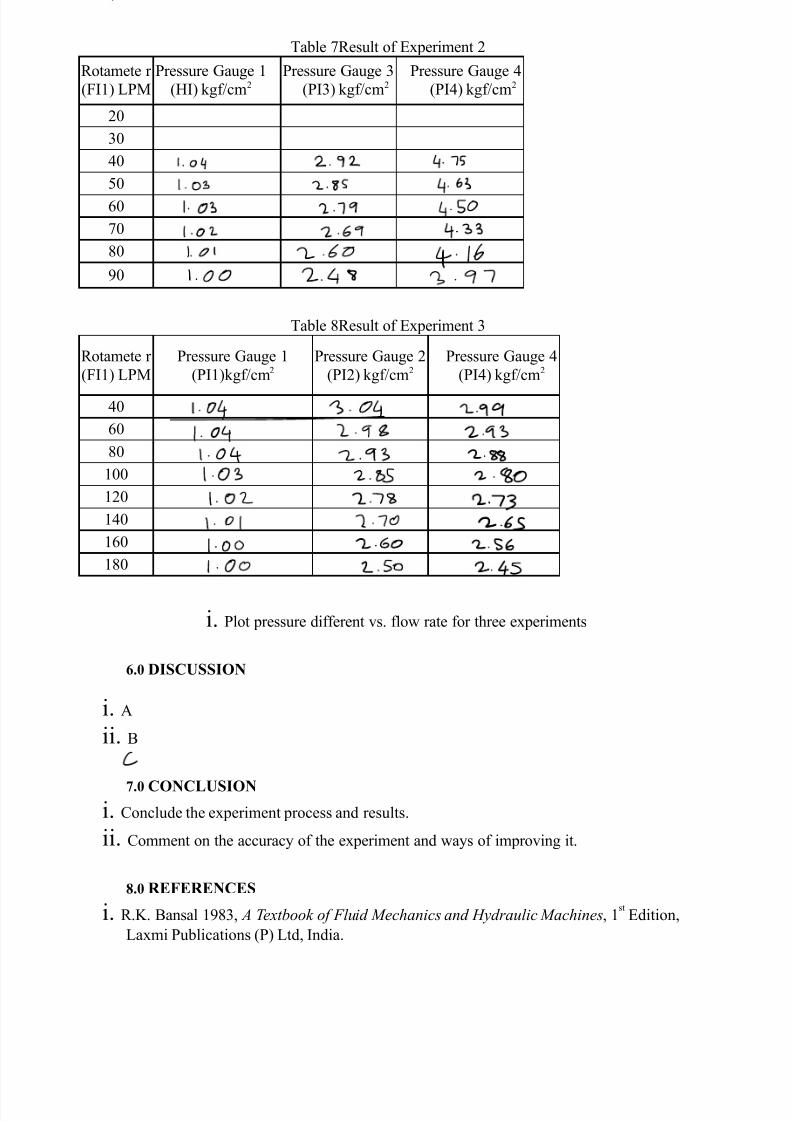
Table 7Result of Experiment 2
Rotamete r
(FI1) LPM
Pressure Gauge 1
(HI) kgf/cm2
Pressure Gauge 3
(PI3) kgf/cm2
Pressure Gauge 4
(PI4) kgf/cm2
20
30
40
50
60
70
80
90
Table 8Result of Experiment 3
Rotamete r
(FI1) LPM
Pressure Gauge 1
(PI1)kgf/cm2
Pressure Gauge 2
(PI2) kgf/cm2
Pressure Gauge 4
(PI4) kgf/cm2
40
60
80
100
120
140
160
180
i. Plot pressure different vs. flow rate for three experiments
6.0 DISCUSSION
i. A
ii. B
7.0 CONCLUSION
i. Conclude the experiment process and results.
ii. Comment on the accuracy of the experiment and ways of improving it.
8.0 REFERENCES
i. R.K. Bansal 1983, A Textbook of Fluid Mechanics and Hydraulic Machines, 1st Edition,
Laxmi Publications (P) Ltd, India.
:
4
2.92
4.75
1.03
2.85
4.63
1.03
2.79
4.50
1.02
2.69
4.33
1.01
2.60
4.16
1.00
2.48
3.97
1.04
3.04
2.99
=
04
2.98
2.93
1.04
2.93
2.88
1.03
2.85
2 80
1.02
2.78
2.73
1.01
2.70
2.65
1.00
2.60
2.56
1.00
2.50
2.45
C
8/19/2019 Lab3E6_Series and Parallel Pump.pdf
http://slidepdf.com/reader/full/lab3e6series-and-parallel-pumppdf 12/13
ii. Rama Durgaiah, 2002, Fluid Mechanics and Machinery, 1st Edition, New Age
International (P) Ltd, India.
.
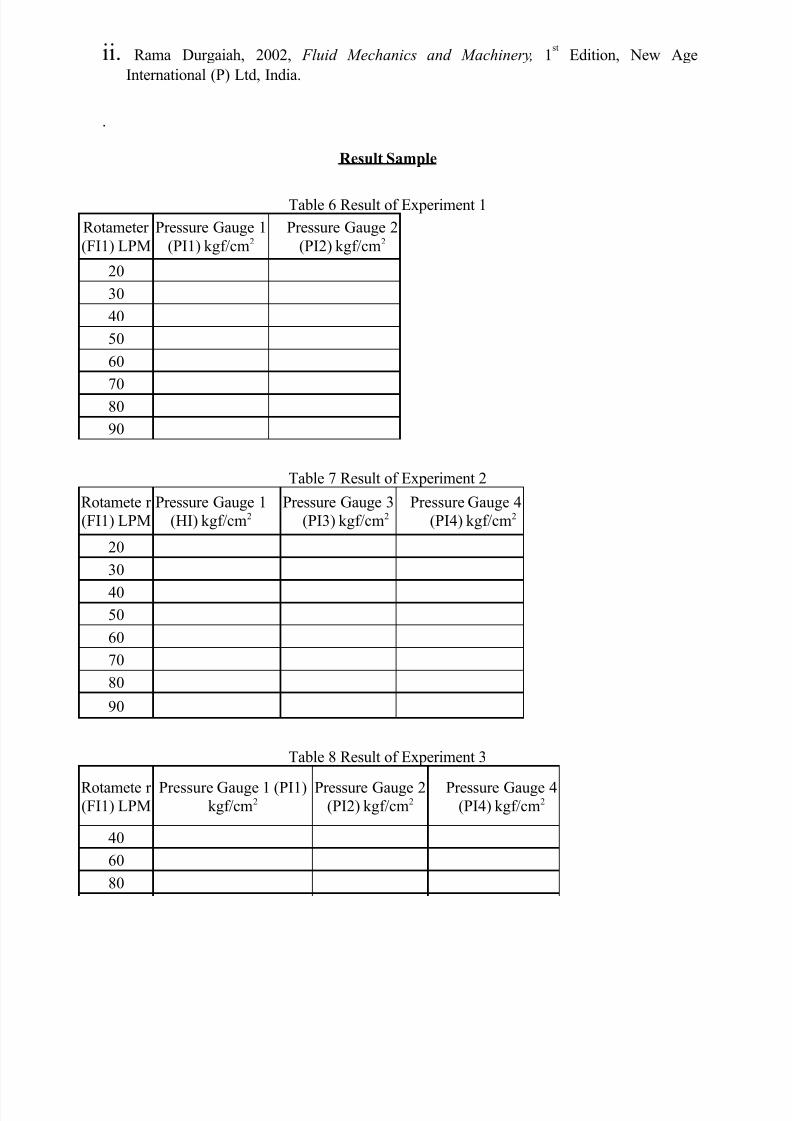
Result Sample
Table 6 Result of Experiment 1
Rotameter
(FI1) LPM
Pressure Gauge 1
(PI1) kgf/cm2
Pressure Gauge 2
(PI2) kgf/cm2
20
30
40
50
60
70
80
90
Table 7 Result of Experiment 2
Rotamete r
(FI1) LPM
Pressure Gauge 1
(HI) kgf/cm2
Pressure Gauge 3
(PI3) kgf/cm2
Pressure Gauge 4
(PI4) kgf/cm2
20
30
40
50
60
70
80
90
Table 8 Result of Experiment 3
Rotamete r (FI1) LPM
Pressure Gauge 1 (PI1)kgf/cm2
Pressure Gauge 2(PI2) kgf/cm2
Pressure Gauge 4(PI4) kgf/cm2
40
60
80

8/19/2019 Lab3E6_Series and Parallel Pump.pdf
http://slidepdf.com/reader/full/lab3e6series-and-parallel-pumppdf 13/13
100
120
140
160
180