KOREA'S DEVELOPMENT PROSPECTS IN HISTORICAL PERSPECTIVE- Pattern of Growth and Structural Change(l955· 70) -
September t 1972
By
Sung. "wan JoDepartment of Economics
Sogang UniversitySeoul, Korea
KOREA'S DEVELOPMENT PROSPECTS IN HISTORICAL PERSPECTIVE- Pattern of Growth and Structural Change(1955.70) -
September, 1972
C...-··· (" ........KS
338.915195J62
Sogang Univ., Seoul.Korea's Development Prospects in Histor
ical. Perspective - Pattern of Growth andStructural Change (1955-70). Sung-Hwan Jo.Sep. 1972.
74 p.Bibliography: p. 74Final report of USAID/Korea Trust-Fund
Research "Korea's Development Prospects inHistorical Perspective".
1. Economic conditions - KS. 2. Development planning KS. 3. Economics - Statistics - KS. 4. Economic development - KS. I. Jo, Sur '{1;o1an. II. Title.
By
Sung. "wan JoDepartmen t of Economics
Sogang UniversitySeoul, Korea
- 1 -
This is the final rep!)rt of t.he UShnyKorcn Trust-Fund Hescarch
Project titled "Korea's DcvelJpqncnt Prcspect~ in Historical
Perspective," \'lhich \-laS intiatec in l.fay, 1t;7<:. The research project
has been carried out, over the ;)cricd of pnst two and one half years,
in cl('sE:: CG-ol"'l.:inati,)n Hith i'1'of£;5sors Gustav I,.anis and John C. H. Fei
of Yale University Economic Grol'lth C(;nter who conceived the idea of
this trust-fund research project. 1-\)1' the formulation of the
unalytic frame\'/Grk, the present Hriter has heavily l!rm·m on the
basic cancer_ ts nn:~ t00ls recently ~:€velcpcd by professors Hunis ard
Fei. In fGct, in eve.ry st~ge of this resenrch \wrk, he has "lorked
clos€:ly "/ith these cmi,lCnt sch'-:.lars at u. series of joint discus-
sions mcctine h(;;1.: in Seoul on:l Tnipei nlternntely in almost every
summer an~ Hinter :i.n the ;mst two an:l one hr.lf year:>. The frrunew)rk
of cl:li-:'iricnl Lln~lysis anL!. hYl- :theses took shnpc an:i f:10St basic data
'-I€r€: systu:lLtic~111~1 nrLc.nizE'c: ~·:ithin the first lr months through
mnny stc.gES c,f the ;~r':")ce5s "f intel'8.cticns bet"lcen em~irical findings
::.nc furth(T _!(;velo~Jncnt ',f cf'ncq:tuc.l frar.l(_Mf~Tk. Thoueh the present
wrtter vlnS deEply involvec in this jc:int rcsec.rch effort , ~rticipating
in ::iscussions-:.,f the: f~rtl1l1 !J(del, the methn~~s, the data, and the
inb.:r~r(;:,~tion, his f:lllin .1.ctivitics ;'1(;1'(, more ::-.1' less concerned \'lith
th~ "U..il:iricnl portions" of thE: jeint research eff<;rts. In essence,
- 2 -
it will be, therefore, ap;>ropriate t<, take the contents of this
report as the "Korean portionll of tht. bror..der related research
project consisting of an integrated analysis oJf other East Asian
Hopen, <luclistic economies" \1hich hes teen Boi.ne 0n under the
(~irection of Professors Hanis and. Fei.
This report is not intem.~6d ta reflect all the aspects of our
past research activities, which have been sufficiel~ly reflected in
n series of the progress reports ~)revicusly submittC(~ to US1JD/Korea.
It is rather analytically organiz(.~ tc summ~rize majvr fi~:ings frem
the theoretical and empirical analysis of the growth ane: structural
change of the postwar Korean economy (1955-70) within the analytic
framc\'1ork of the Hunis-Fei mo::!el of "open, dualistic labor surplus
econorr.y." This study is more or less designed to help answer the
fW11amental questions: (1) what are the long-run requirements of
attaining balnncec self-sustQining growth? an..: \'lhut shoulJ ~e the
policy Taix, corresi/on~ing tc euch stuge cr "sub-phase" of cevelopment,
requirec to achieve this long-run objective? The present report has
attempteel to an.:l.lyze c:!.nd tr,'J.ce nnc~ the erovJth pattern an:: structural
chD.nge of the postwar Korean economy c:!.ml to prcvi...-:e, bused on this
analysis, alternctive policy ,:irections for Kcren IS smo·:)th transi
tion towa~~ economic nat~'ity.
I am greatly indebted to Messrs. Thomas F. OlmsteJ nne Frank
Maresca of l~IDJ,Jashingtonwho ren.::ered all the necessary supports
in the early ph0SC of this study c.uring their stay ~t UStJI1Korea.
- 3 -
I would like in particular to express my sincere gratitude to
Dr. Hoger fl. Scdjo of US1JIYKorea, whu is on leave from his teaching
post at Utah State University, for his CnC I )urllgr.1ent, helpful sugges-
tions and efficient adrnin~3trative.support in nmny stages of this
study.
Sung-HWan JcSogang UniversitySeoul, KoreaSeptember, 1972
- 4 -
CONTENTS
][~()[)tJ(;~.][()tJ.• • • • • • • • • • • • • • • • • • • • • • • • • • • • • • • • • • • • • • • • • • • • • JL
I. C01-iPj.J?.i~TIVE ST1\T IC l\.NilLYS :m . 4
(1) l\gricultural Sector.............................. 5
(2) Heal \lages and Cons\.lr.lption...................... e
(3) Non~lgriculturnlSector......................... 10
(4) Foreign Trade................................... 12
(5) Investment and Saving........................... 16
(C) Structural Chanee During th€ Transition Period.. le
II. DYNANIC lLSPECTS OF THE GRCMTH PhTH: T1lliNING FOINTS. • 26
III. CONCLUSIONS hIID POLICY n·trLIChTIONS
(1) Growth Pattern ane. Policy Rules in Different
SUbphnse of Trnnsition Growth................... 33
(2) The Case of Kcrenn Gro~rrh Experience............ 37
(3) Basic Policy Directions......................... 4J
BIBLIOGrwiPHY
5 -
INTRODUCTION
The objective of this study is to Clnlllyze the growth and
structural change of the postwar Korean economy (1955-70) in the
context of the nnr.lyti::: franel'lork of Rnnis-Fei's extended nodel of
"oper~, dur.listic, lnbol'-burplus econonyll, Clnd to present a set of
i.r.1plicD.tions of our nnr.lysis for development poli.cy nnd strategies
for meeting current und future growth probler.1S.
Fron a long-run historical perspective, the postwar growth of the
Korean economy and of fdUny other developing countries in Southeast
Asia represent'3 a unique grm-Tth process, which is often referred to as
"trunsition growth ll, ir.lplying 0. transition frop.!. a.n end of colonio.l
economic systen to the no.tionnl efforts to enter on era of lI modern
economic growth".l Before the Horld \far II, Korea sho.r€,d with most
developing countries a cornraon heritage of colonial economic system
i.9. 0. predominantly agricultural econony \-lith an II enclave" devoted to
the exports of primnry (or Iand-bo.sed) products. The conclusion of the
\-[orld ~lnr II ho.s l€-G to the new nutionnl efforts in onny developing
countries with vo.rying cegrees of success town~~ the entry of n new
epoch of nodcrn cconomc growth. The period of postwo.r growth in laany
developing countries is a unique historiccl experience of "trnnsition"
frola the colonial epoch to the epoch of modern economic growth.
I 1I.S defined by Simon Kuznets in HoJ.ern Economic Growth: Rate,Structure and Spreo.d, New Haven: Yale University Press, 1966; and alsoJohn C. H. Fei and Gustnv Ranis, "Economic Development in HistoricalPerspective," American Economic Review, r-my 1969.
-6-
In Koren, however, the initintion of all-out nntionnl ~fforts toward
trnnsition and GTowth, ~ftcr more thun a G~neretion of Jn~~nese
colonial rule, \flUS delayed Ly clisruptivc eff€.cts of i?artition and
Korean War. Neglectin[ th~se effects, and pertly du~ to lack of
available dnt~, we shall tcke the initial period of transition as
1955-57 nnd the terminal period for which lat€:st data nre available
is 19(7-[9. Furthermore, Koren's growth experience represents
transition grm-lth of a pnrticular type: an fillen dualistic economy
of a labor-surplus tYl)e. Openness refers to the importance of
foreign trade as en ~s~ect of growth: Korea is sranll in size
calling for a strateeically important role of foreign trade.
Dualism refers to the coexistence of traditional aGTicultural and
moclern non-agricultural sectors: KOr'oa has inherited a laree
subsistence africulturnl sector relative to a commercialized non
agricultural sector in her economyG Lnb0r-surplus means the
presence of hibh pcpulD.tion pressure on land at the initiel point
of transition: the post-wcr trnnsiticn viaS st~rted with an
unfavorable natural resource endowment relative to the size of
population and labor force. In addition, as com~arcd with other
members of the open lluL'..listic labor surplus f:J.mily cf developing
cc~tries (like Taiwan, Thaila~l, etc.), Korea inherited a much
less favorable agricultural infrastructure at the outset, while
she hes a relativG]~ strone human r.esource buse, including the
level of general education llnd skills.
The essential problem of transition and growth in this type of
an economy in general and in Korell in particulnr is how to successfully
r~allocate unemployed and underemployed labor force from the subsistence
agricultural. to the cOInrJercinlized non-agricultural sector in order to
1) provide efficient employment for labor force -- the most nbundant
factor- of production and to 2) increase the national product in the
course of the very s~e process of intersectornl labor reallocation.
With the foreign trade sector as un important aspect of gro\vth, such
an economy like Korea is bound to n 'Jve gradually from traditional
land-based growth and export to non-traditional labor-based growth and
export. Based en the central notion that in an open dualistic labor
surplus economy like Korea gro\'lth and enployment will be eenerated in
a fully compleoE;ntary way, the model which will be applied to the
growth experience of Korea will establish a set of the idealized rules
of growth ane policy Qix for attaining growth m1d ~ployment in the
different phases of transition growth process. The characteristic
pattern of 0rowth and structural change of the postwar Korean economy
during the transition period (1955-70) will be brought into a much
sharrer focus, when our c.ttention is concentrated into analyzing the
divergencies of the Kore<:.n experience from thE: idenlized growth path
shown in the model. In this connection, it will be also useful to
contrast, whenever appropriate, Koren's actual ~rowth performance with
that of Taiwan w~ch shares with Korea a common Japanese colonial
- B -
heritage as well as many other characteristics of the initial
structtU"es (initial conditions) of open dualistic labor-surplus
econo~.
In Section I, 0. c'lmparative static nodel will be presented
which l/ill permit us to analyze structurnl chnnee between the initial
and tr3~nal years. In Section II, dynDJDic aspects of the gro\'Jth path
will be briefly denIer! with by en attempt to identify several impurtant
turninS points which nay hnve emerged in the course of the transition
process in Korea. In Section III, the conclusions and policy implica
tions from our analysis uill be presented.
I. COMPi.Ri.TIVE SThTIC ANALYSIS
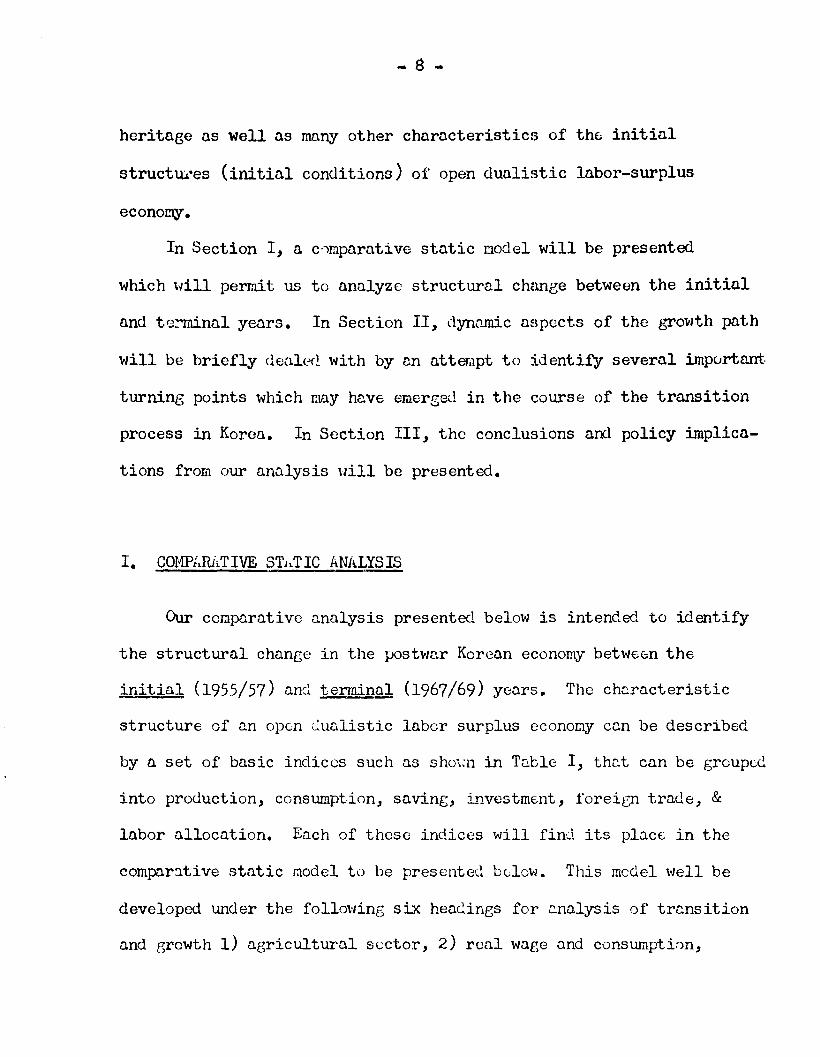
Our comparative analysis presented below is intended to identify
the structural change in the postv/cr Korean economy betw€Gn the
initial (1955/57) and terminal (1967/69) years. The ch~racteristic
structure of an open Junlistic labcr surplus econo~y cen be described
by 0. set of basic indices such as shm;11 in T<ltle I, thc.t can be groupe~
into production, consumption, saving, investment, foreien trade, &
labor allocation. Each of these indices will find its place in the
compnrntive static model to be presented belc\'J. This medel ,.,rell be
developed under the followin5 six hea~ings for ~nalysis of tr~nsition
and growth 1) agricultural sector, 2) renl wage and consumpti0n,
I
-..0
I
.53
.84
.77
.49
.63
.551.18
.54
.83
.56
.48
.40
.80
.391.02
.43
.45
.321.26
dIe
TABLE 1.: COMPARATIVE STATIC ANALYSIS
INITIAL PERIOD TERMmAL PERIODTb.IViAN KOREA PIJUTY TA:fi'lll.N KOREA PliRITY1952-54 1955-57 1967-69 1967-69
a b b/a e d1. V (agricultural labor productivity) $272.6 198.5 .73 658.0 348.72. Q (labor allocation ratio) 42.3% 32.0 .76 58.0 49.03. ~(per cnpita agricultural net exports) $ 19.30 -8.3 - 13.6 -25.34. Ca,I.)(per capita consum:t>tion of ngricultural goods) $138.5 l42.4 1.04 263.2 202.9
40. GDP/X (per capita GDP) $1.31.3 83.4 .64 276.8 136.45. Wa (agricultural I'eo.l wn~e) $303.5 195.0 ~64 472.0 298..06. \ii (industrinl real wnge) $313.8 231.4 .73 529.0 292.17. r (inter-nnl terms of tro.de: Pn/Pi) 97.7% 96.1 .98 96.8 tiO.58. cf (J:ler cepita consumption of industrial goods) ,$221.2 139.5 .63 416.. 5 226.29. K* = K/W (industrial capital labor ratio) $21651 4,809 1.81 3,541 2,948
10. q.= Y/Vl (industr~al ~abor p~oductivit;y) f659.5 541.3 .82 1,442.8 814.311. Y~ = YIP (per cap1ta 1ndustr1ul output) $278.7 169.9 .61 8.37.3 399.7]2. EiL' (per capit.a industrial export8) ~ 16.0 6.8 ..43 225.0 89.413. E/GDP (export rntio) 11.2% 4.1 .37 27.9 22.414. E~ (per c~pitn exports) $ 43.7 11.0 .25 252.8 98.415. Ei/E (inriustrinl sho.re of exports) 36.5% 61.6 1.69 88.8 90.316. Ea/Q (agricultural export rntio) 17.6% 3.1 .18 li.9 5.117. Me/Cd ( import substitution potential index) 8.3% 6.5 .78 10.4 4.718. Mc/M (industrio.l consumer goods share of importw) 26.5% 13.3 .50 19.4 6.319. Mn/(MD.+Q) (c.~riculturo.l import frc.ction) 6.1% 5.6 .92 7.3 9.220. (Sn+Si)/GLP (domestic saving rate) 10.0% -4.1 34.5 17.021. I/GDP (investment rate) 17.0% 15.4 33.1 32.622. Sa/I (ugriculturo.l saving contribution) 16.7% 15.2 24.8 0.923. Sill (industrinl saving contribution) 41.6% -43.5 79.5 51.124. Sf/I (foreign snving contribution) 41.7% 128.31 -4.448.025. X . (population) 8,438rnil 22:,263mi1 13,313mil 30,74lmil26. P ", (labor for~e) 2,B28mil 6,924mil 4z926mil 9,639mil
Cumulative Contribution to Investment Durin~ Transition TABN/(N KOREAarricultural snving r..Sa/r.. I 25. 9% ·~9:b~
industrial saving r:Si/ [J. 68.6% 25.7%forei.gn . silyiI1~ __ ~ .___ tSf/1:I 5.5% 64,8%
- 10 -
3) non-agricultural sector, 4) foreien trade sector, 5) investment
and saving, and 6) structural cha.nee during trnrtsition period.
(1) Agricultural Sector
liS the structural characteristic of the Korean cccnof.1Y at the
initial point was predoninantly aericultura.l, we shall prccccd with
the structure of agricultural sector, fecusinG on agricultural
productivity, the allocation of labor between agricultural and non-
aericultur~l sectors and foreien trade in agricultural goods.
Let us divide the total labor force (p) into an agricultural
labor force (H) and a non-agricultural population (L): P = \1 + L.
Let us denote Q = W/P as the fraction of th~ total l~bcr fcrce in the
non-aericultural sector. Th~n 1 - ~ = L/P is the fraction of the
total labor force in the aericultural sector. Denotin[ Q as the total
output ~)f Q.ericulturnl [oaels nnd v = Q/L as the avero.ge productivity
of aE;ricultural labor, tr.e deno.nd und supply of n@'icultural goods is:
(1) Lv = Q = Cn + Eo.(supply) (der.w.nd)
where the demand for aBricultural Goods is beth for dOill8stic ccnsump-
tion (Co.) and for export (Ea ), refle-ctin£ 0. typi.co.l pnttern of
c0lonio.l pattern of land-based production. Denotin~ D as per capita
quantity fer any variable, tho.t i~, any variable dividoe. by the total
labor force(P), nnd then dividinr. the relation (1) by the total labor
-11-
force, we have: l )
The relntion(2) ShCMS thut n h~thcr n:~-riculturr..l p!'C(:uctivity( If) cun
lead to a c')Ti1bination of (i) a hich(;r p(;r cnpita c::-.nsunption ~t[Lldarcl
(Cn~'), (ii) a hi£h€r por carita p-xport lcvt:!.(f.~,;:), or (iii) a high<;.r
fraction of labor fc~ce alread;y .:.lloc~ltcd ttJ non-<:.griculture(Q).
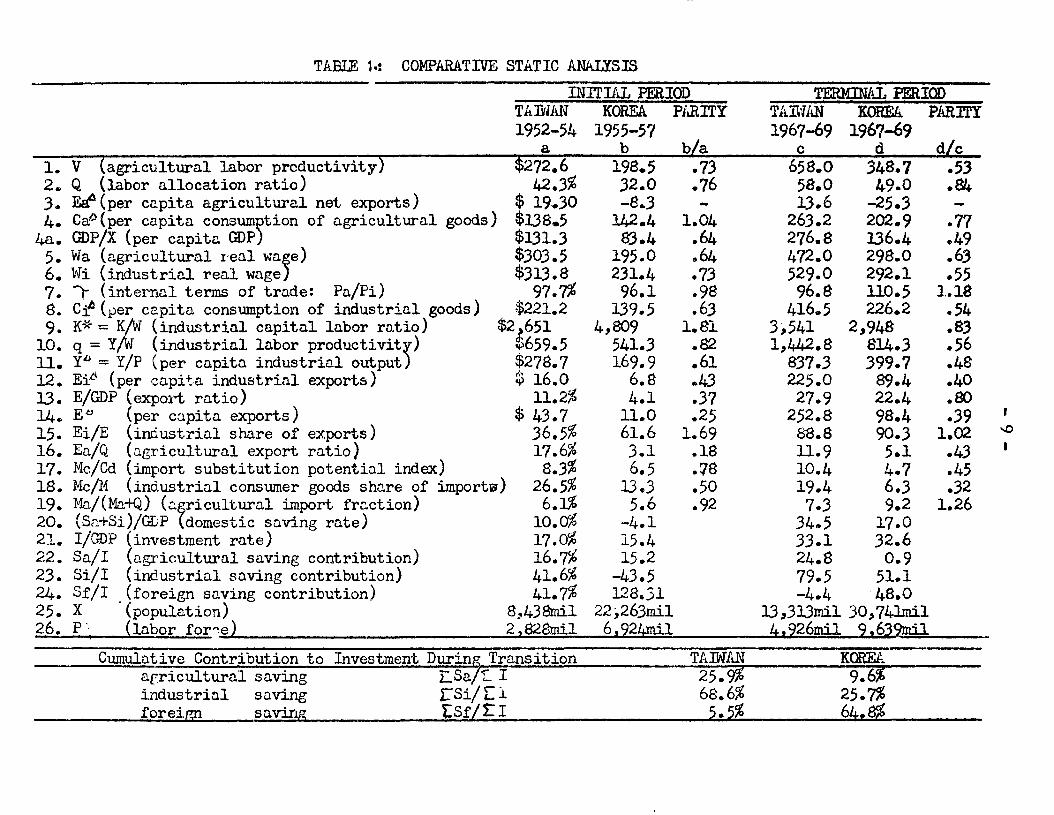
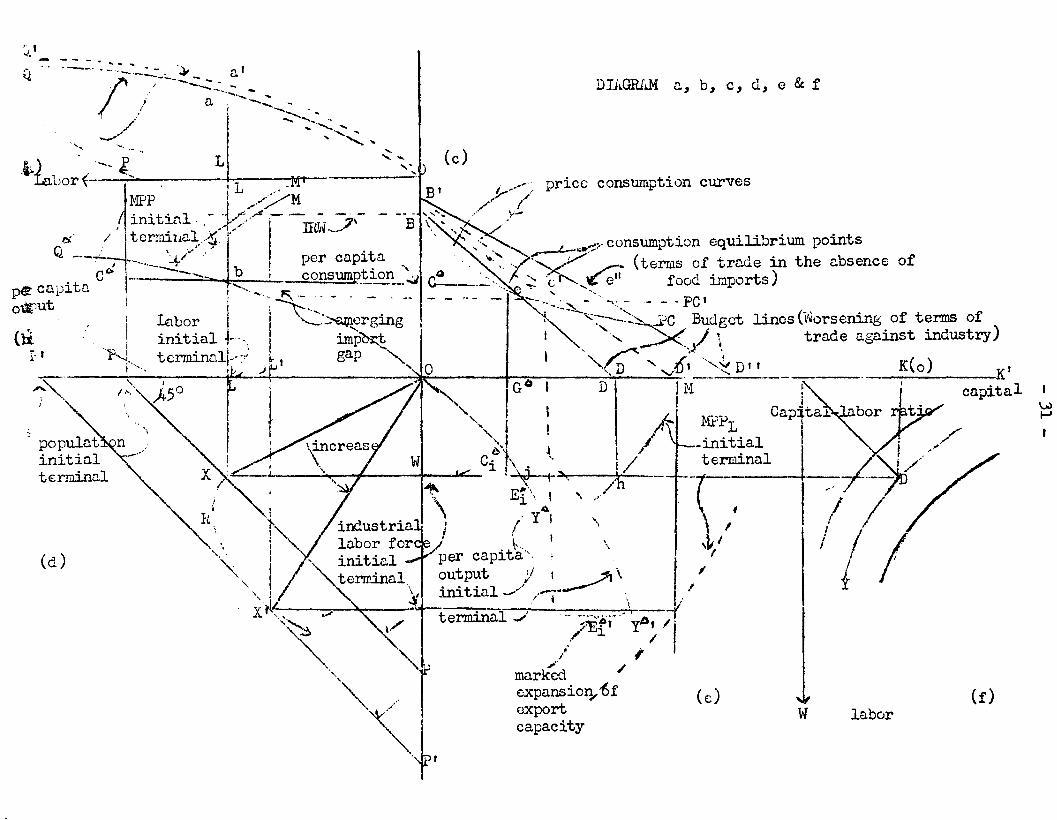
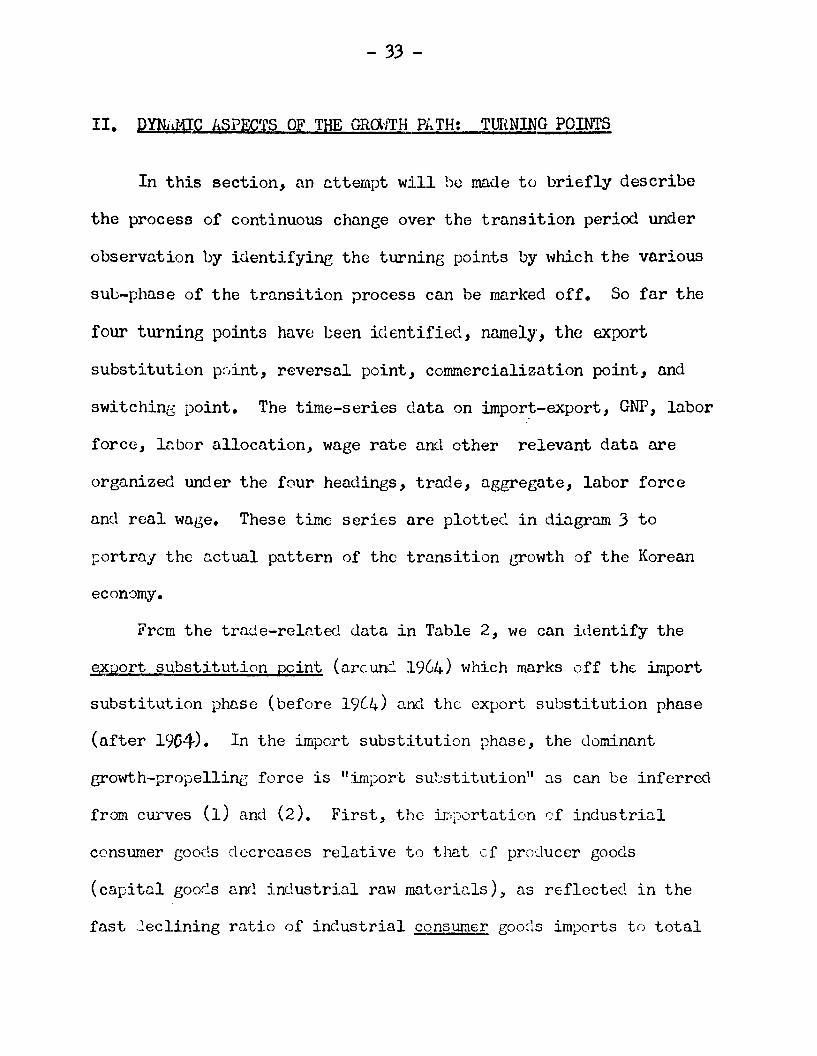
In iir..;:-T£l.m (a), the total productivity Gf a[Ticulturul lu.bor is
the total labor force is measure by a point P 0; I horizontal axis.
The initial aericultural labor force is OL, as measurec~ from the
oricin to the lE:.i't, a~rl the inclustrinl fcr"'€ i c PL. The initia~
agricultural labor productivity( v) is then represented by the sl~-~~(
of a straight line OCl- I~ diacram (b), "lith t>(; S~1e fixed iniU.a..L
pcpulation P and trc, sr..me labor allocC).,tion i:;oint (~.) on the horizor.~al
axis, the per c~pita ucriculturcl cutput is re~)resEnt....-d by the Q -curve,
FroLl Table 1, ~~iD.£ro.ns (a) D.nd (b) ar.d the re1£.tion(2), w€ can
sec a realistic picture of the initial uc;ricultu;-nl conditions in Kc:'ea.
The poor nctill'QI conditions anJ unfcvorr..blc initial a6ricultural
infro.structure in Ko.cc::l is reflecte'_~ in a. ouch 10\ver tic;ricultural labor
productivity "lhich "ms only about 70 ~E;r~ent of thr..t of Tahmn at the
1) illl rcfEcrcD'es to "'Jcr C~1Ditr.1" in Table 1 C).,nl th(; text indi~ates~er capite of total lahcr f~rce(P), 3xcept per capita GDP~ ~hich refersto GOP per c~pita of total P02ulr..tion(X).
-' 12 -
be€~inning of tho transition perio~L (See rO\'1 1 in Table 1). However,
as row 2 of Table 1 shows, Korea I s per capito consur.iption level of
aGricultural goods at th(; initinl perioi ''las about the same as, or even
sl~ ,tly higher than, thD.t of Taiwan, ins~ite of th6 much hiG~er level
of labor j)roductivity in 'rai\oul11. FroE1 the relation (2), we can see that
Taiwan used this c~ifferential between hiGher labor productivity and
relatively 10\'1er constUllption l€:vcl (a[ricultt'ral surplus) .QQ1h to
allocate a higher fraction cf labor to non-agricultural sector and to
export a higher lJOrtion of its ngriculture.l eoods on per capita basis,
thus fimmcing the industrial sector through increasine the foreign
exchange capacity to import capital eoods. Row 2 and 3 clearly
ind:'cate this point. Taiwan had already allocated 42 percent of her
labor force to nrm-n.[:,Ticulture, as aeai nst Kore,a IS 32 ~erc,ont. Uhile
the initial point Taiwan wt..s eX~Grtinf ngriculturnl ~ocds at the rate
of US$19 per capita, Koren ,·ms nlrendy a net illlporter of ::"~Ticultural
goods (about US$8 p8r capita).
Such a sht..rp c:ntrast tiS to initic.l conditions in aGricultural
pr0ductivity clearly sUij,-.::ests itself the cifferent roles pl<:.yed by
the bw aericultural sectc:rs in the course of transi..tion. In the case:
of Tniw<:n, the initinl ex~::crtt..blE:. c.[ricultur.:l sur~)lus provide<.l the
capacity to import cnpitnl goods n.nc. rm"r naterials for industrial
growth in the non-a3.ricultural sector. Furthermore, the fD-vornble
agr'icultural infrastructure provided a stronc base for ccntinued
- 13 -
eXpmlsion of agricultural productivity, thus fulfilling the historicnl
role of agriculture in the course of transiticn. In the case of Korea,
the nsricultur~l sector provid~l no exportable surplus from the be~inninl
point, and remined rolo.tively staenant throuGh,Jut the period, leading
to ever-increasinG food imports. As \'lill be pd.nted out Inter, Korea's
agricultural sector, instead 0: ccntributing tc import capacity and
dooestic savings, i)ut a heavy burden on her industrial sector and
perr.titted forei[]l snvings to pluy a najor role i.n linnncing her
inc:ustri~lizaticnefforts.
(2) Renl \-laces nnd Con~tunpti2!!
In diaGrc.r.l (c), a typical worker's price-consumption curve and
buul:Set line nrc c:rc."m. itS 'Ne c.re ce.:lling with two kinds of cormnodities
(agricultural bocds, measured on ~hc vertic~l axis, and non-agricultural
t;oocls, meo.surec: r;n the horizcntQl axis), the level of the individual
worker's renl waGe c~n be 'represented in two wnys: the re~l waee in
terns of <lLxiculturnl E;oods, (let us ceoll this \·/['.Le "ngricultur~l renl
\'lUeell), nensurcQ by OB on the vertical axis nt the initieol point, and
the renl \·JG.L;C in terr:1.S .)f non-nsriculturc2l boods, I:lensured by OD on
the horizont~l u..xis. The slC'i~e of the budGet line connecting the t\'lO
pcints, Band D, re:::.resents the initi2.1 terns of trade between the
n3ricultural nnj non-ncricultur~l sectors.
- 14-
In the context of a labor surplus dualistic econony, the ronl
wnee in terms of aericulturc.l goods (OB in dia@'mn c) mo.y be considered
ns the II institutionalll reel "m~es (IHH) ",hich is us ually determined by
institutional forces provniline in the traditional aericulturlll sector.
In tho labor surplus condition, the :i.nstitutional real "mge is likely
to be above the mnr::;innl physical procluct (NPPL) of labor in the
aericultural sector. In the course of the transition process, the
institutional real ,·mge is likely to increas e rnodE~rately as long as
IRVl> HPPL. But once laber becomes Sl::Cll1E, ffiH = HPPL and the wage is
expected to follOl'J HPPL thereafter.
In c~iaGrc.m (c), the price-ccnsumption-curve PC is shown and the
typical "/Qrker' s budget line BD is given at the fixed level (DB) of
IR\il. ht the point of e where the the prie-t.-consumpticn curve
inters c cts the budget line, there locates the initial consumption
equilibrium point, indicatin~ the worke~'s purchase of OC units of
a~icu]tural eo~is ane OG w1its cf non-aGricultural bo~JS. Judging
from Table 1, there exists a nece for food imports (food gap) at the
outset (See bel in dia[rnm (t) and r011J 3 iI~ TUble 1). In cQmpc.rison
with the case ef Taiwan, Korea's b~l~et line wust be lower than
Taiwan's, as ref1cctec in lower real wage levels, an~ lower per capita
income (rOl'JS 1,0.. 5. and 6 in Table 1). HO\'Jevcr, the per capita
consULlption of agicu1tural goods are nbcut s().cc as shmJn in I'm·, 4 in
Table 1. These t"10 fects b-:lply that Korea's \'lOrkers, mostly far~ers
- 15 -
at the initial point, consume substantially h~ss non-agricultural
goods on per capita basis. This is confirmed by the elate. in rO\'l e
in Table 1.
(3) Non-;lr:r~9-,..!!.turclSE:ctor
The non-agricultural (or in1ustrinl) s€ctvr ~iffers from the
a6Ticultural sector in the two respects: i) primary factors of
production are now labcr(W) nul capital(K); and ii) the non-a[Ticultural
sector is t1cornmercinlizectll in the sense that the real wage in terms of
non-agricultural goods may no'~ be equatec with the ~arGinal physical
productivity of labor (~1PP"I). In diaEram(f), tht:: "inJustrial" produc
tion map for the initial point is represented by Y, ",ith lnborOn
beine measured on the vertical Qxis and capit~l(K) measured on the
hcri.zontcl axis, \llith a [Siven cD.iJital stock at the initial point,
the HPI\.j-curve is represented by H-curve in diasr~ (e) ~ next to (f).
The initinl industrial labor force ?L in c:inLJrv.n (b) is nOlo' projected
as Otl on the vertico.l n.xis in .:-linLrcr1 (e) ~ \'Iith the aid of a 45-de6ree
tro.nsfcrmation line PP drD.,\·m in c:iacrcm (J). nS thE initinl non
ngriculturnl real \-IUGe (in terms of non-agriculturnl ~oods) is OD in
diagrarn (c) nnc~ (e), the pcint hat ,-,hich l·i-curv€ passes through is
an employment equilibriUI:1 point, inclicatin~ thnt a,i units of workers
are der.w.nded Qt the mm-aETicultural ronl vmge ODe
- 16 -
Now, turning to Table 1, the in~ustri~l wage is sw)stantially
higher in Taiwan (US$3l3) than in Koreo (US$231) in the L."1itial
period, showine the parity of 73% (see row 6). If the initiol produc
tion functions of the two economies D.rE: assumed to hnve been the same,
the hieher inJustrial renl wage in TUDvQn would ~ply a higher cupit~l
labor ratio and also a hifher average industrial labor productivity in
Taiwan. The empiricnl evidence, however, shows that Korea had D. higher
capital intensity (a higher capital-labor ratio) with somewhat lower
industrinl labor productivit~-. Row 9 shows that, while industrial
capital In.bor ratio in Tnhmn wns US$2,650, thnt in Korea was US$4,COO
in the initial period and I'm; 10 shm'ls that industrial labor productivity
in Tnivmn (US$659) "ms somewhat hiGher than that in Korea (US$541) in the
initial period. The combination of higher capitel intensity with lower
industrial lnbor productivity can imply that i) Korea's industrial
sector is usine a capital-using technology with respect to input mix
~nd output mix thnn T,".i\:c.n I ~ inc.ustrinl sector froI!l the be8inning and
that ii) th~ efficiency of Korea's inJustrial sector is initially lower.
Some probnble cnuses of this difference may be trnccd partly to the
Japanese colonial policy which had placed henvy emphnsis on agricultural
develoi)fficnt in Taiwan and on war-related industrialization in Korea and
partly to the ~ore rc~ent post-Korean war oriGin in terms of the initial
industrinl development policies which led r~pidly to the capital-using
and import- dependent structure of industrial production.
- 17 -
The demand and supply of non-agricultural goods can be shown in
the follm"ling relation which is a Btro.ichtforward symmetry to the
relation (2):
(:3) e - q = y':' =
(supply)
where y~~ (YIP) is the
Ci,L\ + ~(-'
(demanc.~)
per capitn. output of non•.aGricultural eoeds and
q is non-nrsricultural labor proc.uctivity.
From row 11 (Table 1), we finel that the initiD.l per capital
industrial output was lower in Korea (US$170) than in Tail-Inn (US$278),
as reflected in the interrelated difference in level of industrial
labor productivity and in fraction of labor force allocated tc non-
aericultural sector in the initial period.
On the demand side, a larger fraction (61%) of Korea's industrial
output was exported from thc initial period as com.pnred "lith Tai\'1an's
initial industrial export ratio (36%), presumably because of Korea's
limited scope for domestic mD.rkct outlet fer inc~ustriul consumer goods
as reflected in lower per capito. GOP and in lcwer real waGes,
particularly far 10\-1 D.6I'icultural real ,·mee.
(4) Foreii:;I1 Trade
\lith respect to the volu..'ac of trade, Korea 'I s tvto.l eXlxJrts as a
fraction of GDP at the initial point, 'oJhich indicates her external
orientation is only 4.1%, \'1hercns that of l'nhmn is 11. 2;~ (rOll 13 in
Table 1). The higher der;ree ,;f external orientnticn in Tahmn at the
- 18 -
initial point can be traced to the initially hieher industrial real
wage and per capita GOP in Tail·mn, if we assume the initial sirr.ilnrity
in the basic natural resource endo~fmcnt.
\'lith respect to the structure of trac~e, Korenls smr.ll volume of
exports ($11 per capita) was, frmn the very beeinnine, dominated by
non-a.griculturnl COr.ID1{),-':ities (62%), \'lhcreas the exports of Taiwan "1€;re
~~ominated by traditional t.LTicultural goods (63.5%), as shown in row 15.
For the analysis of the import dcmnn:.l during the r:eriod of transi
tion grO\rth, it is useful to break do\om total i'llports(l·i) into industrial
consumer Goods imports(Hi) and producers I go<x~s imports (Hp ) , which
includes capital cocds am~ rml nu~terials to bE~ used as inputs in the
industrial sector(H = Hi + l~). This breakdNm is quite useful forI
the analysis of the phen0mcnon of "import-substitution(I-S) growth"which
characterizes the initic.l phase of trnnsiticn growth of develvping
countries. By imrcrt-substitution gowth \'Ie menn an early sub-phase
of the transitiona.l cr~"lth ':rr.:U..."1nt€(l by the devc1opT.1ent of the indieenous
consumer-foods industry "lith tr[lC~itionD.l ccnsumer LOOes imt:crts (~)
Gradually beinG domestically replaced.. In thE' process ()f inport·-
substitution grOl'/th, thE; L-::.port demarK! f·:)r CUiJital gcxls and raw
r:m.tcrials (1.~) is rapidly incr€nsi.nc. RO"IS 17 nnd 18 nrc intended to
describe the potentinl for irlport-sut-stituticn CrrJ'Wth at the initial
point. Ro'\'J 17 indicates that Korca inpcrtee only 6.5% of her total
demand fer inCustrial consumer goods, the corresponding fraction for
- 19 - .
TaiwQn begD.n 8.3%. Row 18 indicates that the imports of Korea were
dominated, from tho beginninG' by capital Boods an~l raw materials for
industrial use (about 66~), while the shure of industrial consumer
eoods in total imports was only 13.3%. Both rows 17 and 18 show that
the industria:i. conSWTIer ,~oods import us u fruction of totul imports
und us a fraction of total industrial demand 'was much less ~portant
in Korea thun in Taiwan. To~ether with Korea's lower per ca~itn GOP
and nee1eeible foreiGn exchange ecrninGs froo her agricultural
exports, this means thut the scope of import substitution of consumer
goods to fo11O\'1 in Korell frocl the initial point on, in terms of J22..1Jl
domestic oorket and import cClpllcity, \'lQS much limited, as compared
with the case of Taiwun.
From the ecrly phas~ of import SUbstitution in the transition
growth, Taiwan's aericultural sectcr pro~:uc(;d nn exported surplus
which provided the i.P.lport capacity for industrial goods including
both consumer eoods and prcducer's goods. Fur.thermore, the increased
income eenerated in the aericulturul sector by the increased acricul
turnl exports provided D.Il cxpandin[ c:Jmestic I:larket for industrial
consumer goods \'/hich hac been initially iLlported and later produced
at home cs the import substitution cn.rx:city \/as teint: built up. In
the CilSC of KQreu, however, e.s the agriculturL~l sectur remnineJ
stllgnant, the process of industrialization, frma the ~eginrrinb' \oms
charilcterized by a "Lilc.tcral" interaction betWEen inc~ustrie.l sector
-·20 -
and foreign sector. From the early phase of transition, Korea
became a net importer of food and obtained foreign exchange
resources, for its industrialization efforts, from foreign savings
and industrial exports.
Such a situation can be also shown in diagram (e). The initial
yD'-curve leads to an initial per capito. output of Wj \Jnits. This
output is in fact higher than domestic demand wei, indicating that
Korea ' s industrial sector is already procucing an exportable surplus,
to partly finance its own import needs. The agricultural sector is
not involved in the process of import financing via trade. To the
extent there is in fact a food deficit, it is already drawing on
the import capacity provided by industrial exports and foreign
capital inflow.
In consequence, the industrial sector, not the agricultural
sector, hns been forcecl to produce an exportable surplus, Industrial
exports tocether with foreign savinGS have been used to finnnce the
iQport of capital goods and raw materials requir~l in the process of
imi.:·ort-suQstitution growth. its the food gap becomes ever Widened,
the incustrinl sector is bUlX~ene~ with the responsibility of
Givertin~ a p~rt of its import capacity tc finance the import of
foreign Grains. This can be seen by lookine into rows 3 and 12.
That is, net food i.mports on a per Co.l-,ito' basis increased from
US$G.3 in the initial year to U5$25.3 toward the terminal year,
- 21 -
whoreas per capita industrial export increase<.l from US$6.8 to US$i?9.4
during the SCJIle period.
(5) Investment and Saving
In our attempt to l'.nalyze the marked structural change observed
cetwcen the initial and terminal points, let us first turn to
investment an:.! savine. 'Inc total saving fund variable to investment
is composed of three sources: for~ign capital inflow (Sf), the
reinvestment of industrial profits (8 i ), an~ agricultural savings(Sa):
(4) I = Sf + 3i + Sa
The relative prop0rtions of these contributions may Jepend on the
distribution of income, the rules Governine the intcrsectorcl t~rms
of trade, and other socia-econemic variables. 'l'he total output of
aericultural sector may be <:!.llocatt;;Ll into the follo\'line three c.-.mponents:
consumption by agricultural workers; agricultural exports; and that
portion \>Jhich is shipped tc non-aericultural sector feT consumption
by i~(:ustrial workers. The lLtter tws tYres of shi~nents rerrescnt
the contribution thnt aGricultural sector makes tv lIindustrial
develoi1ffiEmt" in non-agricultural sector, by ~.:.\rcvic.ing (i) import
capacity (aericultural exports) Coni (ii) foO(: fe,r industrial workers
(intersectoral finc.nce). The total inclustrinl out1 ut cnn be grouped
into the t\'lO parts: the share and the profit shure. The wage
share can be further divided intc the thr(:;c comi)onents: in,-~ustrial
consumption by industrial w9rkers, industrial .£Qnsumer Goods exchanged
- 22 -
for agricultural soeds delivcr~~~ by a£riculturul workers, and domestic
investment goods £xchnnged for agricultural savinGs. Thus, investment
goods (I) in non-agricultural sector mey be; financed clomE.stically from
the three sources: industri~l profits (Si), ~gricultural sQvines (Sal)
and ngricultural exports (50.2). \lith the inflmoJ of forciiSn capital
(Sf)' the totnl clomcstic investment is financed in the way defined in
~he relation (4): I = Si + Sn(=Enl or Sa2) + Sf
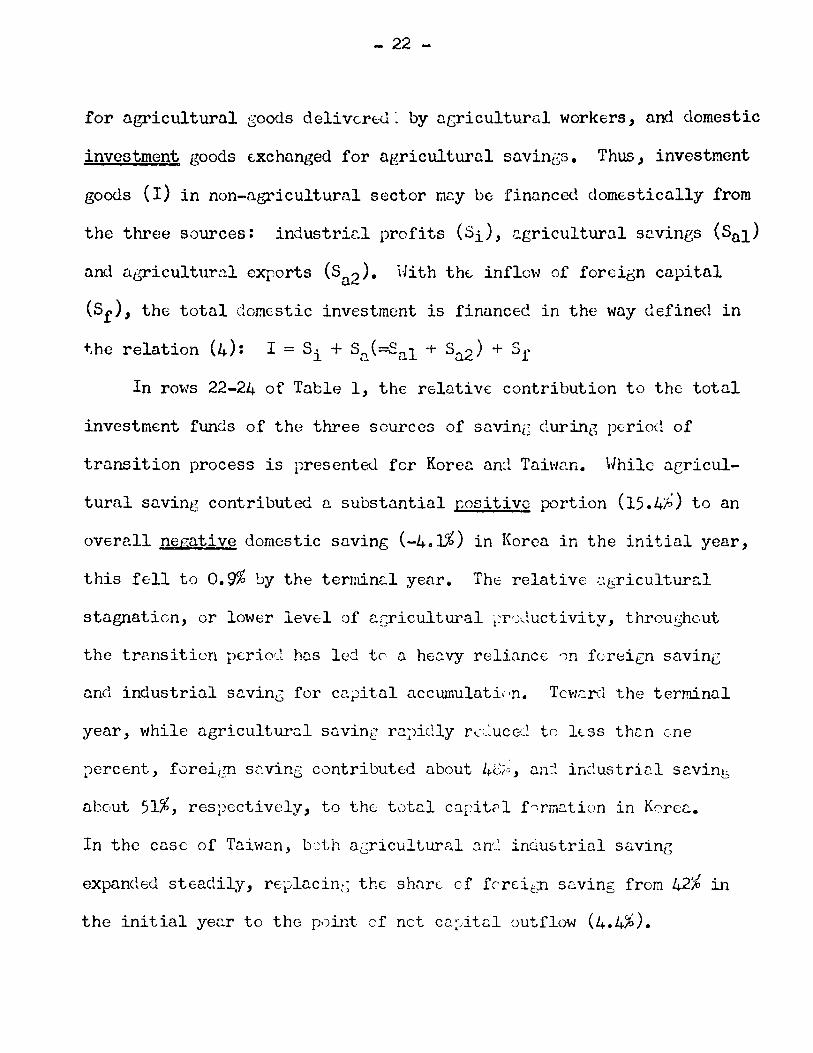
In rO\\'s 22-24 of Table 1, the relntive contribution to the total
investment fWlds of the three sources of saving durinG period of
transition process is presented for Koren an:1 Tahmn. Hhilc acricul
tural saving contributed a substantial positivG portion (15.4~) to an
overall negative domestic saving (-4.1%) in Korea in the initial year,
this fell to O. CJ% ".Jy the terminr..l year. Thl:: relatiV€ ,::[:;riculturcl
stagnaticn, or lower level of ~Gricultural iTr~ductivity, throushcut
the trcmsiticn period hns led tC' 0. hec.vy relinnce ')11 fcrei€n saving
and industrial savine; for cUiJitnl nccumulntic'11. TC'\'J<::.rd the terminnl
year, while ngriculturLll snvinr rD.~i(Uy rl..';_~uC0_~ tc less then ene
~ercent, foreign st-vinE; contributed about 40";' nn=~ in(~ustrir:l s~vinb
about 51%, respectively, to the totel Co.ritC' 1 fr--.rnc.tion in KC'rc~.
In the CElse of TnivJr:n, b:.)th aGricultural o.n·_~ industrinl suvinG
expanded steadily, rEi.JlD.cin~; the sharE. cf fcrei t;I1 s2ving fran 42% in
the initial yer..r to tho pJint of net CD.~.. itr..l Dutflow (4.4%).
- 23 -
In ternrn of the cillfiul~tive contribution to the total investment
of the threo sources of saving over the "'lholc i)erLx:i, the contrast
in saving perforr.tv.nce bet\'leen the twn econ')miE.:s is more dramatic.
hoS shown at bJttom of Tc.blc 1, Korea's ll[;ri.cultural suvinG contributeC.
9.6%, 'oJherens the corres~:~cndinD figure ,·ms 26% in Taiwan. Foreien
saving finuncec: 65% of total cCi:ital t'ormnticm in Korea as against
5.5% in Taiwan. While inJustric.1 saving is a majur so~cc (67%) of
investment fun~s in Taiw2n, it has c0ntributcd only 26% in Korea.
In short, the marked difference of savinc performance between Korea
and Taiwan can Lc traced to the followinG: (i) the agricultural
Sc.vine contribution in Korea is much 100wr ~(;cc?use of the 10\'1 level
of ngricultur~l procuctivity; (ii) u£ricultural sector's contribution
to industrial finc.ncc in Keree. is made mainly thrOUGh the "domestic
route" of intersectoral finc.ncE.: (the terms)f trade anel taxation);
anr~ (iii) foreirn c2.l:ital i:lays r. much lartier role in the financing
of domestic capital f~~rmation.
(6) 3tructural Ch2.n;:e Durinr~ the TransitLm Period
Harke(~ structw"'al ch2.ncc'f the Kor8an E:ccnorlY in the course Jf
the transition procEss behJf'en the initial c~n(~ terr:unal years \'Iill be
~ri8fly chc.ractcrizc.c~ bel()\oJ.
DC5~)itc substant inl :i'ci;ulnti,'n gr'·'-'Jth, th(; nun-ucricultural
s€:ctor in K0rE;u, e.s in Tc:i\oJan, has c~r;)wn rD.pi~ly as refl£cted in a
- 2h -
marked shift of labor ellocn-tion from the agricultural to the non
agricultural sector. In diagrnm (ct) t:t<: drov/th of ~:8~,ulD.tion is
represented ~y the parn1l01 and cutwn~.l shift of the ro~ulntion
lines PP to F I Pl. The D.lloc[:,tion ~;oints II h" have shifted from L to
L', signifyinG an increase in 8. Rows 25 and 26 show annual rat~ of
growth, betwe6n the initinl and te:rminul yec.rs, of 2.3 percent in
population and 3.1 percent in l~bor force in KoreD., whereas the sru~e
ficures for Tr...hmn are 2.9 percent and 3.7 percent, res£)€ctively.
uS \'1e can see from rO\'l 2, the ratio of labor f'Jrce in non-airiculture
(e) increasc,-~ from 32 ~)ercent in the initial yet:.r to 49 percent in
the terminal year in Korea. The labor re[:,llccation in exc£ss of
labor-force growth rate and an a!)solute decline in agriculturnl
population clem0r~trates the rD.i:JiJ race of Kcrea I s indus vrializaticn.
b. The Hole of huicult ure
The initially unfavcracle ngri~ultural infra-structure and the
relative [;Gvernment n(.l~lect ..,f aGricultural ,-~cvel0:Jment in su~sequent
Y€D.rs have lc~ to c:. sitUD.ticn cf rclc.tiV(; Q;;r:.cultural sta;~nlltion int ~_ U
Korea c~urin[; the tr2.nsiticn ~jerioj under ~~)servcLtion. l1.S rcM I in
Table 1 sh~1s, the annual average gain in abricultural la~or
productivity in Korea has bu:n ,-,nly 4.1 percent, much lC)','1cr than
Tail'lan's Pl0re than 7.3 i)C~rcent t;rG\vth. Tocether "Jith rapiJ industri<:.liztl-
tion anJ continuin~ lcbor reallocation, th~ la2Eing asriculture in
Korea has led to food r.1(;ficit r-rv~l€;ms \'lhich havE' been "/nrsening OVEr
- 25 -
time. Increosin£ volume::s of foed .imports have ~)een required to
r~r()vi~ ) ll. I:'lOdeST, increase in the ngricultural r.:onsumptL:m stc.n~:ard
(rOll 4). In din[r~lms (n) and (t,), this str.cnnnt ~gI'iculture is
depictFl by the very slf111l Up"larG shift of the Q-curve nnd of the
DQ -cu.rve. Th(; Growing requi.rement f(·r food impcrts is also
6indicntcd 8y the largt; rotH'Gin of -I~n (r:tinus cxr:'vrt) in dinernm (b).
Koren IS H-.JrscninE proLlcm 0f fece (:cficit is qui.te a ccntrClst to the
cns(; of TnivICn \'ihich has been exporting fooJ durinJ the entire
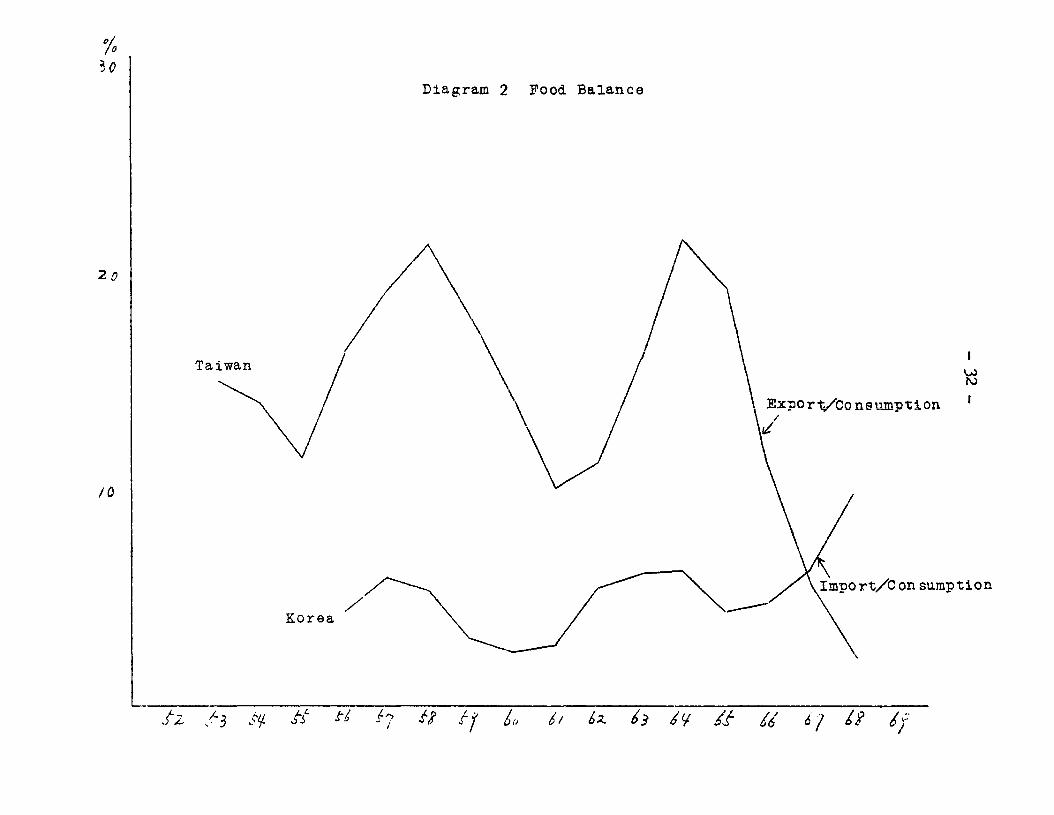
tr~nsition perio~. Di~grllJ:l(2) shO\lls food .!mi::OI't~ as n i)(;}"cetltage of
total food cons~ption in Koren; nnd food -ffiCi.crtS. as c. i'='crcentnge of
total fOOG c;,nsUI:l;:ticn .iD Tahml1. In thE: cc.se :)f 'fail-mn, continuous
rains in r.!.riculturnl prc~uct.ivity, :hich led to lnr6f' inport capacity
thr\)uch r.Cricultura.l cXl:crts, finr.ncerJ in ccnsi-:.~ernblf: part rnr.>ic
gro"Jth, in~ustrinliz~tion an(~ lLb')r' renll')caticn. In the c(),se of
Koren, hOl'IEver, rLl.;:.i;: industriQ.l.iz<lti..:n, Grov.lth cnu l<l~)or recllocntion
'\'1er(; fincnc<;(l in cz-.nsi :erc.blc. ;--nrt '.)y t!1C infl·)\o[ sf fcreign cClpit~1.
Thus, it is the esscnti.:.l -~ifferl;;nc(; bct\oJ€en K2rCD-n an'! Tail-mn in the
industrializaticn ,~rccess th<:t Koren.'s n[,ricultural scct)r ,·ms "pull~
alcng" ~)y <l ,~ynwlic industrial sect·:r rnthcr then provi"':in6 a streng
I!;,ush" for industri::lizcti~n, as in the cc.se )f T~~il-l::n. I.S '.-lill be
ciscussed latt.;.-·, K,jrcc..'s ,::.griculturc, instea.i (f E'.D.kinC cnntribution
V:. inc~ustrialization, has gradu[:.lly beCd:lt. un ir.}-:ortnnt constraint on
further in~ustrinl eXTension.
- 2.6 -
c. Heal \lo.ees and Per (:apitn Consumption
looking into the trt:n~ls in reel 'tIagcs an.~ ;.'E;r ca~>i ta consurar)ticn
standal"(~s ever tine, real \'/UGcs in 1;(t1, ar.:;ricultural an:: in.tus trial
~€ctors shm·/ a r:1arkc(~ rise cnly in recent yu:.rs ;:.ftLOl' re:lativl;ly
stable tr€nd throuGhout the first hn1f (;f 1960's, nn·~ th(: ccnstL':lpticn
increase: Much. Hence, the incrc<'_sc in ret.1 \.:0.:(:: fr::~ tr, :..i '~-l, 's
(since 19t."3/~ C) has been rcfl{;ctoc~ 1<:.r...:'(.1:i in t.n incrcD.sc i:1 the
consumrtion per hccc: of in::ustri[.1 G~c<ls.
HS tc, the trcn;::s in tte intcrs~ct0ro.1 terns L:f trD..:e, it is
noter. t(mt the industrial scctO!" sterns cf trn.::c LH... can t,:. H,:'rs en
since 1963 and increasingly s ..: in recent y(;::.rs, lrtoflcctin:: the
lagGing ;~,erfort1ance ·:of agriculture li·.·hich hti3 l€':~ t:· increasing fc)c::
\!ith the e~~istence ·'f un:lereL~l(;YE'~ 1.::.j· r c :--•.. iti..;ns, it ;&:~Y ~e
ex~ecteG that increase in 10.:-:-::1' prc::;'uctivity Hill ':e f...:,llci·;e.... '
the case of Korea. :r:_uctivity has increasb~
at an ennuc.l <:\ver::t:E r~t€ :. f 4.7 :'cTcent, yicl,-~lnG ~~n iECrC2.Se r:f 176
nercent over thE entire peri(\_~, the c.£rict:.ltur2.1 rc.::.l \';:.,""0 r.L=.S incrt:'se_~
at un annuc:.l c:.v(;rr~Ec rCltc cf 3. 5 >Lrcu~t, yicl.~in:.:: ~n i11crcc.Sl cl' 153
relative tc- In:::,)r t:r'_::uct i vit:: is nls = n~tt~ 1I1 thE. in.~ustricl sect.: r.
- 27 -
\/hil(; industriol Inbor preductivity hc.s incrcc.scG '.mly by 3.4 j)ercent
nnnually or L.y 150 percent over the ?crio-l as c. "/hole, the- industrinl
real "mee has increased at lln annu.c.l averngc r~te of 2.0 percent or by
147 pc.rcent ever tht ~)eriOt:. The lam::ing tren.:l of rcal Hagc behind
lobar i)ro~uctivity is also nete,~ in the CClSC of Tc.hu'.n.
Such 0 trcnc in reel \'luge rcl::.tivc. tr: la'..:·or pro-luctivity has a
direct consequence fer inccla(.' distributi0n nne: savin[ capacity. li.S
the increase in real "/ages in beth sectors lags behind productivity
gc.ins, the distribution of inccme favers the i)r:':iJerty class in both
sectors. TOGether with this trc~,~ ~ccelerateJ industrinl growth in
Korea has c~ntributod to rapid increase in the econ0~ls saving
capacity. hS alrea"::y indicated, n sharp incrc0.se in dcn€stic savings
fren nEgative to a satisfnctJry snvine ratio of 17 percent in Korea
has been 01r:lGSt ...~hclly bnsE<~ on the incrensinij contribution from the
nun-n[1'icultural sector IS j)rofits.
Once aeain, thE; rclntivE stng:nnticn of Koren's ll@"iculture nnd
thE. resulting foed i!:'liJorts have hn'::' obvious c;.;nsequcnces for consump-
tic.n str.nc~c.rd, sG.vin[ C[T,.:lcity nnJ renl "me;es. First, thr{Jugh food
hence cthcndsE r:1l..Lch \'~orscning terns 0f trr:.ck ~g[.inst the inc.ustrial
s€.ctcr e.s \·:cll as cthcrvlisc uuch OGre severe (:E.cline in ccnsum~Jti0n
stanJard tinc.~ cther\'/isc Tilueh sharper inerensc in industrial real ",age.
Sc;cond, thE; relative u!:,i'iculturr;l stacTIl!.ti'Jn has produced neGligible
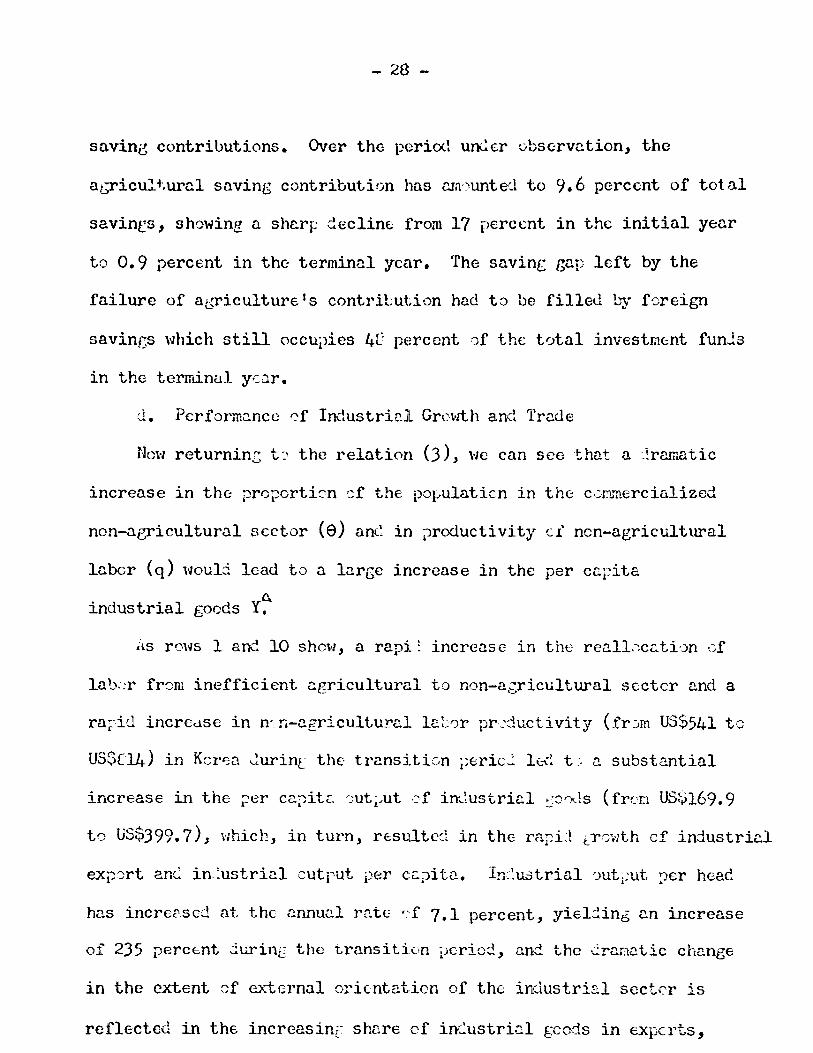
- 28 -
savine contributions. Over tho period un:.':er c.bservc.tion, the
uGricult,urc.l saving contribution has mnmnte:.l to 9.6 percent of total
savinrs, showing a sherr: c.ccline from 17 percent in the initial year
to 0.9 percent in the: terminal yenr. The saving gap left by the
failure of agriculture IS contril:ution had t::> be filled L'Y f·:;reign
savin£s "/hich still OCCUi)ies 4[' percent ''Jf the total inv€stm<;nt funls
in the termin~l YCGr.
d. Pcrform~ncc of Industrinl Grc"Tth and l'rade
Nm'l returnin.c; t=, the relation (3), '-Ie can see toot a '.!rrunatic
increase in the: pr0pcrti~n sf the populaticn in the cv~merciulized
non-aericultural sector (8) anL~ in ~roductivit~r c£ non-agricultural
labor (q) \'lOul:i lead to a lar[;c increase in the per cC,rita
I ye..industrial EOcc.s •
'i.S 1'0"15 1 anc~ 10 she\-l, a rapi: increase in the renlL-:cc.ti·.)n cf
lab:;r frem inefficient c.gricultural to non-a2:ricultural scctcr and a
ra;-·id incre<.1se in n'_ n-c.gricultural lr:.b0r pr2ductivity (fr.)ffi US$541 to
U5$["14) in Kcrt.;a Juril1[ the transitic.n i;ericJ lc-(~ t_: D. substantial
increase in the ~er capitr.. f..:ut~Jut ·::f in~~ustrial ~o'":kls (frcD US~169.9
to US$399. 7), Hhich, in turn, r€sultc~l in the rarL1 t.Tc\·;th cf industrial
exp:;rt and in,:ustrial cutrut per c:<:~ita. Inc:u3trial Juti,;ut per heac.
has incrc[:scd at the ~nnu.::.l rate "'f 7.1 percent., yi€l~in6 Con increase
of 235 perCEnt iurin[ the transition ijcriod, and the --:':r<:lm~tic ch[;,nge
in the extent ~f eA-t'8l'nal orientat.ion of the industrial sect('l' is
reflected in the increasini shnre of in(ustri~l gcods in experts,
- 29 -
Nhich hn.s increased from 36.5 percent in the initial year to 90~3
percent in the terminal year.
In the course of import su~stitution process in early years,
whereas Taiwan continued to employ more labor intensive tecrulology
from the beginning, Korea used ini.tially 1:101'0 cnpital-intensive
technology, as shm'ln in row 9. The capital Inbor ratio in the
initial period for Taiwan was U5$2,650, and that for Korea was
U5$4,800. h convergence of capital-labor rati:Js for the: two c0untrics
in the course of ~~~ort substitution process is noted. While Taiwan's
ratio has gradually increased, Korea's ratio has steadily decreased.
The aggregate capital-labor ratio, if considered as a crude index for
factor intensity at all, in the case of Kcrcn, steadily decreased
from USS4,fOO in 1955/57 to u~$2,[90 in 1967/6[ and since 1968
stE.adily increased again, indicating the recent shift fr0I.1 earlier
liberalization ;olicies nn~ labor-intensive exports toward more
capital-intensive backward-linkage tY'r-,es of import substitution aoc
export ~romotion.
In KorE.a, ns thtre was relatively less scq.Je for consuner goods
import substitution fron the beginning, as reflE.cte<.l in Im'Jer per
capita GDP and 10\'1cr agricultural iJrO\.~uctivity, the shift to\'lard
expert substitutic·n ,-ms n<:Jt so Much fr'-111 "land-based ll aEricultural
export to "labor-h~sed" industrial goolls. 14oreovcr, as carital
resources for industrialization efforts CDJIle more frem foreign capit.al
-30-
and industrial sector than from agricultural sector, the acceleration
of industrial export came from the shift toward non-traditional
industrial export fr0m traditional non-agricultural export. The
absence of aericultural contribution to the process of industrial
growth through agricultural ex['ort placed constraint on the import
capacity and the resulting problem~ of balcnce of paym~nts have
become m0re severe in recent years,.
" ,<J•
(r)laborvi
(E;)
DIilGRl1M a, b, c, d, e & f
price consumption curves
(c)
industrialabor forinitialterninal
\
~
'~i• I
"\,!
"" I
X'#-'-' ;7
"";~
""", ."'''"' .\,m,
(d)
.. :--=-.:. , .... -~1 'I·_·---;-~~~,:."~I_
............ ....
! a -"""'., I ---...... ~_../ L'~.,--::",.t.) ~',-. i- '. L .... " " ~',
tnLor( .... , I L.' -'
~MPP I ....//M
initinl. ,- ;.-~>""" 1'- '-TI);' ?,- E \ ' ~', , ,t ~V~-/ ' • r.. /'e;.' / I tcr~ll()...~,,~~, ,I' .'" ,<,', _....~~y consumption equilibrium points
Q _._~- .._..j-:" . I per caP1~~ ~ . '. ..'," ...;<:::;/~ (terms of trade in the r.bsence of. C I ..... b I consump~~o~_..:J CO ". f '-. ", r-..... " e" food irJ:ports)
~ C(l")ltn ........ "- ", ~ (; ' ..1:-....... 1 I '"" '" .. •
o~u"t ; Lnbor I ",; ~':=:~~cr~~g'- I - -'~~~~-.-=':~~- ';C· P~~dgct linos(~~o'['sening of terms of(Ii I initial .J... impb~t I "" '-''- :5<: J ~i trade against industry)
f~ '~.. tCrmiml!<· ..k g~p -,,_ I '''(I; .... ,)1<'':::-* D" .. K(o) K'
-;-""'-. I'>~!50 -t- I "IGl) , DIM I Ii cllpital II'" 1- l ',- I ' C ~ . • \.0.), (, " I /.. T\~-'P ap~taJ.: '[, I-'
I "I I /1\ '1.J.l.t"~, , ". . . . /' Il?o1?u~at n ./ ~'1 ,,/ _ln1"t:-al . ,./"~nlt~D.l~·· ~IL; W Ci k." 1/ t€=~l -/~I//t€rnun~l " X.. - . ,J 1 ~, /h -_. --~ .._-
! ~ ,t'. ". E \ I ~ •
'\ i \ 4,' • ,,' 'f I I'I ,.11 \ I !I I I /
I '\ I • 'LI i\'" \, 'If Iper capita", I I
output /' I .:'i \ ,; finitinl _,-' ._~--- - , I
I • I '
terminal J'" ;ifi--\~, ./,r-" I
/ Imark~l /mcpansio~ -6fexportcapacity
-32
~0...1
~VP
;
~a:l~
s:l'0
0~"
,.."0
0P.M,
~fit~
~~~I't\(I)
~0s:l
~«lrl
"<l
«ll:Q
"-'d
'<:>00Ji:.
~
~Na
'~
«l'I."
,..til«l
0..:,oM
-<.,
A
(--..'-1..)
'"'U./....a
ro(I),..
""'l
0~
~
~-l.r;
s:lro13:'n
or-!--{.
roJ
E-<
I~
~
<:)
.......
- 33 -
II. DYNiU1IC hSPECrrS OF THE GRCX·JTH PhTH: TUHNING POINTS
In this section, aD c.ttempt will he made to briefly describe
the process of continuous chanee over the transition period under
observation by identifying the turnine points by which the various
sub-phase of the transition process can be mnrked off. So far the
four turning points have been id6ntifie(~, nrunely, the export
substitution p:Jint, reversal point, commercialization point, llnd
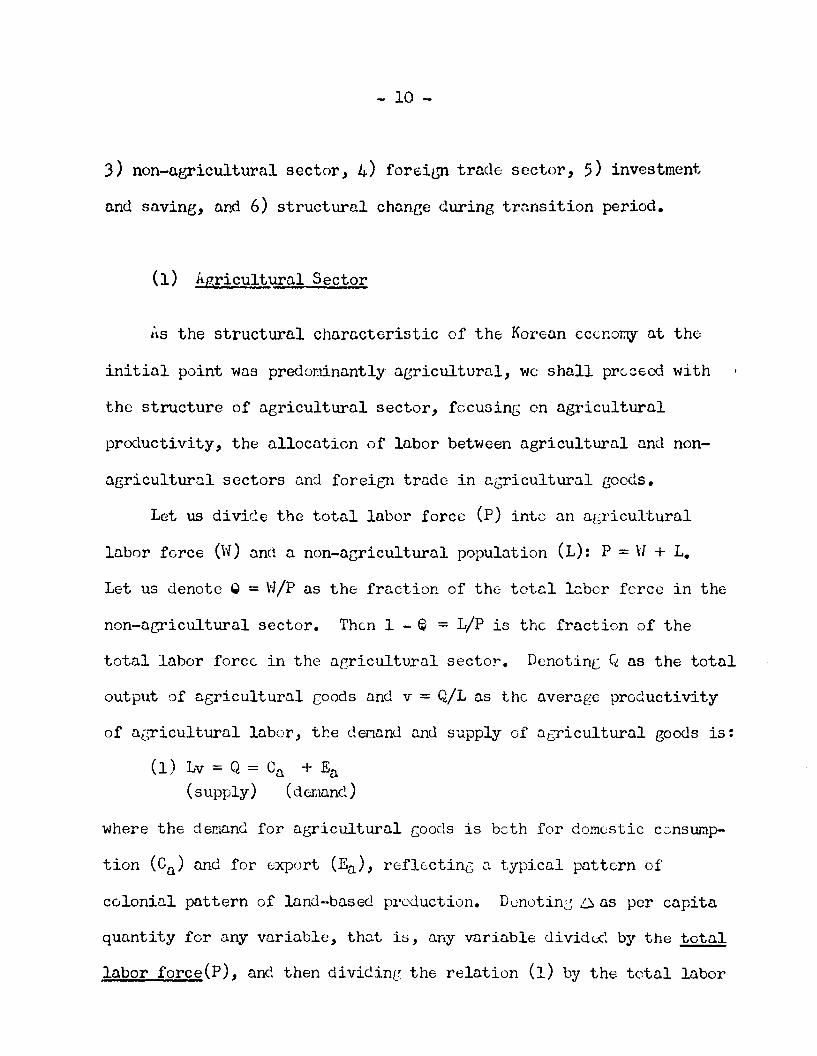
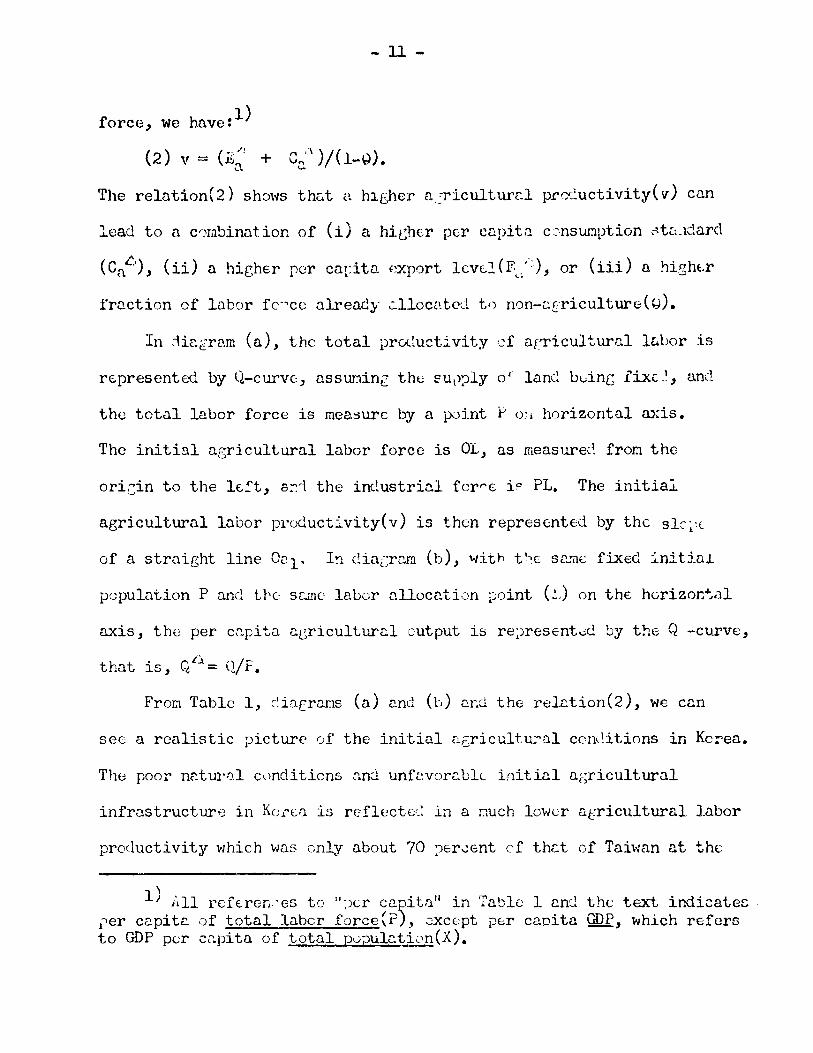
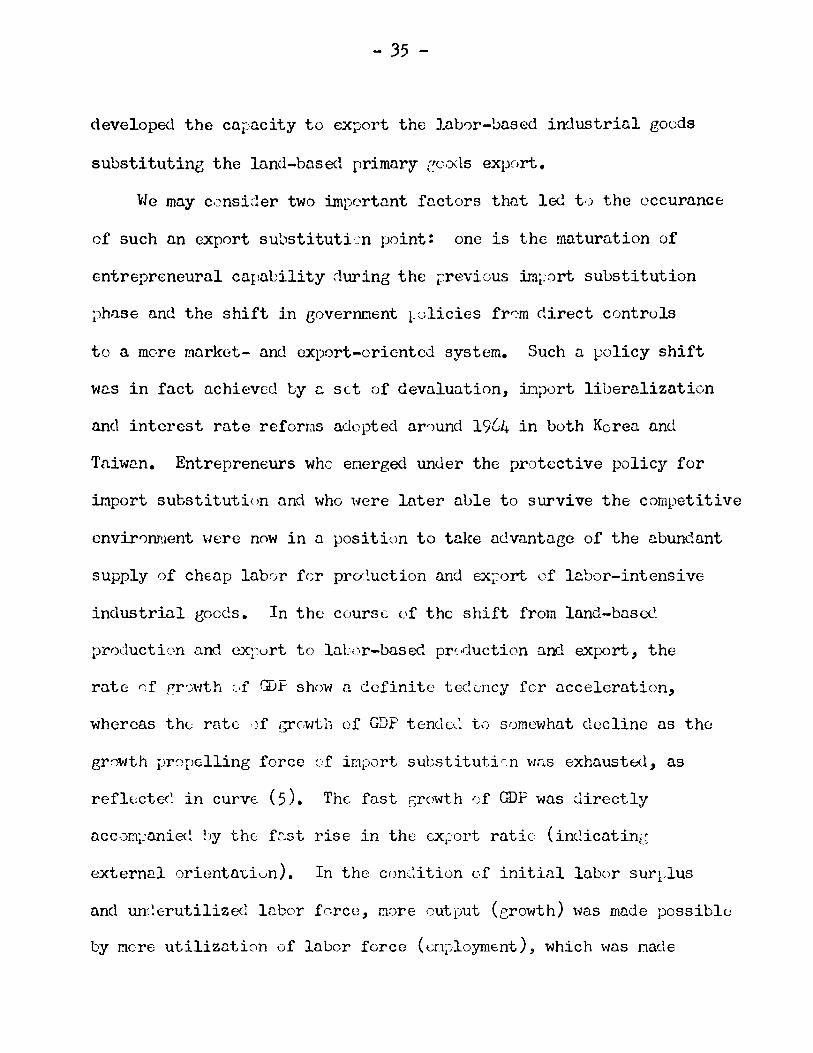
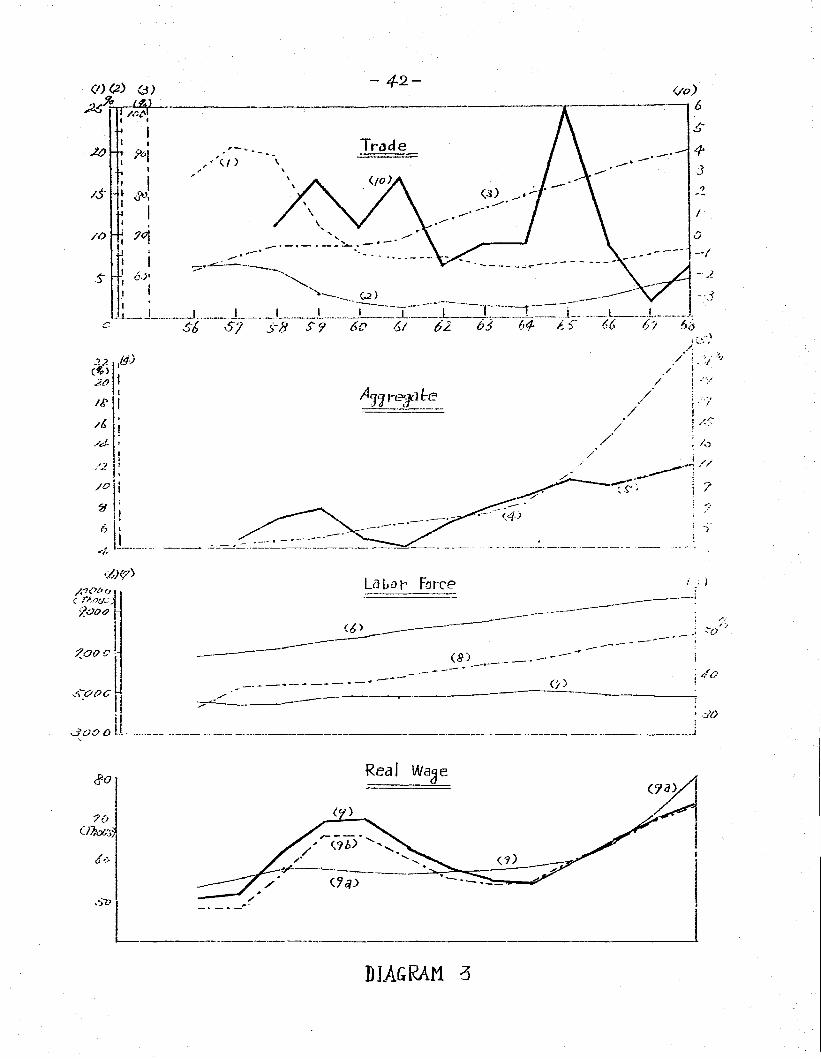
switchin8 point. The time-series data on impor:t-export, GNP, labor
force, lc.bor allocation, wage rate and ether relevant data are
organized under the f0ur headings, trade, aggregate, labor force
and real wage. These time series nre plottec in diagram 3 to
~ortraJ the ~ctual pattern of the transition ~owth of the Korean
econ·:)my.
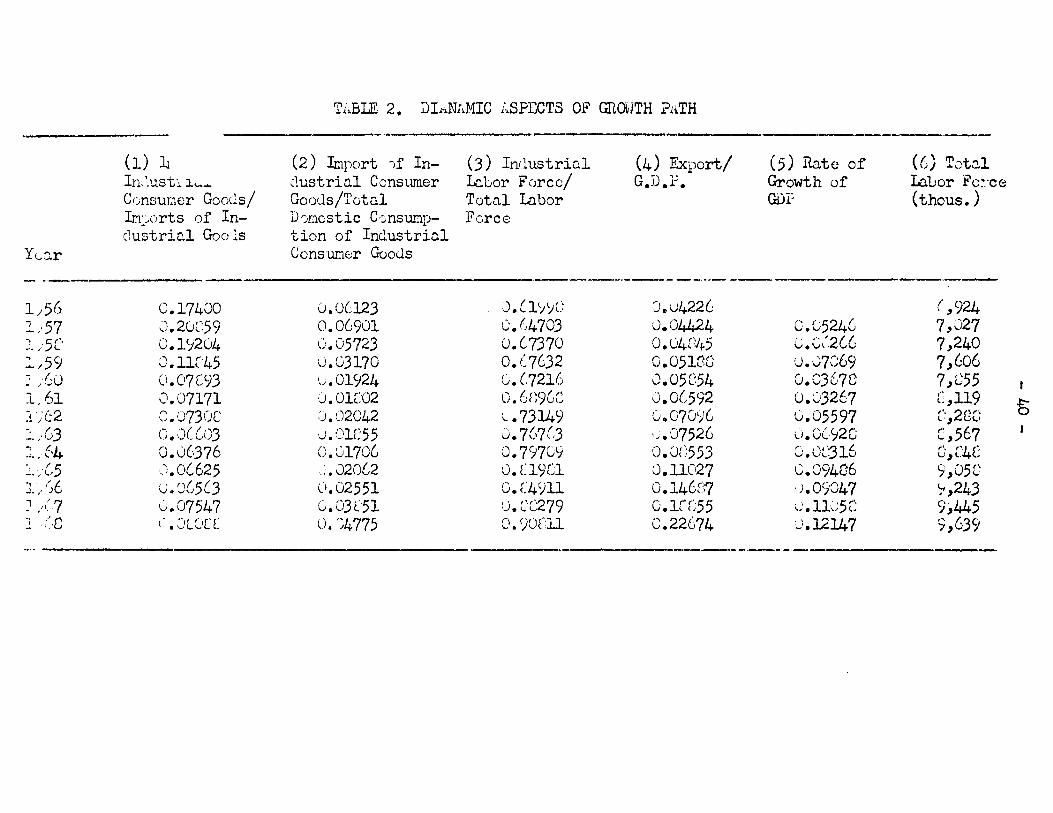
Frcm the traue-rel~ted data in Table 2, we can identify the
export substitution pcint (arcunc 1964) which marks off the i.t1port
substitution phnse (before 19(4) and the export substitution phase
(after 1964). In the import substitution phase, the dominant
growth-propellinc force is lIimi)Ort substitutionll .::lS can be inferred
from curves (1) and (2). First, the iJ'";"'L"Jortation c·f industrinl
consumer goods decreases relative to that cf prC)::Jucer goods
(capital gooes anl industrial raw matcri~ls) as rEflected in the
fnst ~eclining ratio of incustrial consumer goo:ls imports to total
- 34 -
industrial ~oods imports curve (1). Second, the imported cnpitnl
goods and raw materials arc us~l for th~ buildine up of ccmestic
productive cnpacity which will substitute the previously imported
[oods for the doraesticnlly r:.rcx!ucccl goods, thereby decrEasing a
fraction of consumer goods imports in the total consumption of
industrial ccnsumer coods as shmlll in curve (2). The fact that
both curves (1) and (2) turn up a:roun:~ 19(,4 indicates that the
import substitution process has terminated, or accurc.tely, the
import substitution is no lonGer the V'owth-propelling force, and
that a new growth phase propGll6<l by in:~ustrial exports is entered.
During the export suustitution phase, the ratio of industrial
(non-utTicultural) exports to the total ~ports is r~pidly increasine
ns shown in curve (3). Korea stnrted with high rutio of non
agricultural exports to tot~l ex~orts fr0~ th~ beeinnine ~s a
ccnsequGnce of her economy's relatively weak ~~iculturnl base.
In the case ·~)f Tnhmn, industrial experts beCDJil€ dOTaimmt for the
first time at thE- eXFort sul;stitution p(iint (around 1959), rapidly
replacing the aericulturnl E.X~:'Crts vJhich had previously dominated
her eJq")Crt trade. In the CUse of Korea, tX~·t substitution means,
in c. Inree sense, n shift frem trc.diti(mnl ncn.-nt:ricultur.:ll prinw.ry
gcoJs exports (e.e. minine) t.) nJn-tr~ditL:mnl l1'_'n-D.lTicultural
expirts (e.g. lnbur intensiVE; m!2nuf::cture:~ g(;(xis). In nny cuse,
eXiJ~lrt substitution that the ccuntry has, fer the first time, has
- 35 -
developed the Co.i:,acity to ex?ort the labor-based industrial goods
substituting the land-based primary [:c,:xls export.
\tie may c.::nsLler two impC'rtnnt fnctors thtlt led tl) the cccuro.nc~
of such an export substituti·-'n point: one is the maturation of
entrepreneuro.l capa~ility :-luring the i:-revious mi__ort substitution
1)h11se and the shift in eoverru:tent l.ulicies fr0m direct controls
to a more market- and export-orientcd system. Such a ~olicy shift
wc.s in fact achieved by c. set of devaluation, jJ_1i)Ort liberalization
and interest ro.te reforns o.dcpted o.r')und 19G4 in both Koren and
Tniwc.n. Entrepreneurs who energed un~er the protective policy for
inport substitution and who ''''ere Inter aLle to survive th~ competitive
envir0nment Here now in a position to take ac!vantage of the abundant
supply of ch€ap labor fer pru.luction and ex~'ort of Inbor-intensive
industrial BOCGS. In the course 0f the shift from land-bnsec
production and export to laLor-based prf.duction and export, the
rate Gf frr')\'lth :.. f GDF show n c.efinite tec!cncy fer acceleration,
whereas the rate ,)f G!'C"Mth of GDP tenclEl: t..-) s0mewhat decline as the
grcMth pr~pclling force cf iuport suGstituti'.n \oms exhausted, as
reflccte(~ in curvE. (5). The fast t::rowth ·)f GDP was directly
ncc'::ffii..'aniec! by the f::-.st rise in the cx[-:ort rntic (imlicating
externc.l orientat.i0n). In the con:.:ition c,f initial labor surl~lus
and un:!E;rutilizecl lc.bor force, n:)re output (erowth) 'lias mn.de possible
by mere utilizntion of labor force (cDJloymcnt), which was nade
- 3*1 -
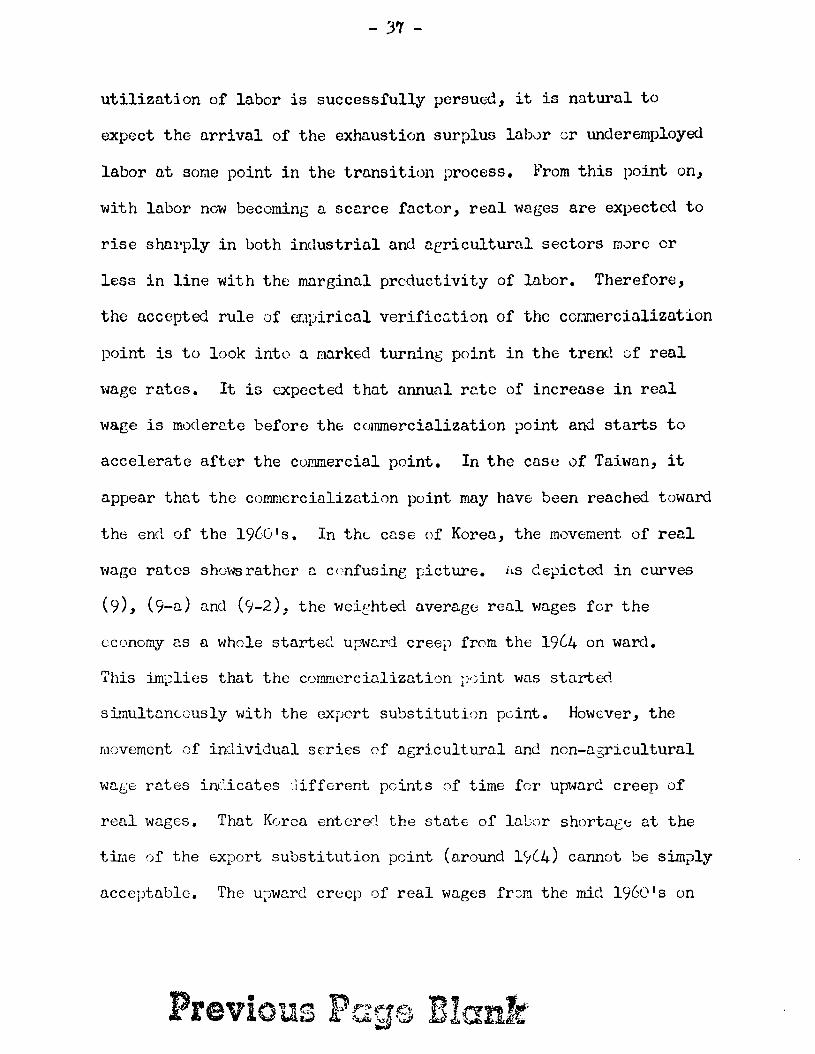
utilizution of labor is successfully persuect, it is natural to
expect the arrival of the exhaustion surplus lab,)r cr underemployed
labor at some point in the transition process. r'rom this point on,
with labor now becoming a scc.rce factor, real wages are expected to
rise sharply in both industrial and aericultural sectors more or
less in line with the marginal productivity of labor. Therefore,
the accepted rule of etlpirical verificution of the cOL1Oercialization
point is to look into a Barked turning point in the trend of real
wage rates. It is expected that annual r~te of increase in real
wage is moderate before the c~mnercializationpoint and starts to
accelerate after the commercial point. In the case of Taiwan, it
appear thnt the cOIIml£rcializntion point may have been reached toward
the end of the 19((I's. In thE; cnse of Koren., the mov€!11ent of real
wage rates shmvs rather n cnnfusine picture. ilS Gepicted in curves
(9), (9-a) nncl (9-2), the weichtecl averag(; real "'1D.ges for the
economy ns a whole starte(~ uI=Mc.rd creep from the 19(4 on ward.
This implies that the cOl1lmercinlization iy:,int was started.
simultnnE;ously with the export su'Jstituti(m p(Jint. Ho\oJever, the
Dlcvement of individual series of agricultural and non-agricultural
W:J.{;€ r:J.tes inc:icates.lifferent pcints of time for up'-Jarc. creep of
real wages. That Korea enter~! the state of laLor shortaEe at the
tllJe ,)f the export substitution point (around 1~(4) cannot be simply
acceptable. The u~wnrd creep of real wages fr~m the mid 1960's on
33
may be traced to sharp increase in fo~l ~rices which besan
approximately at the same point of time. The sharp upwo.rc; shift
in erain prices may be, in turn, traced t,) set sf factors, such
as food shortage caused by cro~ fnilurcs and stagnant ar,riculture,
and goverp.ment erc.in price p~:,licy f0r c .ntinullus increase in ['rain
purchase i)ricos. At any rate, the import :)f foreign [;t'D.ins could
no longer conpletcly avoid some sign:::! food shortage.
il.nother turnine point which shoulJ. be referre\.~ to is the
switching point.nt which an open :~unlistic labor surplus economy
with a poor natural r€sourc~ buse will become sooner or later a
net imr-oorter of fOQ(o~. Korea had become already a net importer of
food from th~ initi~l pcint on lone before her economy reacha! the
export substitution point. One th~ other hand, Tuiwan still rE:mains
a net exporter, extendine her agricultural p~aJuctivity lone ufter
the cxrort-su~stitutionpoint 0ccurral aroun! 1959. InsJito of its
superior iJerf"rJ~mncc, Tc.i'tlun I s uljricultural sectc'r is reachins its
natural linits, cvidence(~ by the (~eclining rc:tc cf Gro\'/th of
agricultural production D.n~l the dcclinls lCVE..l 'Jf ~)er cu~ita
urriculturnl ex!;orts.
The fnct thnt th~ post\·mr Korean eC0n':oy stnrted v/ith u n(;t
importer from the beginning (th8 switchin£ ~sint h~~ alrendy
occurrec~ in 1950 rs), the early ·-Jccurrn.nce.-:f the reversal ~):)int
at thG timE. of expert substitution (arounc. 19(,4), uncl the upvmrd
- 39 -
trerxl in real wage rate s1:.<lrted from 1<;[5 on are all symptoms of
tho poor performance of ab~iculture in Koren. It is precisely this
difference in the porformance of thG atTicultural sector that the
growth pnttern of thE: Korenn Gccnomy differs from that of the
Taiwr..nese econ'Joy in a fundcmenta1 sense, despite &lany apparent
sllJilcrities in other initial structural characteristics between
the two eC0nouies.
Ti"BLE 2. 0I.li.NllMIC i.SPBCTS OF GnOWTH PliTH
--
Yl.,,'J.r
(1) lJIn,'.ust:.l.""...C(Jnsur.1cr Goods/T_'"''rt''' nf In-.1...I:llJU i:>_,
clustri[tl Goo .ls
(2) Import)f Industrial ConsumerGoods/TotalDJmestic C0nSQ~p
tion of IndustrialConsur.ler Goods
(J) Inilustrill11:l.tor FDrce/Totn1 1D.borFCirce
(4) Export!G.D.l-'.
(5) Rate ofGrowth ofGDI:
({)) TOtlllIil.bor Fo::'ce(thous. )
---_..-.._-----'-_...-._-------_.- -- -
1 J 5()
1/57-, 5{"••. ': L
1 / 59J /,601.61~i ;'('2-. (3...... /\j
., l'4.1. " ~.
I ".15.... ,/ l.)
J ,,' 6·.. ,. )
: ,/,7} (,[~
0.17400 u.OC123 0.(1'.1';(: 0,,04226" 2- "59 0.06901 C.C4703 0.04424 C.0524G\".). lJ~.:
0.1';1204 1.,;.05723 0.(7370 o '4"1 ,- '. ,'. '2(1.LJ ," +) v.v\. ';.;0.11C45 U.03170 O. (~7632 f" 051'1(" 0.07069u. L'U') rqC93 '..;.01924 0.(7216 O.05C54 0.C3G7C'- .\.. .'
0.07171 U.01G02 " (\9f r\ ,].0(/592 0.03267lJ. \)(, .J{.J
" '173"1"\ ,:J.02042 ,.• 73149 0 .. 070')6 0.05597v.t.,.J \ <-0.,.)((,\)3 ,I nlr55 .... 7/7/3 ;-. CJ752G (i.O(,92Cv. ,_, ..,. u. \) "0.0(--376 ().G170G 0.79709 O.JI:553 '\ ''\'~31tV.VL' U
,.i. 0(625 ": •J20(,2 ~). L1~C1 0.11027 C.094C60. C)('5CJ C\ 02551 O.C4'J11 O.146rq ) 0"""47' • ';v
(;.07547 G.03l51 U.'...'C279 0.lCC55 . 11"5'"~,,' • '\oJ c..;,
("' • ~)L'C)C C o. '~4775 o. ()ULU 0.22(,74 u.12147"-_"'_·_._,00 _._
( ,9247,0277,2407,6067,l~55
£:,119,'o 2(\'"~., (.iL'
C,567,.'o ""J, (~.'u, ~,"+(.,
C;,05C1;i,2439,4459,639
I
BI
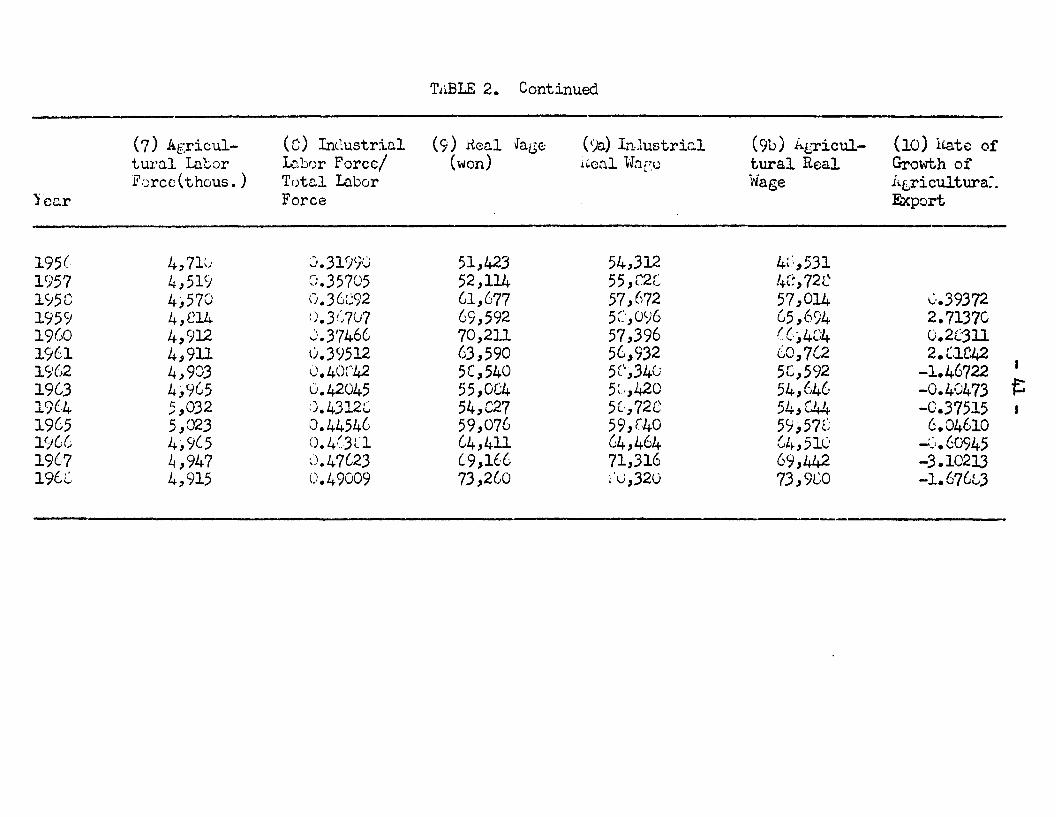
Ti~BLE 2. Continued
)cur
(7) Agricu1t u:ra1 liltorFcrcc(thous. )
(c) In(~ustric.l
I.cbr)r PorcelTutc.l Lo.borForce
(9) Heal faG€;(won)
(lJa) In.lustric.l!~cn.1 U~l:'U.'
(9b) i~gricul
tural Re;a1iti"age
(10) Hate ofGrowth ofI..gricultura:.Export
195( 4,71(.) J.31c)91J 51,,423 54,312 4~-',,531
1957 4,519 ().35705 52,114 55,[2C I ,. 72(\•.j.~" ~
1<150 4,570 O.3GC:92 G1,677 57,,672 57,014 ('.393721959 l~,C14 O.Y'..7v7 69,592 5~~',O96 ()5,694 2.7137019(>0 4,912 J.3'746G 70,211 57,396 ((,,4C;4 u.2C3111961 4,911 \).3<;512 63,590 56,932 GO,7G2 2. (;lC4219(.,2 4,903 1).40C:42 5(,540 5C';,34CJ 5C,592 -1.46722
~1963 4,9G5 ~).42045 55,084 5:,,420 54,64(' -0.4047319C4 5,032 :).4312:: 54,C27 5 f', 7')'\ 54,L44 -0.37515L, _(.,
1965 5,023 0.44546 59,076 59,[',40 5CJ,57L 6.0461019G6 4,9(·5 O.4(3tl G4,411 G4,464 Gl~,51C' -:~1.60945
19(.7 ~,947 ~).47G23 C9"lt,6 71,316 69,442- -3.1021319(,<.: 4,915 0.49009 73,2(.,0 :'0,320 73,9CO -1. 676L3
----
/
?--
.--".--'
- 42-
Trade
(/0)_________________-r- -1 6
\,"(f>,,
d'21:/oq~ I;6 i:
II4- i_·_.. -- -...:.,~~----------
/0 t ....... ._. D1 ~._'-.-.-~-
'. ..-' ,-' -I,f- I ' ... , ?~.---."-... -- -- --~-
...> I 0·/ "-... -·2II I ~...__ . - .t. . ._...~ ."- .-------- 1·'3i I I I I ._---..-. ---T'--'-','--;-
~ i!-__._.....--.J. .. ... ..L.. -' ._-_~__ - 1 . 1__._.1.. _$6 S7 05-8 5"9 6C' 6/ 62 63 64- is' (,6 I;} 68
.? 2
1
.11-)(~) .20 t,16' I id~ i
, }
.. ---_ ..... -.-- --_ .. -./
~------
....---..._-------;~.- .-.,------------- -----'-
(B)__-_c- _-. ----.--_ ....
~"r7().ClUJ t( Tf.?o.....:--1
'lOOt:? I
II
~oooi
0~OOCU. IIII
doo {j lL ... _
Real Wade
/"~(9b)• """ ...../'
'!/----.~-----:>..,~--==---('J ,0 ~_-..:V
DJAGRAt1 3
- 43 _.
III. Conclusions and Policy Implic".ti,~
(1) Growtn Pattern arri Policy Rules in Different Subphase of
Transition Growth
In the course of our D.I1nlysis of the process of transition
growth in on econo~r like Korea in the previoU$ t"lo sections J we
helve sho\'1n that there exists an "idealized" development ~th l'Jh:ich
will permit the continuous ~enerntion of emploYJmmt und growth as the
srone process of transition. In the course of the lIidealll pnthJ we;.. "'
attempted to identify fcur meaningful turnine p,)ints which will mark
off the various subphases of transition gro\Olth. Development policit:s
llnd strategies must be desiGned to be relevant and. sensit~ve to the
particular stase (or SUbp~lse) in which a c~untry finds herself at a
particular time. The pattern ·f res;;urces en:~")\'lJ!lent and particular
subphase an:1 H,s relevnnt p·_:licy rules \'lill be outlined belO\'l:
1) The first im~)rtnnt turning ~,int which mnrks off the
different subphnses is the export substitution point. l~t this point,
gradual chu.nees in the ec,:;llC:my's res'')urct: end:;\olment and the gcverrunGnt's
pnck.::.ge l)f policies durine the subphasE of iLl~.L~t sutstitution, fuelled
f.lainly lJy trnclitionnl lund-rosed exi~:)rts, n.Jw :-;ernits a shift to the
subphnse 0f expert substitution, fuellc\.l by non-traditional lah:r
intensive exports. Once the export substituti~1l1 pDint is rcoached,
the outlet for abundant surplus labor is founc~ through industrial
... 44-
export trade, and the problem of efficiont utilization of labor in the
industrial sector becomes increasingly important. i l package of goverrunent
policy measures, including high prot~ctive tariffs, exchange controls,
low interest rates, overvalued donestic currenci~s, direct subsidies
and price inflation, o.dopt€{~ to facilito.te the process of import
substitution growth need to be changed at the turning point of export
substitution. The basic developr.1ent strategy in facilitating the
natural transition townr~d export substitution calls for the following
~wo policy prerequisities:
(i) A set of libernlization policies, or the dismantling
of the various existing direct centrel measures adopted
curing the import-substitution subphas€ so as to create 0.
market-oriented system which will reflect the relative
price structure correspondinc to the factor proportions
endO't<1(:;.(~ in the econony. This condition I.1Ust be fulfil1eJ,
for it is tht; market-oriented system that is ffivst conducive
to the rational choice of domestic entrG~reneurs in soekinG
efficient utilizo.ti2n of labor force in technology and Qutput-
mix.
(ii) Nore p,)sitive gwernment policies must ~)e centerc-d on
the modernizr'tion Af agricultural sector, s:) as to pernit
Korea's agricultural sector to generate agricultural savings
and export earnings nnd to release laLor force to the
... 44-
export trade, and the problem of efficient utilization of labor in the
industrial sector becomes increasingly important. i~ package of govermnent
policy measures, including high protective ta.riffs, exchange controls,
low interest rates, overvalued (~onestic currencies, direct subsidies
and price inflation, ndoptec~ to faci.litllte the process of import
substitution growth need to be clmnged at the turning point of export
substitution. The basic develotnont strategy in facilitating the
natural transition townrd export substitution calls for the following
~wo policy prerequisities:
(i) A set of liber~lization policies, or the dismantling
of the various existing direct ccntrul measures adopted
curing the import-substitution subphas€ so as to create a
m~rket-oriented system which will reflect the relative
price structure correspondin[ to the factor proportions
endO'\'1(:;(~ in the econoDy. This condition IJust be fulfilled,
for it is th<:- market-oriented system that is most conducive
to the rntic:nnl choice of domestic entro;.:;reneurs in sockinG
efficient utiliznti2n of labor force in technology nnd output-
mix.
(ii) Nore p\")sitive government policies must ~)e centerc-d on
the moderniz:,tion Af agricultural sector, s') as to permit
Korea's agricultural sector to generate agricultural savings
and export earnings and to release InLor force to the
- 45 -
industrial sector. As shown i.n Section II, the export
substitution point is reach~l around 19G4. This was
confirmed by the movement of the time series of major
growth-relevant variables which shot-I D. definite shift
around 19(.4 and also by the major shift tal-lard tl set of
liberali2ation policies which took effect around 1903/[4.
2) There is the most inportant turning point, that is, the
commercialization point which signifies the end of the labor surplus
condition which has been inherited from the pre-modern epoch. When
this point is reached, the economy is said to have solved its
unemployment problem in the course toward economic maturity. Fr0m
the commercialization point on, a most observable phenomenon is a
sustained increase in the real wage accompanied by relative reduction
in the savinES rate and a relative decline in the importance of foreign
trade for growth. At this peint, a large number of efficiency-oriented
entrepren~urs will seek a more skill- D.lll capital-intensive technology
and output mix. Relevnnt Government policy package is to put a heavy
emphasis en education and hWilan capital devel0pment to provide nn
adequnte supply 0f hi:h-quulity mnnp0l'lcr.
3) i~nother turning point is t-lhat is called switchine point
at \'lhich n sr.lUll open c:.unlistic labor surplus economy '<lith poor
ngriculturnl base is likoly to move from the successful exploitation
of its a6Ticulturnl potential to its nnturnl long term position as n
-lth-
net importer of foods. The switching l')l)int sifPifics that the
economy vlill ultimately hnve tt) nccelcrate its industrinl exports
to import the ne~led food and agriculturaJ raw materials. Once
this {JO int occurs, the eccn0r.1Y must develop a hieher forei[n
exchanee earning capacity thr'jueh developr.1\3nt of m0re htun~n skills
and capite.l. The simple exportation of labor sorvic\..s alone ~'lill no
longer suffice tc increase hii:h per capita foreign exchange carnine
capacity. The rel~vant p0licy requirement is to place a greater
emphasis on labor quality thrcugh m~npO\'lCr development (education
and traininG), as in the case of the commercialization IYJint.
4) In the process of trc.nsition growth, the reversal j)c;int
is likely to occur at 'Hhich the size cf the agriculttu"ul Inuer force
boeins an abs·,;lute decline. \'lhon this point occurs, the c:cucic.l
~~licy question is an assessment of thG likely duration of the
export sulJstitution phase, thc.t is, the ...~uration of continuous
reliance on laber intensive ex[crts to provide the major source of
generation anr.. growth of c1:1j)loymcnt and output. If commercializa
tion point has already occurred, it may be necessary tL! prolong the
duration of the export substitution sub-~hase throueh th~ mocerniza
tion vf aGriculture which will provide additional supply of
relatively chea~j labor. In this case, the relevant policy f:::..;cus
mcy shift tv labor-savine techniques in agriculturo in order to
prol:)ne labor-using techniques in industry, uhieh is in(l.e~
beccming the policy iSSUE: in Tc.ivmn tit present.
- 47 -
(2) The Case of Kor~an Gro~~h Experience
\ie have so far nttempted to sUJ1lJJ1tlrizc a set of "idealizedll
growth rules and relevant policy shifts in various subphascs at
transition Browth. Now it will be most Ecaninstful D.nc~ instructive- '-'
to compare and contrcst Korea1s actual ~erfcrmnnce to the aforemen-
tioned "idealiz(,'<l" erowth pnttern llnd policy shifts. In the case
of Korea, as we have seen in Section II, export substitution point
was reached aroun~ 19(4, n f~1 years after T~iwan had reachcc that
point around 19GO. Whereas the cornnercialization point seem~s
clearly to have already reached in Taiwan, it is doubtful or at
least debatable in the case of K0re~ ,~hether or not the becinnine
of marked real \'lage increases occurred arcun::l the nid- 19(.,0's have
led te· the IIcommercia.lization point ll marking the ene. of her labor
surplus condition. Sharp increases in renl llD.ges in tooth aericul-
turnl and non-agricultural sectors in Koren. in recent years may
signify the II premn.turell shortuS€ of labor \'/hich hllS much to <.:0 with
the lagging performance of her agricultural sector. ~s tc the
switchinG point, Korea became a net fOG~ im~0rter fro~ the beginning
of the transition period under observnti.'m, whereas Taiwan remt'.ins a
net exporter of f~od tc dnte, still extendinG her a8ricultural
prGductivity long nfter the export-substitution point cccurra~
arounrl 19[0. The reversal poirrt was reached in Korean around
19[5-(6 when real wages tCGun to rise r~ther sh~r~ly. In T~iwun
-48-
the reversal point was reached a fb"t;J years ahem! of the commercializa
tion point.
Despite or behind the apparent similarities between Kerea and
Taiwan which seem to be on an "idenlizedll pa.th of transition growth,
there is the most fundamental difference in the erm'1th pattern of
the countries, \',hich has in fnct led to II mnrkce deviation of the
Korean path from the idec.lizec! pattern of growth stated above.
That fundumcntcl difference lies in the perfoJ~nc€ of the llEricultural
sGctor. In the case cf Korea, the agricultural sect~r has not y€;t
fulfillect its IIhistericalll mission. l1s a result, throughout the
import substitution subphnse which ?errnitted the Ecturntion of
indigenous industrial entrepreneurs, the potential sources of
industrial growth were not much eeneratoc from the agriculturc.l
side. /l.fter the export substitution pointed was reached, continuous
rapid industrinl grO\·rth was lar£cly fuelled ~y forcien cai:ital rather
than agricultural surplus. The relatively stnenant agricultural
sector faile<.~ to permit the in:lustrilll sector at fairly stable renl
wares for lnbor intensive inc:ustrial prVlluction afttl export. In the
absensc of agricultural contribution to the continued irrlustria.l
expnnsion, it \"IUS the industria.l secti.-;r which not only hn(~ t~) pay
for its O\oJn continued expansion, but also for the fJed imp,jrts \"Ihich
was ever-increasing. In other "lards, in a shari:) contrast to the
idealized erowth pattern ctc~;ictc(! lll;ove,the in:Justrial sectcr hus
- 49 -
to It pull" II dracging a£riculturnl sector along with it, rather than
gettine the benefit of "push" from it.
Such a heavy burden ~)laced on the industrir..l sector, due to
failure of agri.cultural sector's "push", has in turn brought about
distortions in the patteI'n of industrial gro\o/th. First, the
irKlust rial ~.xport drive has been pushed far beyoThl the point of
efficiency, as evidenced by negative vull4e add€.d culminutect in
certe-in export inc~ustries. Sec(Jnrl, the: iJ:1~,:n1;C'J. raw rnnterinl
component and capital intensity cf uxp:'rts have been risine,
toeether with the expansion ;,f Deckwa-rel linkage type elf impvrt
substitution in the areas of ccnsumer durables. a~~ interoediate
goods. It is important ~o note that the inJustrial export ~romotion
and the expansion of imi:ort-substitution industries in c~msUP-Ier
durables and intermediate GOods have been pursu~d under the sane
policy 0lckage \o/hich establishes a number 'Jf subsidies ane:
incentives, includinG tariff re:~uctions and ex€m:,tions for rat'l
materials an(~ capitnl Boods, tax reduction anc~ exemptions, pref
erential interest rates, raw material imixrt wastaEe allowance
nnd other direct subsidies.
In sum, the ~sricultural sector's fcilure to fulfill its
historical reI€: in Korea hns nffectc~ the ~ttern of the :~rm·rth of
the industrial sector. Instellil of movine first to laber-intensivo,
then to skill-intensive, ill1(~ l'L:1aliy t~, cr.pitnl intensive prccluction
- 50 -
nne! exports, in the sequential order of various subphases of transi-
tion grcwth presont(,~l in the previous sections, Korea has nttcmptoc
to move into some fnirly technolol.:'Y- and cni~itnl-intensive industries,
"/hi10 continuous erG\'lth cf labor intensive c..xport "lill prGvidc the
major source of employment generation anJ output 5r0\'lth for ~renrs to
como. rurthermore, to keep the process goinE, Kvren has been f~rced
to secure an increasing inflo\'l of fvreicn lco.ns o.m:~ private fcreiEn
investments. The increasing im~Qrt intensity vf inctustri~l ~rcAlucti0n
and exports, the heavy foreign debt structure un~: the :7Oliin[ f8cxl galJ
l' k '~ n u['.r C': cvic.-
tion cf the Korean Growth pattern from the h:eDolize:.l grcwth pu.ttern
depicted in the open dualistic n~lel present~l in the text.
(3) Busic Policy Directions
Development ~licy nnd strnteeY in the context of the Korean
economy r.1ust '!Je sensitive nnrl relevnnt to tlie export-substituticn
subi)ho.se in which the Korean ec("·nomy has foun": itself since the mid-
19(0's. The basic policy dircctien must be fr.cused en the creation
of a set of policy conditions cont.~ucivc to c ~·ntinUt,l. (:xi.}~nsi!~·n :f
1c-~_·or-int(;nsiv.:; in~:ustri[:.l :~-r(ducti n D.n.:.~ (;.x~~:)rts which ~T' vi~~s the
r.l1lj::r source of emplcynent eeneraticn nnd out~;ut Cr0\·Tth fer the Jte~rs
to ct.-me. Efficient imlJort substitution p-~licy iX-CkC-£f; must Le llesi£na.l
to stimulate industrial entre~)reneurs t!~ seek, utilize <:i.n.:l e..xteml
- 51 -
lahar-using techncloG""Y nm~ output-mix an:! to (mabIe the o.gricul-
turnl sector tc pIny out its historical role; in order to kCGp the
actural pattern of industrial growth in tune ",ith the ec:.:>nnr.lY's
changing resource enc~ol/mcnt o.nd ~lcnf th€ ideal ;lD.th of export-
substituticn gro"'th as suggester_l in Gur c.nnlys:is. Our critical
cnr-.lysis of the Korea IS Crc"\·,th cxrericncc 'tUr::--t:r.3ts :·.t~-·rbll()win5
i)clicy .:lirections ",hich ere rclevnnt t(' Koren I S cXl-='crt-substituticn
subphasc and ,·;hich have to be .:;ivcn tOil ~)riority f;)r devcl:;pmont
policy nn(~ strategy.
(i) The hichest order of ~ri0rity shouhl be eiven to
the r:FxlernizntiGn cf <::~,riculturc. Kcrea is still f«::.ced
,-lith the i?rcl~len (,f buildil16 u~) thE;; infra-structure in
hcr D.~;riculturul sectc,r nn~! utilizint; the relatively
uncXl)lor(.(~ agricultural pr(~\luctivity reserves. By
infrastructure is r.icnnt n'}t only irrig.:.ti·Jn, roadne:t"lcrk
[:·.n.l !Jthcr i;hysicD.I investments but nlso the creation of
Co. t·;tcl inst.ituticnc.l ~'lilicu c,-'n:ucive tc c.criculturnl
:lrrx:uctivit~~ incrcn,sc. If thl: :_.rcv~ilinL vi<ow thet ther(;
exists n. su~.st~nti~l t,_·-tcnti~l f:~r further <::~~ricultur:ll
-"'1' -, "uct.· ~ Vl'ty l'ncre"'sc. thl '''-'1'· -h~l-"e- 1 /.> ..,t -;1-.1' "'" r r' -'c l~:';;'; 1n.:.~ _........... a. U v ..... ",,::.•• _'-'" ...., Ji.. '-_.it .... ~1L . .,.jj,-, ...... li I..... tv-IL ~t
:-;itlyut the n(;cc~ for extensivs r.'Il::.chG.niz~t~0n is n:.:t cff the
nc.rk, thE.. fensii.::lc approD..ch tm,mr.:: D.ctiv:J.ting the ~gricul-
tur~l pro~~uctivity reserv(;~; \·:)ul:~: certainly net call for
- 52 -
cnpitnl-intcnsivc J.wnsures. H£ricultur~J. Jevulcpmc;nt mainly
t t:lonco ')f rtlJ-'l~lent ::.rcssurcs. thr:.. u:h r(.:~ucti"n in impcrt
f'~,r ; I" c::n.. ·"tll"n' tlll(' "'V~ e-ti n . ""/cot· r ", . r '~1"rr·ct c'-'ntr"'~ls,. ' •• ~.,......... G' • - ~.::."> - ''- ;:),,'> ~I.. - ~ ~ -
subsi·.:ics GnL incentives a.,~:}:'tc.~ durinG t.he inpart-suL3titu-
li:.'eraliz~tic;n nCc.5urcs in the ~reus Gf fcreien exchnnre
1,v·ul.': ten.! to cc,rrcct the .;,:istcrtions in the industrial
intcnsivl tcchnoloi.:.:l and ut;.'ut-r.'lix lihict. is cL~lle:.l .fer ;:'y
little ilc ..nncctivit:r" ". h',Ilth
.'. ..l.
- 53 -
system bc.:tween urban-oricntcd l~g(; industries lIlY.: sLall
r.nd mLuium industries reachinG out into the cotUltry SiGl;
l:0uld not Cinly hcl~ reeucing inc!ustrinl capital intensity
but also increase fc.I'I:lers I perccpti::n of invcstncnt
r'p~rtunitics outside of nS,riculturc one: their inc(;ntiv(~s
to accept new techn~)lo[Y.
(iv) lihilc efficient export-su~stitutic.npolicy pD.CKr.;gc
shoulC: be pursued with a vii\;;u to i.klintnininc th.: ctntinucd
r:rowth 1Jased on labor-intensive: exports, the pelley ci'
IntoI' utilization "lill hn.vc tc hl, i~r~_:unlly ::irected: tc't'1:1.rt:
devclcpr.lcnt of hUf:1cn skills and trr..inin[' to provic..:e D,., '_equc.te
supply of skill€<.: r.ump0l·mr in an effort to cxtcnc: the ":urn
tion t)f export-substitution D"'c\-ith ~-,hnSelt
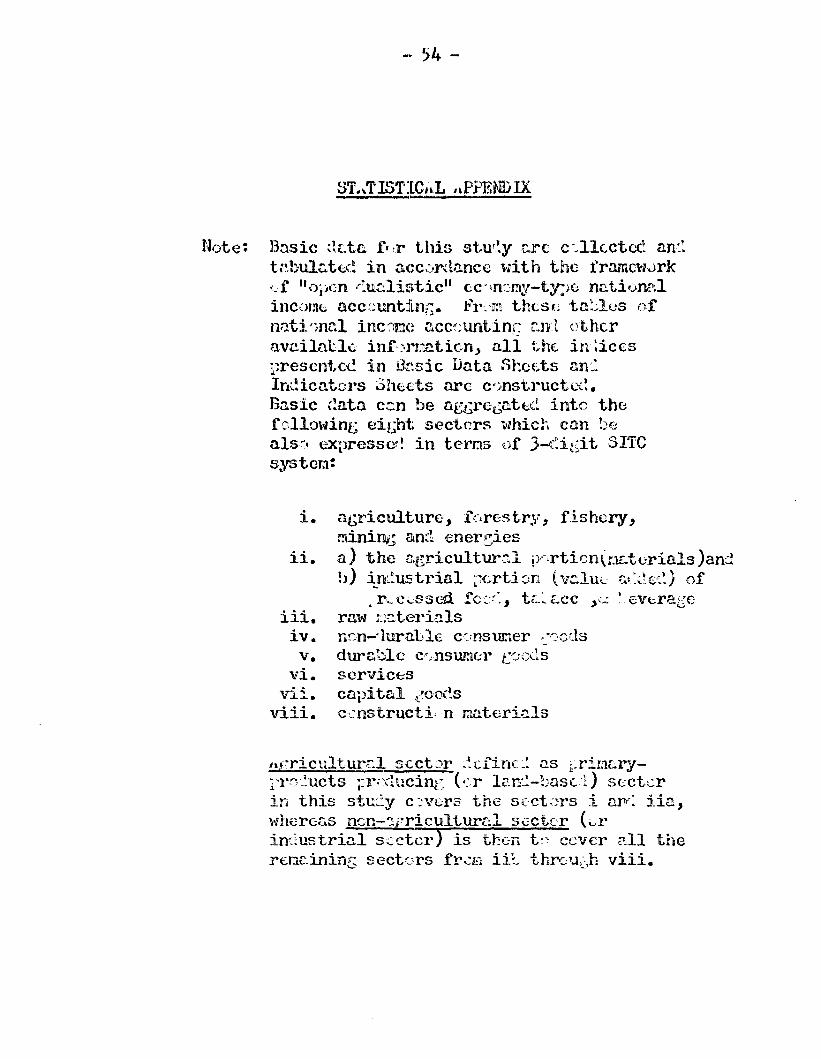
•. 54 -
Note: Basic ~~::tr. fK,r this stur~y ere c·~11(.ctcC an::t(~bulc.t(.-(~ in accc)rdc.ncc "lith the frmncw,,)rkc.f "okJcn .r:u.:;:lit-)tic" cC·bn::.:,m~r·-ty:.i(; nr;.ti0Th:~1
income ncc::untiLnG. l;'rA:l these tn:;lf":s ofI1nti'mGl inc'Jrne acccuntinr; r~~nl nthcravnilablc infH'!:w.ticn, all t~h(. in:iccsi)resenf,cc in jJ[~sic Data :lhc(~ts nn2Indicators Shects nrc c"mstructe(~.
Basic (~nta c·:.n be llEJ;rebntt:;(~ lute thefollO\·ling eiGht secters which can !)cals r • expresser! in terns of 3-(~i{;it SITesystem:
i.
ii.
iii.iVav.
vi.v-.ii.
viii.
Ub'Ticulture:, f(,rest~l, fishery,F.dniOb and enereiesa) the aericultur.r~l iy-,rtion(I.1£.terials )and!J) ~nc~ustrial ~J{;rti0n {v::luL ;:.•. ~,-ter.~) of
• !",_ c-.;s s cd. fcc./., t<..~ Lee ,c: ~_ E;Vt;raGcra\J' ;:t~terinls
ncn-'lurnbl€ cr.mstlr.ler >"C'eds-dtD~ablc c~~nsur.l(;r C:x)dsscrvict:scapital lOO~s
c,:nstructi;n J:'Jlteri~ls
hrricultur.c:l sect:)r :~(.finc_: D.S i-rimr:.ryprC"_:ucts rr:'ctucinC ('~-r lr.rr":-bascl) s(;;ct(;rin this stucy c ::vers the S(-ct:)rs i (111'< iiD-,\'fherG:us ncn-"lpriculturr:.l scctcr (vI'im~ustrial sc'.::tcr) is tt::e-n t~· ccvcr cdl the.rene.inint; sectGrs fr·~n ii~# thrvu.c,h viii.
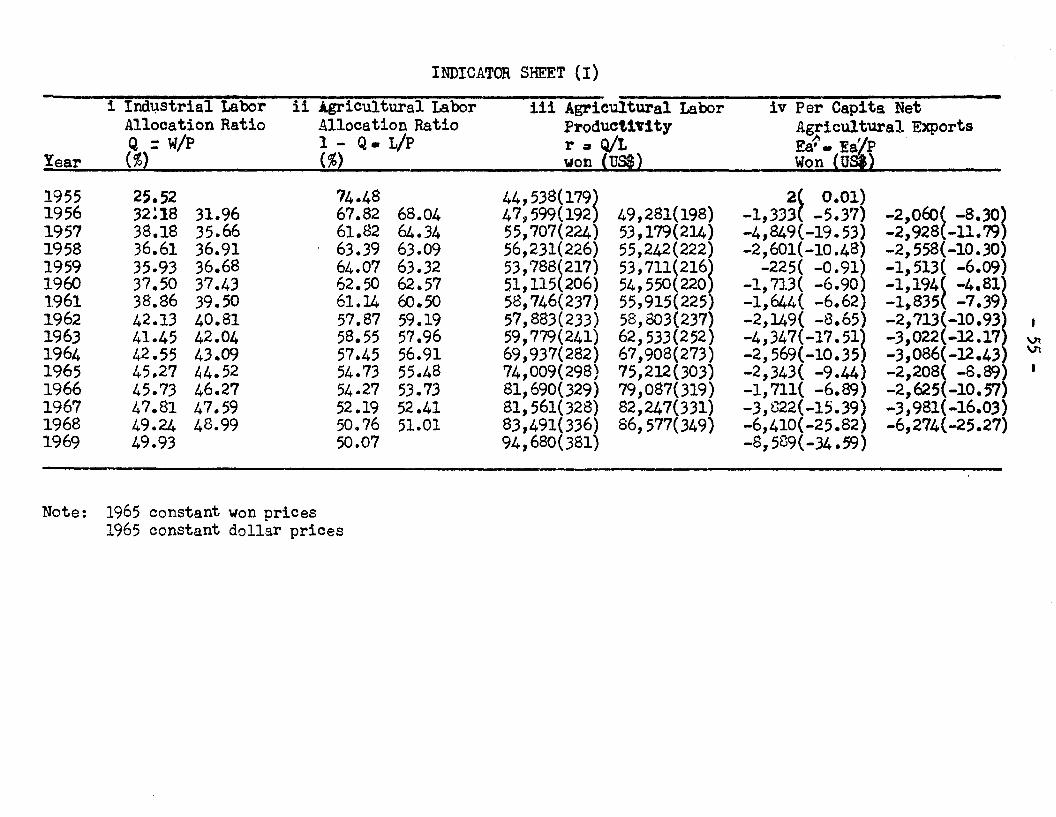
INDICATOR SHEET (I)
1 Ind~str1al Labor ii Agricultural Labor iii Agricultural Labor iv Per Capita NetAllocation Ratio Allocation Ratio Product11'1ty Agricultural ExportsQ =W/P 1- Q-t/p r Oil Q/L Ret. Ea'/P .
Year (%) (%) won (US$) Won C]§l)
1955 25.52 74.48 44,538(179~ 2~ 0.01)1956 32;18 31.96 67.82 68.04 47,599(192 49,281(198) -1,333 -5.37) -2,060~ -8.30~1957 38.18 35.66 61.82 64.34 55,707(224) 53,179(214) -4,849(-19.53) -2,928 -11.'791958 36.61 36.91 63.39 63.09 56,231(226) 55,242(222) -2,601(-10.48) -2,558(-10.30)1959 35.93 36.68 64.07 63.32 53,788~217) 53,711~216~ -225( -0.91~ -1,513( -6.09)1960 37.50 37.43 62.50 62.57 51,115 206) 54,550 220 -1,713( -6.90 -1,194~ -4.81~1961 38.86 39.50 61.14 60.50 58,746(237) 55,915(225) -1,644( -6.62) -1,835 -7.391962 42.13 40.81 57.87 59.19 57,883(233) 58,803(237~ -2,149( -8.65) _2'713(-10'93~1963 41.45 42.04 58.55 57.96 59,779(241) 62,533(252 -4,347(-17. 51~ -3,022(-12.17 V1
1964 42.55 43.09 57.45 56.91 69,937(282) 67,908(273) -2,569(-10.35 -3,086(-12.43 V1
1965 45.27 44.52 54.73 55.48 74,009(298) 75,212(303) -2,343( -9.44) -2,208{ -8.891966 45.73 46.27 54.27 53.73 81,690(329) 79,087(319) -1,711( -6.89) -2,625(-10.57)1967 47.81 47.59 52.19 52.41 81,561(328) 82,247(331) -3,822(-15.39~ -3,981(-16.0:3)1968 49.24 48.99 50.76 51.01 83,491(336) 86,577(349) -6,410{-25.82 -6,274(-25.27)1969 49.93 50.07 94,680(381) -8, 589{-34.59)
Note: 1965 constant won prices1965 constant dollar prices
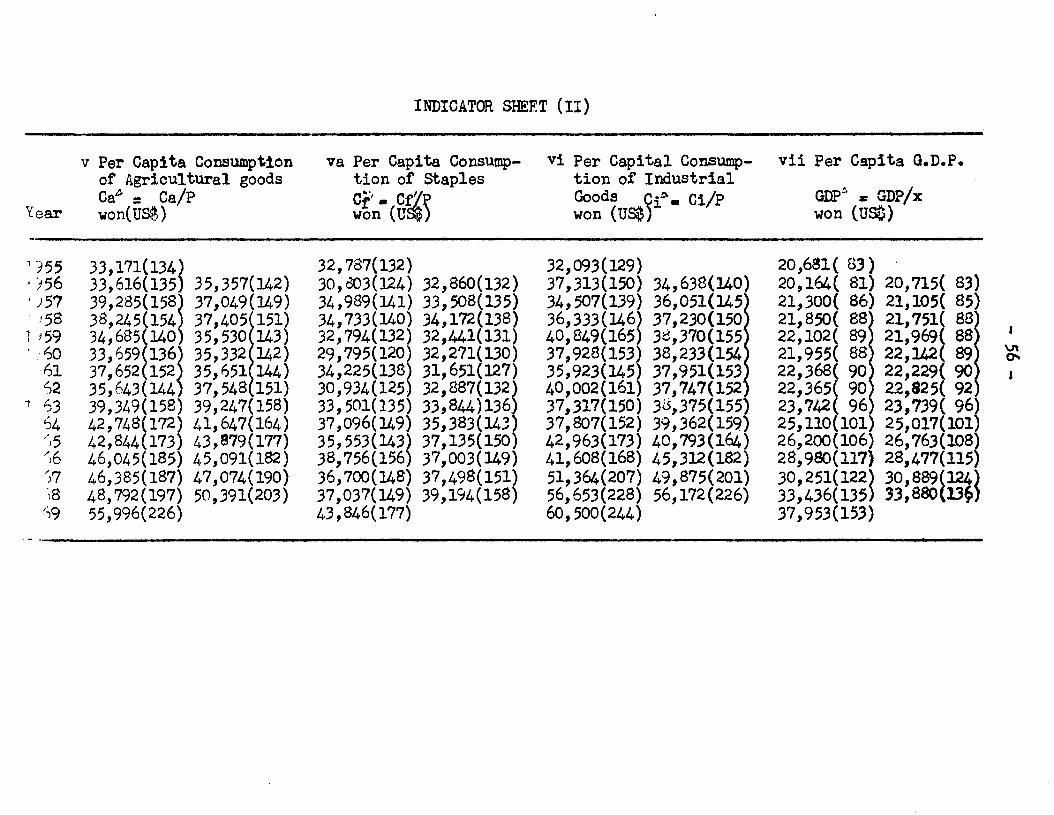
INDICATOR SHEET (II)
v Per Capita Consumptionof Agricu1tural goodsCa~ = Cal?
Year won(US~)
va Per Capita Consumption of StaplesCf'. Cfl'pwon (U~)
vi Per Capital Consump- vii Per Capita G.D.P.tion of IndustrialGoods Ci~. cilp GDP:' s: GDP/xwon (US$) won (US$)
')551)56I )57. 1581 J59·~O
61t.,2
1 >S364/6/)6/)7"18'~9
33,171(134)33,616(135) 35,357(142)39,285(158~ 37,049(149)38,245(154 37,405 151)34,685(140 35,530 143)33,659(136~ 35,332 142)37,652 152 35,651 144)35,643~144 37,548 151)39,349(158) 39,247(158)42,7~,8(172) 41,647(164)42,844(173) 43,!79(177)46,045(185) 45,091(182)46,385(187) 47,074(190)48,792(197) 50,391(203)55,996(226)
32,787(132)30,d03(124) 32,860(132)34,989(141) 33,508(135)34,733(140) 34,172(138)32,794(132) 32,441(131)29,795(120) 32,271(130)34,225(138) 31,651(127)30,934(125) 32,887(132~33,501(135) 33,844)13637,096(149) 35,383(14335,553(143) 37,135(15038,756(156) 37,003(149)36,700(148) 37,498(151)37,037(149) 39,194(158)43,846(177)
32,093(129)37,313(150) 34,638(140)34,507(139) 36,051(14536,333(146) 37,230{15040,849(165) 3d,370(15537,928(153) 38,233{15435,923(145) 37,951(15340,002(161) 37,747(15237,317(150) 3J ,375(155)37,807(152) 39,362(159)42,963(173) 40,793(164)41,608(168) 45,312(182)51,364(207) 49,875(201)56,653(228) 56,172(226)60,500(244)
20,681( (3)20,164( 81) 20,715( 83)21,300( 86) 21,105( 85)21,850{ 88 21,751( 8822,102( 89 21,969( 8821,955( 88 22,142( 8922'368~ 90 22,229( 9022,365 90 22,825( 9223,742 96, 23,739( 9625,110 101) 25,017(101~26,200(106) 26,763(108)28,9SO(117} 28,477(115)30,251(122) 30,889(124)33,436(135) 33,880(13§)37,953(153)
\on0'
I
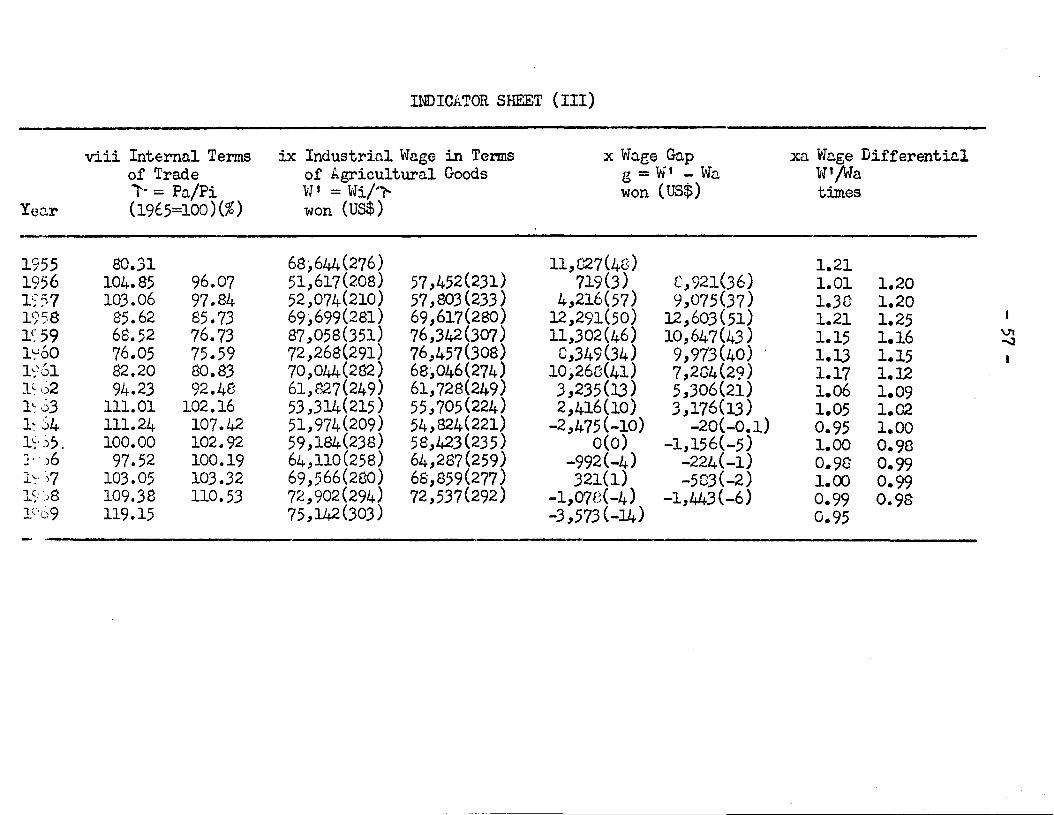
INDICATOR SHEET (III)
viii Internal Terms ix Industrial Wage in Ter.ms x W~ge G~p xa W~ge Differentialof Tra.de of Agricultural Goods g = vi' - W(l Vf'/'da,..,. = P~/Pi \~, = vii!',... won (US$) times
Yenr (1965=100) (%) won (US$)
1955 80.31 68,644(276) 11,C27(48) 1.211956 104.85 96.07 51,617(208) 57,452(231) 719(3) C,921(36) 1.01 1.20Ie.,7 103.06 97.84 52,074(210) 57,803(233) 4,216(57) 9,075(37) 1.3C 1.20, .1<;58 85.62 85.73 69,699(281) 69,617(280) 12,291(50) 12,603(51) 1.21 1.25F59 6S.52 76.73 87,058(351) 76,342(307) 11,302(46) 10,647(43 ) 1.15 1.16 VI
-.J1';J60 76.05 75.59 72,268(291) 76,457(308) C,349(34) 9,973(40) 1.13 1.15 I1~~61 82.20 80.83 70,044(282) 68,046(274) 10,26C(41) 7,2G4(29) 1.17 1.12l~ 1,;2 94.23 92.48 61,827(249) 61,728(249) 3,235(13) 5,306(21) 1.06 1.091~o3 111.01 102.16 53,314(215 ) 55,705(224) 2,416(10) 3,176(13) 1.05 1.02l~ :j4 111.24 107.42 51,974(209) 54,824(221) -2,475(-10) -20(-0.1) 0.95 1.001,;' ~,. 100.00 102.92 59,184(238) 58,423(235 ) 0(0) -1,156(-5) 1.00 0.98J .. )6 97.52 100.19 64,110(258) 64,287(259) -992(-4) -224(-1) 0.98 0.99-'7 103.05 103.32 69,566(280) 68,859(277) 321(1) -583(-2) 1.00 0.99.l.~. )
1~,·)8 109.38 110.53 72,902(294) 72,537(292) -1,07e(-4) -1,443(-6) 0.99 0.981::'t)9 119.15 75,142 (303 ) -3,573 (-14) 0.95
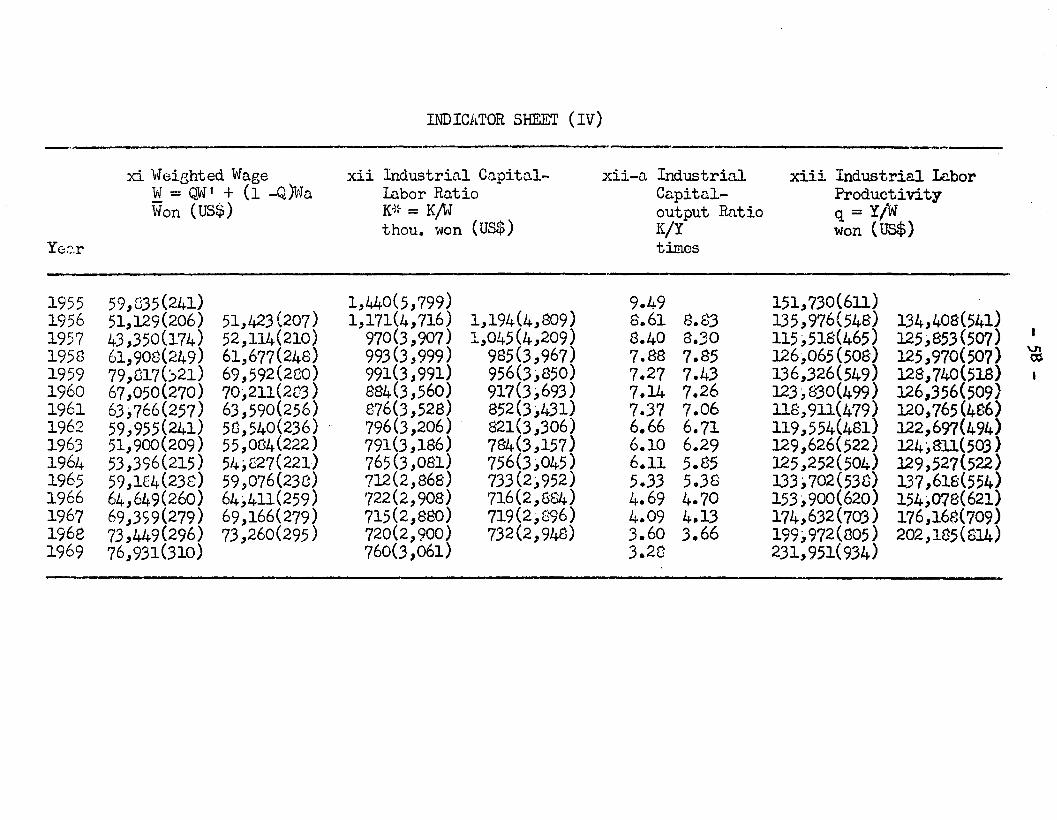
INDICATOR SHEET (IV)
- ---,xi \feighted Wa.ge xii Industrial Cnpitn1- xii-a Industrial xiii Industria.1 Labor
vi = Qvi t + (1 -Q)Vfa Labor Ratio Capita1- Productivity'Vvon (US$) K-l~ = K~v output &.1.tio q = yiW
thou. won (US$) K/Y won (US$)Y0::.r timos
1955 59,835 (241) 1,440(5,799) 9.49 151,730(611)1956 51,129(206) 51,423(207) 1,171(4,716) 1,194(4,809) 8.61 8.83 135,976(548) 134,408(541)1957 43,350(174) 52,114(210) 970(3,907) 1,045(4,209) 8.40 8.30 115,518(465) 125,853(507)195B 61,90$(249) 61,677(248) 993(3,999) 985(3,967) 7.88 7.85 126,065(508) 125,970(507) VI
~
1959 79,C17(~21) 69,592(200) 991(3,991) 956<:3,B50) 7.27 7.43 136,326(549) 128,740(518) I
1960 67,050(270) 70,211(2C3) 884(3,560) 917(3,693) 7.14 7.26 123,830(499) 126,356(509)1961 63,766(257) 63,590(256) 876(3,528) 852(3,431) 7.37 7.06 118,911(479) 120,765(486)1962 59,955(241) 50,540(236)" 796(3,206) 821(3,306) 6.66 6.71 119,554(481) 122,697(494)1963 51,900(209) 55,004(222) 791(3,186) 784(3,157) 6.10 6.29 129,626(522) 124,811(503)1964 53,396(215) 54,627(221) 765 (3 ,0En) 756(3,045) 6.11 5.85 125,252(504) 129,527(522)1965 59,1£4(238) 59,076(230) 712(2,868) 733(2,952) 5.33 5.38 133,702(530) 137,618(554)1966 64,649(260) 64,411(259) 722(2,908) 716(2,884) 4.69 4.70 153,900(620) 154,078(621)1967 69,3S9(279) 69,166(279) 715(2,880) 719(2,896) 4.09 4.13 174,632(703) 176,168(709)1968 73,449(296) 73,260(295) 720(2,900) 732(2,948) 3.60 3.66 199,972(005) 202,185(814)1969 76,931(310) 760(3,061) 3.28 231,951(934)
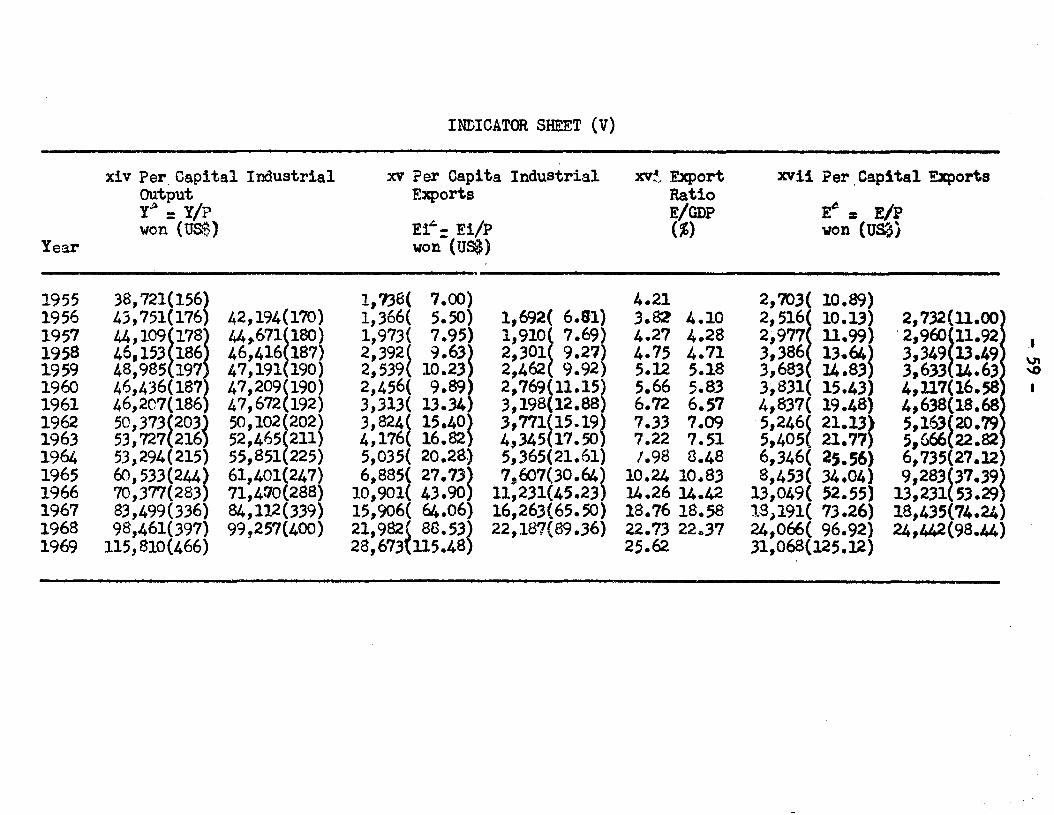
INDICATOR SHEET (V)
xiv Per. Capital Industrial xv Per Capita Industrial xv~ Export xvii Per ,Capital ExportsOutput Exports RatioyA =yip
Ei':': Ei/PE/GDP E~ = Eli
won (U8$) (%) won (US3)Year won (USll)
.-1955 38,721(156~ l,'138( 7.00) 4.21 2,703( 10.89)1956 43,751(176 42,194(170) 1,366( 5.50) 1,692( 6.81) 3.82 4.10 2'S16
f10.13) 2, 732(ll.OO
1957 44,109~178 44,671~180) 1,973( 7.95) 1,910( 7.69) 4.27 4.28 2,977 11.99) .2'960fll.92~ ,.1958 46,153 186 46,416 187) 2,392~ 9.63~ 2,301~ 9.27) 4.75 4.71 3,386 13~64~ 3,349 13.49 Vt1959 48,985 197 47,191 190) 2,539 10.23 2,462 9.92) 5.12 5.18 3,683 14.83 3,633 14.63 '00
1960 46,436(187 4?,209~190) 2,456( 9.89~ 2,769(11.15) 5.66 5.83 3,831( 15.43) 4,ll7(16.58 I
1961 46,207(186 47,672 192) 3,313( 13.34 .3,198(12.88) 6.72 6.57 4,837{ 19.48) 4,638(18.681962 50,373~203~ 50,102~202~ 3,824~ 15.40~ 3,771~15.19~ 7.33 7.09 5,246~ 21.13~ 5,163~20.'791963 53,727 216 52,465 211 4,176 16.82 4,345 17.50 7.22 7.51 5,405 21.77 5,666 22.821964 53,294(215) 55,851(225) 5,035( 20.28) 5,365(21.61) 1.98 8.48 6,346( 2S.56~ 6,735(27.12)1965 (jJ,533(244~ 61,401(247) 6,885~ 27.73~ 7,607(30.64) 10.24 10.83 8,453{ 34.04 9,283~37.39~1966 70,377(283 71,4~0(288) 10,901 43.90 11,231(45.23) 14.26 14.42 13,049{ 52.55) 13,231 53.291967 83,499(336) 84,112(339) 15,906( 64.06) 16,263(65.50) 18.76 18.58 lS)191( 73.26) 18,435(74.24)1968 98,461(397) 99,257(400) 21,982~ 8G. 53~ 22,187(89.36) 22.73 22 ..37 24,066( 96.92) 24,442(98.44)1969 115,810(466) 28,673 115.48 25.62 .31,068(125.12)
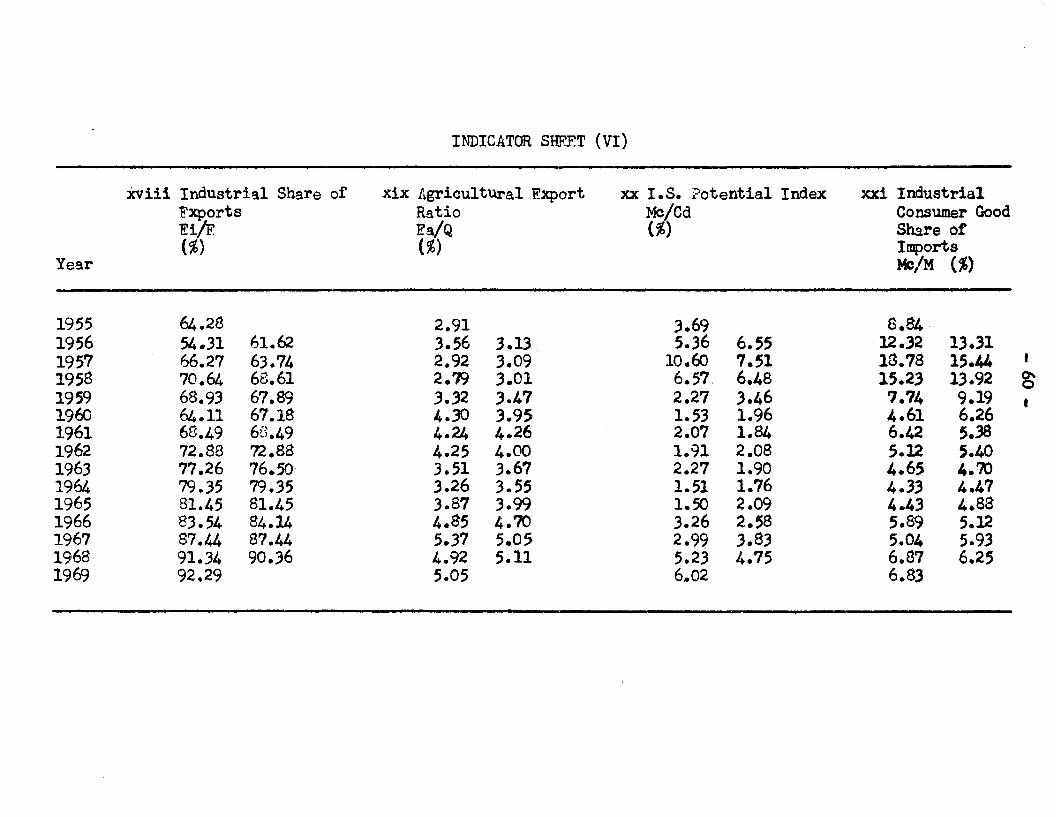
INDICATOR SHEET (VI)
Year
Xviii Industrial Share ofFxportsRilE(%)
xix Agricultural ExportRatioFa/Q(%)
xx I.S. Potential IndexMe/Cd(%)
xxi IndustrialConsumer GoodShare ofImportsMc/M (%)
1955 64.28 2.91 3.69 8.841956 54.31 61.62 3.56 3.13 5.36 6.55 ·12.32 13.311957 66.27 63.74 2.92 3.09 10.60 7.51 13.78 15.44 I
1958 70.64 68.61 2.79 3.01 6.57. 6.48 15.23 13.92 0'0
1959 68.93 67.89 3.32 3.47 2.27 3.46 7.74 9.19 I19(i) 64.11 67.18 4.30 3.95 1.53 1.96 4.61 6.261961 68.49 6G.49 4.24 4.26 2.07 1.84 6.42 5.381962 72.88 '72. .88 4.25 4.00 1.91 2.08 5.12 S.401963 77.26 76.50 3.51 3.67 2.27 1.90 4.65 4.?O1964 79.35 79.35 3.26 3.55 1.51 1.76 4.33 4.471965 81.45 81.45 3.87 3.99 1.50 2.09 4.43 4.881966 83.54 84.14 4.85 4.70 3.26 2.58 5.89 5.121967 87.44 87.44 5.37 5.05 2.99 3.83 5.04 5.931968 91.34 90.36 4.92 5.11 5.23 4.75 6.87 6.251969 92.29 5.05 6.02 6.83
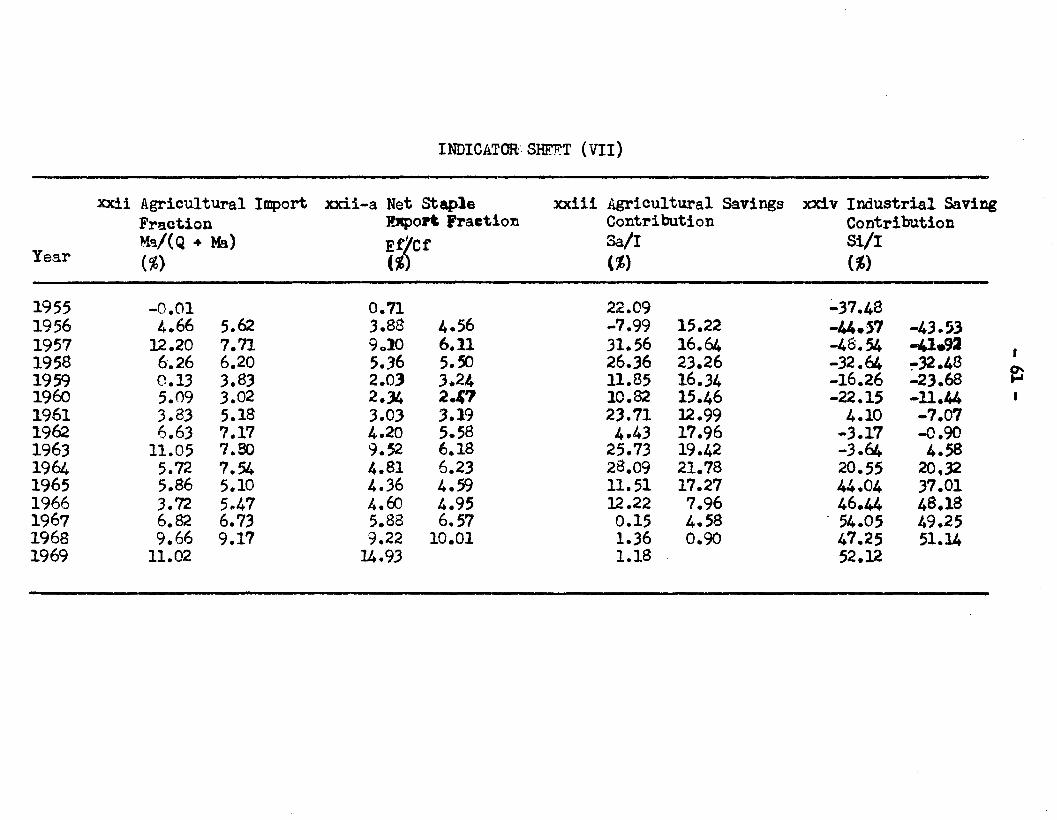
INDICATOR:· SHEF.T (VII)
xxii Agricultural Import xxii-a Net Staple xxiii Agricultural Savings xxiv Industrial SavingFraction lxport Fraction Contribution ContributionM~/(Q .. M9.) E~~cr SaIl sill
Year (%) (% (%) (%)
1955 -0.01 0.71 22.09 ;"37.481956 4.66 5.62 3.88 4.56 -7.99 15.22 -u..S7 -43.531957 12.20 7.71 9..)0 6.11 31.56 16.64 -48.54 -41.92
f1958 6.26 6.20 5.36 5.50 26.36 23.26 -32.64 -32.48
~
1959 0.13 3.8) 2.03 3.24 11.85 16.34 -16.26 -23.68 ~
1960 5.09 3.02 2.34 2-'7 10.82 15.46 -22.15 -1l.'4 f
1961 3.83 5.18 3.03 3.19 23.71 12.99 4.10 -7.071962 6.63 7.17 4.20 5.58 4.43 17.96 -3.17 -0.901963 11.05 7.60 9.52 6.18 25.73 19.42 -3.64 4.581964 5.72 7.54 4.81 6.23 28.09 21.78 20.55 20.321965 5.86 5.10 4.36 4.59 11.51 17.27 44.04 37.011966 3.72 5..47 4. €:lJ 4.95 12.22 7.96 46.44 48.181967 6.82 6.73 5.88 6.57 0.15 4.58 . 54.05 49.251968 9.66 9.17 9.22 10.01 1.36 0.90 47.25 51.141969 11.02 U.93 1.18 52.12
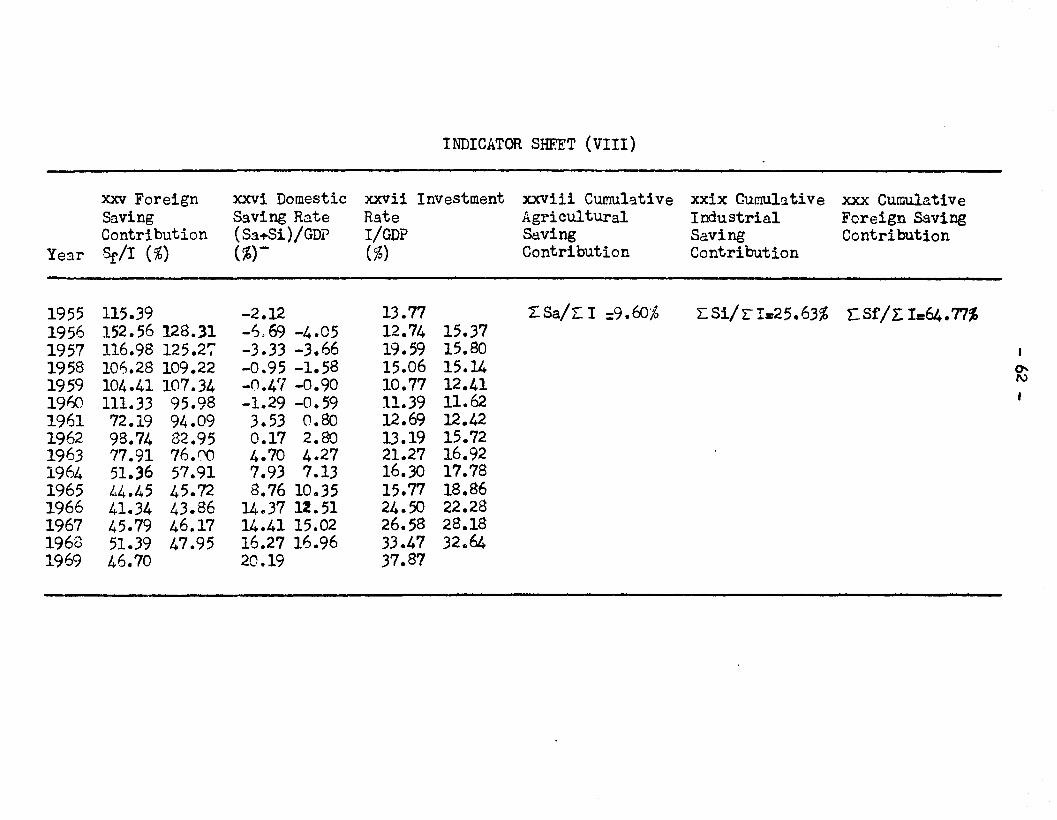
INDICATOR SHEET (VIII)
xxv Foreign xxvi Domestic xxvii Investment xxviii CUffiu1stive xxix Cur.IU13.tive xxx CumulativeSaving Saving Rate Rate Agricultural Industrial Foreign SavingContribution (Sa...Si)/GDP I/GDP Saving Saving Contribution
Yesr Sr/I (%) (%)- (%) Contribution Contribution
1955 115.39 -2.12 13.77 J:- Sal L.. I =9.1!:iJ 10 2:Si/L" I:25.63% r: SfI r: I=64. 77%1956 152.56 128.31 -1:>,69 -4.05 12.74 15.371957 116.98 125.27 -3.33 -3.66 19.59 15.80 I
1958 10~.28 109.22 -0.95 -1.58 15.06 15.14 0"-
1959 104.41 107.34 -0.4'1 -0.90 10.77 12.41 l\)
1960 111.33 95.98 -1.29 -0.59 11.39 11.62 f
1961 72.19 94.09 3.53 0.80 12.69 12.421962 98.74 82.95 0.17 2.80 13.19 15.721963 77.91 76.00 4.70 4.27 21.27 16.921964 51.36 57.91 7.93 7.13 16.30 17.781965 1.,.4.45 45.72 8.76 10.35 15.77 18.861966 41.34 43.86 14.37 12.51 24.50 22.281967 45.79 46.17 14.41 15.02 26.58 28.181968 51.39 47.95 16.27 16.96 33.47 32 .. 641969 46.70 20.19 37.87
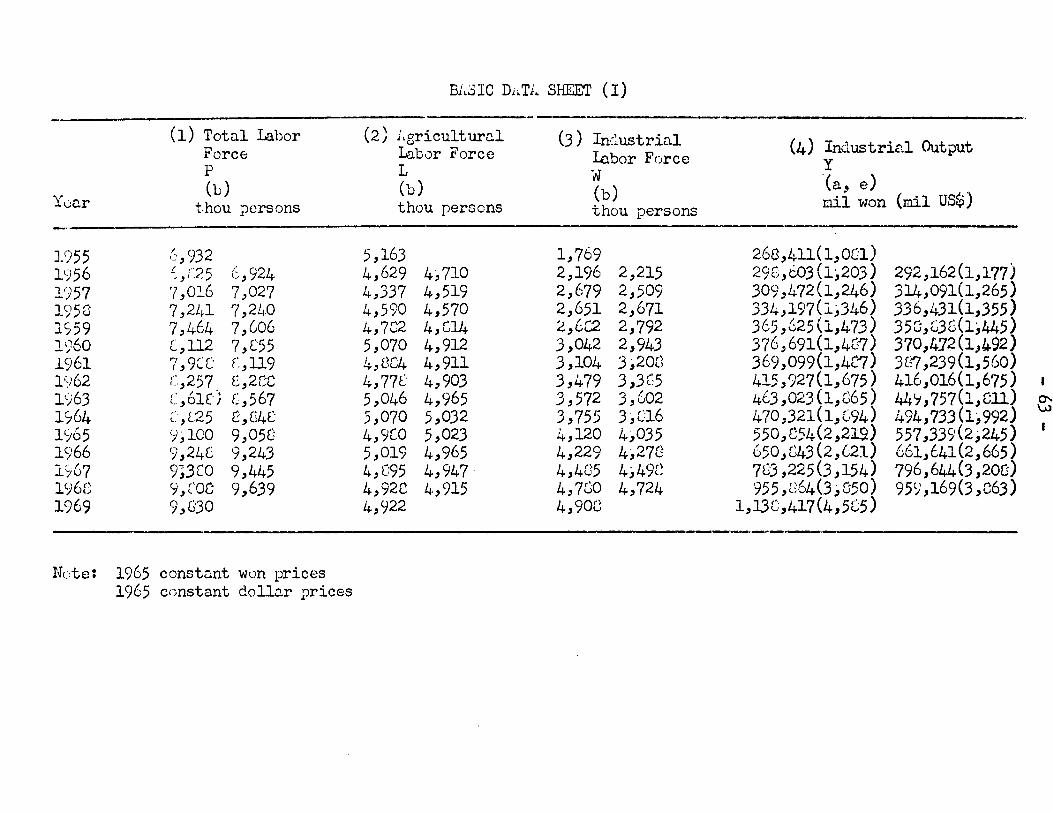
Yvc,r
J.()5519561')5719581S591960.196119621')631'7641';;6519661'-767196G1969
Bl.3IC Di.Ti.. SHEET (I)_._--
(1) Tottl1 Labor (2) 1.ericu1turc.1 (3) In:~ustritl1 (4) Industrin1 OutputForce L!J.bor Force Labor Forcep L W
Y(b) (b) (b)
(a, e)thou persons thou persons thou persons mii won (mil US$)
- . -
(',932 5,163 1,769 26$,4ll(1,Of.Jl)~ "''j 5 ;' 9?4 4,629 4,710 2,196 2,215 298,603 (1:,203) 292,162(1,177)-" i .r. (,' \-
'1,02.6 7,027 4,337 4,519 2,679 2,509 309,472(1,246) 314,091(1,265)7,2Lj.1 7,24.0 4,590 4,570 2,651 2,671 334,197(:i.,346) 336,431(1,355)7,464 7,G06 4,782 4,C14 2.,L,C2 2,792 365,625 (1,473) 358,£:3G(l,445)[,112 7,855 5,070 4,912 3,042 2,943 376,691(1,4G1) 370,472(1,~92)r7 9(' r\ [',,119 I (5("4 4,911 3,104 3' 20(\ 369,099(1,4('7) 3G'7,239(1,560)I, LL. ,,+,LU , ~.l
c' 257 r 2("("\ 4,77l' 4,903 3,479 3,3(5 415,927(1,675) 416,016(1,675) I'-' , ~ , ,,:<.,.," 1.1(" r 567 5,046 4,965 3,572 3,G02 463,023 (1,065) 44'i,757(l,Cll) 0"-<..,0 I .,r ['?5 £::,[34£: 5,070 5,032 3,755 3,[:16 470,321(1,(;94) 494,733(1,992) \"JL., J"-
I'7,100 9,05£:: 4,9[0 5,023 4,120 4,035 550,C54(2,219) 557,339(2;245)9,248 9,243 5,019 4,965 4,229 4 ')7('\ 650,C43 (2,621) 661,641(2,665),... ~
9;3CO 9,445 4,C95 4,947, 4,485 4,49C 783,225 (3 ,154) 796,644(3,20C)C),COC 9,639 4,92C 4,915 4,700 4,724 955 ,C64(3 ,G50) 95),169(3,C63)9,G'30 4,922 4,90G 1,13[:,417(4,585)
-~.---
Nete: 1965 constnnt won prices1965 constant do11D.r prices
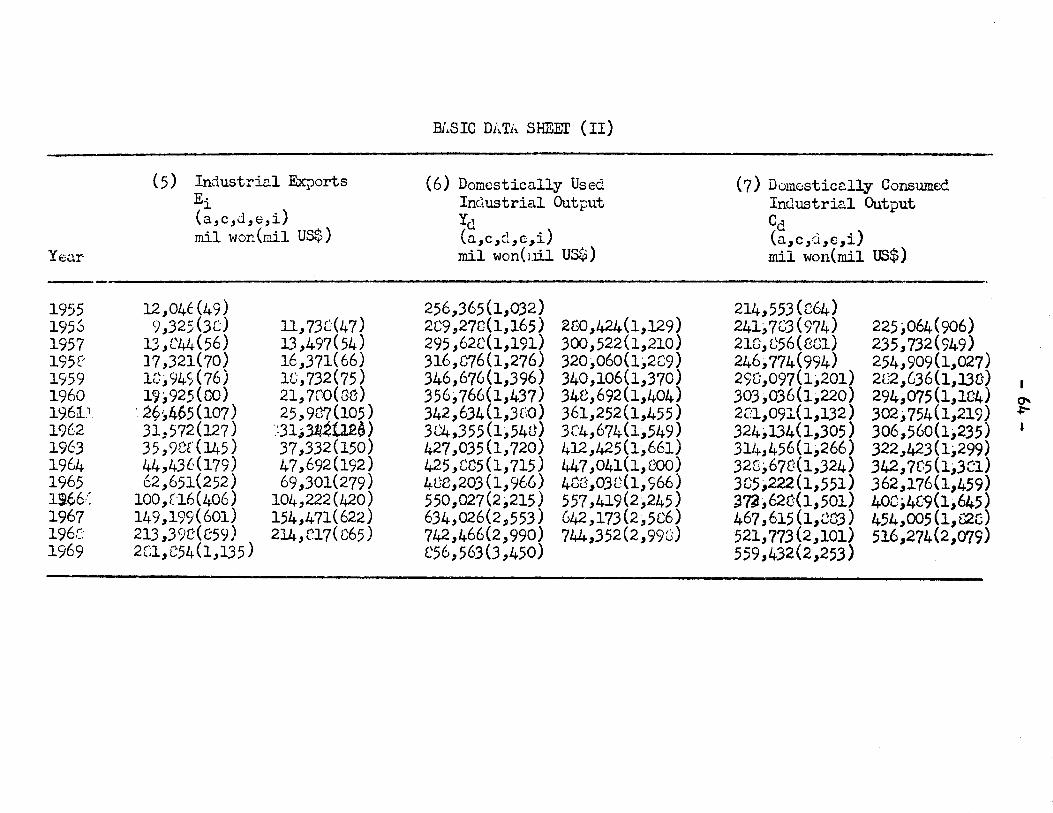
BI..SIC Dj~Tl~ SHEEr (II)
(5) Industri~l Exports (6) Domestically Used (7) Domostica11y Consum€dE· Industrial OutPltt Industrial Output~
(a,c,J,e,i) Yd Cdmil wor.(mil US$) (n,c,d,e,i) (a,c,d,e,i)
Year mil won(uil u3$) mil won(mil 08$)
1955 12,04c(49) 256,365(1,032)280,424(1,129)
214,553 (C64)225:,064(906)1956 <) ,325 (3e) 11,738(47) 289,270(1,165) 241,7C3 (974)
1957 13, C'4Ll. (56) 13 ,497( 54) 295,628(1,191) 300,522(1,210) 218,856(801) 235,732(949)195£' 17,321(70) 16,371(66) 316,076(1,276) 320,060(1,289) 246,774(994) 254,909(1,027)1959 10,94S(76) 1(;,732(75) 346,676(1,396) 340,106(1,370) 290,097(1,201) 2C2,G36(1,13C) I1960 19:,925(00) 21,7CO(G8) 356,766(1,437) 34C,692(1,404) 303:,036(1,220) 294,075(1,104) 0-.19.61.1 . 29~465(107) 25,9C7(105) 342,634(1,3(:0) 361,252(1,455) 2[;1,091(1,132) 302,754(1,219) ~
19L-2 31,572(127) ·.Jl;31I~U£~) 3C4,355 (1,54U) 3C'4,674(1,549) 324,134(1,305 ) 306,560(1,235) I
1963 35,9Cr(145) 37,332(150) 427,035(1,720) 412,425(1,661) 314,456(1,266) 322,423(1:,299)1964 44,43{(179) 47,692(192) 425,005(1,715) 447,041(1,£"'00) 32C:,67C(1,324) 342,7(:5 (1,381)1965 62,651(252) 69,301(279) 4CC,203 (1,966) 4C3,03C(l,966) 3C5,222(1,551) 362,176(1,459)1'66": 100,C16(406) 104,222(420) 550,027(2,215) 557,419(2,245) ~7a,62C(1,501) 400,401(1,645)1967 149,199(601) 154,471(622) 634,026(2,553) 642,173 (2,506) 467,615 (l,CQ3) 454,005 (l,i2C)196[; 213 ,39C(C59) 214,C17(C65) 742,466(2,990) 744,352(2,99(;) 521,773(2,101) 516,274{2,079)1969 2Cl,854(1,135 ) C56,563(3,450) 559,432(2,253)
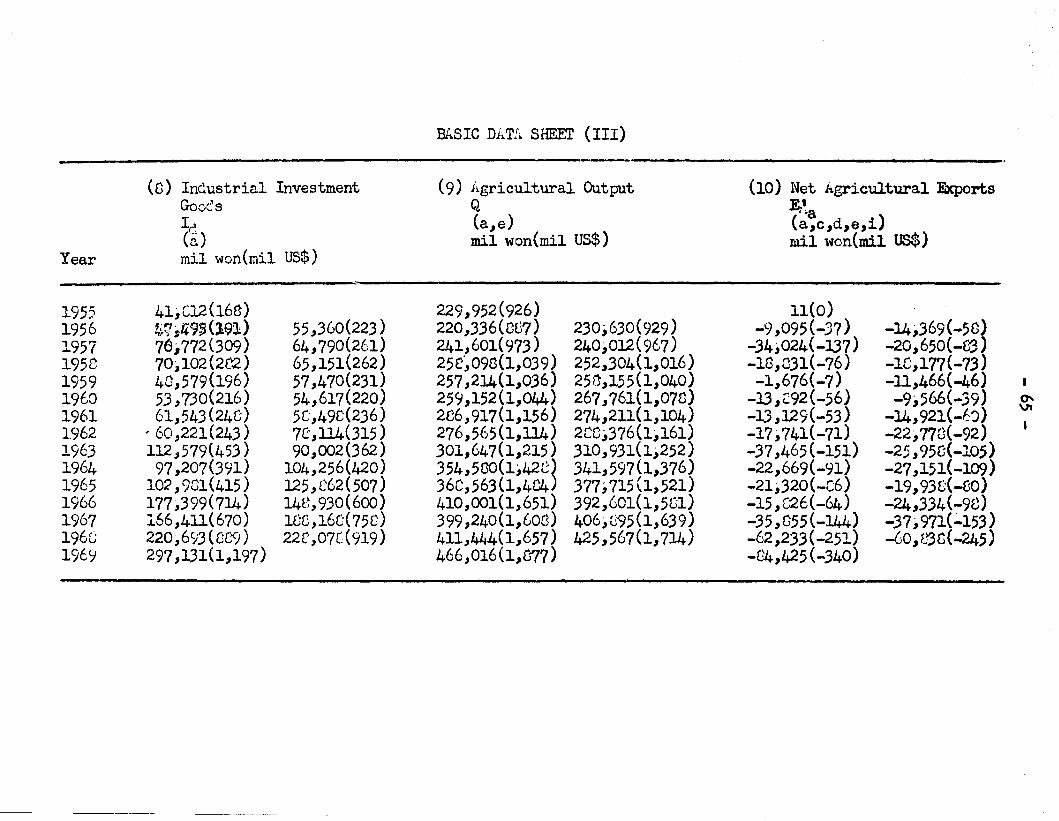
BASIC Dil.T!~ SHEET (III),a__
(0) Industrial Investment (9) il.gricultural Output (10) Net Agricultural ExportsGooC's Q E;~'aI (a,e) (a,c,d,e,i)(')c. mil won(mil US$) mil won(mi1. US$)
Year mil won(rnil US$)
1955 41, [;12 (16B) 229,952(926) 11(0)1956 !i1 ,495 (lQJJ 55,360(223 ) 220,336(CC7) 230;630(929) -9,095(-.37) -14,369(-50)1957 70;,772(309) 64,790(261) 241,601(~73) 240,012(967) -34,024(-137) -20, 650(-83 )1958 70,102(2C2) 65,151(262 ) 25e~09G(l,039) 252,304(1,016) -1£3,C31(-76) -1C,177(-73)1959 43,579(196) 57,470(231) 257,214(1,036) 25n,155(1,040) -1,676(-7) -11,466(-46) I
1960 53,730(216) 54,617(220) 259,152(1,044) 267,761(1,078) -13,C:92(-56} -9,566(-39) 0'
1961 61,543 (24C) 5C,49C(236) 286,917(1,156) 274,211(1,104) -13,129(-53) -14,921(-6~)VI
1.962 . 60,221(243) 715,114(315 ) 276,565(1,114) 2CC;376(1,161) -17,741(-71) -22,770(-92)1963 112,579(453) 90,002(362) 301,647(1,215) 310,931(1;252) -37,465(-151) -25,95C(-105)1964 97,207(391) 104,256(420) 354,500(1,42e~ 341,597(1,376) -22,669(-<11) -27,151(-109)1965 102,9C1(415) 125,C62(507) 36C,563(1,404 377,715(1,521) -21;320(-C6) -19,93[:(-BO)1966 177,399(714) 14g,930(600) 410,001(1,651) 392,601(1,581) -15,826(-64) -24,334(-9C)1967 166,411(670) 10C,16C(75C) 399,240(1,60G) 406,095(1,639) -35,055(-144) -37;971(~153)1968 220,693 (CCC) ) 22C ,07[:(919) 411,44.4(1,657) 425 ,567{1,711+) -62,233(-251) -60,l~C(-245)1969 297,131(1,197) 466,016 (1,G,?7) -C4,425 (-340)
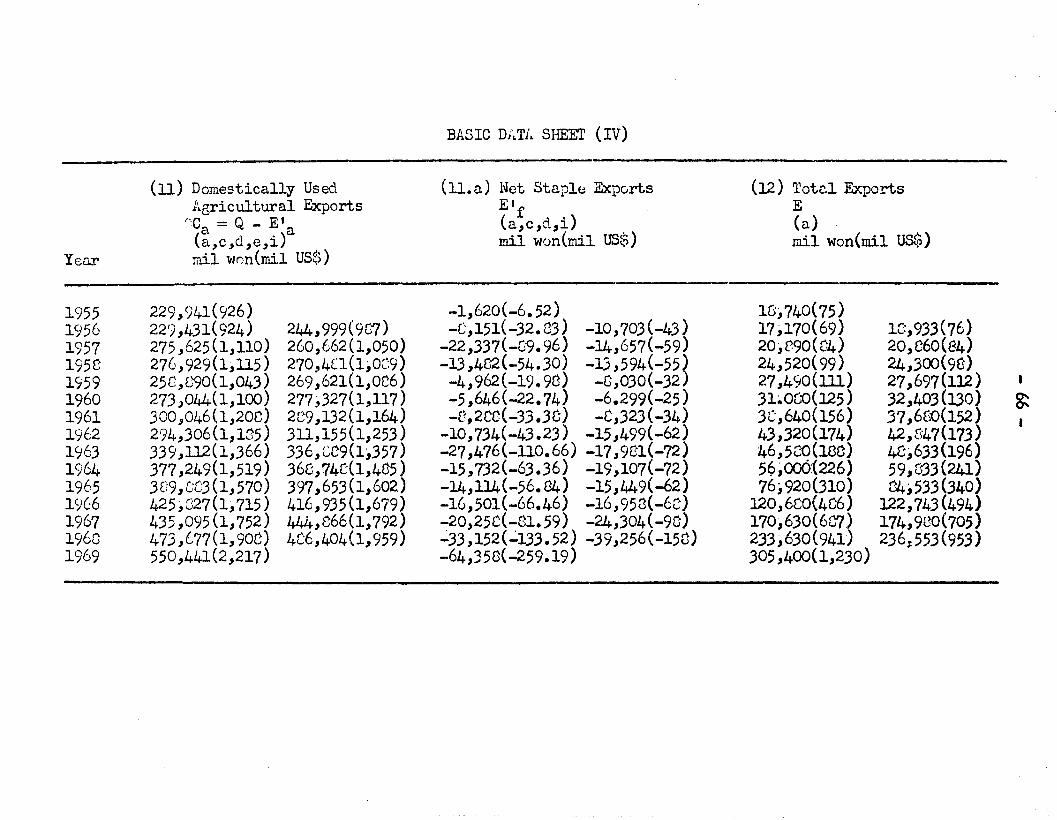
Year
(11) Domestically UsedAgricultural Exports
r':c = Q _ E'(
CL aa,c,d,e,i)
mil wnn(mil US$)
BASIC D;'LTl~ SHEET (IV)
(ll.a) Net Staple ExpertsElf(a,c,d,i)mil won(mil US$)
(12) TotCJ.1 ExportsE(a)mil won(mil US$)
195519561957195819591960196119621963196419651966196719681969
229,941(926)229 ,431(924)275,625(1,110)276,929(1,115)25C,G90(1,043)273,044(1,100)300,046(1,208)294,306(1,135 )339,112(1,366)377,249(1,519)3[;9,[;03(1,570)425:,827(1,715)435,095(1,752)473,677(1,908)550,441(2,217)
244,999(9G1)260,662(1,050)270,4Cl(1,0~;9)269,621(1,OC6)277,327(1,117)2C9,132(1,164)311,155(1,253 )336,CC9(l,357)368,74(:(1,4155 )397,653(1,602.)416,935(1,679)444,866(1,792)4C6,404(1,959)
-1,620(-6.52)-C,151(-32. (3) -10,703(-43)
-22,337(-09.96) -14,657(-59)-13,4C2(-54.30) -13,594(-55)-4,962(-19.98) -8,030(-32)-5,646(-22.74) -6.299(-25)-8,2CC(-33.3C) -C,323(-34)
-10,734(-43.23) -15,499(-62)-27,476(-110.66) -17,981(-72)-15,732(-63.36) -19,107(-72)-14,114(-56.84) -15,449(-62)-16,501(-66.46) -16,953(-6C)-20,25C(-Cl.59) -24,304(-90)~33,152(~133.52) -39,256(-15C)-64,35C(-259.19)
10,740(75)17,170(69) 1C,933(76)20,r.90(C4) 20,C60(84)24,520(99) 24,300(9C)27,490(lll) 27,697(112)31~OCV(125) 32,403(130)38,640(156) 37,650(152)43,320(174) 42,647(173)46,5C~(18C) 48,633(196)59~ooO{226) 59,833(241)76;920(310) 04,533(340)
120,6CO(4C6) 122,743(494)170:,630(607) 174,9CO(705)233,630(941) 236:553(953)305,400(1,230)
~
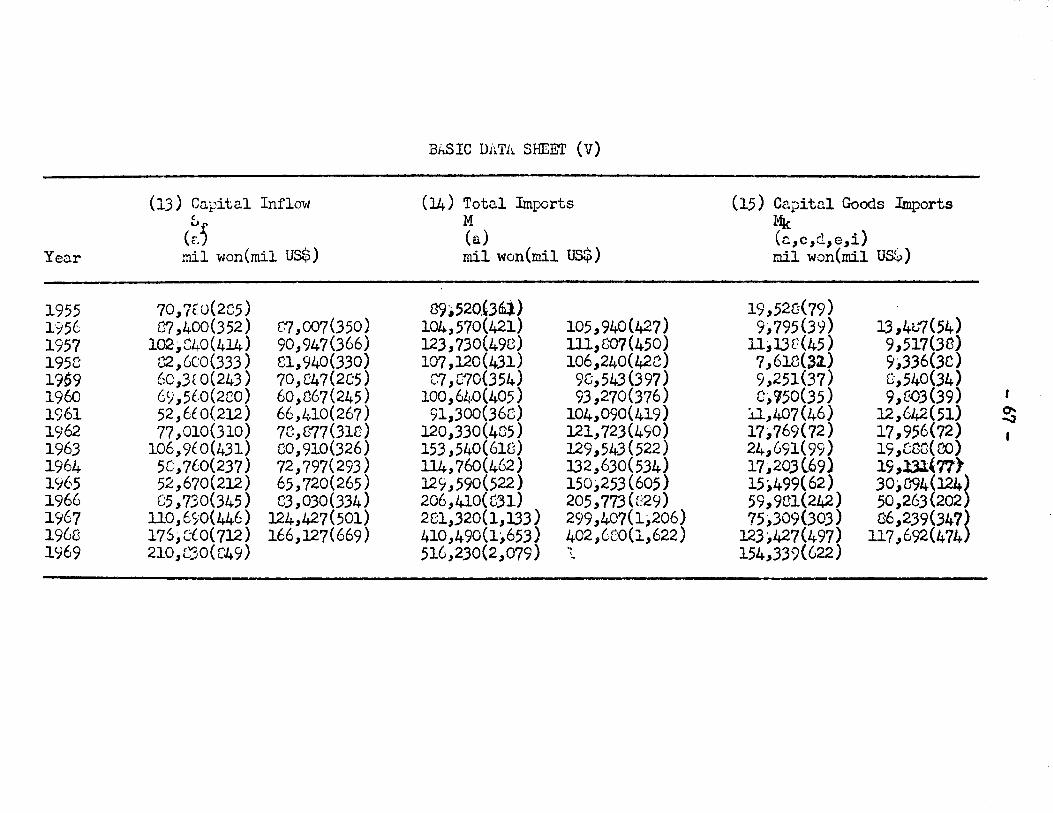
Bi~SIC DATl~ SHEET (V)
(13) C~pital Inflow (14) Total Imports (15) Capital Goods Imports5 M Mk
(r.' (a) (c.,c,d,e,i)Year mil won (mil US$) mil won(mil US$) mil won(mil uSS)
1955 70,7t:O(285) 89~520.'.361) 19,52C(79)1'156 C7,400(352) (1,007(350) 104,570(421) 105,940(427) 9,795(39) 13 ,4L'7(54)1957 102,840(414) 90,947(366) 123,730(4ge) 111,OO7(450) 1l;,13f(45) 9,517(.30)195[; O2,6CO(333 ) 81,940(330) 107,120(431) 106,240(42C) 7,618(;32) 9;,3.36(.3C)1959 60,3[ 0(243) 70,C47(2C5) C1 ,1310(354) 9[;,543(397) 9,251(37) 8,540(34)1960 (}J ,5{,0(2CO) 60,C67(245) 100;,6h.0(405) 93,270(376) C;,?50(35) 9,C~3(39) I
1961 52,6t 0(212) 66,410(267) 91,300(368) 104,090(419) :u.,407(46) 12,642.(51) 0"--..J
1962 77,010(310) 7C,877(318) 120,330(4C5) 121,723(490) 17,769(72) 17,956(72) I1963 106,9{0(431) 80,910(326) 153,540(618) 129,543(522) 24,691(99) 19,C88(00)1964 5C,7(;0(237) 72,797( 293 ) 114,760(462) :132,630(534) 17,203(69) 19,Ul'77}1965 52,670(212) 65,720(265) 129,,590(522) 150,253(605) 15,499(62) 30;'C94(124~1966 85,730(345 ) 83,030(334) 206,410( C:31) 205,773 (e29) 59,9C1(242) 50,263(2021967 110,6)0(446) 124,427(501) 281,320(1,:133) 299,407(1;,206) 75,309(303 ) C6,239(347~1968 17S;, eto(712 ) 166,127(669) 410,490(1,653) 402 /680(1,622) 123,427(497) 117,692(4741<)69 210,C30(C49) 516,230(2,079) ~ 154,339(622)'-
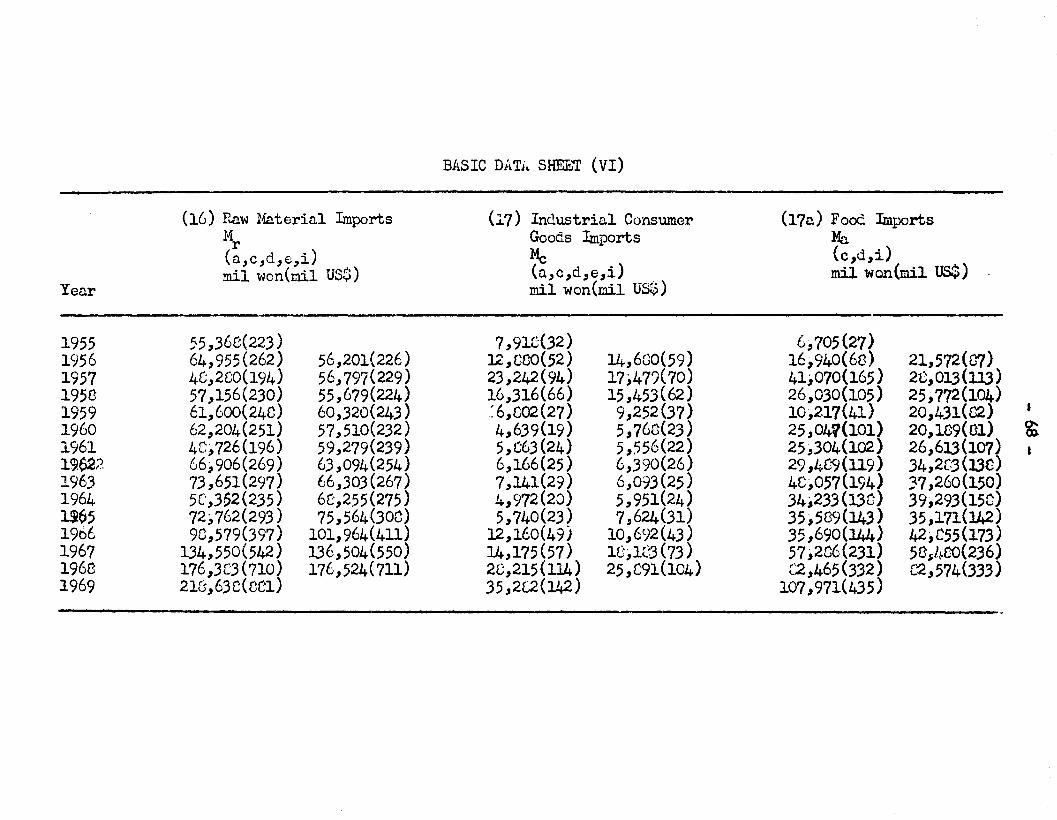
BAS IC DATi. S}{E].'T (VI)
(16) Raw Uateria1 Imports <:1.7) Industrial Consumer (170.) Food ImportsM Goods Imports MaI'(a,c,d,e,i) Me (c,d,i)mil won(mi1 US$) (o.,c,d,e,i) mil won (mi,l US$)
Yellr mil won(rni1 U8$)
1955 55,368(223 ) 7,91C(32) 6,705(27)1956 64,955(262) 56,201(226) 12,COO(52) 14,600(59) 16,940(60) 21,572(07)1957 48,280(194) 56,797(229) 23,242(94) 17,47?(70) 41;,070(165) 28,013(113)195£5 57,156(230) 55,679(224) 16,316(66) 15,453(62) 26,030(105) 25,772(104.)1959 61,600(240) 60,320(243) :6,C02(27) 9,252(37) 10,2,17(41) 20,431«(2) •1960 62,204(251) 57,510(232) 4,639(19) 5,760(23) 25,04?(101) 20,lG9(01) ~1961 4C,726(196) 59,279(239) 5,C63(24) 5,556(22) 25,304(102) 26,613(107)19.62? 66,906(269) 63,094(254) 6,166(25) 6,390(26) 29,4($(119) 34,2G3(J3C)1963 73,651(297) 66,303 (267) 7,141(29) 6,093(25) 4C,057(194) 37,260(150)1964 5(',352(235) 6[;,255(275) 4,972(20) 5,951(24) 34,233 (DC) 39,293(15C)1365 72,762(293 ) 75,564(300) 5,740(23) 7,624(31) 35,5(3<)(143 ) 35,171(:142)1966 90,579(397 ) 101,964(411) 12,160(49) 10,6<)2(43) 35,690(144) 42,C55(173)1967 134,550(542) 136,504(550) 14,175(57) 1(;,123(73) 57,2C6(231) 5f3shOO(236)1960 176,3C3 (710) 176,524(711) 28,215(114) 25,C91(104) [2,465(332) ('2,574(:333)1969 21u,63C(CC1) 35,2t2(142) 107,971(435)
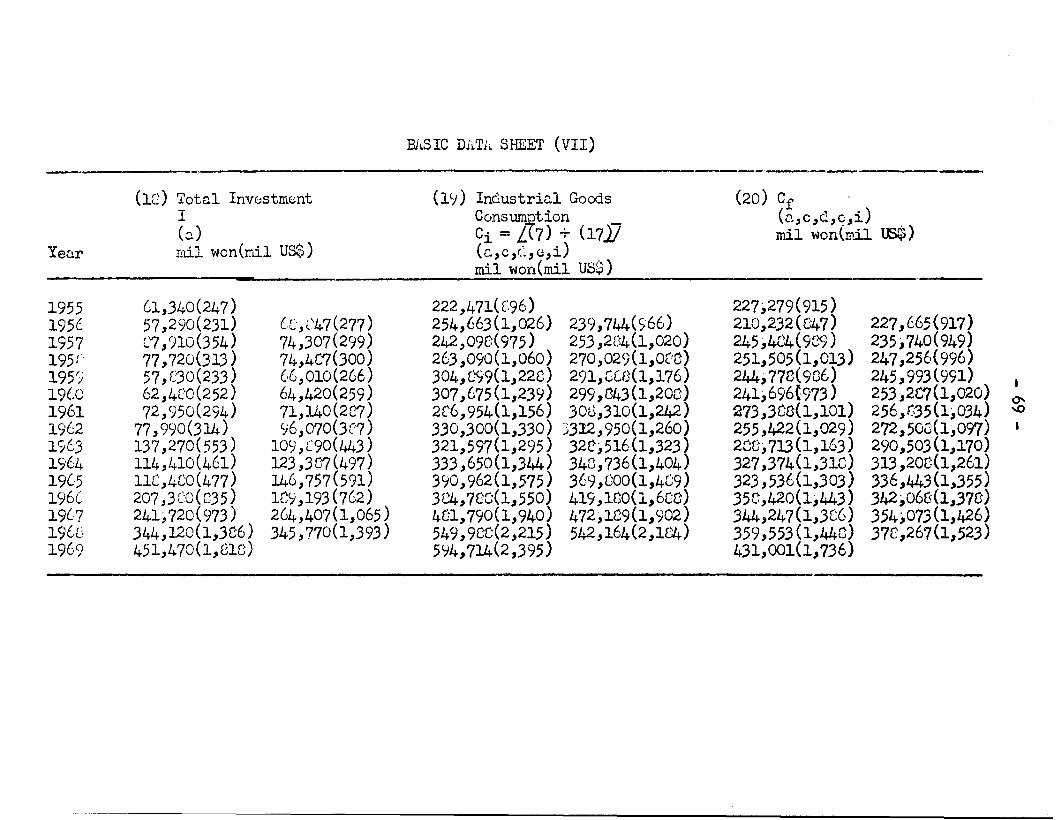
BJ\SIC DiI.T1l. SHEET (VII)
-- --,------------------------, --------------
YeD.r
(Ie) Tote1 Inv8stmentIC~.)mil won(r.ti1 US$)
(1~) Industri~l GoodsCons~.Jftion
Ci = L~7) + (17)](c.,c ,(~, e,i)mil won(mil US$)
(20) Cf .(c.,c,c.,c,i)mil won(Illil lB$)
1955195c1957195('195()196019611962196319641905196C19(.719[·01969
61,340(247)57,290(231)C:7,910(354)77,720(313 )57,C30(233)62,4CO(252)72,950(294)
77,990(314)137,270( 553)114,410(461)11C,480(477)207,3C:0(C35)241,720(973)344,120(1,3C6)451,470(1,818)
Gc.:,C47(277)74,307(299)74,4C7(300)(,6,010(266)64,420(259)71,140(2[;'7 )16,070(3('7)
109,[90(443)123 ,3C7 (497)146,757(591)1[;'),193(762)264,407(1,065)345,770(1,393 )
222,471(C96)254,663 (1,026) 23(;1,744(,66)242,09(;(975) 253,2e4(1,020)263,090(1,060) 270,02<;(1,0(0)304,C99(1,22C) 291,CGD(1,176)307,675(1,239) 299,843(1,208)2C6,954(1,156) 30u,310(1,242)330,300(1,330) 3312,950(1,260)321,597(1,295) 32C,516(l,323)333,650(1,344) 343,736(1,404)390,962(1,575) 369,GOO(1,409)3C4,7CC(1,550) 419,lnO(1,6CC)401,790(1,940) 472,lC9(1,902)549,98C(2,215) 542,164(2,184)5lJ4,714(2,395)
227,279(915)210,232(847)245,4C4(9C9)251,505(1,013)244,77C(906)241,696{973 )273,3CC(l,101)255,422(1,029)2(;C,713 (1,163)327,374(1,31C)323,536(1,303)35C,420(l,443)344,247(1,3C6)359,553 (l,44C)431,001(1,736)
227,665(917)235,740(949)247,256(996)245,993 (991) I
253,2C7(1,020) 0"
256,(-35(1,034) -.0
272,500(1,097) I
290,503(1,170)313,20C(1,261)336,443(1,355)342,068(1,37C)354,073(1,426)378,267(1,523)
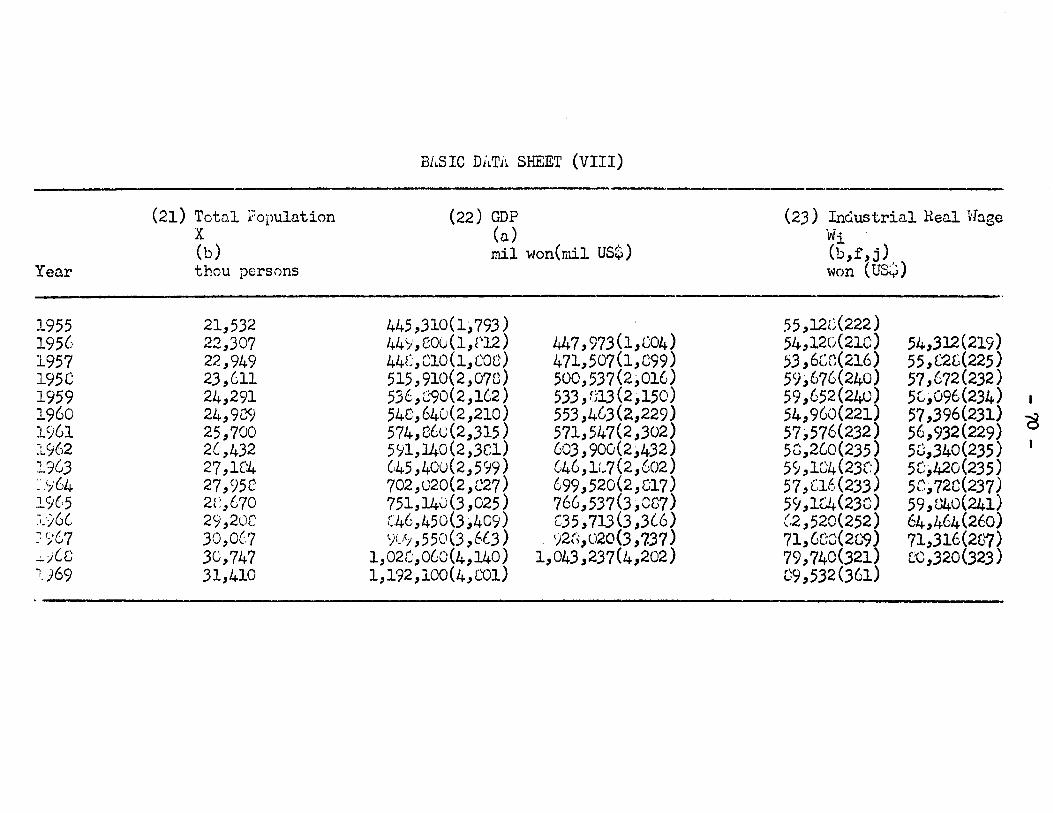
Bil.SIC DiLTA SHEET (VIII)--
(21) Totn1 Population (22) GDP (23) Inclustri<ll Real vbgeX (D.) Wi(b) mil won(mil US$) (b,f,j)
Year thou pers0ns won (US~)
.-1955 21,532 445,310(1,793 ) 55,12(:(222 )1956 22,307 h4'-),C00(1,e12) 447,973(1,£,:;04) 54,12CJ(21C) 54,312(219)1957 22,949 44C,C10(1,COC) 471,507(1,C99) 53,6Ce(216) 55,C2G(225)195C 23,611 515,910(2,070) 500,537(2;,016) 59,676(240) 57,672(232)1959 24,291 536,:':90(2,162) 533, (;13 (2,150) 59,652(240) 5[,,096(234)1960 24,989 548,640(2,210) 553,463(2,229) 54,960(221) 57,396(231)
~1961 25,700 574,C6c(2,315) 571,547(2,302) 57,576(232) 56,932(229)1962 2(,432 5<)1,140(2,3(;1) 603,900(2,432 ) 58,2GO(235) 50,340(235)1963 27,1[:4 (,45,40()(2,599) ('46,11.:7 (2, (;()2) 51,1C4(23[':) 5[';,420(235)~'')G4 27,950 702,020(2,C27) 699,520(2,017) 57,£:,16(233) 5[;,72C(237)19(j 2(:,670 751,140(3,025) 766,537(3 ,Cr..:q) 59,1C4(23C) 59,040(241)~ ..)6G 29,20C C46,450(3,409) C35, 71.3 (3 ,3(6) (.2,520(252) 64,464(260)-::967 30,0(,7 '-)t}; ,550(3,6(.3) . 1)2[;,020(3,7.37) 71, 6CC(2L'9) 71,316(2C7)
Gr\ 30,747 1,02(;,060(4,140) 1,043,237(4,202) 79,740(321) DC,320(323)..:..J u1.')69 31,410 1,192,100(4,G~1) C9,532(361)
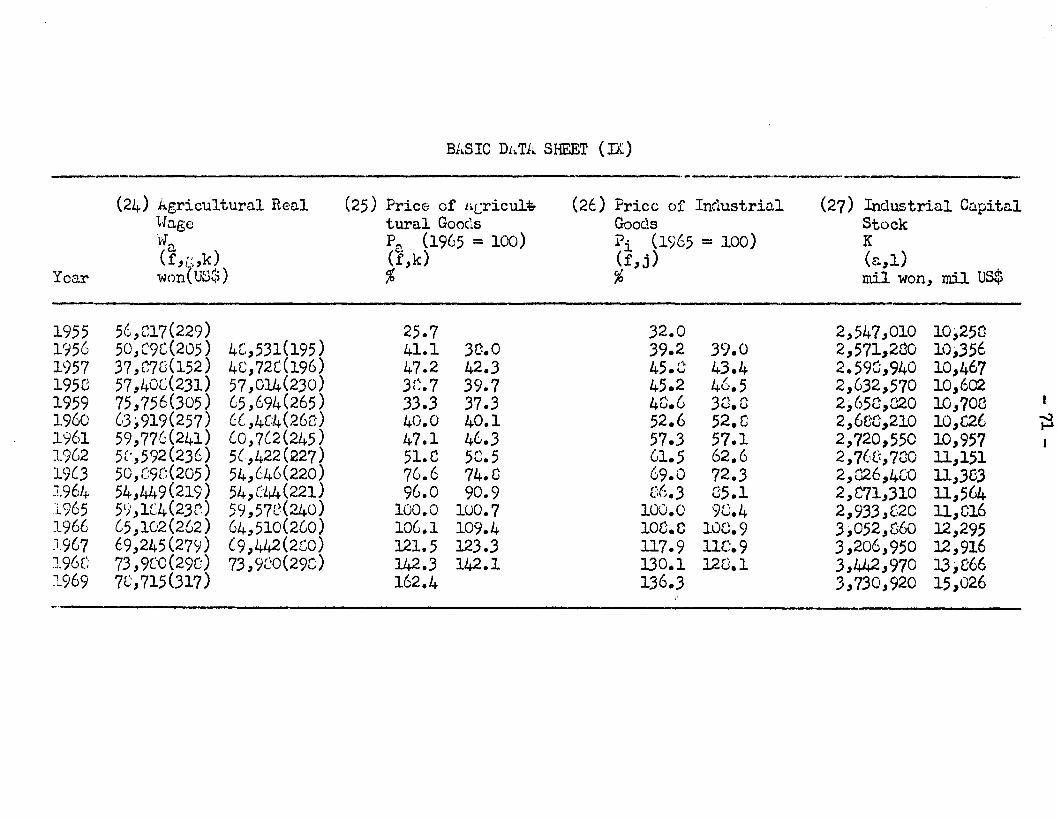
Bl~SIC DJ.Tk SHEET (n)
._._--------(24) Agricultural Real (25) Price of Ji.cricultr (26) Price of Industria.l (27) Industrial Ca.pita1
HOoge tura1 Goods Goods Stock·v{ Fa (1965 = 100) Pi (1965 = 100) K(l
(~,1)(f,[:;,k) (f,k) (f,j)Year w()n{US~) % % mil won, mil uS$
- -1955 56,(;17(229) 25.7 32.0 2,547,010 10,2501956 50,C9C(205) 4C,531(195) 41.1 3e.O 39.2 39.0 2,571,200 10;,3561957 37,878(152) 48,72(196) 47.2 42.3 45.8 43.4 2.59C,940 10,4671958 57,40C(231) 57,014(230) 3:~. 7 39.7 45.2 46.5 2,632,570 10,6021959 75,756(305 ) G5,694(265) 33.3 37.3 40.6 3"~ r~ 2,650,020 10,70(3u.u1960 63,919(257) U, ,4(:4(26e) 40.0 40.1 52.6 52.0 2,6CC,210 10,C26 ~1961 59,776(241) GO,7(,2(245) 47.1 4(".3 57.3 57.1 2,720,550 10,9571962 5[',592(236) 5(,422 (227) 51.C 5C.5 61.5 62.6 2,7Ge,7CO 11,15119(3 50,[;9[;(205) 54,646(220) 76.6 74.0 69.0 72.3 2,026,4GO 11,3£53J.96/+ 54,449(219) 54,Ui-4(221) 96.0 90.9 r'{ 3 05.1 2,C71,310 11,5(J4(.l Je
.~L965 59,lC4(23r) 59,57e(240) 100.0 100.7 lOu.0 9C.4 2,933,£:.20 11,0161966 65,102(262) 64,510(260) 10G.l 109.4 10C.C 108.9 3;,052,860 12,295J967 69,245(279) (9,442(2CO) 121.5 123.3 117.9 l1C.9 3,206,950 12,916J.96C 73,9("0(290) 73,9[:0(290) 142.3 142.1 130.1 120.1 3,442,970 13;,[;661969 78,715(317) 162.4 136.3 3,730,920 15,026
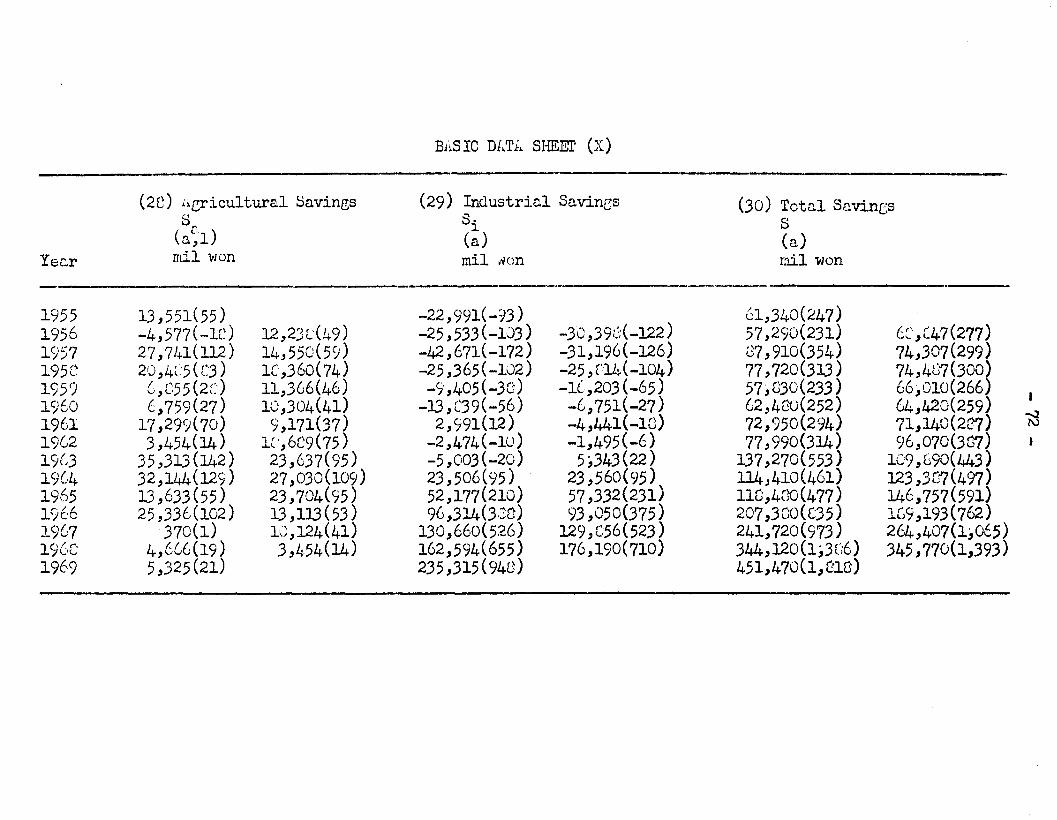
Bi~SIC DI.T;. SHEEr (X)- --
(2e) 1l.gricu1tura1 ~avings (29) Industrial Savines (30) Total SavinGsS s· S(n~'l)
J.(a) (a)
Ye<:r mil won mil .-Ion mil won--_.__._.
1955 13,551(55 ) -22,991( -13) 61,340(247)1956 -4,577(-lC) 12,232(49) -25,533 (-103 ) -30,39C;(-122) 57,290(231) 6C,t47(277)1957 27,71+1(112) 14,55C(59) -42,671(-172) -31,196(-126) 27,910(354) 74,307(299)1958 20 ,4~5(r3) 1[,360(74) -25 ,365( -102) -25 ,C'1L~(-104) 77,720(313 ) 74,4G1(300)1959 G,[':55 (2C) 11,366(46) -9,405(-38) -1(,203(-65) 57,[530(233) 66,010(266) I
1960 6,759(27) 10,304(41) -13 ,::.'39(-56) -6,751(-27) 62,400(252) 64,420(259) -'l
1961 17,299(70) 9,171(37) 2,991(12) -4,441(-10) 72,950(294) 71,140(287) N1962 3,454(14) 1C,6C9(75) -2,474(-lU) -1,495(-6) 77,990(314) 96,070(3G7) I
1963 35,313 (142) 23,637(95) -5,003(-20) 5;,343(22) 137,270(553) 109,G90(443)19U~ 32,144(129) 27,030(109) 23,506(95) , 23,560(95) 114,410(461) 123,3e7(497)1965 13,633(55) 23,704(95) 52,177(210) 57,332(231) 11C,4nO(477) 146,757(591)1""' 16 25,336(102) 13,113(53) 96,314(J,3C) 93,050(375) 207,3eo(e35) 1G9,193(762)')0
1967 370(1) 1(),124(41) 130,660(526) 129,C56(523) 241,720(973) 264,407(1;,065)19(.[; 4,66G(19) 3,454(14) 162,594(655) 176,190(710) 344,120(1;3(;6) 345,770(1,393)1969 5,325(21) 235 ,315(94e) 451,470(1,(;18)
e)
- 73 -
SOURCES:
a) National InCOI!le Statistical Yearbook 1968, 1969(The Bank of Korea)
b) Korea Statistical Yearbook 1960-69(li'.,conor.dc Planning Board, Republic of Korea)
c) Annual Economic Revi~w 1955-59(The &'lnk of Korea)
d) Economic Statistical YeM"book 1960-?1(The Bank of Korea)
Inter-Industry Relations Tables 1960, 1963, 1966, 1968(The Bank of Korea)
f) Price Statistical Summary 1961, 1964, 1966, 196a(The Bank of Korea)
g) Yearbook of A· iculture and Forestr 1964, 1968, 1969Uinistry of Agriculture and Forestry, Republic of Korea)
h)
i)
j) Ii. icultural Coo erative lfonthl SurveNational f"gricultural Cooperative Fe~leration, Korea)
k) r.;stirnates of Korean ea ital and Inventory C08fficients in 1 68by Kee Chun Han, Yonsei University
1) Behavior in Korea, 1970
- 74 -
Bibliogrll.p&
John C. H. Fei and Gustav Itnnis, Development of the labor, SurplusEconcm.y: Theory and Policy, Richard D. Irwin, 19{,4.
John C. H. Fei nnd Gustav Rnnis,IIInnovation, Capital llccumulationand Economic Development, II iiDlerican Economi.£ Review, June 19{3.
John C. H. Fei and Gustav I(D.nis, uEconomic Development inHistorical Perspective,1I i.moric,an Economic R,eview, Nay 1969.•
John C. H. Fei and Gustav kanis, IIGrowth and &1ployment in theOpen Dualistic Economy," a paper prcsE:nteti to the Conference on&npower Problems in East and Southeast i1sia, Singapore, lfuy, 1Ci71.
John C. H. Fei and Gustav Ranis, uJ1 model of Growth and Employmentin the Open Dualistic Econoll\V: The Cases of Korea and Taiwan, IIJune, 1972, Economic Grm'lth Center Discussi':m Paper, Yale University.
hrthur !£wis, IIEconomic Development with Unlimited Supplies of ~ccr,II
ltJanchester School of Economics and Social Studies, Vol. 22, lfuy,1954.
Charles F. Kindle~'(;rt:er, Europe IS PQstliar Grm'1th: Tho Hole of LaborSupply, Hnrvnrd University Press, 19G7.
Simon Kuznets, Ncdern Economic Gri?!'1th: Hate, Structure c:nd Spread,Net., Haven, Yale University Press, 19(,(.
Gustav Ranis, liThe Role of the IlY":ustri~l Sector in Korea's Transition to Economic l1aturity," a paper presented to the ILCCUKConference on Industrialization in Korea, 1971.