THIS REPORT CONTAINS ASSESSMENTS OF COMMODITY AND TRADE ISSUES MADE BY
USDA STAFF AND NOT NECESSARILY STATEMENTS OF OFFICIAL U.S. GOVERNMENT
POLICY
-
Date:
GAIN Report Number:
Post:
Report Categories:
Approved By:
Prepared By:
Report Highlights:
Korean imports of seafood in 2016 totaled $4.5 billion, up 6.2 percent from 2015 due to rising
prices. Imports of American seafood decreased by 2.6 percent from $233 million to $227 million
making United States the fifth largest exporter with a market share of 5.1 percent. U.S. seafood is
generally considered high quality and safe, but less price competitive when competing with other
origins. By volume, frozen Alaska Pollack Surimi, Flatfish, Alaska Pollack Fish, Cod, Alaska Pollack
roe, Monkfish, Hagfish, Ray, Atka Mackerel, and live Lobsters were the major seafood imported
from the United States. By value, frozen Alaska Pollack Surimi, live Lobsters, Cod, Flatfish, Alaska
Pollack Fish, Monkfish, live Hagfish, frozen Skate, Alaska Pollack roe, and frozen Hagfish were the
top ten imported species.
Sun Young Yoo, Market Promotions Specialist
Lynne Larrabee, Director, ATO
Fishery Products
Seafood Market Brief Update 2017
Seoul ATO
Korea - Republic of
KS1726
9/22/2017
Public Voluntary

General Information:
SECTION I: KOREAN SEAFOOD MARKET OVERVIEW
In 2016, Korea’s seafood imports from all origins amounted to $4.5 billion , up 6.2 percent
from $4.24 billion in 2015. The United States was the fifth largest supplier of seafood products to
Korea giving its fourth largest exporter rank to Norway. The largest seafood supplying country in
2016 was China at $1.2 billion, followed by Russia at $698 million, Vietnam at $615 million,
Norway at $299 million, USA at $227 million, Thailand at $147 million, Japan at $142 million,
Hong Kong at $100, Taiwan at $100 million and Peru at $89 million. These ten countries
accounted for 80 percent of Korea’s total seafood imports in 2016. The most popular seafood
imported in volume was Alaska Pollack Fish, followed by Alaska Pollack Surimi, Sand Lance, Squid,
Mackerel, Saury, Poulp Squid, Baby Clam, Yellow Corbina, frozen Flatfish, Hair Tail, Monkfish, and
Webfoot Octopus. By value, the most popular seafood was Shrimp & Prawn, followed by Alaska
Pollack Fish, other fish Surimi, frozen/live Poulp Squid, Atlantic Salmon, live King Crab, frozen Hair
Tail, frozen Yellow Corbina, frozen Webfoot Octopus, live Glass Eel for aquaculture, live Snow
Crab, dried Alaska Pollack, frozen Squid, and live Lobsters.
Korea imported $227 million of U.S. seafood in 2016 , down 2.1 percent from $233 million in
2015, but market share remained relatively steady at 5.1 percent. In Korea, U.S. seafood,
including aquaculture, is generally considered high quality, but higher in price compared to that of
competing countries. Until 2011 the United States had been the fifth largest exporter of seafood
to the Korean market following China, Russia, Vietnam and Japan, but in 2012 the United States
became the fourth largest due to Korean consumers’ concern for Japanese seafood products after
the nuclear power plant accident in Fukushima. However in 2016, Norway increased sales
performance of its seafood products drastically and is now the fourth.
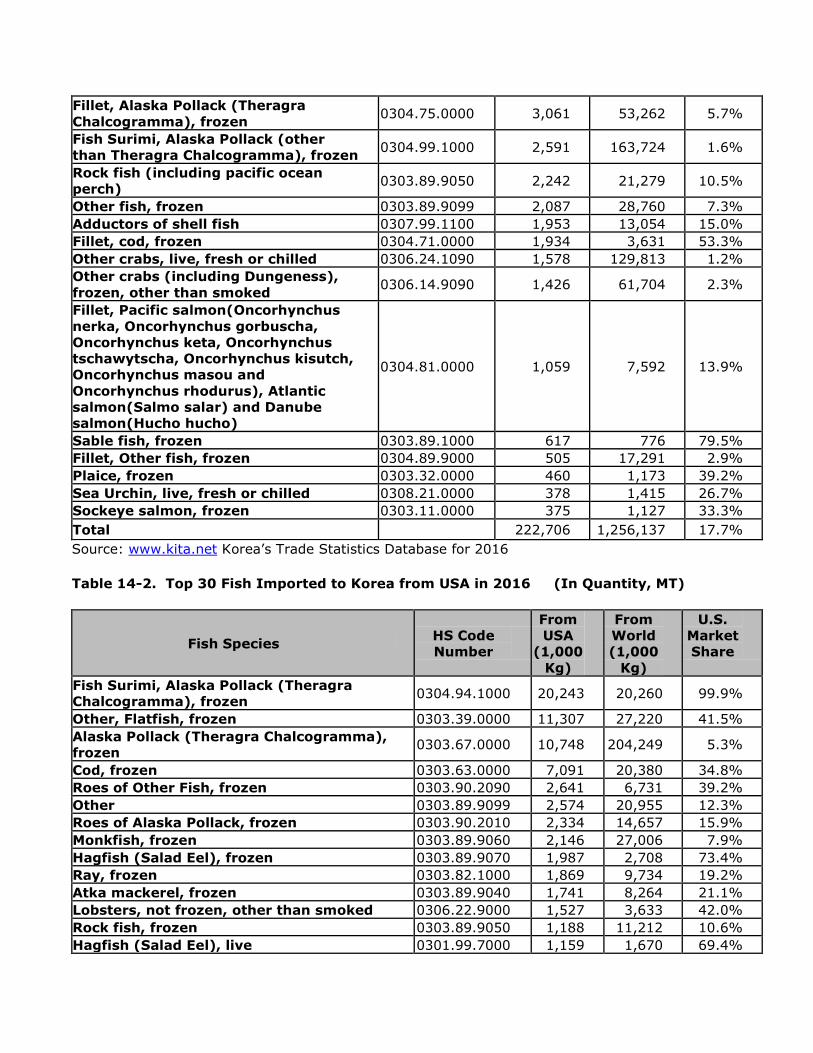
The top ten seafood products that Korea imported in large quantities from the United States were
frozen Alaska Pollack Surimi (20,243 MT), flatfish (11,307 MT), Alaska Pollack (10,748 MT), roes
of Alaska Pollack and other fish (7,549 MT), cod (7,091 MT), monkfish (2,146 MT), hagfish (1,987
MT), ray (1,869 MT), Atka Mackerel (1,741 MT), and live lobster (1,527 MT).
By value, Alaska Pollack Surimi ($56.6 million), live lobster ($30.3 million), cod ($19.5 million),
flatfish ($17.8 million), Alaska Pollack ($13.8 million), monkfish ($11 million), live hagfish ($10.3
million), skate ($6.6 million), Alaska Pollack roe ($6.4 million), and frozen hagfish ($6.3 million)
were the ten most leading seafood products exported from United States to Korea.
Table 12-1 of Section V below shows the major species exported to Korea from the United States
and the world by value. Imports of 30 fish species accounted for 98 percent of the total imports of
fishery products from the United States in 2016.
Until 2000, Korea was a net exporter of seafood. However, growing domestic demand and limited
supplies reversed the situation. In 2016, Korea exported $1.64 billion of seafood and imported
about $2.86 billion more than it exported. Imports are expected to continue to outpace exports
ensuring that Korea will remain an important market for U.S. seafood suppliers.
SECTION II: KORUS FTA AND CUSTOMS DUTY
KORUS FTA With respect to the seafood sector, the KORUS FTA is expected to create more opportunities for
U.S. seafood exporters. Customs duties for fishery products imported from the United States were
cut to zero immediately, or phased out over the course of 3 to 10 years. For instance, the
customs duty for frozen Sockeye Salmon was cut to zero immediately, but duties for U.S. trout
and sea bass were reduced to zero in 3 and 10 years, respectively. The customs duty elimination
is prorated equally every year over the phase-out period.
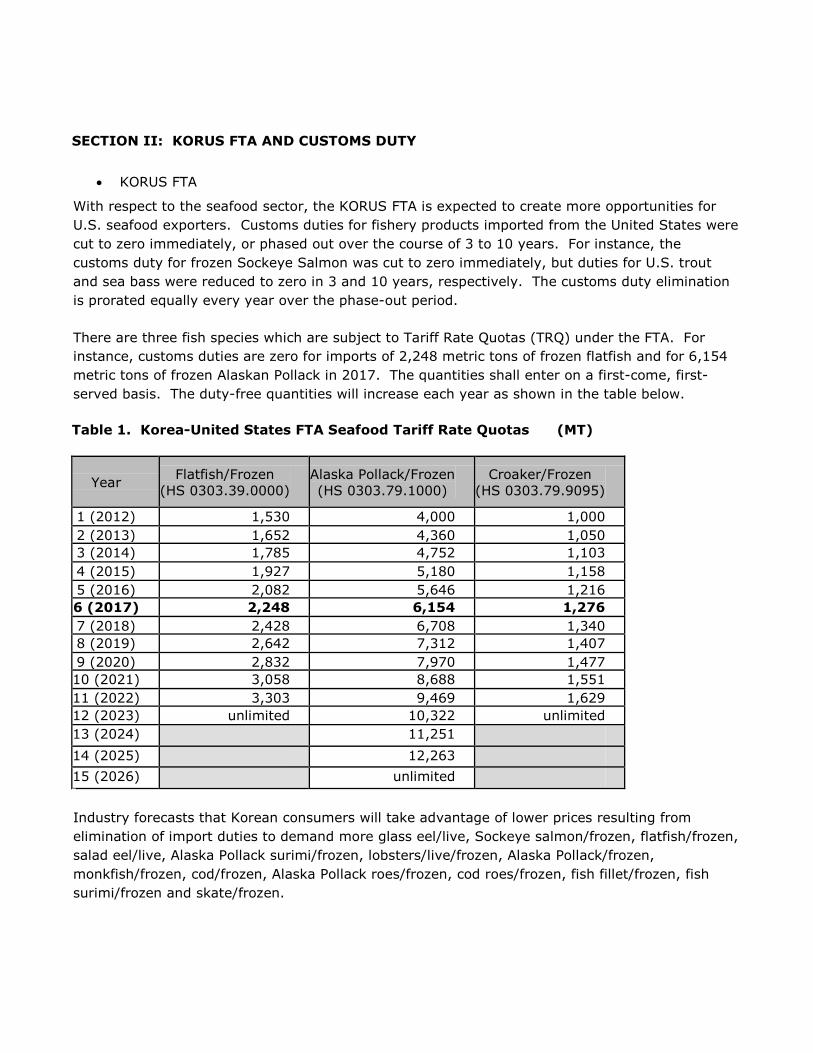
There are three fish species which are subject to Tariff Rate Quotas (TRQ) under the FTA. For
instance, customs duties are zero for imports of 2,248 metric tons of frozen flatfish and for 6,154
metric tons of frozen Alaskan Pollack in 2017. The quantities shall enter on a first-come, first-
served basis. The duty-free quantities will increase each year as shown in the table below.
Table 1. Korea-United States FTA Seafood Tariff Rate Quotas (MT)
Year Flatfish/Frozen
(HS 0303.39.0000) Alaska Pollack/Frozen (HS 0303.79.1000)
Croaker/Frozen (HS 0303.79.9095)
1 (2012) 1,530 4,000 1,000 2 (2013) 1,652 4,360 1,050 3 (2014) 1,785 4,752 1,103 4 (2015) 1,927 5,180 1,158 5 (2016) 2,082 5,646 1,216 6 (2017) 2,248 6,154 1,276 7 (2018) 2,428 6,708 1,340 8 (2019) 2,642 7,312 1,407 9 (2020) 2,832 7,970 1,477 10 (2021) 3,058 8,688 1,551 11 (2022) 3,303 9,469 1,629 12 (2023) unlimited 10,322 unlimited 13 (2024) 11,251 14 (2025) 12,263 15 (2026) unlimited
Industry forecasts that Korean consumers will take advantage of lower prices resulting from
elimination of import duties to demand more glass eel/live, Sockeye salmon/frozen, flatfish/frozen,
salad eel/live, Alaska Pollack surimi/frozen, lobsters/live/frozen, Alaska Pollack/frozen,
monkfish/frozen, cod/frozen, Alaska Pollack roes/frozen, cod roes/frozen, fish fillet/frozen, fish
surimi/frozen and skate/frozen.

For more detailed information about the results of the KORUS FTA including the tariff schedule for
Korea, please visit: KORUS FTA Official Homepage in English and ATO Seoul Homepage FTA
Section. Table 2. Korean Tariff Schedule for Major U.S. Fishery Products Sold to Korea
Description H.S. Code 2012
Base
Rate
2017 KOR-US
FTA Rate
Zero-
Duty
Year
Fish Surimi, Alaska Pollack, frozen 0304.94.1000 0304.99.1000
10% 0% 2014
Other, Flatfish, frozen 0303.39.0000 10%
0% (TRQ 2,248
MT) 2023 10%
(Above TRQ) Monkfish, frozen 0303.89.9060 10% 6.9% 2021 Roes of Alaska Pollack, frozen 0303.90.2010 10% 0% 2016 Skate, frozen* 0303.82.2000 10% 10% 2021 Hagfish (Salad Eel), live 0301.99.7000 10% 0% 2014 Cod, frozen 0303.63.0000 10% 0% 2016 Glass eel, live 0301.92.1000 0% 0% 2012
Alaska Pollack, frozen 0303.67.0000 0303.69.9000
10%
0% (TRQ 6,154
MT) 2026 10%
(Above TRQ) Hagfish (Salad Eel), frozen 0303.89.9070 10% 5% 2021 Roes of other fish, frozen 0303.90.2090 10% 0% 2016 Atka mackerel, frozen 0303.89.9040 10% 5% 2021 Fillet, Alaska Pollack, frozen 0304.75.0000 10% 6.9% 2021 Rock fish, frozen 0303.89.9050 10% 6.9% 2021 Ray, frozen 0303.82.1000 10% 6.9% 2021 Sockeye salmon, frozen 0303.11.0000 10% 0% 2012 Fillet, Plaice, frozen 0304.83.1000 10% 6.9% 2021 Sardines, frozen 0303.53.0000 10% 0% 2016 Sable fish, frozen 0303.89.1000 10% 0% 2016 Adductors of shell fish, frozen 0307.99.1100 20% 13.8% 2021
Lobsters, other than smoked 0306.12.9000 0306.22.9000
20% 0% 2016
Squid, frozen 0307.49.1020 10% 10% 2021 Anchovy, dried 0305.59.2000 20% 10% 2021 Fillet, Others, frozen 0304.89.9000 10% 0% 2014 Oyster, frozen 0307.19.1000 20% 0% 2012 Fish Surimi, the families Bregmacerotidae,
Euclichthyidae, Gadidae, Macrouridae, other
than Alaska Pollack, frozen 0304.95.1000 10% 0% 2016
Other Crabs, frozen, other than smoked
(Dungeness Crab) 0306.14.9090 14% 0% 2014
Other Crabs, frozen, other than smoked 14% 9.6% 2021 Fillet, cod, frozen 0304.71.0000 10% 5% 2021
Plaice, frozen 0303.32.0000 10% 6.9% 2021 Other baby eels, live 0301.92.9010 10% 0% 2012 Source: Korea Customs and Trade Development Institute, Import/Export Customs Clearance
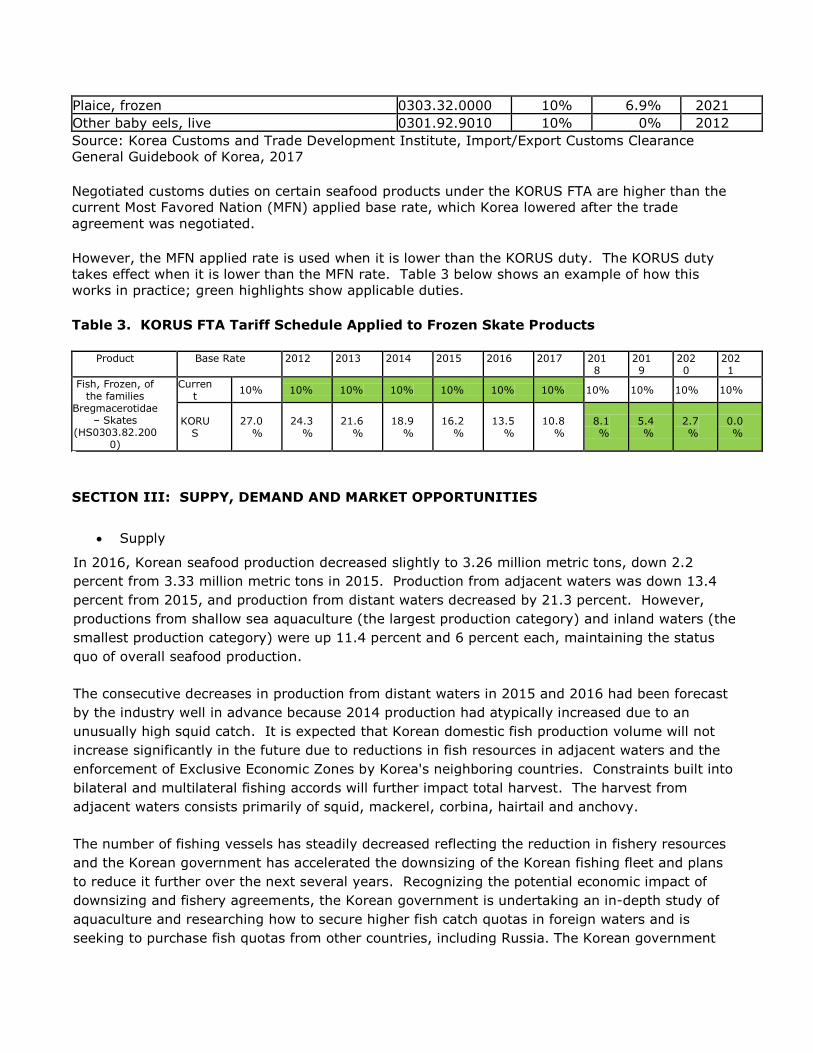
General Guidebook of Korea, 2017 Negotiated customs duties on certain seafood products under the KORUS FTA are higher than the
current Most Favored Nation (MFN) applied base rate, which Korea lowered after the trade
agreement was negotiated. However, the MFN applied rate is used when it is lower than the KORUS duty. The KORUS duty
takes effect when it is lower than the MFN rate. Table 3 below shows an example of how this
works in practice; green highlights show applicable duties. Table 3. KORUS FTA Tariff Schedule Applied to Frozen Skate Products
Product Base Rate 2012 2013 2014 2015 2016 2017 2018
2019
2020
2021
Fish, Frozen, of the families
Bregmacerotidae – Skates
(HS0303.82.2000)
Current 10% 10% 10% 10% 10% 10% 10% 10% 10% 10% 10%
KORUS
27.0%
24.3%
21.6%
18.9%
16.2%
13.5%
10.8%
8.1%
5.4%
2.7%
0.0%
SECTION III: SUPPY, DEMAND AND MARKET OPPORTUNITIES
Supply In 2016, Korean seafood production decreased slightly to 3.26 million metric tons, down 2.2
percent from 3.33 million metric tons in 2015. Production from adjacent waters was down 13.4
percent from 2015, and production from distant waters decreased by 21.3 percent. However,
productions from shallow sea aquaculture (the largest production category) and inland waters (the
smallest production category) were up 11.4 percent and 6 percent each, maintaining the status
quo of overall seafood production.
The consecutive decreases in production from distant waters in 2015 and 2016 had been forecast
by the industry well in advance because 2014 production had atypically increased due to an
unusually high squid catch. It is expected that Korean domestic fish production volume will not
increase significantly in the future due to reductions in fish resources in adjacent waters and the
enforcement of Exclusive Economic Zones by Korea's neighboring countries. Constraints built into
bilateral and multilateral fishing accords will further impact total harvest. The harvest from
adjacent waters consists primarily of squid, mackerel, corbina, hairtail and anchovy.
The number of fishing vessels has steadily decreased reflecting the reduction in fishery resources
and the Korean government has accelerated the downsizing of the Korean fishing fleet and plans
to reduce it further over the next several years. Recognizing the potential economic impact of
downsizing and fishery agreements, the Korean government is undertaking an in-depth study of
aquaculture and researching how to secure higher fish catch quotas in foreign waters and is
seeking to purchase fish quotas from other countries, including Russia. The Korean government
efforts to boost aquaculture production in shallow sea areas clearly indicate the importance of this
sector as a future seafood resource.
Moreover, as seafood export opportunities with China, the EU and Japan grow, the Korean
government’s focus on shallow sea aquaculture is expected to continue in order to achieve plans to
reach annual seafood exports of $10 billion by the year 2020.
To insulate select domestic seafood producers from imported products (mainly from China), the
Korean government has set higher “adjustment tariffs” ranging from 22 to 50 percent for nine fish
species which are not subject to tariff bindings under WTO agreements. Prior to implementation of
the adjustment tariffs, imports of these nine species were subject to tariffs ranging from 10 to 20
percent. However, the Korea-China FTA implemented as of December 20, 2015, started to give
rise to the surge of price-competitive and good quality Chinese seafood into the Korean market.
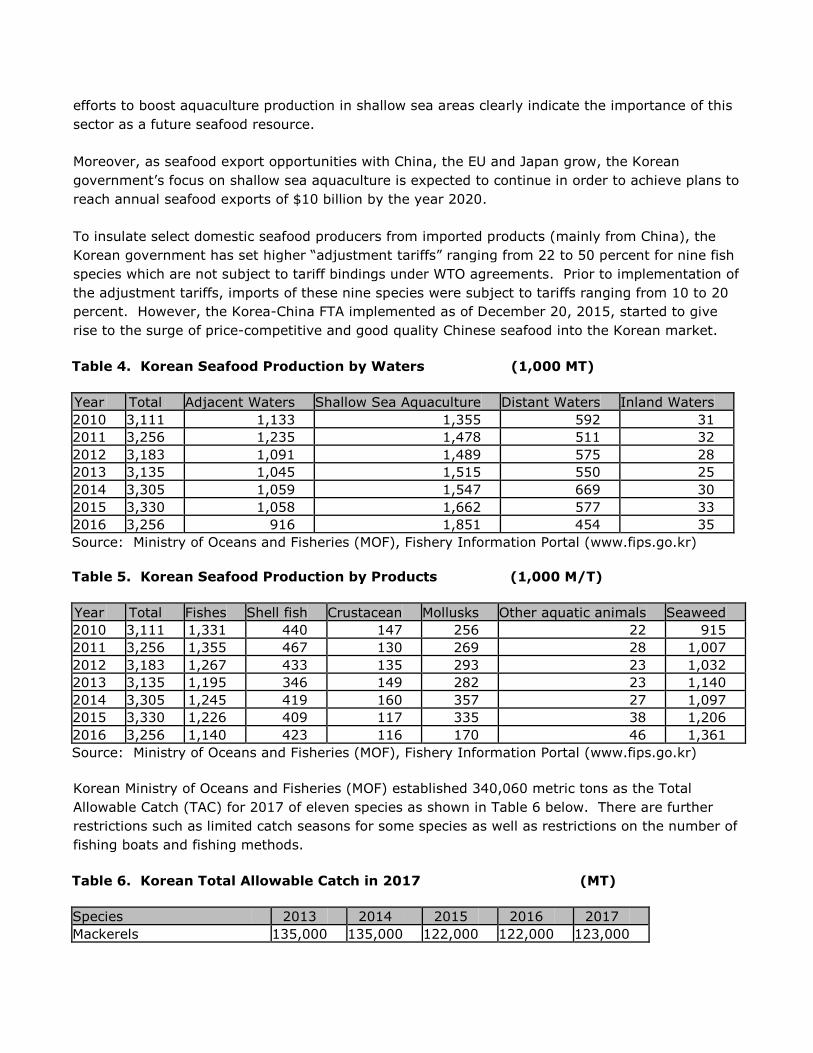
Table 4. Korean Seafood Production by Waters (1,000 MT)
Year Total Adjacent Waters Shallow Sea Aquaculture Distant Waters Inland Waters 2010 3,111 1,133 1,355 592 31 2011 3,256 1,235 1,478 511 32 2012 3,183 1,091 1,489 575 28 2013 3,135 1,045 1,515 550 25 2014 3,305 1,059 1,547 669 30 2015 3,330 1,058 1,662 577 33 2016 3,256 916 1,851 454 35 Source: Ministry of Oceans and Fisheries (MOF), Fishery Information Portal (www.fips.go.kr) Table 5. Korean Seafood Production by Products (1,000 M/T)
Year Total Fishes Shell fish Crustacean Mollusks Other aquatic animals Seaweed 2010 3,111 1,331 440 147 256 22 915 2011 3,256 1,355 467 130 269 28 1,007 2012 3,183 1,267 433 135 293 23 1,032 2013 3,135 1,195 346 149 282 23 1,140 2014 3,305 1,245 419 160 357 27 1,097 2015 3,330 1,226 409 117 335 38 1,206 2016 3,256 1,140 423 116 170 46 1,361 Source: Ministry of Oceans and Fisheries (MOF), Fishery Information Portal (www.fips.go.kr)
Korean Ministry of Oceans and Fisheries (MOF) established 340,060 metric tons as the Total
Allowable Catch (TAC) for 2017 of eleven species as shown in Table 6 below. There are further
restrictions such as limited catch seasons for some species as well as restrictions on the number of
fishing boats and fishing methods.
Table 6. Korean Total Allowable Catch in 2017 (MT)
Species 2013 2014 2015 2016 2017 Mackerels 135,000 135,000 122,000 122,000 123,000
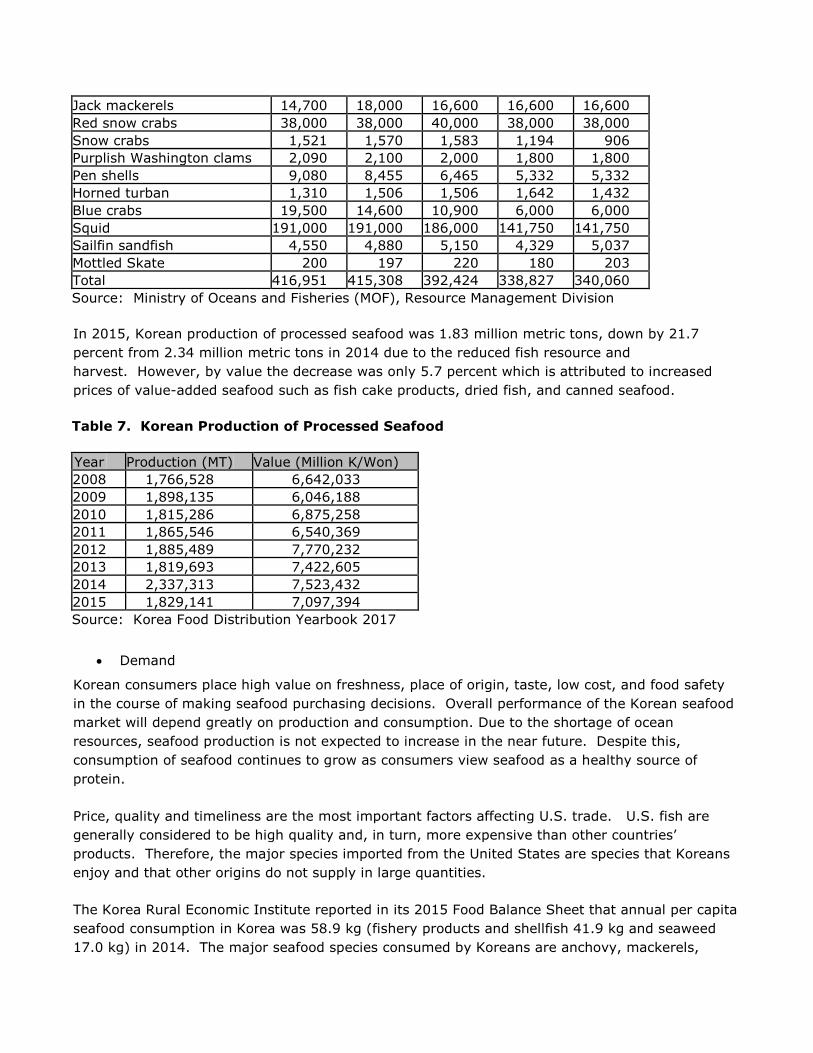
Jack mackerels 14,700 18,000 16,600 16,600 16,600 Red snow crabs 38,000 38,000 40,000 38,000 38,000 Snow crabs 1,521 1,570 1,583 1,194 906 Purplish Washington clams 2,090 2,100 2,000 1,800 1,800 Pen shells 9,080 8,455 6,465 5,332 5,332 Horned turban 1,310 1,506 1,506 1,642 1,432 Blue crabs 19,500 14,600 10,900 6,000 6,000 Squid 191,000 191,000 186,000 141,750 141,750 Sailfin sandfish 4,550 4,880 5,150 4,329 5,037 Mottled Skate 200 197 220 180 203 Total 416,951 415,308 392,424 338,827 340,060 Source: Ministry of Oceans and Fisheries (MOF), Resource Management Division
In 2015, Korean production of processed seafood was 1.83 million metric tons, down by 21.7
percent from 2.34 million metric tons in 2014 due to the reduced fish resource and
harvest. However, by value the decrease was only 5.7 percent which is attributed to increased
prices of value-added seafood such as fish cake products, dried fish, and canned seafood.
Table 7. Korean Production of Processed Seafood
Year Production (MT) Value (Million K/Won) 2008 1,766,528 6,642,033 2009 1,898,135 6,046,188 2010 1,815,286 6,875,258 2011 1,865,546 6,540,369 2012 1,885,489 7,770,232 2013 1,819,693 7,422,605 2014 2,337,313 7,523,432 2015 1,829,141 7,097,394 Source: Korea Food Distribution Yearbook 2017
Demand Korean consumers place high value on freshness, place of origin, taste, low cost, and food safety
in the course of making seafood purchasing decisions. Overall performance of the Korean seafood
market will depend greatly on production and consumption. Due to the shortage of ocean
resources, seafood production is not expected to increase in the near future. Despite this,
consumption of seafood continues to grow as consumers view seafood as a healthy source of
protein.
Price, quality and timeliness are the most important factors affecting U.S. trade. U.S. fish are
generally considered to be high quality and, in turn, more expensive than other countries’
products. Therefore, the major species imported from the United States are species that Koreans
enjoy and that other origins do not supply in large quantities.
The Korea Rural Economic Institute reported in its 2015 Food Balance Sheet that annual per capita
seafood consumption in Korea was 58.9 kg (fishery products and shellfish 41.9 kg and seaweed
17.0 kg) in 2014. The major seafood species consumed by Koreans are anchovy, mackerels,
shrimp, squid, tuna, Alaskan Pollack, yellow corbina, hair tail, flat fish, monk fish, eel, rock fish
and cod. The success of the Korean industry efforts to change consumer perceptions of fish (as a
healthy alternative to red meat), to diversify fish products, to improve quality, and to develop
processing technology will be key in expanding domestic demand.
Due to increased incomes and improved standards of living, seafood family restaurants have
grown in popularity in Korea and have been expanding over the years. Popular seafood family
restaurants include Todai, Ocean Seafood, Bono-Bono, Marisco, Makinochaya, Fisher’s Market,
Sea-n-More, Seafood Blue, El Mareta, Cfood Kitchen, D’ Maris, Muscus, Viking’s Wharf, and
Soosa. These restaurants are using imported seafood as well as locally produced seafood.
Koreans eat fish in various states: fresh fish, chilled fish and lastly, frozen fish in the order of
preference. Some fish are consumed raw (“Hoi”, or “Sashimi”), and commands a price
premium. Korean consumers assume fresh fish tastes better than frozen fish after
cooking. Accordingly, fresh or chilled fish tend to be substantially more expensive than frozen
fish. As more and more women are working outside the home, the demand for convenience food has
increased. Korean consumers are more attracted to precooked, prepared and preserved food
available at supermarkets.
In 2013, CJ (Cheil Jedang) Corporation of Korea launched a new processed seafood brand called
“Alaska Salmon”. The “Alaska Salmon” is a canned product made in Thailand (OEM) using natural
salmon from Alaska, a region that is famous with its pristine waters. The price of a can is 3,600
Korean Won for 135 grams which can be converted to about $13.40 per pound. Even though the
price was more than two times higher than those of regular canned tunas, this 100 percent natural
salmon product hit the market making $8.2 million in sales in its first year with a market share of
86 percent. Stimulated by this successful launching of “Alaska Salmon” brand, competing
canneries such as “Dongwon” and “Sajo” also introduced their canned salmon products eroding CJ
Corporation’s market share every year. CJ Corporation, still the leader with more than 60 percent
market share in 2014 and 2015, diversified its canned salmon products by adding three new
products in 2014, which contributed the record total market sales of $44.1 million in
2015. Currently five varieties of product (Original, Olive Oil, White Mayo, Brown Rice Oil, and Hot
Pepper) are being sold in the market.
Hotels and department stores generally use high quality seafood for which they charge a higher
price and some of the five-star hotels and leading department stores have already done special
promotions featuring U.S. seafood products such as lobsters and scallops commemorating the
3rd and 4th anniversaries of the KORUS FTA implementation.
However, the institutional feeding and food service sector generally uses cheaper food ingredients
to reduce cost as much as possible to remain competitive in the sector. The most popular fish
products in this market include frozen flatfish (mostly yellowfin sole), skate, croaker (aka yellow
corbina), Atka mackerel, Alaska Pollack roe and snow crab.
Table 8. Korean Seafood Demand and Supply (Unit: 1,000 tons)

Total Demand Total Supply Self-
sufficiency
rate Local
consumption Exports Carry-
over Production Imports Inventory
2010 3,639 1,751 603 5,993 3,111 2,339 543 85.9% 2011 3,813 1,466 639 5,918 3,256 2,059 603 85.4% 2012 4,236 1,072 390 5,698 3,170 2,144 384 74.8% 2013 4,070 1,087 374 5,531 3,133 2,008 390 77.0% 2014 4,545 949 468 5,962 3,305 2,263 394 72.7% Source: Korea Rural Economy Institute (KREI) 2015 Food Balance Sheet
Table 9. Korean Annual Per Capita Consumption of Seafood Products (Kg)
Product Category 2008 2009 2010 2011 2012 2013 2014 2015
(Preliminary) Fish and Shell fish 39.0 36.1 36.5 37.1 38.3 37.1 41.6 41.3 Seaweed 15.8 14.4 14.7 15.7 15.9 17.4 16.9 18.6 Total (kg/year) 54.8 50.5 51.2 52.8 54.2 54.5 58.5 59.9 Source: Korea Rural Economy Institute (KREI) 2015 Food Balance Sheet
Competitors Seafood is imported into Korea from about 100 different countries. Major suppliers of fishery
products to Korea include China, Russia, Vietnam, Norway, USA, Thailand, Chile, Japan, Peru and
Taiwan. In 2016, the top ten supplying countries accounted for about 80 percent of total Korean
seafood imports on a value basis. China continued to be the largest supplier, followed by Russia
and Vietnam.
Several countries have recently entered into trade agreements with Korea that have also put many
of their seafood products at zero or phased out duties, which has increased competition in the
sector. For example, the KORUS FTA implemented in March 2012 has focused attention on U.S.
lobster and a growing number of importers and retailers began to hold a series of large scale in-
store promotions. In 2014, the tariff for live American lobsters dropped to 8% and total Korean
imports of lobsters increased nearly 30% from 2013, nearly all of which was imported from the
United States. However, the accelerated implementation of the Korea-Canada FTA in 2015
reversed the situation as tariffs dropped to zero for Canadian frozen lobsters in 2015. Over the
past three years the total Korean market for lobsters has grown remarkably both by value and
volume. Since 2013, total sales of American lobsters have increased over 50% and opportunities
for American live lobster remains strong. However, competition will be fierce as the tariff for all
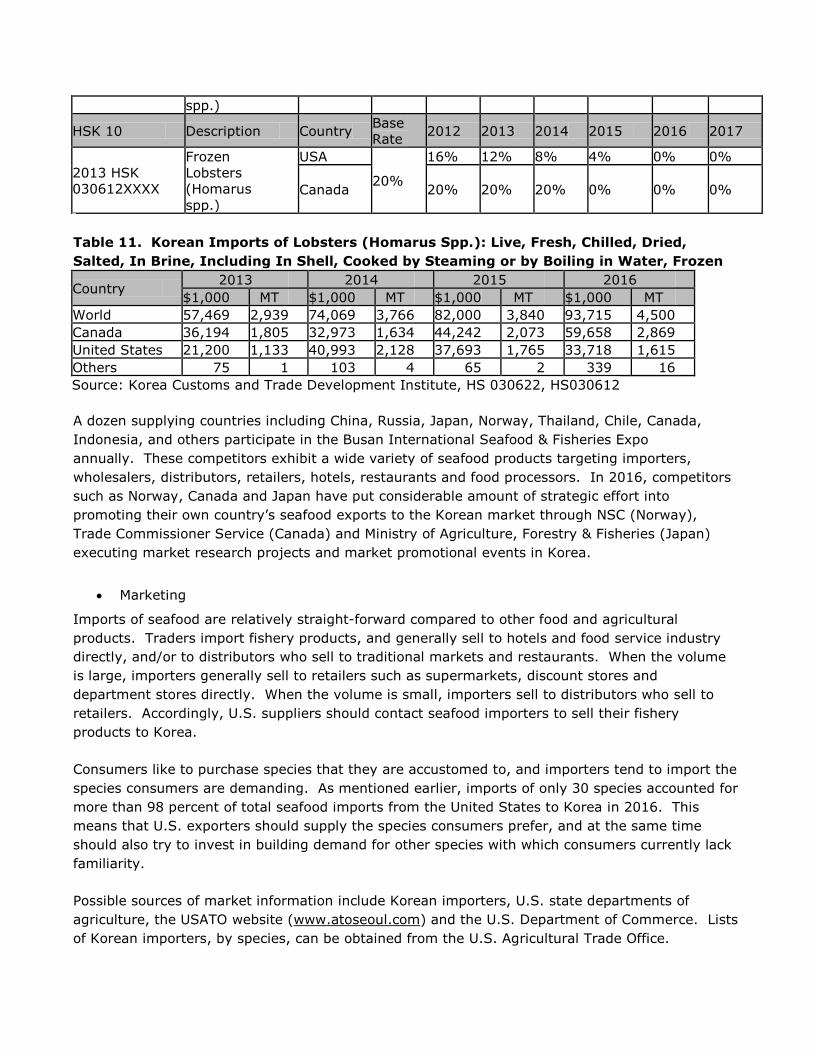
Canadian lobsters dropped to zero in 2017. Table 10. Tariff Phase-Out Schedule for Lobster Products under KORUS FTA
HSK 10 Description Country Base
Rate 2012 2013 2014 2015 2016 2017
2013 HSK
030622XXXX
Live, Fresh,
Chilled
Lobsters
(Homarus
USA
20%
16% 12% 8% 4% 0% 0%
Canada 20% 20% 20% 13.3% 6.6% 0%
spp.)
HSK 10 Description Country Base
Rate 2012 2013 2014 2015 2016 2017
2013 HSK
030612XXXX
Frozen
Lobsters
(Homarus
spp.)
USA
20%
16% 12% 8% 4% 0% 0%
Canada 20% 20% 20% 0% 0% 0%
Table 11. Korean Imports of Lobsters (Homarus Spp.): Live, Fresh, Chilled, Dried,
Salted, In Brine, Including In Shell, Cooked by Steaming or by Boiling in Water, Frozen
Country 2013 2014 2015 2016
$1,000 MT $1,000 MT $1,000 MT $1,000 MT World 57,469 2,939 74,069 3,766 82,000 3,840 93,715 4,500 Canada 36,194 1,805 32,973 1,634 44,242 2,073 59,658 2,869 United States 21,200 1,133 40,993 2,128 37,693 1,765 33,718 1,615 Others 75 1 103 4 65 2 339 16 Source: Korea Customs and Trade Development Institute, HS 030622, HS030612
A dozen supplying countries including China, Russia, Japan, Norway, Thailand, Chile, Canada,
Indonesia, and others participate in the Busan International Seafood & Fisheries Expo
annually. These competitors exhibit a wide variety of seafood products targeting importers,
wholesalers, distributors, retailers, hotels, restaurants and food processors. In 2016, competitors
such as Norway, Canada and Japan have put considerable amount of strategic effort into
promoting their own country’s seafood exports to the Korean market through NSC (Norway),
Trade Commissioner Service (Canada) and Ministry of Agriculture, Forestry & Fisheries (Japan)
executing market research projects and market promotional events in Korea.
Marketing Imports of seafood are relatively straight-forward compared to other food and agricultural
products. Traders import fishery products, and generally sell to hotels and food service industry
directly, and/or to distributors who sell to traditional markets and restaurants. When the volume
is large, importers generally sell to retailers such as supermarkets, discount stores and
department stores directly. When the volume is small, importers sell to distributors who sell to
retailers. Accordingly, U.S. suppliers should contact seafood importers to sell their fishery
products to Korea.
Consumers like to purchase species that they are accustomed to, and importers tend to import the
species consumers are demanding. As mentioned earlier, imports of only 30 species accounted for
more than 98 percent of total seafood imports from the United States to Korea in 2016. This
means that U.S. exporters should supply the species consumers prefer, and at the same time
should also try to invest in building demand for other species with which consumers currently lack
familiarity.
Possible sources of market information include Korean importers, U.S. state departments of
agriculture, the USATO website (www.atoseoul.com) and the U.S. Department of Commerce. Lists
of Korean importers, by species, can be obtained from the U.S. Agricultural Trade Office.

One way of finding potential importers while also assessing market potential is to participate in
local food shows to showcase your products to a larger audience. Many Korean importers
attending these shows are looking to establish reliable long-term trading relationships. Show
participation enhances initial contacts with importers, agents, wholesalers, distributors, retailers
and others in the food and beverage industry.
Seoul International Seafood Show (3S) 2017 was held in Seoul at COEX, May 10-12,
2017. Sponsored by the Ministry of Oceans and Fisheries (MOF) of Korea, this is the only show
held in Seoul specializing in seafood, fishery, nursery, aquaculture, processing machinery and
related equipment. This show will be held in May 9-11 again next year and targets seafood
buyers, users, fishing businessmen and traders. Check the official website of the show
(www.seoulseafood.com) for further details.
Busan International Seafood & Fisheries Expo (BIFSE) 2017 will be held in Busan at BEXCO
convention center, November 8-10, 2017. It offers an excellent opportunity to explore possible
market opportunities in Korea. This show has been held in November (or October) every year and
targets importers, wholesalers, distributors, retailers, hotels, restaurants, food processors, and
media. Currently, it is the only seafood show held in Korea supported by ATO Seoul. ATO Seoul
has been participating in this show for 13 years, in cooperation with State Regional Trade Groups
such as SUSTA and Food Export USA Northeast. Check BISFE’s official website (www.bisfe.com)
for detailed information on the show. The registered trade show sales company in USA for this
show is B-FOR the international exhibit people™, 520 William Street, Suite E, Fredericksburg,
VA 22401-5775, USA (+1.540.373.9935 / [email protected] / www.b-for.com)
SECTION IV: FURTHER INFORMATION AND KEY CONTACTS
For further information on how you can enter the Korean market for imported food
products:
ATO Seoul uses the USDA’s Global Agriculture Information Network (GAIN) system to provide
stakeholders with market knowledge on Korean food trade. Exporters who want to find most
recent copy of the annual Exporter Guide for the Korean market can access the GAIN and review
the report at: 2016 Annual Exporter Guide Report by ATO Seoul
For any further information about Korean market, please contact:
U.S. Agricultural Trade Office (ATO)
Local address: Rm 303, Leema B/D, 42, Jongro 1-gil, Jongro-gu, Seoul, Korea 03152
U.S. mailing address: ATO, U.S. Embassy - Seoul, Unit 9600 Box 0050, DPO, AP 96209-0050
Phone: 82-2-6951-6848
Fax: 82-2-720-7921
E-mail: [email protected]
Home Page: www.atoseoul.com
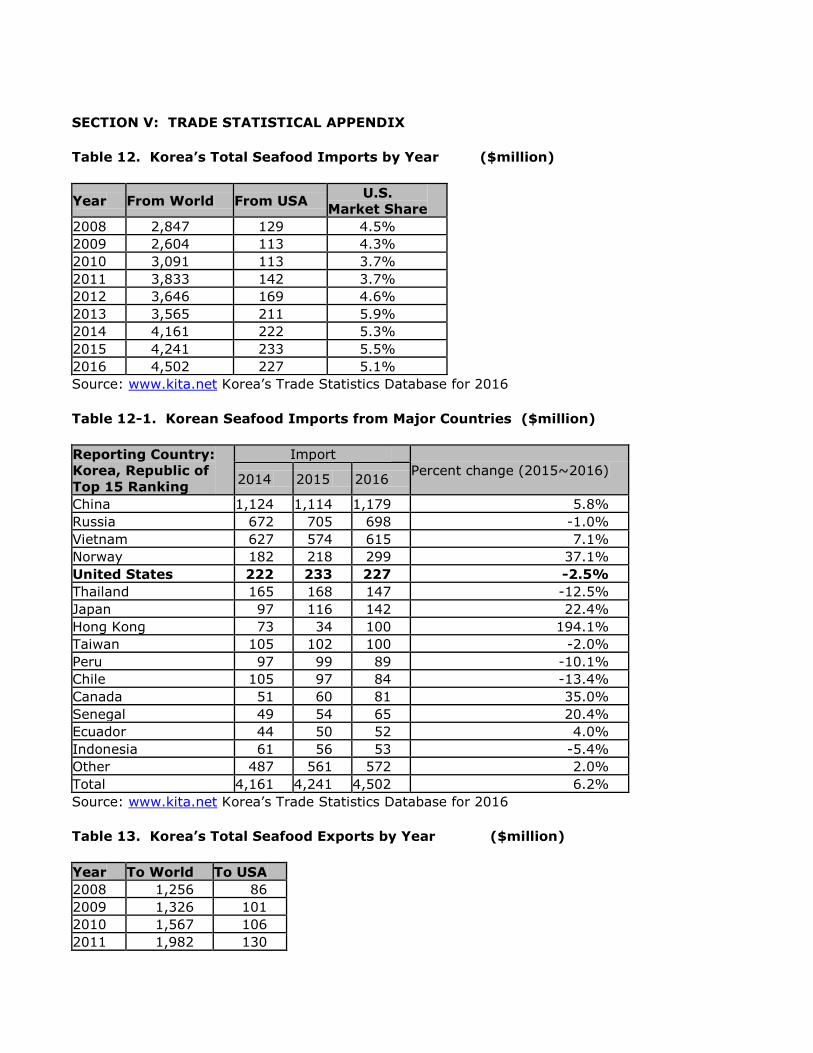
SECTION V: TRADE STATISTICAL APPENDIX Table 12. Korea’s Total Seafood Imports by Year ($million)
Year From World From USA U.S.
Market Share 2008 2,847 129 4.5% 2009 2,604 113 4.3% 2010 3,091 113 3.7% 2011 3,833 142 3.7% 2012 3,646 169 4.6% 2013 3,565 211 5.9% 2014 4,161 222 5.3% 2015 4,241 233 5.5% 2016 4,502 227 5.1% Source: www.kita.net Korea’s Trade Statistics Database for 2016 Table 12-1. Korean Seafood Imports from Major Countries ($million)
Reporting Country:
Korea, Republic of
Top 15 Ranking
Import Percent change (2015~2016)
2014 2015 2016
China 1,124 1,114 1,179 5.8% Russia 672 705 698 -1.0% Vietnam 627 574 615 7.1% Norway 182 218 299 37.1% United States 222 233 227 -2.5% Thailand 165 168 147 -12.5% Japan 97 116 142 22.4% Hong Kong 73 34 100 194.1% Taiwan 105 102 100 -2.0% Peru 97 99 89 -10.1% Chile 105 97 84 -13.4% Canada 51 60 81 35.0% Senegal 49 54 65 20.4% Ecuador 44 50 52 4.0% Indonesia 61 56 53 -5.4% Other 487 561 572 2.0% Total 4,161 4,241 4,502 6.2% Source: www.kita.net Korea’s Trade Statistics Database for 2016 Table 13. Korea’s Total Seafood Exports by Year ($million)
Year To World To USA 2008 1,256 86 2009 1,326 101 2010 1,567 106 2011 1,982 130

2012 1,973 129 2013 1,749 136 2014 1,642 133 2015 1,481 146 2016 1,637 157 Source: www.kita.net Korea’s Trade Statistics Database for 2016 Table 13-1. Korean Seafood Exports to Major Countries ($million)
Reporting Country:
Korea, Republic of
Top 10 Ranking
Export
2014 2015 2016
Japan 625 545 585 China 254 235 293 United States 133 146 157 Thailand 106 95 123 Vietnam 62 76 85 Hong Kong 27 42 50 France 26 42 44 Italy 20 24 38 Spain 38 16 29 Other 350 258 231 Total 1,642 1,481 1,637 Source: www.kita.net Korea’s Trade Statistics Database for 2016 Table 14-1. Top 30 Fish Imported to Korea from USA in 2016 (In Value, $1,000)
Fish Species HS Code
Number
From
USA
($1,000)
From
World
($1,000)
U.S.
Market
Share Fish Surimi, Alaska Pollack (Theragra
Chalcogramma), frozen 0304.94.1000 56,606 56,639 99.9%
Lobsters, not frozen, other than
smoked 0306.22.9000 30,332 73,610 41.2%
Cod, frozen 0303.63.0000 19,479 55,079 35.4% Other, Flatfish, frozen 0303.39.0000 17,828 57,715 30.9% Alaska Pollack (Theragra
Chalcogramma), frozen 0303.67.0000 13,752 222,422 6.2%
Monkfish, frozen 0303.89.9060 10,970 71,381 15.4% Hagfish (Salad Eel), live 0301.99.7000 10,269 14,770 69.5% Skate, frozen 0303.82.2000 6,614 33,571 19.7% Roes of Alaska Pollack, frozen 0303.90.2010 6,413 60,048 10.7% Hagfish (Salad Eel), frozen 0303.89.9070 6,223 8,357 74.5% Roes of Other Fish, frozen 0303.90.2090 5,231 15,478 33.8% Atka mackerel, frozen 0303.89.9040 4,844 20,287 23.9% Ray, frozen 0303.82.1000 3,722 25,911 14.4% Fillet, Plaice, frozen 0304.83.1000 3,403 4,730 71.9% Lobsters, frozen, other than smoked 0306.12.9000 3,386 20,104 16.8% Other Pacific salmon 0303.12.0000 3,368 11,434 29.5%
Fillet, Alaska Pollack (Theragra
Chalcogramma), frozen 0304.75.0000 3,061 53,262 5.7%
Fish Surimi, Alaska Pollack (other
than Theragra Chalcogramma), frozen 0304.99.1000 2,591 163,724 1.6%
Rock fish (including pacific ocean
perch) 0303.89.9050 2,242 21,279 10.5%
Other fish, frozen 0303.89.9099 2,087 28,760 7.3% Adductors of shell fish 0307.99.1100 1,953 13,054 15.0% Fillet, cod, frozen 0304.71.0000 1,934 3,631 53.3% Other crabs, live, fresh or chilled 0306.24.1090 1,578 129,813 1.2% Other crabs (including Dungeness),
frozen, other than smoked 0306.14.9090 1,426 61,704 2.3%
Fillet, Pacific salmon(Oncorhynchus
nerka, Oncorhynchus gorbuscha,
Oncorhynchus keta, Oncorhynchus
tschawytscha, Oncorhynchus kisutch,
Oncorhynchus masou and
Oncorhynchus rhodurus), Atlantic
salmon(Salmo salar) and Danube
salmon(Hucho hucho)
0304.81.0000 1,059 7,592 13.9%
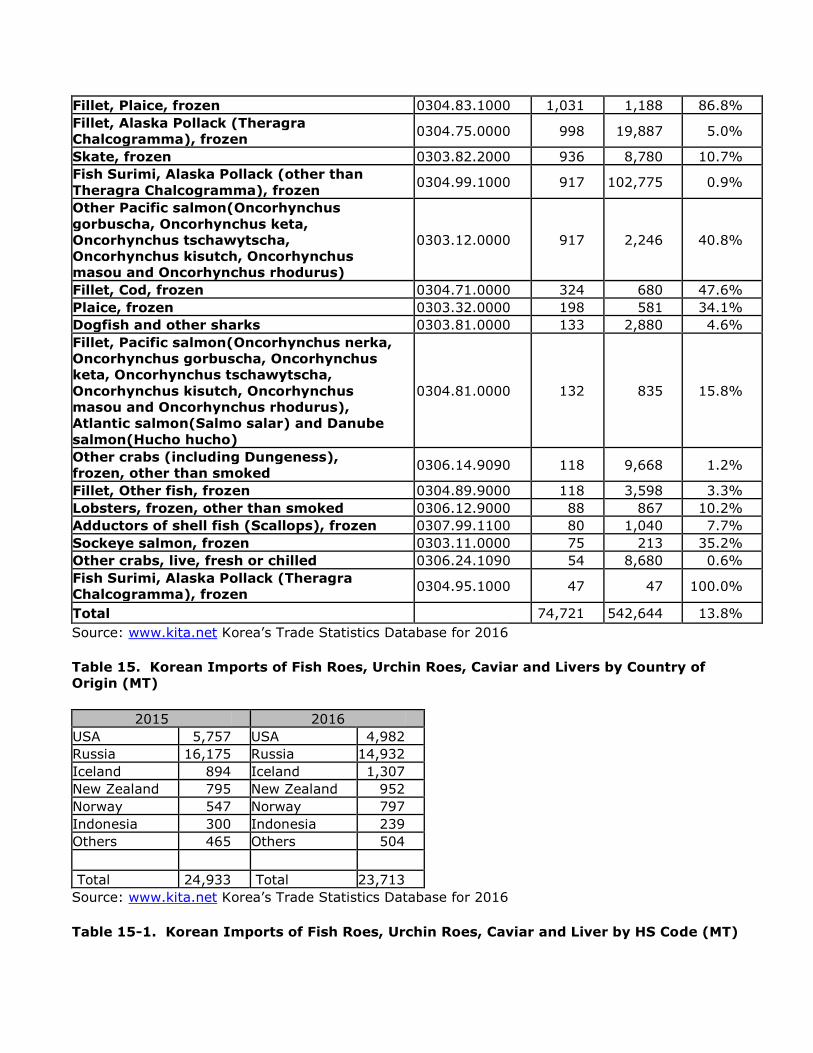
Sable fish, frozen 0303.89.1000 617 776 79.5% Fillet, Other fish, frozen 0304.89.9000 505 17,291 2.9% Plaice, frozen 0303.32.0000 460 1,173 39.2% Sea Urchin, live, fresh or chilled 0308.21.0000 378 1,415 26.7% Sockeye salmon, frozen 0303.11.0000 375 1,127 33.3% Total 222,706 1,256,137 17.7% Source: www.kita.net Korea’s Trade Statistics Database for 2016 Table 14-2. Top 30 Fish Imported to Korea from USA in 2016 (In Quantity, MT)
Fish Species HS Code
Number
From
USA (1,000
Kg)
From
World (1,000
Kg)
U.S.
Market
Share
Fish Surimi, Alaska Pollack (Theragra
Chalcogramma), frozen 0304.94.1000 20,243 20,260 99.9%
Other, Flatfish, frozen 0303.39.0000 11,307 27,220 41.5% Alaska Pollack (Theragra Chalcogramma),
frozen 0303.67.0000 10,748 204,249 5.3%
Cod, frozen 0303.63.0000 7,091 20,380 34.8% Roes of Other Fish, frozen 0303.90.2090 2,641 6,731 39.2% Other 0303.89.9099 2,574 20,955 12.3% Roes of Alaska Pollack, frozen 0303.90.2010 2,334 14,657 15.9% Monkfish, frozen 0303.89.9060 2,146 27,006 7.9% Hagfish (Salad Eel), frozen 0303.89.9070 1,987 2,708 73.4% Ray, frozen 0303.82.1000 1,869 9,734 19.2% Atka mackerel, frozen 0303.89.9040 1,741 8,264 21.1% Lobsters, not frozen, other than smoked 0306.22.9000 1,527 3,633 42.0% Rock fish, frozen 0303.89.9050 1,188 11,212 10.6% Hagfish (Salad Eel), live 0301.99.7000 1,159 1,670 69.4%
Fillet, Plaice, frozen 0304.83.1000 1,031 1,188 86.8% Fillet, Alaska Pollack (Theragra
Chalcogramma), frozen 0304.75.0000 998 19,887 5.0%
Skate, frozen 0303.82.2000 936 8,780 10.7% Fish Surimi, Alaska Pollack (other than
Theragra Chalcogramma), frozen 0304.99.1000 917 102,775 0.9%
Other Pacific salmon(Oncorhynchus
gorbuscha, Oncorhynchus keta,
Oncorhynchus tschawytscha,
Oncorhynchus kisutch, Oncorhynchus
masou and Oncorhynchus rhodurus)
0303.12.0000 917 2,246 40.8%
Fillet, Cod, frozen 0304.71.0000 324 680 47.6% Plaice, frozen 0303.32.0000 198 581 34.1% Dogfish and other sharks 0303.81.0000 133 2,880 4.6% Fillet, Pacific salmon(Oncorhynchus nerka,
Oncorhynchus gorbuscha, Oncorhynchus
keta, Oncorhynchus tschawytscha,
Oncorhynchus kisutch, Oncorhynchus
masou and Oncorhynchus rhodurus),
Atlantic salmon(Salmo salar) and Danube
salmon(Hucho hucho)
0304.81.0000 132 835 15.8%
Other crabs (including Dungeness),
frozen, other than smoked 0306.14.9090 118 9,668 1.2%
Fillet, Other fish, frozen 0304.89.9000 118 3,598 3.3% Lobsters, frozen, other than smoked 0306.12.9000 88 867 10.2% Adductors of shell fish (Scallops), frozen 0307.99.1100 80 1,040 7.7% Sockeye salmon, frozen 0303.11.0000 75 213 35.2% Other crabs, live, fresh or chilled 0306.24.1090 54 8,680 0.6% Fish Surimi, Alaska Pollack (Theragra
Chalcogramma), frozen 0304.95.1000 47 47 100.0%
Total 74,721 542,644 13.8% Source: www.kita.net Korea’s Trade Statistics Database for 2016 Table 15. Korean Imports of Fish Roes, Urchin Roes, Caviar and Livers by Country of
Origin (MT)
2015 2016 USA 5,757 USA 4,982 Russia 16,175 Russia 14,932 Iceland 894 Iceland 1,307 New Zealand 795 New Zealand 952 Norway 547 Norway 797 Indonesia 300 Indonesia 239 Others 465 Others 504
Total 24,933 Total 23,713 Source: www.kita.net Korea’s Trade Statistics Database for 2016 Table 15-1. Korean Imports of Fish Roes, Urchin Roes, Caviar and Liver by HS Code (MT)
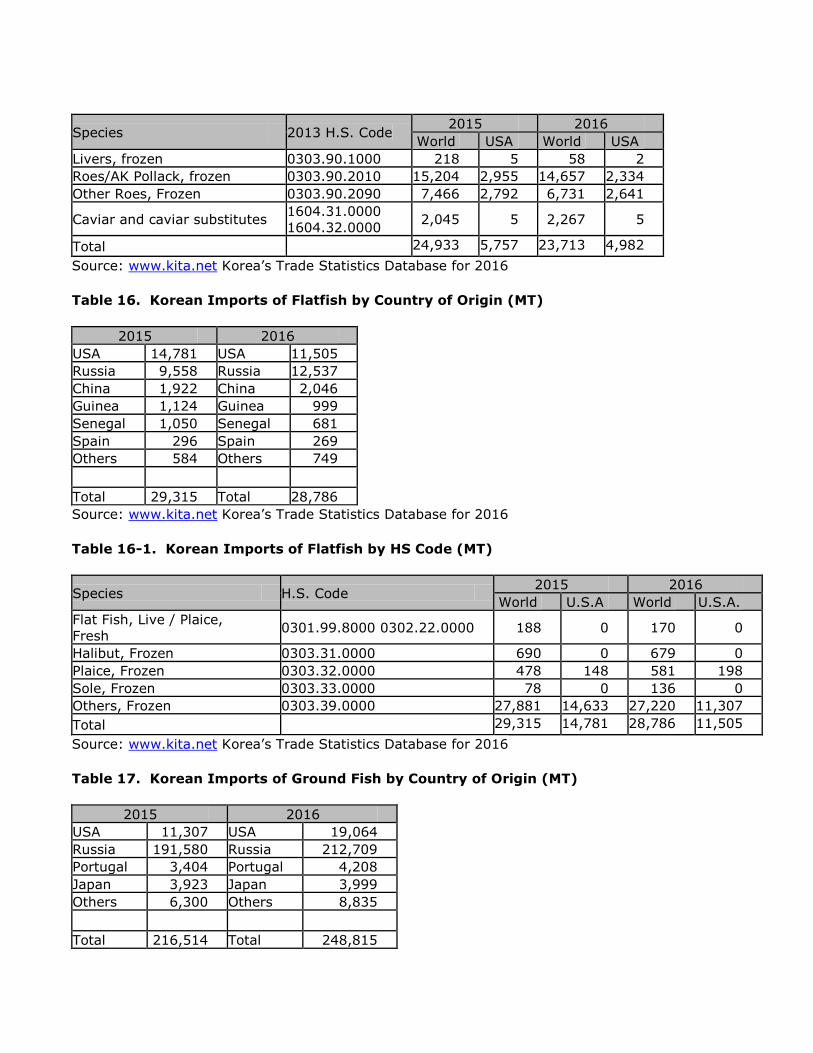
Species 2013 H.S. Code 2015 2016
World USA World USA Livers, frozen 0303.90.1000 218 5 58 2 Roes/AK Pollack, frozen 0303.90.2010 15,204 2,955 14,657 2,334 Other Roes, Frozen 0303.90.2090 7,466 2,792 6,731 2,641
Caviar and caviar substitutes 1604.31.0000 1604.32.0000
2,045 5 2,267 5
Total 24,933 5,757 23,713 4,982
Source: www.kita.net Korea’s Trade Statistics Database for 2016 Table 16. Korean Imports of Flatfish by Country of Origin (MT)
2015 2016 USA 14,781 USA 11,505 Russia 9,558 Russia 12,537 China 1,922 China 2,046 Guinea 1,124 Guinea 999 Senegal 1,050 Senegal 681 Spain 296 Spain 269 Others 584 Others 749
Total 29,315 Total 28,786 Source: www.kita.net Korea’s Trade Statistics Database for 2016 Table 16-1. Korean Imports of Flatfish by HS Code (MT)
Species H.S. Code 2015 2016
World U.S.A World U.S.A. Flat Fish, Live / Plaice,
Fresh 0301.99.8000 0302.22.0000 188 0 170 0
Halibut, Frozen 0303.31.0000 690 0 679 0 Plaice, Frozen 0303.32.0000 478 148 581 198 Sole, Frozen 0303.33.0000 78 0 136 0 Others, Frozen 0303.39.0000 27,881 14,633 27,220 11,307 Total 29,315 14,781 28,786 11,505
Source: www.kita.net Korea’s Trade Statistics Database for 2016 Table 17. Korean Imports of Ground Fish by Country of Origin (MT)
2015 2016 USA 11,307 USA 19,064 Russia 191,580 Russia 212,709 Portugal 3,404 Portugal 4,208 Japan 3,923 Japan 3,999 Others 6,300 Others 8,835
Total 216,514 Total 248,815
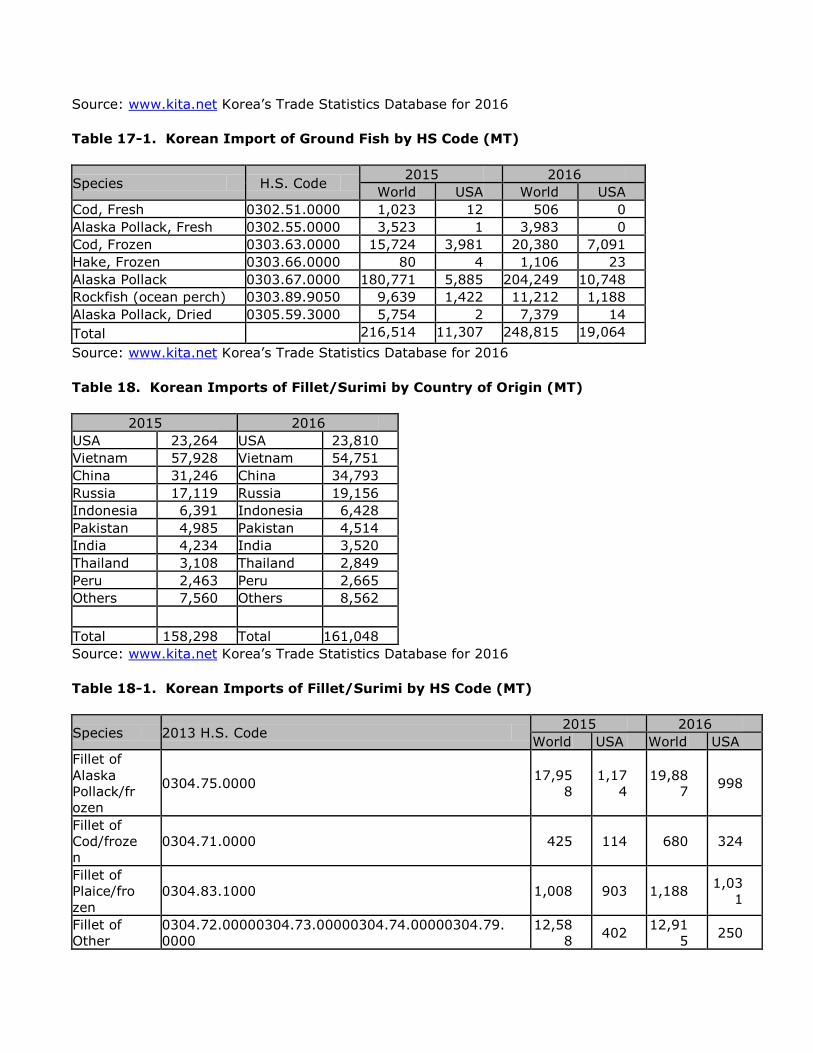
Source: www.kita.net Korea’s Trade Statistics Database for 2016 Table 17-1. Korean Import of Ground Fish by HS Code (MT)
Species H.S. Code 2015 2016
World USA World USA Cod, Fresh 0302.51.0000 1,023 12 506 0 Alaska Pollack, Fresh 0302.55.0000 3,523 1 3,983 0 Cod, Frozen 0303.63.0000 15,724 3,981 20,380 7,091 Hake, Frozen 0303.66.0000 80 4 1,106 23 Alaska Pollack 0303.67.0000 180,771 5,885 204,249 10,748 Rockfish (ocean perch) 0303.89.9050 9,639 1,422 11,212 1,188 Alaska Pollack, Dried 0305.59.3000 5,754 2 7,379 14 Total 216,514 11,307 248,815 19,064
Source: www.kita.net Korea’s Trade Statistics Database for 2016 Table 18. Korean Imports of Fillet/Surimi by Country of Origin (MT)
2015 2016 USA 23,264 USA 23,810 Vietnam 57,928 Vietnam 54,751 China 31,246 China 34,793 Russia 17,119 Russia 19,156 Indonesia 6,391 Indonesia 6,428 Pakistan 4,985 Pakistan 4,514 India 4,234 India 3,520 Thailand 3,108 Thailand 2,849 Peru 2,463 Peru 2,665 Others 7,560 Others 8,562
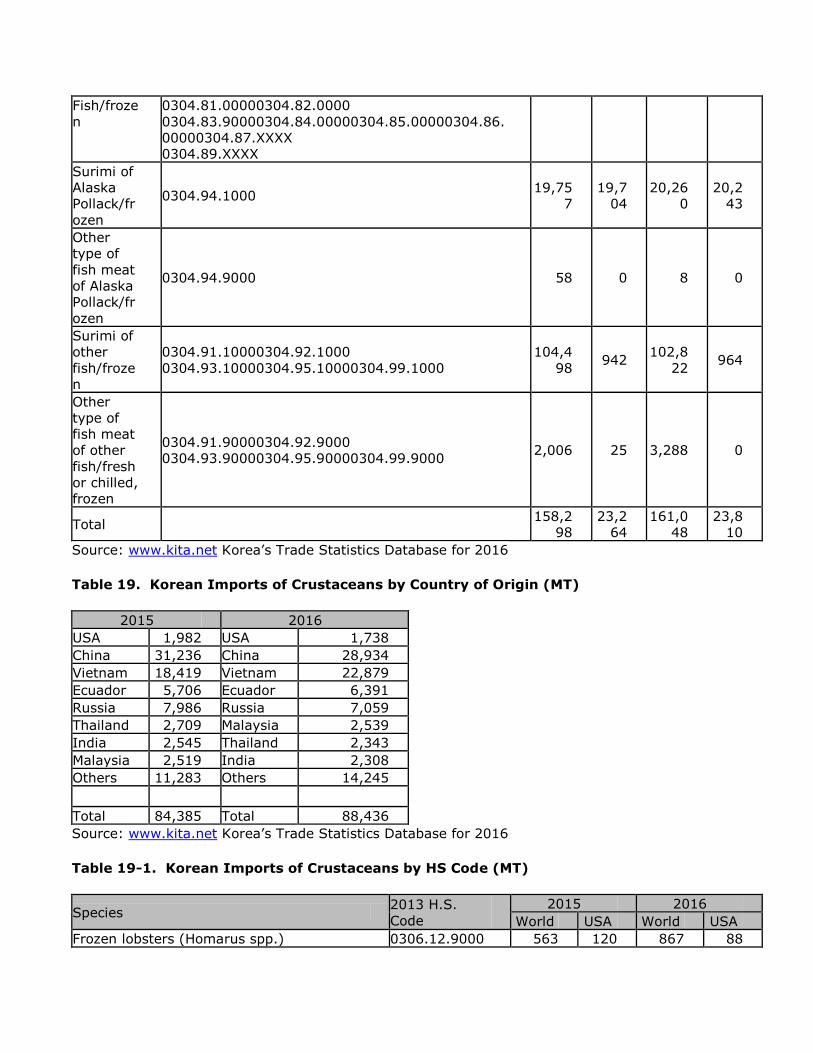
Total 158,298 Total 161,048 Source: www.kita.net Korea’s Trade Statistics Database for 2016 Table 18-1. Korean Imports of Fillet/Surimi by HS Code (MT)
Species 2013 H.S. Code 2015 2016
World USA World USA Fillet of
Alaska
Pollack/fr
ozen
0304.75.0000 17,95
8 1,17
4 19,88
7 998
Fillet of
Cod/froze
n 0304.71.0000 425 114 680 324
Fillet of
Plaice/fro
zen 0304.83.1000 1,008 903 1,188
1,03
1
Fillet of
Other
0304.72.00000304.73.00000304.74.00000304.79.
0000 12,58
8 402
12,91
5 250
Fish/froze
n 0304.81.00000304.82.0000 0304.83.90000304.84.00000304.85.00000304.86.
00000304.87.XXXX 0304.89.XXXX
Surimi of
Alaska
Pollack/fr
ozen
0304.94.1000 19,75
7 19,7
04 20,26
0 20,2
43
Other
type of
fish meat
of Alaska
Pollack/fr
ozen
0304.94.9000 58 0 8 0
Surimi of
other
fish/froze
n
0304.91.10000304.92.1000 0304.93.10000304.95.10000304.99.1000
104,4
98 942
102,8
22 964
Other
type of
fish meat
of other
fish/fresh
or chilled,
frozen
0304.91.90000304.92.9000 0304.93.90000304.95.90000304.99.9000
2,006 25 3,288 0
Total 158,2
98 23,2
64 161,0
48 23,8
10 Source: www.kita.net Korea’s Trade Statistics Database for 2016 Table 19. Korean Imports of Crustaceans by Country of Origin (MT)
2015 2016 USA 1,982 USA 1,738 China 31,236 China 28,934 Vietnam 18,419 Vietnam 22,879 Ecuador 5,706 Ecuador 6,391 Russia 7,986 Russia 7,059 Thailand 2,709 Malaysia 2,539 India 2,545 Thailand 2,343 Malaysia 2,519 India 2,308 Others 11,283 Others 14,245
Total 84,385 Total 88,436 Source: www.kita.net Korea’s Trade Statistics Database for 2016 Table 19-1. Korean Imports of Crustaceans by HS Code (MT)
Species 2013 H.S.
Code 2015 2016
World USA World USA Frozen lobsters (Homarus spp.) 0306.12.9000 563 120 867 88
Frozen peeled shrimps and prawns 0306.16.1090 0306.17.1090
20,840 0 22,819 0
Frozen other type of shrimps and prawns 0306.17.9010 0306.17.9090
20,560 19 21,921 0
Frozen crab meat 0306.14.1090 0 0 17 0 Frozen king crabs 0306.14.2090 360 1 46 0 Frozen blue crabs 0306.14.3090 22,491 0 20,846 0 Frozen other type of crabs 0306.14.9090 7,494 195 9,668 118 Not frozen lobsters (Homarus spp.) 0306.22.9000 3,277 1,645 3,633 1,527 Live, fresh or chilled shrimps and prawns 0306.26.1000 1 1 3 1 Salted or in brine shrimps and prawns 0306.26.3000 0 0 0 0 Live, fresh or chilled snow crab 0306.24.1020 5,501 1 5,040 2
Frozen rock lobster, other sea crawfish,
dried shrimps, crabs, etc.
0306.11.9000 0306.26.2000 0306.27.2000 0306.24.2000 0306.29.2000
3,298 0 3,576 2
Total 84,385 1,982 88,436 1,738 Source: www.kita.net Korea’s Trade Statistics Database for 2016
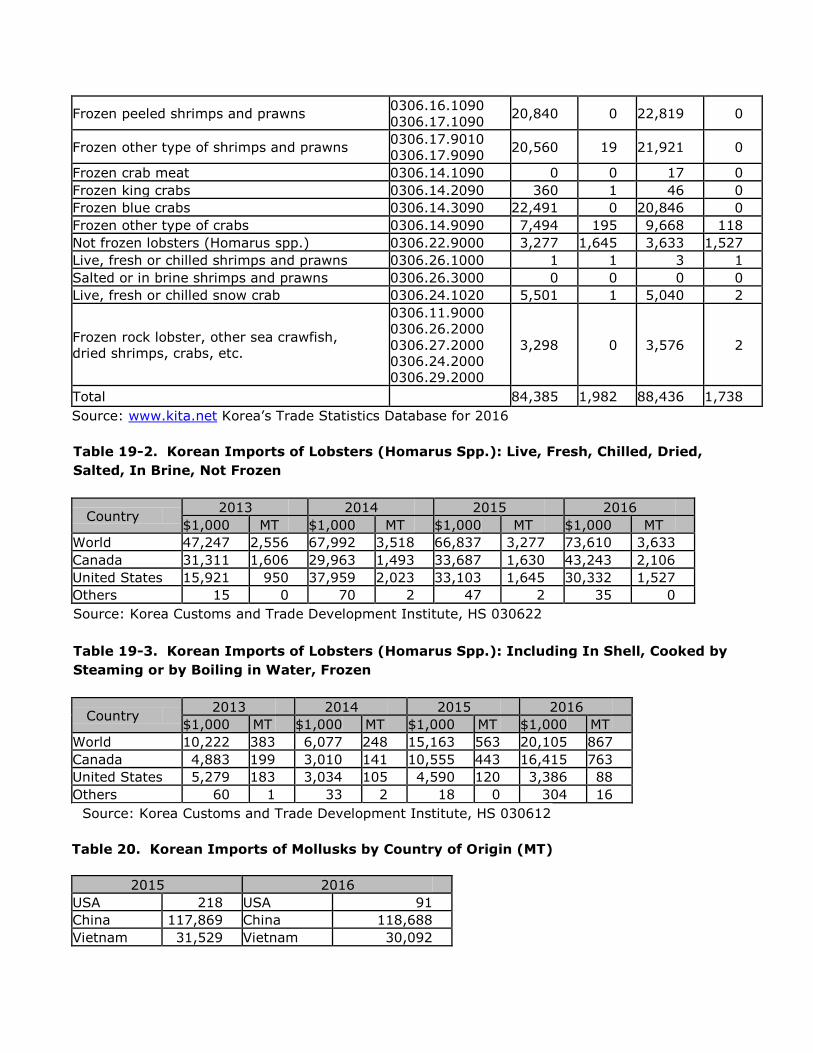
Table 19-2. Korean Imports of Lobsters (Homarus Spp.): Live, Fresh, Chilled, Dried,
Salted, In Brine, Not Frozen
Country 2013 2014 2015 2016
$1,000 MT $1,000 MT $1,000 MT $1,000 MT World 47,247 2,556 67,992 3,518 66,837 3,277 73,610 3,633 Canada 31,311 1,606 29,963 1,493 33,687 1,630 43,243 2,106 United States 15,921 950 37,959 2,023 33,103 1,645 30,332 1,527 Others 15 0 70 2 47 2 35 0 Source: Korea Customs and Trade Development Institute, HS 030622
Table 19-3. Korean Imports of Lobsters (Homarus Spp.): Including In Shell, Cooked by
Steaming or by Boiling in Water, Frozen
Country 2013 2014 2015 2016
$1,000 MT $1,000 MT $1,000 MT $1,000 MT World 10,222 383 6,077 248 15,163 563 20,105 867 Canada 4,883 199 3,010 141 10,555 443 16,415 763 United States 5,279 183 3,034 105 4,590 120 3,386 88 Others 60 1 33 2 18 0 304 16 Source: Korea Customs and Trade Development Institute, HS 030612
Table 20. Korean Imports of Mollusks by Country of Origin (MT)
2015 2016 USA 218 USA 91 China 117,869 China 118,688 Vietnam 31,529 Vietnam 30,092

Chile 22,569 Chile 28,519 Peru 15,225 Peru 9,183 Thailand 9,490 Thailand 7,369 Japan 7,832 Japan 7,039 Argentina 4,533 Mauritania 3,148 Mauritania 4,384 Taiwan 3,025 Indonesia 2,719 Indonesia 1,751 Others 8,152 Others 7,083
Total 224,520 Total 215,988 Source: www.kita.net Korea’s Trade Statistics Database for 2016 Table 20-1. Korean Imports of Mollusks by HS Code (MT)
Species 2013 H.S.
Code 2015 2016
World USA World USA Scallops 0307.2X.XXXX 9,977 1 8,349 2 Cuttlefish 0307.4X.XXXX 48,325 23 52,350 0 Octopus 0307.5X.XXXX 85,908 106 78,454 9 Hard clams, abalones, top shells, pearl
oyster, ark shells, cockles, adductors of shell
fish, sea urchins, sea cucumbers, hen clams,
baby clams, jelly fish
0307.7X.XXXX 0307.8X.XXXX 0307.9X.XXXX
80,244 71 76,553 80
Oysters, mussels 0307.1X.XXXX 0307.3X.XXXX
66 17 282 0
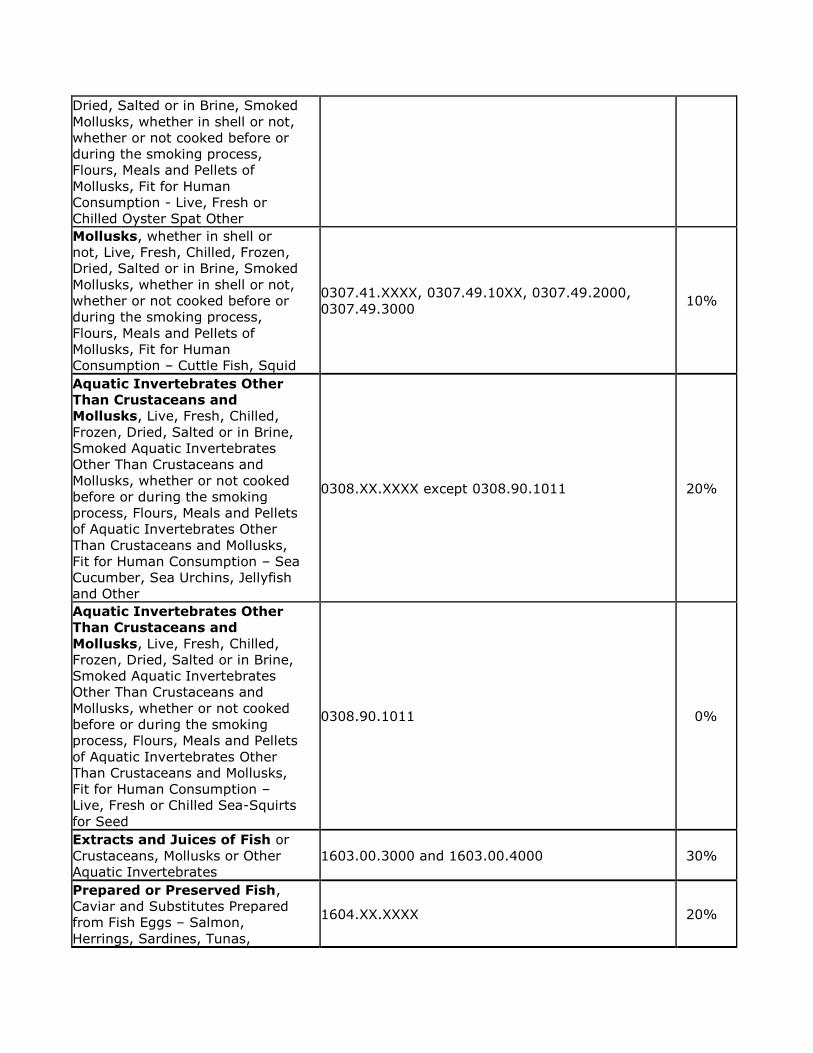
Total 224,520 218 215,988 91 Source: www.kita.net Korea’s Trade Statistics Database for 2016 Table 21. Korean Tariff Schedule for Fishery Products
Description H.S. Code 2012
Base
Rate
Live Fish, Ornamental, Other
Live 0301.XX.XXXX except 0301.92.1000,
0301.92.2000 and 0301.99.4010 10%
Live Fish, Other, Eels, Glass Eels
(not exceeding 0.3g per unit, for
aquaculture) and Sea Bream Fry
(for aquaculture)
0301.92.1000 and 0301.99.4010 0%
Live Fish, Other, Eels, Young
Eels (exceeding 0.3g and not
exceeding 50g per unit, for
aquaculture)
0301.92.2000 5%
Fish, Fresh or Chilled 0302.XX.XXXX 20%
Fish, Frozen 0303.XX.XXXX 10% Fish Fillets and Other Fish Meat
- Fresh or Chilled Fillets of
Tilapias, Catfish, Pacific Salmon,
Trout, Flat Fish, Swordfish,
0304.3X.XXXX, 0304.4X.XXXX, 0304.5X.XXXX 20%

Toothfish, and Other Fish Fish Fillets and Other Fish Meat
- Frozen Fillets of Tilapias,
Catfish, Cod, Haddock, Coalfish,
Hake, Alaska Pollack, Pacific
Salmon, Trout, Flat Fish,
Swordfish, Toothfish, Herrings,
Tunas and Other Fish
0304.6X.XXXX, 0304.7X.XXXX, 0304.8X.XXXX,
0304.9X.XXXX 10%
Fish, Dried, Salted or in Brine,
Smoked Fish, whether or not
cooked before or during the
smoking process, Flours, Meals
and Pellets of Fish, Fit for Human
Consumption
0305.XX.XXXX 20%
Crustaceans, whether in shell
or not, Live, Fresh, Chilled,
Frozen, Dried, Salted or in Brine,
Smoked Crustaceans, whether or
not cooked before or during the
smoking process, Crustaceans, in
shell or not, Cooked by Steaming
or by Boiling in Water, whether or
not chilled, Frozen, Dried, Salted
in Brine, Flours, Meals and Pellets
of Crustaceans, Fit for Human
Consumption
0306.XX.XXXX 10%
Mollusks, whether in shell or
not, Live, Fresh, Chilled, Frozen,
Dried, Salted or in Brine, Smoked
Mollusks, whether in shell or not,
whether or not cooked before or
during the smoking process,
Flours, Meals and Pellets of
Mollusks, Fit for Human
Consumption – Oysters, Scallops,
Mussels, Smoked Cuttle Fish and
Squid, Octopus, Snails, Clams,
Cockles, Ark Shells, Abalone, Top
Shells and Adductors of Shell Fish
0307.1X.XXXX, 0307.2X.XXXX, 0307.3X.XXXX ,
0307.4X.XXXX, 0307.5X.XXXX, 0307.6X.XXXX, 0307.7X.XXXX, 0307.8X.XXXX and 0307.9x.XXXX
except
0307.11.1010, 0307.11.1090, 0307.41.XXXX,
0307.49.10XX, 0307.49.2000, 0307.49.3000, 0307.71.2010 and
0307.91.2010
20%
Mollusks, whether in shell or
not, Live, Fresh, Chilled, Frozen,
Dried, Salted or in Brine, Smoked
Mollusks, whether in shell or not,
whether or not cooked before or
during the smoking process,
Flours, Meals and Pellets of
Mollusks, Fit for Human
Consumption - Live, Fresh or
Chilled Oyster Spat , Ark Shell
and Pearl Oyster for Seed
0307.11.1010, 0307.71.2010, 0307.91.2010 0%
Mollusks, whether in shell or
not, Live, Fresh, Chilled, Frozen, 0307.11.1090 5%
Dried, Salted or in Brine, Smoked
Mollusks, whether in shell or not,
whether or not cooked before or
during the smoking process,
Flours, Meals and Pellets of
Mollusks, Fit for Human
Consumption - Live, Fresh or
Chilled Oyster Spat Other Mollusks, whether in shell or
not, Live, Fresh, Chilled, Frozen,
Dried, Salted or in Brine, Smoked
Mollusks, whether in shell or not,
whether or not cooked before or
during the smoking process,
Flours, Meals and Pellets of
Mollusks, Fit for Human
Consumption – Cuttle Fish, Squid
0307.41.XXXX, 0307.49.10XX, 0307.49.2000,
0307.49.3000 10%
Aquatic Invertebrates Other
Than Crustaceans and
Mollusks, Live, Fresh, Chilled,
Frozen, Dried, Salted or in Brine,
Smoked Aquatic Invertebrates
Other Than Crustaceans and
Mollusks, whether or not cooked
before or during the smoking
process, Flours, Meals and Pellets
of Aquatic Invertebrates Other
Than Crustaceans and Mollusks,
Fit for Human Consumption – Sea
Cucumber, Sea Urchins, Jellyfish
and Other
0308.XX.XXXX except 0308.90.1011 20%
Aquatic Invertebrates Other
Than Crustaceans and
Mollusks, Live, Fresh, Chilled,
Frozen, Dried, Salted or in Brine,
Smoked Aquatic Invertebrates
Other Than Crustaceans and
Mollusks, whether or not cooked
before or during the smoking
process, Flours, Meals and Pellets
of Aquatic Invertebrates Other
Than Crustaceans and Mollusks,
Fit for Human Consumption –
Live, Fresh or Chilled Sea-Squirts
for Seed
0308.90.1011 0%
Extracts and Juices of Fish or
Crustaceans, Mollusks or Other
Aquatic Invertebrates 1603.00.3000 and 1603.00.4000 30%
Prepared or Preserved Fish,
Caviar and Substitutes Prepared
from Fish Eggs – Salmon,
Herrings, Sardines, Tunas,
1604.XX.XXXX 20%

Mackerel, Anchovies, Eels, Saury,
Jerk Filefish, Fish Pastes, Fish
Marinade, Fish Cake, Caviar and
Caviar Substitutes Crustaceans, Mollusks and
Other Aquatic Invertebrates,
Prepared or Preserved – Crab,
Shrimps and Prawns, Lobster,
Oysters, Scallops, Mussels, Cuttle
Fish, Squid, Octopus, Clams,
Abalone, Snails, Sea Cucumber,
Sea Urchins, Jellyfish and Other
Fish
1605.XX.XXXX 20%
Source: Korea Customs and Trade Development Institute, Import/Export Customs Clearance
General Guidebook of Korea, 2017